Article

Numerical and Experimental Analysis of Vortex Pump with Various Axial Clearances

1
National Research Center of Pumps, Jiangsu University, Zhenjiang 212013, China
2
School of Energy and Power Engineering, Jiangsu University, Zhenjiang 212013, China
3
CFD Lab, Washington University in St. Louis, St. Louis, MO 63130, USA
*
Authors to whom correspondence should be addressed.
Water 2024, 16(11), 1602; https://doi.org/10.3390/w16111602
Submission received: 27 April 2024 / Revised: 30 May 2024 / Accepted: 30 May 2024 / Published: 3 June 2024
(This article belongs to the Section Hydraulics and Hydrodynamics)

Abstract

:
Axial clearance is a critical parameter affecting the performance of vortex pumps. In this study, numerical simulation and experimental validation methods are employed to establish four different clearance schemes. The analysis focuses on multiple aspects, including the internal flow field, clearance flow field, leakage flow, and recirculation flow, to investigate the impact of axial clearance on the internal flow field and the external characteristics of the vortex pump. The results indicate that under the pressure difference between the inlet and outlet, the main flow leaks from the high-pressure region at the outlet to the clearance flow channel, and the clearance flow returns to the main flow channel at the low-pressure region of the inlet. As the axial clearance increases, the intensity of the vortices inside the pump gradually decreases. This leads to a reduction in intensity of the momentum exchange between the fluid inside and outside the impeller, causing a decline in the pump performance curve. Simultaneously, the increase in clearance reduces the flow resistance in the clearance region, and the clearance flow gradually stabilizes. The interaction between the clearance flow and the main flow intensifies, causing the leakage flow and recirculation flow to increase rapidly, which results in significant energy loss.

1. Introduction

Vortex pumps, also known as regenerative or friction pumps, belong to the category of vane machinery [1]. Due to their ability to generate high head at low flow rates, they find extensive applications in chemical transportation, agricultural spraying, metal smelting, and food processing [2,3,4,5]. The internal flow within a vortex pump is highly turbulent. Currently, there are two widely accepted theories regarding the operating principle of vortex pumps. The first is the frictional turbulence theory [6,7,8,9]. This theory posits that the interaction between the impeller and the fluid in the outer channel generates friction, through which energy is transferred to the fluid in the outer channel. The second theory is the momentum exchange theory [10,11,12]. This theory posits that in a vortex pump, the rotating impeller performs work on the fluid, accelerating it and causing it to move along the pump’s flow path. During this process, the high-velocity fluid within the impeller exchanges momentum with the low-velocity fluid in the outer channel. Through this mechanism, the vortex pump effectively converts kinetic energy into the pressure energy of the fluid. Based on these two theories, Quail [13] proposed a novel one-dimensional theoretical model to explain the energy exchange process between fluids within a vortex pump.
While vortex pumps provide high head, the internal vortices cause significant energy dissipation [14,15], leading to generally low efficiency values for these pumps. Therefore, controlling energy dissipation within vortex pumps to enhance their performance has been a significant research focus for many scholars. Choi et al. [16] discovered that altering the blade angle and shape of the pump significantly improved vortex pump performance, with V-shaped blades at a 30° angle showing the most notable enhancement. Wang et al. [17] based the design of the vortex pump casing cross-section on the constant area theory, shaping it into an M shape. Numerical simulations confirmed that the M-shaped cross-section helps improve flow at the blade exit, thus enhancing the performance of the vortex pump. Mosshammer et al. [18] considered four different intake areas, five different impeller parameters, and six different outer flow path parameters as basic variables. They combined these variables to create over 300 experimental configurations and used a simplified model to identify the optimal solution. Pei et al. [19] investigated the impact of changing the wrap angle of the outer flow path on the performance and internal flow of vortex pumps. They found that the number of momentum exchanges between the fluid inside the impeller and the outer fluid primarily depends on the size of the outer flow path wrap angle. In the design and assembly process, vortex pumps have very strict requirements for axial clearance, typically ranging from 0.1 to 0.2 mm. Axial clearance, as one of the main sources of volumetric losses in vortex pumps, has been a focal point of research for scholars in the field. Zhang et al. [20] found that an appropriate axial clearance is crucial for the performance of vortex pumps. If the axial clearance is too large, it can easily lead to leakage. Conversely, if the axial clearance is too small, it can hinder the movement of the impeller, potentially resulting in jamming. Shi et al. [21] analyzed the impeller fixation methods of vortex pumps and discussed the advantages and disadvantages of several existing clearance adjustment techniques. Zhu et al. [22] analyzed the impact of axial clearance on the external characteristics of vortex pumps through numerical simulation and experimental methods. They found that axial clearance has a significant influence on the performance of vortex pumps. To ensure the performance indicators of the pump, the clearance size must be controlled within a certain range. Wang et al. [23] conducted numerical simulations and validations on the flow characteristics of the impeller clearance of vortex pumps under high-efficiency operating conditions. They revealed the principles of mass flow exchange within the clearance of vortex pumps and analyzed the causes of head pulsation.
From the above analysis, it is evident that research on the axial clearance of vortex pumps primarily focuses on its influence on pump performance, with relatively few studies examining the internal flow within the clearance. To understand the effects of axial clearance on both the external characteristics and internal flow field of vortex pumps, this study selected four clearance configurations (0 mm, 0.15 mm, 0.2 mm, and 0.25 mm) for numerical simulations under various operating conditions. The aim is to provide insight into the flow characteristics of axial clearances in vortex pumps and offer some reference for structural design.

2. Numerical Simulation and Experimental Validation

2.1. Turbulence Model and Boundary Conditions

Axial clearance affects the external characteristics and internal flow of the vortex pump. The internal flow of a vortex pump is filled with a large amount of spatial vortex, characterized by high strain and strong rotational turbulence. Fleder et al. [24] compared the effects of three turbulence models, Shear Stress Transport (SST) k-ω, k-ω, and k-ε, on the numerical simulation of vortex pumps, finding that all three models are applicable. Compared to k-ω and k-ε, the SST k-ω turbulence model can freely switch between the mainstream and near-wall regions [25,26]. Therefore, the SST k-ω turbulence model is employed in this study for the numerical simulation of the vortex pump utilizing ANSYS FLUENT 2022 R1 commercial software. The SIMPLEC pressure–velocity coupling algorithm is opted for as the solution method. Inlet boundary conditions are defined as mass inflow, while pressure outflow conditions are set at the outlet. Momentum, turbulent kinetic energy, and turbulent dissipation rate interpolation employ a second-order upwind scheme. Convergence criteria for the simulation are established at 10−5.

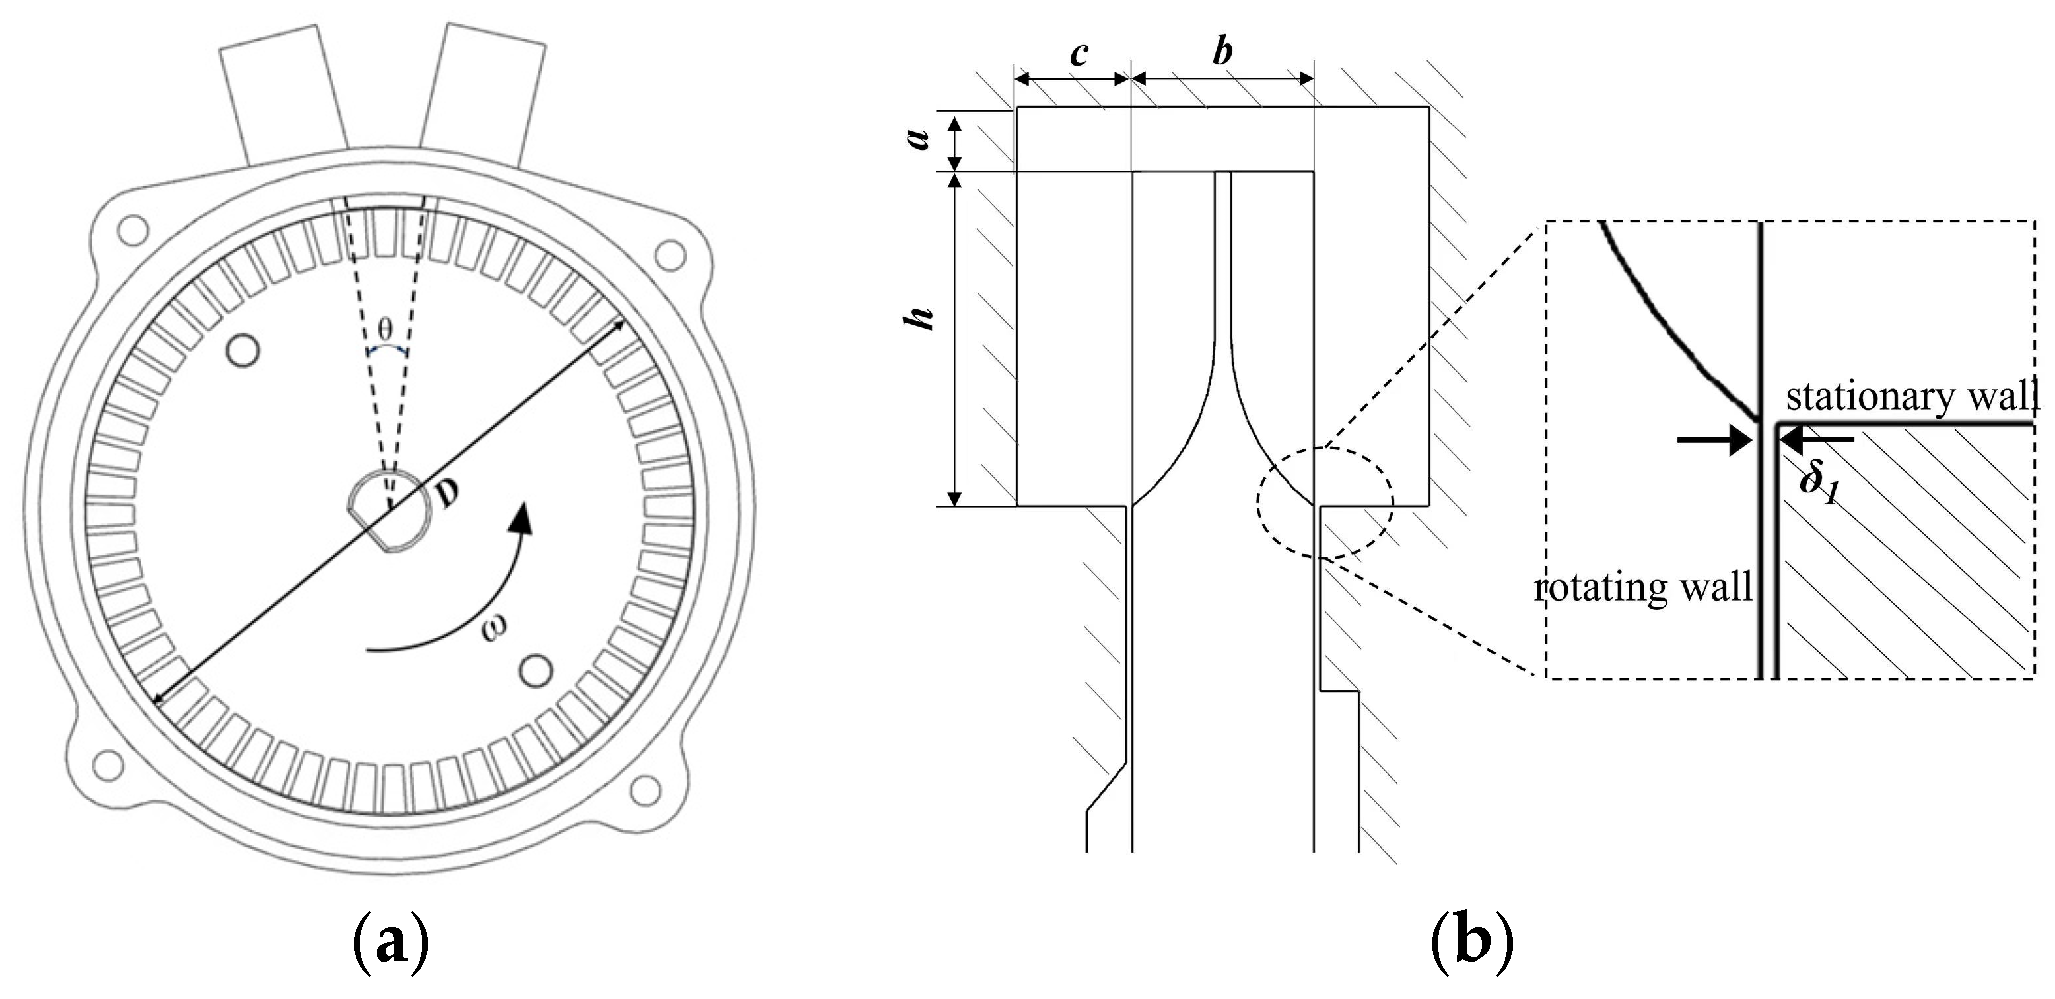
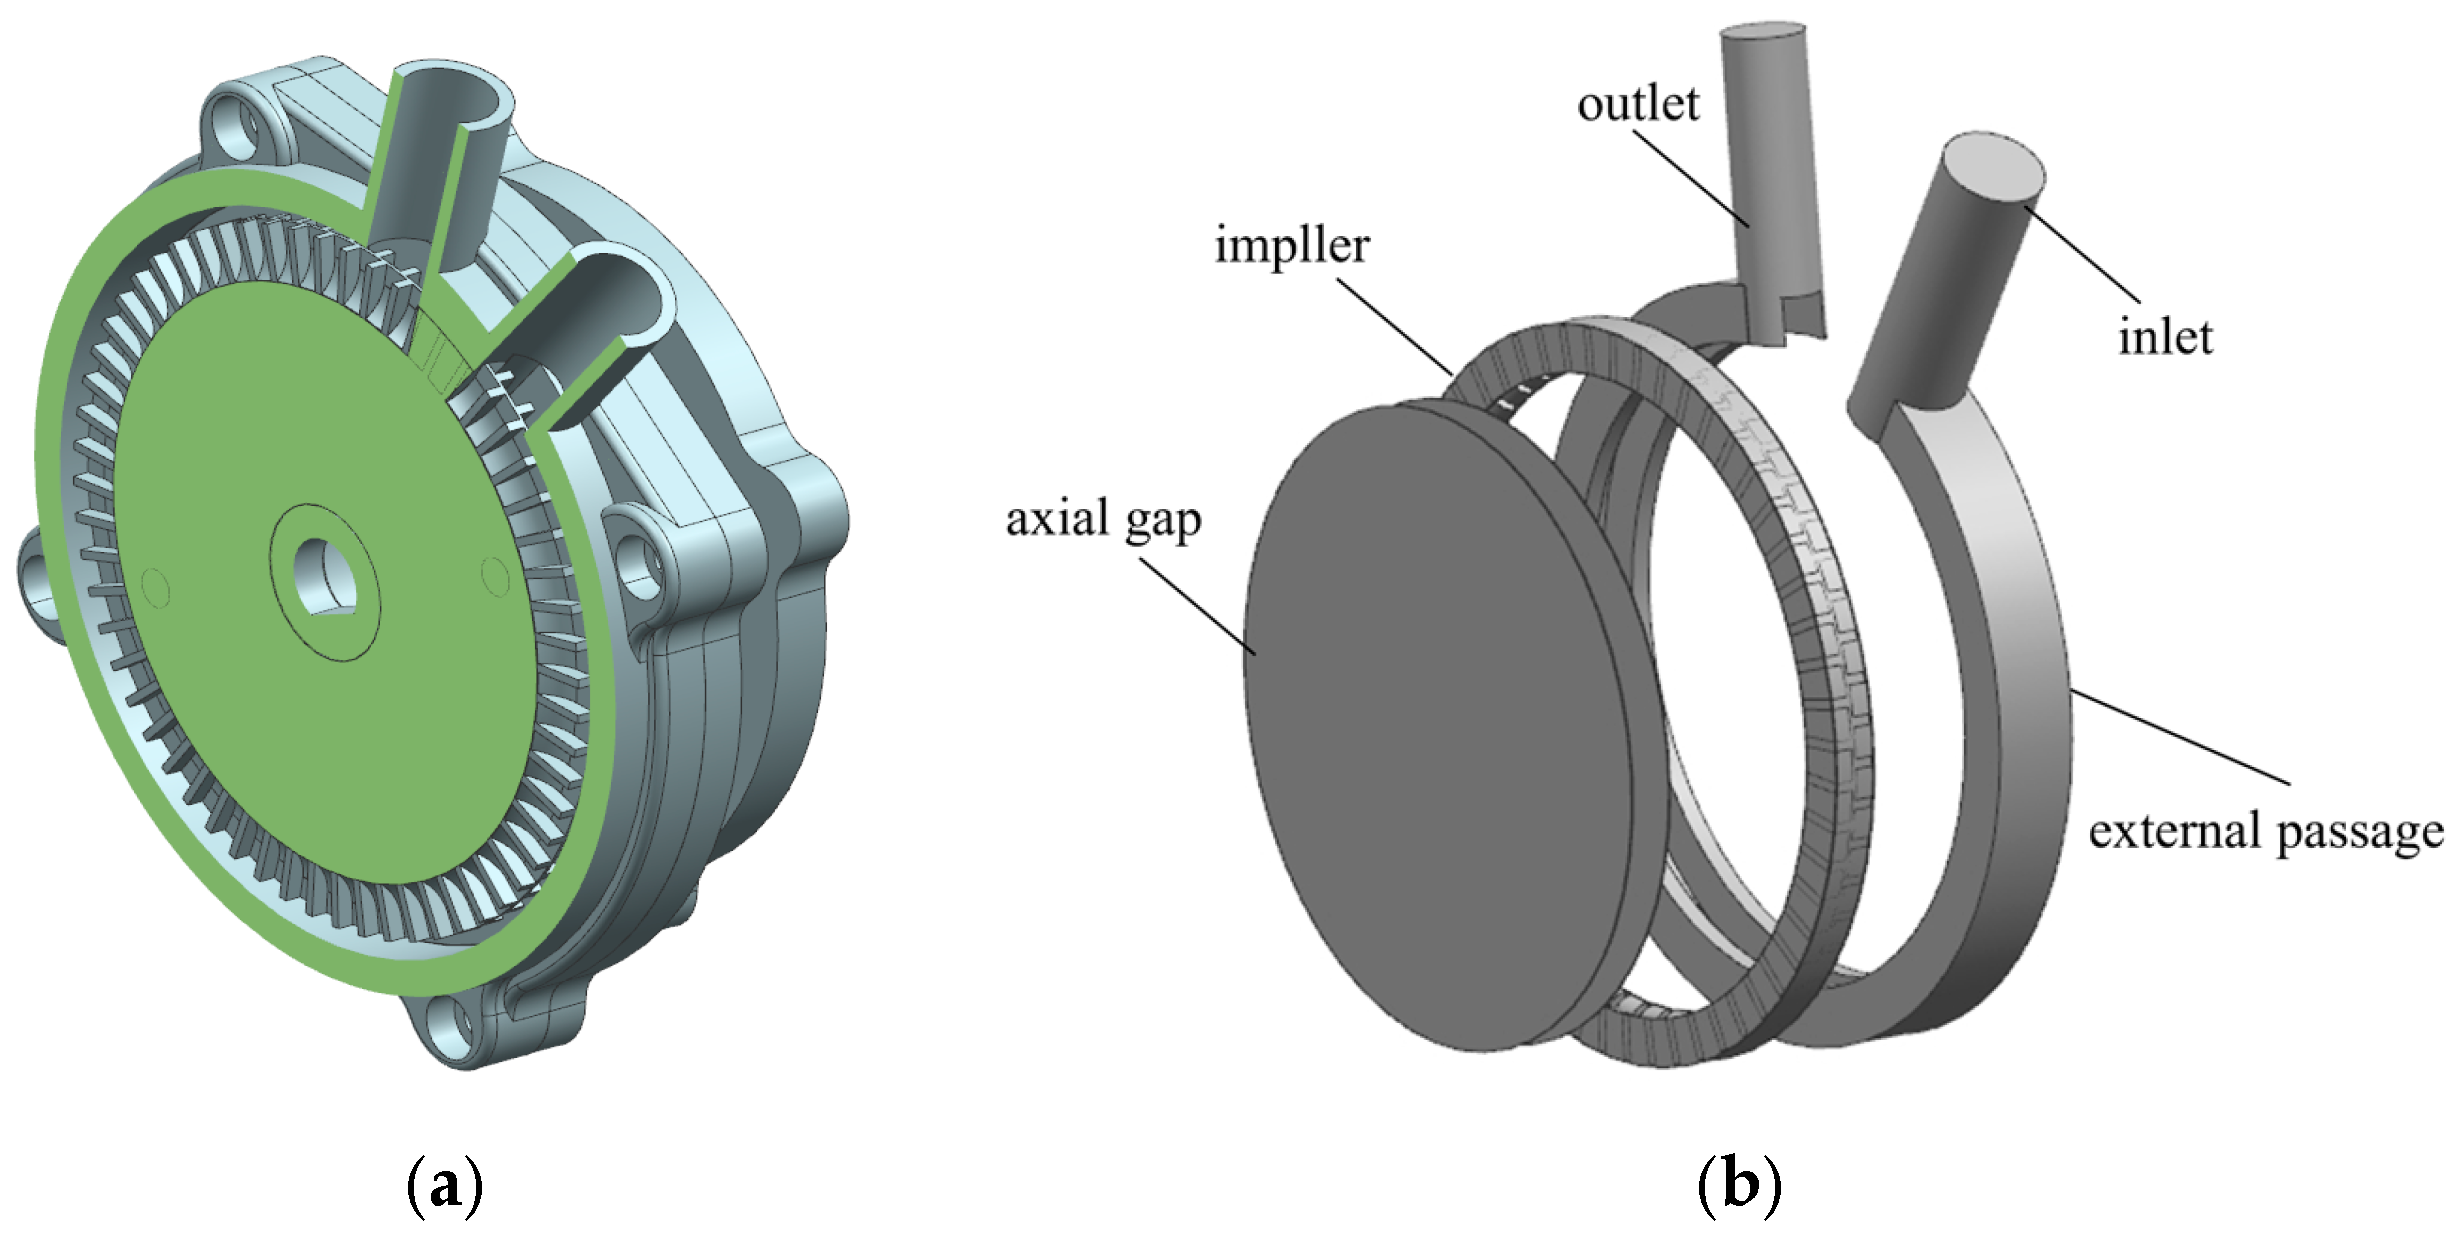
2.2. Geometric Model

The structure of a vortex pump is very simple and compact, consisting of an upper pump casing, a lower pump casing, and an impeller. When fluid enters through the inlet, it gains circumferential velocity due to the rotation of the impeller. Because the fluid velocities inside and outside the impeller are different, there is an imbalance of forces on the fluid, resulting in the formation of longitudinal vortices. Under the action of these longitudinal vortices, fluid enters the impeller from the radial inner edge of the blades, undergoes work by the blades, and exits from the outer edge of the blades. This repeated circumferential flow between the blades continuously increases the energy of the fluid; thus, vortex pumps have relatively high heads [23,27].
The structural parameters of the vortex pump are shown in Figure 1. The top clearance of the impeller (a) is 1.64 mm, the impeller width (b) is 4.10 mm, the single-side width of the flow passage (c) is 2.25 mm, the blade height (h) is 6.97 mm, the impeller diameter (D) is 84 mm, the tongue angle is 10°, the axial clearance (δ1) between the impeller and the tongue region is 0.20 mm, and the number of blades is 55. The rated operating condition is 10 L/min, and the rated speed is 4000 r/min.
A 3D model was created using UG 10.0 software, as shown in Figure 2a. Key components such as the impeller, external flow passage, and the axial clearance of the vortex pump were extracted to form the computational domain, as illustrated in Figure 2b. To maintain the stability of the inlet and outlet flow parameters, the inlet length was extended to three times the pipe diameter, while the outlet length was extended to five times the pipe diameter. Furthermore, to enhance mesh quality, the axial clearance was separately meshed.

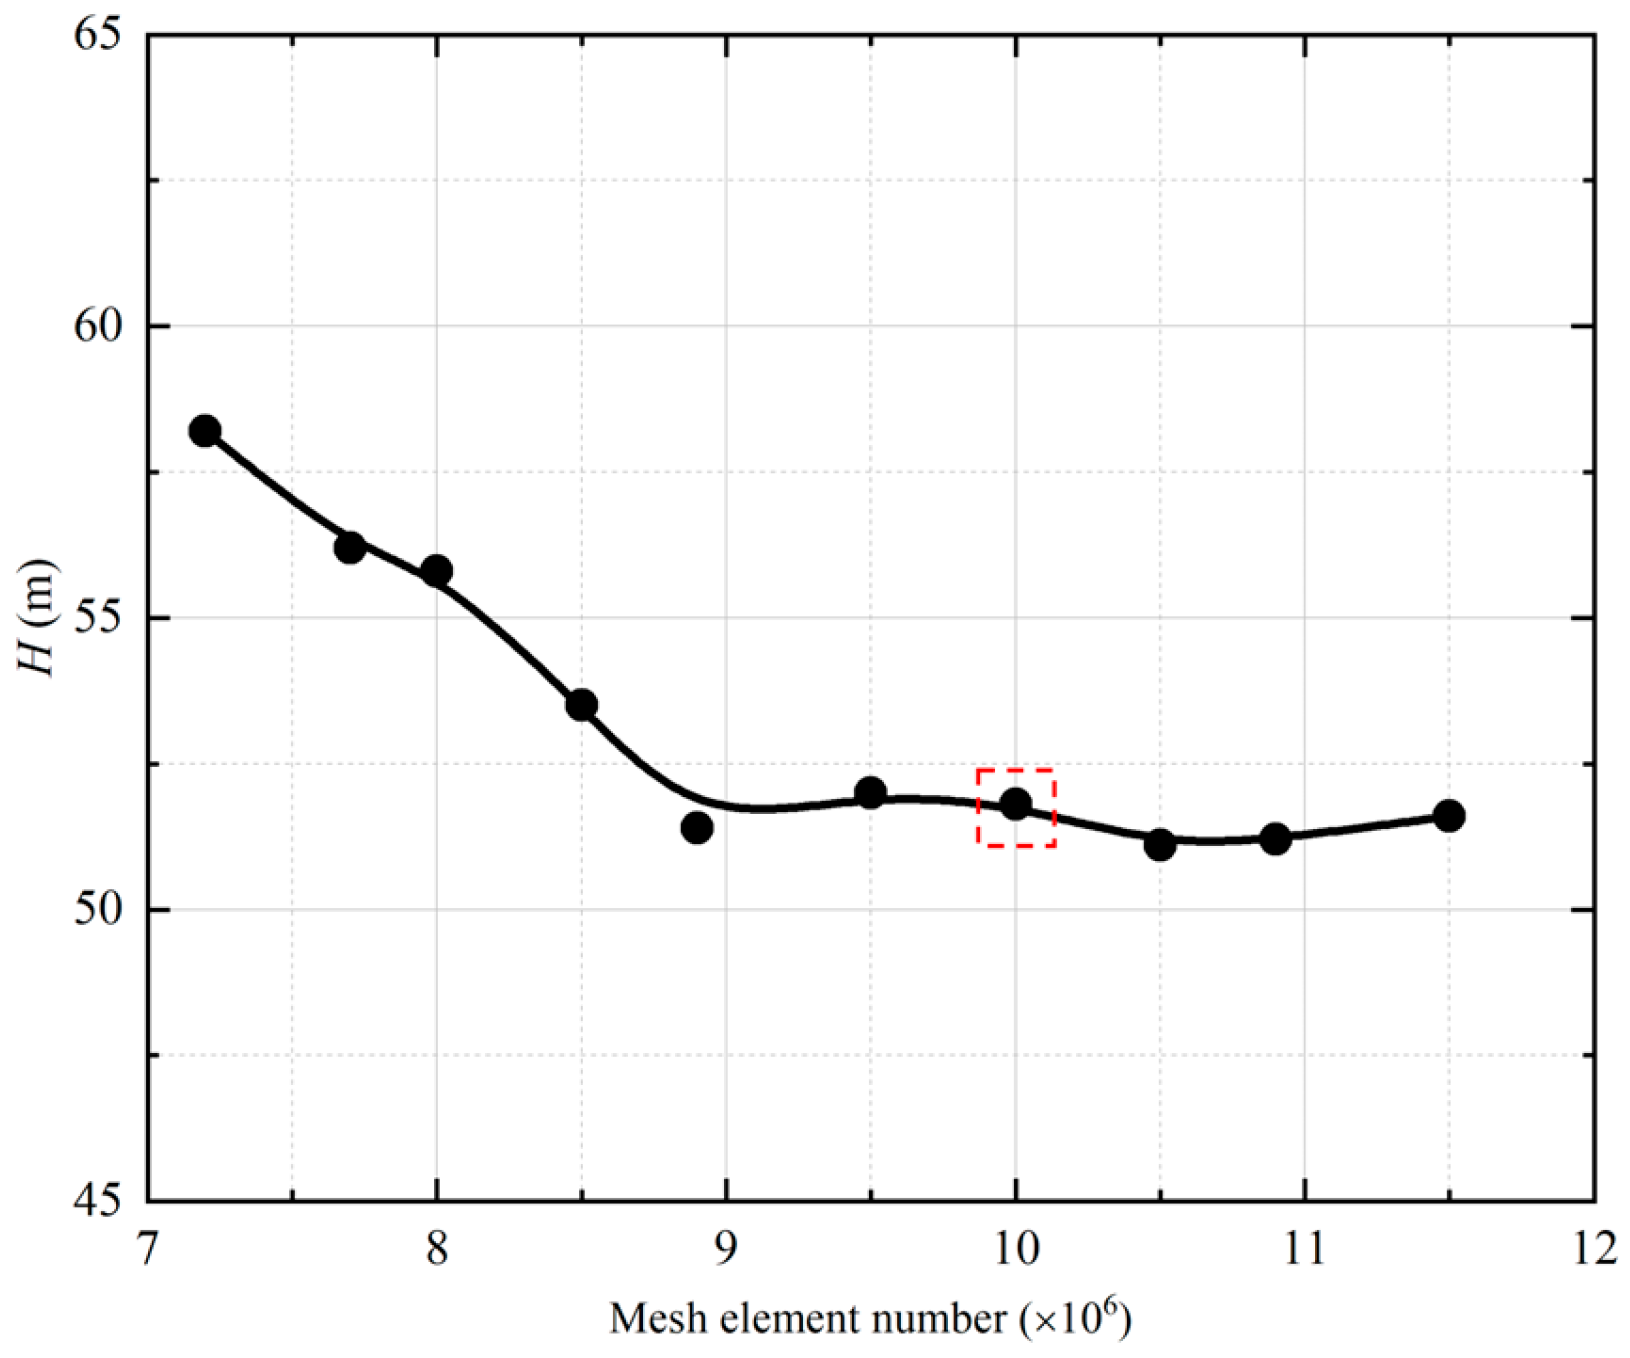
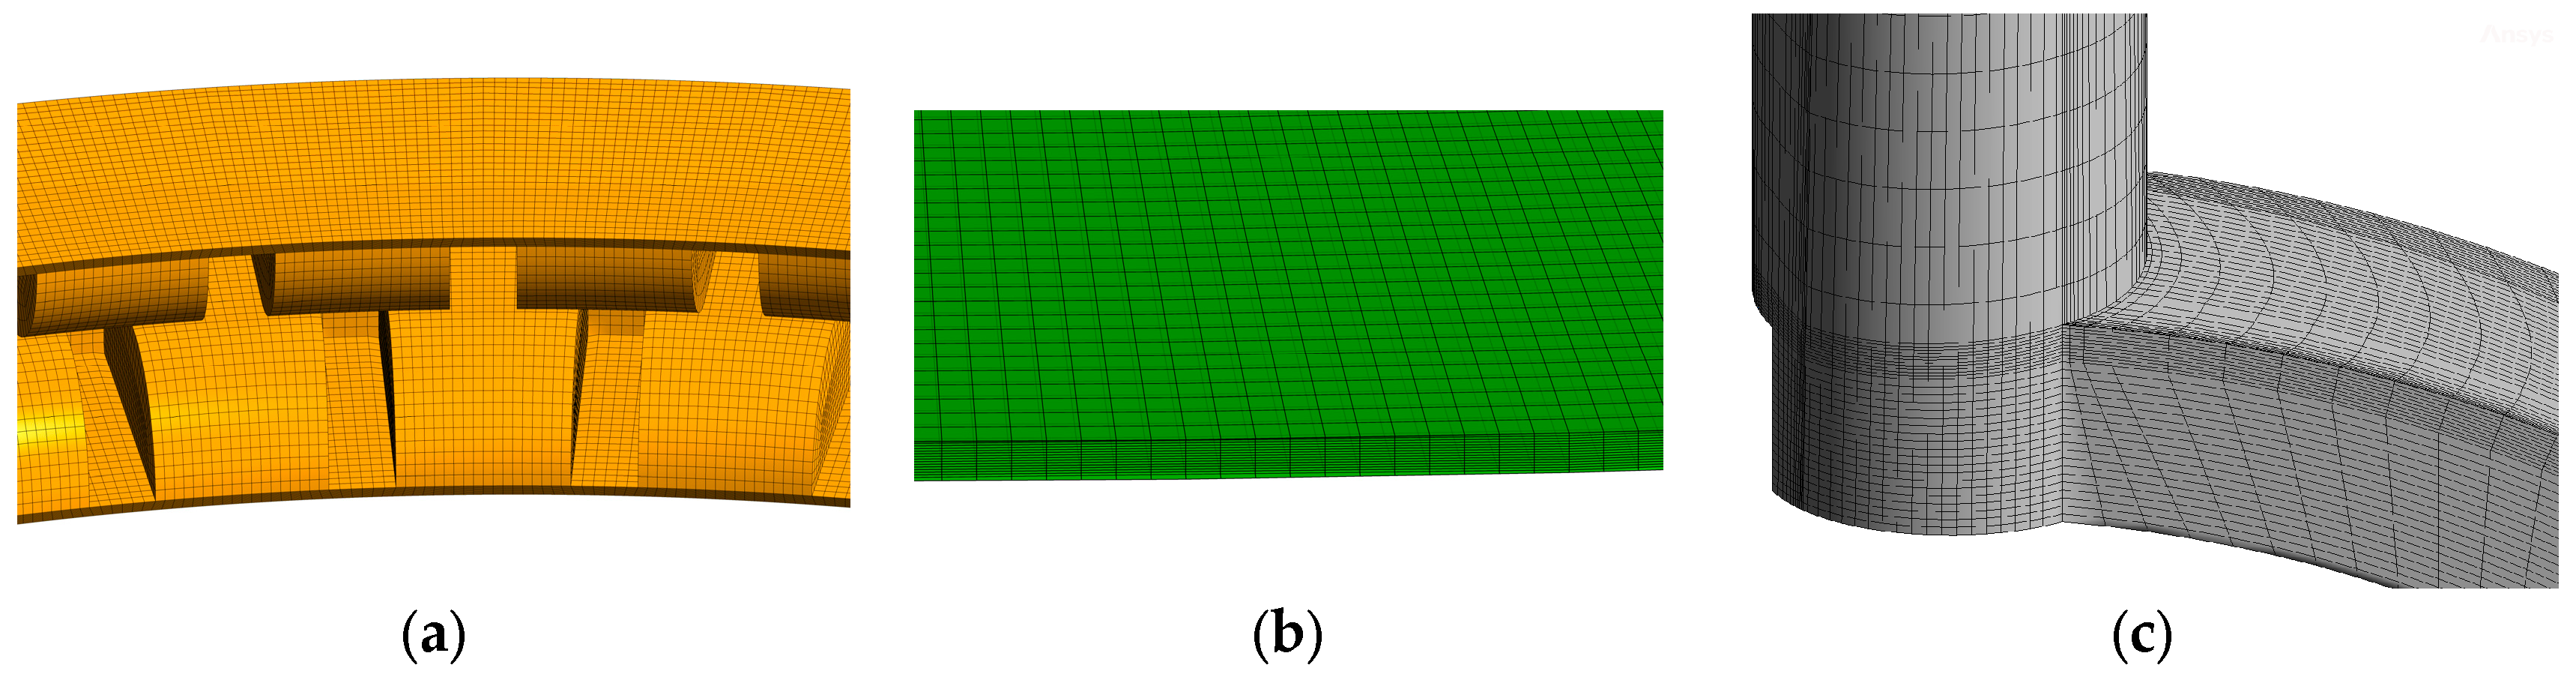
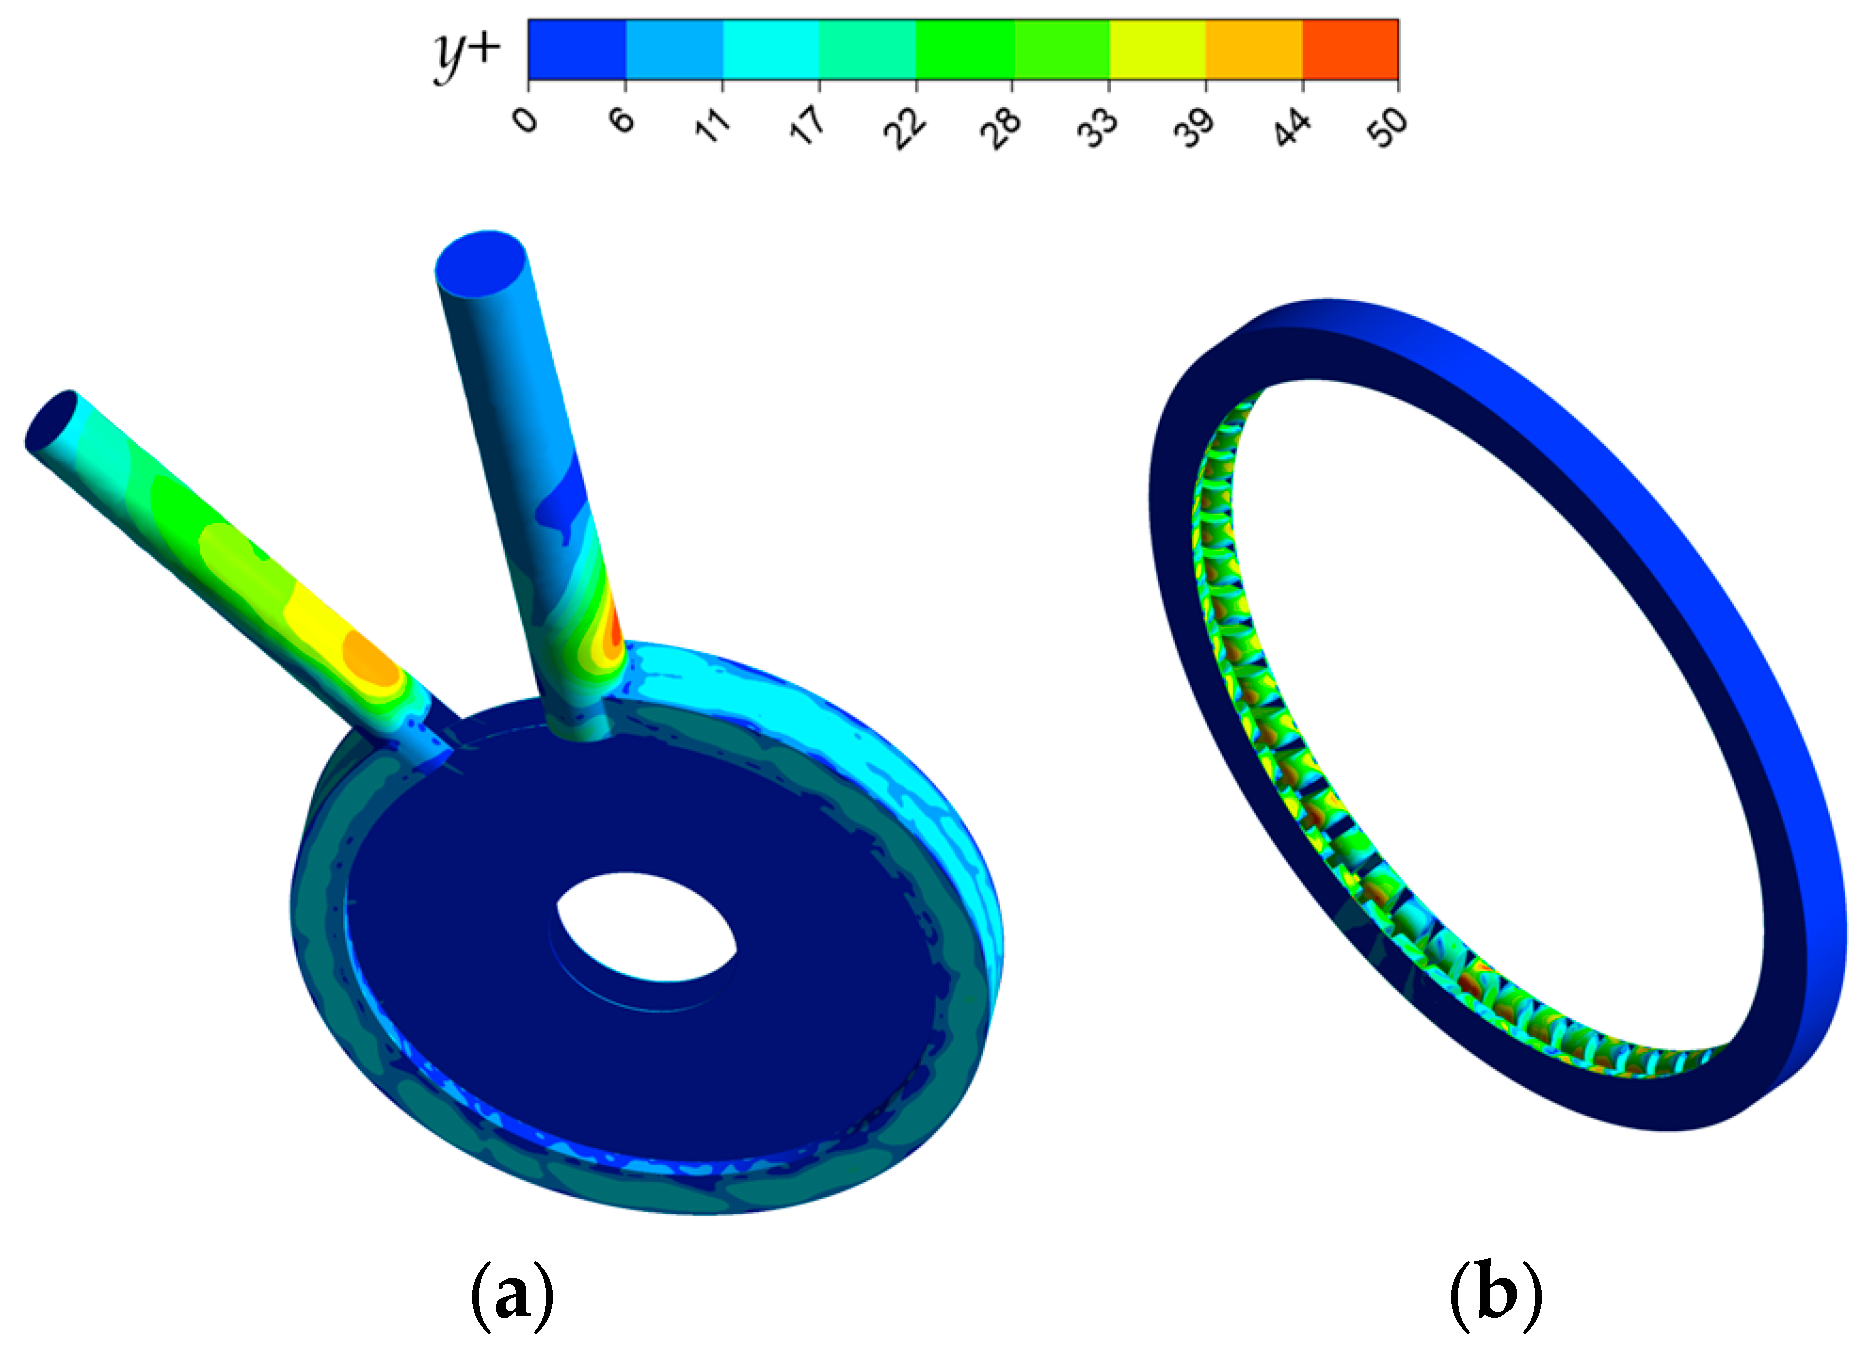
2.3. Grid Generation

To reduce computational errors resulting from excessive grid refinement, grid independence verification was conducted under rated operating conditions. Figure 3 shows the variation in the pump head (H) obtained from calculations using the same settings but different grid sizes. From the analysis of the figure, it can be observed that when the number of grid cells increases to 10 million, as indicated in the figure, the calculated results for the pump head become essentially stable. Therefore, considering computational resources and time, the final total number of grid cells is determined to be approximately 10 million.
Using ANSYS-ICEM 19.0 software, a hexahedral structured grid was generated for the computational domain to accelerate convergence speed and enhance computational accuracy. Considering the complex flow near the clearance of the vortex pump, 15 layers of grids were set along the axial direction to ensure an adequate number of grid nodes to capture the internal flow within the clearance. The structural grid details for each component are illustrated in Figure 4.
The SST k-ω turbulence model generally requires that the model grid’s y+ value does not exceed 100 [28]. The y+ distribution plot for the vortex pump is shown in Figure 5. Herein, the maximum y+ value is 48.7. The average y+ value in the impeller region is 13.5, in the external flow passage region is 16.7, and in the clearance region is 1.4. Overall, the y+ values across the entire grid are within the reasonable range for numerical simulation.

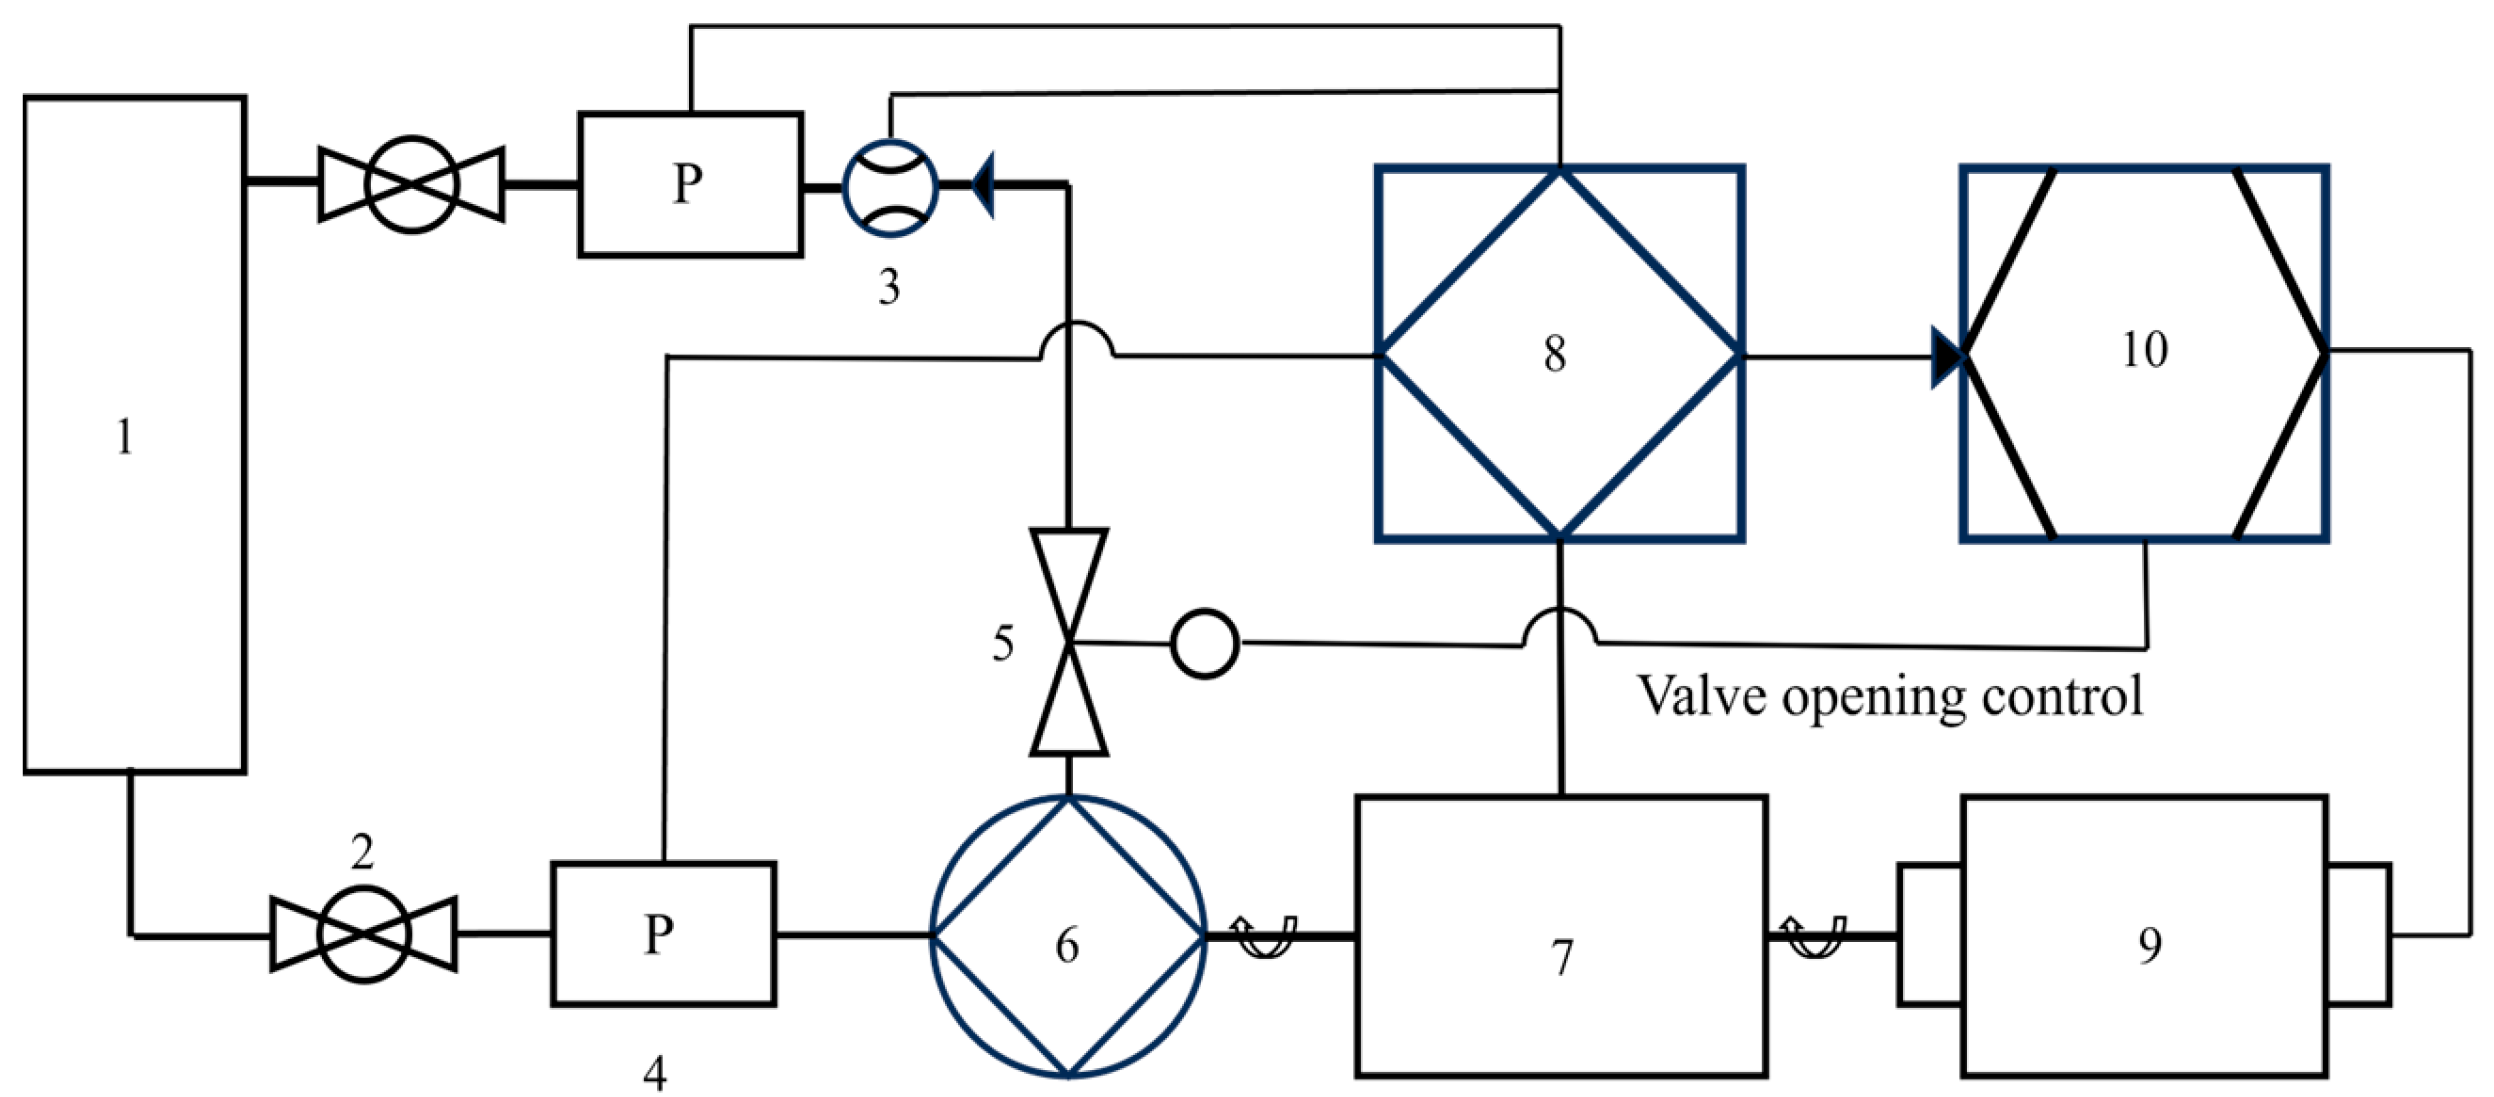
2.4. Experimental Procedure and Validation by Numerical Simulation

To validate the accuracy of the numerical simulations, an external characteristic test was conducted on the vortex pump, as illustrated in Figure 6. The test system primarily consists of a vortex pump, inlet and outlet pipelines, a flow meter, inlet and outlet pressure sensors, and an electric valve. In the test process, the variable frequency motor drives the vortex pump, the real-time speed and torque of the vortex pump are measured by the tachometer and torque meter, and the data are transmitted to the computer in real time for recording. The control of the flow rate is achieved by the computer manipulating the opening of the motorized valve so that the computer can record and analyze the readings of the pressure sensors on both sides of the pump under different flow conditions. In this way, the pump operation can be precisely adjusted and the pump performance parameters can be collected for a detailed analysis of the external characteristics of the vortex pump. Specifically, the measurement accuracy is 0.2% for the flow meter, 0.1% for the pressure sensor, 0.5% for the torque sensor, and 0.5% for the speed measurement. By incorporating the experimental data under different operating conditions and the measurement accuracies of the equipment into the calculations, the maximum uncertainty in pump efficiency was determined to be 0.57% and the maximum uncertainty in pump head was determined to be 0.27%.
The comparison between the numerical simulation results and the experimental data is shown in Figure 7, where the error bars represent the experimental uncertainty. The trends of the experimental results are generally consistent with the numerical simulation results. Specifically, the head decreases sharply with increasing flow rate, while the efficiency initially increases and then decreases with increasing flow rate. However, there are still discrepancies in the numerical magnitudes between the two sets of results, especially at low flow rates. There are two main reasons for this discrepancy. Firstly, appropriate simplifications were made in the numerical simulation, neglecting various objective factors such as energy leakage and losses in the connecting pipelines. Under low flow conditions, the internal pressure of the pump is higher, resulting in greater energy losses caused by the connecting pipelines. Secondly, due to the special working principle of the vortex pump, the pump is filled with a large number of vortices of different scales under low flow conditions leading to a highly turbulent internal flow, which poses challenges for high-precision numerical simulation. Although there is a certain gap between the numerical simulation results and the experimental data, the trends of the two sets of results are consistent, and the errors are within a controllable range. Therefore, the numerical simulation results are relatively accurate and reliable, and suitable for subsequent research.

3. Results and Discussion

3.1. External Characteristics Comparison

To investigate the influence of axial clearance size on the performance of the vortex pump, the external characteristic curves for each clearance scheme are shown in Figure 8. Figure 8a illustrates the variation in head for each clearance scheme. It can be observed that the trend of head curves for each scheme is generally consistent, transitioning gradually from low flow and high head to high flow and low head. As the clearance increases, the magnitude of head reduction with increasing flow rate also increases. Specifically, when the axial clearance is 0, the head decreases from 95.53 m to 22.86 m. When the axial clearance increases to 0.25 mm, the head decreases from 45.97 m to 11.53 m. Thus, the axial clearance to some extent determines the slope of the head curve of the vortex pump. At the same flow rate, the head decreases with increasing axial clearance, and this decreasing trend diminishes with increasing flow rate. With the increase in axial clearance, at the 0.6Qd operating condition, the head decreases from 95.53 m to 45.97 m; at the 1.4Qd operating condition, the head decreases from 22.86 m to 11.53 m. The impact of axial clearance on head is more significant at low flow conditions.
Figure 8b illustrates the variation in efficiency for each clearance scheme. It can be observed that with the increase in axial clearance, the range of efficiency values for different flow conditions gradually decreases, and the optimal operating point shifts from 1.2Qd to 1.0Qd. At the same flow condition, the efficiency decreases with increasing axial clearance, but unlike the head curve, this decreasing trend increases with increasing flow rate. At the 0.6Qd operating condition, with the increase in clearance, the efficiency decreases from 13.97% to 12.29%; at the 1.4Qd operating condition, with the increase in axial clearance, the efficiency decreases from 19.72% to 13.32%. The impact of axial clearance on efficiency is more significant in high-flow conditions.

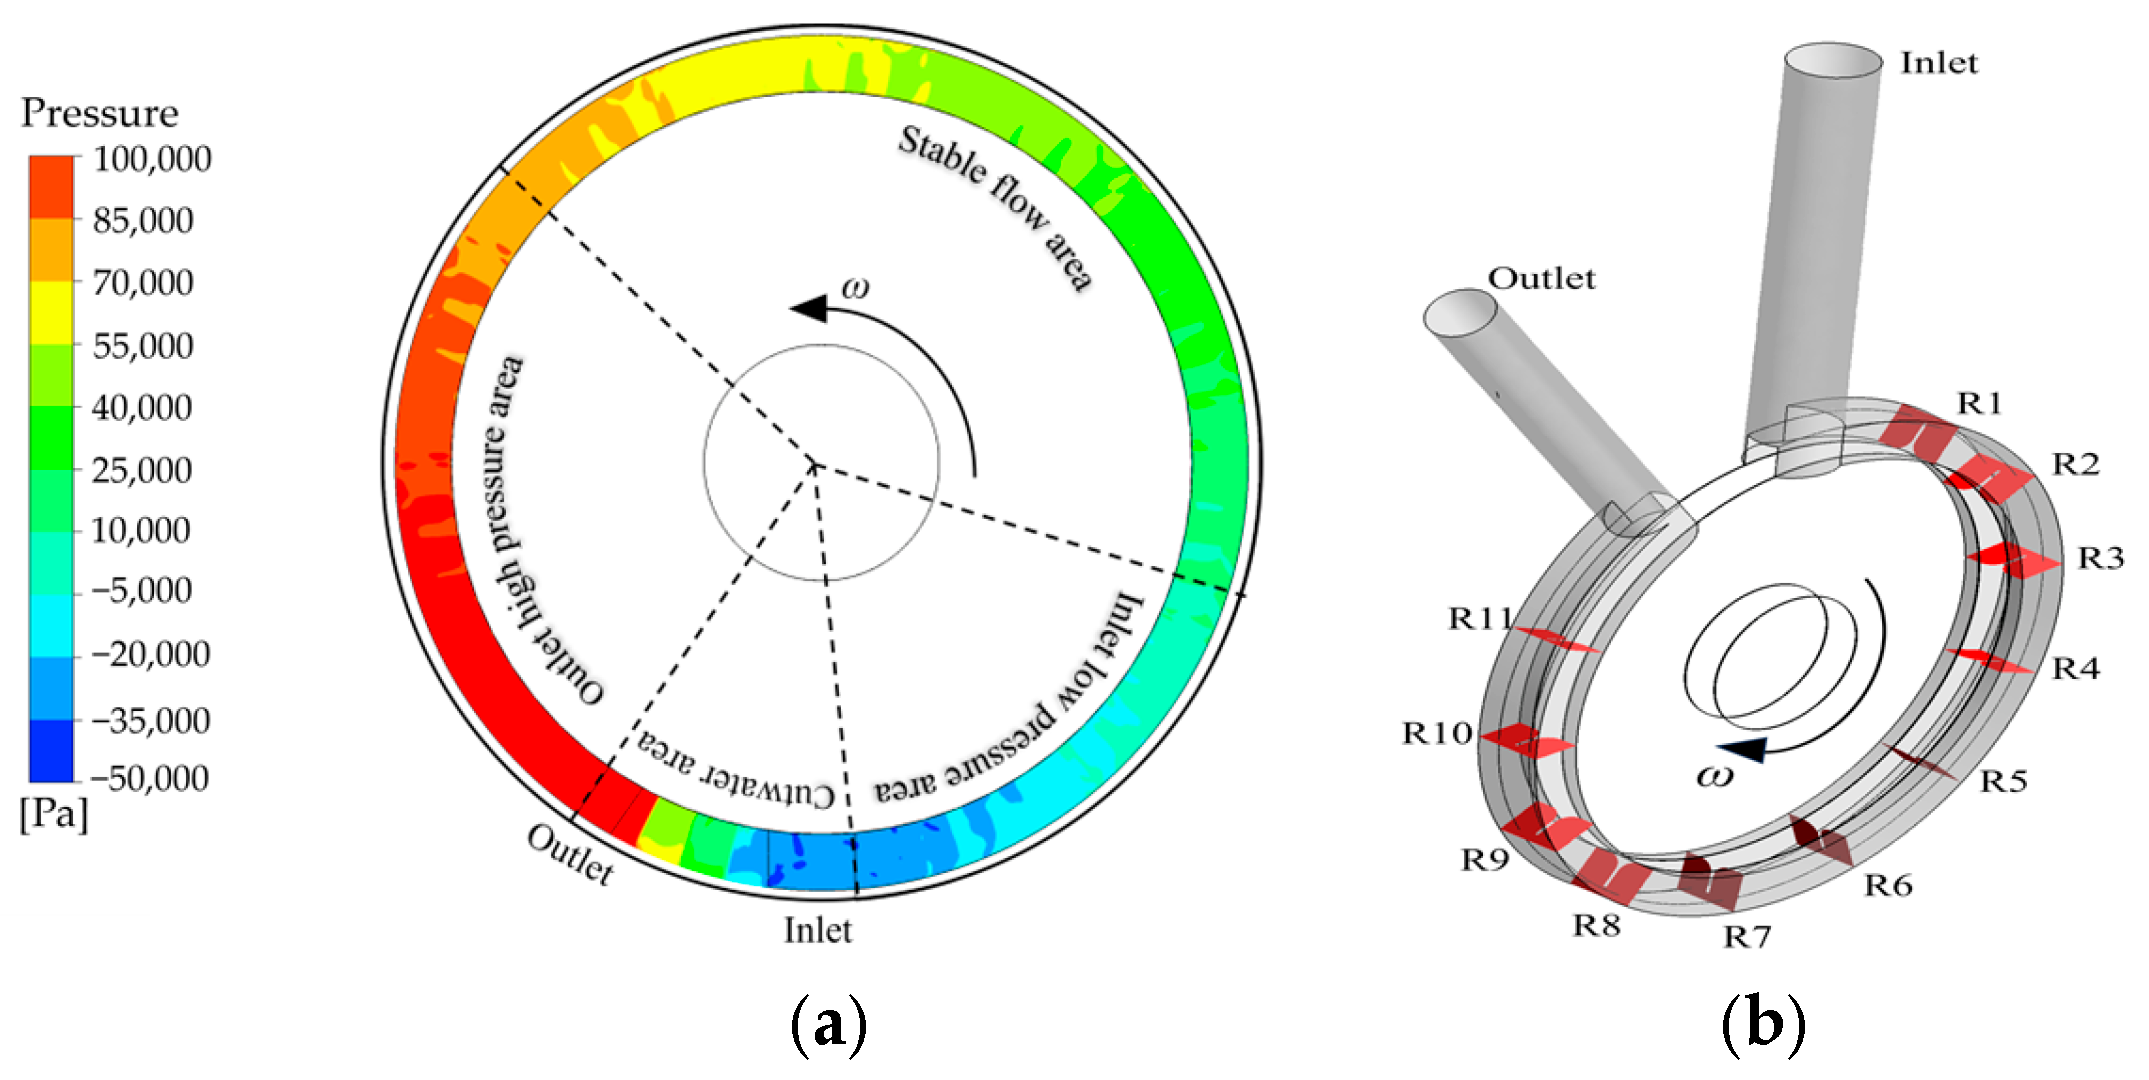
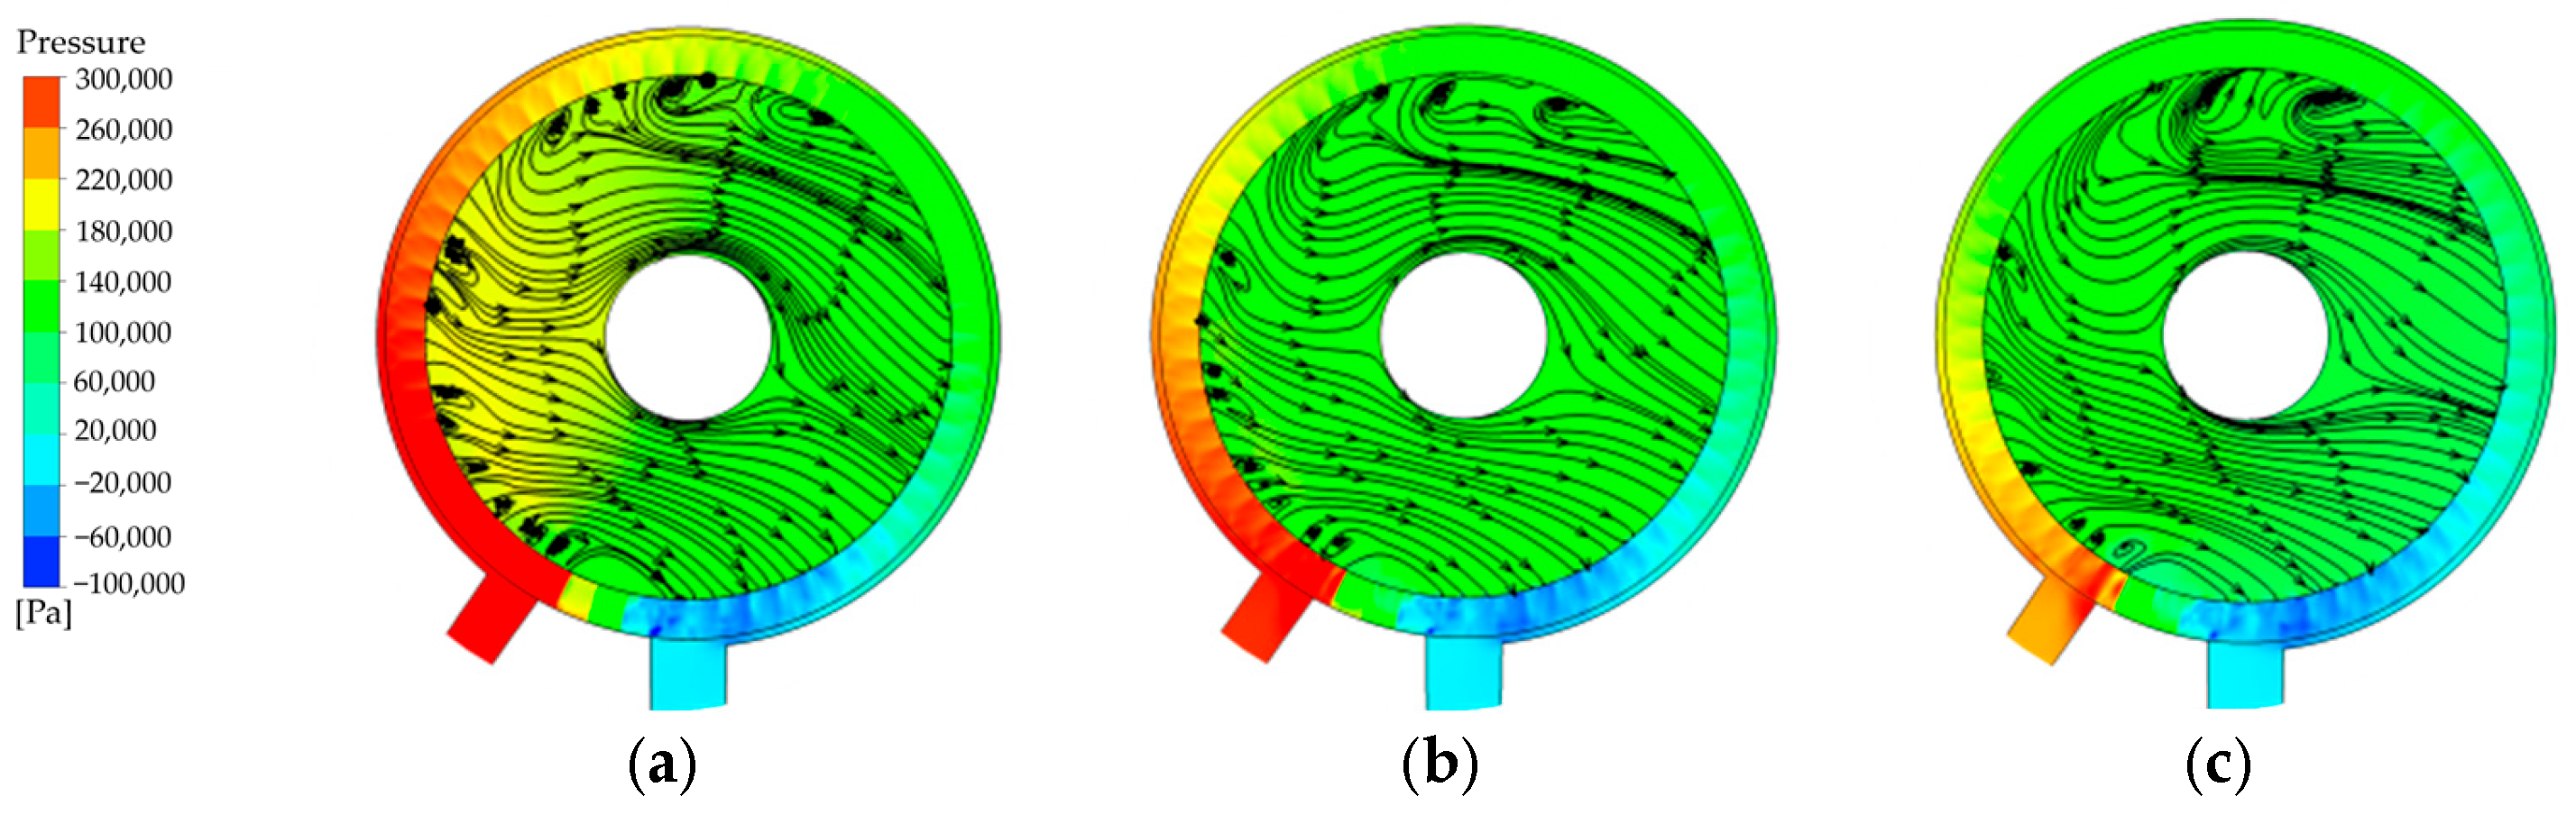
3.2. Internal Flow Field Analysis

Figure 9a depicts the pressure distribution inside the vortex pump. It can be observed that the pressure distribution within the vortex pump gradually increases circumferentially. Under the driving force of pressure difference, fluid from high-pressure regions flows through the axial clearance towards low-pressure regions. According to Reference [29], the annular flow passage is divided into several regions based on the growth pattern of internal pressure and pressure distribution within the vortex pump. These regions include the inlet low-pressure region, stable-flow region, outlet high-pressure region, and tongue region. Among these, the stable-flow region is characterized by fully developed internal circulation within the vortex pump, where stable momentum exchange occurs between the fluid inside and outside the impeller. The majority of pressure increase within the vortex pump is concentrated in this region, making it the critical area determining the operational capacity of the vortex pump. The internal flow within the axial clearance is intricate, exhibiting different flow characteristics in various regions. To analyze the flow field variations in different regions of the vortex pump under different operating conditions, radial analysis sections are taken along the flow direction starting from the inlet low-pressure region. One radial analysis section comprises four channels, resulting in a total of eleven sections. Sections R1 to R3 are located in the inlet low-pressure region, R3 to R9 are in the stable-flow region, and R9 to R11 are in the outlet high-pressure region. A schematic diagram of the section positions is shown in Figure 9b.
The mass exchange distribution at the interface between the impeller and the external passage in the stable-flow section for various clearance schemes is shown in Figure 10. The blue area represents fluid entering the impeller passage from the external passage, while the red area represents fluid exiting the impeller passage. In all four schemes, the boundary between fluid entering and exiting is located at a height corresponding to 70% of the blade height. At δ1 = 0, the fluid-entering area forms a continuous band that spans from the inner diameter to the mid-diameter of the impeller. As the axial clearance increases, the entering area gradually changes into a discrete block distribution, with a decreasing entering area. Additionally, noticeable gaps appear between the impeller flow channels, indicating that with larger axial clearances, the intensity of mass exchange inside the vortex pump gradually decreases.
Figure 11 illustrates the pressure distribution and axial clearance streamline distribution for each clearance scheme under rated conditions. In terms of pressure distribution, the increase in clearance leads to an increase in volume loss for the vortex pump. Consequently, there are significant variations in internal pressure among the different clearance schemes. When the axial clearance is 0.15 mm, the fluid undergoes repeated pressurization in the later stage of the annular flow passage, reaching a high-pressure state. However, when the axial clearance increases to 0.25 mm, some areas in the pump outlet region still fail to reach a high-pressure state.
Regarding clearance flow, it is observed from the diagram that there is a clear fluid recirculation phenomenon within the axial clearance of the vortex pump. The fluid from the main passage enters the clearance passage from the outlet high-pressure region and, driven by the pressure difference between the inlet and outlet of the pump, flows back from the inlet low-pressure region to the main passage. This requires additional work to be completed by the pump on this recirculation, resulting in a reduction in effective output energy and a decrease in energy utilization efficiency. In the stable flow section and the outlet high-pressure region, when the fluid leaks from the main passage to the clearance passage, it fails to adapt to the sudden change in flow space, leading to flow separation at the clearance entrance and the formation of a large number of vortices in this region. As the axial clearance size increases, both the driving force and flow resistance of the clearance flow decrease. Therefore, the flow state within the axial clearance of the vortex pump gradually tends to stabilize, and the quantity and intensity of vortices within the clearance decrease to some extent.
Figure 12 shows the velocity vector distribution at the radial section R6 of the stable-flow section for each clearance scheme under rated conditions. It can be observed that with the increase in clearance, there is little change in the flow state of the fluid inside the impeller, while the flow velocity in the external passage slightly increases. This results in a decrease in the area of the acceleration zone formed at the root of the blade for blade inlet flow, and an increase in the area of the high-speed zone at the impeller outlet. As the clearance increases, the difference in velocity between the fluid inside and outside the impeller decreases, leading to a reduction in the intensity of longitudinal vortices inside the vortex pump and a consequent decrease in the external characteristics of the pump.

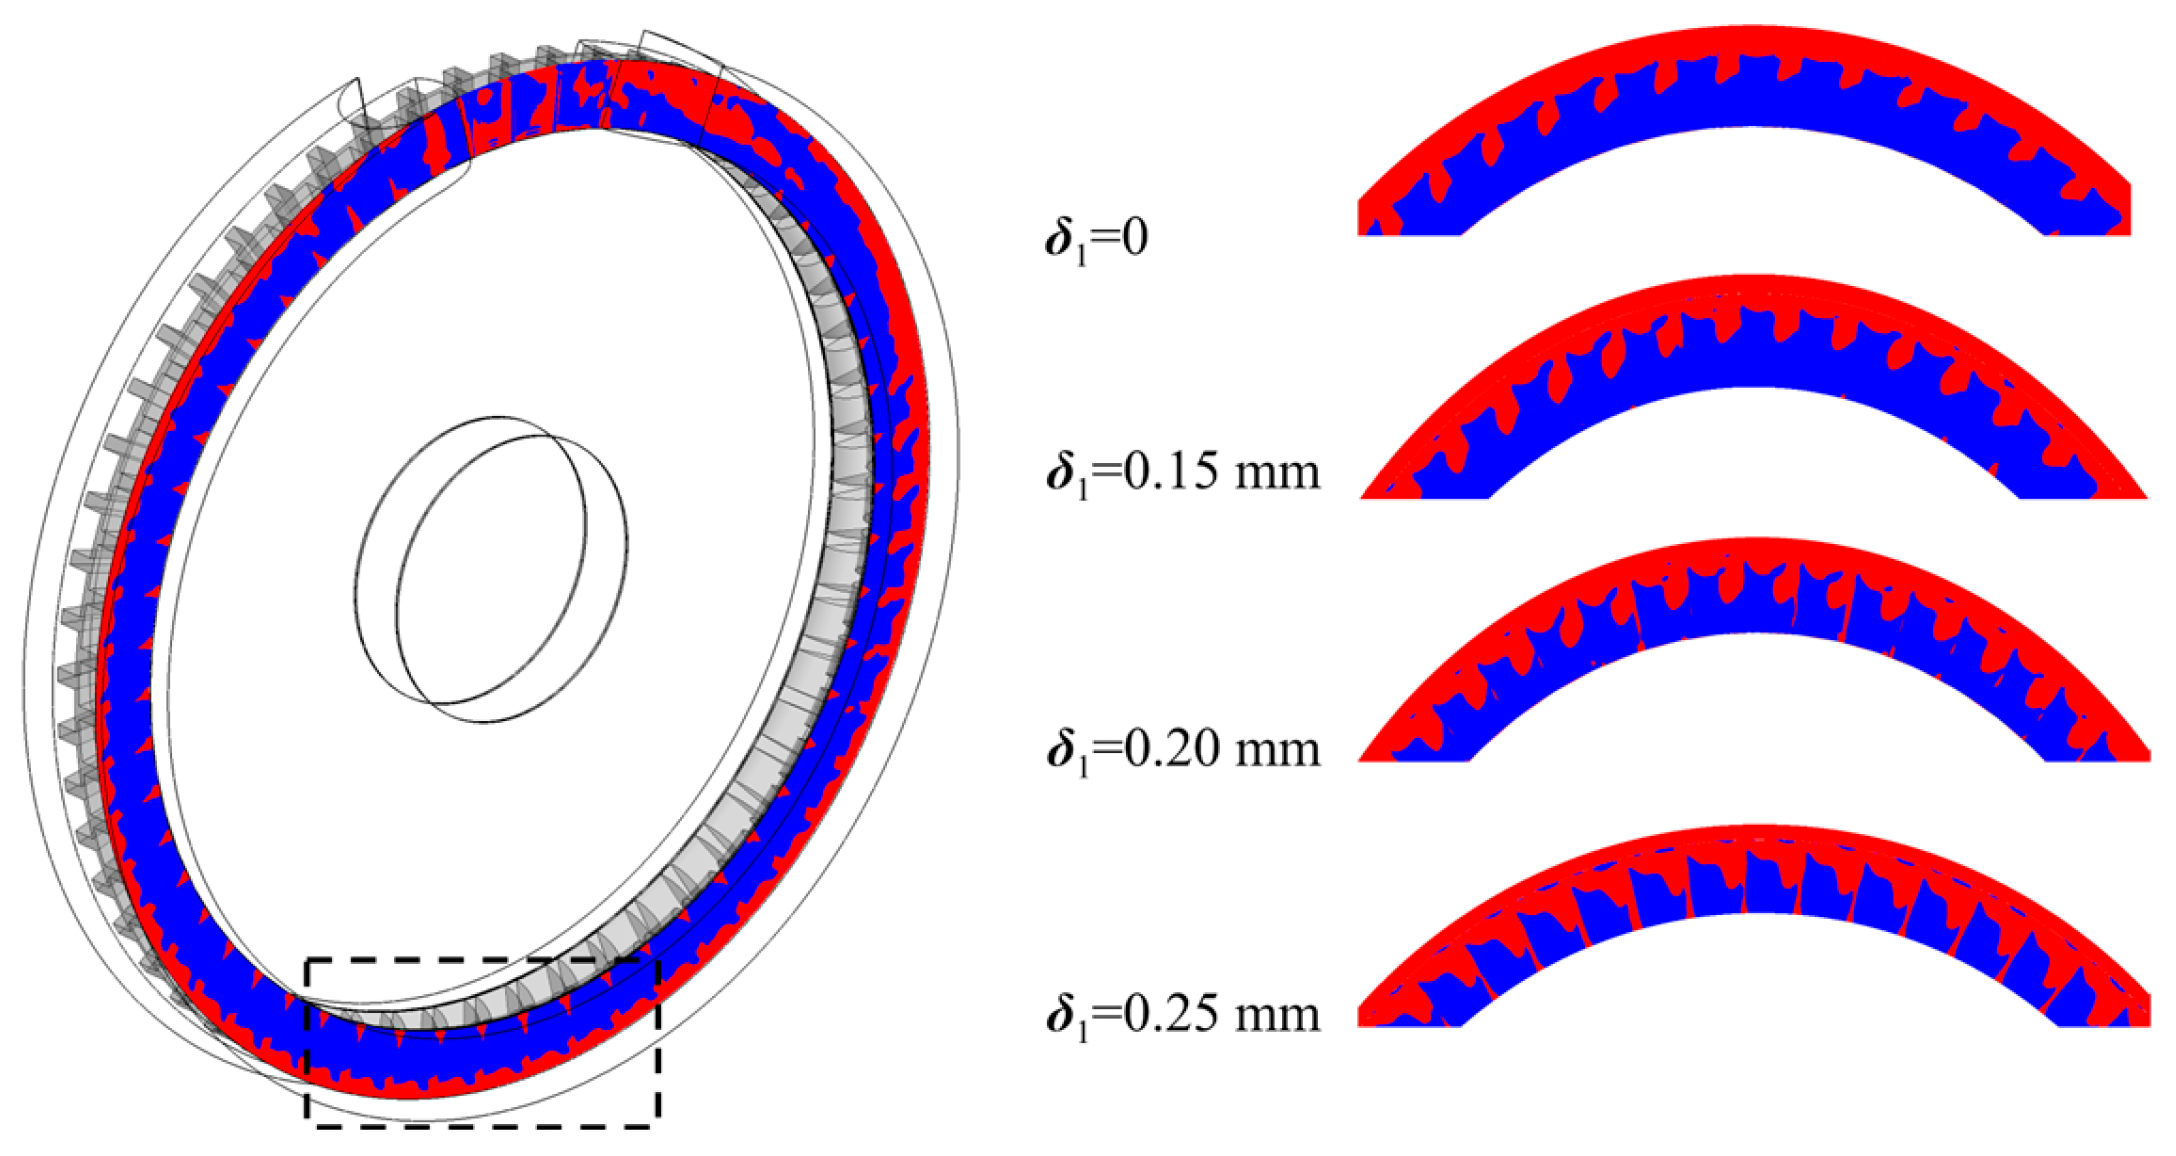
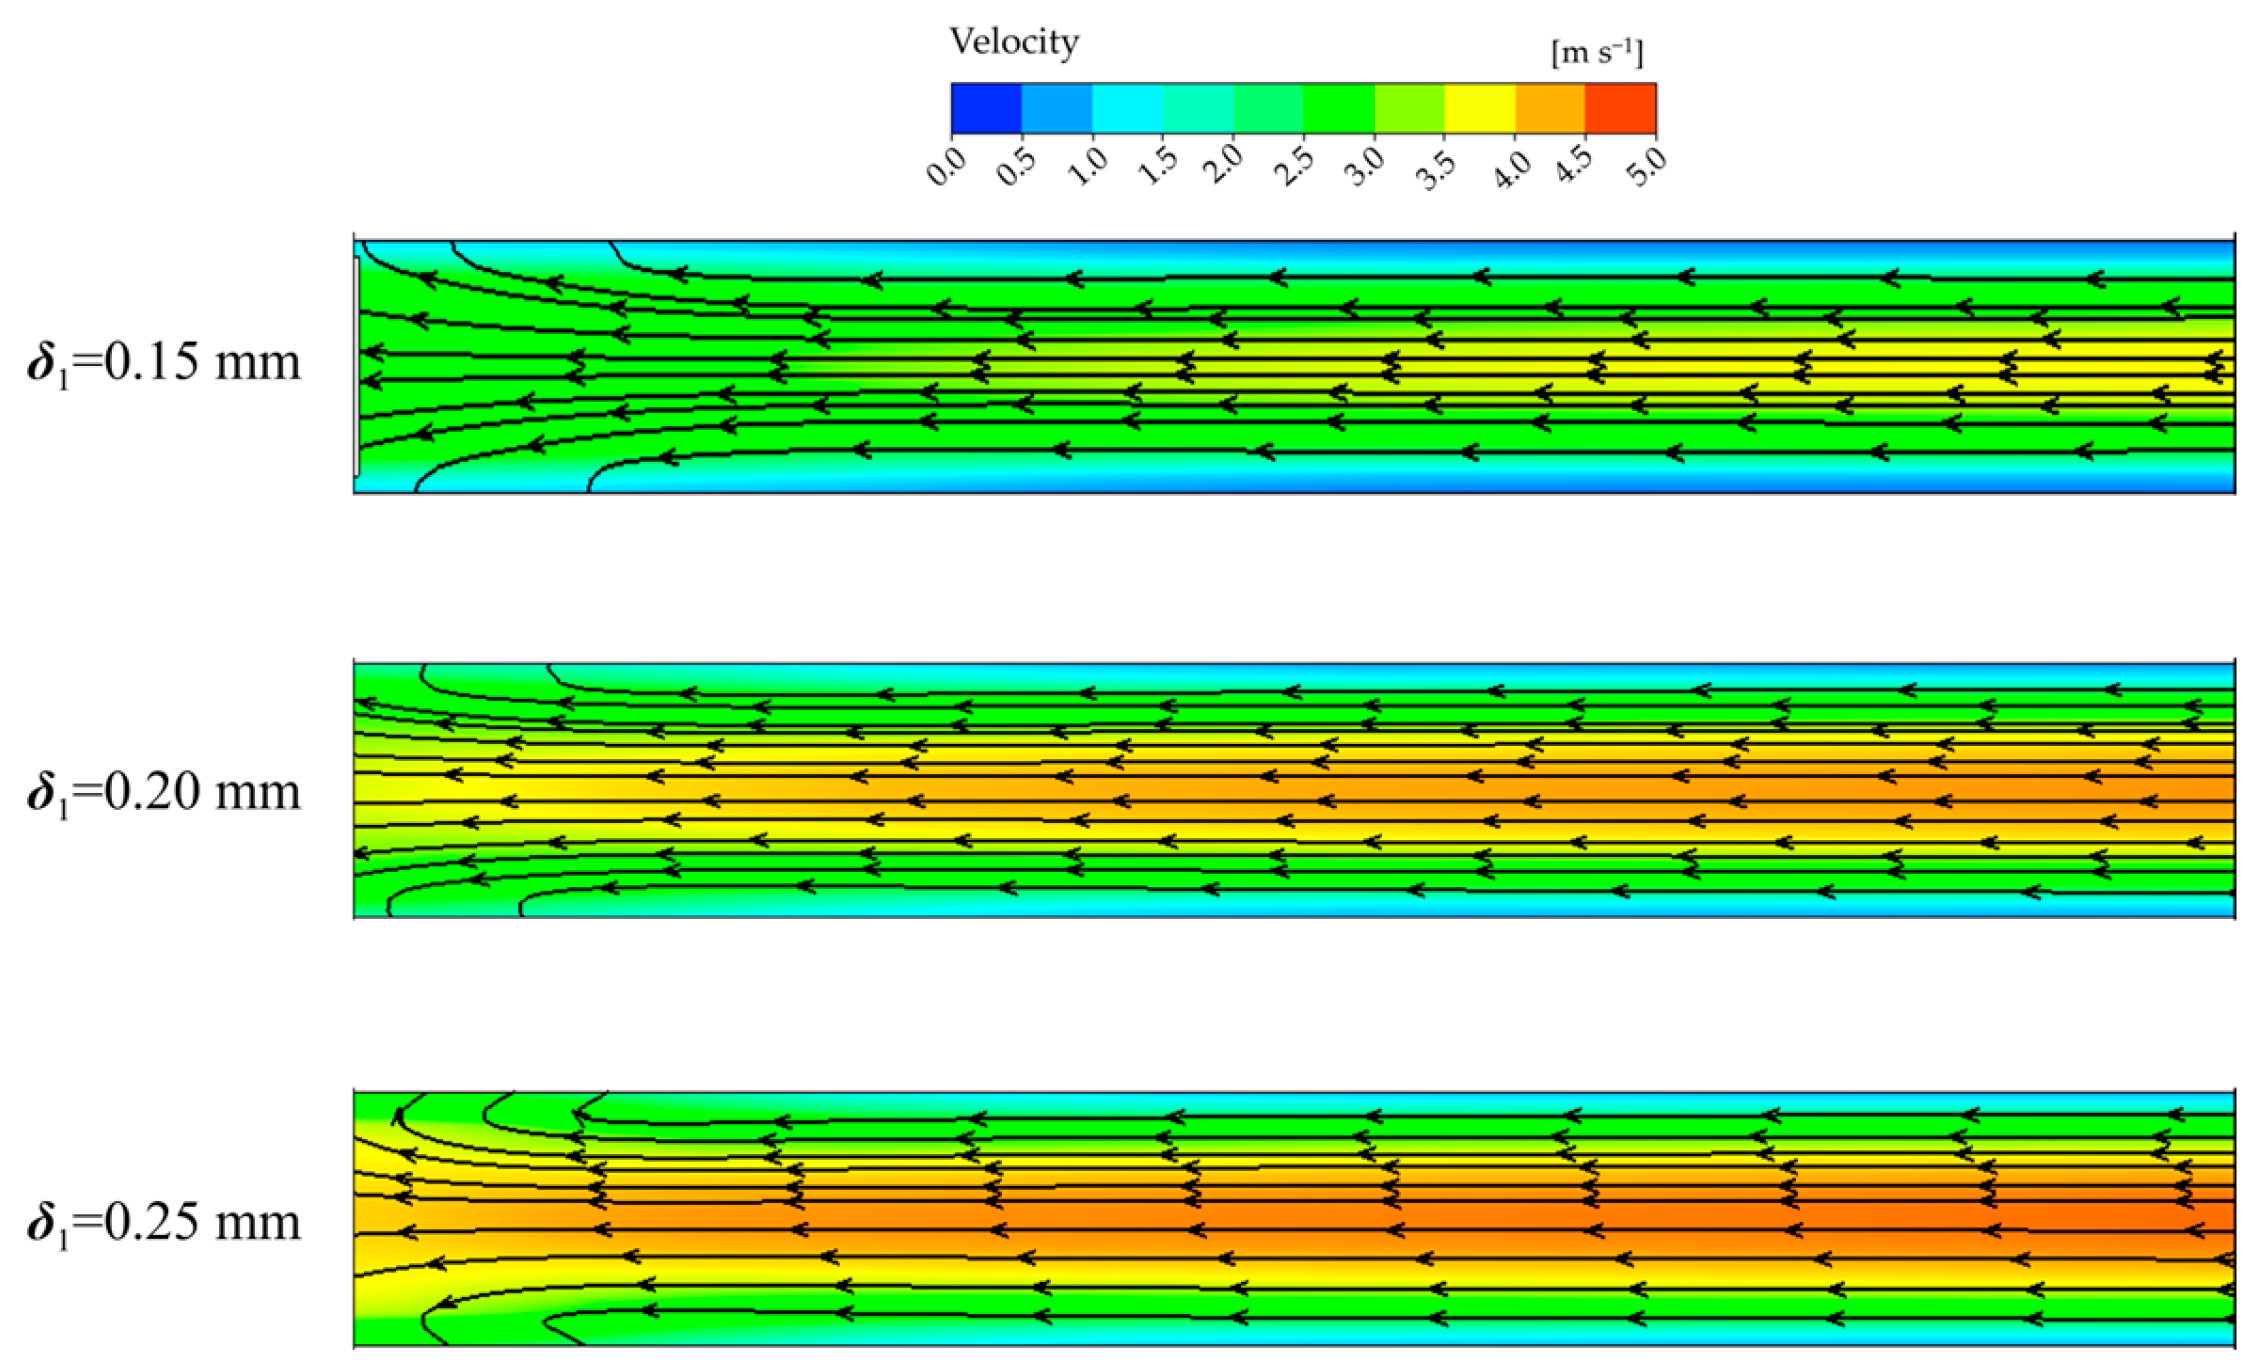
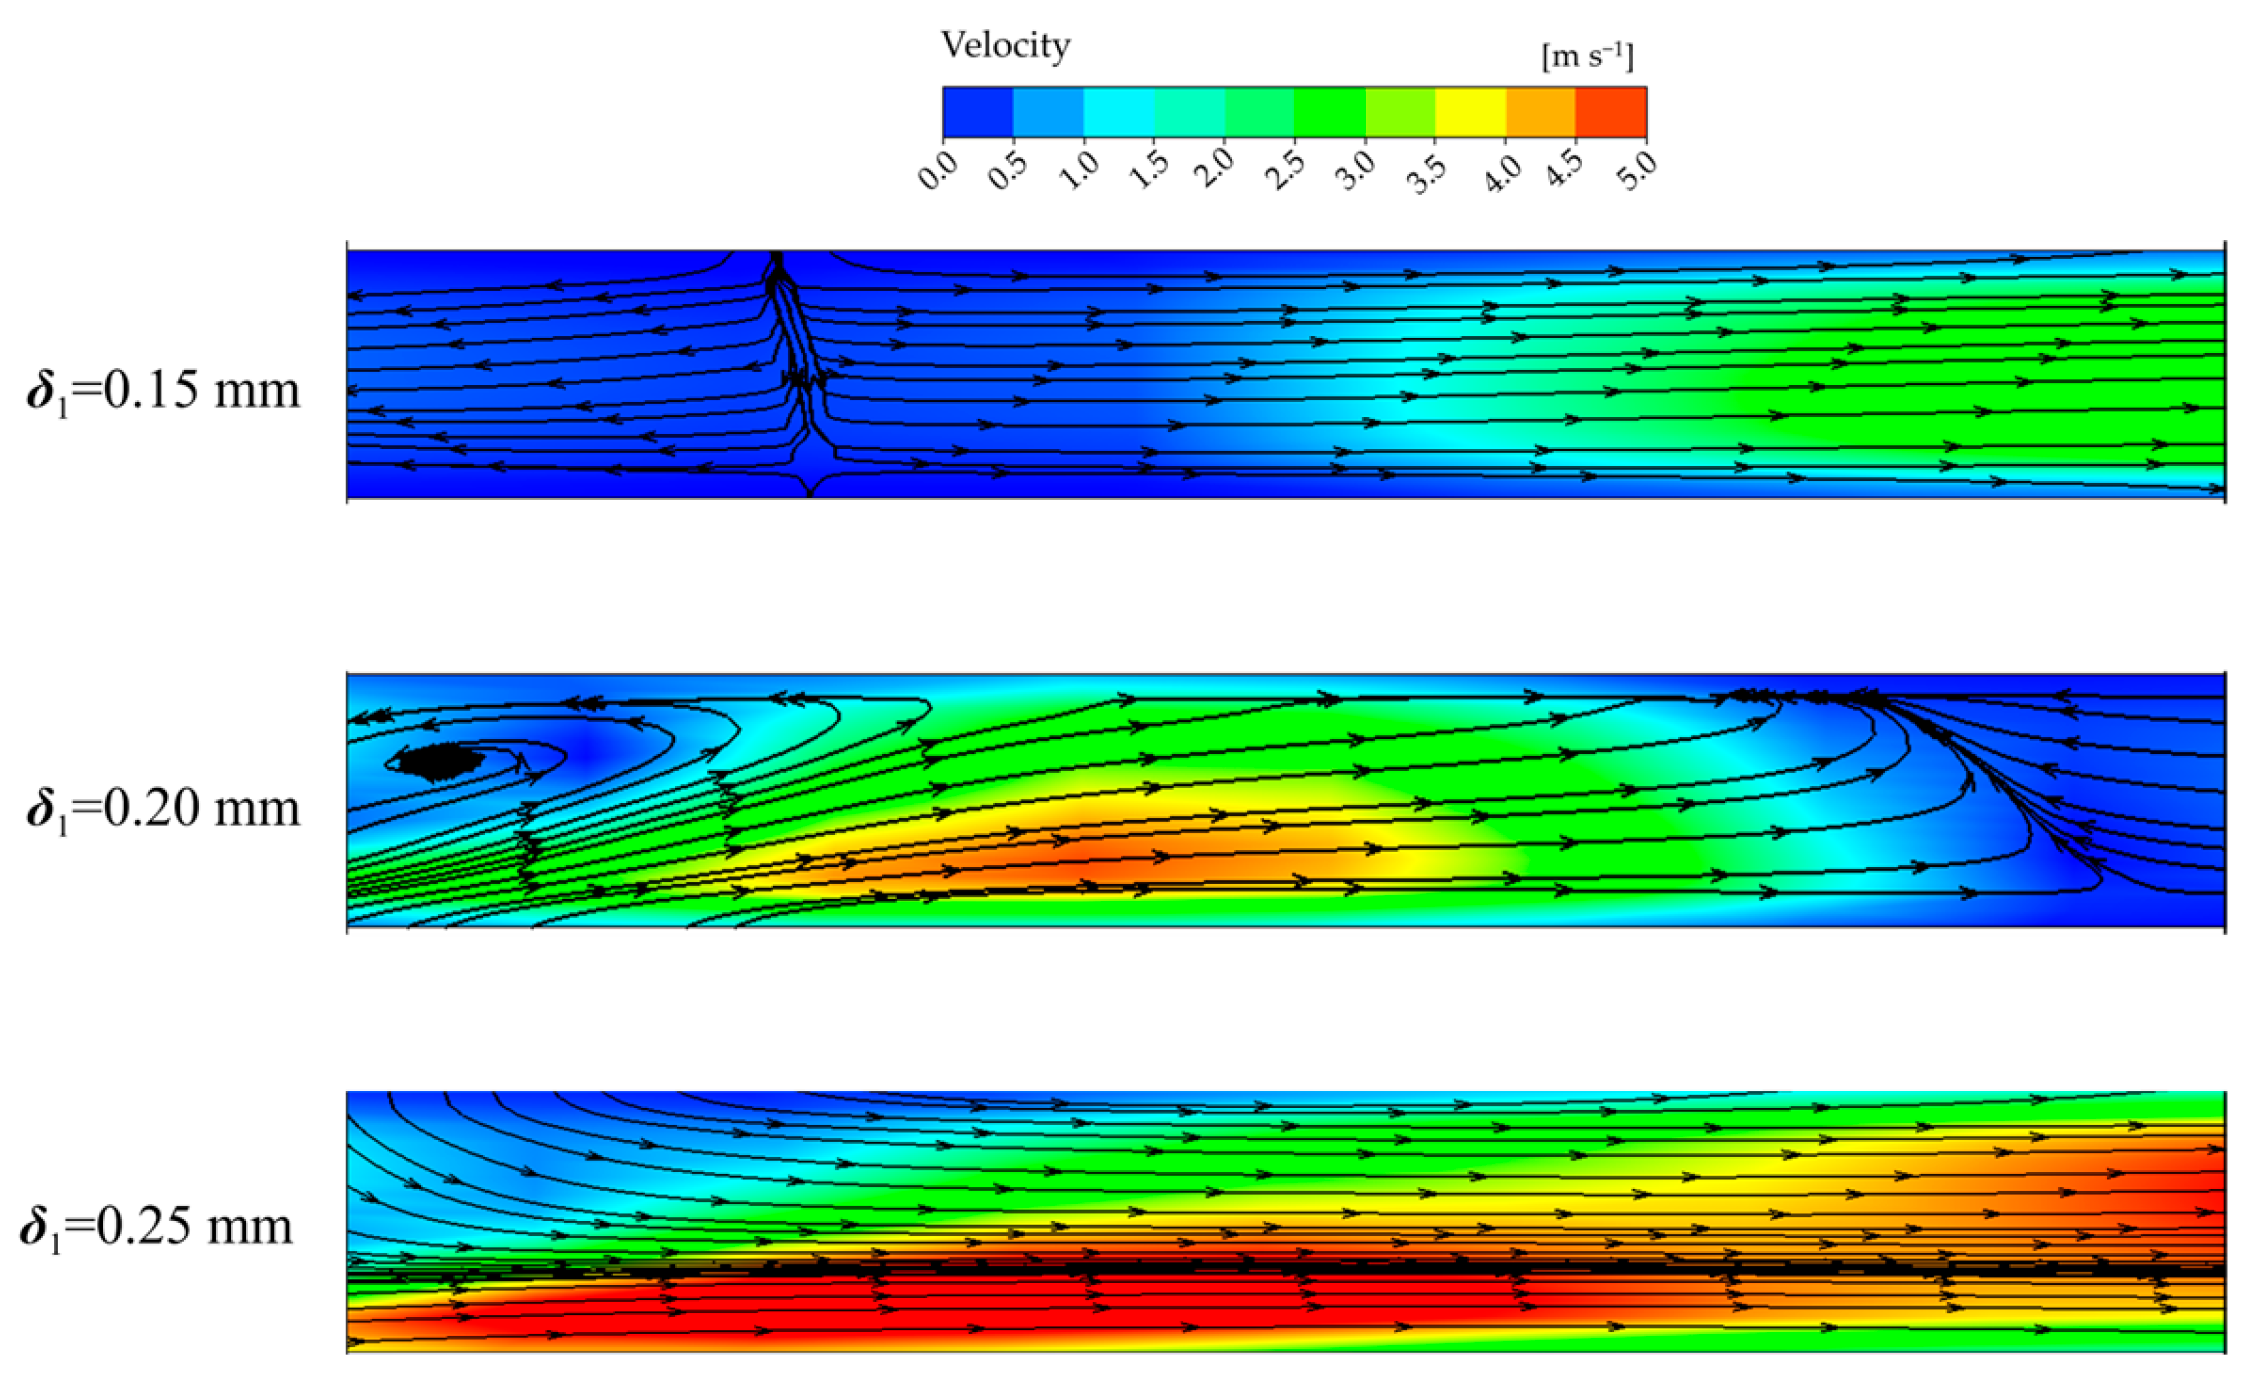
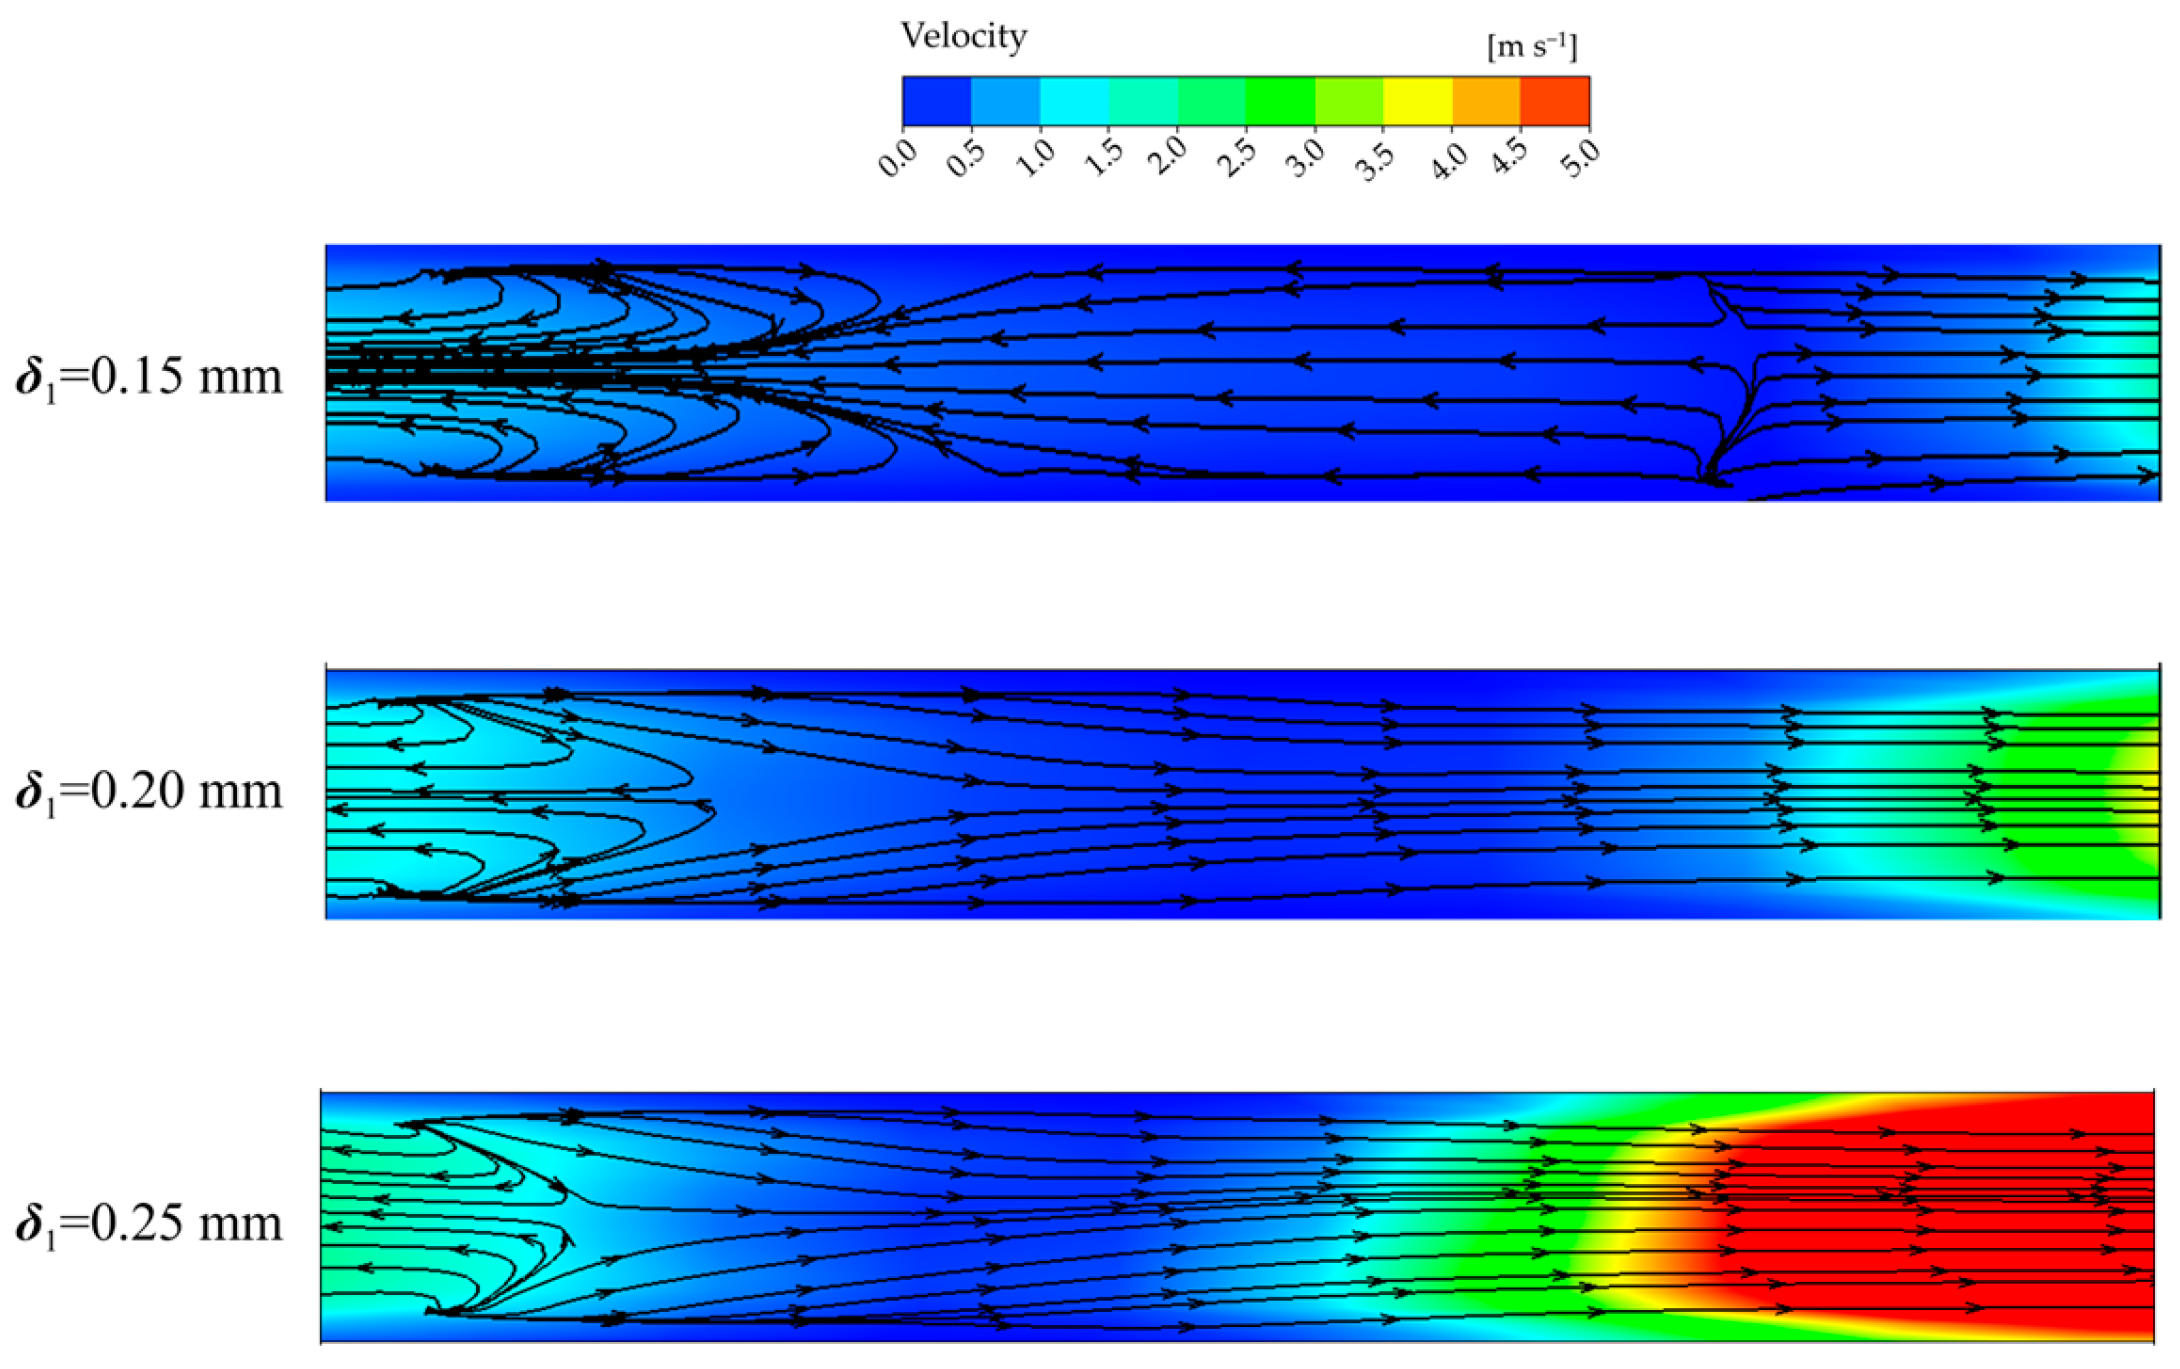
3.3. Clearance Flow Characteristics Analysis

To further analyze the influence of clearance on the internal flow characteristics of various regions within the vortex pump, Figure 13 shows the radial section of the clearance velocity streamlines in the inlet low-pressure region R2 under rated conditions for each clearance scheme. It can be observed that in this region, the clearance flow returns to the main passage in a laminar flow manner. Near the junction of the clearance with the main passage, some of the backflow is influenced by the fluid in the main passage and flows towards the two sidewalls. With the increase in clearance, there is little overall change in the clearance flow state, but there is a slight increase in clearance flow velocity. This is because the enlargement of the clearance size greatly reduces the flow resistance of the clearance flow.
Figure 14 illustrates the velocity streamlines of the clearance at the radial section R6 of the stable-flow region for each clearance scheme under rated conditions. It can be observed that when the clearance value is 0.15 mm, flow separation occurs at the clearance inlet, with the fluid flowing back to the main passage and some flowing towards the radial direction inside the clearance, all in a laminar manner. At a clearance value of 0.20 mm, significant vortices appear at the clearance inlet, with a small portion of the fluid accelerating towards the radial direction inside the clearance from the vicinity of the moving wall region. When the clearance value increases to 0.25 mm, the reduction in flow resistance due to the enlargement in the clearance size results in smoother clearance flow. After entering the clearance passage from the main passage, some streamlines near the stagnant wall surface at the clearance inlet area experience bending and twisting. However, beyond this region, the overall streamlines remain parallel, and the fluid flow becomes more orderly.
Figure 15 illustrates the velocity streamlines of the clearance in the radial section R10 of the high-pressure region at the outlet of the vortex pump for different clearances. It can be observed that there are significant differences in the internal flow characteristics of the clearance in this region under different clearances. Specifically, with the increase in clearance, the backflow at the clearance inlet significantly weakens. This is because the increase in clearance size provides the fluid with a larger flow space to adapt to the velocity changes caused by the channel variation, thereby reducing the phenomenon of flow separation. As mentioned earlier, the clearance fluid in this region gradually returns to a more stable flow state after passing through the turbulent zone at the clearance inlet. During this process, kinetic energy is redistributed, and the fluid velocity gradually increases. With the increase in clearance, the acceleration amplitude of the fluid after passing through the turbulent zone also increases gradually. The main reasons are twofold: firstly, the increase in clearance provides the fluid with a larger space for flow separation recovery, and secondly, the vortices cause energy loss. With the increase in clearance, the reduction in vortices leads to less energy dissipation, resulting in more energy being available for subsequent kinetic energy distribution.
Figure 16 depicts the distribution of turbulent viscosity at the radial section R6 of the stable-flow section for various clearance schemes under rated conditions. This parameter reflects the stress generated when the medium in the axial clearance undergoes turbulent motion, thereby indicating the intensity of turbulent flow inside the clearance. It can be observed that with the increase in axial clearance, there are significant differences in the distribution of turbulent viscosity within the axial clearance. Specifically, the turbulent viscosity within the clearance increases continuously with the increase in clearance value. The main reason for this is that the vortices located at the clearance inlet block the interference between the main stream and the clearance flow. When the clearance value is 0.15 mm, the high-intensity vortices at the clearance inlet hinder the interference between the main stream and the clearance flow. As the clearance increases, the number of vortices in the clearance inlet area decreases, and the blocking effect of the vortices gradually weakens. When the clearance value increases to 0.25 mm, a distinct highly turbulent viscosity region appears at the clearance inlet, connected to the highly turbulent viscosity region formed by the main stream. This indicates that the interference between the main stream and the clearance flow has reached a high level of intensity at this point.

3.4. Leakage Analysis

As mentioned earlier, there is a significant phenomenon of fluid recirculation within the vortex pump. To analyze the impact of leakage flow and recirculation flow on the internal flow field and external characteristics of the vortex pump, Figure 17 shows the distribution of internal leakage flow and recirculation flow under rated conditions for various clearance schemes. It can be observed that in all clearance schemes, the recirculation flow is always greater than the leakage flow. The main reason for this is that the leakage flow in the vortex pump is mainly concentrated in the high-pressure area at the outlet. In this region, there are a large number of vortices at the entrance of the clearance, which partially block the leakage flow. On the other hand, the recirculation flow in the vortex pump is mainly concentrated in the low-pressure area at the inlet, where there are no vortices to obstruct the recirculation, resulting in much lower flow resistance for recirculation compared to leakage flow.
As the clearance increases, both the leakage flow and recirculation flow show an upward trend. This also indicates that the intensity of fluid recirculation in the clearance area increases, consuming more energy. This is one of the key reasons why the performance of the vortex pump decreases with increasing clearance size.

4. Conclusions

This study utilized numerical simulations and experimental validation to investigate vortex pumps with different axial clearances, focusing on a comprehensive numerical simulation of the entire flow field. The analysis explored the influence mechanism of clearance size on the external characteristics, internal flow field, and clearance flow characteristics of vortex pumps, leading to the following conclusions:
  • Axial clearance has a significant impact on the external characteristics of the vortex pump, with a rapid decline in performance as the clearance size increases. The pump head index is more sensitive to clearance scale under low flow conditions, while the pump efficiency index is more sensitive to clearance scale under high flow conditions.
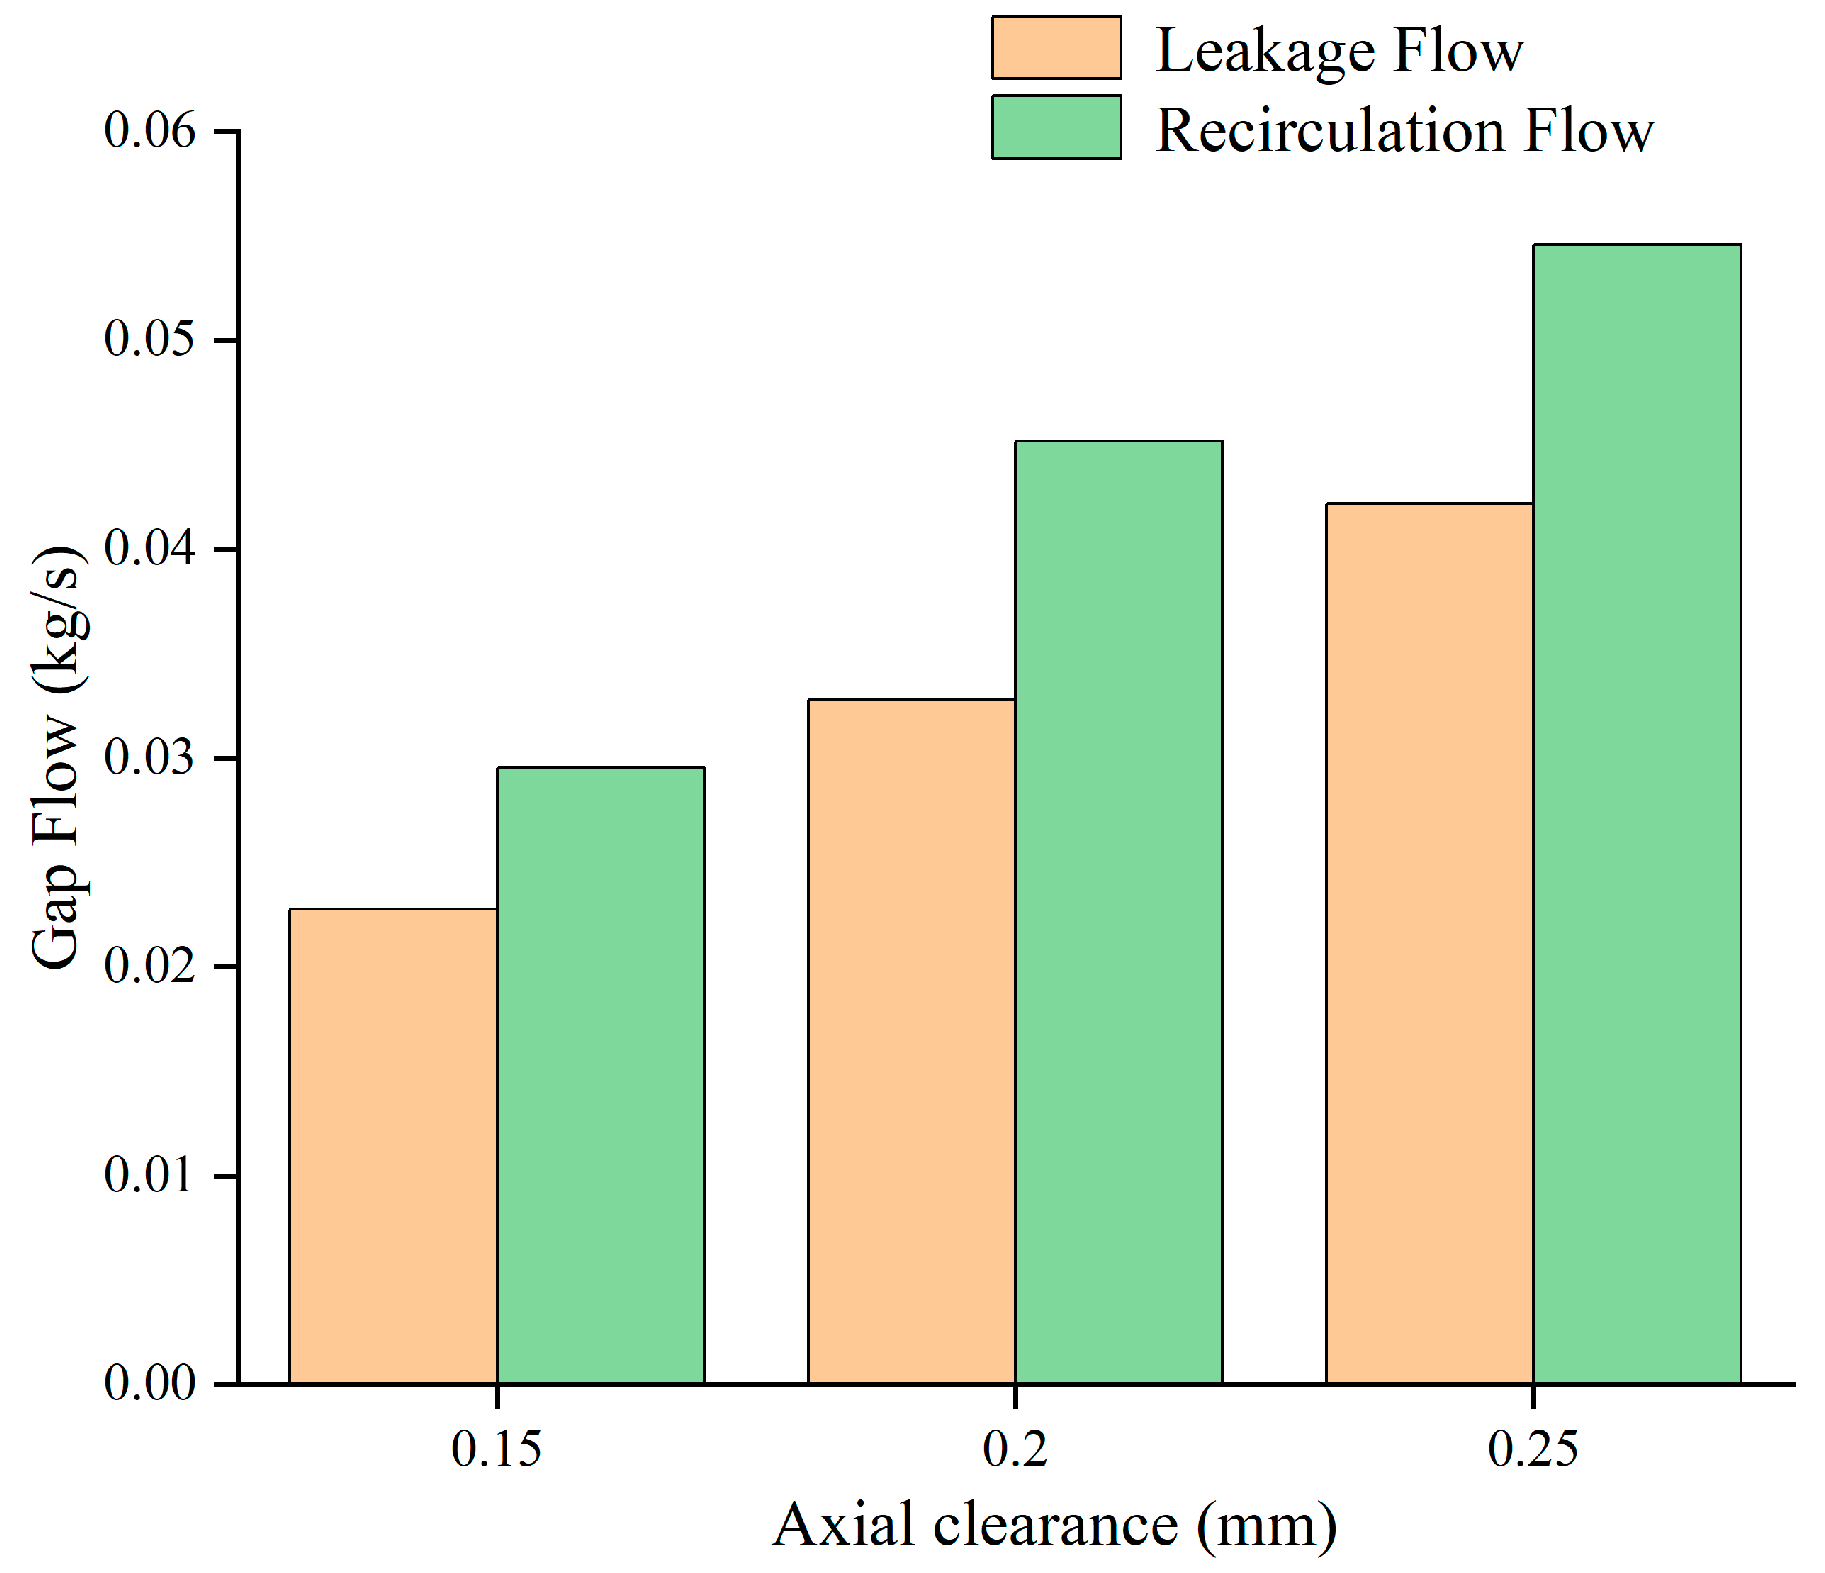
  • In the axial clearance of the vortex pump, there is a significant phenomenon of fluid recirculation. The fluid from the main flow path leaks from the high-pressure area at the outlet and recirculates back to the main flow path in the low-pressure area at the inlet. Both the leakage flow and the recirculation flow cause considerable energy dissipation.
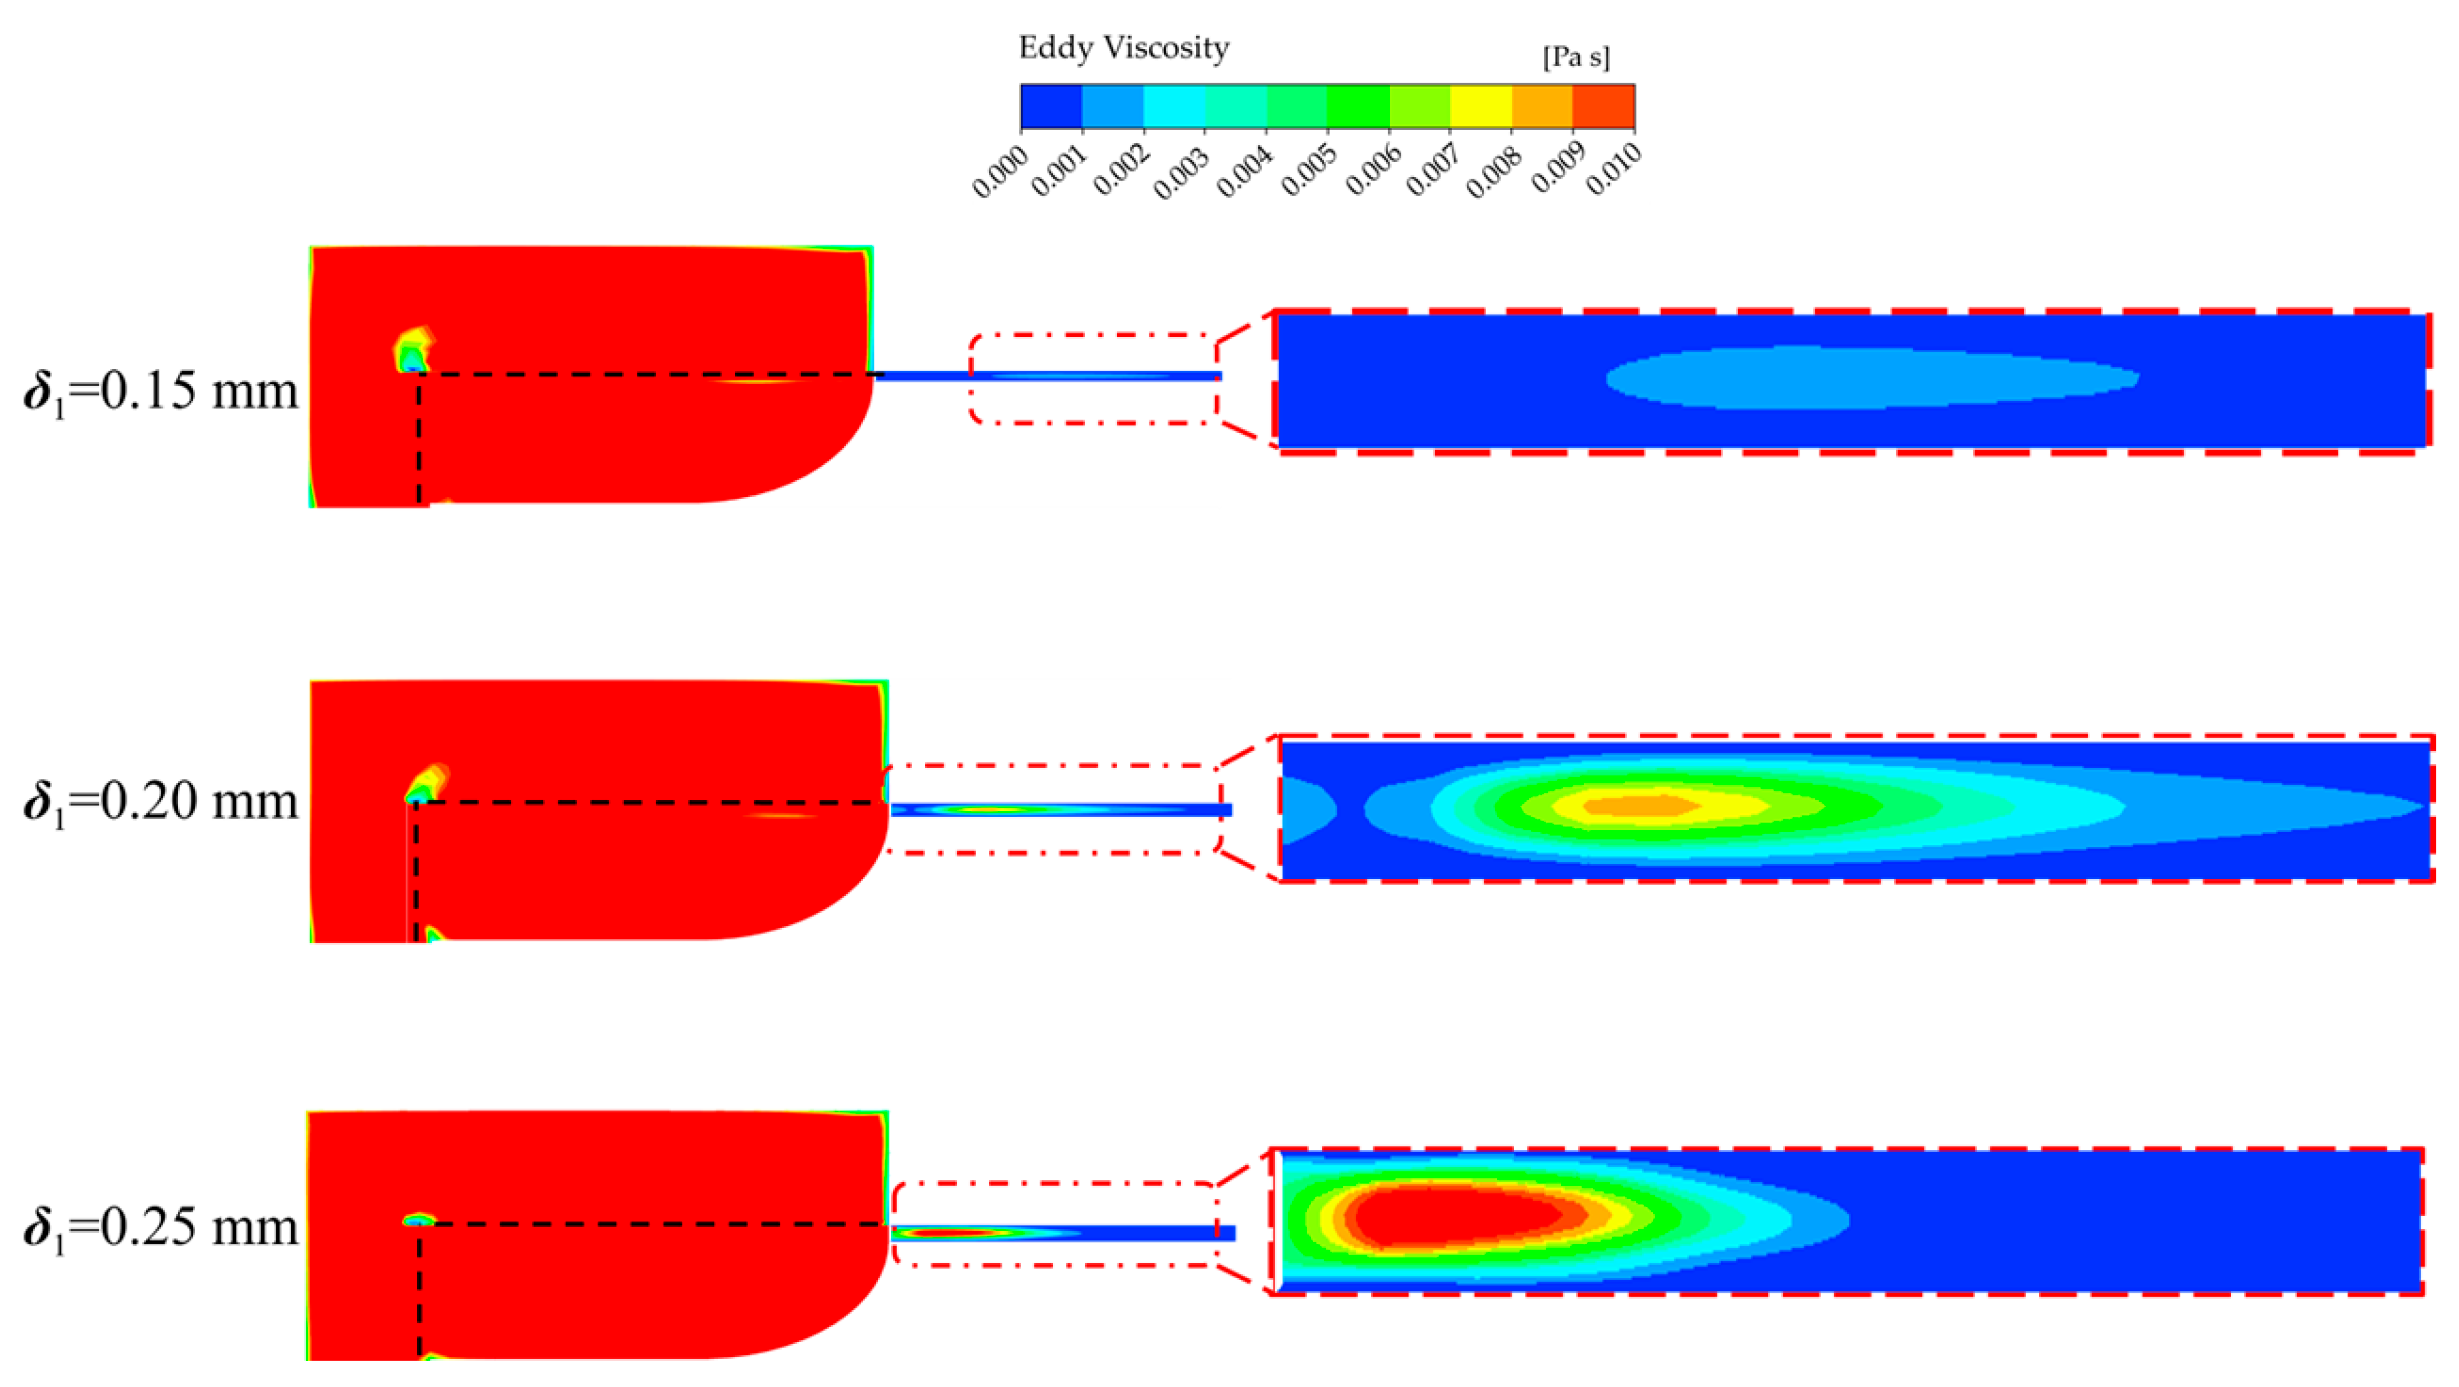
  • As the clearance increases, the flow resistance in the clearance region decreases, leading to an increase in both the clearance leakage and recirculation flow. This results in a higher intensity of fluid recirculation within the clearance region, consuming more energy. Simultaneously, the increased clearance affects the internal vortices of the pump, leading to a decrease in vortex intensity that consequently reduces the intensity of the momentum exchange between the fluid inside and outside the impeller. These two factors are the main reasons for the decline in the external characteristics of the vortex pump caused by an increase in clearance.

Author Contributions

Conceptualization, L.Z. and C.Z.; methodology, L.B.; software, C.Z.; validation, C.Z., L.Z. and L.B.; formal analysis, C.Z.; investigation, L.Z.; resources, L.B.; data curation, C.Z.; writing—original draft preparation, L.Z.; writing—review and editing, R.A.; visualization, L.B.; supervision, R.A.; project administration, L.B.; funding acquisition, L.Z. All authors have read and agreed to the published version of the manuscript.

Funding

This work was supported by the National Natural Science Foundation of China (grant nos. 52079058 and 52209113), the Natural Science Foundation of Jiangsu Province (grant nos. BK20230011 and BK20220544), and China Postdoctoral Science Foundation (grant no. 2023M731367).

Data Availability Statement

The data presented in this article are available upon request from the corresponding author.

Conflicts of Interest

The authors declare that the research was conducted in the absence of any commercial or financial relationships that could be construed as a potential conflict of interest.

References

  1. Guan, X. Modern Pump Theory and Design; China Aerospace Press: Beijing, China, 2011. [Google Scholar]
  2. Wang, H.; Mao, W.; Zhang, Y.; Li, C.; Shen, Y. Design and experiment of online drug mixing system based on synchronous control of water and pesticide flow. J. Jiangsu Univ. (Nat. Sci. Ed.) 2022, 43, 737–744. [Google Scholar]
  3. Möttönen, M.; Pietilä, V.; Virtanen, S.M.M. Vortex pump for dilute Bose-Einstein condensates. Phys. Rev. Lett. 2007, 99, 250406. [Google Scholar] [CrossRef] [PubMed]
  4. Deng, X.; Harrison, G.; Roger, F.; Houston, W. Methodology of turbulence parameter correction in water-lubricated thrust bearings. ASME J. Fluids Eng. 2019, 141, 071104. [Google Scholar] [CrossRef]
  5. El-Emam, M.; Zhou, L.; Yasser, E.; Bai, L.; Shi, W. Computational methods of erosion wear in centrifugal pump: A state-of-the-art review. Arch. Comput. Methods Eng. 2022, 29, 3789–3814. [Google Scholar] [CrossRef]
  6. Senoo, Y. Theoretical Research on Friction Pump; Reports of the Research Institute for Fluid Engineering; Research Institute for Fluid Engineering, Kyushu University: Fukuoka, Japan, 1948; Volume 5, pp. 23–38. [Google Scholar]
  7. Senoo, Y. Researches on Peripheral Pump; Reports of the Research Institute for Applied Mechanics; Research Institute for Applied Mechanics, Kyushu University: Fukuoka, Japan, 1954; Volume 3, pp. 53–113. [Google Scholar]
  8. Iversen, H. Performance of the periphery pump. Trans. Am. Soc. Mech. Eng. 1970, 77, 19–28. [Google Scholar] [CrossRef]
  9. Weinig, F. Analysis of traction pumps. Hydraul. Div. ASME 1955, 2, 21–23. [Google Scholar]
  10. Pfleiderer, C. Centrifugal Pump for Liquids and Gases; Springer: Berlin, Germany, 1949. [Google Scholar]
  11. Wilson, W.; Santalo, M.; Oelrich, J. A theory of the fluid-dynamic mechanism of regenerative pumps. Trans. Am. Soc. Mech. Eng. 1955, 7, 1303–1316. [Google Scholar] [CrossRef]
  12. Grabow, G. Effect of Blade Shape on the Characteristic Behavior of Peripheral and Side Channel Pumps and Hydrodynamic Fluid Couplings. Doctoral Thesis, Technical University of Magdeburg, Magdeburg, Germany, 1971. [Google Scholar]
  13. Quail, F.; Scanlon, T.; Baumgartner, A. Design study of a regenerative pump using one-dimensional and three-dimensional numerical techniques. Eur. J. Mech. B-Fluid 2012, 31, 181–187. [Google Scholar] [CrossRef]
  14. Karlsen-Davies, N.D.; Aggidis, G.A. Regenerative liquid ring pumps review and advances on design and performance. Appl. Energy 2016, 164, 815–825. [Google Scholar] [CrossRef]
  15. Fleder, A.; Böhle, M. A systematical study of the influence of blade number on the performance of a side channel pump. J. Fluids Eng. 2019, 141, 109–111. [Google Scholar] [CrossRef]
  16. Choi, W.C.; Yoo, I.S.; Park, M.R.; Chung, M.K. Experimental study on the effect of blade angle on regenerative pump performance. Proc. Inst. Mech. Eng. Part A J. Power Energy 2013, 227, 585–592. [Google Scholar] [CrossRef]
  17. Wang, Y.; Li, Y.C.; Cao, P.Y.; Liu, Y.; Lü, Z. Analysis of the influence of M-section runner on the performance of vortex pump. Trans. Chin. Soc. Agric. Mach. 2014, 45, 77–82. [Google Scholar]
  18. Mosshammer, M.; Benigni, H.; Jaberg, H.; Konrad, J. Maximum efficiency despite lowest specific speed—Simulation and optmisation of a side channel pump. Int. J. Turbomach. Propuls. Power 2019, 4, 6. [Google Scholar] [CrossRef]
  19. Pei, J.; Zhang, F.; Appiah, D.; Hu, B.; Yuan, S.; Chen, K.; Asomani, S.N. Performance prediction based on effects of wrapping angle of a side channel pump. Energies 2019, 12, 139. [Google Scholar] [CrossRef]
  20. Zhang, W.; Li, Z. Axial clearance of vortex pump. Pump Technol. 1991, 22–26. [Google Scholar]
  21. Shi, G.; Liu, D. Vortex pump impeller backlash adjustment technology. Pump Technol. 2009, 14, 29–31. [Google Scholar]
  22. Zhu, Z.; Wang, L.; Huang, D.; Jin, Q. Theoretical design and experimental study of low flow vortex pump. J. Eng. Thermophys. 2001, 22, 450–452. [Google Scholar]
  23. Wang, J.; Zhang, F.; Zhang, J.; Chen, K.; Hong, Q. Internal flow characteristics of single-stage and multi-stage side channel pumps. J. Drain. Irrig. Mach. Eng. 2023, 41, 133–139. [Google Scholar]
  24. Fleder, A.; Bohle, M. A Systematical Study of the Influence of Blade Length, Blade Width and Side Channel Height on the Performance of a Side Channel Pump. ASME J. Fluids Eng. 2015, 137, 121102. [Google Scholar] [CrossRef]
  25. Qiu, Z.; Zhou, L.; Bai, L.; El-Emam, M.A.; Agarwal, R. Empirical and numerical advancements in gas-liquid separation technology: A review. Geoenergy Sci. Eng. 2024, 233, 212577. [Google Scholar] [CrossRef]
  26. Zhou, L.; Hang, J.; Bai, L.; Krzemianowski, Z.; El-Emam, M.A.; Yasser, E.; Agarwal, R. Application of entropy production theory for energy losses and other investigation in pumps and turbines: A review. Appl. Energy 2022, 318, 119211. [Google Scholar] [CrossRef]
  27. Song, M.; Liu, R.; Chen, K.; Wang, Y.; Zhang, F. Influence of clocking effect on pressure pulsation of multistage side channel pump. J. Drain. Irrig. Mach. Eng. 2023, 41, 993–998. [Google Scholar]
  28. Li, Y.; Bai, C.; Qiao, H.; Yang, Y. Flow characteristics of viscous oil in rotor cavity of cam pump. J. Jiangsu Univ. (Nat. Sci. Ed.) 2022, 43, 464–471. [Google Scholar]
  29. Li, Q. Research on Energy Exchange and Pressure Pulsation Mechanism of Vortex Pump. Doctoral Thesis, Zhejiang University, Hangzhou, China, 2021. [Google Scholar]
Figure 1. Flow passage structure. (a) Axial structure. (b) Radial structure.
Water 16 01602 g001
Figure 2. Three-dimensional model and computational domain. (a) Three-dimensional model. (b) Computational domain.
Water 16 01602 g002
Figure 3. Mesh independence of solution analysis.
Water 16 01602 g003
Figure 4. Computational domain meshing. (a) Impeller. (b) Axial clearance. (c) External passage.
Water 16 01602 g004
Figure 5. y+ distribution. (a) External passage and axial clearances. (b) Impeller.
Water 16 01602 g005
Figure 6. Schematic diagram of test bench. 1—Water storage tank. 2—Ball valve. 3—Flowmeter. 4—Pressure sensor. 5—Solenoid. 6—Vortex pump. 7—RPM torque gauge. 8—Data acquisition board. 9—Variable frequency motors. 10—Computer.
Water 16 01602 g006
Figure 7. Comparison of experimental and numerical calculation results.
Water 16 01602 g007
Figure 8. External characteristic curves of vortex pump model with different axial clearances. (a) Head curve. (b) Efficiency curve.
Water 16 01602 g008
Figure 9. Flow distribution of vortex pumps. (a) Pressure distribution. (b) Radial section distribut I confirmion.
Water 16 01602 g009
Figure 10. Mass exchange between impeller and external passage with different clearances.
Water 16 01602 g010
Figure 11. Pressure distribution of a vortex pump with different axial clearances and vortex pump clearance flow diagrams. (a) δ1 = 0.15 mm. (b) δ1 = 0.20 mm. (c) δ1 = 0.25 mm.
Water 16 01602 g011
Figure 12. Velocity vector distribution of R6 cross-section with different clearances. (a) δ1 = 0.15 mm. (b) δ1 = 0.20 mm. (c) δ1 = 0.25 mm.
Water 16 01602 g012
Figure 13. Streamline distribution in the clearance region of R2 cross-section with different clearances.
Water 16 01602 g013
Figure 14. Streamline distribution in the clearance region of R6 cross-section with different clearances.
Water 16 01602 g014
Figure 15. Streamline distribution in the clearance region of R10 cross-section with different clearances.
Water 16 01602 g015
Figure 16. Eddy viscosity distribution of R6 cross-section with different clearances.
Water 16 01602 g016
Figure 17. Leakage flow and recirculation flow with different axial clearances.
Water 16 01602 g017
Disclaimer/Publisher’s Note: The statements, opinions and data contained in all publications are solely those of the individual author(s) and contributor(s) and not of MDPI and/or the editor(s). MDPI and/or the editor(s) disclaim responsibility for any injury to people or property resulting from any ideas, methods, instructions or products referred to in the content.

