Article

Wastewater and Grey Water Footprint Assessment of the Olive Oil Production Process in Northwest Argentina

by
Evelyn Vuksinic
1,
Roberto Esteban Miguel
1,
Maite M. Aldaya
2,3 and
Corina Iris Rodriguez
4,5,*
1
Estación Experimental Agropecuaria Chilecito, Centro Regional Catamarca La Rioja, Instituto Nacional de Tecnología Agropecuaria (INTA), Ruta de la Producción Km 7.5, Tilimuqui, Chilecito 5360, Argentina
2
Science Department, Public University of Navarra (UPNA), Arrosadia Campus, 31006 Pamplona, Spain
3
Institute for Sustainability & Food Chain Innovation (IS-FOOD), Public University of Navarra (UPNA), Arrosadia Campus, 31006 Pamplona, Spain
4
Centro de Investigaciones y Estudios Ambientales (CINEA), Facultad de Ciencias Humanas, Universidad Nacional del Centro de la Provincia de Buenos Aires, Campus Universitario, Tandil 7000, Argentina
5
Consejo Nacional de Investigaciones Científicas y Técnicas (CONICET), Ciudad Autónoma de Buenos Aires 1425, Argentina
*
Author to whom correspondence should be addressed.
Water 2024, 16(11), 1612; https://doi.org/10.3390/w16111612
Submission received: 15 April 2024 / Revised: 24 May 2024 / Accepted: 1 June 2024 / Published: 5 June 2024

Abstract

:
Argentina stands as the leading producer and exporter of olive products in the Americas, with the province of La Rioja as its main productive area. Since the 1990s, the olive grove cultivated area and related agro-industry in La Rioja have expanded. However, the resulting wastewater has generally been neglected. The water footprint (WF) provides information about the water volume consumed and polluted by a production process. Since the 1990s, agricultural and agro-industrial activities in La Rioja have experienced substantial growth. This study aims to analyze the generation, quality, and management of Oil Mill Wastewater (OMWW) using the grey WF of chloride and nitrate as an indicator and focusing on two olive mills (OM) in La Rioja. Additionally, it seeks to examine the relationship between the international trade of provincial olive oil and the estimated grey WF. For the diagnosis of OMWW generation, a description of the production process was made coupled with flow and physico-chemical characterization. The total grey WF was 8.69 and 45.5 L water/L olive oil for OM 1 and OM 2, respectively. Nitrate was identified as the critical pollutant. The grey virtual water export related to the export of olive oil was 5569 m3 for OM 1 and 28,000 m3 for OM 2. The provincial grey virtual water export related to olive oil was 161,955 m3 with major trade destinations including Spain, the United States, and Brazil. The article analyses for the first time the grey WF of olive oil industries and assess the related grey virtual water exports. This research represents a step forward in the knowledge of wastewater management in the olive oil sector and facilitates the search for solutions to minimize negative environmental impacts while promoting cleaner production.

Graphical Abstract

1. Introduction

In the current globalized world, countries engage in international trade to exchange goods and services. While it brings economic benefits, it also means that consumption in some countries relies on production by others. This interdependency generates several environmental pressures in exporting countries, jeopardizing resources and causing environmental degradation, which hinders the sustainable development of these regions [1,2]. In the case of Argentina, 88% of the land is used for consumption purposes, primarily by the European Union countries and China [3]. Thus, the underdeveloped regions become shelters from the environmental impacts associated with international trade [4,5,6].
In this context, the water footprint (WF) can be a helpful indicator. The WF is a volumetric measurement of the use and pollution of water. Its application and calculation provide useful information for the management of the resource, easing strategic planning, the establishment of priorities, and decision-making on investments, among other benefits. At the same time, it contributes to the estimation of the local environmental impact in terms of the amount of water consumed and polluted, associated with the vulnerability of the local water system. In summary, the objective of the WF assessment is to analyze how human activities are related to the problems of water scarcity and its pollution [7]. The WF is composed of three indicators: blue WF (volume of fresh water consumed from surface and groundwater sources), green WF (volume of rainwater that is evapotranspired), and grey WF (volume of fresh water necessary to assimilate pollutant loads) [7].
Currently, the grey WF has received less attention than the green and blue WF. However, several studies highlighted the relevance of grey WF across industrial sectors [8,9,10], agriculture [11,12,13,14,15,16], and construction materials [17].
In recent years, research conducted in Argentina has evaluated the water–food–trade nexus through virtual water trade [18,19]. Virtual water refers to the volume of fresh water used in the production of a commodity or a service, and which is then traded [20]. To the best of our knowledge, in Argentina there are no studies focusing on grey WF and its international virtual water trade. The grey WF was assessed on a global scale, focusing on nitrogen, and the international virtual water flows were estimated on the basis of trade in agricultural and industrial commodities [21]. In most countries, agricultural WF accounts for the majority of the country’s total WF, with 76% of virtual water flows between countries attributed to international trade in crops and crop products. Argentina ranks as the fourth largest exporter of virtual water (98 billion m3/year), yet its external WF comprises less than 4% of the total WF, making it one of the countries with the lowest external WF [21].
International studies have assessed the associated WF of olive tree-derived productions [22,23,24,25]. Studies comparing WF among primary production systems [26] found that traditional systems had the highest water demand due to green crop water use and the ammonium nitrate used for crop fertilization, compared to the high-density system, which raised the grey WF value. The WF methodology for olive oil production was applied in Spain in the period 1997–2008. The study found that most of the olive oil supply chain water footprint originated during the olive growing process (>99.5%) [27]. This work highlighted the need for further studies that analyze the operational water footprint, which was considered zero [27]. Green water was globally determined as the major WF component of olive groves (82%), with the lowest WF value associated with the crop’s grey component (1.5%) [28]. The green, blue, and grey WF of olive trees and oil at a global level showed an average grey WF of 45 m3/t for olive groves and 217 m3/t for virgin olive oil [29]. The literature focuses on the grey WF related to nitrogen in the agricultural phase [11,12,13,14,15,16]. Even if there are few stages of industrial production processes that contribute substantially to the total WF of the product, in general terms, it is the raw materials of agricultural origin that have the greatest contributions to the total WF [30]. Water reuse linked to grey WF has been highlighted as key for resource conservation, especially in arid regions [28]. As far as we have found, the grey WF of wastewater from olive product industrialization has not been studied.
This article analyses for the first time the generation, quality, and management of wastewater in olive oil industries in the province of La Rioja (Argentina), using the grey WF as an indicator, and assesses the international grey virtual water exports associated with olive oil. This research represents a step forward in the knowledge of wastewater management in these industries and facilitates the search for solutions to minimize negative environmental impacts and promote cleaner production. This research addresses the usefulness of the water footprint as an indicator of water pollution related to a production process of great regional relevance, and also the international water dependencies on it.
Thus, the aims of this study were twofold: to analyze the generation, quality, and management of wastewater in olive oil industries in the province of La Rioja (Argentina), using the grey WF as an indicator, and to assess the grey virtual water exports associated with olive oil globally.

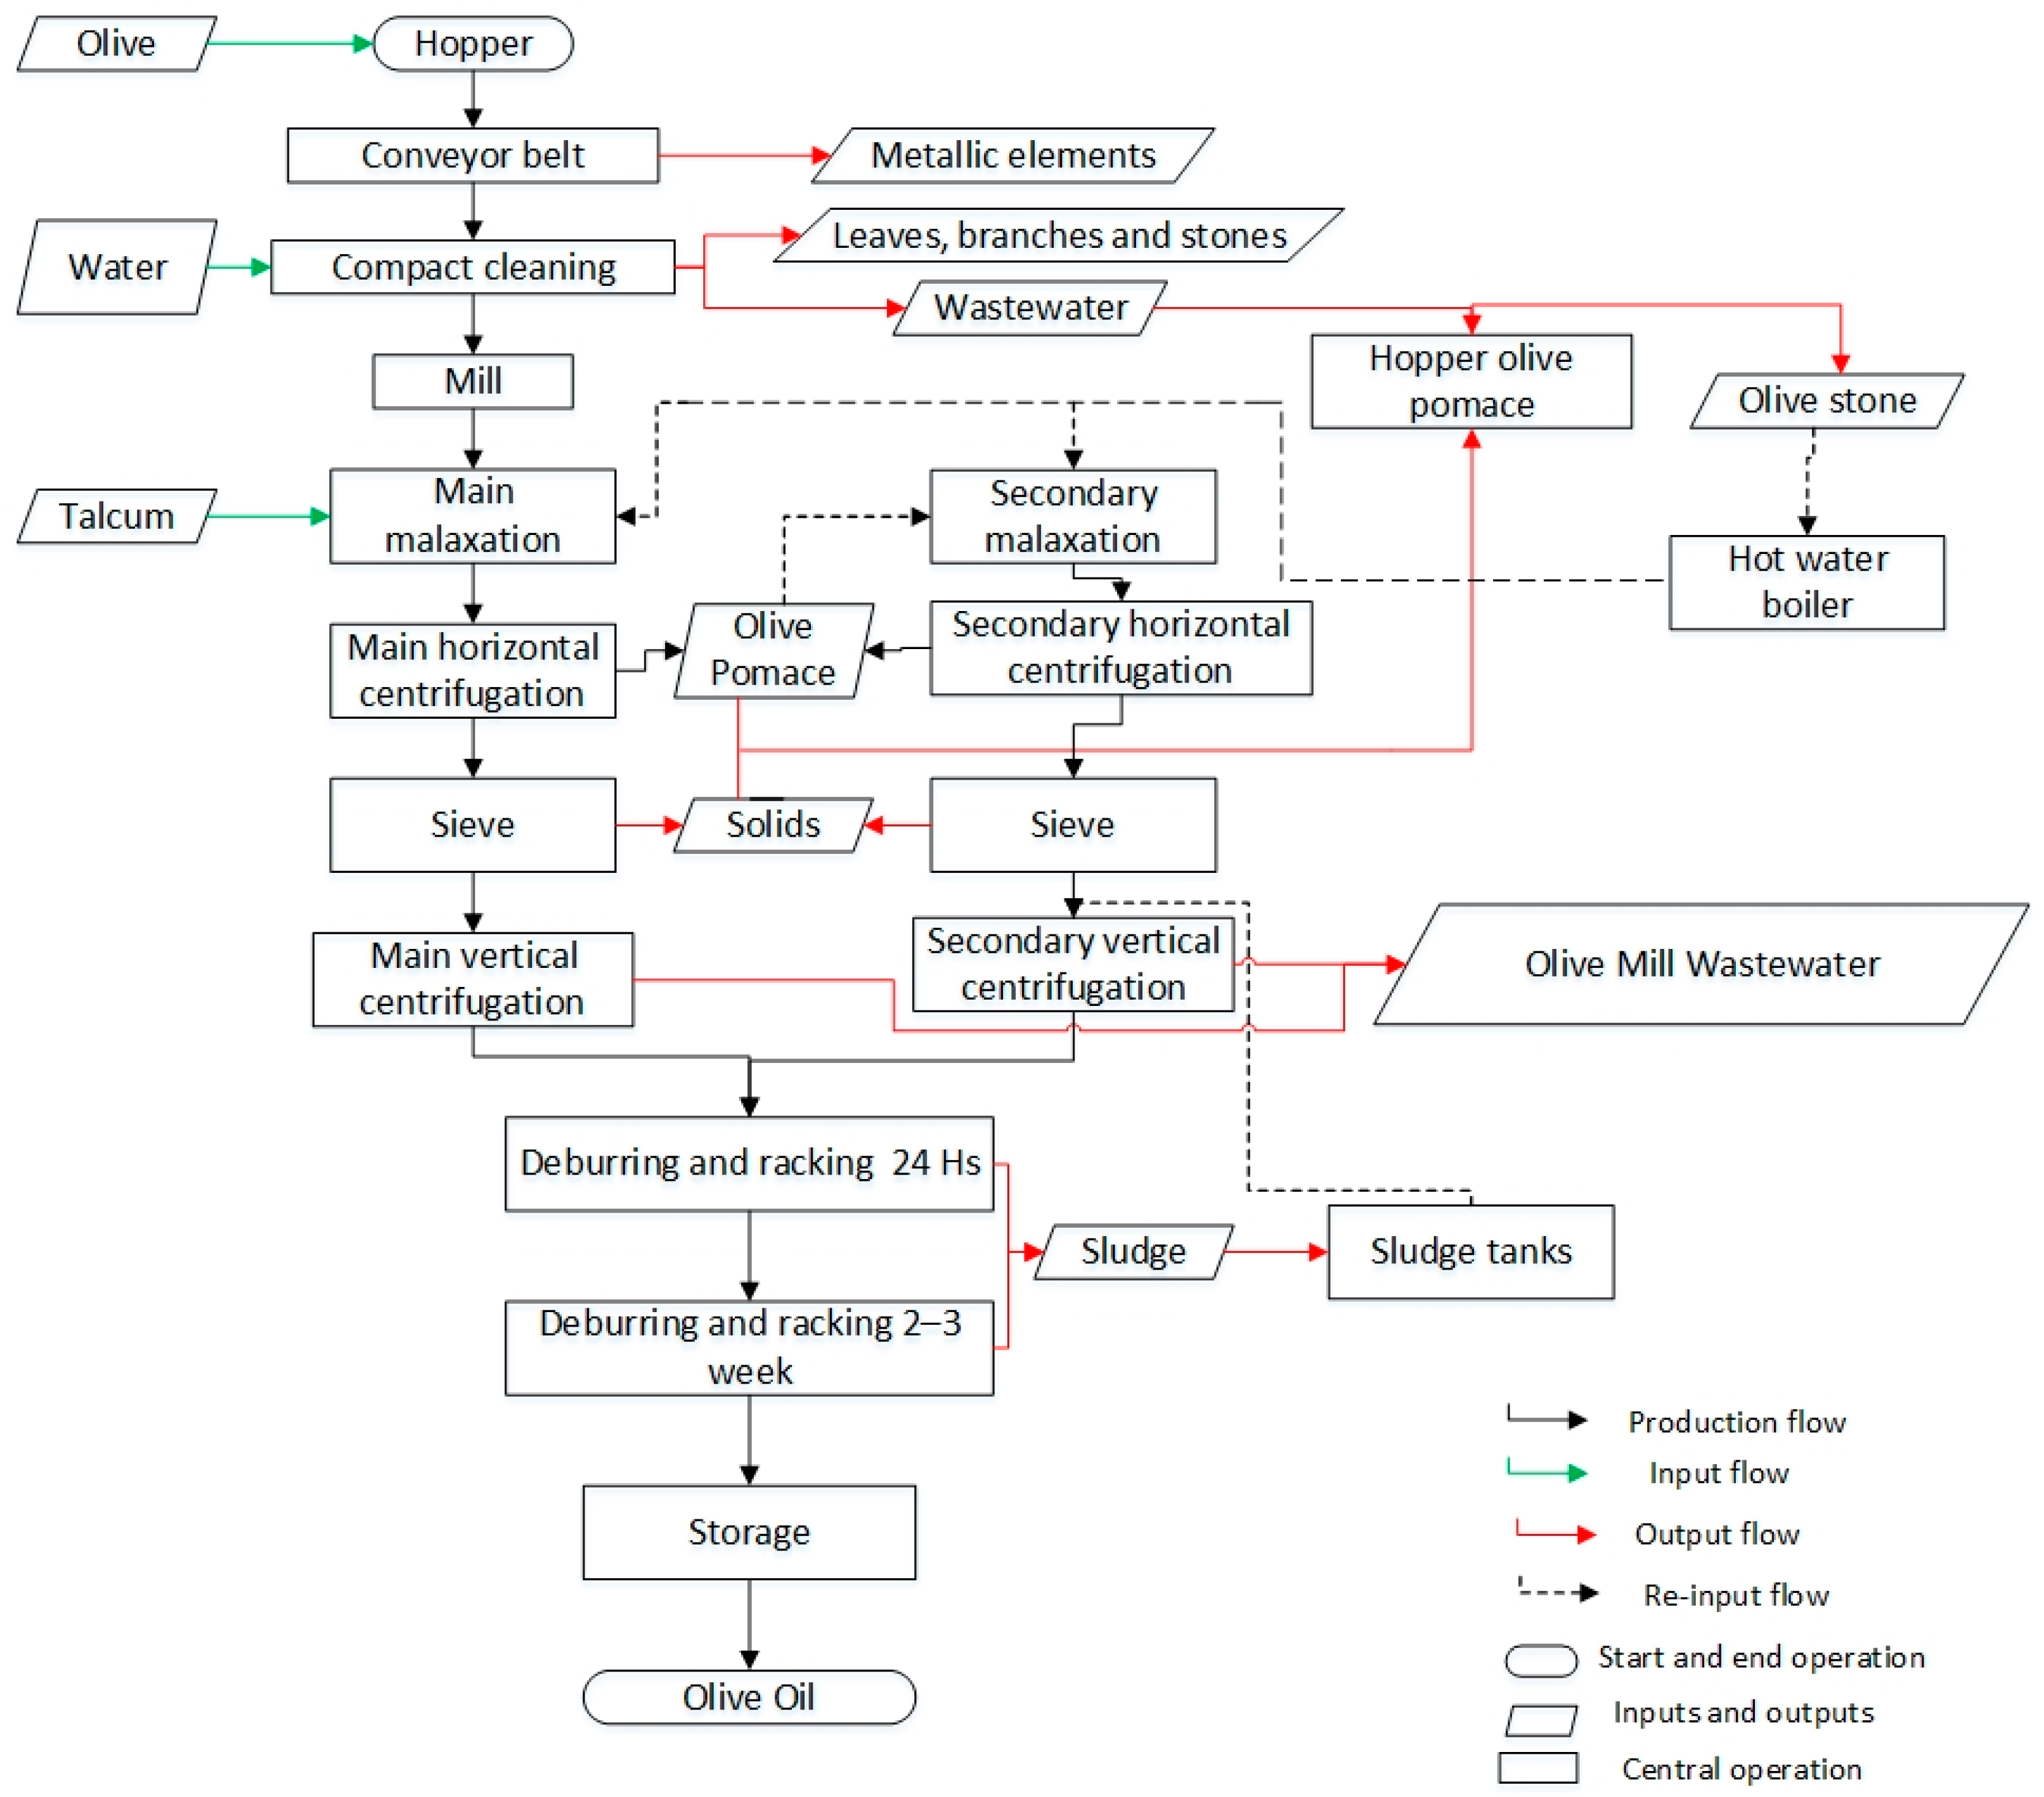
1.1. Production Process and Olive Mill Wastewater Generation

The olive oil production process has evolved over the years with the adoption of new technologies. Basically, the process involves milling the olives to separate and extract the oil. Currently, most industries use a two-phase extraction system that reduces the volume of olive mill wastewater (OMWW) compared to traditional methods. However, the physico-chemical quality of OMWW does not often meet regulatory limits for discharge into rivers, soil, or sewers without previous treatment. Thus, OMWW cannot be used for irrigation because of its high pollutant load [31]. Two-phase industries generate three waste streams: washing water from fruit cleaning, also present in other systems; semi-solid waste generated during primary centrifugation composed of stone and olive pulp residues in an aqueous phase known as olive pomace (OP) [32]; and vegetable water produced during the purification of virgin olive oil (OMWW). The flow rate of OMWW is approximately 0.15 L/kg of processed olives, while the fruit washing stage generates around 0.05 L/kg of processed olives [33].
One of the solutions implemented for OMWW management has been storage in evaporation ponds. Although this method is widely used, it has drawn criticism and concern from producers, regulators, and researchers. It is a long-lasting process that results in the concentration of organic and inorganic matter [34]. The long-term storage of wastewater derived from olive industries leads to the accumulation of toxic sediments rich in recalcitrant compounds with phytotoxic and antimicrobial properties, which limits their use for agronomic purposes [35]. Consequently, the wastewater’s pollutant load increases over time. Furthermore, it generates additional problems such as pond clogging, the need for new ponds construction, expansion of occupied areas, overflow, air pollution, and insect infestations. In some cases, evaporation ponds become accumulation ponds because of a higher influx of effluents compared to the rate of evaporation, which depends on weather conditions [36].
A number of researchers have proposed the reuse of wastewater as a soil amendment, along with olive cake. Both actions must be carried out prior to treatment because of their potential effects on the physical, chemical, and biological properties of the soil, phytotoxic effects on crops, and groundwater pollution [37,38,39,40,41,42]. Currently, regional production lacks wastewater treatment generated in olive oil production. Regarding liquids, the olive washing water contains particles of dust or dirt carried over, as well as some amounts of fat and other products from olives that may be more or less physically damaged during harvesting and transport. The presence of polluting substances in the washing water largely depends on the state of the olives at the time of harvesting. The olives collected early in the harvesting season are in a stable state and contribute little of their vegetable content to the water during washing. However, towards the end of the harvesting season, the fruits have ripened and break easily when washed, which leads to greater organic pollution with sugars, organic acids, polyalcohols, polyphenols, and fats, among other substances [34]. As for nitrogen, although the content in oil effluents is in organic form, its mineralization by soil microorganisms can transform it into nitrate, thus favoring accumulation and leaching into groundwater [38]. The physico-chemical properties of the effluents can vary depending on the extraction process, olive variety, degree of maturation, cultivation system, conservation time of the olives before being crushed, and storage techniques and facilities [39]. Worth highlighting is the seasonality of the OMWW generation in olive oil production, which is not only affected by the seasonality of the crop harvest (March–May) but also by alternate bearing of the olive trees, whereby an abundant harvest is preceded by another with fewer fruits [43].

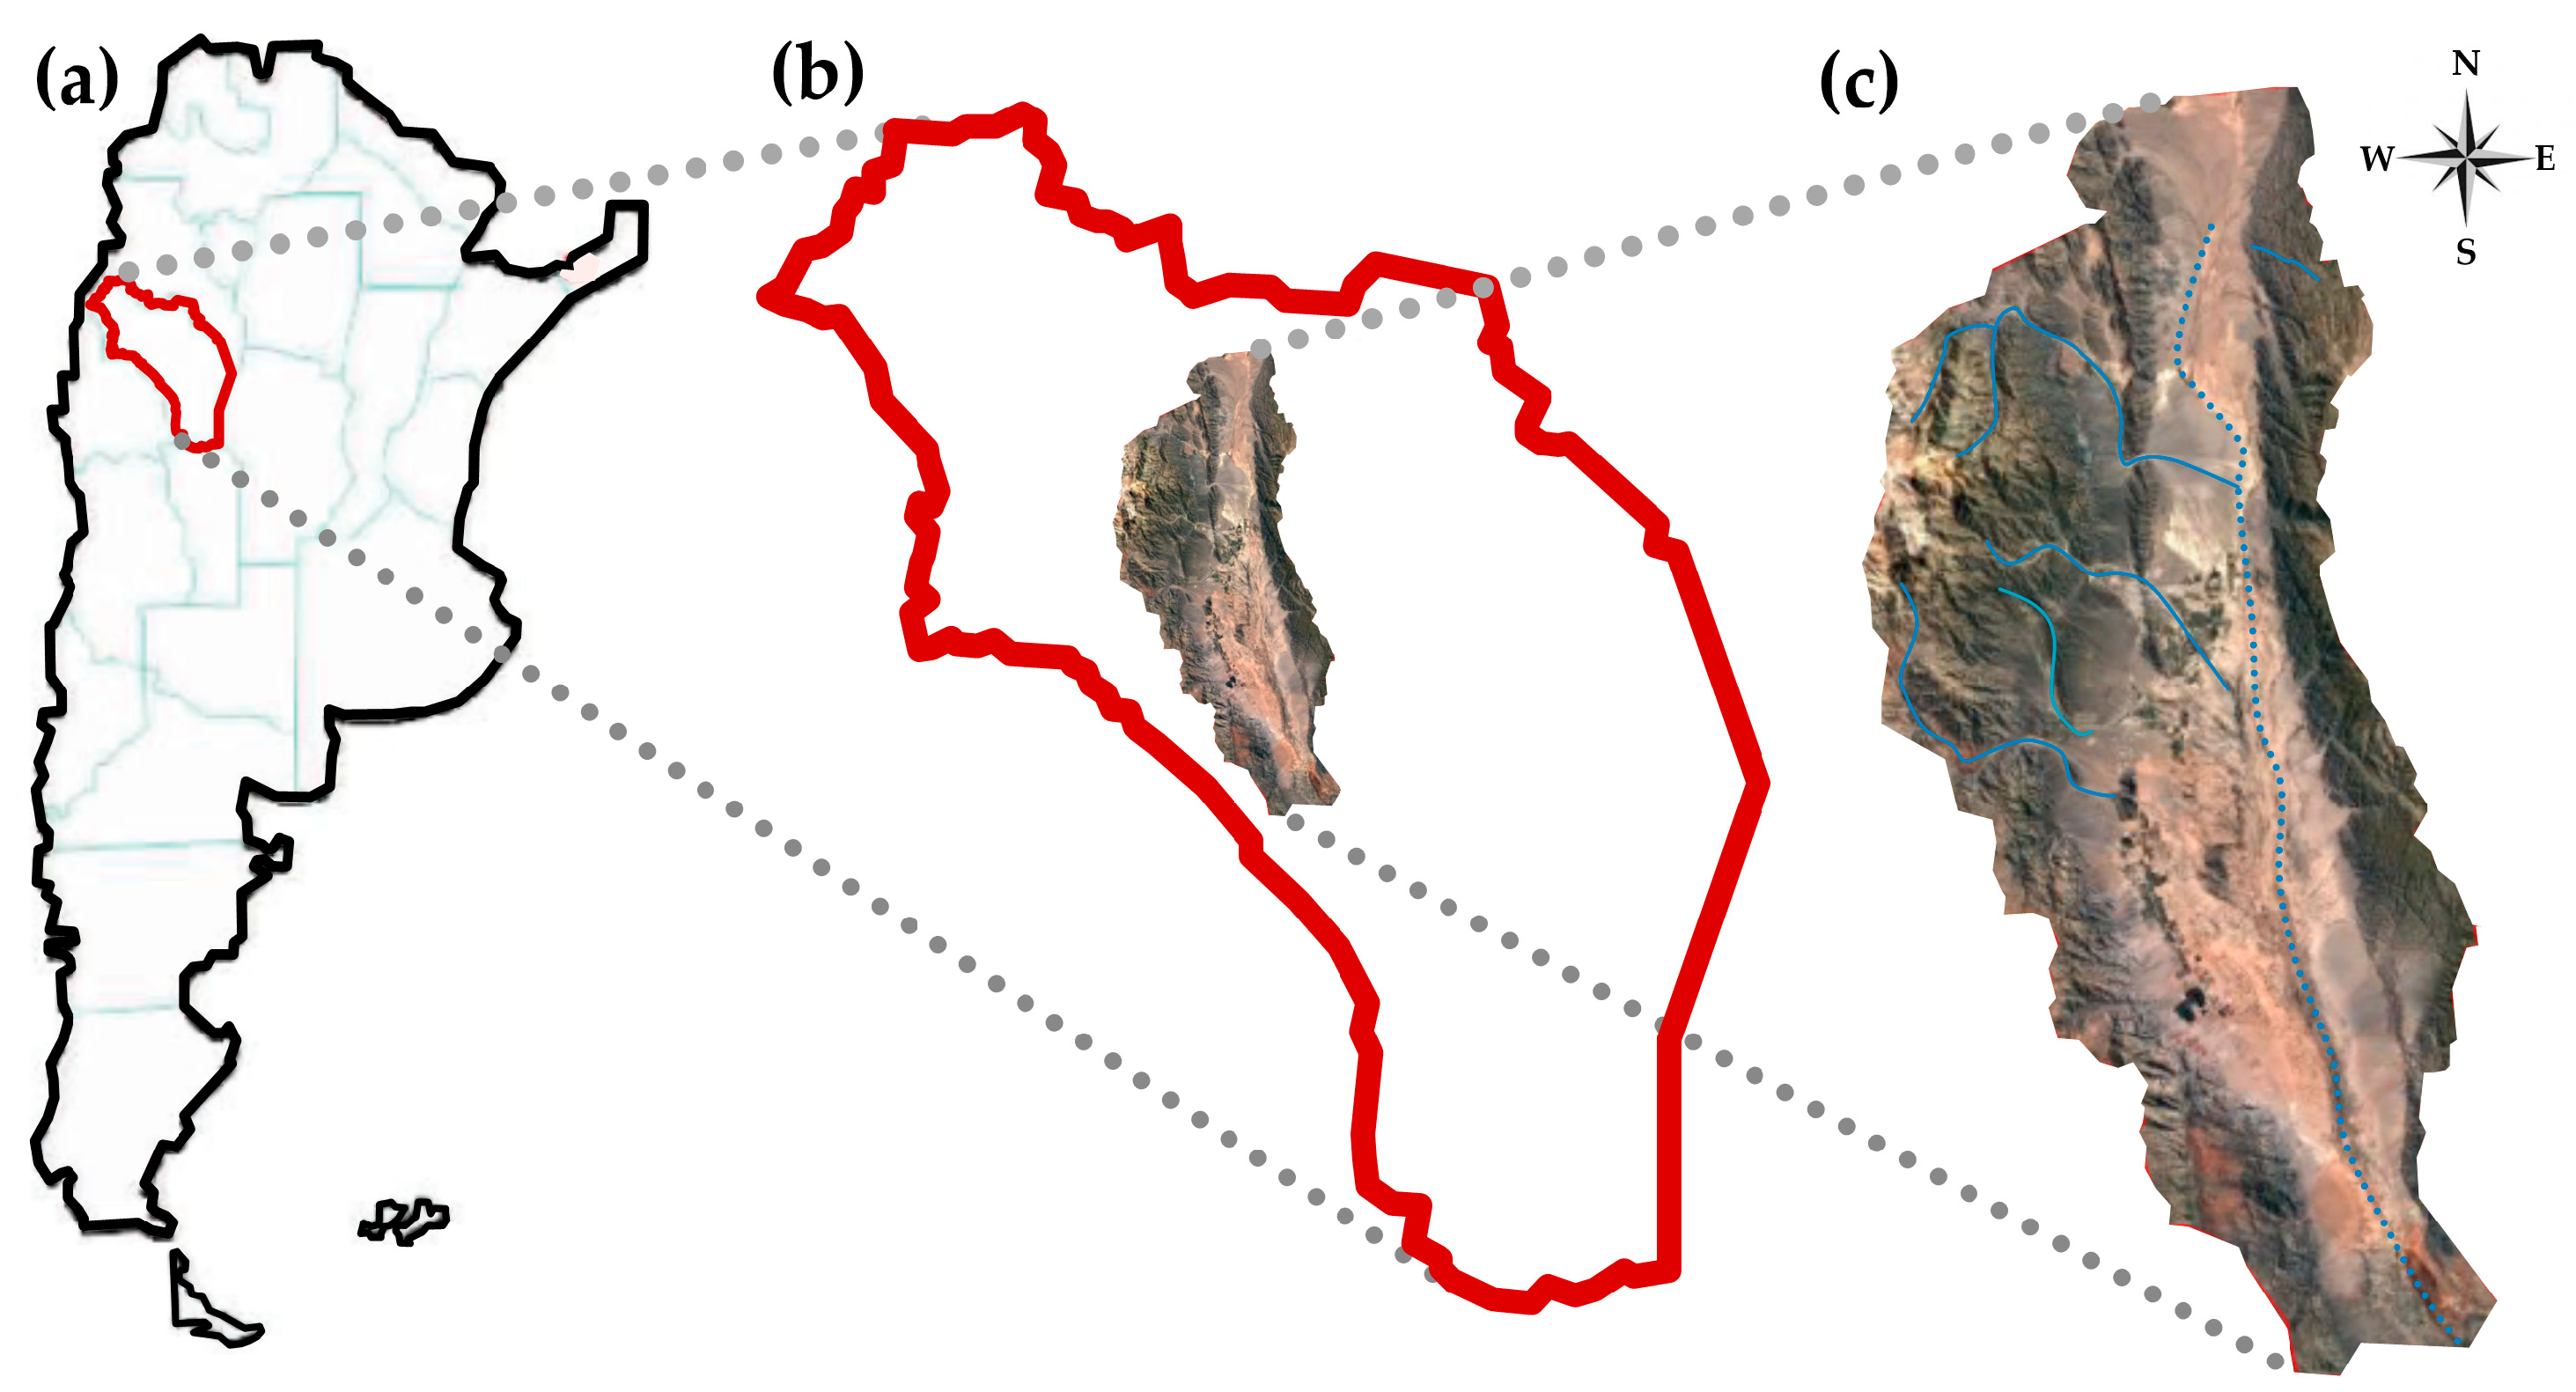
1.2. Study Area and Industrialization Process in the Region

The olive grove cultivated area in Argentina expanded by approximately 50,000 hectares between 1992 and 2003. Argentina is the leading producer and exporter of olive products on the American continent, with 77,170 hectares of olive groves cultivated for oil and preserves [44]. Around 50% of the cultivated area is dedicated to varieties for olive oil extraction, 30% to table olive production, and the remaining 20% to dual-purpose varieties [45]. The main productive regions include the provinces of La Rioja (27.8%), Mendoza (22.9%), Catamarca (20.8%), San Juan (20.2%), Córdoba (5%), Buenos Aires (2.7%), and Rio Negro (0.6%) (CNA, 2018). In terms of olive oil, Argentina ranks sixth in global exports, with 80% of production exported to Spain (42%), the United States (39%), Brazil (17%), Paraguay (1%), and Chile (1%) [46].
Antinaco Los Colorados Basin (ALCB) is the most important agricultural area in La Rioja province, with olive groves being the main crop grown under irrigation from surface and groundwater sources [47]. La Rioja allocates 57.75% of its production to the elaboration of olive oil, with its main international destinations being the United States of America, Spain, and Brazil [46]. The export of the olive chain represents 11.5% of the total external sales of the province of La Rioja [46]. Olive oil extraction poses a serious environmental challenge because it generates a large quantity of waste in a short period. The waste from olive mills, in both liquid and solid forms, includes olive mill wastewater (OMWW), wood and leaves, olive pomace (OP), and stones [48].
Since the 1990s, agricultural and agro-industrial activities in the province have significantly expanded under different laws promoting production. However, this growth overlooked wastewater management. Thus, wastewater is currently discharged into dry riverbeds, applied in soil, or disposed of in ponds, which poses a risk of groundwater contamination. Therefore, groundwater, the primary resource for irrigation and agro-industry, could suffer adverse effects from agro-industrial wastewater management, which jeopardizes the sustainability of the productive system [31]. Indeed, salinization processes have been detected to the south of the basin, together with changes in groundwater quality extracted from pumping wells. This increased electrical conductivity and high nitrate and chloride concentrations indicate anthropic contamination from irrigation runoffs and agro-industrial wastewater discharge. The nitrate concentration found by previous studies for the south of the basin was on average 202 mg/L, with a maximum of 1100 mg/L; meanwhile, chloride reached on average 249 mg/L for the same area, with a maximum of 543 mg/L [49,50]. These values are above the natural concentrations estimated in this study (Section 2.2.2).
The research was conducted at two olive mills in Antinaco Los Colorados Basin, province of La Rioja, Argentina (Figure 1) during 2019. At the initial stage, the managers were interviewed, which resulted in the collection of data related to a variety of aspects including process stages, equipment and its management, inputs and outputs, wastewater treatment, and disposal methods. A flow chart illustrating the processes was created using Microsoft Visio® v16.0.
Olive mill 1 (OM 1) has the capacity to process 500 tons of olives per day, which far exceeds olive mill 2 (OM 2), which processes approximately 12 tons per day. The production processes in the two industrial plants differ in the brand and model of the equipment used, while both apply the two-phase extraction system. The plants consist of three sectors: the yard where the fruit is received and cleaned, the extraction area where the oil is obtained, and the cellar where it is stored (Figure 2).
The dirty olives are weighted upon arrival from the yard to the industrial plant and then deposited in hoppers to be sent by conveyor belt to the cleaning compact. Once there, air and water flows are applied in order to extract clean fruit and discard solid waste (branches, leaves, stones), semi-solids (mud), and liquids (washing water). Then, the cleaned olive fruit reaches metallic hammer crushers called mills, which tear and break the pulp and skin of the fruit during the olive crushing process.
In the extraction area, malaxation is conducted by using a kneading process that consists of three compartments with hot water circulation (30–34 °C), aimed at raising the temperature to release oil droplets and induce coalescence. The kneading process lasts between 25 and 30 min. Talcum is added at this stage to promote coalescence. The mixture then undergoes horizontal centrifugation to separate the oil from the rest of the components. Usually, between 100 and 600 L of water are added per batch and the speed is adjusted to improve extraction. The OP generated during this process must contain no more than 4% fat to prevent oil loss in the waste. Subsequently, the oil passes through an inspection sieve, where the oil arrives with portions of water and solids. Solid impurities are removed through vibration and are recirculated back to the malaxation stage for reprocessing. The final processing stage is carried out in the vertical centrifuge, where the oil is separated from the remaining vegetable water, resulting in the production of OMWW. The oil is then poured into temporary tanks to be later pumped to the storage while the OMWW is discarded. Both industries have a main processing line, where the input is the olives, and an additional processing line that uses the OP removed from the main line as input to obtain additional oil of lower quality. The oil is stored in aluminum and fiberglass tanks, which protect the oil from light and air, at a constant temperature between 15° and 18°.

1.3. Waste and Wastewater Treatment in the Olive Mill

Table 1 provides an overview of the waste and wastewater management practices implemented by each agro-industry.
The olive mills use a similar extraction system but differ in wastewater management practices. Both agro-industries utilize olive pomace to stone production, which serves as fuel for the boiler and factory supply. The main difference is that OM 1 applies a physical treatment to the OMWW involving a degreasing chamber where fat is removed to a primary settling tank and suspended solids are decanted. After physical treatment, the OMWW is pumped into a waterproof evaporation pond with high-density polyethylene. In contrast, OM 2 disposes of the olive pomace and the OMWW into a concrete pond and then deposits in the field (Table 1). Notably, the evaporation ponds lack adequate safety measures to prevent OMWW spills or infiltrations. Moreover, the presence of fats and oils in the ponds hinders the evaporation process. Over time, this condition prompts the construction of additional ponds as existing ones reach capacity, which results in the accumulation of pollutants, all of which lead to the discharge of a mixture of solids, sludge, and effluents into the field. In some cases, clogging of the ponds causes overflows and an uneven distribution on the soil. Numerous studies have highlighted the risks associated with evaporation ponds such as groundwater contamination, emphasizing that they do not provide a viable solution to the problem of OMWW [35,51,52,53,54].

2. Materials and Methods

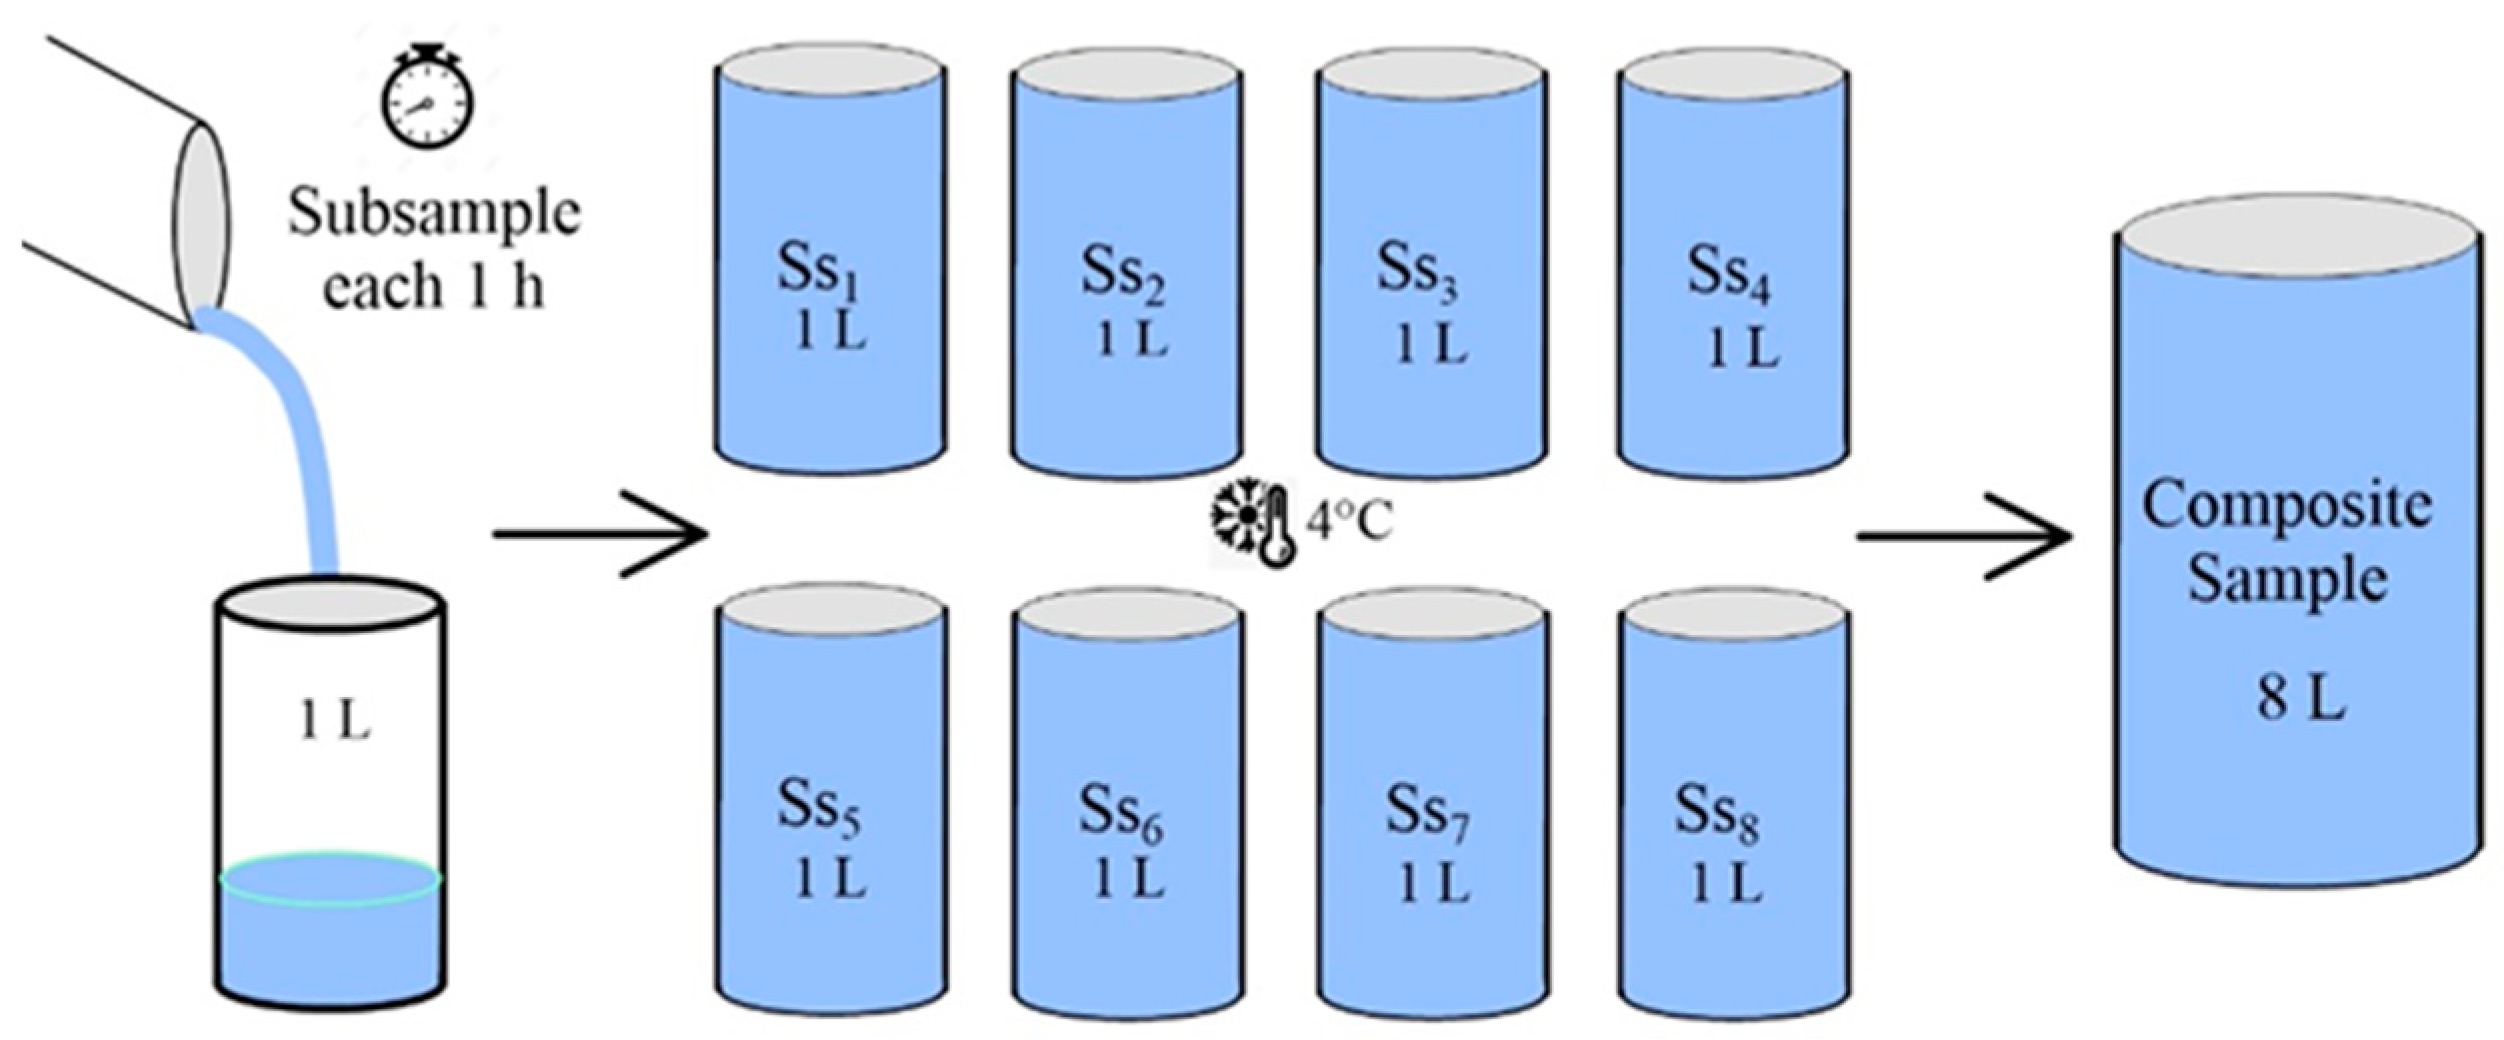
2.1. Physico-Chemical Characterization and Gauging of Olive Mill Wastewater

For the physico-chemical characterization of the OMWW, a subsample of 1 L of effluent was collected every hour during the 8-h production process in a PVC container. Parameters such as pH, temperature, and electrical conductivity were measured in the subsample, which was immediately refrigerated at 4 °C. Eight subsamples were taken in each olive mill. Thus, a composite sample was formed and the field parameters were measured again. One liter of composite sample was stored in a portable refrigerator and transferred to the laboratory for its physico-chemical characterization. Various parameters including total nitrogen [55], Chemical Oxygen Demand (COD) [56], Biological Oxygen Demand (BOD5), and chloride [57] were determined (Figure 3). A total of 16 composite samples (eights per olive mill) were collected at different times during the 2019 season. The OMWW flow rate was measured using a volumetric method every hour during the 8-h productive periods. The daily and season averages were calculated. As in the sampling for the physico-chemical characterization, the measurement was carried out every hour in order to obtain a representative average considering the maximum and minimum fluctuations in the productive process. The olive oil production season lasts 90 days. In that period, the sampling and measurements were performed with a 10-day frequency.

2.2. Grey Water Footprint Estimation

The method proposed by Hoekstra et al. [7] was used to calculate the operational grey water footprint (Equation (1)) for the olive oil production process. Groundwater was considered as the receiving water body of the OMWW since it is disposed of in dry river beds consisting of sand, gravel, and boulders, potentially allowing for pollution loads of conservative elements to reach the aquifer system.
This study does not address pollution of surface water bodies due to the arid condition of the region. Pollution of groundwater is the main water pollution process in the region. Previous research warns of salinization processes in groundwater associated with wastewater from agro-industries in the province [47,49,50]. The risk of groundwater pollution by OMWW has been raised by several studies [34,35,36,37,38,39,40,41,42].
The grey water footprint was determined separately for two pollutants, which can be useful for formulating response measures referring to specific contaminants and identifying the most critical contaminant for the case study [7]. Only conservative chemical elements were considered because of the thickness of the unsaturated zone in the study area (≈50–100 m). Grey WF was determined taking into account:
(a)
The grey WF for nitrogen as nitrate (NO3). In the nitrification processes, the generation of these oxidized forms of nitrogen is expected, which are mobilized by advective flow and percolate until they reach the groundwater resource [58]. The total value of nitrogen was taken as nitrate without considering transformation and retention values, and assuming that 100% of the nitrogen is transformed to nitrate.
(b)
The grey WF for chloride (Cl) was calculated because of its importance as a conservative element [59].
The grey WF was calculated by dividing the pollutant load (PL, in mass/time) by the difference between the ambient water quality standard for that pollutant (the maximum acceptable concentration Cmax, in mass/volume) and its natural concentration in the receiving water body (Cnat, in mass/volume) [7]:
W F   p r o c , g r e y = P L α         C m a x C n a t
The PL (kg/season) was calculated by multiplying the average effluent flow per season (Q, m3/season) by the mean concentration of the pollutant in the OMWW (mg/L). Because there are no leaching factors determined for this region, a leaching factor (α) of 10% was applied [60] considering that a certain fraction of the chemical substances in the OMWW ultimately reaches the groundwater. Using a leaching factor equal to 10% may lead to an underestimation of the grey water footprint considering that this value depends on the characteristics of the soil. Soils with a coarse texture such as sands allow for nitrate to leach into groundwater faster than soils with a fine texture [61]. Further studies investigating the leaching process in the study area are needed to provide local data for water resources pollution.

2.2.1. Maximum Concentration Allowed

Cmax was derived from the limits set for drinking water and human consumption as stipulated in the Argentine Food Code [62], prioritizing the precautionary principle and safety of the water resource. The recommended values are 350 mg Cl/L and 45 mg NO3/L. There are no specific regulations for groundwater quality in terms of environmental standards and protection.

2.2.2. Natural Concentration

As regards the Cnat, the values of nitrate and chloride in groundwater for Antinaco Los Colorados Basin [63] and recent values for the upper zone of the basin without anthropic disturbances were considered [50]. We used the median as a representative parameter of the baseline component, along with the 2.3 and 97.7% percentiles to show its range of variation [64]. The background values for NO3 were obtained from 179 wells with a median of 5.6 mg NO3/L, and extreme values of 0.2 mg NO3/L and 24 mg NO3/L. The Cnat values of chloride corresponded to 237 wells, with a median value of 42 mg Cl/L, and 18 mg Cl/L and 123 mg Cl/L as extreme values.

2.3. International Trade and Grey Virtual Water

In order to calculate the volume of contaminated water exported by the province of La Rioja, several steps were taken: (1) The grey WF values were determined for the analyzed olive mills and also for the provincial production average. (2) The average grey WF of both OMs was estimated. (3) This average grey WF was multiplied by the average oil exports for 2019 and 2020 from the province of La Rioja [46]. An average between 2019 and 2020 was considered because the oil is not sold in the same year of production. An oil density of 0.916 kg/L was used to convert from m3/L to m3/t.

3. Results

3.1. Physico-Chemical Characterization of the Olive Mill Wastewater

Table 2 shows the average, maximum, and minimum values for the 16 composite samples collected in the OMs. In the case of La Rioja province, there are only general regulatory limits for wastewater which are not classified by industries. They are shown in Table 2.
Although both industrial plants used the same extraction system, OMWW showed heterogeneous physico-chemical characteristics, as evidenced by the wide range between the maximum and minimum values. Most parameters showed higher concentrations in OM 1 compared to OM 2. For instance, the BOD5/COD ratio indicated recalcitrant wastewater in OM 1 and wastewater with biodegradation potential in OM 2, as values above 0.4 correspond to effluents with good biodegradability [65]. In addition, the pH of OM 1 was more acidic than that of OM 2, and the EC concentration was higher in OM 1 than in OM 2. These differences were attributed to the sampling point; in OM 1 the pumped OMWW was more concentrated because of previous physical treatment, whereas in OM 2 OMWW was sampled immediately upon leaving the factory before disposal in the concrete pond. The parameters of both olive mills exceeded local regulatory limits (Table 2), which shows a need for treatment before their final disposal. Table 3 presents concentrations, flow rates, and pollutant loads (PL) for both OMs.
The OMWW flows in the olive processing industries varied throughout the year because of the seasonal nature of the crop and the intra-industry variability in operations. OM 1 exhibited higher daily and seasonal OMWW compared to OM 2, which is attributable to differences in productive capacity and management practices. Notably, chloride PL differed significantly between the two plants, with OM 1 showing the highest concentration and PL. While the NO3 concentration for OM 1 was lower than that of OM 2, their PL values were similar. This concentration underscores the importance of considering the PL concept in wastewater diagnosis, as it serves as a link between quality and quantity values. As a result, more comprehensive diagnoses can be achieved for each industrial plant.

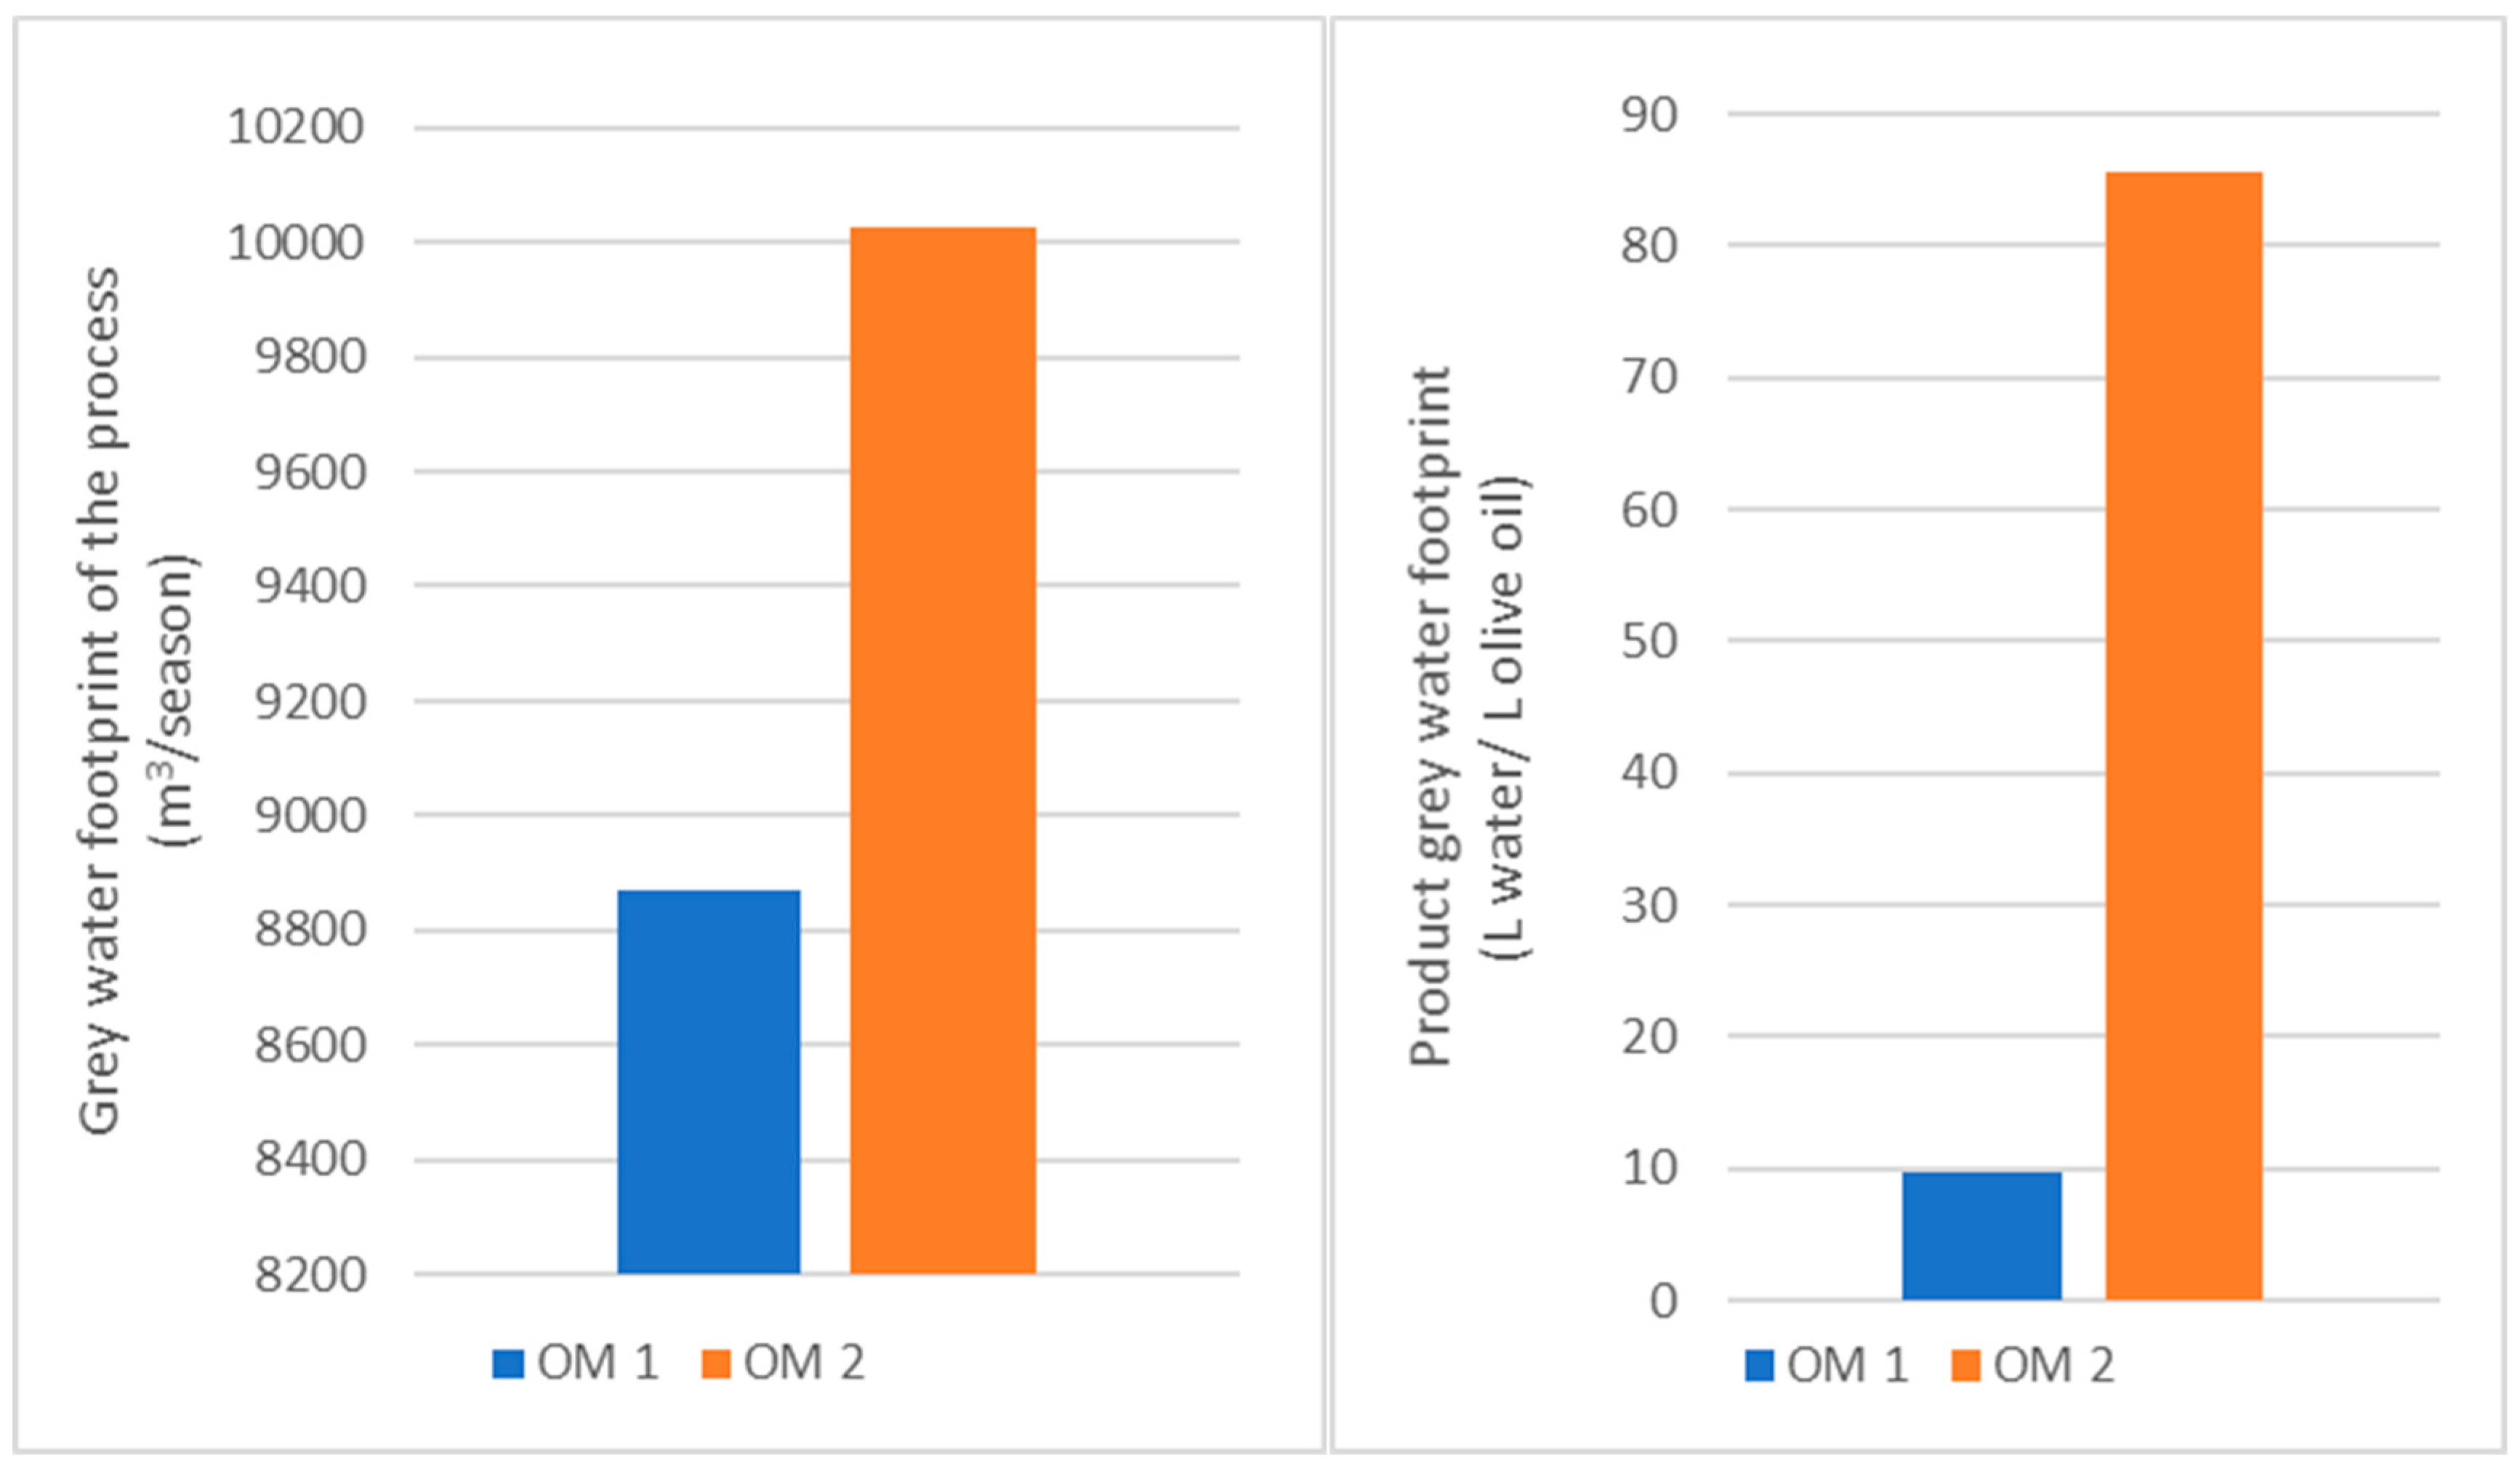
3.2. Grey Water Footprint of the Olive Oil Production Process

Table 4 shows the grey WF for nitrate and chloride in the OMs. OM 2 exhibited a higher grey WF for NO3 compared to OM 1, with a volume nearly 10 times that of its effluent, while the grey WF for OM 1 was approximately eight times greater than the volume generated. In the case of Cl, OM 1 presented a higher grey WF than OM 2.
Table 5 presents the grey WF associated with the production of each OM and the volumes of OMWW. OM1 produced 1,020,000 L of oil, while OM2 produced 220,000 L of oil in 2019.
OM 1 showed a higher PL and a greater grey WF than OM 2 in terms of Cl. When olive oil production is considered, however OM 1 exhibited a lower grey WF per unit than OM 2 for Cl, even though the volume of OMWW per unit of product was also lower. While OM 1 generated approximately one liter of OMWW per liter of oil, OM 2 generated 4.3 L of OMWW per liter of oil. The PL between the two OMs was not significantly different in relation to NO3. However, the grey WF related to NO3− by product was higher for OM 2 than for OM 1.
The grey WFs per season were higher for NO3 than for Cl in both industries. When expressing the grey WF in the olive oil industry, considering the grey WF for nitrate is convenient since the grey WF is determined by the pollutant that generates the largest footprint [7]. The grey WF of NO3 for both agro-industries resulted in approximately eight to 10 times greater than the volume of wastewater.

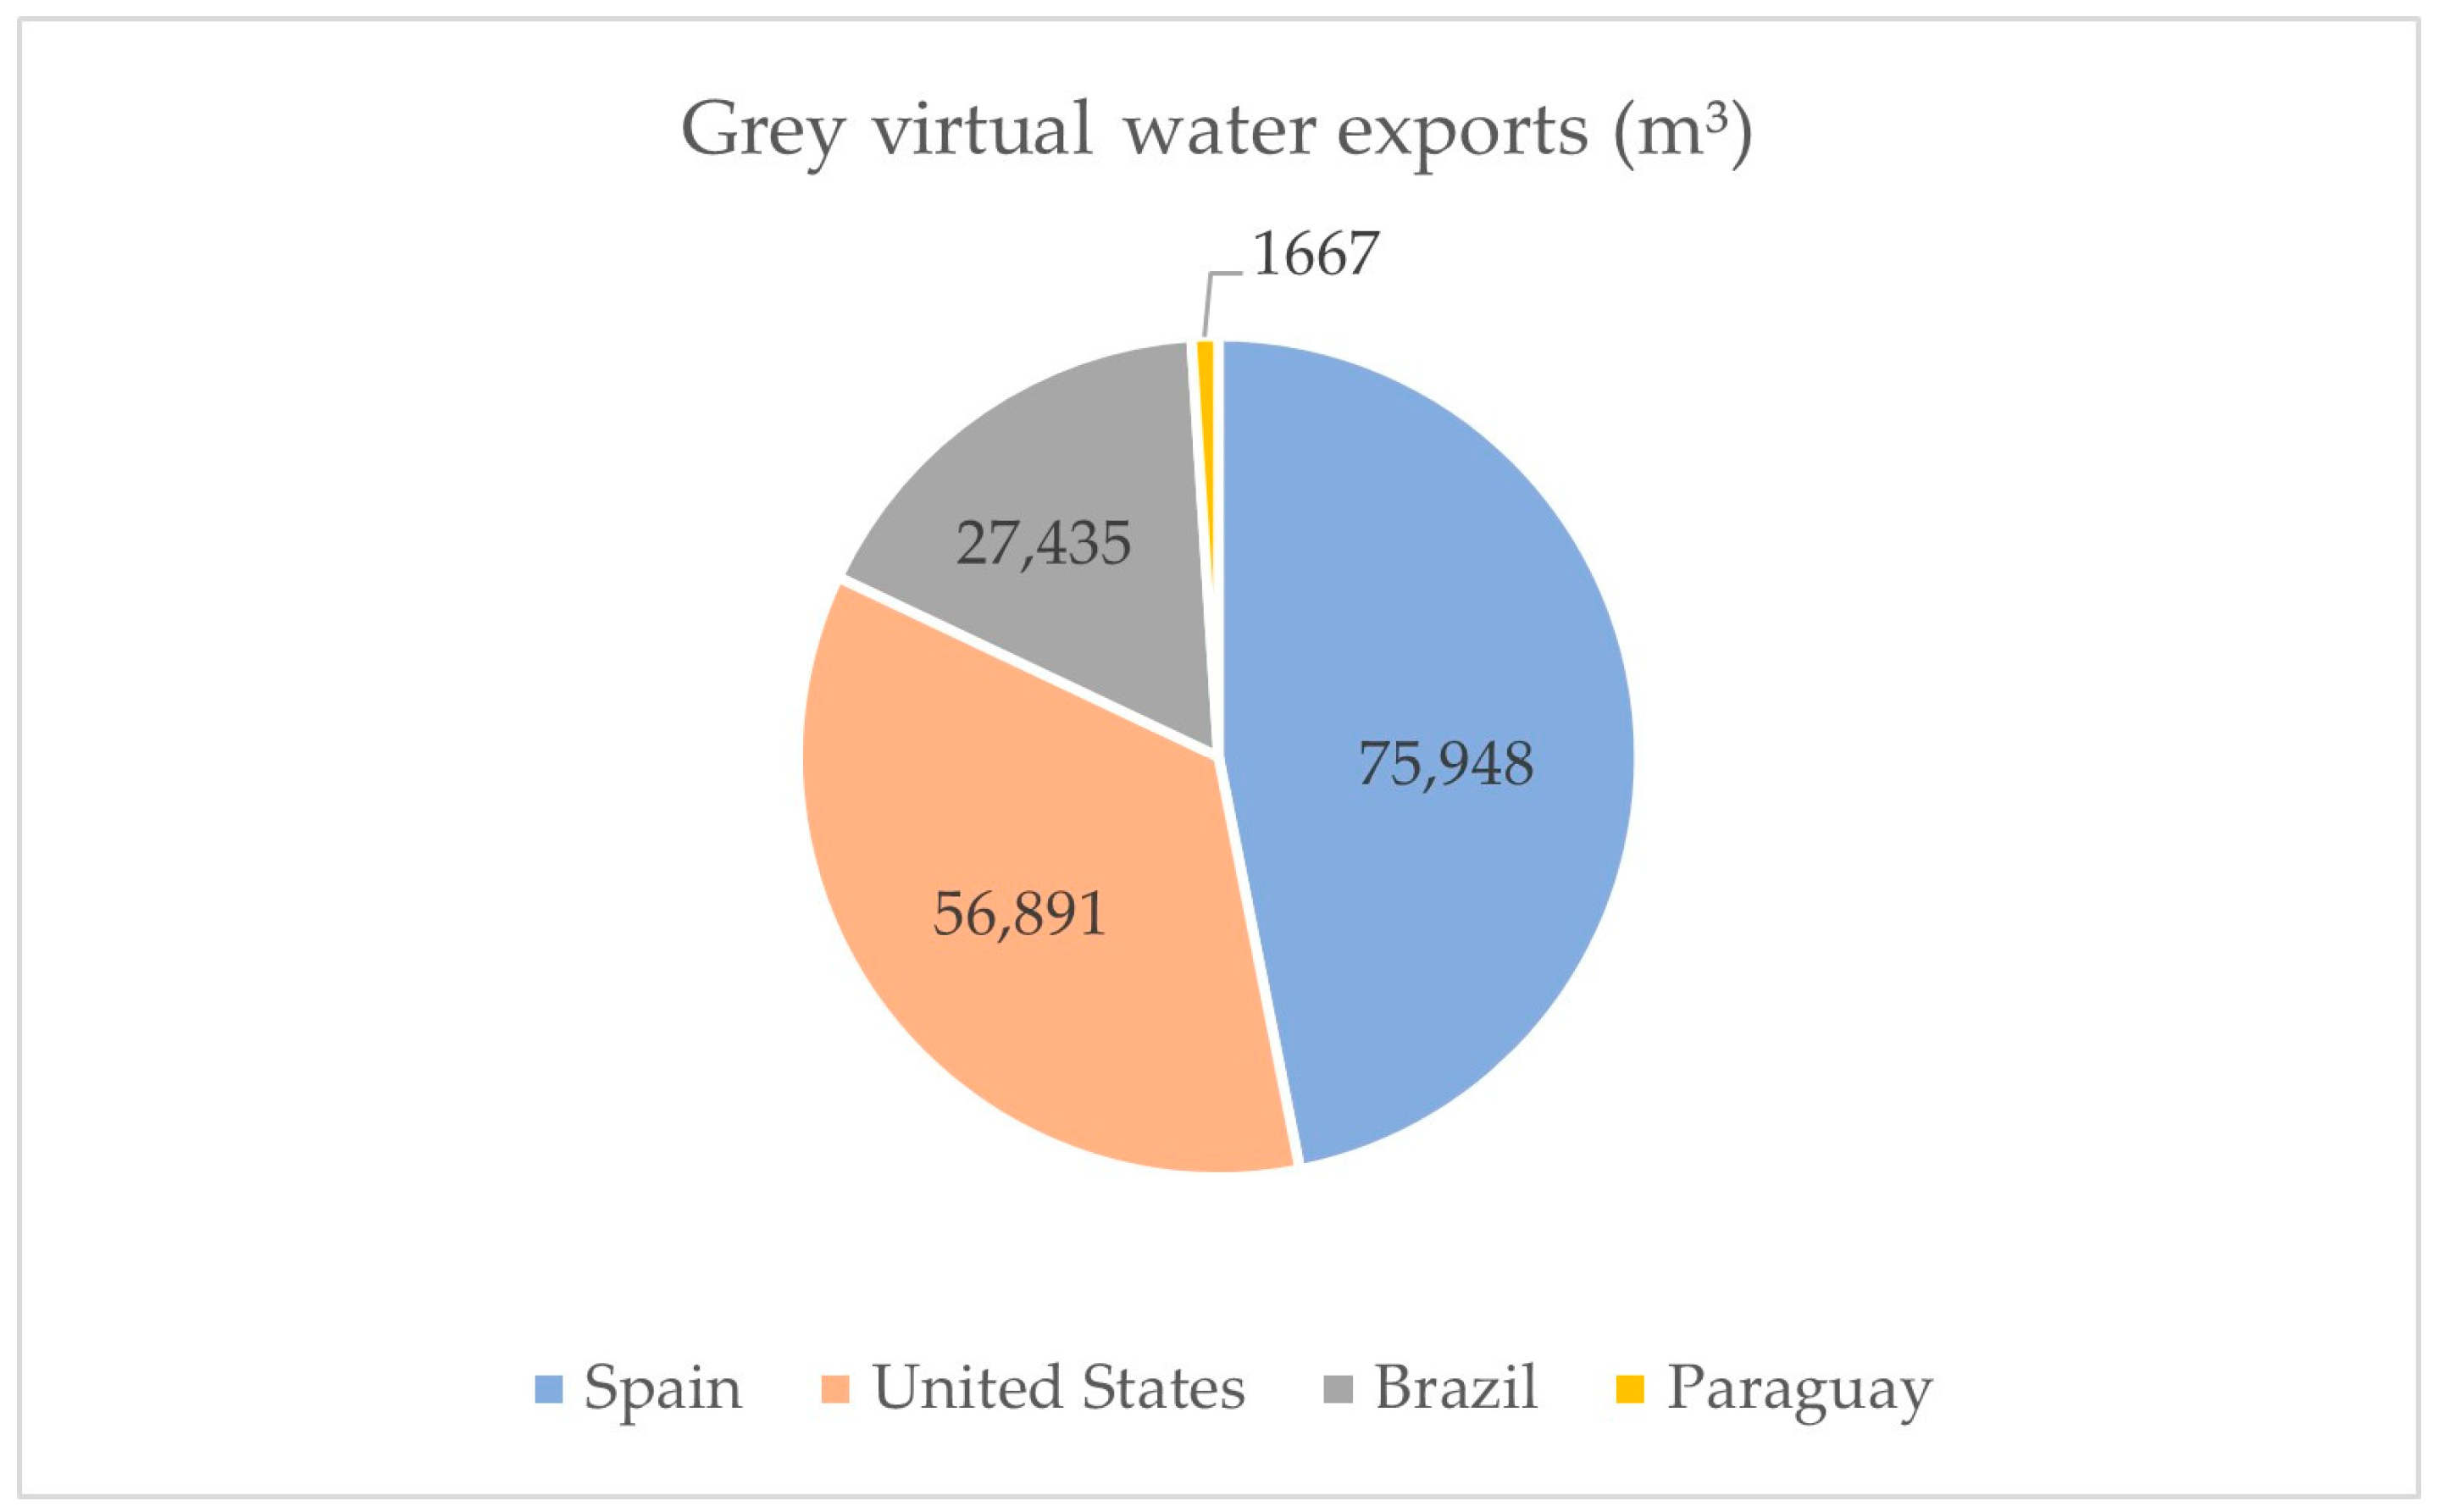
3.3. Grey Water Footprint and International Trade

Table 6 shows the exports of olive oil (tons), the operational grey WF of olive oil (m3/t), and the grey virtual water exports (m3) for the province of La Rioja and for each OM for the years 2019 and 2020. The manager interviewed confirmed that during the pandemic period they produced and exported the same as in other years.
There was no significant difference between the tons exported by the industries; however, OM 2 exhibited greater grey virtual water exports for nitrate than OM 1. The volume of grey virtual water exports far exceeded the trade volumes of oil and the generated volumes of OMWW in each OM. Figure 4 illustrates the main destinations of provincial olive oil production and the grey virtual water exported for each of them.
The grey virtual water exports from La Rioja related to the olive oil production process amounted to 161,955 m3, with Spain being the main destination. This result does not include the grey WF of olive tree cultivation estimated on 217 m3/t [20], in which case the grey virtual water would reach 1,191,330 m3.

4. Discussion

The wastewater produced in the olive oil industry varied both in quantity and quality. The OMWW exhibited acidic pH levels, high organic loads, and nitrogen concentrations, which shows a need for treatments prior to final disposal [36,37,38,39]. The characteristics of OMWW varied between industries, with OM 1 showing higher pollutant concentrations than OM 2, which indicates that primary treatments alone were insufficient. Moreover, it should be noted that evaporation ponds, although commonly used, offer just a partial solution to the problem as they favor the concentration of pollutants [34,35,36].
To obtain representative information about the production process, a detailed methodology is required that considers the variability of the OMWW. Previous studies [34,38,66,67] often focused on treatment proposals where only specific OMWW samples were analyzed. Consequently, the OMWW data represented just a fraction of the total volume, as a picture of a moment, but did not capture the process variability showed in this work. According to an interview with the head of OM 1, approximately 6.5 kg of olives are processed to obtain one liter of oil. Therefore, the value of 0.25 L of OMWW per kilo of processed olives equals 1.62 L of OMWW per liter of oil for OM 1 [33]. The results of this work showed that OM 1 was below this expected value, with 1.1 L of OMWW per liter of oil, while OM 2 exceeded it, with 4.29 L of OMWW per liter of oil.
The concentration values, PL, Q, and grey WF per season for Cl were higher for OM 1 than for OM 2 (Table 3 and Table 4). However, when considering these values in relation to the volumes of oil production, it becomes apparent that OM 2 exceeded OM 1 in terms of the grey WF generated per unit of production for Cl. The grey WF for NO3 was similar in both OMs. However, when examining the values per production unit, it became evident that OM 2 generated twice the amount of OMWW per production unit and a greater grey WF per product than OM 1 (Figure 5).
To ensure a comprehensive assessment of wastewater generation, the sampling methodology should account for the seasonality of the olive crop and the different production stages. Additionally, the use of indicators that synthesize and integrate information is crucial since relying solely on concentration analyses provide partial information about wastewater generation. Therefore, it is essential to include other variables such as OMWW flows and production volumes from each industrial plant. In this regard, the grey WF constitutes an indicator of environmental quality compared to discharge regulations that solely consider concentrations, disregarding the particularities of industries and the surrounding physical environment.
The grey WF indicator revealed that OM 1 is a more efficient plant because its grey WF per unit of product is lower than that of OM 2. It showed that OM 2 has low efficiency in terms of OMWW generation per unit of product and potentially greater environmental impacts on water resources.
Applying the WF indicator to both parameters led to the conclusion that methods or assessments are needed that incorporate a broader range of information about effluent generation and management for comprehensive environmental diagnoses. Industrial processes contribute to water pollution [30]. The operational grey WF has not been included in most studies and it has been considered equal to zero [27,29]. However, it is an important contribution, in some cases being similar to the grey WF of the crop.
The final aim of this research is to try to improve wastewater management in the olive oil sector, which is an issue not only in Argentina but also in other regions, such as Southern Europe [68].
In order to achieve a reduction in the grey WF it is necessary to work on intra-industry water management. The OMs analyzed exported similar volumes of olive oil. However, grey virtual water trade was five times higher for the OM with the highest product WF (OM 2). In this sense, recommendations for environmental policy and strategies for water and wastewater management in the industries are mentioned: (a) Carry out intra-industry operation to promote correct water management and the minimization of wastewater volumes. For example: prioritize mechanical cleaning instead of manual cleaning, separate solid and liquid wastes, avoid dispensing unused water, use efficient of water, and implement pressure technologies [7]. (b) Apply end-of-pipe measures or innovative solutions such as treating wastewater [69,70,71,72], and reusing and revalorizing the related byproducts, for agricultural purposes, the food industry [68], or the pharmaceutical industry [73]. (c) Evaporation ponds must be conditioned as a safety landfill, with the purposes of controlling possible losses and avoiding groundwater pollution [31]. (d) Improvement of the legislation about wastewater, in order to replace and complement the regulatory limits [31].
Legal frameworks for water resource management vary widely across Argentina. Some provinces have well-developed legislations while others neither regulate important aspects such as irrigation systems, user organizations, and water rights, nor enforce the polluter-pays or user-pays principles. Seven provinces still do not have legal provisions for conjunctive management of surface and groundwater resources [74]. Regarding the results of this study, it is worth developing studies about water allocation for olive industry in La Rioja province. The volume of grey virtual water traded from the province is incongruous with the scarcity conditions and water resource management problems through the provincial territory [46]. In this way, the province exports a significant volume of virtual water, whereas the importing countries do not assume the environmental responsibility for the associated impacts [75].
The present study, for the first time, provides data on the grey virtual water flows related to olive oil exports from Argentina. This information can be useful to raise awareness of the interlinkages between olive oil exports and groundwater pollution in certain areas of Argentina, such as La Rioja. Trade enables countries to outsource their production by importing products, but product transparency and traceability are key to avoiding unintended consequences [76,77].
Argentina is one of the main virtual water exporters related to crops, but it has one of the lowest external WF. Considering international trade, more than half of the provincial olive oil production is exported, which generates a negative externality due to water resource pollution locally. This externality adds to those generated in the primary production of olive groves, as well as to the green and blue WF of olive oil, which were not considered in this study. The different approaches used to estimate the grey WF depend on the data used for grey WF calculation. Therefore, through the use of global grey WF values in the analysis of international water trade from La Rioja, the results would not agree with the current situation of each industrial plant and territory. Finally, the substantial difference in grey WF between industries within the same basin is worth highlighting, as it emphasizes the need to study the grey WF in other facilities and olive oil-producing basins within the province of La Rioja and other regions of the country and beyond. This approach will facilitate the creation of industry-specific solutions customized for each industry and region.

5. Conclusions

The flows and physico-chemical characteristics of the OMWW from the analyzed agro-industries exhibited high heterogeneity, influenced not only by the seasonality of the crops and the stages of production, but also by intra- and extra-industry management practices. The treatment of OMWW varied between the two industrial plants, being partial in one and non-existent in the other. Wastewater analysis must consider physico-chemical parameters, concentrations, and flow rates to achieve contaminant load values that provide additional information about the production process. Additionally, it is necessary to intensify the analysis of indicators that relate pollutant loads with the volumes of the final product. In this regard, the grey WF would allow for a synthesis of the information generated during the diagnosis of effluent generation, including characteristics, flows, pollutant loads, and production volumes.
Nitrate was identified as the critical parameter for evaluating the grey WF. The findings of this research revealed that the operational grey WF was approximately eight to 10 times higher than the volume of effluent generated by each agro-industry. This is important compared to other studies that considered the grey WF equal to zero as they assumed that all wastewater was treated. In fact, the evaluation of exported volumes of grey virtual water is possible by assessing local grey WF data alongside provincial and international trade data.
This work represents one of the first studies that assesses the grey WF associated with OMWW. It constitutes an important input in the advance towards the sustainability of the olive oil sector. The results constitute relevant inputs to further adequate wastewater management in these industries, and also facilitate the search for solutions to minimize negative environmental impacts and promote cleaner production through comprehensive environmental management systems.

Author Contributions

Conceptualization, E.V., R.E.M. and C.I.R.; methodology, all authors; data analysis, E.V., R.E.M. and C.I.R.; investigation, all authors; writing—original draft preparation, E.V. and R.E.M.; writing—review and editing, C.I.R. and M.M.A.; supervision, M.M.A. and C.I.R.; and funding acquisition, E.V. and R.E.M. All authors have read and agreed to the published version of the manuscript.

Funding

This research was funded by Instituto Nacional de Tecnología Agropecuaria (INTA) through “Proyecto macro regional I055: Abordaje para la prevención y mitigación de la degradación ambiental y la pérdida de biodiversidad en la Región NOA”, “Proyecto macro regional I054: Aporte al estudio y gestión del recurso hídrico en áreas rurales y periurbanas del Noroeste Argentino”, and “Plataforma temática I163 Huellas Ambientales y Análisis de Ciclo de Vida”. In addition, this research was supported by technical connection agreements N° 25411 y 25412 between INTA and agro-industries from Antinaco Los Colorados Basin and Central Valley.

Data Availability Statement

Data are contained within the article.

Acknowledgments

The technical cooperation with the olive mills is appreciated. Authors thank Analia Gandur for her valuable contribution in the language revision.

Conflicts of Interest

The authors declare no conflicts of interest. The funders had no role in the design of the study; in the collection, analyses, or interpretation of data; in the writing of the manuscript; or in the decision to publish the results.

References

  1. Chen, W.; Kang, J.N.; Han, M.S. Global environmental inequality: Evidence from embodied land and virtual water trade. Sci. Total Environ. 2021, 783, 146992. [Google Scholar] [CrossRef]
  2. Wang, J.; Lin, J.; Feng, K.; Liu, P.; Du, M.; Ni, R.; Chen, L.; Kong, H.; Weng, H.; Liu, M.; et al. Environmental taxation and regional inequality in China. Sci. Bull. 2019, 64, 1691–1699. [Google Scholar] [CrossRef]
  3. Yu, Y.; Feng, K.; Hubacek, K. Tele-connecting local consumption to global land use. Glob. Environ. Chang. 2013, 23, 1178–1186. [Google Scholar] [CrossRef]
  4. Yu, Y.; Feng, K.; Hubacek, K. China’s unequal ecological exchange. Ecol. Indic. 2014, 47, 156–163. [Google Scholar] [CrossRef]
  5. Sarkodie, S.A.; Strezov, V. Effect of foreign direct investments, economic development and energy consumption on greenhouse gas emissions in developing countries. Sci. Total Environ. 2019, 646, 862–871. [Google Scholar] [CrossRef]
  6. Feng, H.; Yang, M.; Zeng, P.; Liu, Y.; Sun, F.; Wang, K.; Yang, K.; Che, Y. Transprovincial water quality impacts and the environmental inequity of grey water footprint transfer in China. Resour. Conserv. Recycl. 2022, 186, 106537. [Google Scholar] [CrossRef]
  7. Hoekstra, A.Y.; Chapagain, A.K.; Aldaya, M.M.; Mekonnen, M.M. The Water Footprint Assessment Manual: Setting the Global Standard; Earthscan: London, UK, 2011. [Google Scholar] [CrossRef]
  8. Johnson, M.B.; Mehrvar, M. An assessment of the grey water footprint of winery wastewater in the Niagara Region of Ontario, Canada. J. Clean. Prod. 2019, 214, 623–632. [Google Scholar] [CrossRef]
  9. Ma, X.; Yang, D.; Shen, X.; Zhai, Y.; Zhang, R.; Hong, J. How much water is required for coal power generation: An analysis of gray and blue water footprints. Sci. Total Environ. 2018, 636, 547–557. [Google Scholar] [CrossRef]
  10. Martínez-Alcalá, I.; Pellicer-Martínez, F.; Fernández-López, C. Pharmaceutical grey water footprint: Accounting, influence of wastewater treatment plants and implications of the reuse. Water Res. 2018, 135, 278–287. [Google Scholar] [CrossRef]
  11. Allocca, V.; Marzano, E.; Tramontano, M.; Celico, F. Environmental impact of cattle grazing on a karst aquifer in the southern Apennines (Italy): Quantification through the grey water footprint. Ecol. Indic. 2018, 93, 830–837. [Google Scholar] [CrossRef]
  12. Joy, M.K.; Rankin, D.A.; Wöhler, L.; Boyce, P.; Canning, A.; Foote, K.J.; McNie, P.M. The grey water footprint of milk due to nitrate leaching from dairy farms in Canterbury, New Zealand. Australas. J. Environ. Manag. 2022, 29, 177–199. [Google Scholar] [CrossRef]
  13. Hu, Y.; Huang, Y.; Tang, J.; Gao, B.; Yang, M.; Meng, F.; Cui, S. Evaluating agricultural grey water footprint with modeled nitrogen emission data. Resour. Conserv. Recycl. 2018, 138, 64–73. [Google Scholar] [CrossRef]
  14. Lovarelli, D.; Ingrao, C.; Fiala, M.; Bacenetti, J. Beyond the Water Footprint: A new framework proposal to assess freshwater environmental impact and consumption. J. Clean. Prod. 2018, 172, 4189–4199. [Google Scholar] [CrossRef]
  15. Muratoglu, A. Grey water footprint of agricultural production: An assessment based on nitrogen surplus and high-resolution leaching runoff fractions in Turkey. Sci. Total Environ. 2020, 742, 140553. [Google Scholar] [CrossRef]
  16. Vergé, X.; VanderZaag, A.; Smith, W.; Grant, B.; Gordon, R. The consideration of time step in calculating grey water footprints of agricultural cropping systems. Ecol. Indic. 2017, 78, 31–36. [Google Scholar] [CrossRef]
  17. Corredor, J.A.G.; González, G.L.V.; Granados, M.V.; Gutiérrez, L.; Pérez, E.H. Use of the gray water footprint as an indicator of contamination caused by artisanal mining in Colombia. Resour. Policy 2021, 73, 102197. [Google Scholar] [CrossRef]
  18. Tamea, S.; Laio, F.; Ridolfi, L. Global effects of local food-production crises: A virtual water perspective. Sci. Rep. 2016, 6, 18803. [Google Scholar] [CrossRef]
  19. Arrien, M.M.; Aldaya, M.M.; Rodríguez, C.I. Water footprint and virtual water trade of maize in the province of Buenos Aires, Argentina. Water 2021, 13, 1769. [Google Scholar] [CrossRef]
  20. Allan, T. Water: Tackling the Threat to Our Planet’s Most Precious Resource; Tauris: London, UK, 2011. [Google Scholar]
  21. Hoekstra, A.Y.; Mekonnen, M.M. The water footprint of humanity. Proc. Natl. Acad. Sci. USA 2012, 109, 3232–3237. [Google Scholar] [CrossRef]
  22. Rossi, L.; Regni, L.; Rinaldi, S.; Sdringola, P.; Calisti, R.; Brunori, A.; Dini, F.; Proietti, P. Long-term water footprint assessment in a rainfed olive tree grove in the Umbria region, Italy. Agriculture 2019, 10, 8. [Google Scholar] [CrossRef]
  23. De Leo, F.; Miglietta, P.P. Water footprint and virtual water trade of olive oil. In Proceedings of the 18th IGWT Symposium of Technology and Innovation for a Sustainable Future: A Commodity Science Perspective, Roma, Italy, 24–28 September 2012; pp. 24–28. [Google Scholar] [CrossRef]
  24. Nogueira, A.M.; Paço, T.A.; Silvestre, J.C.; González, L.F.; Santos, F.L.; Pereira, L.S. Water Footprint of a Super-Intensive Olive Grove under Mediterranean Climate Using Ground-Based Evapotranspiration Measurements and Remote Sensing. EGU General Assembly. Vienna 2012. Available online: http://www.isa.utl.pt/files/pub/noticias/2012/nogueira_et_al_2012_poster_final_web.pdf (accessed on 25 August 2022).
  25. Dichio, B.; Palese, A.M.; Montanaro, G.; Xylogiannis, E.; Sofo, A. A preliminary assessment of Water Footprint components in a Mediterranean olive grove. Acta Hortic. 2014, 1038. [Google Scholar] [CrossRef]
  26. Pellegrini, G.; Ingrao, C.; Camposeo, S.; Tricase, C.; Conto, F.; Huisingh, D. Application of water footprint to olive growing systems in the Apulia region: A comparative assessment. J. Clean. Prod. 2016, 112, 2407–2418. [Google Scholar] [CrossRef]
  27. Salmoral, G.; Aldaya, M.M.; Chico, D.; Garrido, A.; Llamas, M.R. The water footprint of olive oil in Spain. In Papeles de agua virtual 2010, 7; Foundation Botin: Santander, Spain, 2010; Available online: https://ris.utwente.nl/ws/portalfiles/portal/13518159/Salmoral10water.pdf (accessed on 7 May 2024).
  28. Crovella, T.; Paiano, A.; Lagioia, G. A meso-level water use assessment in the Mediterranean agriculture. Multiple applications of water footprint for some traditional crops. J. Clean. Prod. 2022, 330, 129886. [Google Scholar] [CrossRef]
  29. Mekonnen, M.M.; Hoekstra, A.Y. The green, blue and grey water footprint of crops and derived crop products. Hydrol. Earth Syst. Sci. 2011, 15, 1577–1600. [Google Scholar] [CrossRef]
  30. Chapagain, A.K.; Hoekstra, A.Y. Globalization of Water: Sharing the Planet’s Freshwater Resources; Blackwell Publishing: Oxford, UK, 2008. [Google Scholar] [CrossRef]
  31. Vuksinic, E. Caracterización Química y Ambiental de Efluentes Agroindustriales y Análisis de sus Implicancias Sobre el Agua Subterránea del Valle Central Antinaco-Los Colorados. Ph.D. Thesis, Universidad Nacional de Lujan, Luján, Argentina, 2022. Available online: https://repositoriosdigitales.mincyt.gob.ar/vufind/Record/INTADig_8ce46f8378ef58f3d593100c7f141960 (accessed on 25 August 2022).
  32. Roig, A.; Cayuela, M.L.; Sánchez-Monedero, M.A. An overview on olive mill wastes and their valorisation methods. Waste Manag. 2006, 26, 960–969. [Google Scholar] [CrossRef]
  33. Borja, R.; Raposo, F.; Rincón, B. Treatment technologies of liquid and solid wastes from two-phase olive oil mills. Grasas Y Aceites 2006, 57, 32–46. [Google Scholar] [CrossRef]
  34. Birame, B.; María, S.D.J.; Antonio, S.H.J.; Mercedes, P.C.M.; Amalia, V.C.; José, V.S.F.; Domingo, O.C. Planta Industrial de Tratamiento de las Aguas de Lavado Provenientes de Almazaras. 2007. Available online: http://infoil.gr/it/digital-library/doc_download/OMW_5.pdf_%3B%20modification-date%3D_Fri%2C%2012%20Nov%202010%2010_28_33%20%2B0200_%3B%20size%3D66369%3B (accessed on 12 December 2022).
  35. Saez, J.A.; Perez-Murcia, M.D.; Vico, A.; Martinez-Gallardo, M.R.; Andreu-Rodriguez, F.J.; Lopez, M.J.; Bustamante, M.A.; Sánchez-Hernández, J.C.; Moreno, J.; Moral, R. Olive mill wastewater-evaporation ponds long term stored: Integrated assessment of in situ bioremediation strategies based on composting and vermicomposting. J. Hazard. Mater. 2021, 402, 123481. [Google Scholar] [CrossRef]
  36. Cabezas, J.E. La Aceituna de Mesa: Nociones Sobre sus Características, Elaboración y Cualidades. Diputación de Sevilla. 2011, 16, 105–117. Available online: https://www.encurtidosmonica.es/medios/libroaceitunademesa.pdf (accessed on 23 December 2022).
  37. Barbera, A.C.; Maucieri, C.; Cavallaro, V.; Ioppolo, A.; Spagna, G. Effects of spreading olive mill wastewater on soil properties and crops, a review. Agric. Water Manag. 2013, 119, 43–53. [Google Scholar] [CrossRef]
  38. Caputo, M.C.; De Girolamo, A.M.; Volpe, A. Soil amendment with olive mills wasted. Impact to groundwater. J. Environ. Manag. 2013, 131, 216–221. [Google Scholar] [CrossRef]
  39. Elabdouni, A.; Haboubi, K.; Merimi, I.; El Youbi, M.S.M. Olive mill wastewater (OMWW) production in the province of Al-Hoceima (Morocco) and their physico-chemical characterization by mill types. Mater. Today: Proc. 2020, 27, 3145–3150. [Google Scholar] [CrossRef]
  40. Sierra, J.; Martí, E.; Garau, M.A.; Cruañas, R. Effects of the agronomic use of olive oil mill wastewater: Field experiment. Sci. Total Environ. 2007, 378, 90–94. [Google Scholar] [CrossRef]
  41. El Hassani, F.Z.; El Karkouri, A.; Errachidi, F.; Merzouki, M.; Benlemlih, M. The impact of Olive Mill Wastewater spreading on soil and plant in arid and semi-arid areas. Environ. Nanotechnol. Monit. Manag. 2023, 20, 100798. [Google Scholar] [CrossRef]
  42. Khalil, J.; Habib, H.; Bouguerra, S.; Nogueira, V.; Rodríguez-Seijo, A. The impact of olive mill wastewater on soil properties, nutrient and heavy metal availability–A study case from Syrian vertisols. J. Environ. Manag. 2024, 351, 119861. [Google Scholar] [CrossRef]
  43. Pritsa, T.S.; Voyiatzis, D.G. Correlation of ovary and leaf spermidine and spermine content with the alternate bearing habit of olive. J. Plant Physiol. 2005, 162, 1284–1291. [Google Scholar] [CrossRef]
  44. National Agricultural Census-CNA. Economy Ministry. National Institute of Statistics and Census 2018 (INDEC). Available online: https://www.indec.gob.ar/ftp/cuadros/economia/cna2018_resultados_definitivos.pdf (accessed on 12 December 2022).
  45. Ministry of Finance. Presidency of the Nation. Productive Report Provincial, La Rioja. 2018. Available online: https://www.argentina.gob.ar/sites/default/files/informe_productivo_la-rioja.pdf (accessed on 15 May 2023).
  46. National Institute of Statistics and Censuses. INDEC. Georeferenced Query System OPEX. 2023. Available online: https://www.indec.gob.ar/indec/web/Nivel4-Tema-3-2-79 (accessed on 9 August 2023).
  47. Miguel, R.E.; Gareis, M.C. El nexo agua, energía y alimentos en un valle árido bajo explotación intensiva. Estud. Sociales. Rev. Aliment. Contemp. Desarro. Reg. 2023, 33, 25. [Google Scholar] [CrossRef]
  48. Foti, P.; Romeo, F.V.; Russo, N.; Pino, A.; Vaccalluzzo, A.; Caggia, C.; Randazzo, C.L. Olive mill wastewater as renewable raw materials to generate high added-value ingredients for agro-food industries. Appl. Sci. 2021, 11, 7511. [Google Scholar] [CrossRef]
  49. Miguel, R.E.; Tálamo, E.; Cristos, D.; González Ribot, J.V.; Chayle, L. Análisis y evolución del proceso de salinización del acuífero Antinaco-Los Colorados en las colonias Vichigasta y Cantinzaco, La Rioja, Argentina. In Proceedings of the IX Congreso Argentino de Hidrogeología, San Fernando del Valle de Catamarca, Argentina, 21 September 2016; Available online: https://www.cohife.org/advf/LARIOJA/E13.pdf (accessed on 13 May 2024).
  50. Miguel, R.E.; Gonzalez Ribot, J.V.; Canelo, H.N. Evolución hidrogeológica del Valle Central Antinaco-Los Colorados. Parte 4: Vichigasta y Catinzaco. In Proceedings of the XI Congreso Argentino de Hidrogeología, Bahía Blanca, Argentina, 25 October 2022. [Google Scholar]
  51. El-Abbassi, A.; Kiai, H.; Raiti, J.; Hafidi, A. Application of ultrafiltration for olive processing wastewaters treatment. J. Clean. Prod. 2014, 65, 432–438. [Google Scholar] [CrossRef]
  52. Kavvadias, V.; Doula, M.; Theocharopoulos, S. Long-term effects on soil of the disposal of olive mill waste waters (OMW). Environ. Forensics 2014, 15, 37–51. [Google Scholar] [CrossRef]
  53. Kavvadias, V.; Elaiopoulos, K.; Theocharopoulos, S.; Soupios, P. Fate of potential contaminants due to disposal of olive mill wastewaters in unprotected evaporation ponds. Bull. Environ. Contam. Toxicol. 2017, 98, 323–330. [Google Scholar] [CrossRef]
  54. Komnitsas, K.; Modis, K.; Doula, M.; Kavvadias, V.; Sideri, D.; Zaharaki, D. Geostatistical estimation of risk for soil and water in the vicinity of olive mill wastewater disposal sites. Desalination Water Treat. 2016, 57, 2982–2995. [Google Scholar] [CrossRef]
  55. Paez, V.; Barrett, W.B.; Deng, X.; Diaz-Amigo, C.; Fiedler, K.; Fuerer, C.; Hostetler, G.L.; Johnson, P.; Joseph, G.; Konings, E.J.M.; et al. AOAC SMPR® 2016. 002. J. AOAC Int. 2016, 99, 1122–1124. [Google Scholar] [CrossRef]
  56. USEPA. Guidelines for Water Reuse; U.S. Environmental Protection Agency: Washington, DC, USA, 2012. Available online: https://www.epa.gov/regulatory-information-topic/regulatory-and-guidance-information-topic-water (accessed on 8 July 2020).
  57. American Public Health Association. Standard Methods for the Examination of Water and Wastewater; American Public Health Association: Washington, DC, USA, 2012. [Google Scholar]
  58. Cisneros Basualdo, N.E.; Banda Noriega, R.B.; Migue, R.E.; Rodríguez, C.I.; Ruiz de Galarreta, A. Peligro de contaminación del agua subterránea por sistemas de lagunas para tratamiento de efluentes de tambos. Rev. De Geol. Apl. A La Ing. Y Al Ambiente 2023, 50. [Google Scholar] [CrossRef]
  59. Custodio, E.; Llamas, M.R. Hidrología Subterránea, 2nd ed.; Omega: Barcelona, Spain, 1983. [Google Scholar]
  60. Franke, N.A.; Boyacioglu, H.; Hoekstra, A.Y. Grey Water Footprint Accounting: Tier 1 Supporting Guidelines. In Value of Water Research Report Series Nº 65; UNESCO-IHE: Delft, The Netherlands, 2013; Available online: https://ris.utwente.nl/ws/portalfiles/portal/5141740/Report65-GreyWaterFootprint-Guidelines.pdf (accessed on 7 May 2024).
  61. Hallaq, A.H. The impact of soil texture on nitrates leaching into groundwater in the North Governorate, Gaza Strip. J. Soc. Sci. 2010, 38, 11. [Google Scholar]
  62. Argentine Food Code. Chapter XII: Water Drinks, Water and Aerated Water. Law 18.284, Argentina 2021. Available online: https://www.argentina.gob.ar/sites/default/files/capitulo_xii_aguas_actualiz_2024-04.pdf (accessed on 7 May 2024).
  63. Rocca, J.A.; Ortíz, A.; Zambrano, J.; Taballione, C.; Togores, E.; Robles, J.O.; Victora, J.A.; Pelegrino, J.; Salvioli, G.; Bosch, E.; et al. Investigación del Agua Subterránea en el Valle Antinaco-Los Colorados, Provincia de La Rioja; Publicación N° P-067. INA CRAS; Secretaría de Estado de Recursos Naturales y Ambiente Humano: La Rioja, Argentina, 1975; p. 350. [Google Scholar]
  64. Manzano, M.; Custodio, E.; Nieto, P. The natural background to the quality of groundwater: Implications for the implementation of the Framework Water Directive in Europe. Tecnol. Del Agua 2003, 241, 38–47. Available online: https://www.osti.gov/etdeweb/biblio/20412731 (accessed on 23 December 2022).
  65. Beily, M.E. Caracterización de Efluentes de Cerdos, con Énfasis en Biodegradabilidad Anaeróbica. Master’s Thesis, Buenos Aires Technological Institute, Buenos Aires, Argentina, 2015. Available online: https://repositorio.inta.gob.ar/handle/20.500.12123/2080 (accessed on 25 August 2021).
  66. Azzam, M.O.; Hazaimeh, S.A. Olive mill wastewater treatment and valorization by extraction/concentration of hydroxytyrosol and other natural phenols. Process Saf. Environ. Prot. 2021, 148, 495–523. [Google Scholar] [CrossRef]
  67. Dermeche, S.; Nadour, M.; Larroche, C.; Moulti-Mati, F.; Michaud, P. Olive mill wastes: Biochemical characterizations and valorization strategies. Process Biochem. 2013, 48, 1532–1552. [Google Scholar] [CrossRef]
  68. European Union. Olive Oil Wastewater Reuse for the Production and Commercialisation of Spirulina Alga. 2016. Available online: https://cordis.europa.eu/project/id/711725 (accessed on 22 May 2024).
  69. Khdair, A.; Abu-Rumman, G. Sustainable environmental management and valorization options for olive mill byproducts in the Middle East and North Africa (MENA) region. Processes 2020, 8, 671. [Google Scholar] [CrossRef]
  70. Sánchez-Sánchez, C.; González-González, A.; Cuadros-Salcedo, F.; Cuadros-Blázquez, F. Two-phase Olive mill waste: A circular economy solution to an imminent problem in Southern Europe. J. Clean. Prod. 2020, 274, 122789. [Google Scholar] [CrossRef]
  71. Hassen, W.; Hassen, B.; Werhani, R.; Hidri, Y.; Jedidi, N.; Hassen, A. Processes of Valorization and Management of Olive By-Products: The Pomace and Olive Mill Wastewater. In Wastewater from Olive Oil Production: Environmental Impacts, Treatment and Valorisation; Souabi, S., Anouzla, A., Eds.; Springer: Cham, Germany, 2023; pp. 1–25. [Google Scholar] [CrossRef]
  72. Agabo-García, C.; Repetto, G.; Albqmi, M.; Hodaifa, G. Evaluation of the olive mill wastewater treatment based on advanced oxidation processes (AOPs), flocculation, and filtration. J. Environ. Chem. Eng. 2023, 11, 109789. [Google Scholar] [CrossRef]
  73. Vlyssides, A.G.; Loizides, M.; Karlis, P.K. Integrated strategic approach for reusing olive oil extraction by-products. J. Clean. Prod. 2004, 12, 603–611. [Google Scholar] [CrossRef]
  74. OECD. Water Governance in Argentina, OECD Studies on Water; OECD Publishing: Paris, France, 2019. [Google Scholar] [CrossRef]
  75. Cao, Y.; She, Y.; Wang, Q.; Lin, J.; Chen, W.; Qu, S.; Liu, Z. Redefining virtual water allocation in China based on economic welfare gains from environmental externalities. J. Clean. Prod. 2024, 434, 140243. [Google Scholar] [CrossRef]
  76. Hoekstra, A.Y. The Relation between International Trade and Freshwater Scarcity; WTO Working Paper Series, No. 5. World Trade Organization: Geneva, Switzerland, 2010; Available online: https://ris.utwente.nl/ws/portalfiles/portal/5147042/Hoekstra10relation.pdf (accessed on 20 May 2024).
  77. Ospital, P.; Masson, D.; Beler, C.; Legardeur, J. Toward product transparency: Communicating traceability information to consumers. Int. J. Fash. Des. Technol. Educ. 2023, 16, 186–197. [Google Scholar] [CrossRef]
Figure 1. Location of the study area. (a) Argentina and province of La Rioja. (b) La Rioja and Antinaco Los Colorados Basin. (c) Antinaco Los Colorados Basin and Central Valley.
Water 16 01612 g001
Figure 2. Flow chart of olive oil production, including inputs and outputs of the industrial system.
Water 16 01612 g002
Figure 3. Olive mill wastewater sampling scheme in each agro-industry.
Water 16 01612 g003
Figure 4. Volume and main destinations of the grey virtual water exports from the province of La Rioja, Argentina (m3).
Water 16 01612 g004
Figure 5. Grey WF related to NO3 per season and WF grey per unit for olive mills (OMs) 1 and 2.
Water 16 01612 g005
Table 1. Comparison of the final disposal of waste and wastewater between the two olive mills.
Waste and WastewaterFinal Disposal
Olive Mill 1Olive Mill 2
Leaves, branches, stones, mudTo the fieldTo the field
Washing waterOlive pomace hopperTo the field
Olive pomaceOlive pomace hopperOlive pomace hopper and then storage pool
Residual olive pomaceTo the fieldTo the field with wastewater
Olive mill wastewaterPrimary treatment—evaporation pondsStorage pool with olive pomace, then it is deposited to the field
Drainage and cleaning of storage tankPrimary treatment—evaporation pondsStorage pool with olive pomace, then it is deposited to the field
Table 2. Physico-chemical parameters of the olive mill wastewater for the two olive mills (OM).
Parameters (mg/L)OM 1OM 2Regulatory Limits *1
AverageMinMaxAverageMinMaxWastewater
Regulations
pH5.14.76.46.495.27.16.5–10
EC (µS/cm)21681680324017275308500NR
BOD54434120611,864292014045166<200
COD13,431288033,9006806429013,800<500
BOD5/COD0.330.140.670.430.320.53NR
Chloride41025547721896.5921NR
Nitrogen70614112229486701718<105
Notes: *1 Industrial effluent discharge parameters for absorbent soil. Decree 773/93. Annex 5. Provincial Law 4.741. NR: Not regulated.
Table 3. Average values of olive mill wastewater concentrations, flows, and pollution loads in the olive mills (OMs).
OM 1OM 2
Q (m3/season)1.120943
NO3 (mg/L)3.1214.190
Cl (mg/L)410218
PL NO3 (kg/season)3.4953.951
PL Cl (kg/season)459205
Table 4. Grey water footprint (WF) of the olive oil production process associated with the two pollutants analyzed: chloride (Cl) and nitrate (NO3).
G r e y   W F   B a s e d   o n   C h l o r i d e G r e y   W F   B a s e d   o n   N i t r a t e
OM 1 1,120,000   L     410   m g   C l / L     0.10 350   m g   C l / L     42   m g   C l / L = 149 m 3 s e a s o n 1,120,000   L     3121   m g   N O 3 / L     0.10 45   m g   N O 3 / L     5.6   m g   N O 3 / L = 8872 m 3 s e a s o n
OM 2 943,000   L     218   m g   C l / L     0.10 350   m g   C l / L     42   m g   C l / L = 67 m 3 s e a s o n 943,000   L     4190   m g   N O 3 / L     0.10 45   m g   N O 3 / L     5.6   m g   N O 3 / L = 10,028 m 3 s e a s o n
Table 5. Grey water footprint (WF) per unit for the olive oil production process associated with the two pollutants analyzed: chloride (Cl) and nitrate (NO3).
IndustriesProduction
(L oil)
Q/p
(L OMWW/
L oil)
Product Grey WF Related to Cl
(L water/L oil)
Product Grey WF Related to NO3
(L water/L oil)
OM 11,020,0001.100.148.69
OM 2220,0004.290.3045.5
Table 6. Olive oil exports, operational grey water footprint (WF), and grey virtual water exports related to NO3 for the province of La Rioja and for each olive mill (OM).
IndustriesOlive Oil Exports (tons)Product Grey WF Related to NO3
(m3 water/t oil)
Grey Virtual Water Exports (m3)
20192020Average 2019–2020
OM 1675500587.59.485569
OM 2877252564.549.628,000
Total for La Rioja66394341549029.5161,955
Disclaimer/Publisher’s Note: The statements, opinions and data contained in all publications are solely those of the individual author(s) and contributor(s) and not of MDPI and/or the editor(s). MDPI and/or the editor(s) disclaim responsibility for any injury to people or property resulting from any ideas, methods, instructions or products referred to in the content.

