Article

Modelling Trends in Urban Flood Resilience towards Improving the Adaptability of Cities

1
School of Management, Wuhan University of Science and Technology, Wuhan 430065, China
2
School of Information Engineering, Wuhan Huaxia Institute of Technology, Wuhan 430073, China
3
Enterprise and Business Innovation, De Montfort University, The Gateway, Leicester LE1 9BH, UK
*
Author to whom correspondence should be addressed.
Water 2024, 16(11), 1614; https://doi.org/10.3390/w16111614
Submission received: 27 April 2024 / Revised: 28 May 2024 / Accepted: 3 June 2024 / Published: 5 June 2024

Abstract

:
Urban flooding is one of the main challenges affecting sustainable urban development worldwide, threatening the safety and well-being of communities and citizens. The aim of this study is to assess the development and trends in urban flood resilience at the city scale, as well as to improve the resilience of cities to these risks over time. The study constructs a model for assessing urban flood resilience that incorporates economic, social, ecological, and managerial aspects and assesses them through a range of indicators identified in the literature. The comprehensive evaluation model of Network Analysis Method–Entropy Weight Method–The Distance between Excellent and Inferior Solutions (ANP-EWM-TOPSIS) was used to empirically investigate the flood resilience characteristics of Nanjing from 2010 to 2021. There are two main findings of the study: firstly, the flood resilience of Nanjing gradually improves over time, as the economic flood resilience steadily increases, while the social, ecological, and management flood resilience decreases; and secondly, during the study period, barriers caused by economic and regulatory factors in Nanjing decreased by 33.75% and 23.72%, respectively, while barriers caused by social and ecological factors increased by 32.69% and 24.68%, respectively. The novelty of this study is the introduction of a “barrier degree” model, which identifies and highlights barriers and obstacles to improving urban flood resilience and provides new insights into improving urban flood resilience at the city scale.

1. Introduction

With global warming and accelerated urbanization, urban flooding has become increasingly frequent worldwide, posing a huge threat to urban development [1,2]. During the period of 1989 to 2019, the data indicate there were approximately 320 major natural disasters in the world per year, of which floods were the most frequent, accounting for more than 60% [3]. As is common around the world, many cities in China are built near to rivers and lakes and are vulnerable to flooding [4]. According to the “China Flood and Drought Disaster Prevention Bulletin” of the Ministry of Water Resources, in 2020, hundreds of cities across the country were flooded, with a disaster-affected population of up to 78.615 million and a direct economic loss of $38.28 billion [5,6]. Being faced with such severe natural hazards raises the question of how to enhance a city’s ability to withstand the effects and reduce the losses and casualties caused by flooding. This represents an important issue facing current urban development in many parts of the world.
Flood risks in urban areas are increasing due to a combination of factors, including climate change, population growth, and rapid urbanization [7,8]. The primary consideration in responding to urban flooding is to identify the nature of the flood risk through complex and sophisticated modeling and assessment [9,10], which can be used by decision makers and stakeholders to develop policies aimed at preventing and mitigating flood hazards. Decision-making methods and machine-learning approaches are effective in characterizing urban floodplains [11]. Rafiei et al. used a combination of machine-learning and decision-making methods to assess the flood risk in Jiroft City, Iran [12]. The application of machine learning and GIS techniques can help to map flood risk [13]. Overall, existing research focuses on modeling flood scenarios [14], but simulations are scarce in considering the social or economic aspects of urban systems. In addition, it is far from sufficient to focus only on urban areas, and more research is needed to understand flooding across entire catchments. Adopting engineered flood defense strategies is also no longer the optimal solution for flood prevention and mitigation, and improving the ability of urban systems to become resilient to external disturbances on their own is becoming an important approach to mitigating the impacts of flooding.
Given the increased risk of flooding [15], current flood risk management thinking has shifted from resistance and control (i.e., fighting floods) to adapting to floods and improving resilience (living with floods) [7,8,16]. Although floods cannot be entirely controlled, urban resilience can be used to enable communities to adapt to changes in risk levels. The concept of resilience was first proposed by Holling, with an emphasis on withstanding shocks and disturbances and recovering from them [17]. Since then, resilience research has gradually been embraced by other fields and extended to socio-economic systems, providing new perspectives on the development of urban flood resilience [18,19]. In 2012, the UNISDR (United Nations International Strategy for Disaster Reduction) developed the “Making Cities Resilient” program, which emphasizes the development of resilient cities that can be adapted or retrofitted to withstand and absorb the impacts of hazards, shocks, and stresses, ensuring long-term sustainability and essential functions, features, and structures [20]. Urban flood resilience implies the development of urban systems that can adapt to and recover from floods, enabling urban systems to support recovery, thereby helping to restore normality and reduce losses [21,22]. This supports the development of cities that can coexist with flooding and can be designed to increase resilience [23,24].
In recent years, improving flood resilience has become an important part of the development of urban resilience [25]. In-depth analysis of the factors influencing urban flood resilience is of some significance for enhancing urban flood resilience and promoting sustainable urban development. At present, national and international scholars have undertaken research on urban flood resilience from different aspects [26]. These studies are a crucial part of urban development, but the field lacks a unified system and approach. In general, this body of research on urban flood resilience mainly focuses on the following three aspects:
(1) Exploring the concept and framework of urban flood control. Shi improved the regional disaster mechanism from three aspects: disaster environment, disaster-causing factors, and disaster-bearing bodies [27]. Then, Li and Xu studied the formation mechanism of urban flood disasters [28,29]. These research findings provide a useful reference for the prevention and control of flood disasters in urban areas, but lack due consideration of resilience theory. Cutter et al. provided a new framework, namely the disaster resilience of place model (DROP) [30], which provided a reference for future research. Bruneau et al. established the technology, organization, society, and economy (TOSE) resilience assessment framework [31]. Restemeyer et al. proposed a heuristic framework where resilience is measured by the corresponding three characteristics of robustness, adaptability, and convertibility [32]. Li et al. proposed a practical framework combining urban flood simulation and flood hazard assessment to assess the effective impacts due to flood protection measures [33]. Ruan et al. used the pressure–state–response model (PSR model) to establish a quantitative evaluation model of urban elasticity under rainstorm conditions [34]. Wu et al. developed a methodological framework for improving the flood resilience of urban flood control systems and produced a numerical model of urban flooding that simulates the hydrological processes of a city’s response to rainfall events [1].
(2) Quantitative assessment of urban flood resilience. In terms of flood resilience assessment, Chen and Leandro used modeling to assess the flood resilience of urban areas during flood occurrence and recovery [35]. Zhang et al. selected evaluation indicators from the four aspects of the economy, society, environment, and management and used the entropy weight TOPSIS method to evaluate the resilience of China‘s key flood control cities from 2016 to 2018 [36]. Qiao and Pei evaluated urban rainwater resilience based on a cloud model and the development of approximated ideal solutions three dimensions: resistance, recovery, and adaptation [37]. Tayyab et al. proposed the Urban Flood Resilience Model (UFResi-M) to evaluate the flood resilience of cities in different regions [38]. Orencio and Fujii analyzed the flood elasticity of 31 urban watersheds based on the grid unit index [39]. Li et al. identified the sensitivity of factors affecting flood resilience under heavy rainfall scenarios, and then used system dynamics to explore their intrinsic interaction mechanisms [14].
(3) Exploring future flood risk management enhancement strategies and planning practices. Liao developed a theory of “urban resilience to flooding”, which advocates adaptation and applies the theory to planning practice, providing a reference for urban flood disaster management [40]. Restemeyer et al. proposed a long-term adaptive water policy [8]. Dewulf et al. proposed adaptive management to enhance flood management [41]. In addition, studies in the Netherlands expanded flood risk management to include flood defense systems, spatial planning, and contingency planning [42], and the practice of progressive urban resilience was introduced to strengthen flood resilience for sustainable development [43].
In summary, research on urban flood resilience has evolved, becoming more focused and diversified, but shortcomings remain. To date, few studies have focused on building flood resilience in cities in developing countries. In terms of scale, the overall assessment is mainly based on provincial or watershed level studies, and there is a lack of in-depth studies on urban flood resilience. Therefore, this study takes Nanjing, a major city in China, as the research object and adopts a combination of subjective and objective evaluation methods to analyze the dynamic changes in urban flood resilience in Nanjing from 2010 to 2021. A barrier degree model is introduced to identify weaknesses and make suggestions for improvement. Combined with the dynamic changes in Nanjing’s urban flood resistance, the study analyzes the factors affecting flood resistance and proposes methods to improve the city’s flood resistance, providing a basis for urban planning and sustainable development.
The remaining of this article is organized as follows. The research model and the employed methods are introduced in the Section 2. Then, in Section 3, a description of the research field and the evaluation index system is constructed. The results of the empirical analysis are presented in Section 4, then the discussion and prospect of future research are presented in Section 5, before finally the conclusions are presented.

2. Research Framework and Methods

2.1. Research Method Selection

To identify the most appropriate research method, firstly the most commonly used indicator weighting methods were identified and divided into three main categories, namely subjective weighting, objective weighting, and combination weighting methods. Table 1 lists the main commonly used weighting methods including DARE (decision alternative ratio evaluation system), Delphi, FA (factor analysis), and PCA (principal component analysis). The combined empowerment method attempts to address the risk of bias in relying on the judgment of experts (decision-making group) in the subjective weighting method, and it is able to combine this information with statistical data. This is useful as the metrics of urban flood resilience contain both objective data (statistical and computational indicators) and subjective data (assessment indicators). Therefore, it is more appropriate to adopt the combination of subjective and objective data, i.e., the combination assignment method for weight calculation. The ANP (analytic network process) method is a decision-making method developed on the basis of AHP (analytic hierarchy process), which takes into account the interactions between factors or neighboring levels. In contrast, the AHP model only emphasizes the unidirectional hierarchical relationship between the decision-making levels, i.e., the influence of the next level on the upper level. Since there may be a dependent relationship between the indicators of urban flood resilience, the ANP method was chosen to calculate the weights in this research. The entropy weight method (EWM) is a more accurate and widely applicable objective assignment method. Therefore, the combination of ANP-EWM helps to improve the objectivity and accuracy of the metric results.
In addition, in order to measure the development of urban flood resilience over time, comprehensive evaluation methods need to be introduced. Commonly used integrated evaluation methods include the fuzzy evaluation method and the catastrophe progression method, as shown in Table 2. TOPSIS (technique of order preference similarity to the ideal solution) is a technique widely used in multi-criteria decision-making processes because of its simplicity and ability to consider an unlimited number of alternatives and criteria [44,45]. TOPSIS has been widely used in assessing flood resilience [12,46]. Although the VIKOR (VIseKriterijumska Optimizacija I Kompromisno Resenje) method can take the relative importance of positive and negative ideal solutions into account [47], the positive and negative ideal solutions are considered to be of equal importance in this research. In summary, this research adopted a combined ANP-EWM-TOPSIS integrated model to assess urban flood resilience.
Table 1. Common methods of empowerment.
MethodDescriptionApplicable ScenariosAdvantages and DisadvantagesReference
SubDAREUnidirectional determination of the level of importance of an indicator can be effective in solving decision-making problems.Flexible determination of proportions without the limitation of sample data can solve the problems that cannot be handled by optimization techniques.Requires experts to have a clear understanding of the indicators and to be able to compare and quantify them accurately, otherwise the weighting will be biased.[48,49]
DelphiThe knowledge and experience of experts in their specialties can be fully utilized.Suitable for forming weights for indicators that are difficult to quantify.The limited number of experts surveyed resulted in an incomplete and limited collection of views.[50]
AHPCompare multiple indicators in pairs, determine the judgment matrix, and calculate the decision weights.Generally used for weighting of indicators; used alone for synthesizing evaluations.Failure to provide new options for decision-making.[39]
ANPCalculates indicator weights by constructing a judgment matrix, similar to AHP.Combination of qualitative and quantitative, more widely used.The calculation is simple and easy to grasp; the correlation between the elements of the guideline layer and the elements of the indicator layer is considered.[51]
ObFAReducing noise and redundancy in data by downscaling the data.Can be used for information condensation, weight calculation, competitive ranking, etc.The evaluation results are more objective; the cumulative contribution of the first few principal components extracted is required to reach a high level.[52]
PCAIndicator weights are calculated from the variance contribution ratio of the principal components, which is more objective and reasonable.There is no limit to the number of indicators and samples, and there is a wide range of applications.The assumption of a linear relationship between the indicators is biased by the fact that in reality the relationship is mostly non-linear.[53]
CRITICWeights are calculated using the volatility of the data or the correlation situation between the data.It is appropriate that the data information itself carries some correlation or volatility.The impact of more correlated indicators can be eliminated and overlapping information can be reduced.[54]
Coefficient of VariationThe use of sample data ensures that the weights are objective.Not applicable for small samples, which reduces the accuracy of the method.Simple and practical methodology; does not reflect the intrinsic linkage of the indicators and can only analyze the indicators individually with judgment.[55]
EWMBased on the information provided by each indicator, the weights are determined in relation to the degree of variability of each indicator, reflecting the degree of dispersion of the attribute.Weighted calculation, wide range of application areas.High precision, simple operation, and wide range of applications.[36]
Notes: In this table, Sub represents the subjective empowered method and Ob represents the objective empowered method.
Table 2. Integrated assessment method.
MethodDescriptionAdvantages and DisadvantagesReference
Fuzzy Integrated EvaluationConversion of qualitative evaluation to quantitative evaluation based on the theory of affiliation degree in fuzzy mathematics.Situations where fewer indicators are applied; evaluation results are more subjective.[56]
Catastrophe Progression MethodCombining mutation theory and fuzzy mathematics for multi-objective judgmental decision-making.No weighting of the indicators is involved, only the relative importance of the indicators to each other is taken into account.[57]
Cloud ModelUncertainty transformation between qualitative concepts and quantitative descriptions can be realized.The determination of evaluation intervals is somewhat subjective.[37]
BP Artificial Neural NetworkSimulates the neural network of the human brain to build a model that can “learn” and accumulates and makes full use of empirical knowledge to minimize the error between the best solution and the actual value.Predictive effects have a high degree of confidence; operation is more complex.[58]
VIseKriterijumska Optimizacija I Kompromisno Resenje (VIKOR)This is a compromise sorting method based on ideals.The relative importance of positive and negative ideal solutions is considered.[59]
Technique of Order Preference Similarity to the Ideal Solution (TOPSIS)Ranking of the evaluation sample based on how close the evaluation object is to the idealized target.The evaluation results are objective; they are applicable to both small sample data and multiple evaluation units, and they can well inscribe the comprehensive impact strength of multiple impact indicators.[36,44]

2.2. Research Framework

The evaluation of flood resilience in Nanjing was undertaken through four stages. Firstly, a Delphi study and literature review were used to screen the evaluation indexes and establish an index system of urban flood resilience. Then, the analytic network process (ANP) and entropy weighting (EWM) methods were used to develop the comprehensive evaluation index weightings. In the third stage, the technique for order preference by similarity to an ideal solution (TOPSIS) was used to study the dynamic changes in urban flood resilience over time in Nanjing between 2010 and 2021. Finally, an obstacle degree model was used to identify the main obstacles restricting the improvement of urban flood resilience. Figure 1 presents the methodological framework for this research.

2.3. Determination of Index Weight

2.3.1. Analytic Network Process

The analytic network process (ANP) is a further development of the analytic hierarchy process (AHP), and it takes into account the correlation or feedback relationships between elements of different levels and within the element group [60]. The steps involved in the network analysis are as follows:
Step 1: Construct a network hierarchy model and divide the control layer and network layer.
Step 2: The judgment matrix is constructed by expert scoring.
Step 3: Consistency test. The test principle is CR < 0.1, and the judgment matrix is considered to pass the consistency test. Otherwise, we need to adjust the judgment matrix and then test. After verifying the consistency test, the limit weighted super matrix was obtained (Appendix A).
C R = C I R I
C I = λ max 1 n 1
where λ max is the maximum eigenvalue of the pairwise comparison matrix, n is the order of the pairwise comparison matrix, and the value of R I can be found from the random consistency index reference table.
Step 4: Obtain the weight value of each index W A j .

2.3.2. Entropy Weight Method

The entropy weight method uses information theory to quantify several types of information and assigns weights to them according to the degree of change in each index. The larger the entropy value, the more information the index provides. When the evaluation object has a significant difference in the value of a certain index, the greater the difference, the greater the weight of the index. The entropy weights are calculated as follows:
Step 1: Standardization. The initial data matrix K = k i j ( i = 1 , 2 n ; j = 1 , 2 m ) is standardized to obtain a standardized matrix H .
Positive indicators:
H i j = k i j min ( k i j ) max ( k i j ) min ( k i j )
Negative indicators:
H i j = max ( k i j ) k i j max ( k i j ) min ( k i j )
Step 2: Calculate the entropy of the index j .
S j = 1 ln ( n ) i = 1 n q i j ln q i j
Q i j = h i j i = 1 n h i j
Step 3: Calculate the objective weight of each index.
W s j = ( 1 S j ) i = 1 n ( 1 S j )

2.3.3. Combination Weighting Method

The analytic network process method is a subjective weighting method centered on the views of experienced experts, obtained through a systematic approach. The entropy weight method is an objective weighting method based on data. The result depends on the distribution of the data set, which has strong objectivity and avoids the limitations caused by the subjective understanding or bias of experts. Combining the two methods of calculating weights can improve reliability and accuracy. Formula (8) is used to calculate the combined weight: in the formula, we take 0.5.
W j = α W A j + ( 1 α ) W Sj

2.4. TOPSIS Model

By calculating the Euclidean distance, the TOPSIS model (technique for order preference by similarity to an ideal solution) obtains the closeness degree between each research object and the ideal solution, so as to reflect the relative advantages and disadvantages of each evaluation object. The steps for developing the TOPSIS model are as follows:
Step 1: Multiply the normalized decision matrix by the weight of each indicator to obtain a weighted normalized matrix Z .
Z i j = W j H i j
Step 2: Determine the positive and negative ideal solution. The positive and negative ideal solutions are as follows:
Z + = max 1 i n h i j j = 1 , 2 , , m
Z = min 1 i n h i j j = 1 , 2 , , m
Step 3: Calculate the Euclidean distance between the evaluation object and the positive ideal solution and the negative ideal solution.
D i + = j = 1 m ( Z j + z i j ) 2
D i = j = 1 m ( Z j z i j ) 2
Step 4: Calculate the proximity.
C i = D i D i + + D i
The value of C i is between [0, 1]; the greater the value is, the higher the urban flood resilience is.

2.5. Obstacle Degree Model

This study introduces a new obstacle degree model to further reveal the main factors affecting and inhibiting urban flood resilience. The calculation formula is as follows:
A j = R j × V j j = 1 m R j × V j × 100 %
where R j is the factor contribution, R j = W j ; V j is the index deviation, V j = 1 h j ; h j is the standardized value of the j -th index, and m is the number of indicators.

3. Empirical Research

3.1. Study Area

Nanjing is the capital “megacity” of Jiangsu Province in China [25,61] and had a resident population of 9.42 million in 2021 and a GDP of $241.52 billion. Nanjing is located in the middle of the lower reaches of the Yangtze River, with a total area of about 6587.02 km2, and the overall terrain is low-lying. The city has a subtropical monsoon climate, with an uneven distribution of seasonal and heavy rainfall, as shown in Figure 2. Nanjing suffers from different types of urban flooding every year. From May to September there is a period of frequent flooding and the threat of typhoons, which seriously affects the normal production and life of residents. Major flood events have occurred frequently in Nanjing, including in 1991, 1998, 1999, 2003, 2005, and 2008. In addition, Nanjing was hit by successive floods between 2015 and 2017 [24]. Most recently, in July 2020, severe urban flooding was caused by several days of heavy rainfall. As such, improving the overall flood resilience of the city as well as the development of more resilient approaches to governance have become a top priority.

3.2. Constructing the Evaluation Index System

An analysis of previous studies on urban flood resilience was used to identify the main processes and characteristics affecting flood events. According to the pressure–state–response (PSR) analysis framework of urban flood systems, when an urban flood occurs, it will experience three stages of pressure–state–response [2]. Factors such as climate characteristics, rapid population density growth, and lifestyle characteristics will also exert pressures on the development of effective urban systems. On the contrary, rainwater and soil infiltration, the improvement of flood control measures, and the strengthening of flood monitoring can reduce the pressure on urban systems. A variety of factors are intertwined and work together to influence the development of urban resilience. A city can be considered as composing three systems: society, economy, and nature. This social–economic–natural complex ecosystem (SENCE) is composed of human behavior, natural environment, resource flow and social culture [62]. The SENCE theory has been widely used in urban related research fields, including the development of urban system evaluation, and the analysis of the coupling and coordination mechanisms within the urban system. This study considers both the PSR analysis framework and the SENCE theory, and in consideration of the availability of data, develops a comprehensive evaluation index system of urban flood resilience in Nanjing. This is constructed around the economic, social, ecological, and management dimensions. To underpin these dimensions, a total of 16 indicators were selected (Table 3) (where “+” in the indicator attributes represents a positive indicator, i.e., the larger the value of the indicator, the better; “−” represents a negative indicator, i.e., the smaller the value of the indicator, the better).
Economic resilience refers to the ability of an economic system to cope with shocks and disruptions, and it measures a city’s level of economic development and financial support [68]. Therefore, economic factors can be reflected by the level of regional economic development, the level of per capita income, and the level of employment in terms of GDP per capita, disposable income per capita, social security, and employment expenditure. A high level of economic development means that more funds are invested in infrastructure and flood control and disaster reduction [24]. GDP per capita measures a city’s economic strength and further measures the economic capacity of city residents to prevent and mitigate disasters [69]; disposable income per capita reflects the resilience of the socio-economic system [70]; and social security and employment expenditures reflect the government’s post-disaster recovery capacity. In addition, government fixed assets are particularly important [71].
Social resilience measures the ability related to the ability of various groups of people in a city to cope properly with flooding, and describes the city’s population, education, and healthcare [19]. Population density reflects the concentration of the population, and densely populated areas are more vulnerable to flooding due to intensive production activities. A high level of education can help everyone to understand flood hazard related impacts [72]. Drainage pipe density can reflect the city’s carrying capacity for flooding and is an important indication of the city’s drainage capacity and rainfall mitigation problems [73]. The number of health workers and the number of hospital beds are also important influences; they are a reflection of the degree of social security in the city, with a higher number representing the city’s emergency response capacity. Therefore, for the social dimension we chose a total of five indicators: population density, average number of students enrolled in higher education per 10,000 population, drainage density, number of health workers per 10,000 population, and number of hospital beds.
The ecosystem of cities is more fragile and vulnerable to various disturbances and shocks. Urban ecosystems play an important role in sustainable urban development [65] and are a true reflection of the urban context. Other things being equal, flood disasters are mostly affected by rainfall, so we chose rainfall as the first indicator of the ecological dimension. Meanwhile, ecosystems not only provide energy and resources for the normal operation of economic and social systems, but also need to decompose and digest emissions from economic production and social activities; thus, the harmless treatment of domestic waste in cities is also quite important. Forests also play a role in protecting water sources and regulating the climate, and cities with forests have varying degrees of flood resilience, so we considered choosing this indicator, but in view of the difficulty of collecting data for the indicator, we chose the green coverage of built-up areas instead. Therefore, for the ecological dimension, we selected three indicators: rainfall, rate of non-hazardous treatment of domestic waste, and green coverage of built-up areas.
The level of urban flood resilience is considered a combination of aspects reflecting the preparations before an event, the emergency management response, and the ability of communities to recover in a timely way after the event. Management resilience is expressed as the ability of the emergency management services to resist to the effects of a flood event. The key lies in the development of a robust flood risk management policy, strategy, and regulations, including the implementation of appropriate methods for flood monitoring, early warning, and flood defenses. Therefore, four indicators were selected: flood emergency plan, flood dynamic monitoring accuracy, public disaster emergency awareness, and disaster relief evacuation speed.

3.3. Data Sources

The statistics used in this research was extracted from the “Nanjing Statistical Yearbook”, “Jiangsu Statistical Yearbook”, and “China Civil Affairs Database” from 2011 to 2022, which can be consulted on the website of China Statistical Information Network and Jiangsu Provincial Bureau of Statistics. Secondly, the results of a questionnaire survey of experts (including those working at the Water Resources Department of Jiangsu Province, the Urban Planning Bureau, and researchers in the field of urban flood resilience) were used to identify the importance of the indicators. The details and characteristics of the experts are provided in Appendix B.

4. Analysis of Research Results

4.1. Determination of Index Weight

As can be seen from Table 4, the economic and social dimensions account for a higher proportion than the management and ecological dimensions. Economic development reflects the level of regional economic development. The level of resilience is higher in areas with prosperous economic development, indicated by having sufficient resources to help residents to cope with the impacts of a flooding event. Furthermore, the economic system also affects other dimensions. When the economic development is slow, residents are more vulnerable and have lower levels of awareness of environmental issues and the emergency management response. The main concerns in the social dimension are the characteristics of the urban population, health care, education, and drainage, which are directly related to urban flood risk and therefore more important.
In the indicator layer, the top index weights calculated by the ANP method are (A2) fixed asset investment, (A4) social security and employment expenditure, (C1) rainfall, (B1) population density, and (A1) per capita GDP. This indicates that experts in the field of urban flood resilience believe that these indicators have a significant impact on urban flood resilience. Through the entropy weight method, calculations for the following were made: (B2) the average number of students in colleges and universities per 10,000 population, (D3) the public disaster emergency awareness, (B4) the number of health workers per 10,000 population, (A4) the social security and employment expenditure, and (C3) the green coverage rate of built districts; these factors have higher weights. The combined weights were calculated by combining the ANP method and the entropy weight method. The higher the priority, the greater the impact of these factors on urban flood resilience.

4.2. TOPSIS Model Evaluation Results

4.2.1. Analysis of Urban Flood Disaster Resilience in Nanjing

According to the model findings, the urban flood resilience of Nanjing from 2010 to 2021 was evaluated including the dimensions of economic, social, ecological, and management resilience. Combined with the evidence in the literature on urban resilience classification, urban flood resilience was divided into five grades (Table 5) [3]. In order to evaluate the urban flood resilience objectively and accurately, the ANP-EWM-TOPSIS model was used to obtain the characteristics of the flood resilience levels in Nanjing from 2010 to 2021, and a comprehensive index curve of flood resilience was drawn (Figure 3).
From Figure 3, it can be seen that during the study period, the flood resilience of Nanjing City generally showed a fluctuating upward trend. The urban flood resilience score between 2010 and 2012 was low, and the overall resilience level moved from Level 1 to Level 2. Flood resilience continued to increase from 0.309 to 0.454 in 2012–2016, with an increase of 0.145, although the overall resilience was still at Level 2. The growth rate of flood resilience in 2016–2019 was significantly higher than before, with the overall resilience transitioning from Level 2 to 4. Flood resilience then slowly grew and gradually stabilized over the period of 2019–2021, with an overall resilience at Level 4.
Figure 4 shows the development trend of flood resilience in Nanjing.
D i + showed a downward trend, while D i showed an increasing trend and gradually widened the distance from the negative ideal value, which indicates that the flood resilience of Nanjing is developing in a positive direction, and the negative aspects are constantly being addressed.
Overall, during the study period, the evolution of flood resilience in Nanjing can be divided into four stages:
The first phase is the steady development phase from 2010 to 2012. During this period, the flood resilience comprehensive index increased rapidly, although the flood resilience level was low. At this stage, the Nanjing municipal government increased investment in fixed assets, increased attention to urban safety, and increased green coverage in urban governance. These measures are conducive to improving the level of urban flood resilience.
The second stage is the slow growth stage of 2012–2016. At this stage, the city still had a low level of resilience, and changes were not obvious. During this period, there were high levels of concentrated urban rainfall and while the green coverage and management measures had been improved, short-term heavy rainfall was still causing difficulties. At the same time, due to the deterioration of the ecological environment, the level of urban flood resilience was not significantly improved.
The third stage is the rapid upward phase between 2016 and 2019. At this stage, the concept of resilience had been widely recognized and Nanjing undertook a series of measures to promote the development of urban resilience, such as improving spatial planning and improving flood control plans. At the same time, due to the occurrence of major floods in 2016, the public‘s awareness of disaster emergency response was also unprecedentedly improved. Various factors prompted Nanjing to move towards a more stable and healthy urban system.
The fourth stage is the steady growth stage of 2019–2021. At this stage, the city is at a higher level of resilience and Nanjing‘s flood resilience is growing well. Over the years, urban infrastructure and economic development have been continuously improved, and the ability to resist various disturbances and risks has been enhanced. This has also coincided with further improvements to urban safety.

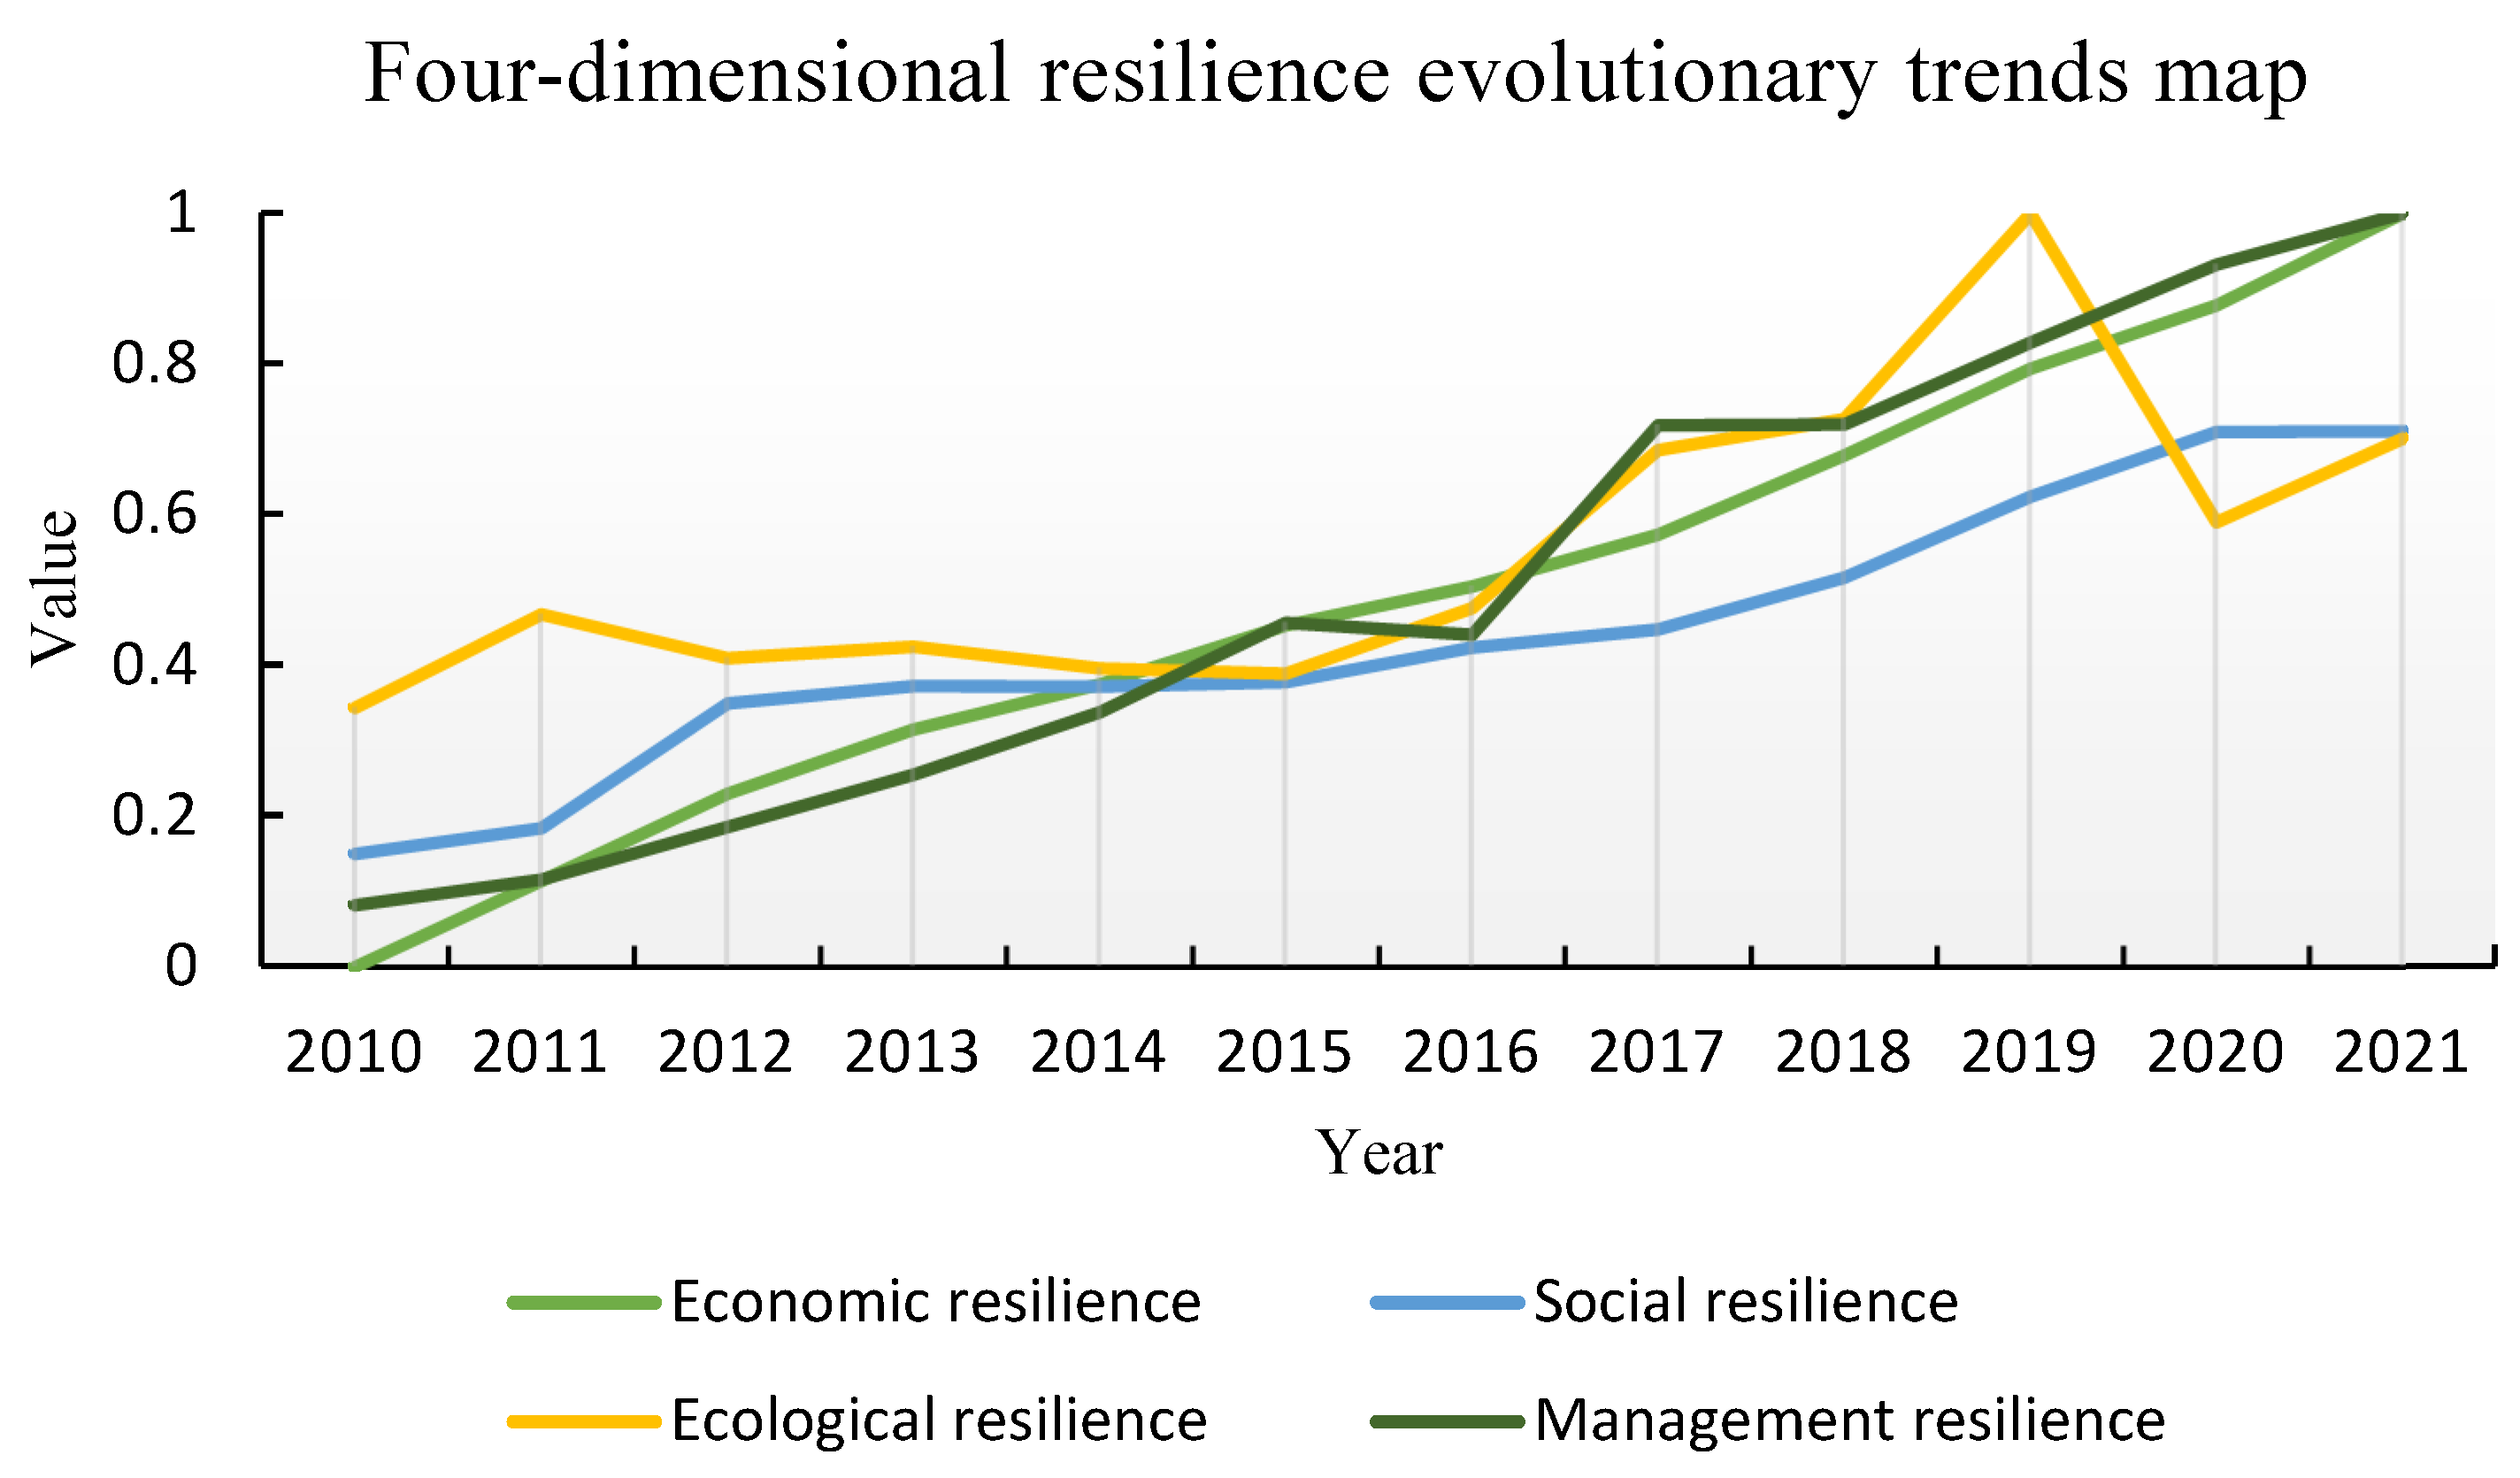
4.2.2. Single System Time Series Analysis

In order to explore more deeply the structure and dynamic evolutionary characteristics of urban flood resilience in Nanjing, it is necessary to conduct a more detailed analysis of the economic, social, ecological, and management resilience dimensions that constitute urban flood resilience. Table 6 shows the four-dimensional resilience measurement values of Nanjing from 2010 to 2021, and Figure 5 shows the four-dimensional resilience evolutionary trends map.
(1)
Economic resilience
According to Table 6 and Figure 5, the economic resilience of Nanjing shows a linear growth trend from 2010 to 2021. In recent years, during the development of Nanjing City, the economy has maintained a good development trend, and the economic subsystem has provided support for flood control and infrastructure development, which has helped to improve flood risk management in the city. In 2010, the economic resilience score was zero, indicating a low level of economic development. Nanjing’s per capita GDP and social security and employment expenditures have increased significantly from 2010 to 2021. In 2021, Nanjing’s per capita disposable income and fixed asset investment also increased by about 2.7 and 1.7 times compared with 2010. The “Yangtze River Delta Regional Integration Development Plan Outline” issued in 2019 further promoted the economic development of Nanjing and provided opportunities for the overall development of the city.
(2)
Social resilience
From 2010 to 2021, Nanjing’s social resilience showed a fluctuating growth trend and an uneven growth rate. Between 2010 and 2017, the growth rate of social resilience was relatively slow. Between 2017 and 2020, there was a significant rise to the fourth level, which then stabilized. According to the specific indicators, the population density of Nanjing increased gradually after 2012. Other indicators have also increased to varying degrees. By the end of 2020, the number of beds per 1000 permanent residents in the city had reached 6.76, and the number of practicing (assistant) physicians per 1000 permanent residents in the city had reached 4.06, exceeding the goal of the ‘ Nanjing 2018–2020 Medical and Health Service System Plan ’. Under this combined effect, the resilience of the Nanjing social subsystem shows an overall upward trend.
(3)
Ecological resilience
From 2010 to 2021, the development process of Nanjing’s ecological resilience relative to the economic and social systems is observed as more complex and fluctuating. From 2010 to 2015, the ecological resilience score was basically maintained around a level of 0.4. The score then rose between 2015 and 2019, rising faster, indicating that Nanjing had increased the intensity of ecological environment development during this period. Ecological resilience reached the highest level in 2019. In 2020, Nanjing suffered from extreme weather and heavy rainfall, resulting in a major impact on the city’s original flood discharge system and a sharp decline in ecological resilience. From 2020 to 2021, the level of ecological resilience was restored and then improved. With the further advancement and development of cities, human activities will cause pressure on some of the ecological environmental conditions, such as increased resource consumption and industrial production which may increase the deterioration of urban ecosystems. However, with the change to the concept of living with water [8] and the implementation of flood risk management measures [40], as well as the promotion of the sponge city approach and green production concepts, positive human action can also reduce the pressure on the ecological environment.
(4)
Management resilience
Between 2010 and 2021, the development of Nanjing’s management resilience fluctuates but overall is gradually seen to be increasing. The level of management resilience increased linearly from 2010 to 2015, and it experienced a small fluctuation from 2015 to 2016, with a small decline. This is related to the frequent heavy rainfall in Nanjing and highlights the need for further improvements in the flood risk management measures in the city. From 2016 to 2021, Nanjing’s flood management plan was further improved, resulting in an increased public awareness of flood risk and improvements in the emergency response. This has led to the development of more robust flood risk management plans and measures which have achieved positive results.

4.3. Obstacle Degree Model

Table 7 shows the range of obstacles to improved flood resilience in Nanjing between 2010 and 2021. It can be seen that the contribution values of the four dimensions of flood resilience are clearly different, with economic and management factors decreasing, while the social and ecological obstacles are increased (Figure 6). Before 2016, economy, society, and management played a leading role in hindering Nanjing’s flood resilience. Between 2016 and 2019, the main obstacles were linked to society and the economy. After 2019, the society and ecology dimensions became the largest barriers affecting the development of resilience.
In order to more intuitively see the distribution of barrier factors to flood resilience in Nanjing, a hotspot map is presented, as shown in Figure 7 (Where (a), (b), (c), and (d) denote the sub-hotspot maps of barriers for each dimension of economic, social, ecological, and management factors, respectively). This shows that not only is the proportion of economic and management obstacle factors decreasing, but we also know exactly which factors are decreasing; similarly, we can not only know that the proportion of social and ecological obstacle factors is increasing, but also know exactly which factor prevents the increase in social and ecological resilience in Nanjing. As can be seen from the figure, almost every obstacle factor in the economy and management is decreasing year by year, which is due to the fact that during the study period, the structural transformation of Nanjing was promoted in an orderly manner, and the new development pattern of the two internal and external cycles constructed was effective. This led to an enhancement of the vitality of the economic development and a steady improvement of the economy, and, with the growth of time, the public’s awareness of the emergency response to the flood disaster in Nanjing has greatly improved. Some of the government’s own flood defense mechanisms, rescue speed, etc., are also improving; the main obstacle to the reduction in social resilience is (B1) population density, and the main obstacle to the reduction in ecological resilience is (C1) rainfall.
This is attributed to the fact that as one of the major cities in China, and capital of the Jiangsu Province, Nanjing, in the context of accelerating urbanization, has also attracted a lot of people to the city and the per capita land has decreased, so that the damage caused by flood disasters has also increased compared to before. This in turn has led to a decrease in social resilience, and at the same time, due to the big flood in 2016, the levels of awareness of flood prevention have improved. Hence, the obstacle factor was reduced in the years 2016–2019, but the heavy rainfall the city suddenly suffered in 2020 led to the city’s original flood drainage system being affected and leading to a sharp decline in ecological resilience.
At the same time, in order to better highlight the primary and secondary relationships of the barrier factors in each year, we also ranked the barrier factors in order of frequency from high to low, and then filtered out the top five barrier factors, as shown in Table 8. It can be found from Table 8 that (A4) social security and employment expenditure, (A1) per capita GDP, (A2) fixed asset investment, (B4) health personnel per 10,000 population, and (D3) public disaster emergency awareness had the highest frequency. These were considered as the key factors affecting urban flood resilience in Nanjing.
From 2010 to 2014, (A4) social security and employment expenditure was the primary obstacle restricting the improvement of urban flood resilience, followed by (C3) the green coverage rate of built-up areas and (B4) the number of health workers per 10,000 population. The main obstacle between 2015 and 2017 were (C1) rainfall and (A2) fixed asset investment. From 2018 to 2021, the main obstacles were (B1) population density, (C1) rainfall, and (C3) built-up area green coverage. Based on a comprehensive comparison of these obstacles, it can be seen that the main barriers to improving flood resilience changed from 2010 to 2021. While social security and employment expenditure was the main factor, this has changed to rainfall, and then to population density. With the increased investment in development and infrastructure, a large number of people have moved into the city in the search of better economic development opportunities and improved prospects. Economic factors are no longer the key factors restricting the healthy development of cities. The density of the population is high, and the impact of extreme weather and heavy rainfall aggravates the pressure on urban systems. Although the government departments of Nanjing have paid attention to environmental and infrastructure development, there are still some barriers hindering the development of urban resilience, and further measures are needed to adapt to the challenges brought about by flooding.

5. Discussion and Prospects

Nanjing is a megacity, situated in an advantageous geographical location, and benefits from strong economic prosperity and development. However, when a severe flood event takes place, this causes a serious loss of life, damage to property, and major disruption to the normal production and life of local communities. While flood events in Nanjing in the early years were frequent and severe, in more recent years, the impacts of flooding problems in Nanjing have decreased significantly. It is useful to analyze the reasons for this change, which is conducive to the healthy and sustainable development of the city. At the same time, it can also provide a basis for other cities towards developing their own resilience-improvement strategies.
The results of this paper show that Nanjing’s flood resilience has gradually increased over time during the study period, with a particularly high increase from 2016 to 2019. The reason for this is that, compared with other years, the great flood in 2016 sounded an alarm for the people of Nanjing, and in 2017, the Nanjing municipal government re-revised the Nanjing Flood Prevention Measures. This report provides a clear and detailed description of the construction management, planning, emergency plans, safeguard measures, and related legal responsibilities for flood prevention and flood control; in 2018–2019, the state and Jiangsu Province also issued multiple announcements on effectively strengthening flood defense measures during the flood season, and during this period, the Nanjing municipal government also carried out strong and effective management of the city’s drainage system, water conservancy facilities, and pre-flood preparations and inspections, which led to Nanjing’s rapid growth in flood resistance in the 2016–2019 period.
At the same time, during the period of 2015–2019, the Nanjing Municipal Bureau of Ecology and Environment also issued a number of documents to strengthen environmental governance, urban groundwater pollution prevention and control, flood season pollution prevention and control, and environmental safety and security. These developments have all helped to contribute to improvements in the urban greening rate of Nanjing. During this period, the rainfall in Nanjing was even, life security was stable, and there were no catastrophic floods, which made the ecological resilience of this period grow very fast. Further, we can find that the overall resilience of social and ecological resilience to floods declined during the study period. Each of these parts is indispensable, and therefore the government should pay more attention to them in the latter part of these developments and plans. As far as the above is concerned, over the years, the policies on flood prevention and control issued by the state and the Nanjing government, as well as the positive response of the public, have led to an increase in Nanjing’s flood resilience. Of course, this is also due to the successful implementation of the policies. The results of this study can be used to help inform recommendations and policy-makers in developing more targeted and practical plans to improve urban flood resilience for sustainable development.
Compared to other studies, Nanjing has seen a general upward trend in urban flood resilience between 1990 and 2017, and higher fixed asset investments have helped to strengthen urban infrastructure to better cope with urban flooding [24]. This is consistent with the results of the ANP-EWM-TOPSIS integrated evaluation model and further verifies the validity of this model. Rezende et al. proposed the Urban Flood Resilience Index (UFRI) to assess the resilience of watershed spaces, and the results showed that the impervious surface increases and the infiltration rate decreases, which can exacerbate the risk of urban flood hazards [74]. The urbanization process, which leads to an increase in the impervious area for land development and use, increases the flood risk, and this concept is in line with this study. The results of the data trained by Rafiei-Sardooi et al. show that the most vulnerable to flooding tend to be areas with a relatively high population density [12]. Similarly, in a regional case study of Kunming, China, rainfall and population density were important factors in terms of urban flood vulnerability [75]. In this study, it can be found that the main obstacle for urban flood resilience in Nanjing for 2018–2021 is population density, followed by rainfall. The redundancy and systematic resistance of the urban system to cope with potential risks can be improved by promoting the development of smart cities [76].
Meanwhile, in considering some of the earlier research which has investigated the flood resilience levels of the Yangtze River Delta (including Nanjing) [61,77,78], we find that Nanjing is consistently in the top in terms of resilience among the 27 cities in the region. Shanghai, a municipality directly under the Central Government, and Hefei and Hangzhou, also provincial capitals, have a high flood resilience but fall below Nanjing. This may be attributed to their different economic, social, and physical characteristics. For example, although Shanghai is more economically developed, it has an increasing population density, and surveys have found that the elderly population in Shanghai is the highest of all cities, accounting for more than 33 per cent of the population [79]. Contrary to Shanghai, Hefei, although better off in terms of population density and ageing, is itself relatively backward in terms of economic activity [80] and its flood prevention and mitigation policies are also relatively lacking. Consequently, Hefei is ranked lowest in terms of flood resilience amongst these provincial capitals of the Yangtze River delta region. Furthermore, whilst Hangzhou’s lower green coverage has resulted in a slightly lower resilience to flooding than that of Nanjing. Nanjing itself is at the forefront of flood resilience among these cities due to the high priority given to urban flood management in recent years, including the release of a number of policy documents, which have resulted in a clear increase in flood resilience in Nanjing.
From the above analysis, we can see that the strength of a city’s flood resilience is affected by a number of complex and integrating factors, such as economic development, population exposure, and ecological issues. As cities such as Shanghai, Nanjing, and Hangzhou become increasingly more densely populated, the risk and consequences of flooding continues to rise. Given that it will be difficult to reduce the density of the population, steps need to be taken to increase the ecological protection by improving the natural environment and to enhance the function of ecosystem services to increase the city’s flood resistance. This corresponds to the idea of addressing the barriers affecting ecological resilience as reported in this study.
The findings of this research are consistent with earlier studies by Huang et al. [81] and Li et al. [82] who argue that the development of the ecological environment in Nanjing has the greatest potential to impact urban flood resilience, and that GDP per capita is the main barrier affecting economic resilience. This further supports the authenticity and veracity of the findings reported herein.
This research used an ANP-EWM-TOPSIS comprehensive evaluation model to evaluate the trends in urban flood resilience in the city of Nanjing from 2010 to 2021. The results reflect the real situation of flood management in Nanjing and verify the practicability of the model. The methodology adopted in this study is not only applicable to the evaluation of urban flood resilience, but can also be extended and applied to the management of resilience to other natural hazards and disasters. In addition, urban areas have similar flood hazard characteristics and behave similarly before, during, and after floods. Therefore, the proposed ANP-EWM-TOPSIS framework can be generalized to other regions of China or indeed to different countries. It is worth noting that the indicator system needs to be modified according to the development characteristics of different regions to provide a reference for regional flood prevention and mitigation, so as to improve the ability to adapt to flooding events.
At the same time, the evaluation index system of urban flood resilience constructed in this study can not only effectively reflect the impact of flood disasters on urban resilience in Nanjing, but also has the benefit of using indicators which are easy to measure. The weighting method of combining subjective and objective data reduces the reliance on subjective judgment and helps to improve the accuracy of the results. Most of the objective data used here were taken from statistical annual reports and publicly available government websites, ignoring urban flood resilience at the meso- and micro-levels, and the results tend to be macro-analyzed. There are also some data from questionnaire surveys, and there may be cases of bias in the opinions of different expert groups, which will also affect the final results obtained using the model. In the future, fuzzy comprehensive evaluation (FCE), multi-criteria compromise solution sorting (VIKOR), grey relational analysis (GRA), urban flood resilience index (UFRI), and data envelopment analysis (DEA) can also be used to evaluate the resilience levels. A useful next step for this body research would be to compare the accuracy of these methods and then select the most accurate method for validating their predictions.

6. Conclusions

This research combines the PSR framework with SENCE theory to construct an evaluation index system of urban flood resilience, which includes 4 first-level dimensions and 16 s-level indicators. The main conclusions are as follows:
(1) The ANP-EWM combination weighting can be used to identify the degree of importance of each indicator affecting urban flood resilience. According to the results, the economic and social dimensions have a greater impact on urban flood resilience. At the indicator layer, A4 social security and employment expenditure, A2 fixed asset investment, B1 population density, A1 GDP per capita, and C1 rainfall are considered to be the most critical indicators.
(2) The flood resilience of Nanjing from 2010 to 2021 was evaluated by the technique of order preference similarity to the ideal solution, which provides new insights on how to quantify the city’s flood resilience. During the study period, the flood resilience of Nanjing experienced four stages, with an overall growth trend and steady improvement. This is due to the strong economic development of Nanjing which has seen increasing investment in fixed assets, improvements in the medical service capacity, and the adoption of a series of disaster prevention and mitigation measures. The development and changes in each subsystem in Nanjing were as follows: economic resilience and management resilience increased year by year, and the speed of improvement was faster; social resilience and ecological resilience also presented an increasing trend, but the overall growth rate was relatively slow.
(3) Finally, the obstacle degree model was used to determine the barriers to the development of flood resilience in Nanjing, which is helpful in highlighting possible improvement paths and providing guidance for decision-makers involved in urban sustainable development and urban planning. The results of the obstacle diagnosis model show that the main barriers to improving flood resilience in Nanjing are social security and employment expenditure, per capita GDP, fixed asset investment, number of health workers per 10,000 population, and public disaster emergency awareness. These indicators represent the key factors affecting flood resilience in Nanjing over this period. In the past five years, Chinese cities have had to confront the increased pressure caused by population density while further developing and adapting to the risk of severe flooding. Hence, alleviating the challenges caused by urbanization and significant population growth has become the key challenge. Secondly, there is a need to strengthen the development of sponge cities which support the concept of living with water, while continuing to advocate environmental protection and creating green and healthy ecosystems.
This study has some practical significance for improving Nanjing’s flood resilience. This lies mainly in two aspects: firstly, targeted flood resilience improvement measures based on the assessment results can reduce the risk of Nanjing encountering floods again and, to a certain extent, reduce the economic losses as well as the number of casualties; secondly, based on the comparison with other cities, Nanjing needs to continue to support the development of the natural ecosystem by introducing policies that motivate and reward more sustainable development.
However, this research still has some limitations that need to be acknowledged. The selected indicators, although based on previous related studies, have some limitations in terms of scope and accuracy. Further research will need to consider selecting more effective and specific indicators, as well as comparing the accuracy of different metrics to improve the accuracy of the results.

Author Contributions

All authors were involved in the production and writing of the manuscript. Conceptualization, W.X.; methodology, X.C.; validation, W.X., X.C., Q.Y. and T.X.; writing—original draft, W.X. and X.C.; writing—review and editing, D.P.; investigation, W.X. and X.C.; supervision, W.X., Q.Y. and D.P. All authors have read and agreed to the published version of the manuscript.

Funding

This research was funded by Key Project of Hubei Provincial Department of Education grant number [23D060] and Project of Hubei Provincial Science and Technology Department grant number [2022CFC067].

Data Availability Statement

Some or all data, models, or code that support the findings of this study are available from the corresponding author upon reasonable request.

Conflicts of Interest

The authors declare no conflicts of interest.

Appendix A

Table A1. Limit super matrix.
A1A2A3A4B1B2B3B4B5C1C2C3D1D2D3D4
A10.0870 0.0870 0.0870 0.0870 0.0870 0.0870 0.0870 0.0870 0.0870 0.0870 0.0870 0.0870 0.0870 0.0870 0.0870 0.0870
A20.1356 0.1356 0.1356 0.1356 0.1356 0.1356 0.1356 0.1356 0.1356 0.1356 0.1356 0.1356 0.1356 0.1356 0.1356 0.1356
A30.0463 0.0463 0.0463 0.0463 0.0463 0.0463 0.0463 0.0463 0.0463 0.0463 0.0463 0.0463 0.0463 0.0463 0.0463 0.0463
A40.0981 0.0981 0.0981 0.0981 0.0981 0.0981 0.0981 0.0981 0.0981 0.0981 0.0981 0.0981 0.0981 0.0981 0.0981 0.0981
B10.0973 0.0973 0.0973 0.0973 0.0973 0.0973 0.0973 0.0973 0.0973 0.0973 0.0973 0.0973 0.0973 0.0973 0.0973 0.0973
B20.0165 0.0165 0.0165 0.0165 0.0165 0.0165 0.0165 0.0165 0.0165 0.0165 0.0165 0.0165 0.0165 0.0165 0.0165 0.0165
B30.0562 0.0562 0.0562 0.0562 0.0562 0.0562 0.0562 0.0562 0.0562 0.0562 0.0562 0.0562 0.0562 0.0562 0.0562 0.0562
B40.0606 0.0606 0.0606 0.0606 0.0606 0.0606 0.0606 0.0606 0.0606 0.0606 0.0606 0.0606 0.0606 0.0606 0.0606 0.0606
B50.0241 0.0241 0.0241 0.0241 0.0241 0.0241 0.0241 0.0241 0.0241 0.0241 0.0241 0.0241 0.0241 0.0241 0.0241 0.0241
C10.0974 0.0974 0.0974 0.0974 0.0974 0.0974 0.0974 0.0974 0.0974 0.0974 0.0974 0.0974 0.0974 0.0974 0.0974 0.0974
C20.0298 0.0298 0.0298 0.0298 0.0298 0.0298 0.0298 0.0298 0.0298 0.0298 0.0298 0.0298 0.0298 0.0298 0.0298 0.0298
C30.0653 0.0653 0.0653 0.0653 0.0653 0.0653 0.0653 0.0653 0.0653 0.0653 0.0653 0.0653 0.0653 0.0653 0.0653 0.0653
D10.0191 0.0191 0.0191 0.0191 0.0191 0.0191 0.0191 0.0191 0.0191 0.0191 0.0191 0.0191 0.0191 0.0191 0.0191 0.0191
D20.0770 0.0770 0.0770 0.0770 0.0770 0.0770 0.0770 0.0770 0.0770 0.0770 0.0770 0.0770 0.0770 0.0770 0.0770 0.0770
D30.0419 0.0419 0.0419 0.0419 0.0419 0.0419 0.0419 0.0419 0.0419 0.0419 0.0419 0.0419 0.0419 0.0419 0.0419 0.0419
D40.0479 0.0479 0.0479 0.0479 0.0479 0.0479 0.0479 0.0479 0.0479 0.0479 0.0479 0.0479 0.0479 0.0479 0.0479 0.0479

Appendix B

Table A2. Specifics of the expert group.
CharacteristicsNumber
Experts
(n = 15)
Work experience5 years4
5–8 years5
More than 8 years6
Work unitColleges and universities5
Government department5
Urban planners5
Expertise or research fieldUrban resilience5
Resilience enhancement strategy3
Flood management4
Urban planning development3

References

  1. Wu, Y.; Yu, G.; Shao, Q. Resilience benefit assessment for multi-scale urban flood control programs. J. Hydrol. 2022, 613, 128349. [Google Scholar] [CrossRef]
  2. Liu, G.; Yuan, X.; Huang, J.; Wang, H. Evaluation of urban resilience to flood based on PSR framework—A Case of Area in Suzhou—Wuxi—Changzhou. Resour. Dev. Mark. 2018, 34, 593–598. [Google Scholar]
  3. Zhou, Z.; Hu, Q.; Zhou, M.; Liu, D.; Tang, W.; Wang, S. Rainfall resilience assessment and obstacle factor diagnosis based on PSR-TOPSIS model: Taking Hefei City as an example. J. Hunan City Univ. (Nat. Sci.) 2022, 31, 55–61. [Google Scholar]
  4. Chen, C.; Chen, Y.; Shi, B.; Xu, T. An model for evaluating urban resilience to rainstorm flood disasters. China Saf. Sci. J. 2018, 28, 1–6. [Google Scholar]
  5. Li, Z.; Guo, X. Quantitative evaluation of China’s disaster relief policies: A PMC index model approach. Int. J. Disaster Risk Reduct. 2022, 74, 102911. [Google Scholar] [CrossRef]
  6. Zhang, Y.; Xue, W.; Wen, Y.; Wang, X. Sustainability Assessment of Water Resources Use in 31 Provinces in China: A Combination Method of Entropy Weight and Cloud Model. Int. J. Environ. Res. Public Health 2022, 19, 12870. [Google Scholar] [CrossRef]
  7. Laeni, N.; van den Brink, M.; Arts, J. Is Bangkok becoming more resilient to flooding? A framing analysis of Bangkok’s flood resilience policy combining insights from both insiders and outsiders. Cities 2019, 90, 157–167. [Google Scholar] [CrossRef]
  8. Restemeyer, B.; van den Brink, M.; Woltjer, J. Between adaptability and the urge to control: Making long-term water policies in the Netherlands. J. Environ. Plan. Manag. 2017, 60, 920–940. [Google Scholar] [CrossRef]
  9. Hosseini, F.S.; Sigaroodi, S.K.; Salajegheh, A.; Moghaddamnia, A.; Choubin, B. Towards a flood vulnerability assessment of watershed using integration of decision-making trial and evaluation laboratory, analytical network process, and fuzzy theories. Environ. Sci. Pollut. Res. 2021, 28, 62487–62498. [Google Scholar] [CrossRef]
  10. Cao, F.; Xu, X.; Zhang, C.; Kong, W. Evaluation of urban flood resilience and its Space-Time Evolution: A case study of Zhejiang Province, China. Ecol. Indic. 2023, 154, 110643. [Google Scholar] [CrossRef]
  11. Taromideh, F.; Fazloula, R.; Choubin, B.; Emadi, A.; Berndtsson, R. Urban Flood-Risk Assessment: Integration of Decision-Making and Machine Learning. Sustainability 2022, 14, 4483. [Google Scholar] [CrossRef]
  12. Rafiei-Sardooi, E.; Azareh, A.; Choubin, B.; Mosavi, A.H.; Clague, J.J. Evaluating urban flood risk using hybrid method of TOPSIS and machine learning. Int. J. Disaster Risk Reduct. 2021, 66, 102614. [Google Scholar] [CrossRef]
  13. Darabi, H.; Choubin, B.; Rahmati, O.; Haghighi, A.T.; Pradhan, B.; Klove, B. Urban flood risk mapping using the GARP and QUEST models: A comparative study of machine learning techniques. J. Hydrol. 2019, 569, 142–154. [Google Scholar] [CrossRef]
  14. Li, W.; Jiang, R.; Wu, H.; Xie, J.; Zhao, Y.; Song, Y.; Li, F. A System Dynamics Model of Urban Rainstorm and Flood Resilience to Achieve the Sustainable Development Goals. Sustain. Cities Soc. 2023, 96, 104631. [Google Scholar] [CrossRef]
  15. Hegger, D.L.; Driessen, P.P.; Wiering, M.; Van Rijswick, H.F.; Kundzewicz, Z.W.; Matczak, P.; Crabbé, A.; Raadgever, G.T.; Bakker, M.H.; Priest, S.J. Toward more flood resilience: Is a diversification of flood risk management strategies the way forward? Ecol. Soc. 2016, 21, 52. [Google Scholar] [CrossRef]
  16. Sörensen, J.; Persson, A.; Sternudd, C.; Aspegren, H.; Nilsson, J.; Nordström, J.; Jönsson, K.; Mottaghi, M.; Becker, P.; Pilesjo, P.; et al. Re-Thinking Urban Flood Management-Time for a Regime Shift. Water 2016, 8, 332. [Google Scholar] [CrossRef]
  17. Holling, C.S. Resilience and stability of ecological systems. Annu. Rev. Ecol. Syst. 1973, 4, 1–23. [Google Scholar] [CrossRef]
  18. Zeng, Z.; Fang, Y.; Zhai, Q.; Du, S. A Markov reward process-based framework for resilience analysis of multistate energy systems under the threat of extreme events. Reliab. Eng. Syst. Saf. 2021, 209, 107443. [Google Scholar] [CrossRef]
  19. Zhang, X.; Song, J.; Peng, J.; Wu, J. Landslides-oriented urban disaster resilience assessment-A case study in ShenZhen, China. Sci. Total Environ. 2019, 661, 95–106. [Google Scholar] [CrossRef]
  20. Unisdr, G. How to Make Cities More Resilient: A Handbook for Local Government Leaders; United Nations: Geneva, Switzerland, 2012. [Google Scholar]
  21. Bertilsson, L.; Wiklund, K.; Tebaldi, I.D.; Rezende, O.M.; Veról, A.P.; Miguez, M.G. Urban flood resilience—A multi-criteria index to integrate flood resilience into urban planning. J. Hydrol. 2019, 573, 970–982. [Google Scholar] [CrossRef]
  22. Xu, X.; Zhang, Z.; Long, T.; Sun, S.; Gao, J. Mega-city region sustainability assessment and obstacles identification with GIS–entropy–TOPSIS model: A case in Yangtze River Delta urban agglomeration, China. J. Clean. Prod. 2021, 294, 126147. [Google Scholar] [CrossRef]
  23. Miguez, M.G.; Veról, A.P. A catchment scale Integrated Flood Resilience Index to support decision making in urban flood control design. Environ. Plan. B Urban Anal. City Sci. 2017, 44, 925–946. [Google Scholar] [CrossRef]
  24. Wang, P.; Li, Y.; Zhang, Y. An urban system perspective on urban flood resilience using SEM: Evidence from Nanjing city, China. Nat. Hazards 2021, 109, 2575–2599. [Google Scholar] [CrossRef]
  25. Xu, W.; Cong, J.; Proverbs, D.; Zhang, L. An evaluation of urban resilience to flooding. Water 2021, 13, 2022. [Google Scholar] [CrossRef]
  26. Suna, R.R.; Shia, S.H.; Rehemana, Y.J.; Lib, S.M. Measurement of urban flood resilience using a quantitative model based on the correlation of vulnerability and resilience. Int. J. Disaster Risk Reduct. 2022, 82, 103344. [Google Scholar] [CrossRef]
  27. Shi, P. Theory and practice of disaster study. J. Nat. Disasters 1996, 18, 1–9. [Google Scholar]
  28. Li, S. Analysis Flood Risk and Study Waterlogging Simulation in Zhengzhou. Zhengzhou Univ. 2016, 14, 4777. [Google Scholar]
  29. Xu, Z.; Chen, H.; Ren, M.; Cheng, T. Progress on disaster mechanism and risk assessment of urban flood/waterlogging disasters in China. Adv. Water Sci. 2020, 31, 713–724. [Google Scholar]
  30. Cutter, S.L.; Barnes, L.; Berry, M.; Burton, C.; Evans, E.; Tate, E.; Webb, J. A place-based model for understanding community resilience to natural disasters. Glob. Environ. Chang.-Hum. Policy Dimens. 2008, 18, 598–606. [Google Scholar] [CrossRef]
  31. Bruneau, M.; Chang, S.E.; Eguchi, R.T.; Lee, G.C.; O’Rourke, T.D.; Reinhorn, A.M.; Shinozuka, M.; Tierney, K.; Wallace, W.A.; Von Winterfeldt, D. A framework to quantitatively assess and enhance the seismic resilience of communities. Earthq. Spectra 2003, 19, 733–752. [Google Scholar] [CrossRef]
  32. Restemeyer, B.; Woltjer, J.; van den Brink, M. A strategy-based framework for assessing the flood resilience of cities–A Hamburg case study. Plan. Theory Pract. 2015, 16, 45–62. [Google Scholar] [CrossRef]
  33. Li, C.; Cheng, X.; Li, N.; Du, X.; Yu, Q.; Kan, G. A Framework for Flood Risk Analysis and Benefit Assessment of Flood Control Measures in Urban Areas. Int. J. Environ. Res. Public Health 2016, 13, 787. [Google Scholar] [CrossRef] [PubMed]
  34. Ruan, J.; Chen, Y.; Yang, Z. Assessment of temporal and spatial progress of urban resilience in Guangzhou under rainstorm scenarios. Int. J. Disaster Risk Reduct. 2021, 66, 102578. [Google Scholar] [CrossRef]
  35. Chen, K.; Leandro, J. A Conceptual Time-Varying Flood Resilience Index for Urban Areas: Munich City. Water 2019, 11, 830. [Google Scholar] [CrossRef]
  36. Zhang, H.; Yang, J.; Li, L.; Shen, D.; Wei, G.; Khan, H.U.R.; Dong, S. Measuring the resilience to floods: A comparative analysis of key flood control cities in China. Int. J. Disaster Risk Reduct. 2021, 59, 102248. [Google Scholar] [CrossRef]
  37. Qiao, H.; Pei, J. Urban Stormwater Resilience Assessment Method Based on Cloud Model and TOPSIS. Int. J. Environ. Res. Public Health 2022, 19, 38. [Google Scholar] [CrossRef] [PubMed]
  38. Tayyab, M.; Zhang, J.; Hussain, M.; Ullah, S.; Liu, X.; Khan, S.N.; Baig, M.A.; Hassan, W.; Al-Shaibah, B. GIS-Based Urban Flood Resilience Assessment Using Urban Flood Resilience Model: A Case Study of Peshawar City, Khyber Pakhtunkhwa, Pakistan. Remote Sens. 2021, 13, 1864. [Google Scholar] [CrossRef]
  39. Orencio, P.M.; Fujii, M. A localized disaster-resilience index to assess coastal communities based on an analytic hierarchy process (AHP). Int. J. Disaster Risk Reduct. 2013, 3, 62–75. [Google Scholar] [CrossRef]
  40. Liao, K.H. A Theory on Urban Resilience to Floods-A Basis for Alternative Planning Practices. Ecol. Soc. 2012, 17, 48. [Google Scholar] [CrossRef]
  41. Dewulf, A.; Meijerink, S.; Runhaar, H. Editorial: The governance of adaptation to climate change as a multi-level, multi-sector and multi-actor challenge: A European comparative perspective. J. Water Clim. Chang. 2015, 6, 1–8. [Google Scholar] [CrossRef]
  42. Wiering, M.; Green, C.; van Rijswick, M.; Priest, S.; Keessen, A. The rationales of resilience in English and Dutch flood risk policies. J. Water Clim. Chang. 2015, 6, 38–54. [Google Scholar] [CrossRef]
  43. Lu, X.; Chan, F.K.S.; Li, N.; Chen, C.; Chen, W.; Chan, H. Improving urban flood resilience via GDELT GKG analyses in China’s Sponge Cities. Sci. Rep. 2022, 12, 20317. [Google Scholar] [CrossRef]
  44. Lu, P.; Sun, Y.; Steffen, N. Scenario-based performance assessment of green-grey-blue infrastructure for flood-resilient spatial solution: A case study of Pazhou, Guangzhou, greater Bay area. Landsc. Urban Plan. 2023, 238, 104804. [Google Scholar] [CrossRef]
  45. Moghadas, M.; Asadzadeh, A.; Vafeidis, A.; Fekete, A.; Kötter, T. A multi-criteria approach for assessing urban flood resilience in Tehran, Iran. Int. J. Disaster Risk Reduct. 2019, 35, 101069. [Google Scholar] [CrossRef]
  46. Ji, J.; Chen, J. Urban flood resilience assessment using RAGA-PP and KL-TOPSIS model based on PSR framework: A case study of Jiangsu province, China. Water Sci. Technol. 2022, 86, 3264–3280. [Google Scholar] [CrossRef] [PubMed]
  47. Tavana, M.; Di Caprio, D.; Santos-Arteaga, F.J. An extended stochastic VIKOR model with decision maker’s attitude towards risk. Inf. Sci. 2018, 432, 301–318. [Google Scholar] [CrossRef]
  48. Liu, H.; Qiao, H.; Liu, S.; Wei, G.; Zhao, H.; Li, K.; Weng, F. Energy, environment and economy assessment of sewage sludge incineration technologies in China. Energy 2023, 264, 126294. [Google Scholar] [CrossRef]
  49. Xiang, C.; Qin, J.; Yin, L. Study on the rural ecotourism resource evaluation system. Environ. Technol. Innov. 2020, 20, 101131. [Google Scholar] [CrossRef]
  50. McPherson, S.; Reese, C.; Wendler, M.C. Methodology Update: Delphi Studies. Nurs. Res. 2018, 67, 404–410. [Google Scholar] [CrossRef]
  51. Jamali, A.; Robati, M.; Nikoomaram, H.; Farsad, F.; Aghamohammadi, H. Urban Resilience Assessment Using Hybrid MCDM Model Based on DEMATEL-ANP Method (DANP). J. Indian Soc. Remote Sens. 2023, 51, 893–915. [Google Scholar] [CrossRef]
  52. Asadzadeh, A.; Kötter, T.; Zebardast, E. An augmented approach for measurement of disaster resilience using connective factor analysis and analytic network process (F’ANP) model. Int. J. Disaster Risk Reduct. 2015, 14, 504–518. [Google Scholar] [CrossRef]
  53. Abdrabo, K.I.; Kantoush, S.A.; Esmaiel, A.; Saber, M.; Sumi, T.; Almamari, M.; Elboshy, B.; Ghoniem, S. An integrated indicator-based approach for constructing an urban flood vulnerability index as an urban decision-making tool using the PCA and AHP techniques: A case study of Alexandria, Egypt. Urban Clim. 2023, 48, 101426. [Google Scholar] [CrossRef]
  54. Yang, J.; Ding, Y.; Zhang, L. Conceptualizing and Measuring Megacity Resilience with an Integrated Approach: The Case of China. Sustainability 2022, 14, 11685. [Google Scholar] [CrossRef]
  55. Mabrouk, M.; Han, H. Urban resilience assessment: A multicriteria approach for identifying urban flood-exposed risky districts using multiple-criteria decision-making tools (MCDM). Int. J. Disaster Risk Reduct. 2023, 91, 103684. [Google Scholar] [CrossRef]
  56. Azareh, A.; Sardooi, E.R.; Choubin, B.; Barkhori, S.; Shahdadi, A.; Adamowski, J.; Shamshirband, S. Incorporating multi-criteria decision-making and fuzzy-value functions for flood susceptibility assessment. Geocarto Int. 2021, 36, 2345–2365. [Google Scholar] [CrossRef]
  57. Zheng, J.; Huang, G. Towards flood risk reduction: Commonalities and differences between urban flood resilience and risk based on a case study in the Pearl River Delta. Int. J. Disaster Risk Reduct. 2023, 86, 103568. [Google Scholar] [CrossRef]
  58. Jiao, L.; Wang, L.; Lu, H.; Fan, Y.; Zhang, Y.; Wu, Y. An assessment model for urban resilience based on the pressure-state-response framework and BP-GA neural network. Urban Clim. 2023, 49, 101543. [Google Scholar] [CrossRef]
  59. Parkouhi, S.V.; Ghadikolaei, A.S. A resilience approach for supplier selection: Using Fuzzy Analytic Network Process and grey VIKOR techniques. J. Clean. Prod. 2017, 161, 431–451. [Google Scholar] [CrossRef]
  60. Saaty, T.L. How to make a decision: The analytic hierarchy process. Eur. J. Oper. Res. 1990, 48, 9–26. [Google Scholar] [CrossRef]
  61. Zhu, S.; Li, D.; Huang, G.; Chhipi-Shrestha, G.; Nahiduzzaman, K.M.; Hewage, K.; Sadiq, R. Enhancing urban flood resilience: A holistic framework incorporating historic worst flood to Yangtze River Delta, China. Int. J. Disaster Risk Reduct. 2021, 61, 102355. [Google Scholar] [CrossRef]
  62. Ma, S.; Wang, R. The Social-Economic-Natural Complex Ecosystem. J. Ecol. 1984, 4, 1–9. [Google Scholar]
  63. Chen, X.; Guo, Z.; Zhou, H.; Qian, X.; Zhang, X. Urban Flood Resilience Assessment Based on VIKOR-GRA: A Case Study in Chongqing, China. Ksce J. Civ. Eng. 2022, 26, 4178–4194. [Google Scholar] [CrossRef]
  64. Rana, I.A.; Bhatti, S.S.; Jamshed, A.; Ahmad, S. An approach to understanding the intrinsic complexity of resilience against floods: Evidences from three urban communities of Pakistan. Int. J. Disaster Risk Reduct. 2021, 63, 102442. [Google Scholar] [CrossRef]
  65. Yang, Y.; Guo, H.; Wang, D.; Ke, X.; Li, S.; Huang, S. Flood vulnerability and resilience assessment in China based on super-efficiency DEA and SBM-DEA methods. J. Hydrol. 2021, 600, 126470. [Google Scholar] [CrossRef]
  66. Kotzee, I.; Reyers, B. Piloting a social-ecological index for measuring flood resilience: A composite index approach. Ecol. Indic. 2016, 60, 45–53. [Google Scholar] [CrossRef]
  67. Xu, W.; Zhong, M.; Hong, Y.; Lin, K. Enhancing community resilience to urban floods with a network structuring model. Saf. Sci. 2020, 127, 104699. [Google Scholar] [CrossRef]
  68. Yao, Z. Study on the Evaluation of Urban Resilience and Lift Path in Shanxi Province. Shanxi Univ. Financ. Econ. 2021. [Google Scholar] [CrossRef]
  69. Zhou, X.; Luo, W.; Shi, S. Evaluation and Empirical Study of Resilient City Construction Based on ESEF-TOPSIS Model. City 2023, 24–36. Available online: https://kns.cnki.net/kcms2/article/abstract?v=lQz6UQjnwp-jVvRLuU3icLAtq4Ee1umECIe7IzEzBAji6vzGPpbR_NvEXtWujhfw84aeR0kCGZ912LayORjDhb8oXMaNVHRQlozvWPbnd0cmnUYh4P40ahRFRMLAVt8E8nGs3BLMcx9uWkMVsS9r_A==&uniplatform=NZKPT&language=CHS (accessed on 18 May 2024).
  70. He, L.; Chen, J.; Cheng, C.; Yuan, J. Assessment and spatiotemporal analysis of flood vulnerability in the Yangtze River Economic Belt. Water Resour. Hydropower Eng. 2023, 1–16. [Google Scholar] [CrossRef]
  71. Zhu, S.; Li, D.; Feng, H.; Zhang, N. The influencing factors and mechanisms for urban flood resilience in China: From the perspective of social-economic-natural complex ecosystem. Ecol. Indic. 2023, 147, 109959. [Google Scholar] [CrossRef]
  72. Müller, A.; Reiter, J.; Weiland, U. Assessment of urban vulnerability towards floods using an indicator-based approach—A case study for Santiago de Chile. Nat. Hazards Earth Syst. Sci. 2011, 11, 2107–2123. [Google Scholar] [CrossRef]
  73. Xiong, Q. Assessment of Urban Resilience and its Spatial-Temporal Evolution: A Case of Hubei Province. Hubei Univ. Technol. 2021. [Google Scholar] [CrossRef]
  74. Rezende, O.M.; de Franco, A.; de Oliveira, A.K.B.; Pitzer Jacob, A.C.; Miguez, M.G. A framework to introduce urban flood resilience into the design of flood control alternatives. J. Hydrol. 2019, 576, 478–493. [Google Scholar] [CrossRef]
  75. Xu, T.; Xie, Z.; Jiang, F.; Yang, S.; Deng, Z.; Zhao, L.; Wen, G.; Du, Q. Urban flooding resilience evaluation with coupled rainfall and flooding models: A small area in Kunming City, China as an example. Water Sci. Technol. 2023, 87, 2820–2839. [Google Scholar] [CrossRef] [PubMed]
  76. Morris, A.; Patsakis, C.; Bouroche, M.; Cahill, V. Context dissemination for dynamic urban-scale applications. Mob. Netw. Appl. 2017, 22, 305–317. [Google Scholar] [CrossRef]
  77. He, S.; Liang, S.; Wu, S.; Guo, H. Analysis on Spatio-temporal Evolution and Relevance of Urban Flood Disaster Resilience in Yangtze River Delta. Resour. Environ. Yangtze Basin 2022, 31, 1988–1999. [Google Scholar]
  78. Huang, J.; She, J. Flood Vulnerability Assessment and Analysis of Influencing Factors in the Yangtze River Delta Urban Agglomeration. J. Hohai Univ. (Philos. Soc. Sci. Ed.) 2020, 22, 39–45. [Google Scholar]
  79. Song, S.; Wang, D.; Zhu, W.; Wang, C. Study on the spatial configuration of nursing homes for the elderly people in Shanghai: Based on their choice preference. Technol. Forecast. Soc. Chang. 2020, 152, 119859. [Google Scholar] [CrossRef]
  80. Ye, C.; Zhu, J.; Li, S.; Yang, S.; Chen, M. Assessment and analysis of regional economic collaborative development within an urban agglomeration: Yangtze River Delta as a case study. Habitat Int. 2019, 83, 20–29. [Google Scholar] [CrossRef]
  81. Huang, J.; She, J.; Yuan, X.; Wang, H. Simulation of Urban Flood Resilience Based on A System Dynamic Model: A Case Study in Nanjing. Resour. Environ. Yangtze Basin 2020, 29, 2519–2529. [Google Scholar]
  82. Li, D.; Nie, X.; Zhu, S.; Zhou, S. Quantitative Evaluation and Spatial-temporal Evolution of County-level Flood Resilience: A Case Study of Jiangsu Province. J. Catastrophology 2023, 38, 99–106. [Google Scholar]
Figure 1. Research framework.
Water 16 01614 g001
Figure 2. Overview map of the study area.
Water 16 01614 g002
Figure 3. Trend of flood resilience in Nanjing from 2010 to 2021.
Water 16 01614 g003
Figure 4. Evaluation results of flood resilience in Nanjing.
Water 16 01614 g004
Figure 5. Four-dimensional resilience evolutionary trends map.
Water 16 01614 g005
Figure 6. Criterion layer obstacle factor.
Water 16 01614 g006
Figure 7. Hotspot map of flood resilience barrier factors in Nanjing.
Water 16 01614 g007
Table 3. Evaluation system of urban flood resilience.
DimensionIndicatorIndicator PropertiesSymbolReference
Economic factorsGDP per capita+A1[37,63]
Fixed asset investment+A2[24,25]
Per capita disposable income+A3[24,26,63]
Social security and employment expenditure+A4[36,64]
Social factorsPopulation densityB1[63]
Average number of college students per 10,000 population+B2[45]
Drainage pipe density+B3[24]
Number of health workers per 10,000 population+B4[37,63]
Number of hospital beds+B5[24,45]
Ecological factorsRainfallC1[35,36,65]
Domestic waste harmless treatment rate+C2[4]
Green coverage rate of built district+C3[37,45]
Management factorsFlood dynamic monitoring accuracy+D1[25]
Flood emergency plan+D2[45,66]
Public disaster emergency awareness+D3[37,64]
Disaster relief response speed+D4[66,67]
Table 4. Indicators’ weight.
DimensionIndicatorWAjWSjWj
Economics factor
(0.301)
A1 GDP per capita0.0870.0620.075
A2 fixed asset investment0.1360.0350.085
A3 Per capita disposable income0.0460.0650.056
A4 Social security and employment expenditure0.0980.0730.086
Social factor
(0.299)
B1 Population density0.0970.0640.080
B2 Average number of college students per 10,000 population0.0170.1040.060
B3 Drainage pipe density0.0560.0510.054
B4 Number of health workers per 10,000 population0.0610.0770.069
B5 Number of hospital beds0.0240.0480.036
Ecological factors
(0.174)
C1 Rainfall0.0970.0500.074
C2 Domestic waste harmless treatment rate0.0300.0330.032
C3 Green coverage rate of built district0.0650.0720.069
Management factors
(0.226)
D1 Flood dynamic monitoring accuracy0.0190.0510.035
D2 Flood emergency plan0.0770.0610.069
D3 Public disaster emergency awareness0.0420.0900.066
D4 Disaster relief response speed0.0480.0650.056
Table 5. Resilience level classification.
Resilience LevelLowSlightly LowModerateSlightly HighHigh
grade12345
Ci[0, 0.3)[0.3, 0.5)[0.5, 0.65)[0.65, 0.85)[0.85, 1]
Table 6. Four-dimensional resilience measure value.
YearEconomic ResilienceSocial ResilienceEcological ResilienceManagement Resilience
20100.0000.1500.3440.082
20110.1140.1840.4680.116
20120.2300.3500.4100.186
20130.3150.3730.4250.255
20140.3750.3720.3960.338
20150.4530.3780.3890.457
20160.5050.4240.4760.441
20170.5740.4480.6860.719
20180.6790.5170.7270.720
20190.7940.6241.0000.829
20200.8780.7100.5900.932
20211.0000.7110.7011.000
Table 7. Criterion layer obstacle factor obstacle degree.
YearObstacle Degree (%)
Economic FactorSocial FactorEcological FactorManagement Factor
201033.6529.4713.1623.72
201132.6030.9911.1525.26
201231.9926.4414.3427.24
201330.1226.4515.4028.04
201428.2327.9717.5426.25
201526.0730.0321.5922.31
201623.9828.7419.3927.89
201734.2037.6912.9315.18
201830.8341.2913.0714.81
201931.1554.030.0014.82
202017.5943.4533.825.13
20210.0062.1637.840.00
Table 8. Main obstacle factors of the index layer.
Obstacle Factor
Ranking
Obstacle Degree in Different Years
2010 2011 2012 2013 2014 2015 2016 2017 2018 2019 2020 2021
1A4A4A4A4A4C1C1A2B1B1B1B1
2A2B4C3C3C3B2D2B2C1B2C1C1
3A1A1B4B4B2A4A4B1B2A2C3C3
4B1D3A1D3B4B4B2B4A2A1A1-
5D3A2D3A1D3D3B4C1D3A4A2-
Disclaimer/Publisher’s Note: The statements, opinions and data contained in all publications are solely those of the individual author(s) and contributor(s) and not of MDPI and/or the editor(s). MDPI and/or the editor(s) disclaim responsibility for any injury to people or property resulting from any ideas, methods, instructions or products referred to in the content.

