
Factors Controlling the Formation and Evolution of a Beach Zone in Front of a Coastal Cliff: The Case of the East Coast of Evia Island in the Aegean Sea, Eastern Mediterranean

Abstract
:1. Introduction
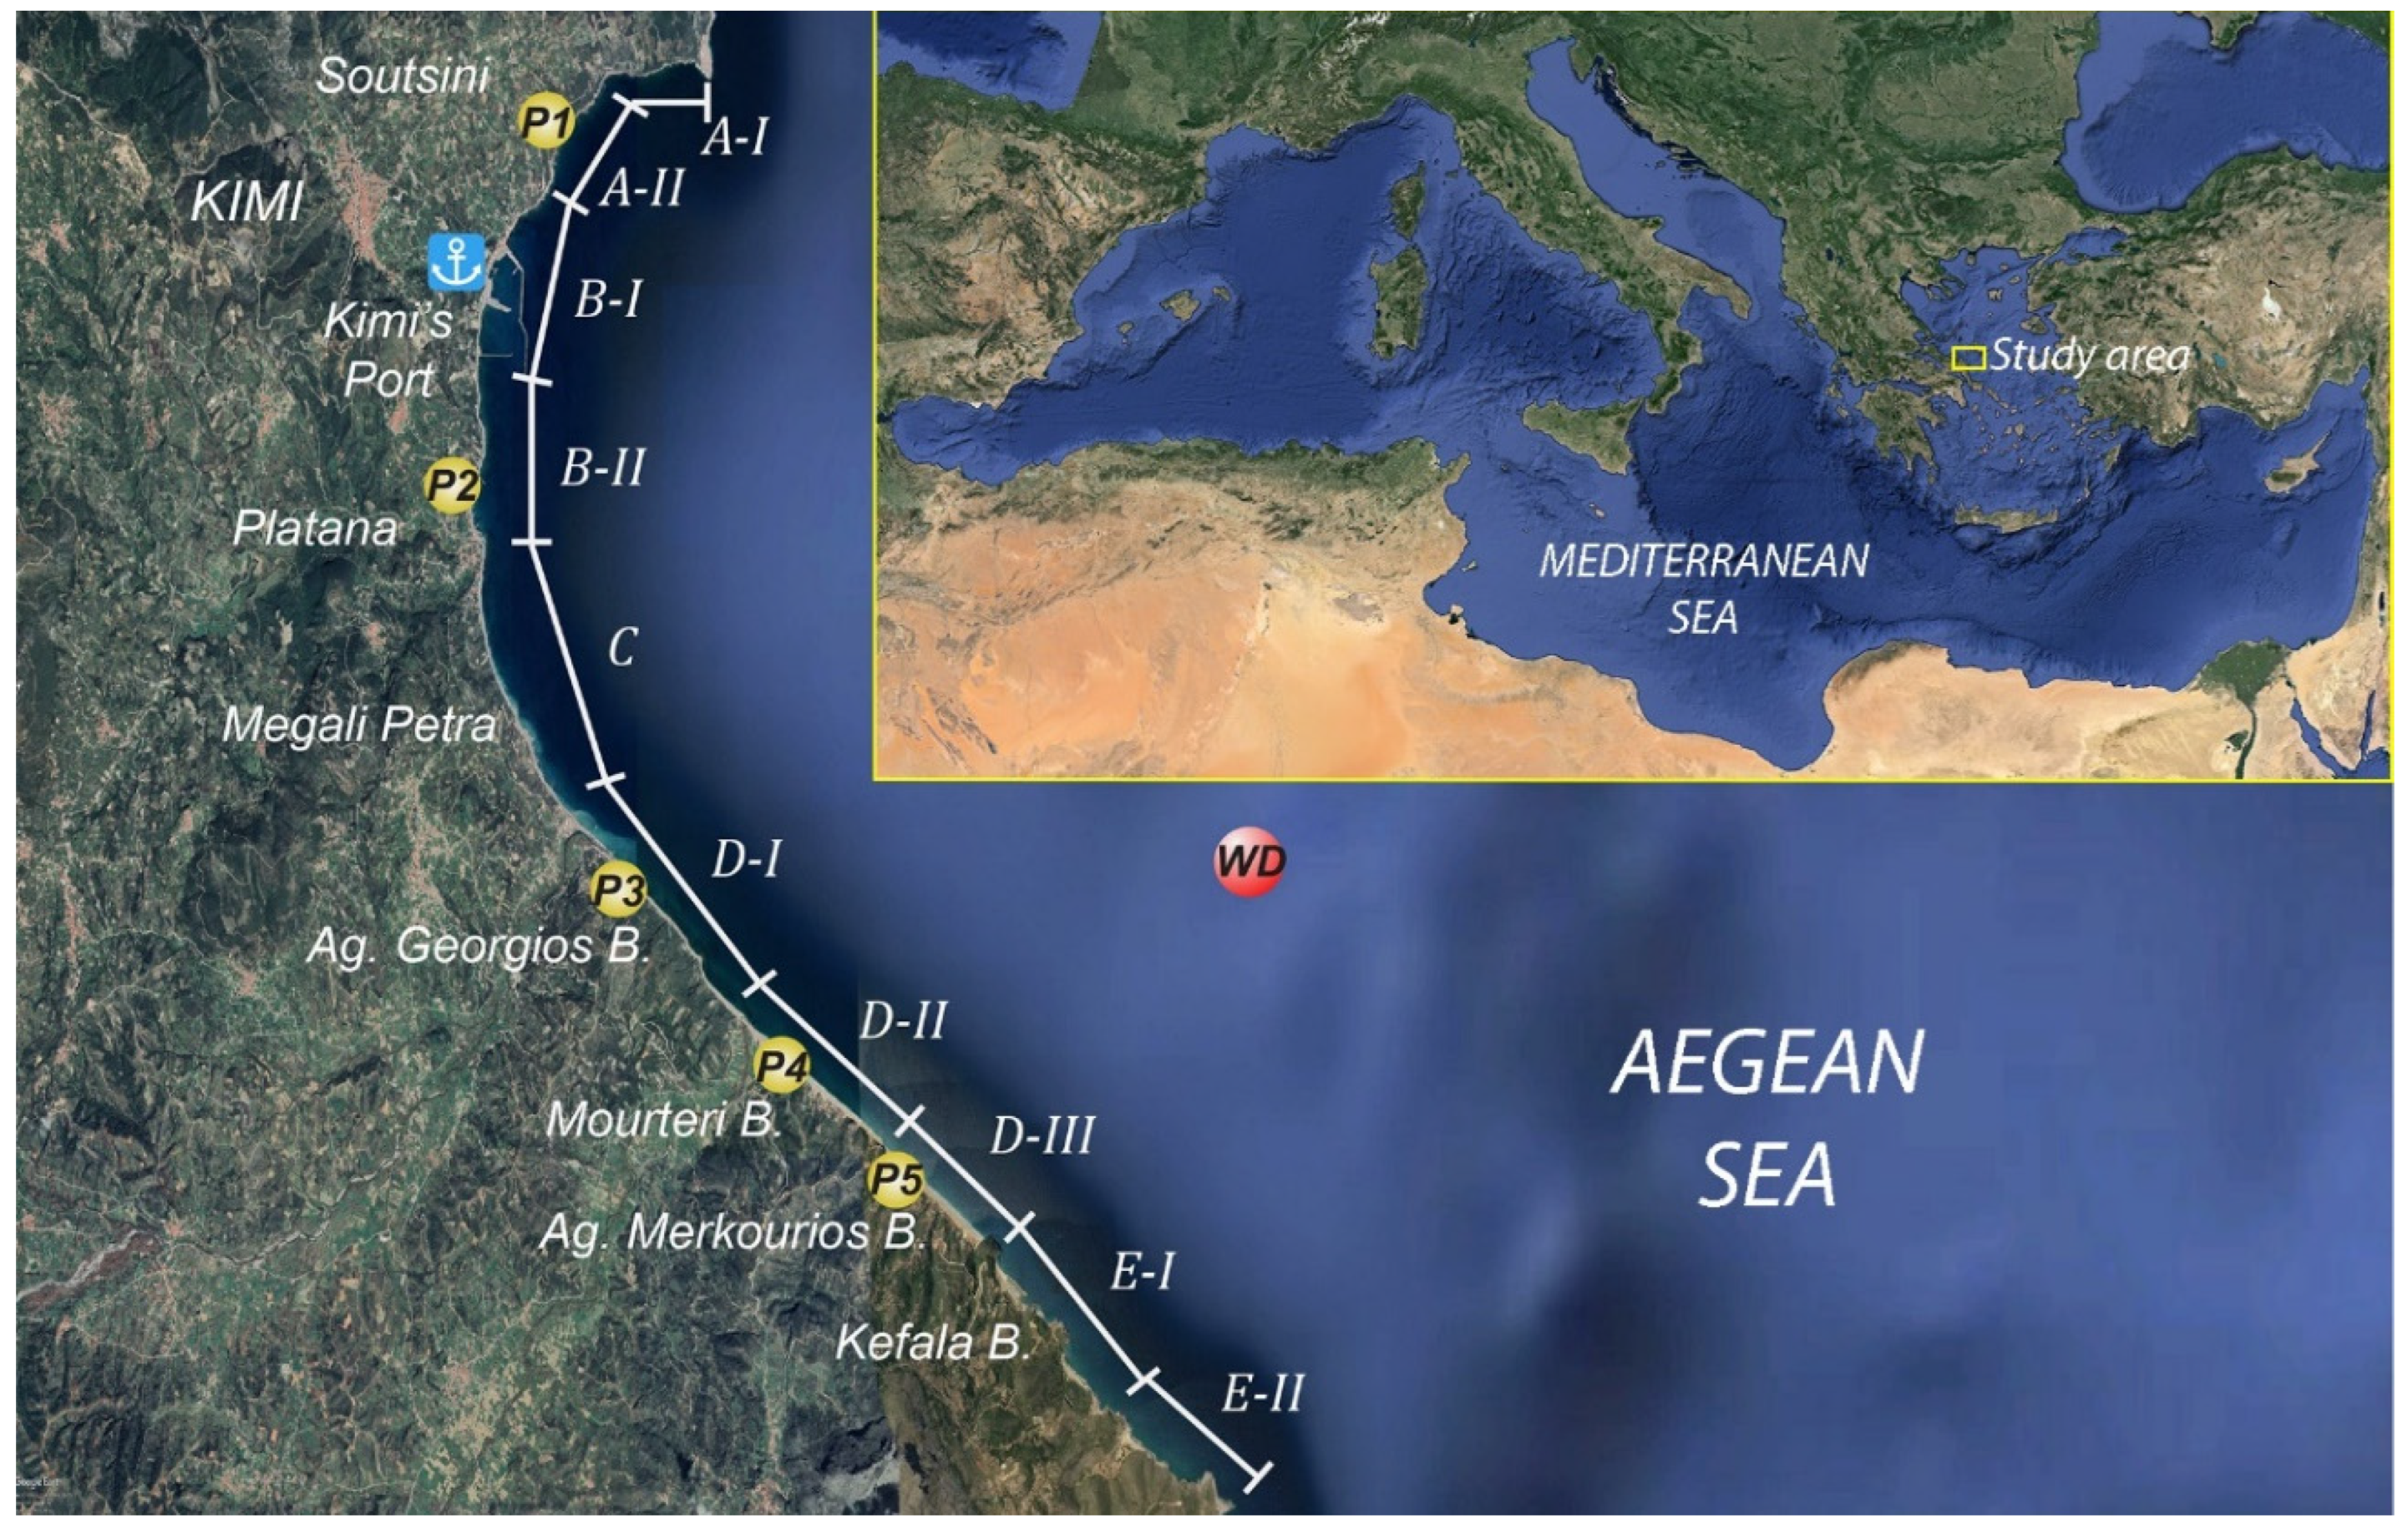
2. Study Area
3. Materials and Methods
3.1. Nearshore Hydrodynamics
3.2. Beach Morphology and Granulometry
3.3. Coastline Displacement
4. Results
4.1. Nearshore Hydrodynamics
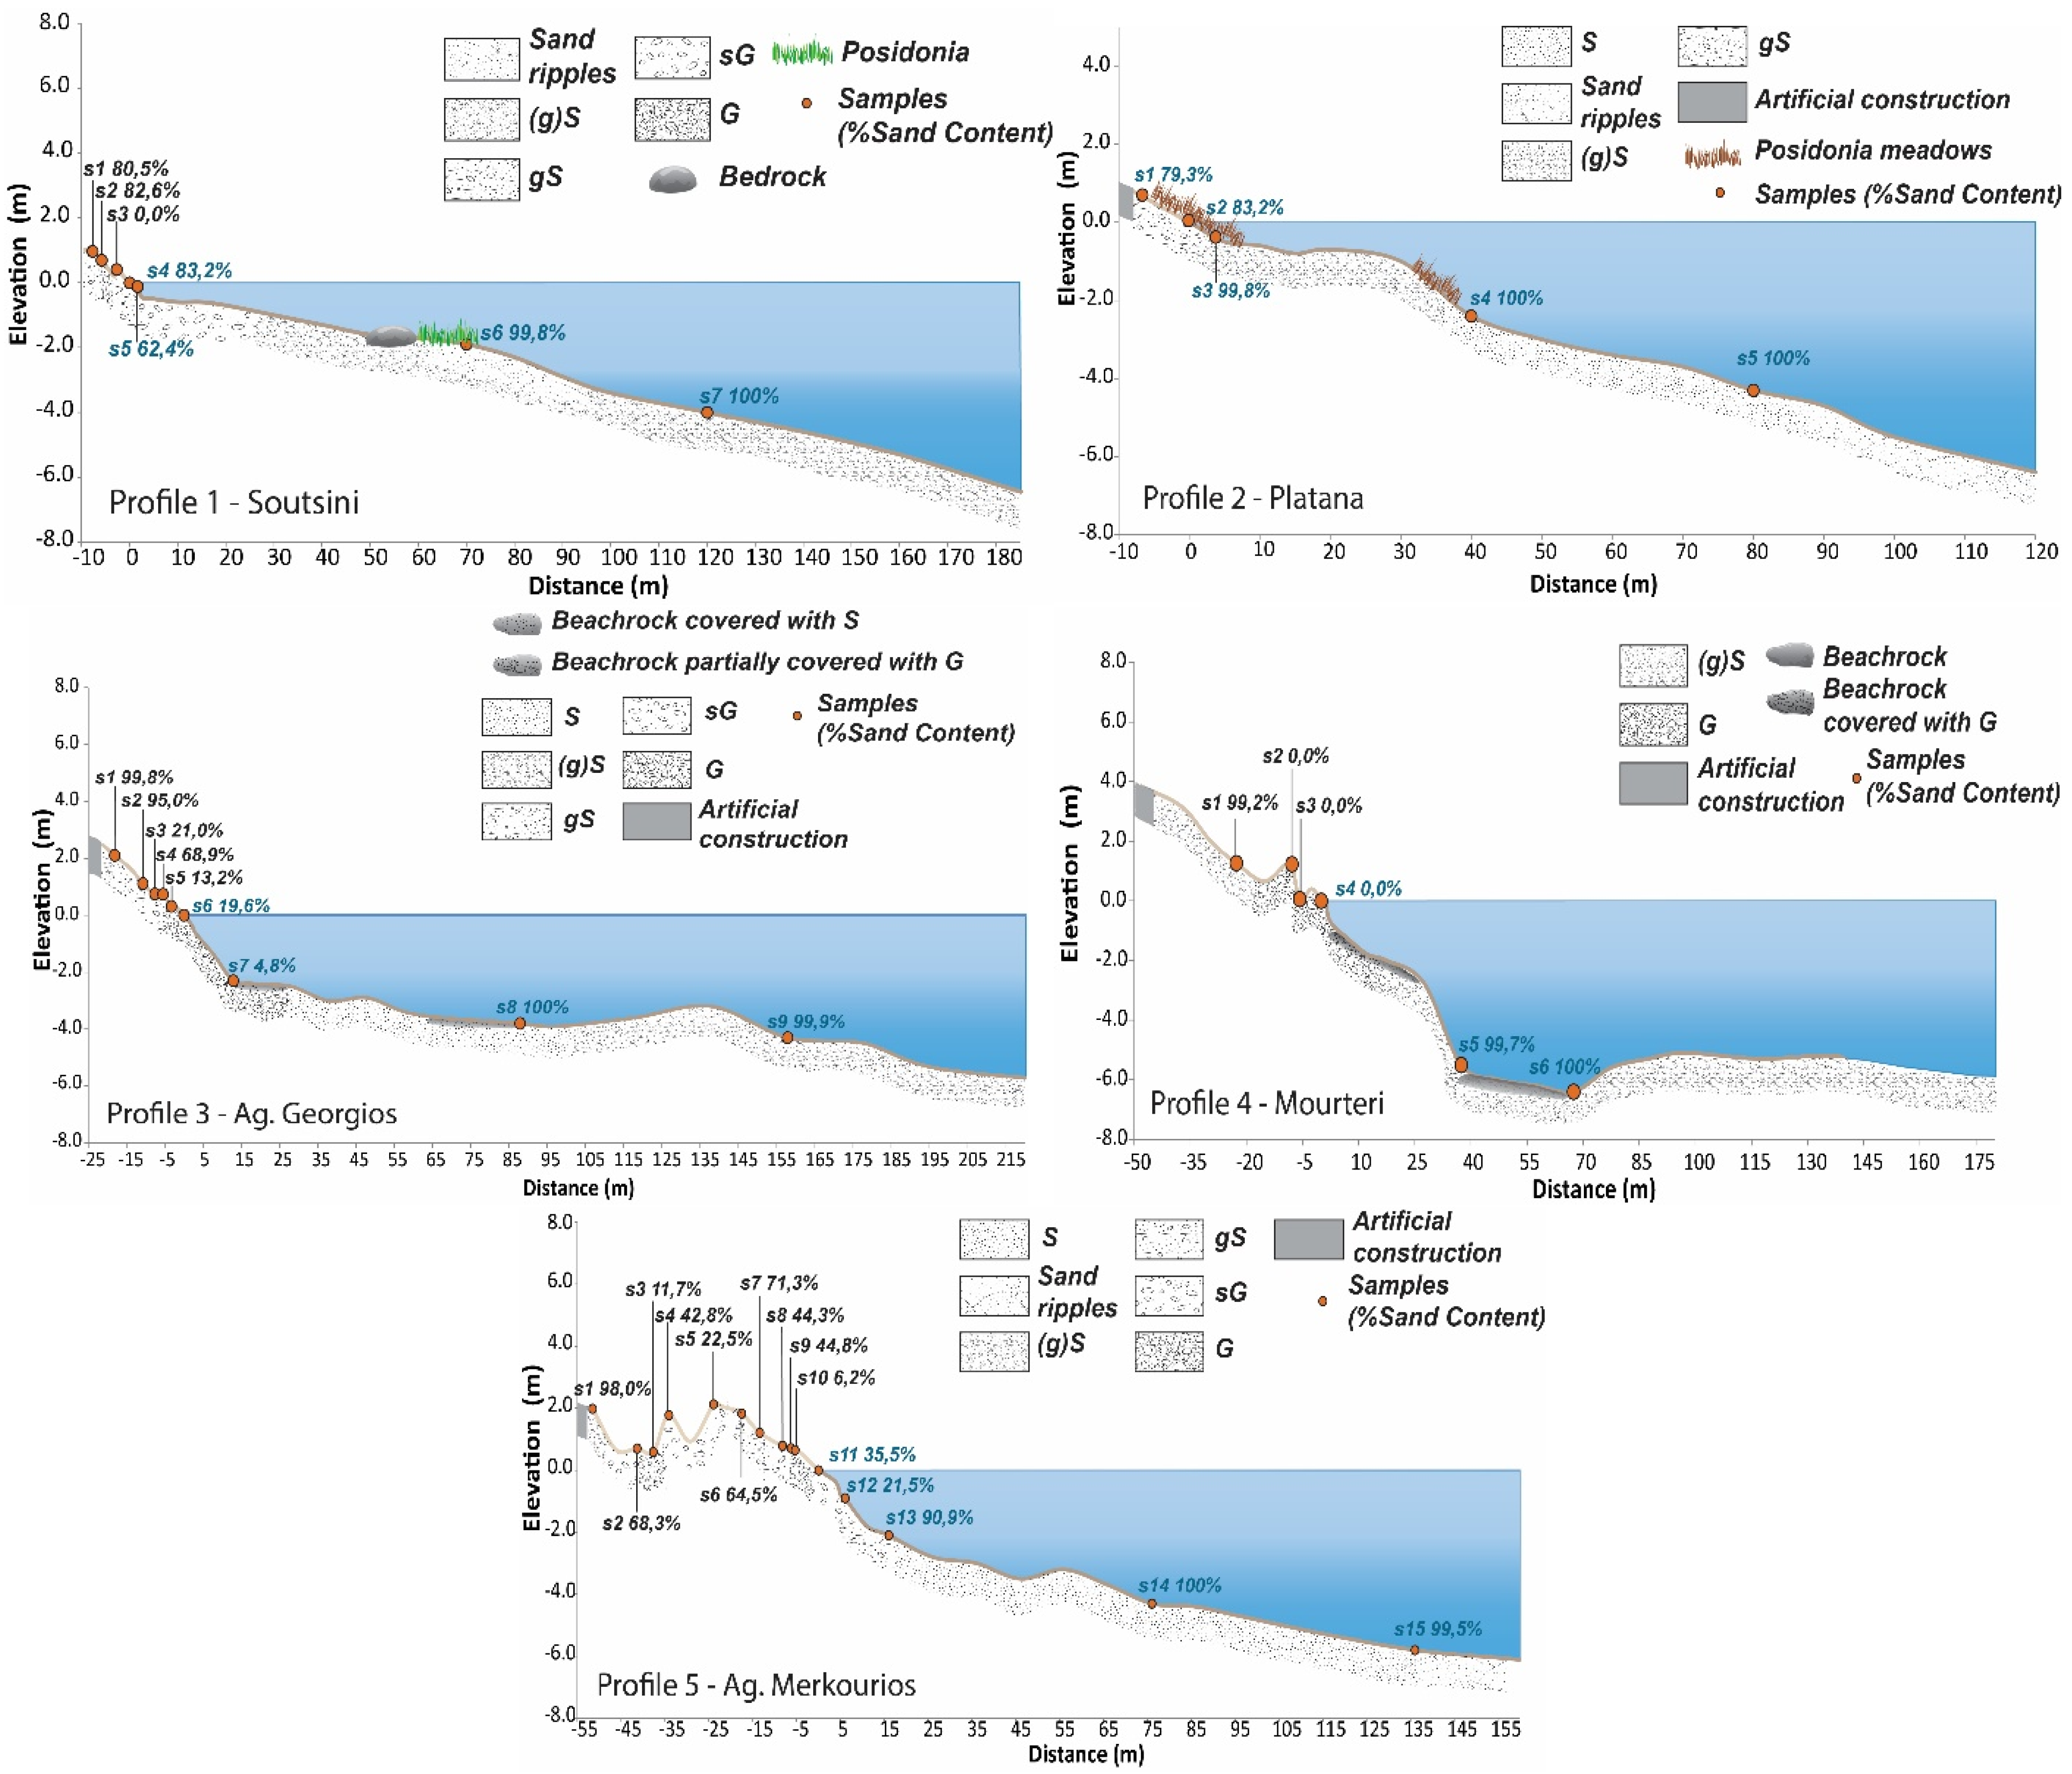
4.2. Beach Profiles
4.3. Sediment Budget
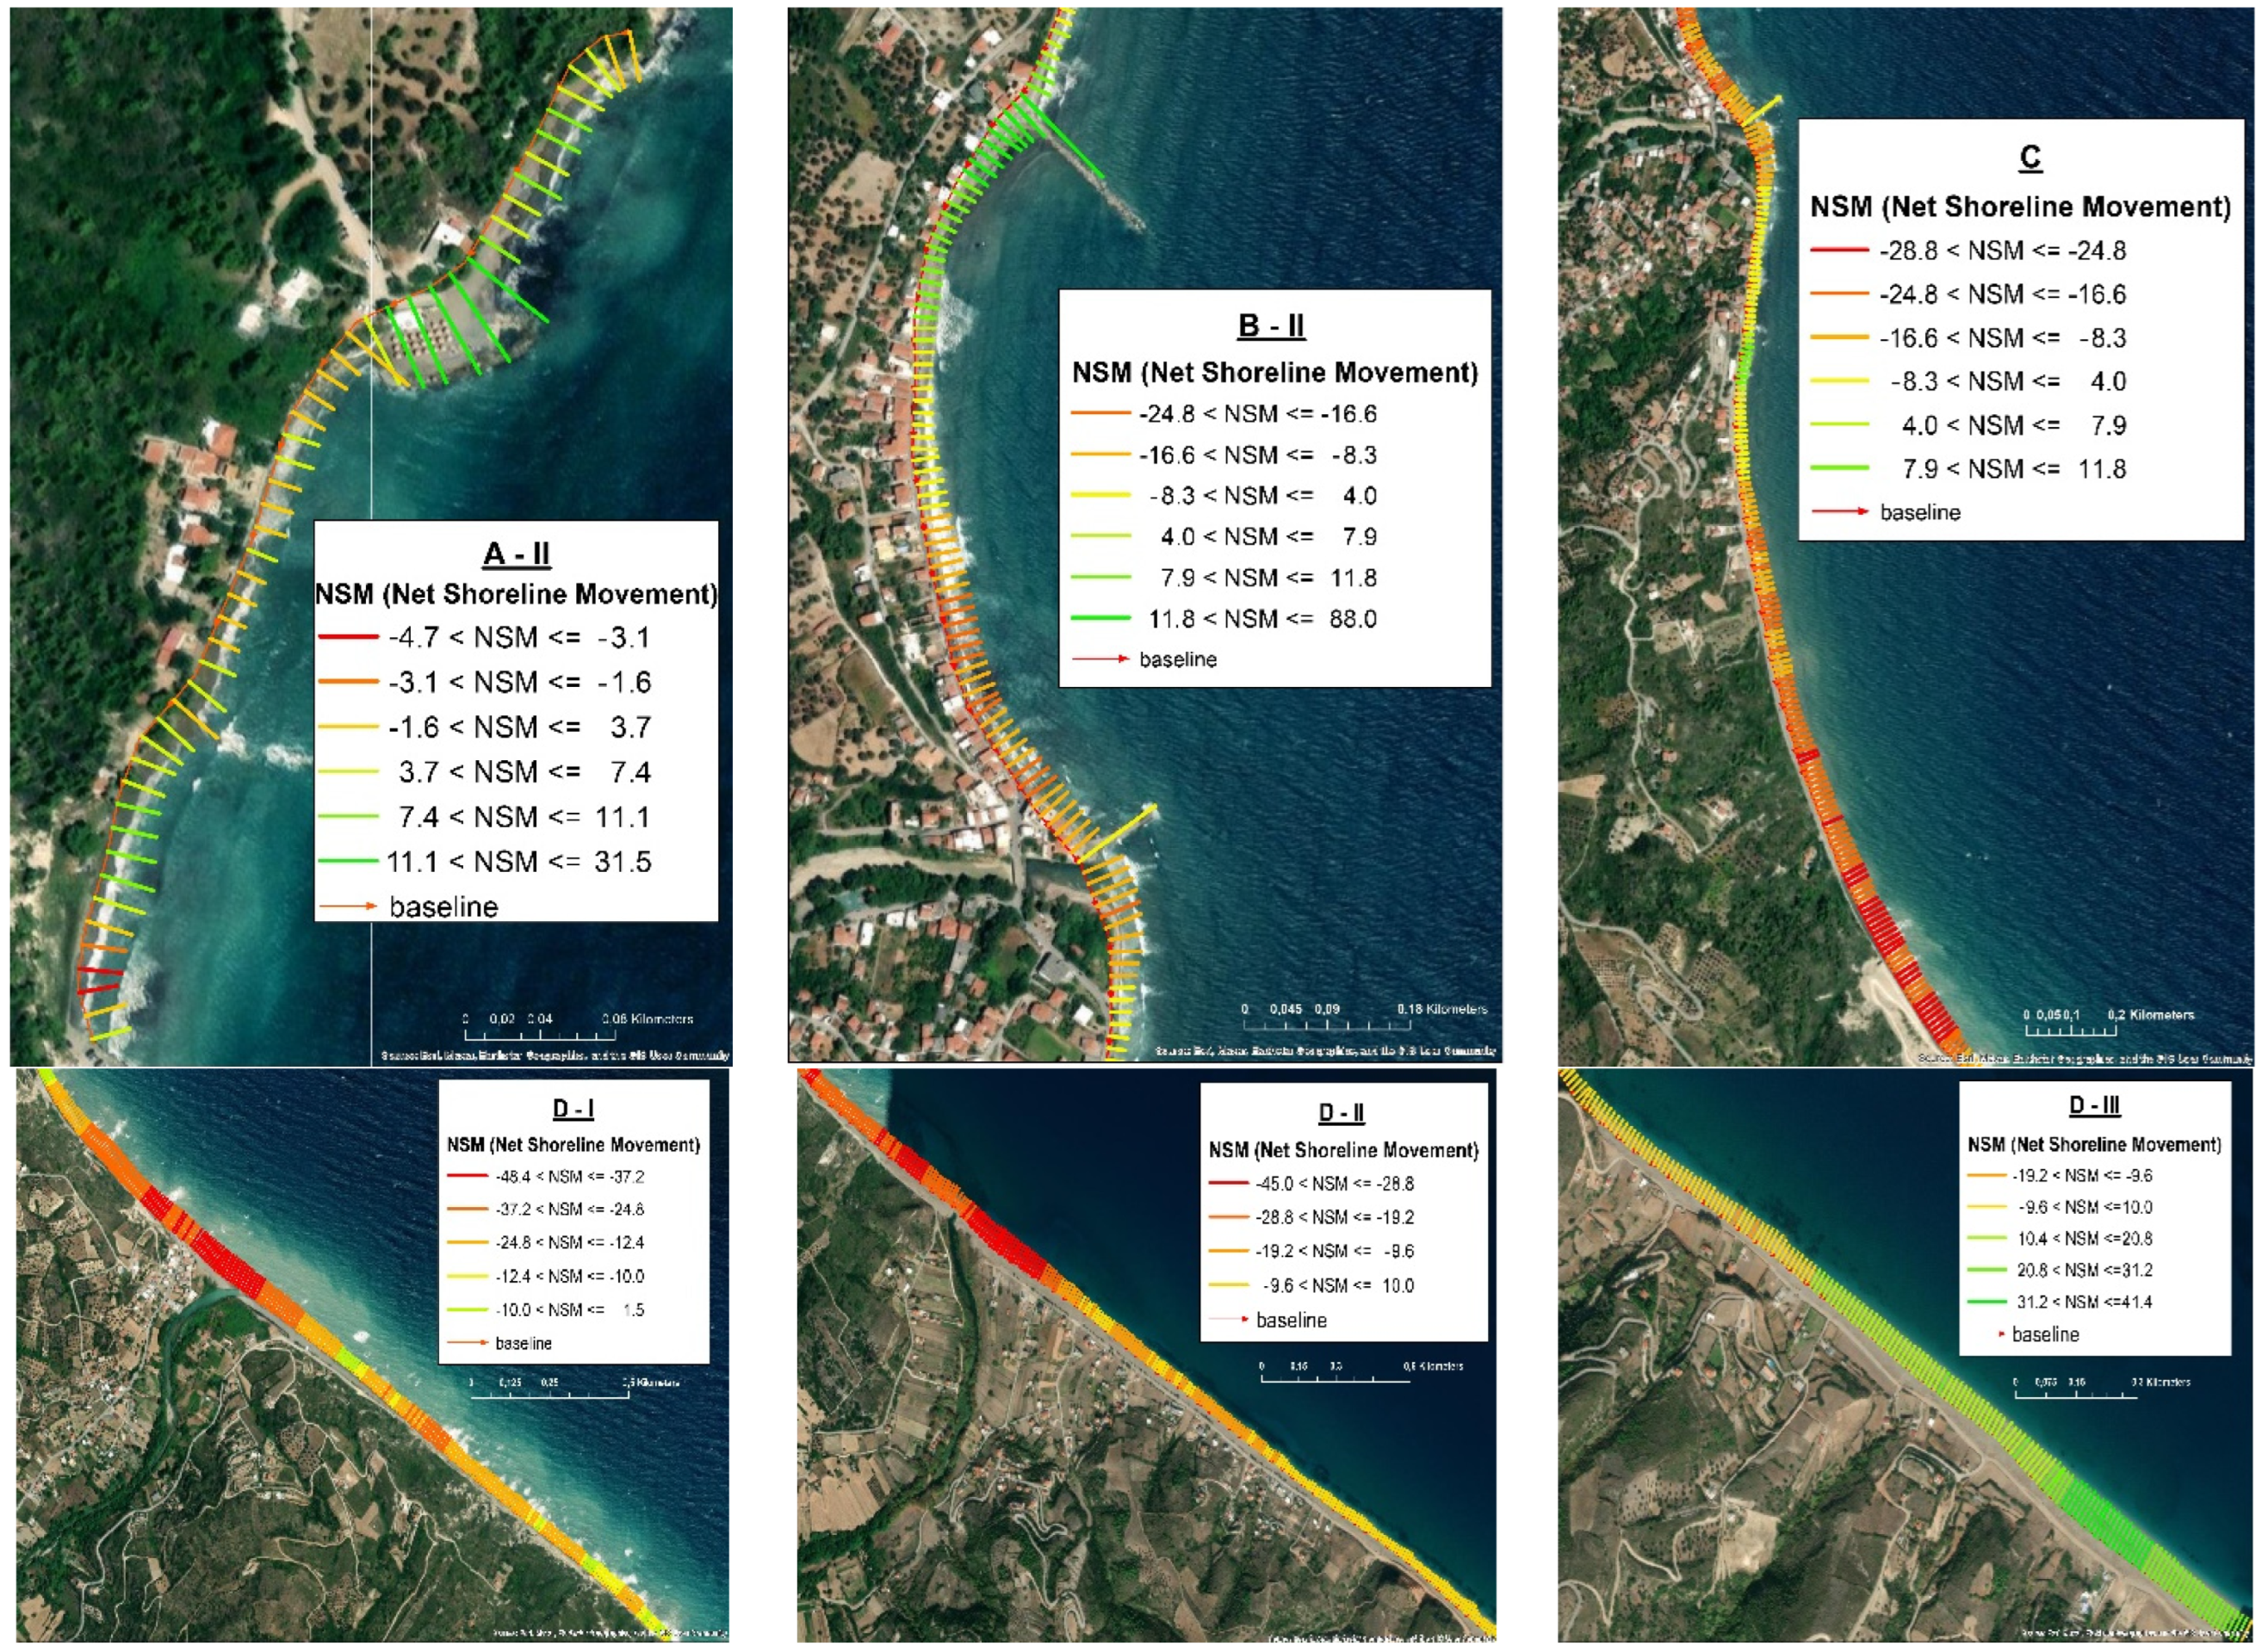
4.4. Recent Coastal Evolution
5. Discussion
5.1. Factors Controlling Coastal Evolution
5.2. Coastal Evolution
6. Conclusions
Author Contributions
Funding
Data Availability Statement
Conflicts of Interest
Appendix A

| Sectors | Samples | ELV (m) | Mz (mm) | D50 (mm) | S (%) | Type |
|---|---|---|---|---|---|---|
| A-II (Profile 1) | s1 | 1.4 | 8.266 | 8.942 | 2.7 | G |
| s2 | 1.2 | 6.504 | 6.240 | 0.6 | G | |
| s3 | 0.8 | 13.050 | 21.234 | 0.0 | G | |
| s4 | 0.4 | 14.227 | 13.390 | 0.0 | G | |
| s5 | 0.2 | 9.070 | 9.316 | 0.0 | G | |
| s6 | 0.0 | 4.525 | 4.737 | 0.4 | G | |
| s7 | −4.2 | 0.318 | 0.334 | 99.9 | S | |
| s8 | −6.0 | 0.234 | 0.233 | 99.9 | S | |
| B-I (Profile 2) | s1 | 0.5 | 0.350 | 0.352 | 79.3 | gS |
| s2 | 0.0 | 0.670 | 0.445 | 83.2 | gS | |
| s3 | −0.6 | 0.250 | 0.244 | 99.8 | (g)S | |
| s4 | −2.0 | 0.181 | 0.181 | 100 | S | |
| s5 | −4.0 | 0.195 | 0.190 | 100 | S | |
| D-III (Profile 3) | s1 | 2.1 | 0.605 | 0.641 | 99.8 | (g)S |
| s2 | 1.1 | 0.490 | 0.481 | 95.0 | gS | |
| s3 | 0.7 | 4.227 | 20.972 | 21.0 | sG | |
| s4 | 0.7 | 1.743 | 0.851 | 68.9 | sG | |
| s5 | 0.3 | 4.942 | 5.059 | 13.2 | G | |
| s6 | 0.0 | 4.123 | 4.545 | 19.6 | G | |
| s7 | −2.3 | 6.991 | 23.249 | 4.8 | G | |
| s8 | −3.8 | 0.299 | 0.317 | 100 | S | |
| s9 | −6.0 | 0.390 | 0.372 | 99.9 | (g)S | |
| D-II (Profile 4) | s1 | 3.3 | 0.856 | 0.782 | 87.8 | gS |
| s2 | 2.2 | 5.611 | 16.686 | 34.7 | sG | |
| s3 | 1.7 | 4.717 | 3.036 | 22.3 | sG | |
| s4 | 0.9 | 6.519 | 5.757 | 7.5 | G | |
| s5 | 0.6 | 2.207 | 2.025 | 49.3 | sG | |
| s6 | 0.6 | 7.729 | 7.898 | 0.2 | G | |
| s7 | 0.3 | 3.754 | 3.371 | 0.2 | G | |
| s8 | 0.0 | 2.752 | 2.603 | 32.7 | sG | |
| s9 | −2.3 | 5.202 | 4.333 | 7.4 | G | |
| s10 | −4.0 | 0.572 | 0.611 | 99.8 | (g)S | |
| s11 | −6.0 | 0.320 | 0.335 | 100.0 | S | |
| D-II (Profile 5) | s1 | 2.0 | 0.973 | 1.018 | 98.0 | (g)S |
| s2 | 0.7 | 2.190 | 1.378 | 68.3 | sG | |
| s3 | 0.6 | 5.164 | 3.488 | 11.7 | G | |
| s4 | 1.8 | 1.657 | 2.223 | 42.8 | sG | |
| s5 | 2.1 | 6.838 | 15.863 | 22.5 | sG | |
| s6 | 1.8 | 1.356 | 1.091 | 64.5 | sG | |
| S7 | 1.2 | 1.716 | 1.617 | 71.3 | gS | |
| s8 | 0.8 | 2.985 | 2.323 | 44.3 | sG | |
| s9 | 0.7 | 2.068 | 2.134 | 44.8 | sG | |
| s10 | 0.6 | 5.548 | 5.730 | 6.2 | G | |
| s11 | 0.0 | 2.480 | 2.612 | 25.5 | sG | |
| s12 | −0.9 | 4.479 | 4.214 | 21.5 | sG | |
| s13 | −2.1 | 0.669 | 0.851 | 90.9 | gS | |
| s14 | −4.3 | 0.454 | 0.450 | 100.0 | S | |
| s15 | −5.8 | 0.152 | 0.143 | 99.5 | S |
References
- Lambeck, K. Sea-level change and shore-line evolution in Aegean Greece since Upper Palaeolithic time. Antiquity 1996, 70, 588–611. [Google Scholar] [CrossRef]
- Lambeck, K.; Purcell, A. Sea-level change in the Mediterranean Sea since the LGM: Model predictions for tectonically stable areas. Quat. Sci. Rev. 2005, 24, 1969–1988. [Google Scholar] [CrossRef]
- Poulos, S.E.; Ghionis, G.; Maroukian, H. Sea-level rise trends in the Attico–Cycladic region (Aegean Sea) during the last 5000 years. Geomorphology 2009, 107, 10–17. [Google Scholar] [CrossRef]
- Kolaiti, E.; Mourtzas, N. Late Holocene relative sea-level changes and coastal landscape readings in the island group of Mykonos, Delos, and Rheneia (Cyclades, Greece). Mediterr. Geosci. Rev. 2023, 5, 99–128. [Google Scholar] [CrossRef]
- Woodroffe, C.D.; Thom, B.G.; Chappell, J. Development of widespread mangrove swamps in mid-Holocene times in northern Australia. Nature 1985, 317, 711–713. [Google Scholar] [CrossRef]
- Stapor, F.W., Jr.; Stone, G.W. A new depositional model for the buried 4000 yr BP New Orleans barrier: Implications for sea-level fluc tuations and onshore transport from a nearshore shelf source. Mar Geol. 2004, 204, 215–234. [Google Scholar] [CrossRef]
- Harvey, N.; Nicholls, R. Global sea-level rise and coastal vulnerability. Sustain. Sci. 2008, 3, 5–7. [Google Scholar] [CrossRef]
- Regard, V.; Prémaillon, M.; Dewez, T.J.B.; Carretier, S.; Jeandel, C.; Godderis, Y.; Bonnet, S.; Schott, J.; Pedoja, K.; Martinod, J.; et al. Rock coast erosion: An overlooked source of sediments to the ocean. Europe as an example. Earth Planet. Sci. Lett. 2022, 579, 117356. [Google Scholar] [CrossRef]
- Dawson, R.J.; Dickson, M.E.; Nicholls, R.J.; Hall, J.W.; Walkden, M.J.; Stansby, P.K.; Mokrech, M.; Richards, J.; Zhou, J.; Milligan, J.; et al. Integrated analysis of risks of coastal flooding and cliff erosion under scenarios of long term change. Clim. Change 2009, 95, 249–288. [Google Scholar] [CrossRef]
- Budetta, P.; Galietta, G.; Santo, A. A methodology for the study of the relation between coastal cliff erosion and the mechanical strength of soils and rock masses. Eng. Geol. 2000, 56, 243–256. [Google Scholar] [CrossRef]
- Kirk, R.M.; Komar, P.D.; Allan, J.C.; Stephenson, W.J. Shoreline erosion on Lake Hawea, New Zealand, caused by high lake levels and storm-wave runup. J. Coast. Res. 2000, 16, 346–356. [Google Scholar]
- Hapke, C.J.; Reid, D.; Richmond, B. Rates and trends of coastal change in California and the regional behavior of the beach and cliff system. J. Coast. Res. 2009, 25, 603–615. [Google Scholar] [CrossRef]
- Earlie, C.; Masselink, G.; Russell, P. The role of beach morphology on coastal cliff erosion under extreme waves. Earth Surf. Process. Landf. 2018, 43, 1213–1228. [Google Scholar] [CrossRef]
- Mushkin, A.; Katz, O.; Porat, N. Overestimation of short-term coastal cliff retreat rates in the eastern Mediterranean resolved with a sediment budget approach. Earth Surf. Process. Landf. 2019, 44, 179–190. [Google Scholar] [CrossRef]
- Barkai, O.; Katz, O.; Mushkin, A.; Goodman-Tchernov, B.N. Long-term retreat rates of Israel’s Mediterranean Sea cliffs inferred from reconstruction of eroded archaeological sites. Geoarchaeology 2018, 33, 314–327. [Google Scholar] [CrossRef]
- Sytnik, O.; Del Río, L.; Greggio, N.; Bonetti, J. Historical shoreline trend analysis and drivers of coastal change along the Ravenna coast, NE Adriatic. Environ. Earth Sci. 2018, 77, 779. [Google Scholar] [CrossRef]
- Giuliano, J.; Dewez, T.J.; Lebourg, T.; Godard, V.; Prémaillon, M.; Marçot, N. Mapping Coastal Erosion of a Mediterranean Cliff with a Boat-Borne Laser Scanner: Performance, Processing, and Cliff Erosion Rate. In 3D Digital Geological Models: From Terrestrial Outcrops to Planetary Surfaces; Wiley: Hoboken, NJ, USA, 2022; pp. 109–132. [Google Scholar]
- Theodore, P.; Thomas, H.; Adonis, V.; Theophanis, K.; Emmanouel, O.; Charalampos, D. Erosion status of a sea cliff promontory bounding an ecologically important beach. J. Coast. Conserv. 2020, 24, 39. [Google Scholar] [CrossRef]
- Vandarakis, D.; Poulos, S.; Karditsa, A.; Petrakis, S.; Alexandrakis, G.; Malliouri, D.; Hatiris, G.-A.; Moraitis, V.; Kikaki, K.; Anagnostou, C.; et al. Geomorphology and Dynamics of the Aegean Coasts. In The Handbook of Environmental Chemistry; Springer: Berlin/Heidelberg, Germany, 2024. [Google Scholar] [CrossRef]
- Dornbusch, U.; Williams, R.B.; Moses, C.A.; Robinson, D.A. Foreshore narrowing along the coast of southeast England, UK—A reevaluation. J. Coast. Res. 2008, 24, 14–24. [Google Scholar] [CrossRef]
- Lee, E.M. Coastal cliff behaviour: Observations on the relationship between beach levels and recession rates. Geomorphology 2008, 101, 558–571. [Google Scholar] [CrossRef]
- Sunamura, T. Processes of sea cliff and platform erosion. In Handbook of Coastal Processes and Erosion; Chapter 12; Komar, P.D., Ed.; CRC Press: Boca Raton, FL, USA, 2018. [Google Scholar]
- Terefenko, P.; Giza, A.; Paprotny, D.; Kubicki, A.; Winowski, M. Cliff retreat induced by series of storms at Międzyzdroje (Poland). J. Coast. Res. 2018, 85, 181–185. [Google Scholar] [CrossRef]
- Vousdoukas, M.I.; Velegrakis, A.F.; Plomaritis, T.A. Beachrock occurrence, characteristics, formation mechanisms and impacts. Earth-Sci. Rev. 2007, 85, 23–46. [Google Scholar] [CrossRef]
- Danjo, T.; Kawasaki, S. Characteristics of Beachrocks: A Review. Geotech. Coast. Eng. 2014, 32, 215–246. [Google Scholar] [CrossRef]
- Kelletat, D. Beachrock as sea-level indicator? Remarks from a geomorphological point of view. J. Coast. Res. 2006, 22, 1555–1564. [Google Scholar] [CrossRef]
- Desruelles, S.; Fouache, É.; Ciner, A.; Dalongeville, R.; Pavlopoulos, K.; Kosun, E.; Coquinot, Y.; Potdevin, J.L. Beachrocks and sea level changes since Middle Holocene: Comparison between the insular group of Mykonos–Delos–Rhenia (Cyclades, Greece) and the southern coast of Turkey. Glob. Planet. Change 2009, 66, 19–33. [Google Scholar] [CrossRef]
- Eurosion. “Coastal Erosion—Evaluation of the Need for Action” Directorate General Environment, European Commission [Research Programme for the Erosion in Europe], 2004. Available online: https://home-affairs.ec.europa.eu/whats-new/evaluations-and-impact-assessments_en (accessed on 18 April 2024).
- Pranzini, E.; Wetzel, L.; Williams, A.T. Aspects of coastal erosion and protection in Europe. J. Coast. Conserv. 2015, 19, 445–459. [Google Scholar] [CrossRef]
- GNRAC (Gruppo Nazionale per la Ricerca sull’ Ambiente Costiero). Lo stato dei litorali in Italia. Studi Costieri 2006, 10, 3–172. [Google Scholar]
- European Commission. The Economics of Climate Change Adaptation in EU Coastal Areas; Final Report; Policy Research Corporation Belgium: Brussels, Belgium, 2009; p. 153. [Google Scholar]
- Alexandrakis, G.; Karditsa, A.; Poulos, S.; Ghionis, G.; Kampanis, N.A. An assessment of the vulnerability to erosion of the coastal zone due to a potential rise of sea level: The case of the Hellenic Aegean coast. In Environmental Systems, Encyclopedia of Life Support Systems (EOLSS); Sydow, I., Ed.; Developed under the Auspices of the UNESCO; Eolss Publishers: Oxford, UK, 2010. [Google Scholar]
- Magoon, O.T.; Edge, B.L.; Stone, K.E. The impact of anthropogenic activities on coastal erosion. In Proceedings of the 27th International Conference on Coastal Engineering, Sydney, Australia, 16–21 July 2000. [Google Scholar]
- Williams, A.T.; Rangel-Buitrago, N.; Pranzini, E.; Anfuso, G. The management of coastal erosion. Ocean. Coast. Manag. 2018, 156, 4–20. [Google Scholar] [CrossRef]
- Abualhin, K. Short-term analysis of coastal erosion among human intervention and sea level rise. J. Coast. Conserv. 2022, 26, 75. [Google Scholar] [CrossRef]
- Ilia, I. Engineering Geological Features of Marls in the Wide Area of Kymi, Euboea, Their Impact on Construction Problems and Their Treatment. Ph.D. Thesis, National Technical University of Athens, School of Mining and Metallurgical Engineering, Athens, Greece, 2013; p. 328. [Google Scholar]
- IGME. Geological Map of Kymi (1:50,000); Institute for Groundwater Mineral Exploration: Athens, Greece, 1989. [Google Scholar]
- Koumantakis, I.; Rozos, D.; Markantonis, K.; Ilia, I.; Tsagaratos, P. Landslide Phenomena of Kymi Municipality. Research Program founded by the Prefecture of Euboea Island, 2008. Available online: https://scholar.google.com.hk/scholar?hl=zh-CN&as_sdt=0,5&q=Landslide+Phenomena+of+Kymi+Municipality.+Research+Program+funded+by+the+Prefecture+of+Euboea+Island (accessed on 18 April 2024).
- Ring, U.; Glodny, J.; Will, T.; Thomson, S. An Oligocene extrusion wedge of blueschist-facies nappes on Evia, Aegean Sea, Greece: Implications for the early exhumation of high-pressure rocks. J. Geol. Soc. 2007, 164, 637–652. [Google Scholar] [CrossRef]
- Ganas, A.; Drakatos, G.; Pavlides, S.B.; Stavrakakis, G.N.; Ziazia, M.; Sokos, E.; Karastathis, V.K. The 2001 Mw ¼ 6:4 Skyros earthquake, conjugate strike-slip faulting and spatial variation in stress with the central Aegean Sea. J. Geodyn. 2005, 39, 61–77. [Google Scholar] [CrossRef]
- Tsimplis, M.N. Tidal oscillations in the Aegean and Ionian Seas. Estuar. Coast. Shelf Sci. 1994, 39, 201–208. [Google Scholar] [CrossRef]
- CERC (Coastal Engineering Research Center). Shore Protection Manual, 4th ed.; U.S. Army Corp of Engineers, U.S. Government Printing Office: Washington, DC, USA, 1984.
- Goda, Y. Random seas and design of maritime structures. In Advanced Series on Ocean Engineering, 2nd ed.; World Scientific Publishing: Singapore, 2000; Volume 15. [Google Scholar]
- Hallermeyer, R.J. A profile zonation for seasonal sand beaches from wave climate. Coast. Eng. 1981, 4, 253–277. [Google Scholar] [CrossRef]
- Kraus, N.C.; Larson, M. Beach Profile Change Measured in the Tank for Large Waves 1956–1957 and 1962; Coastal Engineering Research Center: Vicksburg, MI, USA, 1988. [Google Scholar]
- Rattanapitikon, W.; Shibayama, T. Breaking wave formulas for breaking depth and orbital to phase velocity ratio. Coast. Eng. J. 2006, 48, 395–416. [Google Scholar] [CrossRef]
- Iribarren, R.; Nogales, C. Protection des Ports; Section II-4; XVII International Navigation Congress: Lisbon, Portugal, 1949. [Google Scholar]
- Short, A.D. The role of wave height, period, slope, tide range and embaymentisation in beach classifications: A review. Rev. Chil. Hist. Nat. 1996, 69, 589–604. [Google Scholar]
- Van Rijn, L.C. Principles of Sediment Transport in Rivers, Estuaries and Coastal Seas; Aqua Publications: Blokzijl, The Netherlands, 1993. [Google Scholar]
- Atkinson, A.L.; Power, H.E.; Monra, T.; Hammond, T.; Callaghan, D.P.; Baldock, T.E. Assessment of runup predictions by empirical models on non-truncated beaches on the southeast Australian coast. Coast. Eng. 2017, 119, 15–31. [Google Scholar] [CrossRef]
- Mase, H. Random Wave Runup Height on Gentle Slope. J. Waterw. Port Coast. Ocean. Eng. 1989, 115, 649–661. [Google Scholar] [CrossRef]
- Folk, R. Petrology of Sedimentary Rocks; Hemphill Publishing Company: Austin, TX, USA, 1980. [Google Scholar]
- Blott, S.J.; Pye, K. GRADISTAT: A grain size distribution and statistics package for the analysis of unconsolidated sediments. Earth Surf. Process. Landf. 2001, 26, 1237–1248. [Google Scholar] [CrossRef]
- Himmelstoss, E.A.; Henderson, R.E.; Farris, A.S.; Kratzmann, M.G.; Bartlett, M.K.; Ergul, A.; McAndrews, J.; Cibaj, R.; Zichichi, J.L.; Thieler, E.R. Digital Shoreline Analysis System; Version 6.0; U.S. Geological Survey: Reston, VA, USA, 2024. [CrossRef]
- Armaroli, C.; Ciavola, P.; Balouin, Y.; Gatti, M. An integrated study of shoreline variability using GIS and ARGUS techniques. J. Coast. Res. 2006, 39, 473–477. [Google Scholar]
- Poulos, S.E. River systems and their water and sediment fluxes towards the marine regions of the Mediterranean Sea and Black Sea earth system. An overview. Mediterr. Mar. Sci. 2019, 20, 549–565. [Google Scholar] [CrossRef]
- Woodward, J.C. Patterns of erosion and suspended sediment yield in Mediterranean river basins. In Sediment and Water Quality in River Catchments; Foster, I.D.L., Gurnell, A.M., Webb, B.W., Eds.; John Wiley & Sons Ltd.: Hoboken, NJ, USA, 1995; pp. 365–389. [Google Scholar]
- Poulos, S.E.; Collins, M.B. Fluviatile sediment fluxes to the Mediterranean Sea: A quantitative approach and the influence of dams. Geol. Soc. 2002, 191, 227–245. [Google Scholar] [CrossRef]
- Mourtzas, N.L. Palaeogeographic reconstruction of the coast of ancient Andros. In Palaiopolis, Andros: Thirty Years of Excavation Research; Palaiokrassa-Kopitsa; Kaïreios Library: Andros, Greece, 2018; pp. 56–66. Available online: https://scholar.google.com.hk/scholar?hl=zh-CN&as_sdt=0%2C5&q=Palaeogeographic+++reconstruction+++of+++thecoast+++of+++ancient+++Andros.&btnG= (accessed on 18 April 2024).


| H (m) | T (s) | Dir (deg) | f (%) | Hb (m) | db (m) | ||
|---|---|---|---|---|---|---|---|
| Total arc | (1/3) | 0.86 | 3.77 | 16.03 | 23.31 | 0.91 | 0.87 |
| (1/10) | 2.87 | 6.40 | 20.29 | 6.27 | 2.84 | 4.29 | |
| (1/100) | 5.68 | 7.99 | 20.98 | 0.79 | 5.43 | 7.71 | |
| N (0° ± 22.5°) | (1/3) | 0.74 | 3.55 | 7.6 | 17.04 | 0.85 | 0.75 |
| (1/10) | 2.35 | 5.85 | 16.3 | 6.89 | 2.56 | 3.65 | |
| (1/100) | 4.99 | 7.59 | 18.2 | 0.91 | 5.45 | 7.76 | |
| NE (45° ± 22.5°) | (1/3) | 0.99 | 3.95 | 30.5 | 4.85 | 1.13 | 1.01 |
| (1/10) | 3.12 | 6.61 | 29.6 | 1.95 | 3.40 | 4.84 | |
| (1/100) | 5.95 | 8.10 | 27.1 | 0.24 | 6.49 | 9.23 | |
| E (90° ± 22.5°) | (1/3) | 0.24 | 2.18 | 90.3 | 0.83 | 0.27 | 0.24 |
| (1/10) | 0.34 | 2.41 | 97.3 | 0.39 | 0.37 | 0.53 | |
| (1/100) | 1.32 | 4.00 | 77.3 | 0.05 | 1.44 | 2.05 | |
| SE (135° ± 22.5°) | (1/3) | 0.44 | 2.86 | 142.9 | 4.08 | 0.50 | 0.45 |
| (1/10) | 1.47 | 4.70 | 148.2 | 0.74 | 1.59 | 2.26 | |
| (1/100) | 3.81 | 6.16 | 139.1 | 0.10 | 4.14 | 5.89 | |
| (1/100) | (1/10) | ||||
|---|---|---|---|---|---|
| hS | R2% | Rmax | R2% | Rmax | |
| N | 11.3 | 1.3 | 1.6 | 0.6 | 0.9 |
| NE | 13.4 | 1.5 | 2.2 | 0.8 | 1.2 |
| E | 3.0 | 0.4 | 0.5 | 0.1 | 0.1 |
| SE | 8.6 | 1.0 | 1.1 | 0.4 | 0.6 |
| Ν | ΝΕ | E | SE | |||||
|---|---|---|---|---|---|---|---|---|
| Ω[1/3] | Ω[1/10] | Ω[1/3] | Ω[1/10] | Ω[1/3] | Ω[1/10] | Ω[1/3] | Ω[1/10] | |
| A-II (Ρ1) | (1–6) | >6 | >6 | >6 | (1–6) | (1–6) | (1–6) | >6 |
| B-II (Ρ2) | >6 | >6 | >6 | >6 | (1–6) | (1–6) | >6 | >6 |
| D-I (Ρ3) | <1 | >6 | <1 | (1–6) | <1 | <1 | <1 | <1 |
| D-II (Ρ4) | <1 | >6 | <1 | (1–6) | <1 | <1 | <1 | <1 |
| D-III (Ρ5) | <1 | (1–6) | (1–6) | (1–6) | <1 | <1 | <1 | <1 |
| Coastal Sectors (Beaches) | Qm (103 tons/year) |  |
| A-II (Soutsini) | −10 | |
| B-II (Platana) | +105 | |
| C (Petra) | +130 | |
| D (Ag. Georgios, Ag. Merkourios, Mourteri) | +99 |
| Coastal Sector | Coastline Displacement |
|---|---|
| A-II | 40% (northern part) slightly retreated (2–4 m, maximum 6 m); 60% (southern part) prograde by 4–10 m (RMSE = 0.58 m). |
| B-II | About 70% is under erosion with a mean retreat of 6 m (maximum 12 m); the other 30% shows a small progradation (>4 m), which locally exceeds the 10 m (RMSE = 0.24 m). |
| C | ¾ retreating up to 20 m (mean value = 11 m); the other ¼ is either rather stable and/or prograde by < 6 m (southern end) (RMSE = 0.24 m). |
| D-I | 87% (central and southern part) retreat by no more than 15 m (on average), while 8% is rather stable and 5% prograde by a few meters (RMSE = 0.52 m). |
| D-II | About 60% (northern part) retreats on average by 13–15 m (maximum values = 25 m); its central part (18%) has retreated by > 18 m, while its southern part (22%) is rather stable or slightly prograde (RMSE = 0.38 m). |
| D-III | The northern part (40%) is rather stable or slightly retreating; its central/southern part progrades with an average value of 15 m (maximum 20 m), while its southern end presents the largest progradation of 36 m and a mean value of 19 m (RMSE = 0.38 m). |
Disclaimer/Publisher’s Note: The statements, opinions and data contained in all publications are solely those of the individual author(s) and contributor(s) and not of MDPI and/or the editor(s). MDPI and/or the editor(s) disclaim responsibility for any injury to people or property resulting from any ideas, methods, instructions or products referred to in the content. |
© 2024 by the authors. Licensee MDPI, Basel, Switzerland. This article is an open access article distributed under the terms and conditions of the Creative Commons Attribution (CC BY) license (https://creativecommons.org/licenses/by/4.0/).
Share and Cite
Poulos, S.; Lesioti, S.; Karditsa, A.; Angelopoulos, C. Factors Controlling the Formation and Evolution of a Beach Zone in Front of a Coastal Cliff: The Case of the East Coast of Evia Island in the Aegean Sea, Eastern Mediterranean. Water 2024, 16, 1622. https://doi.org/10.3390/w16111622
Poulos S, Lesioti S, Karditsa A, Angelopoulos C. Factors Controlling the Formation and Evolution of a Beach Zone in Front of a Coastal Cliff: The Case of the East Coast of Evia Island in the Aegean Sea, Eastern Mediterranean. Water. 2024; 16(11):1622. https://doi.org/10.3390/w16111622
Chicago/Turabian StylePoulos, Serafeim, Stamatina Lesioti, Aikaterini Karditsa, and Christos Angelopoulos. 2024. "Factors Controlling the Formation and Evolution of a Beach Zone in Front of a Coastal Cliff: The Case of the East Coast of Evia Island in the Aegean Sea, Eastern Mediterranean" Water 16, no. 11: 1622. https://doi.org/10.3390/w16111622