Abstract
The intensification of anthropogenic activities (agriculture, industry, and exploitation of water resources) during urbanization has posed significant challenges to the aquatic environment, particularly in karst regions. Karst aquifers are highly susceptible to surface contaminants and exhibit minimal natural remediation capabilities. Our understanding of the anthropogenic activities involved in these sensitive karst systems remains limited. To address this gap, we conducted a comprehensive study, collecting 285 groundwater samples in Feicheng, northern China, from 1996 to 2015. The overexploitation of karst groundwater has resulted in several concerns. The whole dataset was classified into four groups according to land use. Water quality assessments revealed a yearly decline, particularly in industrial and agricultural areas. The water chemistry transitioned from Ca-Mg-HCO3 to Ca-Mg-HCO3-SO4. Such evolution was attributed to natural hydrogeochemical processes, atmospheric precipitation, and anthropogenic inputs. Natural factors included water-rock interactions (the mineral dissolution) and ion exchange. Absolute principal component scores with multiple linear regression (APCS-MLR) were used to quantitatively estimate the sources of pollution. The results showed that hydrogeological settings (recharge, runoff, and discharge) were crucial in the hydrochemistry evolution of karst groundwater systems. In agricultural areas, it is recognized that much of the NO3− accumulation in aquifers came from upstream inputs in the groundwater system, not just irrigation and fertilization. Urban areas were affected by Cl− pollution, primarily due to domestic waste. Industrial regions of recharge zones were more susceptible to atmospheric precipitation and industrial waste, with pollutants infiltrating through rainfall and degrading water quality. Mining areas exhibit higher SO42− and lower pH due to the oxidation of sulfur-containing minerals. Therefore, the rapid response and low self-purification capacity of groundwater in karst regions necessitate caution in urban planning to mitigate impacts on these fragile systems.
1. Introduction
Karst regions, covering only 7–12% of Earth’s terrestrial areas, provide vital karst groundwater resources and support 20–25% of the global population’s drinking water demands [1,2]. Karst aquifers are typically formed from rock dissolution due to erosion and extensive water-rock interactions, creating networks of fissures, cracks, holes, and conduits. Such aquifer systems are known for their high permeability and storage capacity for water supply [3,4]. Contaminants can enter aquifer systems through these networks and then quickly spread throughout the subsurface system. However, extreme heterogeneity and anisotropy, combined with low permeable soil covering, provide little opportunity for filtration, sorption, or degradation of pollutants along the preferential groundwater flow paths, which leads to the highly vulnerable characteristics of the karst aquifer systems to surficial contaminants caused by human activities and various land uses and is characterized by an extremely low capacity for self-purification and self-restoration [4,5,6,7].
The evolution of groundwater chemistry is heavily influenced by both natural processes, such as hydrogeologic conditions, precipitation, lithology, and water-rock interactions, as well as human activities, including agriculture, industry, mining, and urban development [2,8,9]. Vulnerable karst systems, known for their unique and fragile subsurface groundwater networks, face significant environmental risks due to rapid urbanization and related human activities. These anthropogenic activities and increasing water demands have resulted in alterations to land use patterns and profound impacts on karst groundwater systems, leading to variations and imbalances in water chemistry [10,11,12]. Extensive coal excavation and quarry exploitation have further modified the topography, groundwater levels, and hydrogeological conditions in karst areas, disrupting the water balance and hydraulic gradient [11,13]. Additionally, industrial by-products, domestic waste, and agricultural fertilization have contributed to an increase in organic, inorganic, and heavy metal pollutants released into karst groundwater systems, thereby degrading their quality and usability [14,15,16,17]. Therefore, studying temporal and spatial variations in water quality is essential for better investigating and evaluating water quality in groundwater systems.
Quantitatively evaluating the impact of human activities and natural karstic processes on the subsurface environment is crucial for water resource utilization and environmental protection. Assessment of groundwater pollution previously relied on a survey of pollution sources and a comparison of the measured index with existing water quality standards. The complexity of surveying and monitoring datasets makes traditional methods difficult to explain and extract useful information about pollution sources effectively [18,19]. To address this challenge, multivariate statistical analyses such as factor analysis (FA) and principal components analysis (PCA) have been adopted [20]. These statistical tools help in dealing with large amounts of data and numerous parameters. Through dimensionality reduction, pollution sources can be identified, and variables can be extracted and categorized separately to explain hydrogeochemical processes. While PCA/FA provides qualitative information about potential pollution sources, it cannot determine the quantitative contribution of identified pollution sources to each variable. To achieve quantitative estimation, statistical theory-based receptor models offer a convenient method. Commonly used methods include Positive Matrix Factorization (PMF) and APCS-MLR [21]. Receptor models establish causal correspondence between pollutants and sources, identifying the chemical contributions of each source to water quality variables. These models have been widely utilized for source identification and apportionment in the fields of air and soil environmental management [22]. Despite the effectiveness of receptor models, there have been relatively few studies applying this technology to groundwater contamination [21].
Karst groundwater as an important potable resource has supported urbanization and industrialization over the past 30 years in Feicheng, a major historical coal supply city in northern China [23,24]. However, this has resulted in hydrogeological issues, including declining groundwater levels due to increased water usage and the degradation of water quality due to environmental pollution. Previous studies have indicated that groundwater vulnerability in the region was primarily driven by human activities, coal mine water quality, and lateral groundwater fluxes [25,26]. The regional groundwater level declined, and hydrochemical conditions became more complicated [24,27], posing significant challenges to the sustainable utilization of karst groundwater in Feicheng [28]. Rapid urbanization has led to the establishment of four distinct functional areas: urban, industrial, agricultural, and mining. Each of these areas exhibits unique characteristics that influence karst groundwater conditions. Industrial waste, domestic effluent, agricultural irrigation, and mining water drainage have all contributed to widespread shallow groundwater pollution, posing a significant threat to the quality of deep karst groundwater [26]. Karst aquifers exhibit high permeability and rapid response to anthropogenic inputs, making them highly susceptible to human impacts [15,17]. The spatial heterogeneity in karst aquifer systems results in different hydrogeochemical processes during recharge, runoff, and discharge processes. When combined with various anthropogenic disturbances, this leads to significant spatial-temporal variations in the studied region. However, systematic research on the hydrogeochemical evolution in karst systems influenced by human activities and the hydrological cycle at spatial and temporal scales is lacking. Additionally, there is limited understanding of the combined effects of multiple human activities and karst hydrological cycles in this complex urbanization scenario over many years.
Therefore, the objectives of this study are to: (1) identify the major hydrogeochemical processes of the karst groundwater systems at both temporal and spatial scales; (2) understand how anthropogenic activities impact the hydro-chemical cycles of the karst groundwater systems; and (3) quantitatively characterize the pollution sources across the functional areas. We envisage that such a systematic study can provide a new perspective for karst groundwater cycling and robustly support local groundwater management, especially karst water protection and eco-restoration.
2. Overview of Climatic Characteristics, Hydrogeological Setting and Functional Areas
2.1. Geographical, Climatic, and Hydrogeological Setting
Feicheng is situated southeast of Mount Tai, Shandong province, in the Northern China, covering about 1277 km2 (Figure 1). The regional climate has an average annual precipitation of about 647 mm and evaporation of 1225 mm. The land of this traditional agricultural county primarily consists of Quaternary unconsolidated sediments for farming, comprising roughly 76% of the total land area [23]. In the past five years, water consumption has been divided among agriculture (53%), industry (18%), domestic use (16%), and the rest of the total water supply [23,24]. Karst groundwater comprises 59% of the region’s total potable water supply.
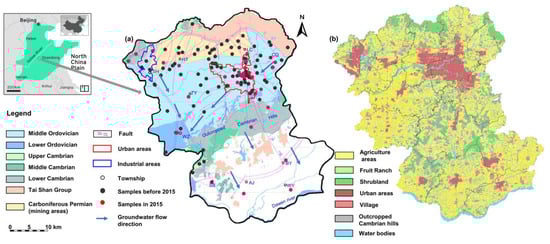
Figure 1.
General setting of the study area: (a) Hydrogeological map and sampling sites, showing groundwater flow directions and geological formations; (b) Land cover and land use, highlighting areas used for agriculture, urban development, industrial activities, and natural vegetation.
Hydrogeologically, the study area includes four aquifers and corresponding groundwater systems: (1) Quaternary porous groundwater, (2) Cambrian-Ordovician limestone karst groundwater, (3) Carboniferous-Permian limestone karst groundwater, and (4) pre-Sinian Taishan Group granite gneiss fissure groundwater [23].The outcropped Cambrian hills in the central region divide the surface and groundwater systems of the study area into two parts. The northern part is the Feicheng Basin, which is a topographic depression formed by the Feicheng fault and the Taoyuan fault. The south, east, and northwest of this region are low mountains and hills composed of Cambrian-Ordovician geology. The Quaternary alluvial plain overlies the Ordovician limestone and the Carboniferous-Permian strata in the central basin. Outcropped limestone in these areas receives atmospheric precipitation, replenishing the groundwater system, which then flows through the limestone and discharges to the southwest of the region [27]. The northeast is a low mountain area dominated by the Taishan gneiss [29]. The study area’s complex geological structure and well-developed fault systems have turned many faults into effective water transfer channels interconnecting different aquifers. In the flow-through zone, the hydrogeochemical facies are Ca-Mg-HCO3; they shift to Ca-Mg-HCO3-SO4 in the discharge area. To the south, the Wenyang Plain is formed by the erosion of the Dawen River. Cambrian-Ordovician limestone is distributed in central Feicheng, extending southward from high to low elevations, with a vast alluvial plain and interspersed low hills, where the main aquifer is the Quaternary pore groundwater.
2.2. Functional Areas
The study area Feicheng is typically segmented into areas based on land cover, land use, and their primary economic activities, as depicted in Figure 1. The industrial areas house energy-intensive enterprises like fuel power plants and steel mills that consume significant amounts of coal, leading to substantial industrial emissions and environmental impacts. The Carboniferous Permian coal mining areas span about 120 km2 in the industrial areas. Over 200 million tons of raw coal were extracted to support industrial development in the region [29]. Around 35 million m3 of acid mining water was discharged annually due to mine excavation dewatering from 1994 to 2001 [24]. The mine drainage caused a serious drop in regional groundwater levels and the deterioration of karst groundwater quality [30]. Rapid urbanization led to a four-fold increase in the size of urban areas (Figure S1), resulting in more impervious surfaces and increased sewage discharge, which poses a threat to the local groundwater system.
3. Materials and Methods
3.1. Sampling and Data Acquirement
Field sampling of karst groundwater was conducted to support the proposed study, resulting in the collection of a total of 285 samples from 1996 to 2015. These samples comprised 270 confined karst samples and 15 mining discharge samples. The data were obtained from the Feicheng Water Resources Department and previous studies [29], with the sample locations depicted in Figure 1. The main objective of the sampling was to target critical areas, especially densely populated regions that are more severely affected by anthropogenic activities. Additionally, the sampling aimed to ensure the safety of water for the local population. Samples were collected from various wells, with a 30-min pumping performed prior to sampling to ensure that the samples represented the real in-situ groundwater conditions [31]. This meticulous sampling approach aimed to capture an accurate representation of the hydrogeochemical characteristics of karst groundwater in the study area. The site information, including elevation and geographic coordinates (longitude and latitude), was logged during the survey, and measurements of pH, EC and total dissolved solids (TDS) were conducted on site immediately after sample collection using the portable meter (HACH DR/800, Loveland, CO, USA). HCO3− was determined through titrimetry in the field. At each site, four bottled samples were collected and filtered through 0.22 μm membranes into polyethylene bottles that were thoroughly pre-washed with deionized water. One bottle of water was used to determine cations. The water was acidified to 1% HNO3, producing a pH of about 1.5, which was sufficient to stabilize for the cation lab analysis. The remaining three bottles of water were directly used for the analysis of anions. All samples were initially stored in an ice box on-site and then transferred to a laboratory refrigerator at 4 °C for analysis in three days. Sample analysis was conducted by the Water Environment Monitoring Center of Shandong Province (Tai’an, China) following the Chinese Groundwater Quality Standard (GB/T 14848-2017) [32]. Testing conditions were maintained at a temperature of 20 ± 3 °C and a humidity of 60 ± 10%. The major anions SO42−, NO3−, and Cl− were measured using ion chromatography (ICS-2100, Dionex, Sunnyvale, CA, USA), and the major cations Ca2+, Mg2+, Na+ and K+ were analyzed using Inductively Coupled Plasma Mass Spectrometry (NexION 2000, PerkinElmer, MA, USA). The analytical precision of the major ions was within 1%. Quality control and quality assurance procedures (e.g., charge balance) were carried out to ensure the accuracy of the data handling, as also detailed in Supplementary Information (SI). The ion balance errors of most water samples were <5%.
3.2. Statistical Procedures and Geochemical Analysis
The one-way analysis of variance (ANOVA) was used to test whether the mean values of major ions among 4 functional areas were statistically significant (p < 0.05) in this work. Principal component analysis (PCA) was used to identify the principal factors corresponding to different sources and chemical variables, as well as for the characterization of major hydrogeochemical processes [10,33]. PCA helps in reducing the dimensionality of the dataset and extracting meaningful information. The principal components obtained from PCA were rotated using the maximum variance method. Only principal components with eigenvalues greater than 1 were retained for further analysis [34]. The abovementioned statistical methods were implemented using SPSS 25.0. AqQA 1.1 was used to draw the Piper diagram, which can directly reflect the characteristics and facies of general water chemistry and possible hydrogeological processes. Then, quantification of mineralization by saturation index (SI) in the groundwater was performed to distinguish the hydrogeochemical processes using PHREEQC. Ion ratio methods were applied to determine the hydrogeochemical processes that control the evolution of karst groundwater [7,35].
3.3. Water Quality for Health
Groundwater quality is closely related to human health and that of other downstream users. Therefore, it is necessary to accurately assess groundwater quality in this regard. The entropy weight quality index (EWQI) was used as an effective method to determine the optimal weights of the hydrogeochemical parameters of groundwater [36]. The detailed workflow for calculating EWQI was presented in SI.
3.4. Source Apportionment Based on PCA
The absolute principal component scores for multivariate linear regression (APCS-MLR) were often used as a receptor model that can identify and quantify source apportionment of water and soil pollutants based on the chemical and physical characteristics of pollutants in sources and receptors [19]. The normalized factor fraction APCS of major ions was obtained based on the results of PCA through Equations (1)–(4) below, and then multiple linear regression was employed to obtain the average contribution of pollution sources to the water quality [21,22].
where Zij is the standardized Z-score of the concentration of element j at location i; Sfj is the loading of principal component f on element j; (r0)j is the constant term of multiple linear regression of element j; rfj is the regression coefficient of source f on element j; and the combined term rfj ∗ APCSf represents the contribution of source f to the element concentration Cj.
4. Results and Discussion
4.1. Hydrogeochemical Characteristics
Sound and fine characterization of the local and regional hydrogeochemical characteristics based upon specific geology and hydrogeology is crucial for a proper understanding of water quality management and the sustainable development of water resources. It provides foundational technical support in identifying potential pollution sources and related preferential transport pathways and processes, which is also a scientific basis for water resource management and environmental protection [3,21].
4.1.1. Groundwater Chemistry along Flow Paths
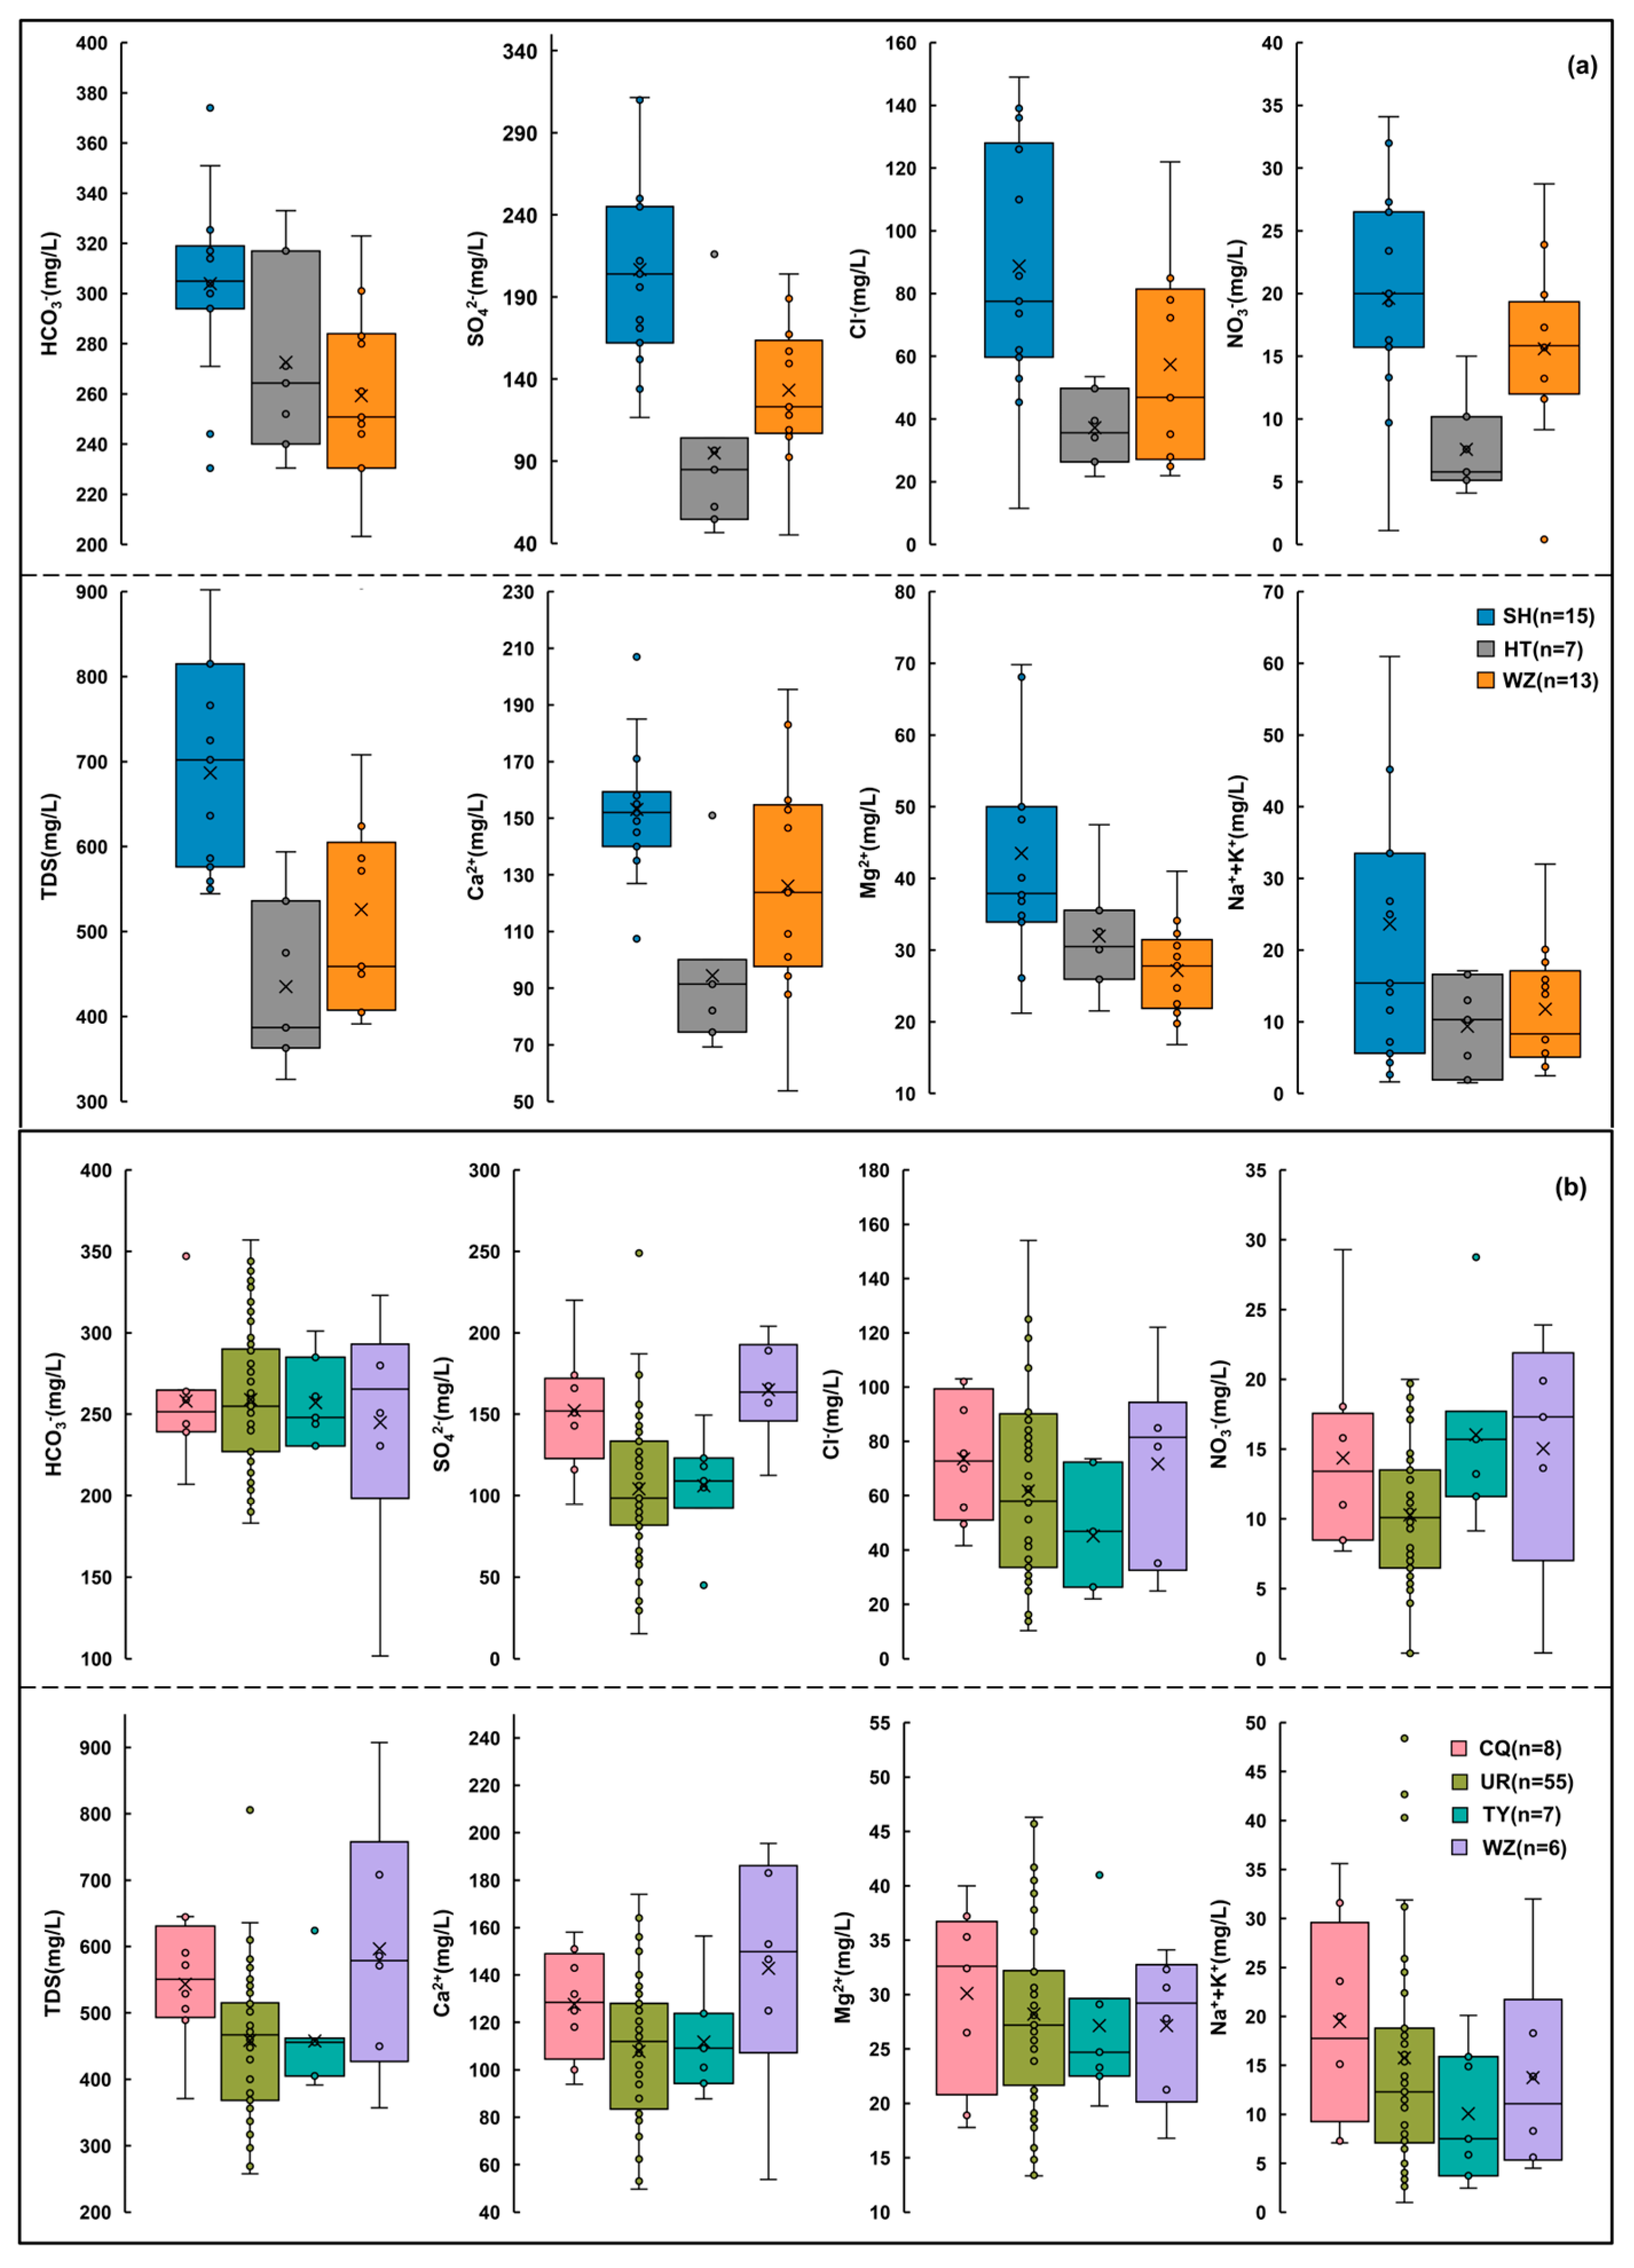
Hydrogeological conditions typically have a significant impact on the migration of solutes in groundwater [8]. As groundwater flows from recharge to discharge areas, it continuously interacts with surrounding aquifer materials, resulting in ongoing water-rock interactions and complicated hydrogeochemical processes. These interactions can drastically change concentrations of the major variables like Ca2+, Mg2+, HCO3− and TDS, especially in the discharging areas under various redox conditions [37]. The karst water systems in the study area have two major recharge areas located in the northeast and northwest. Based on contour hydrographs by Li and Wei [23,24], two hydrological paths can be identified from the recharge areas to study the hydrochemical evolution, each with distinct upstream recharging, runoff, and downstream outlet segments. From the recharge to discharge areas as illustrated in Figure 2, Flow-path 1 is determined as: SH (industrial) → HT (mining) → WZ (agriculture), while Flow-path 2 is CQ (agriculture) → UR (urban) → TY (agriculture) → WZ (agriculture), with parentheses indicating the functional area of each location. With data evidence from the most recent five years (2011–2015) for the box plots, each subplot in Figure 2 demonstrated the concentration variations of specific ions from recharge to discharge areas along with the flow path.
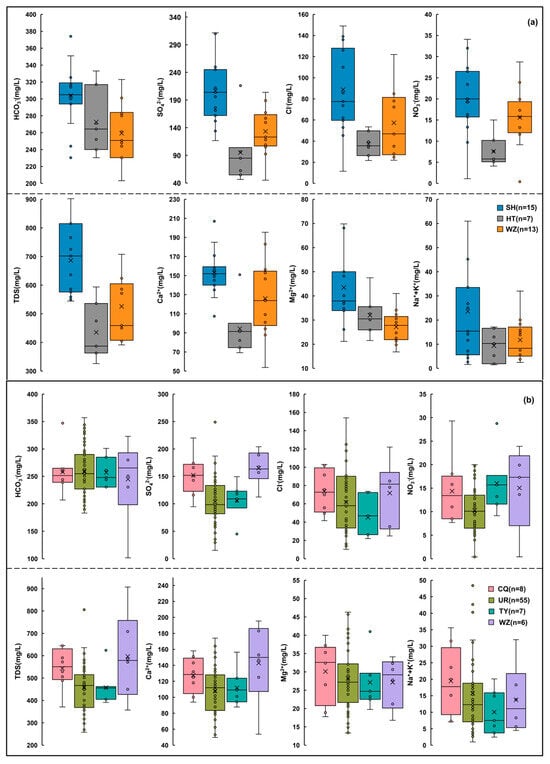
Figure 2.
Boxplots of concentrations of the measured parameters showing chemical concentration variations along groundwater flow, representing the impacts of different human activities during 2011–2015: (a) Flow-path 1 (SH → HT → WZ); (b) Flow-path 2 (CQ → UR → TY → WZ).
Along both paths, the major ion concentrations were high in upstream recharge areas, decreased during the runoff process, and increased again in downstream discharge areas. For instance, TDS values indicated the intensity of human activities [16,37]. In the SH (Path 1) and CQ (Path 2) recharge areas (Figure 2), TDS reached average levels of 700 mg/L and 550 mg/L, respectively, then dropped to approximately 390 mg/L and 485 mg/L, and eventually increased to 460 mg/L and 550 mg/L in discharge areas. Normally, the recharge areas in karst systems are supplied by atmospheric precipitation with lower TDS. Unusually higher values of TDS were observed in SH and CQ in this study. In Chongqing, southwest of China, TDS variations range from 189 to 274 mg/L, averaging 229 mg/L, representing a relatively pristine background. In Northern China’s karst systems, the average TDS is 362 mg/L, ranging from 208 mg/L to 510 mg/L [38]. Urban areas in Chongqing suffer from severe nitrate pollution, with an average TDS of 669 mg/L, ranging from 513 to 799 mg/L [5]. When comparing total dissolved solids (TDS) values with those from other regions, groundwater quality in the study area shows significantly higher values, indicating substantial anthropogenic disturbance. TDS serves as an indicator of the impact of human activity. Similar trends were observed for SO42− and NO3− along the flow paths. Their average concentrations exceeded the standards for Class II groundwater, with nitrate levels over 5 mg/L and sulfate levels exceeding 150 mg/L. The primary sources of sulfate in groundwater include the dissolution of sulfate minerals, the oxidation of sulfides, seawater intrusion, atmospheric precipitation, and anthropogenic impacts [12,39]; Various human activities, such as wastewater irrigation, fertilizer application, and landfill use (particularly leachate leakage), are often responsible for high concentrations of nitrate in groundwater.
In 2015, the EWQI values ranged from 53.3 to 113.1, averaging 78.2 (Figure 3a), reflecting the spatial distribution pattern of the groundwater quality. Water samples were categorized as “good” (50–100) and “poor” (100–200), making up 88% and 12% of the samples, respectively. In the recharge areas, the EWQI values range from 93 to 113, compared to 88 to 99 in the discharge areas, higher than those in other regions. This is attributed to the recharge zone’s greater vulnerability to pollutant infiltration and the karst systems’ limited natural self-purification capacity [4,6]. The increasing trend in groundwater EWQI values since 2004 suggests a gradual deterioration in water quality, influenced by urbanization and other anthropogenic activities (Figure 3b). Human activities, considered alongside groundwater recharge-runoff-discharge relationships, complicated the hydrogeochemical processes in the karst systems overlaying the geo-hydrogeological settings.
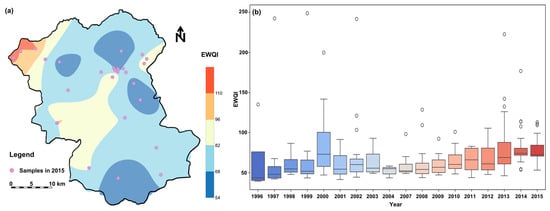
Figure 3.
Assessments of water quality (1996–2015): (a) Spatial distribution of EWQI, indicating water quality status across regions; (b) Temporal variation of EWQI, showing trends and fluctuations over time.
4.1.2. Hydrochemical Variation across the Functional Areas
The mean concentrations of major ions, listed in descending order, were HCO3− > Ca2+ > SO42− > Cl− > Na+ + K+ > Mg2+ > NO3− in the study area. The dominant cations, Ca2+, Mg2+, and HCO3−, show clear evidence in line with the typical characteristics of the karst carbonate rocks, similar to results observed in other northern karst regions [5,36]. TDS, SO42−, Cl−, NO3−, Ca2+, and Mg2+ exhibited an increasing trend over time, as illustrated in Figure S2. Such an evolution in water chemistry most likely stemmed from the gradually developed urbanization that took place in the last three decades. It turned out that various human activities posed distinct impacts on the groundwater chemistry. Based on previous studies incorporating human activities, the samples in the study area were categorized into four groups, each exhibiting unique characteristics. The ANOVA result in Table S2 suggests a significant difference (p < 0.05) in values of Ca2+, NO3−, Cl−, TDS, SO42−, and Na+ + K+, but not for HCO3− and Mg2+.The statistical and descriptive results of the samples are shown in Table S1. Industrial areas showed high concentrations of TDS, bicarbonate, and sulfate, with notable variability reflecting diverse industrial waste discharges. While urban areas present a wide range of TDS and chloride concentrations, with high variability indicating multiple sources of urban pollution. In contrast, agriculture and mining areas exhibit lower levels of water variables and variability compared to areas of industry and urbanization. These differences in water chemistry highlight the importance of further investigating the effects of human activities on water chemistry in specific areas.
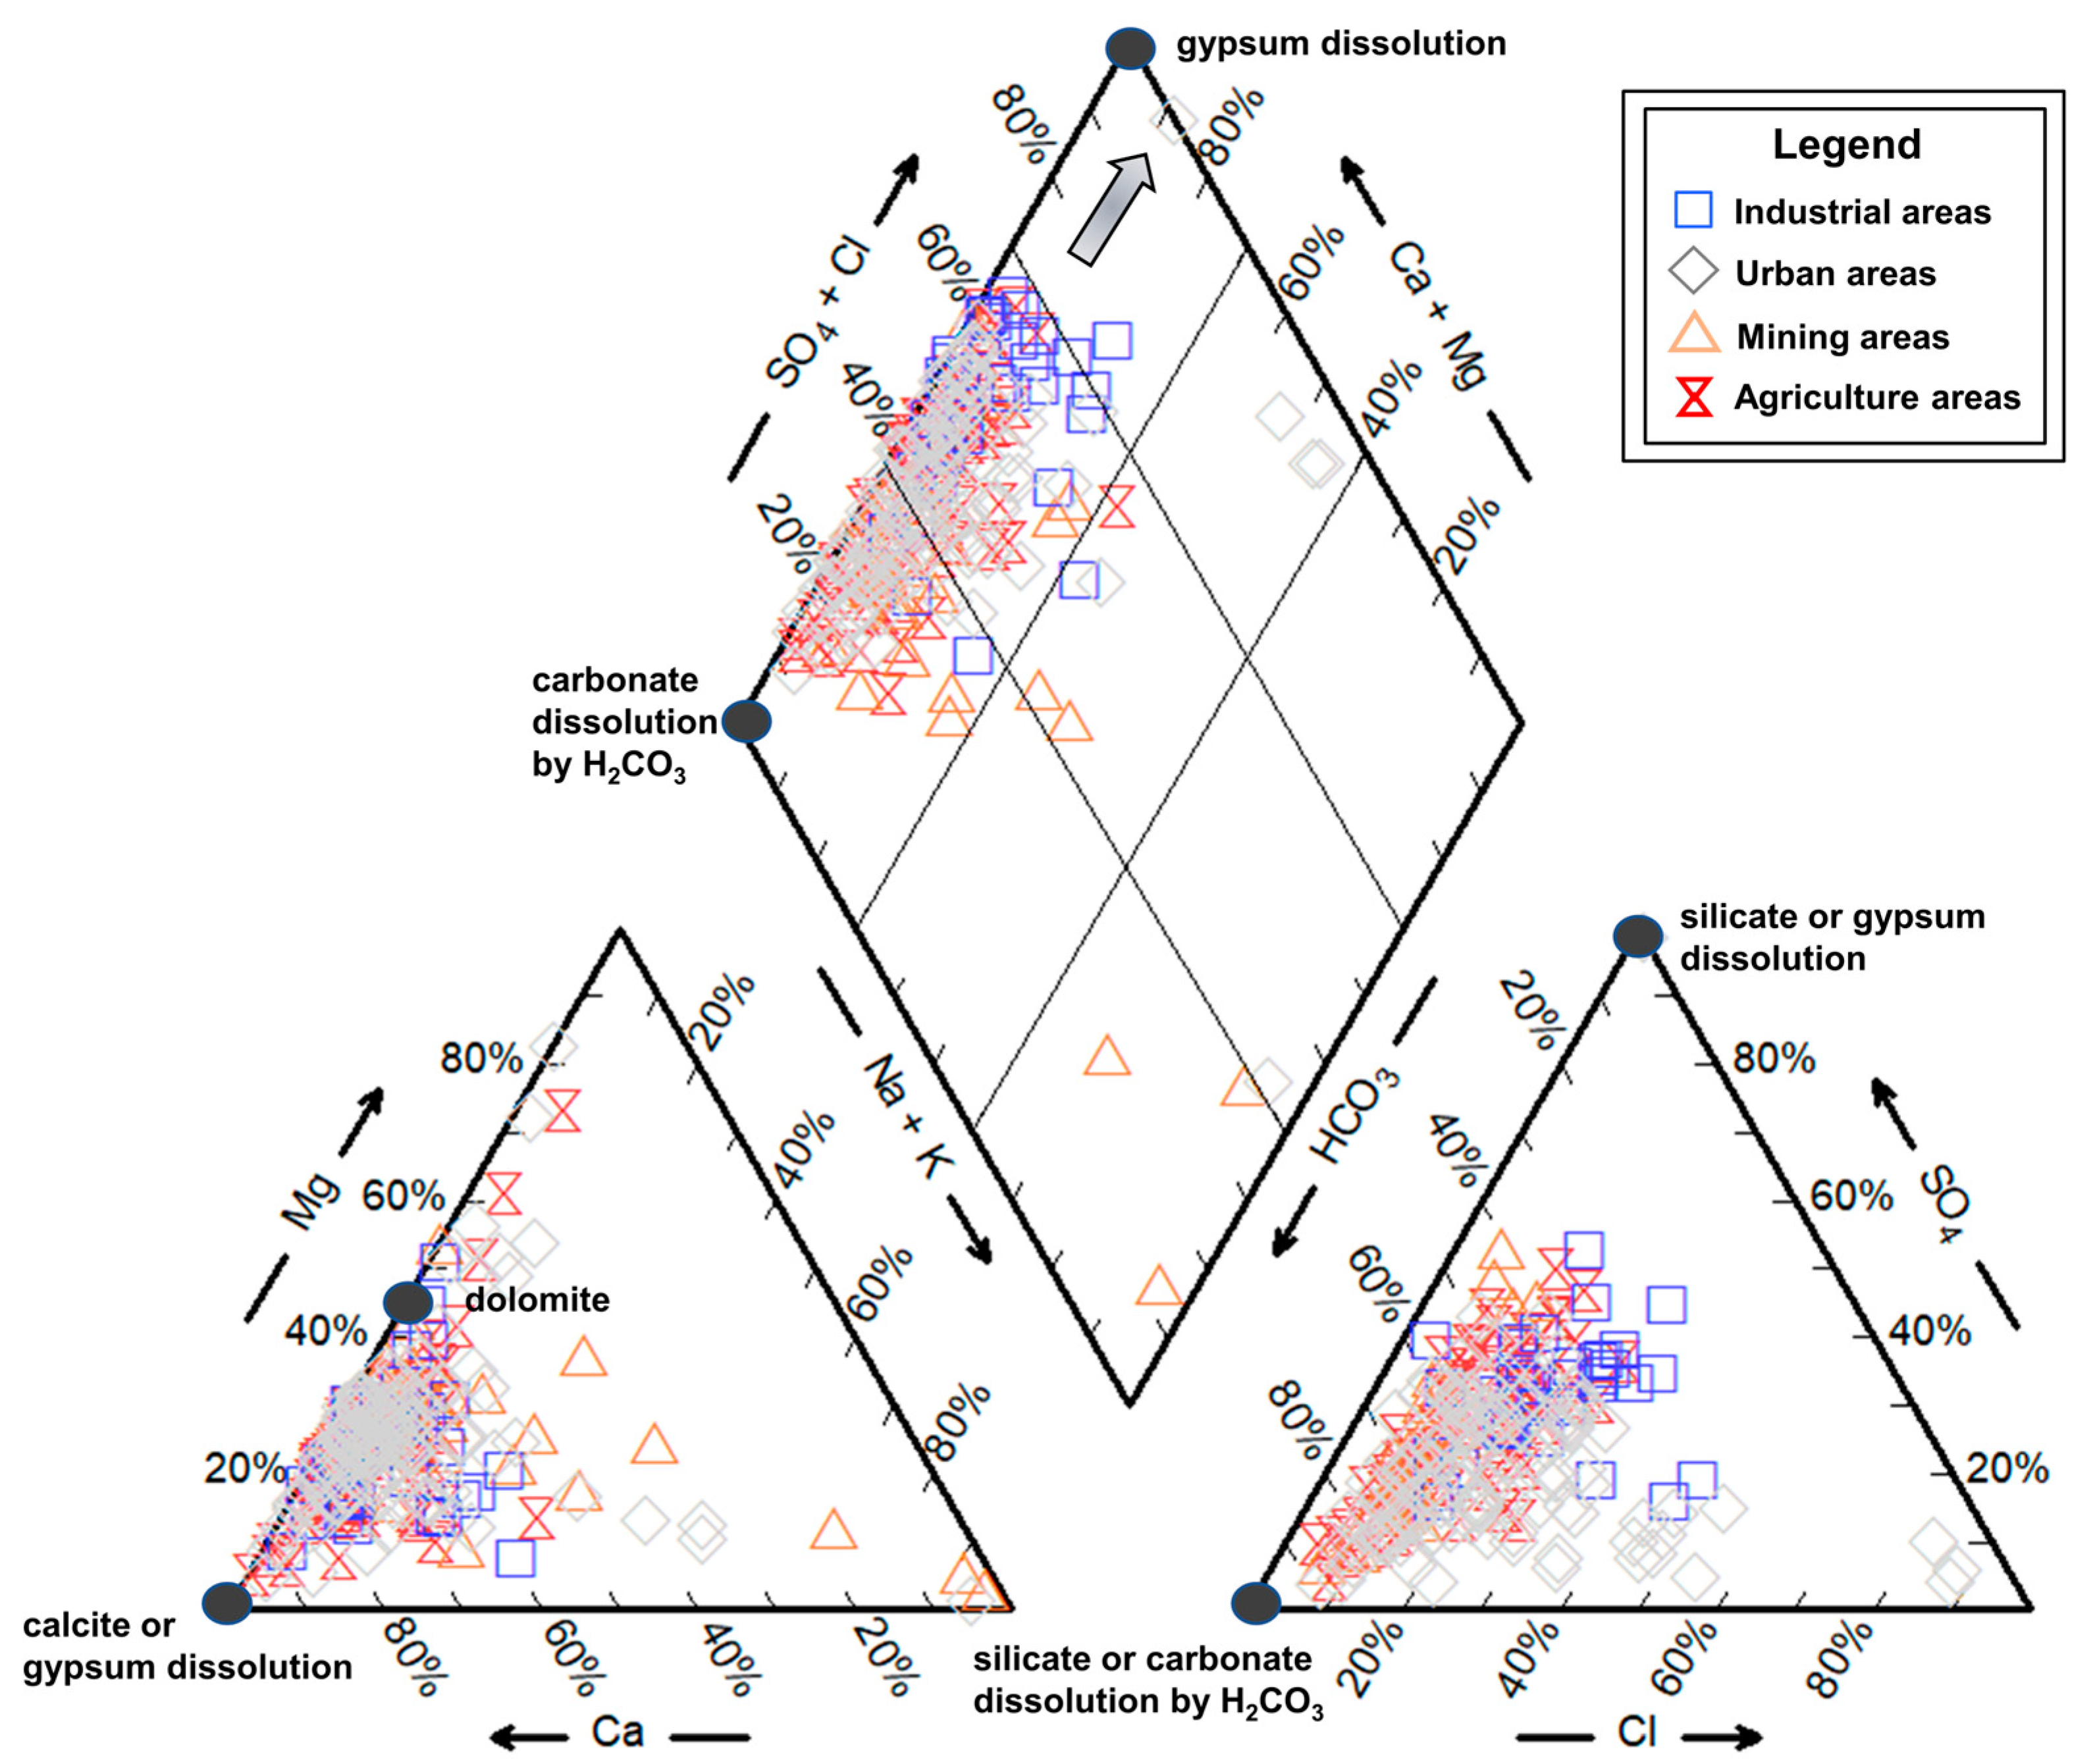
The water chemistry in these four functional areas is plotted in the Piper diagram (Figure 4). The predominant water chemistry types were Ca-HCO3, Ca-HCO3-SO4, and -Ca-Mg-HCO3-SO4 in the study area. The concentrations of SO42− and Cl− were higher compared to agricultural areas, predominantly characterized by Ca-HCO3-SO4, Ca-Mg-HCO3-SO4 in the industrial area. Mine acid wastewater is normally characterized by a low pH, low bicarbonate content, and high content of sulfate, sodium, calcium, and magnesium [40]. The samples from the mining area exhibited a trend of higher Na+ + K+, and SO42− values in this study, which may be due with a special localized mixing of mine water with Ordovician karst water [29]. This is again similar and consistent to the phenomena reported in other karst systems with coal mining activities, such as the Niangziguan and Xujiagou karst systems in northern China [38,40]. In urban areas, a noticeable increase in Cl− concentration was observed, with water chemistry types being HCO3-Ca and Ca-HCO3-Cl. Temporally, the predominant hydrogeochemical facies were HCO3-Ca and Ca-HCO3-SO4 in 1999, accounting for 39% and 22% of the dataset, respectively, while the majority displayed Ca-Mg-HCO3-SO4 facies in 2015, making up 64% of the samples.
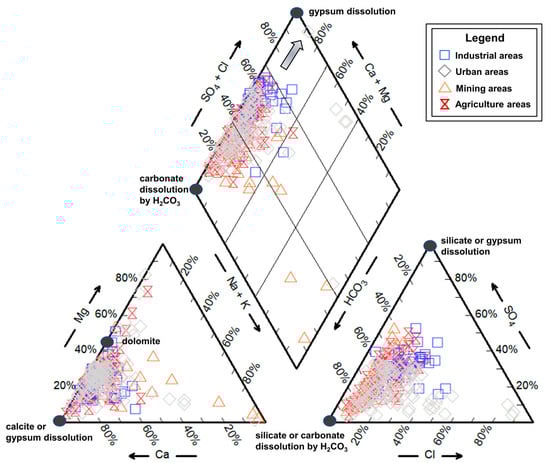
Figure 4.
Piper diagram representing the dissolution patterns of major rock types in industrial, urban, mining, and agricultural areas.
4.2. Hydrogeological Processes Governing Water Chemistry
Groundwater chemistry is a result of water-rock interaction, evaporation, precipitation, and others that are dominantly controlled by the natural hydrogeological processes [20]. The obtained dataset was put on the Gibbs diagram, as shown in Figure S3. Most samples are located in the water-rock interaction area. A portion of anomalies samples collected from industrial and mining areas were projected at the evaporation domain due to high ratios of (Na+ + K+) / (Na+ + K+ + Ca2+). Thus, water-rock interaction appears to be the key hydrogeochemical process governing the evolution of water chemistry in the study area. However, the diagram did not account for ions like SO42−, Cl−, and NO3−, which, to some extent, reflect the impact of human activities on karst water [41,42].
4.2.1. Water-Rock Interaction
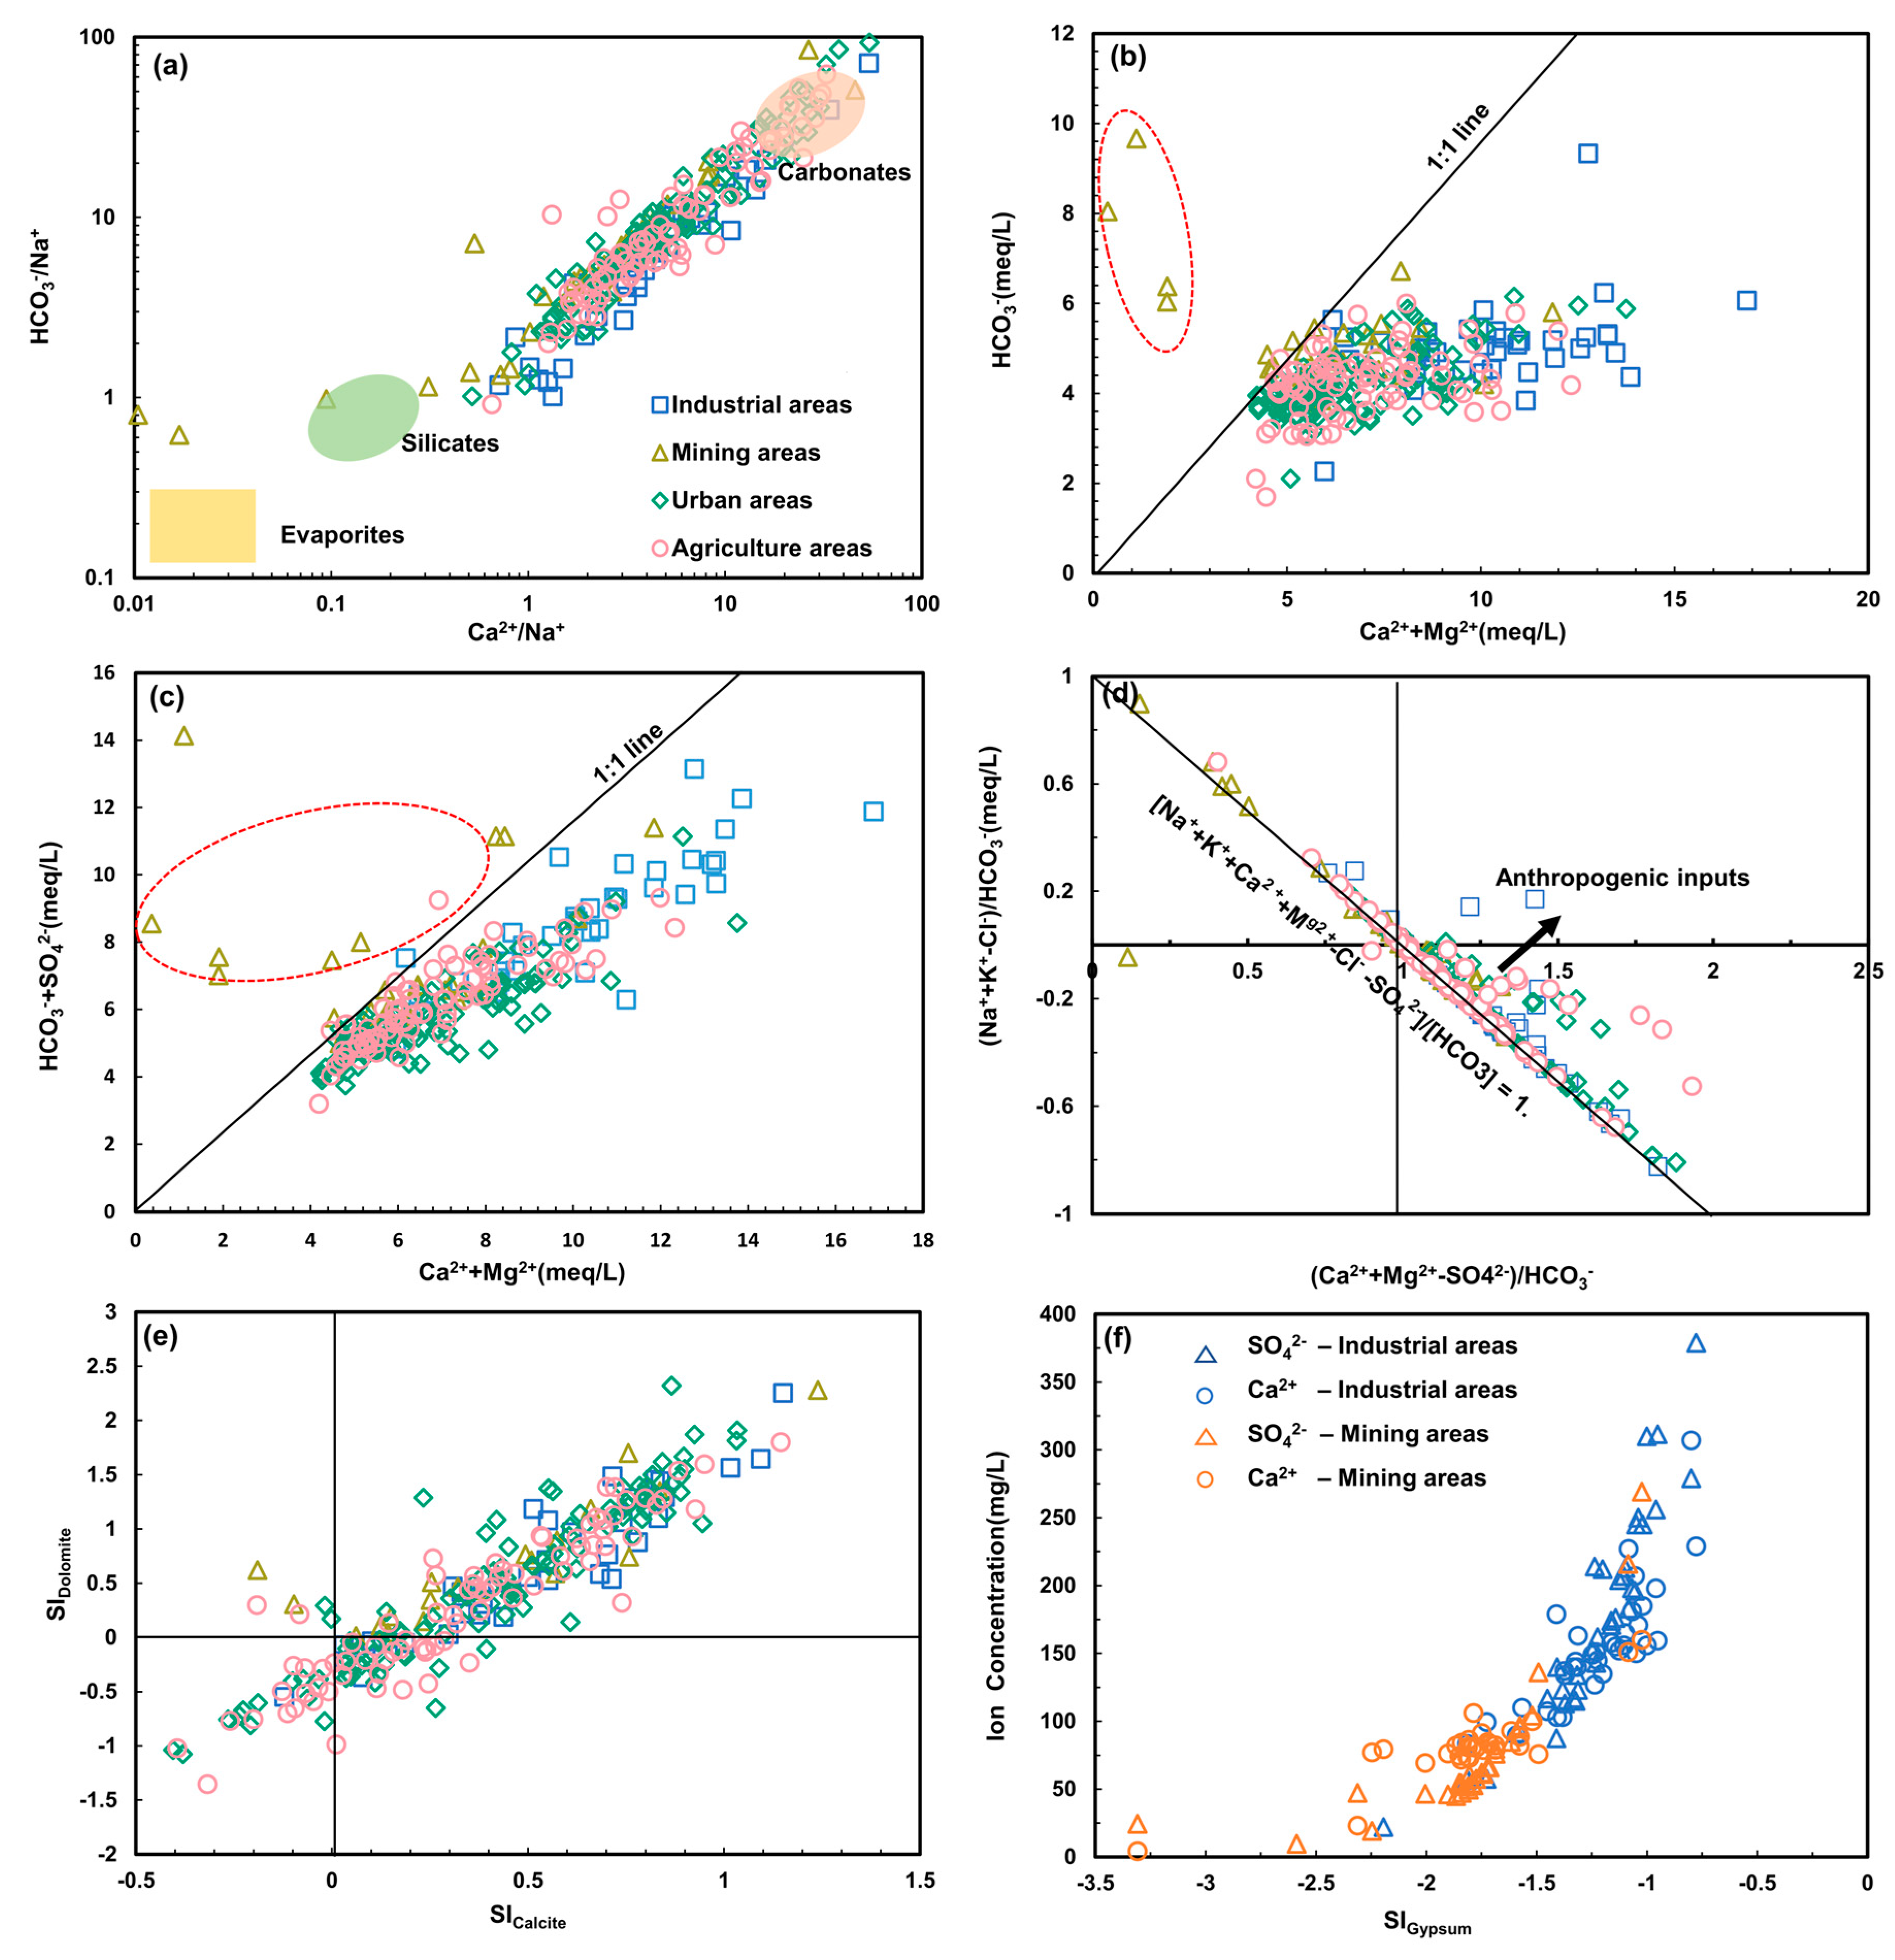
The karst systems predominantly consist of Ordovician limestone, which serves as the primary water-bearing medium. This limestone contains a significant proportion of carbonate minerals, ranging from 70% to 95% of the total mineral composition [42]. The geochemical analysis, specifically the HCO3−/Na+ vs. Ca2+/Na+ diagram (Figure 5a), is crucial for understanding these minerals’ contribution to water solutes in the karst groundwater. This diagram reveals three distinct end-members representing carbonate, silicate, and evaporite minerals. Most groundwater samples in the study area are within the carbonate domain or between the carbonate and silicate zones, suggesting the dissolution of both mineral types in the study area [11]. However, the dissolution is predominantly of carbonate minerals, which leads to the presence of ions like Ca2+, Mg2+, and HCO3− in groundwater systems [15,31]. Groundwater samples from mining areas showed a stronger correlation with silicate dissolution, which aligns with observations from other mining regions [38,40]. Mining activities frequently expose silicate minerals to weathering processes, which are instrumental in forming distinctive chemical signatures in groundwater. Similarly, the samples from the mining areas (within red ellipse) depicted in Figure 5b,c also deviate from the majority, further corroborating this phenomenon. The majority of samples fell below the 1:1 line in the diagram (Figure 5b), suggesting that carbonate dissolution did not fully account for the observed concentrations of Ca2+ and Mg2+. This implied there were additional processes producing Ca2+ and Mg2+ [31]. Considering the inclusion of SO42−, the ratios of (HCO3− + SO42−)/(Ca2+ + Mg2+) in Figure 5c demonstrated that most samples were distributed along the 1:1 line, indicating a significant contribution from gypsum dissolution yielding SO42− and Ca2+ [43]. However, most samples from industrial and urban areas had a ratio of less than 1, suggesting that there must be additional sources of Ca2+ and Mg2+ beyond what can be accounted for by the presence of bicarbonate and sulfate ions alone. In contrast, samples from the mining areas exhibited ratios greater than 1. Similar phenomena in other parts of Shandong Province were also reported [16]. This indicates that the ion exchange where Ca2+ was absorbed in the aquifer medium was replaced by Na+ in groundwater. Most samples did not cluster near the cross lines of (Ca2+ + Mg2+ − SO42−)/HCO3− = 1 and (Na+ + K+ − Cl−)/HCO3− = 0 (see Figure 5d), indicating complex solute sources, not limited to water-rock interaction, can be available, for example external inputs of NO3−, Cl− and other human activity-related sources [15,17]. The overwhelming majority of the samples with Na+ + K+ − Cl− < 0 were plotted in the fourth quadrant, which is the result of the relatively higher concentrations of Cl− in comparison to Na+ + K+. The primary natural source of Cl− is the dissolution of evaporative salts in the Ordovician strata [41].
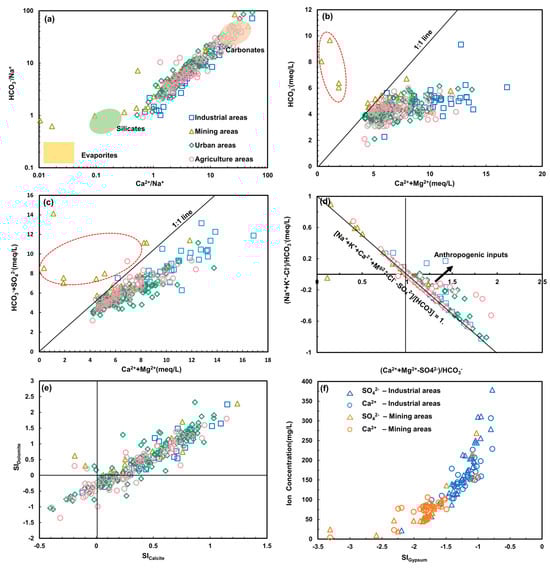
Figure 5.
Scatter plots of selected ion pairs showing dominant water-rock interaction: (a) HCO3−/Na+ vs. Ca2+/Na+; (b) HCO3−/(Ca2+ + Mg2+); (c) (HCO3− + SO42−)/(Ca2+ + Mg2+); (d) (Ca2+ + Mg2+ − SO42−)/HCO3− vs. (Na+ + K+ − Cl−)/HCO3−; (e) SIDolomite/SICalcite; (f) SO42−/SIGypsum and Ca2+/SIGypsum.
To gain further insights into the hydrogeochemical evolution and evaluate the mineral equilibrium between dissolution and precipitation, the saturation index (SI) was used for more specific calculations. The SI values for the key minerals like calcite (CaCO3), dolomite (CaMgCO3), and gypsum (CaSO4) were adopted for the geochemical calculation. The positive SI values for calcite and dolomite (Figure 5e) suggest an over-saturation and potential precipitation for calcite and dolomite. Conversely, the negative SI values for gypsum indicate dissolution, serving as a source of Ca2+, and SO42−, corroborating the findings depicted in Figure 5c. Furthermore, as illustrated in Figure 5f and Figure S4, the concentrations of SO42−, Ca2+ and TDS exhibit an increasing trend, accompanied by an increase in SIgypsum (with R2 values of 0.9, 0.64, and 0.5, respectively) with ascending gypsum. It also proved that the dissolution of gypsum was an important source of SO42− and Ca2+. These observations suggested that the elevated concentration of Ca2+ from gypsum dissolution likely contributed to the observed oversaturation of calcite and dolomite [31,37]. A few samples in the urban and agricultural areas in the lower left corner, where SI values of calcite and dolomite were negative, reflected the enhanced mineral dissolution of dolomite and calcite from human-induced sulfate or chlorine [44].
4.2.2. Ion Exchange
Ion exchange is a natural process that influences the concentrations of Ca2+, Mg2+, and Na+ + K+ in groundwater [38]. The chloro-alkaline (CA) indices are widely used to assess groundwater cation exchange [16]. Negative values of CAI and CAII indicate an exchange between Ca2+ or Mg2+ in groundwater and Na+ + K+ in the soil or rock, while positive values suggest a reverse ion exchange.
In this study, the majority of CAI and all CAII values were positive (Figure S5a), indicating reverse ion exchange. This demonstrated that Na+ + K+ in groundwater replaced Ca2+ and Mg2+ present in the aquifer system, resulting in an increase in the Ca2+ and Mg2+ concentrations in groundwater. In supporting this, the relationship between (Na+ + K+ − Cl−) and (Ca2+ + Mg2+) − (SO42− + HCO3−) in Figure S5b revealed that all groundwater samples were distributed along a straight line (R2 = 0.76, slope = −0.92), signifying the reverse ion exchange. Some groundwater samples from mining areas showed CAI values below zero, deviating from the reverse ion exchange pattern observed in other regions. This discrepancy is likely due to the increased concentrations of Na+ and K+ resulting from acidic mine water, which are higher compared to other functional areas. The elevated levels of Na+ and K+ could be attributed to mineral dissolution or other chemical processes that occur due to mining activities, impacting the ion exchange pattern and leading to negative CAI values.
4.3. Anthropogenic Activities and Potential Source Quantification
4.3.1. Anthropogenic Inputs
Figure 6a illustrates the concentration limit for Class III water quality, represented by the red dotted line. Most samples fell into the acceptable range. In the industrial and coal mining areas, samples exceeding this range were characterized by high SO42− concentrations. The data showed that the elevated SO42− in groundwater differed between the industrial and mining areas. In other similar studies, the karst groundwater also has a high SO42− content in the Niangziguan and Liulin spring areas in northern China [38,40]. Many works argue that SO42− mostly originated from the dissolution of gypsum or the oxidation of pyrite [16]. The relationship between Ca2+ and SIGypsum in the mining areas was not well defined compared to the other functional areas. Figure 5c suggests the amount of gypsum dissolution in the mining area. The increased SO42− concentration in the mining area might indicate oxidation of the sulfur-containing minerals [42]. The industrial areas, influenced dominantly by human activities, were located in the recharge zone. The majority of samples showed over-saturation, likely from an increased carbonate dissolution in the allogeneic recharge zone experiencing a ‘first flush’ effect [9]. Here, the oxidation of sulfides and ammonium during precipitation increased protons, promoting carbonate dissolution and rapidly introducing oxide species and dissolved and suspended substances (including pollutants) into the aquifer [11]. In Figure 6b, many samples fell within the carbonic dissolution of sulfuric acid, confirming this process.
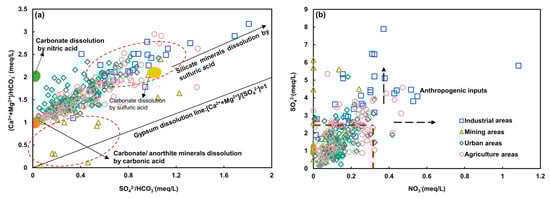
Figure 6.
Scatter plots revealing hydrogeochemical processes: (a) (Ca2+ + Mg2+)/HCO3− vs. SO42−/HCO3−, indicating carbonate and sulfate influence; (b) SO42−/NO3−, identifying sulfate and nitrate contamination sources.
Samples from both industrial and agricultural areas displayed similar patterns with high concentrations of NO3− and SO42−. In agricultural regions, where discharge areas intersect with part of agricultural areas, the heightened levels of NO3− and SO42− are probably due to inputs from upstream and the activities in the overlying agricultural areas, taking into account the hydrogeological conditions. The increasing EWQI values observed from urban to discharge areas, as depicted in the Figure 3a, strongly suggest that urban pollution inputs are accumulating downstream in agricultural areas, leading to excessively high NO3− and SO42− levels compared to other areas.
4.3.2. Potential Source Quantification
PCA, broadly used in geo-statistics and data handling, was employed to interpret the related hydrogeochemical processes [10]. The PCA results in Table S3 revealed that three primary factors (F1-F3) account for 71%, 74%, 73% and 82% of the total hydrogeochemical variability in the urban, industrial, agricultural and mining areas, respectively. Then, APCS-MLR was used to quantify the contributions of identified sources based on the PCA results. SO42−, Cl− and NO3− concentrations, significantly impacting water quality, were chosen to quantitatively assess the influence of natural hydrogeological processes and anthropogenic activities on groundwater chemical evolution. The APCS-MLR results are presented in Figure 7.
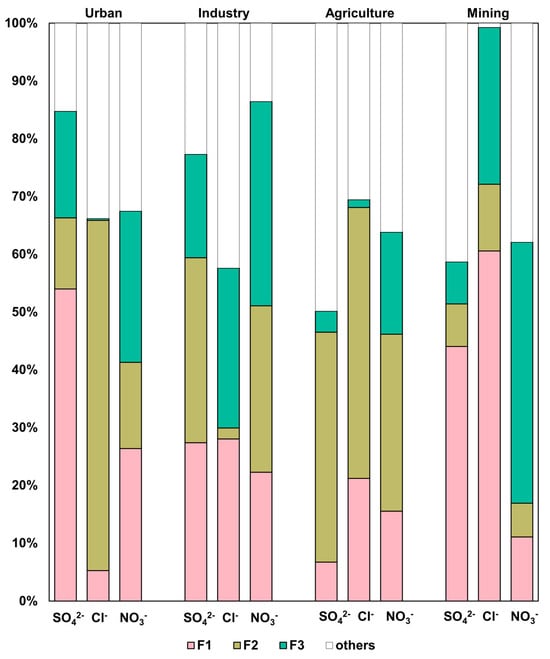
Figure 7.
Average contribution of pollution sources to water quality among 4 functional areas, showing the source apportionment of SO42−, Cl− and NO3− in industrial, urban, agricultural, and mining areas.
In urban areas, F1 is associated with SO42−, Mg2+, and NO3−, primarily representing industrial discharge and human sewage during urbanization. Numerous studies have confirmed that activities such as population growth and waste accumulation contribute to the urbanization process [18,34,39]. F2 is defined by Cl− and Na+ + K+, which can be considered domestic sewage. The more densely populated residential areas produced even higher Cl− concentrations [45]; the possible sources of Cl− included personal care products, sewage wastes, and septic tanks in the processes of industrialization and urbanization [41,46], which easily found their way into the subsurface environment and penetrated into the local karst aquifer. F3 is characterized by pH and Mg2+, suggesting carbonate minerals’ dissolution, a major source of Mg2+, and HCO3− [47]. In urban areas, SO42− and NO3− contribute the most to F1, at 54% and 26.4%, respectively. Cl− contributes the most to F2, with a proportion of 60.6%. F2 also contributes 12.3% to SO42− and 14.9% to NO3−. F3 contributes 18.5% to SO42− and 26.2% to NO3−, with a minimal contribution to Cl− (0.3%).
In industrial areas, F1 consists of Cl−, Na+ + K+, and Ca2+. The presence of HCO3− and Ca2+ together in F1 suggests that it may result from a mix of domestic discharge and natural processes. Domestic sewage is likely another key source of Cl− and Na+ + K+ in local groundwater since sewage commonly infiltrates groundwater in urban regions and is rich in potassium [34]. F2 is associated with SO42−, Mg2+, and NO3−, likely representing industrial pollution. Higher SO42− and NO3− values may result from coal combustion by local enterprises like the Shiheng Power Plant and the steel factory in the industrial areas. F3 has a negative loading for pH and positive loadings for HCO3− and SO42−, which could be influenced by atmospheric acid rain deposition due to local industrial and mining-related enterprises. Rainfall plays a dual role: it triggers intense water-rock interactions in the recharge zone, as acidic precipitation can accelerate carbonate rock dissolution [31,48], and it facilitates the infiltration of sulfuric acid formed from rainwater reacting with sulfur dioxide and nitrogen oxides emitted by coal-fired combustion in local energy-consuming enterprises. The high SO42− values (average of 170 mg) are similar to findings by Huang et al. in the highly industrialized Pearl River Delta region [34,39]. Water samples from this area resembled the patterns of carbonate mineral dissolution by sulfuric acid (Figure 6b), showing a noticeable trend of silicate mineral dissolution [49]. A significant portion of SO42−, Cl−, and NO3− originates from F1, accounting for 27.4%, 28.0%, and 22.3%, respectively. The contributions of SO42− and NO3− are attributed to F2, which significantly contributed 32% and 28.8%, respectively. Meanwhile, 17.9%, 27.7%, and 35.4% to SO42−, Cl−, and NO3− originates from F3, respectively.
In agricultural areas, F1 is significantly influenced by SO42−, Cl−, Ca2+, and NO3−, particularly NO3−. High concentrations of NO3− and Cl− in farmland groundwater are often attributed to the extensive use of nitrogen-based and potassium chloride fertilizers [14,48]. SO42− contamination is mainly due to irrigation using untreated waste, as rivers in the study area have a degree of SO42− pollution [26,50]. Along with agricultural development, nitrate levels steadily increased across most of the study area, as shown in the NO3− box plot (Figure S2h). The average nitrate concentration rose from 0.35 mg/L to 10 mg/L between 1996 and 2015. Thus, F1 can be identified as irrigation and fertilization in agricultural activities. F2 is related to pH, HCO3−, and Mg2+, which are explained by hydrogeological processes. F3 represents Na+ + K+, probably due to the evaporation of soil water during irrigation. 6.7%, 21.2%, and 15.5% of SO42−, Cl− and NO3− are contributed by F1, respectively. Natural hydrological cycles contributed more to NO3− (30.6%) than irrigation and fertilization (15.5%). However, due to interception and natural purification processes in the vadose zone and Quaternary sediment aquifers [51], only a small portion of NO3− entered the karst aquifer. The primary source of NO3− in groundwater came from inputs in the upper gradient via the hydrogeological cycle, highlighting the significance of groundwater flow in pollutant transport.
In the mining areas, F1 shows high positive loadings of SO42−, Cl−, Ca2+, and Mg2+, likely due to a mixing effect from the dissolution of sulfur-containing minerals and limestone minerals. This could be related to wastewater discharge from mining and mineral processing activities in the mining region. The high SO42− concentrations in mining areas result from acidic mineral water formed by the oxidation of pyrite, which then drains into the limestone aquifer [3,30]. F2, with high positive loadings of HCO3− and Na+ + K+, is probably due to the acidic mine water causing extensive dissolution of silicate and Ordovician limestone. Moreover, samples with high concentrations of sulfate, nitrite, and chlorine further enhance the dissolution of silicate minerals like albite and potash feldspar, leading to increased Na+ + K+ in the mining areas [42]. F3 is primarily influenced by pH and NO3−, with acid mine water and denitrification processes commonly seen in coal mining activities [52]. The denitrification process is further confirmed by the lowest concentrations of NO3− found in the mining areas. A substantial portion of 44.1% of SO42−, 60.6% of Cl−, and 11.1% of NO3− can be attributed to F1, significantly influencing the water quality in the mining area. In comparison, 7.4% of SO42−, 11.5% of Cl− and 5.9% of NO3− originate from F2. Additionally, 27.2% of Cl− and 45.2% of NO3− are derived from F3.
The results of source apportionment reveal that human activities introduce various contaminants into aquifers, and pollutants entering at different locations have significantly different outcomes from a hydrological cycle perspective. The crucial role of the natural groundwater cycle in spreading and distributing pollutants emphasizes the karst system’s rapid response to human impacts. For instance, the recharge areas in this study received substantial amounts of potential industrial pollutants, leading to groundwater quality deterioration both locally and downstream. Meanwhile, natural processes such as water-rock interactions, precipitation, and the dissolution of carbonate and silicate minerals play a key role in the hydrogeochemical dynamics of karst systems. The interplay between natural processes and human-induced factors highlights the complexity of managing karst groundwater resources. Addressing this complexity requires an understanding of both natural and anthropogenic factors, as well as their combined effects on groundwater quality and distribution. Such understanding is vital for developing effective environmental management strategies that protect and sustain these fragile groundwater systems.
4.4. Environmental Implication
Analysis based on the major ions in groundwater is a fundamental and straightforward hydrogeological method to determine the groundwater chemistry characteristics, geochemical evolution, and driving forces. The long-term hydrogeochemical data revealed the karst groundwater’s characteristics and chemistry, which were sensitive to various human activities. The results supported our understanding of the interaction between human activities and regional and local hydrogeological contexts. The statistical methods used to quantitatively estimate geochemical processes and identify potential pollutant sources provided a better understanding the study beyond typical qualitative analysis approaches. By linking the hydrochemical characteristics to the broader hydrological cycle, from specific functional areas to the entire study region, more efficiently quantified results can be achieved, thus reducing uncertainty in the characterization of the karst subsurface systems and overcoming the complexities of numerical models.
Feicheng, as a traditional agricultural county with the impact of an overdeveloped coal industry in northern China, faced prolonged anthropogenic disturbances and complicated impacts on the karst groundwater systems. This study emphasized the vulnerability of karst groundwater in northern China to contamination from overlying human activities, which occurred through ‘recharge-runoff-discharge’ flow paths in the karst systems. The recharge zone acted as a conduit between the karst groundwater system and the external environment. It had high hydraulic connectivity but limited self-purification capacity in the vadose zone, increasing its vulnerability to atmospheric and surface soil pollutants and waste disposals [40,53]. Such characteristics of the karst systems resulted in a rapid response to environmental disturbances, leading to a much higher risk of pollutant dispersion. The increasing urbanization and changing climatic conditions have escalated the challenges of meeting water resource demands. Northern China, one of the world’s most densely populated regions, faced significant challenges in water use efficiency, water quality degradation, and water resource management. The region’s agricultural and industrial background, together with other diverse human activities, adversely affected the subsurface environment. These challenges require to be addressed in the implementation of suitable strategies for groundwater utilization and environmental protection simultaneously in these karst aquifers [14,54]. One approach involved reducing pollutant input into the subsurface environment from human activities. This included controlling the use of fertilizer in agriculture, proper management of mining water, and effectively enhancing wastewater treatment from the urban and industrial activities. Additionally, potential ecological and environmental risks should be considered during changes in land use types. For instance, the karst recharge zones should be strictly protected in urban development planning, maintaining a proper water head protection zone to be eco-safe from human activities. Moreover, long-term monitoring of multi-element data on both regional and local scales would be essential for a better and more thorough understanding of the karst groundwater systems.
5. Conclusions
This study presents a comprehensive analysis of hydrogeochemical processes and their implications on groundwater chemistry in karst systems using a coupled integrated geochemical data analysis and geostatistical modelling. The findings demonstrated a significant influence of water-rock interactions, anthropogenic activities, and hydrogeological dynamics on the evolution of groundwater chemistry. The spatial and temporal variations in major ions, particularly sulfate, chloride, nitrate, and TDS, highlighted the complex interplay between natural hydrogeological processes and anthropogenic activities.
The water quality variables, including sulfate, chloride, nitrate, and TDS, were observed to exhibit the highest concentrations in recharge areas, subsequently decreasing, and then increasing again in discharge areas. These elevated concentrations in recharge zones were found to be the result of anthropogenic inputs and the inherent vulnerability of the karst system’s recharge areas. Consequently, it has been demonstrated that continuous hydrological action and the accumulation of contaminants during the flow of groundwater lead to the deterioration of water quality in discharge areas. Furthermore, the persistent deterioration of water quality over time has been attributed to the urbanization process that has occurred over the last three decades. This highlighted the vulnerability of karst aquifers to anthropogenic activities and underscored the importance of implementing effective water management strategies.
Natural factors, including water-rock interactions and ion exchange, primarily involving the dissolution of minerals such as calcite, dolomite, and gypsum, were identified. The geostatistical model system APCS-MLR quantitatively estimated the source apportionment of SO42−, Cl−, and NO3−. Results showed that 60% of the Cl− in urban areas originated from domestic sewage. Some 32% of SO42− and 29% of NO3− in the industrial areas were attributed to industrial pollution. The natural flow systems accounted for 31% of NO3− in the agricultural areas, while fertilizers contributed only 16% due to interception by the Quaternary low permeable sediments. Acid mine drainage and associated denitrification processes were observed in the mining areas. As the karst aquifers continued to face increasing environmental pressures, proactive and knowledge-based management strategies appeared important for preserving the vital karst water resources.
Supplementary Materials
The following supporting information can be downloaded at: https://www.mdpi.com/article/10.3390/w16121656/s1. Figure S1: Satellite image of the study area from 1996 to 2015 (red line: the boundary of the urban area; blue line: the boundary of the industrial area). Figure S2: Box plot of major ions from 1996 to 2015. Figure S3: Gibbs diagram depicting the main processes controlling water chemistry. Figure S4: Relationship between SIGypsum, Ca2+, and TDS. Figure S5: Ion exchange: (a) CA I versus CA II; (b) Na+ + K+ − Cl− versus Ca2+ + Mg2+-SO42− + HCO3−. Table S1: Statistical results of solute from 4 functional areas (mg/L, expect pH); Table S2: The ANVOVA test showing the mean differences among 4 clusters. Table S3: Loadings of variables on principal components of water quality parameters. Text S1: Quality control and quality assurances. Text S2: Workflow for calculating EWQI. References [36,55] are cited in the Supplementary Materials.
Author Contributions
Conceptualization, methodology, writing—original draft preparation, C.Z.; investigation, resources, B.Z.; data curation, software, R.J. and W.Z.; writing—review and editing, J.Z. and Y.Y.; supervision, Y.Y. All authors have read and agreed to the published version of the manuscript.
Funding
This work was supported in part by the Key Research and Development Program of Shandong province (2017GSF20101) and the Water Resources Research Program of Shandong province (SDSLKY201601). It is also supported by the National Natural Science Foundation of China (grant No. 42277189, 42172284) and the Natural Science Foundation Program of Jilin Province (20210101096JC).
Data Availability Statement
Data from the analysis and reporting results during the study can be obtained by contacting the authors.
Acknowledgments
The authors gratefully acknowledge the invaluable support provided by the Water Resources Research Institute of Shandong Province and the Municipal Water Conservancy Bureau of Feicheng for their assistance in field and laboratory work as well as data acquisition, which were crucial in the completion of this paper.
Conflicts of Interest
The authors declare no conflicts of interest.
References
- Campanale, C.; Losacco, D.; Triozzi, M.; Massarelli, C.; Uricchio, V.F. An Overall Perspective for the Study of Emerging Contaminants in Karst Aquifers. Resources 2022, 11, 105. [Google Scholar] [CrossRef]
- Kalhor, K.; Ghasemizadeh, R.; Rajic, L.; Alshawabkeh, A. Assessment of groundwater quality and remediation in karst aquifers: A review. Groundw. Sustain. Dev. 2019, 8, 104–121. [Google Scholar] [CrossRef] [PubMed]
- Sun, J.; Takahashi, Y.; Strosnider, W.H.J.; Kogure, T.; Wang, B.; Wu, P.; Zhu, L.; Dong, Z. Identification and quantification of contributions to karst groundwater using a triple stable isotope labeling and mass balance model. Chemosphere 2021, 263, 127946. [Google Scholar] [CrossRef] [PubMed]
- Yu, X.; Ghasemizadeh, R.; Padilla, I.; Irizarry, C.; Kaeli, D.; Alshawabkeh, A. Spatiotemporal changes of CVOC concentrations in karst aquifers: Analysis of three decades of data from Puerto Rico. Sci. Total Environ. 2015, 511, 1–10. [Google Scholar] [CrossRef] [PubMed]
- Yang, P.; Wang, Y.; Wu, X.; Chang, L.; Ham, B.; Song, L.; Groves, C. Nitrate sources and biogeochemical processes in karst underground rivers impacted by different anthropogenic input characteristics. Environ. Pollut. 2020, 265, 114835. [Google Scholar] [CrossRef] [PubMed]
- Ruggieri, R.; Forti, P.; Antoci, M.L.; De Waele, J. Accidental contamination during hydrocarbon exploitation and the rapid transfer of heavy-mineral fines through an overlying highly karstified aquifer (Paradiso Spring, SE Sicily). J. Hydrol. 2017, 546, 123–132. [Google Scholar] [CrossRef]
- Frank, S.; Goeppert, N.; Ohmer, M.; Goldscheider, N. Sulfate variations as a natural tracer for conduit-matrix interaction in a complex karst aquifer. Hydrol. Process. 2019, 33, 1292–1303. [Google Scholar] [CrossRef]
- Pacheco Castro, R.; Pacheco Ávila, J.; Ye, M.; Cabrera Sansores, A. Groundwater Quality: Analysis of Its Temporal and Spatial Variability in a Karst Aquifer. Groundwater 2018, 56, 62–72. [Google Scholar] [CrossRef] [PubMed]
- Moore, P.J.; Martin, J.B.; Screaton, E.J. Geochemical and statistical evidence of recharge, mixing, and controls on spring discharge in an eogenetic karst aquifer. J. Hydrol. 2009, 376, 443–455. [Google Scholar] [CrossRef]
- Gil-Marquez, J.M.; Andreo, B.; Mudarra, M. Combining hydrodynamics, hydrochemistry, and environmental isotopes to understand the hydrogeological functioning of evaporite-karst springs. An example from southern Spain. J. Hydrol. 2019, 576, 299–314. [Google Scholar] [CrossRef]
- Wu, Y.; Luo, Z.; Luo, W.; Ma, T.; Wang, Y. Multiple isotope geochemistry and hydrochemical monitoring of karst water in a rapidly urbanized region. J. Contam. Hydrol. 2018, 218, 44–58. [Google Scholar] [CrossRef] [PubMed]
- Jebreen, H.; Banning, A.; Wohnlich, S.; Niedermayr, A.; Ghanem, M.; Wisotzky, F. The Influence of Karst Aquifer Mineralogy and Geochemistry on Groundwater Characteristics: West Bank, Palestine. Water 2018, 10, 1829. [Google Scholar] [CrossRef]
- Hadley, P.W.; Newell, C. The New Potential for Understanding Groundwater Contaminant Transport. Groundwater 2014, 52, 174–186. [Google Scholar] [CrossRef] [PubMed]
- Hu, K.; Huang, Y.; Li, H.; Li, B.; Chen, D.; White, R.E. Spatial variability of shallow groundwater level, electrical conductivity and nitrate concentration, and risk assessment of nitrate contamination in North China Plain. Environ. Int. 2005, 31, 896–903. [Google Scholar] [CrossRef] [PubMed]
- Huang, T.; Fan, Y.; Long, Y.; Pang, Z. Quantitative calculation for the contribution of acid rain to carbonate weathering. J. Hydrol. 2019, 568, 360–371. [Google Scholar] [CrossRef]
- Qiao, W.; Li, W.; Zhang, S.; Niu, Y. Effects of coal mining on the evolution of groundwater hydrogeochemistry. Hydrogeol. J. 2019, 27, 2245–2262. [Google Scholar] [CrossRef]
- Yang, P.; Li, Y.; Groves, C.; Hong, A. Coupled hydrogeochemical evaluation of a vulnerable karst aquifer impacted by septic effluent in a protected natural area. Sci. Total Environ. 2019, 658, 1475–1484. [Google Scholar] [CrossRef] [PubMed]
- Zhang, M.; Huang, G.; Liu, C.; Zhang, Y.; Chen, Z.; Wang, J. Distributions and origins of nitrate, nitrite, and ammonium in various aquifers in an urbanized coastal area, south China. J. Hydrol. 2020, 582, 124528. [Google Scholar] [CrossRef]
- Cheng, G.; Wang, M.; Chen, Y.; Gao, W. Source apportionment of water pollutants in the upstream of Yangtze River using APCS-MLR. Environ. Geochem. Health 2020, 42, 3795–3810. [Google Scholar] [CrossRef] [PubMed]
- Banda, L.C.; Kalin, R.M.; Phoenix, V. Isotope Hydrology and Hydrogeochemical Signatures in the Lake Malawi Basin: A Multi-Tracer Approach for Groundwater Resource Conceptualisation. Water 2024, 16, 1587. [Google Scholar] [CrossRef]
- Gholizadeh, M.H.; Melesse, A.M.; Reddi, L.J.S.o.t.T.E. Water quality assessment and apportionment of pollution sources using APCS-MLR and PMF receptor modeling techniques in three major rivers of South Florida. Sci. Total Environ. 2016, 566–567, 1552–1567. [Google Scholar] [CrossRef]
- Abdul-Wahab, D.; Asare, E.A.; Wahi, R.; Ngaini, Z.; Klutse, N.A.B.; Asamoah, A. Deciphering groundwater pollution in the Lower Anayari Catchment: Insights from using δ2H, δ18O, PMF, and APCS-MLR receptor model. Environ. Sci. Pollut. Res. 2024, 31, 27099–27116. [Google Scholar] [CrossRef] [PubMed]
- Wei, X. Study on Numerical Simulation of Groundwater Dynamic Characteristics in Feicheng Basin. Master’s Thesis, University of Jinan, Jinan, China, 2014. (In Chinese with English abstract). [Google Scholar]
- Li, Y.; Feng, J.; Wang, W.; Wan, W.; Wu, Y.; Hou, D. Optimization and rationalization of karst groundwater resource in Feicheng Basin, China. Environ. Geol. 2007, 53, 741–749. [Google Scholar] [CrossRef]
- Cui, S.; Zhang, B.; Fan, M.; Wei, X.; Zhang, J.; Liu, D.; Ww, Q.; Liu, J. Research on the Evolution Law of Groundwater Hydrochemistry in Feicheng Basin. Yellow River 2015, 37, 75–79, (In Chinese with English abstract). [Google Scholar]
- Liu, D. The Characteristics of Shallow Groundwater Quality Evolution and Water Resources Protection in Feicheng Basin. Master’s Thesis, China Agricultural University, Beijing, China, 2006. (In Chinese with English abstract). [Google Scholar]
- Wei, X.; Zhang, B.; Li, W.; Liu, D.; Zhang, J. Research on the Numerical Simulation of Karst Groundwater in Feicheng Basin. China Rural. Water Hydropower 2015, 11, 59–64, (In Chinese with English abstract). [Google Scholar]
- Li, Y.; Feng, J.; Wu, Y.; Wang, W.; Huo, D. Sustainable Utilization of Karst Groundwater in Feicheng Basin, Shandong Province, China. In Proceedings of the Sinkholes and the Engineering and Environmental Impacts of Karst, San Antonio, TX, USA, 24–28 September 2005; pp. 142–153. [Google Scholar]
- Zhang, Z. Water Environmental Assessment in Feicheng City Mining Area. Master’s Thesis, Shandong University of Science and Technology, Qingdao, China, 2004. (In Chinese with English abstract). [Google Scholar]
- Shi, L.; Qiu, M.; Wang, Y.; Qu, X.; Liu, T. Evaluation of water inrush from underlying aquifers by using a modified water-inrush coefficient model and water-inrush index model: A case study in Feicheng coalfield, China. Hydrogeol. J. 2019, 27, 2105–2119. [Google Scholar] [CrossRef]
- Ma, R.; Wang, Y.; Sun, Z.; Zheng, C.; Ma, T.; Prommer, H. Geochemical evolution of groundwater in carbonate aquifers in Taiyuan, northern China. Appl. Geochem. 2011, 26, 884–897. [Google Scholar] [CrossRef]
- GB/T 14848-2017; Standard for Groundwater Quality. General Administration of Quality Supervision, Inspection and Quarantine of the People’s Republic of China: Beijing, China, 2017. (In Chinese)
- Tobin, B.W.; Schwartz, B.F. Using periodic hydrologic and geochemical sampling with limited continuous monitoring to characterize remote karst aquifers in the Kaweah River Basin, California, USA. Hydrol. Process. 2016, 30, 3361–3372. [Google Scholar] [CrossRef]
- Huang, G.; Liu, C.; Sun, J.; Zhang, M.; Jing, J.; Li, L. A regional scale investigation on factors controlling the groundwater chemistry of various aquifers in a rapidly urbanized area: A case study of the Pearl River Delta. Sci. Total Environ. 2018, 625, 510–518. [Google Scholar] [CrossRef] [PubMed]
- Shamsi, A.; Karami, G.H.; Hunkeler, D.; Taheri, A. Isotopic and hydrogeochemical evaluation of springs discharging from high-elevation karst aquifers in Lar National Park, northern Iran. Hydrogeol. J. 2019, 27, 655–667. [Google Scholar] [CrossRef]
- Subba Rao, N.; Sunitha, B.; Adimalla, N.; Chaudhary, M. Quality criteria for groundwater use from a rural part of Wanaparthy District, Telangana State, India, through ionic spatial distribution (ISD), entropy water quality index (EWQI) and principal component analysis (PCA). Environ. Geochem. Health 2020, 42, 579–599. [Google Scholar] [CrossRef] [PubMed]
- Han, Y.; Wang, G.; Cravotta Iii, C.A.; Hu, W.; Bian, Y.; Zhang, Z.; Liu, Y. Hydrogeochemical evolution of Ordovician limestone groundwater in Yanzhou, North China. Hydrol. Process. 2013, 27, 2247–2257. [Google Scholar] [CrossRef]
- Lin, Y.; Ren, H.; Wu, Y.; Cao, F.; Jia, F.; Qu, P. The evolution of hydrogeochemical characteristics of a typical piedmont karst groundwater system in a coal-mining area, Northern China. Environ. Earth Sci. 2019, 78, 557. [Google Scholar] [CrossRef]
- Liu, R.; Xie, X.; Qian, Y.; Hou, Q.; Han, D.; Song, J.; Huang, G. Groundwater sulfate in the Pearl River Delta driven by urbanization: Spatial distribution, sources and factors. Appl. Geochem. 2023, 156, 105766. [Google Scholar] [CrossRef]
- Zhang, X.; Li, X.; Gao, X. Hydrochemistry and coal mining activity induced karst water quality degradation in the Niangziguan karst water system, China. Environ. Sci. Pollut. Res. 2016, 23, 6286–6299. [Google Scholar] [CrossRef] [PubMed]
- Jiang, Y.; Wu, Y.; Groves, C.; Yuan, D.; Kambesis, P. Natural and anthropogenic factors affecting the groundwater quality in the Nandong karst underground river system in Yunan, China. J. Contam. Hydrol. 2009, 109, 49–61. [Google Scholar] [CrossRef] [PubMed]
- Liu, P.; Yang, M.; Sun, Y. Hydro-geochemical processes of the deep Ordovician groundwater in a coal mining area, Xuzhou, China. Hydrogeol. J. 2019, 27, 2231–2244. [Google Scholar] [CrossRef]
- Sun, J.; Takahashi, Y.; Strosnider, W.H.J.; Kogure, T.; Wu, P.; Cao, X. Tracing and quantifying contributions of end members to karst water at a coalfield in southwest China. Chemosphere 2019, 234, 777–788. [Google Scholar] [CrossRef] [PubMed]
- Chetelat, B.; Liu, C.Q.; Zhao, Z.Q.; Wang, Q.L.; Li, S.L.; Li, J.; Wang, B.L. Geochemistry of the dissolved load of the Changjiang Basin rivers: Anthropogenic impacts and chemical weathering. Geochim. Cosmochim. Acta 2008, 72, 4254–4277. [Google Scholar] [CrossRef]
- Chen, J.; Luo, M.; Wan, L.; Wang, J.; Gan, Y.; Zhou, H. Accumulation, conversion and storage of solute from sinkholes to karst spring under concentrated recharge conditions. J. Hydrol. 2023, 620, 129396. [Google Scholar] [CrossRef]
- Subba Rao, N.; Marghade, D.; Dinakar, A.; Chandana, I.; Sunitha, B.; Ravindra, B.; Balaji, T. Geochemical characteristics and controlling factors of chemical composition of groundwater in a part of Guntur district, Andhra Pradesh, India. Environ. Earth Sci. 2017, 76, 747. [Google Scholar] [CrossRef]
- Négrel, P.; Pauwels, H.; Chabaux, F. Characterizing multiple water-rock interactions in the critical zone through Sr-isotope tracing of surface and groundwater. Appl. Geochem. 2018, 93, 102–112. [Google Scholar] [CrossRef]
- Huang, G.; Sun, J.; Zhang, Y.; Chen, Z.; Liu, F. Impact of anthropogenic and natural processes on the evolution of groundwater chemistry in a rapidly urbanized coastal area, South China. Sci. Total Environ. 2013, 463–464, 209–221. [Google Scholar] [CrossRef] [PubMed]
- Liu, J.; Han, G. Major ions and δ34SSO4 in Jiulongjiang River water: Investigating the relationships between natural chemical weathering and human perturbations. Sci. Total Environ. 2020, 724, 138208. [Google Scholar] [CrossRef] [PubMed]
- Torres-Martinez, J.A.; Mora, A.; Knappett, P.S.K.; Ornelas-Soto, N.; Mahlknecht, J. Tracking nitrate and sulfate sources in groundwater of an urbanized valley using a multi-tracer approach combined with a Bayesian isotope mixing model. Water Res. 2020, 182, 115962. [Google Scholar] [CrossRef]
- Turkeltaub, T.; Kurtzman, D.; Dahan, O. Real-time monitoring of nitrate transport in the deep vadose zone under a crop field-implications for groundwater protection. Hydrol. Earth Syst. Sci. 2016, 20, 3099–3108. [Google Scholar] [CrossRef]
- Villegas-Plazas, M.; Sanabria, J.; Junca, H. A composite taxonomical and functional framework of microbiomes under acid mine drainage bioremediation systems. J. Environ. Manag. 2019, 251, 109581. [Google Scholar] [CrossRef] [PubMed]
- Morita, A.K.M.; Pelinson, N.d.S.; Elis, V.R.; Wendland, E. Long-term geophysical monitoring of an abandoned dumpsite area in a Guarani Aquifer recharge zone. J. Contam. Hydrol. 2020, 230, 103623. [Google Scholar] [CrossRef] [PubMed]
- Wang, S.; Tang, C.; Song, X.; Yuan, R.; Han, Z.; Pan, Y. Factors contributing to nitrate contamination in a groundwater recharge area of the North China Plain. Hydrol. Process. 2016, 30, 2271–2285. [Google Scholar] [CrossRef]
- Su, H.; Kang, W.; Xu, Y.; Wang, J. Assessing Groundwater Quality and Health Risks of Nitrogen Pollution in the Shenfu Mining Area of Shaanxi Province, Northwest China. Expo. Health 2017, 10, 77–97. [Google Scholar] [CrossRef]


Disclaimer/Publisher’s Note: The statements, opinions and data contained in all publications are solely those of the individual author(s) and contributor(s) and not of MDPI and/or the editor(s). MDPI and/or the editor(s) disclaim responsibility for any injury to people or property resulting from any ideas, methods, instructions or products referred to in the content. |
© 2024 by the authors. Licensee MDPI, Basel, Switzerland. This article is an open access article distributed under the terms and conditions of the Creative Commons Attribution (CC BY) license (https://creativecommons.org/licenses/by/4.0/).