Article

Efficient H2O2 Production and Activation by Air Diffusion Cathode Combined with Ultraviolet for Lake Water Treatment: A Long-Term Evaluation

1
School of Urban Construction, Wuhan University of Science and Technology, Wuhan 430065, China
2
Hebei Key Laboratory of Wetland Ecology and Conservation, Hengshui University, 1088 Heping West Road, Hengshui 053000, China
3
State Key Laboratory of Environmental Criteria and Risk Assessment, Chinese Research Academy of Environmental Sciences, Beijing 100012, China
*
Author to whom correspondence should be addressed.
Water 2024, 16(12), 1658; https://doi.org/10.3390/w16121658
Submission received: 7 May 2024 / Revised: 31 May 2024 / Accepted: 5 June 2024 / Published: 11 June 2024
(This article belongs to the Special Issue The Application of Electrochemical Methods in Water Treatment)

Abstract

:
This study utilizes a natural air diffusion cathode (ADC) and an ultraviolet lamp to construct a UV/H2O2 reactor for the in situ synthesis and activation of H2O2 and evaluates its potential application in practical lake water treatment. The results indicate that the reactor exhibits stable treatment performance during a continuous flow experiment of 80 h. The air diffusion cathode maintains an H2O2 concentration of above 350 mg·L−1 in sodium sulfate electrolyte and shows no decreasing trend. Under the condition of approximately 59% H2O2 utilization, the removal rates of COD and TOC are 37.6% and 40.0%, respectively; the rate of reduction of A254 is 64.3%; while the total bacterial count removal rate reaches 100%. Large organic molecules in surface water are degraded to small organic molecules and mineralized to inorganic minor molecules. It effectively ameliorates the problem of organic pollution of surface water and effectively kills bacteria and improves the microbiological safety of the water body. Therefore, the UV/H2O2 system developed in this study, based on electrochemically produced H2O2, is an effective method for treating micro-polluted surface water.

1. Introduction

Lakes, as integral ecosystems and essential freshwater resources, are instrumental in the purification and conservation of water, the modulation of climate dynamics, and the preservation of ecological equilibrium and biodiversity. They are even used as domestic water in some water-scarce areas [1,2]. As human society experiences accelerated growth and development, the ecological health and sustainability of lakes are increasingly under severe threat [3]. Due to rapid industrialization and the spread of intensive agricultural practices, eutrophication and pollution have become widespread in many inland water bodies [4]. Eutrophication precipitates the proliferation of algal and cyanobacterial blooms, culminating in the turbidity and toxicity of water bodies, which in turn endangers biodiversity and compromises the safety of human populations [5]. In addition to the challenges posed by algal growth, lake waters are increasingly found to contain a diverse array of emerging organic contaminants, including pesticides, pharmaceuticals, and personal care products, which are being continuously detected [6,7]. Although the detected concentrations of these organic pollutants are low, their recalcitrant nature and propensity for bioaccumulation necessitate the implementation of advanced treatment methods to ensure their effective degradation, thereby safeguarding water security for humans [8].
Conventional water treatment technologies exhibit constrained efficacy in the remediation of nascent organic contaminants. Moreover, certain process technologies, such as chlorination for disinfection, can engender hazardous by-products like organohalides, thereby precipitating ancillary pollution [9]. In the face of these challenges, advanced oxidation processes are regarded as a promising solution, offering the advantages of high efficiency, versatility, and low secondary pollution [10,11,12]. The potent oxidizing free radicals produced by this process ultimately mineralize chemically recalcitrant organic pollutants present in water to CO2, H2O, and additional inorganic minor molecules, or they facilitate the transformation of more toxic pollutants into low-toxicity, readily biodegradable, small-molecule organic compounds [13,14]. Among the advanced oxidation technologies, ultraviolet/hydrogen peroxide (UV/H2O2) technology has received widespread attention because of its high oxidizing capacity, few toxic by-products, and easy operation [15,16,17]. However, H2O2 needs to be continuously dosed in the UV/H2O2 technology, and as an explosive hazardous chemical, the transportation and storage of high concentrations of H2O2 are risky [18].
The electrochemical reduction of oxygen to synthesize H2O2—a methodology that is continually advancing toward maturity—has garnered substantial interest within the domain of water-treatment technology. This technique affords significant environmental advantages, permits meticulous regulation of concentration, and obviates the potential risks related to the storage and transportation of H2O2 [19,20]. Some studies have shown that the use of electrochemical in situ generation of H2O2 combined with UV for the treatment of wastewater with specific pollutants can achieve good performance [21]. However, there is a lack of empirical data on the application of this technology to the treatment of real water bodies. The composition of real water is complex, and the metal cations (Ca2+, Mg2+, etc.) in the water will accumulate at the cathode under the action of an electric field and generate precipitation on the cathode surface, leading to the deterioration of the electrode and a decrease in the H2O2 production rate [22,23]. Meanwhile, the stability of the system needs to be verified by long-term experiments.
To address the above problems, this paper utilizes a homemade air diffusion cathode with a UV lamp to construct a UV/H2O2 system, which allows the oxygen in the air to naturally diffuse through the gas diffusion layer to the reaction sites on the catalyst layer for H2O2 electrogenesis. To avoid the cathodic scaling problem, we added a bypass of H2O2 electrosynthesis in a sodium sulfate electrolyte. In this study, an actual lake water sample was used as the treatment object to carry out a long continuous-flow experiment. During the experiment, several indicators, including the potential of hydrogen (pH), H2O2 concentration, total organic carbon (TOC), absorbance at 254 nm (A254), chemical oxygen demand (COD), fluorescent substances, and total bacterial counts were monitored and evaluated to comprehensively evaluate the performance of this treatment technology. The results of this paper can verify the feasibility and effectiveness of the UV/H2O2 technology of electrochemical in situ generation of H2O2 in the treatment of surface water and provide data support for the further promotion and application of the technology. It also allows for local water treatment in areas where clean water is scarce, providing a new way to access clean water.

2. Materials and Methods

2.1. Materials

Conductive carbon black BP2000 was purchased from Cabot Co. (Boston, MA, USA). The 60% polytetrafluoroethylene emulsion (PTFE) and titanium sulfate (TiSO4) were purchased from Aladdin, Inc. (Shanghai, China). Ethanol (C2H5OH), manganese dioxide (MnO2), and sodium sulfate (Na2SO4) were purchased from Sinopharm Chemical Reagent Co., Ltd., (Shanghai, China). Catalase (100,000 u/g) was purchased from Shandong Longo Enzyme Preparation Co., Ltd. (Linyi, China). All of the above materials are analytically pure and above and were used as is. Dimensionally stable electrode (DSA, Ti/RuIr) was purchased from Baoji Longsheng Nonferrous Metals Co., Ltd. (Baoji, China)

2.2. Preparation of CB–PTFE Air Diffusion Cathodes

The air diffusion electrode consists of a gas diffusion layer (in contact with air), a catalytic layer (in contact with water), and a current collection layer (connected to the power supply). The conductive carbon black was dispersed in anhydrous ethanol and stirred well and was ultrasonically stirred and mixed for 30 min, while 60% PTFE emulsion was added slowly and dropwise. The mass ratios of carbon black to PTFE in the gas diffusion layer and the catalytic layer were 1:3 and 2:1, respectively. The resulting suspension was dried in a water bath at 80 °C to remove excess ethanol and pressed under a roller press to make a sheet of about 0.2 mm. The 0.2 mm gas diffusion layer and catalytic layer flakes were placed on both sides of a stainless-steel mesh and pressed together to form 0.4 mm flakes, which were left to stand for 24 h and then fired at 340 °C for 1 h.

2.3. Experimental Methods

The experimental water for this study was obtained from Huangjia Lake in Wuhan City, and the main water quality parameters of the lake are shown in Table 1. Samples were taken from the lake at 16:00 every day and kept still in the laboratory. The supernatant was used at 08:00 the next day for the continuous experiments. As shown in Figure 1, the experimental setup was mainly composed of an H2O2 generation chamber, raw water electrolysis chamber, excess H2O2 treatment chamber, and UV reactor. All three chambers had internal dimensions of 2 cm × 2 cm × 16 cm. The raw water was delivered into the electrolysis chamber by a peristaltic pump (LM60B-RZ1030-4, Nanjing Runze Fluid Control Equipment Co., Ltd., Nanjing, China) at 8 mL·min−1. The electrolysis chamber was equipped with two-dimensionally stable electrodes (DSA, Ti/RuIr) at a distance of 2 cm. A solution of 50 mM Na2SO4 was pumped at a rate of 2 mL·min−1 into the H2O2 generation chamber, which consisted of an air diffusion cathode and a DSA anode at a spacing of 2 cm. The gas diffusion layer of the air diffusion cathode was exposed to natural air without an additional gas supply. Then O2 entering from the gaseous diffusion layer was reduced by 2e transfer on the catalytic layer to H2O2 in a Na2SO4 solution. The resulting H2O2 solution was then mixed with the effluent from the electrolysis chamber and fed at a flow rate of 10 mL·min−1 into a UV reactor fitted with a low-pressure mercury lamp (254 nm, 10 watts). The volume of the UV reactor was 250 mL and the residence time was 25 min. The effluent of the UV reactor went into the excess H2O2 treatment chamber, which was filled with MnO2 solid particles. The constant current was supplied by DC power (GPS-X303/C, Taiwan Goodwell Electronics Co., Ltd., New Taipei City, Taiwan).

2.4. Methods of Analysis

pH was measured by pH meter (Multi 3630 IDS, WTW Group, Wuppertal, Germany). H2O2 was measured by a UV–visible spectrophotometer (AOE UV-1800, Shanghai Aoyi Instrument Co., Ltd., Shanghai, China) at wavelength 405 nm after color development by titanium sulfate [24]. Total organic carbon (TOC) was determined by a total organic carbon analyzer (HTY-CT000M, Hangzhou Tailin Biotechnology Equipment Co., Ltd., Hangzhou, China). A254 was determined by a UV–visible spectrophotometer. The samples for COD analysis were pretreated by catalase to remove the interference of H2O2 [25] and then determined by the potassium dichromate method. The enumeration of total bacteria was conducted utilizing the plate culture technique, wherein 0.5 mL water samples were inoculated onto Petri dishes containing agar to achieve an even spread of the sample across the medium’s surface. Following this, the dishes were subjected to an incubation period of 24 h at a temperature of 37 °C to allow for the visualization and subsequent counting of bacterial colonies that emerge. Fluorescent organic matter was detected by a fluorescence spectrophotometer (F-7100, Hitachi High-Technologies Co., Tokyo, Japan), and three-dimensional fluorescence spectrograms were drawn to analyze the fluorescent organic matter. The morphologies of the catalytic layer of the air diffusion electrode were examined on a field-emission SEM (ZEISS Gemini SEM 300, Jena, Germany).
The current efficiency (CE) was calculated using Equation (1) [26],
C E = n C q F I × 100 %
where n is the number of electrons transferred from oxygen reduction to H2O2 (2), C represents the H2O2 concentration (mol·L−1), q is the flow rate (L·s−1), F is Faraday’s constant (96,486 C·mol−1), and I is current intensity (A).
The electric energy consumption (EEC, kWh·kg−1) was calculated with Equation (2) [27],
E E C = U I C q
where U and I are the applied voltage (V) and current (A), respectively; C is the concentration of H2O2 (g·L−1); and q is the flow rate (L·h−1).
The unit electrical energy (kWh·m−3) to treat a unit volume of lake water was calculated from Equation (3),
U E E = P q
where p is the total power (w), which is jointly composed of the electrolysis chamber, the H2O2 generation chamber, and the UV reactor power, and q is the flow rate (L·h−1).

3. Results and Discussion

3.1. Performance of H2O2 Production by the Air Diffusion Cathode

Sodium sulfate solution at a concentration of 50 mM was used as the electrolyte. Then, the effluent concentration of H2O2 under different conditions was determined by varying the magnitude of the current density and flow rate, other performance indicators were calculated, and the corresponding results were plotted (Figure 2).
It was observed that the H2O2 effluent concentration, current efficiency, energy consumption per unit, and rate of production were directly related to the magnitude of the applied current density and flow rate. For example, at a current density of 10 mA·cm−2, the current efficiency decreased from 67.03% to 26.29% as the flow rate decreased from 16 mL·min−1 to 2 mL·min−1. At a constant flow rate, the current efficiency showed a slow decreasing trend with increasing current density. At a flow rate of 16 mL·min−1, the H2O2 production rate increased from 2.29 mg· cm−2·h−1 to 8.75 mg· cm−2·h−1 as the current density was increased from 5 mA·cm−2 to 20 mA·cm−2, showing a linear relationship between the applied current density and the H2O2 production rate, which suggests that it is possible to adjust the applied current density to control the production rate. In addition, the unit energy consumption also increased with increasing current density, from 8.51 kWh·kg−1 at 5 mA·cm−2 to 22.62 kWh·kg−1 at 20 mA·cm−2. As the current density increased, the current efficiency decreased, and the energy consumption of the cell gradually increased, which could be due to the accelerated rate of self-decomposition of H2O2 [21]. The results showed that the electrochemical in situ H2O2 generation reactor in this study was able to provide sufficient H2O2 for surface water treatment within an acceptable range of current efficiency and energy consumption. The effluent concentration of H2O2 increased accordingly with increasing current density and decreasing flow rate; however, this trend was accompanied by a decrease in current efficiency and an increase in the unit energy consumption. The focus of this study is to perform a comprehensive evaluation of UV/H2O2 systems to balance energy consumption and electrolyte cost while pursuing high H2O2 yields.
Considering that the device acts on lake water, it was also necessary to verify the H2O2 production performance of the air diffusion electrode in real lake water. The actual lake water was injected into the H2O2 generation chamber as the electrolyte, and the electrolysis process was carried out for 4 and 8 consecutive hours. The H2O2 concentration of the effluent water was then detected. The results are presented in Figure 3a. After 4 h of continuous electrolysis, the H2O2 concentration of the effluent water was 11.1 mg·L−1, and the current efficiency was 16.8%. After 8 h of electrolysis, the H₂O₂ effluent concentration was 4.76 mg·L−1, and the current efficiency was 7.2%. Compare (b) and (c) in Figure 3: a layer of white scale, which might be induced by precipitation of Ca2+ and Mg2+ in the lake water, covered the surface of the ADC after 8 h operation (Equations (4) and (5)). A similar problem has occurred in previous studies, wherein scale formed on ADC led to the performance deterioration of the electrode [22,23]. To avoid degradation of electrode performance due to deterioration of the electrode surface, subsequent experiments will produce H2O2 by electrolysis in a simulated electrolyte. The method of mixing the resulting H2O2 solution with lake water was used for subsequent lake water treatment experiments.
2 H 2 O + 2 e 2 O H + H 2
C a 2 + M g 2 + + 2 O H C a O H 2 [ M g O H 2 ]
Considering that H2O2 is a strong oxidizing agent, it is worth exploring the effect of its individual action on water quality. The H2O2 solution generated by the electrochemical reduction method was mixed with lake water that had been standing for some time, and after one hour of reaction, the H2O2 content and other water quality indicators were tested. As shown in Table 2, the concentration of H2O2 after 1 h reaction was almost unchanged, leading to a utilization rate of almost zero, and other water quality indexes were also basically unchanged. This observation indicated that H2O2 alone could not oxidize the organic pollutants in the lake water. Therefore, in this study, a quick mixing of raw water with H2O2 solution before entering the UV reactor for advanced oxidation reaction was adopted.
The complex composition of natural water bodies and the scattering and high optical density effects caused by metal cations (Ca2+, Mg2+, etc.), inorganic anions (Cl, etc.), natural organic matter (humic acid, fulvic acid, etc.), and other constituents in the water bodies, all lead to a reduction in the efficiency of UV-activated H2O2 in generating free radicals [15,28]. In this study, it is proposed to use an appropriate increase in the initial concentration of H2O2 in the raw water to reduce the impact of the above problems. Therefore, on the premise of comprehensive consideration of various factors such as energy consumption, treatment effect, device convenience, and water quality environment, and to ensure that the concentration of H2O2 effluent from the H2O2 generation chamber meets the experimental requirements, for this study we decided that the H2O2 generation chamber would conduct the subsequent experiments under the conditions of a current density of 10 mA·cm−2 and a flow rate of 2 mL·min−1. The subsequent experiments were carried out at a current size of 30 mA and a voltage of 13 V in the raw water electrolysis chamber. The utilization of H2O2 was further explored by monitoring the change in H2O2 concentration in the system during the reaction process and assessing the treatment effect of the excess H2O2 treatment chamber. Through this comprehensive consideration, this study aims to provide a comprehensive assessment of the production and utilization efficiency of H2O2 under optimal experimental conditions and to provide more reliable data support for the experimental results.
According to the results in Figure 4a, the air diffusion cathode performed well in generating H2O2 after up to 80 h. The concentration of H2O2 effluent from the H2O2 generation chamber remained above 350 mg·L−1 and did not show a decreasing trend. Through the characterization of the catalytic layer’s surface, we can gain insights into its structural and functional properties, which are crucial for understanding its performance in electrochemical reactions. As shown in Figure 4b,c, PTFE and carbon black are uniformly distributed on the catalytic layer. After a long time of electrolysis, the structure of the catalytic layer is still compact and there is no obvious change in the morphology, which is the reason why there is no degradation of the electrode performance. When the effluent from the H2O2 generation chamber was mixed with the raw water, the concentration of H2O2 in the influent water of the UV was about 78 mg·L−1, the effluent water of the reactor was about 32 mg·L−1, and the utilization rate of H2O2 was about 59%. The consumption of H2O2 is closely related to the quality of the water and the irradiation time of the UV lamps [29]. To ensure the treatment effect and safety, a post-treatment process was added after the UV reactor effluent to eliminate these potential pitfalls, and the data showed that the H2O2 decomposition chamber was able to decompose H2O2 effectively with a decomposition efficiency of about 60%. These results further prove the treatment effect and safety of the system.

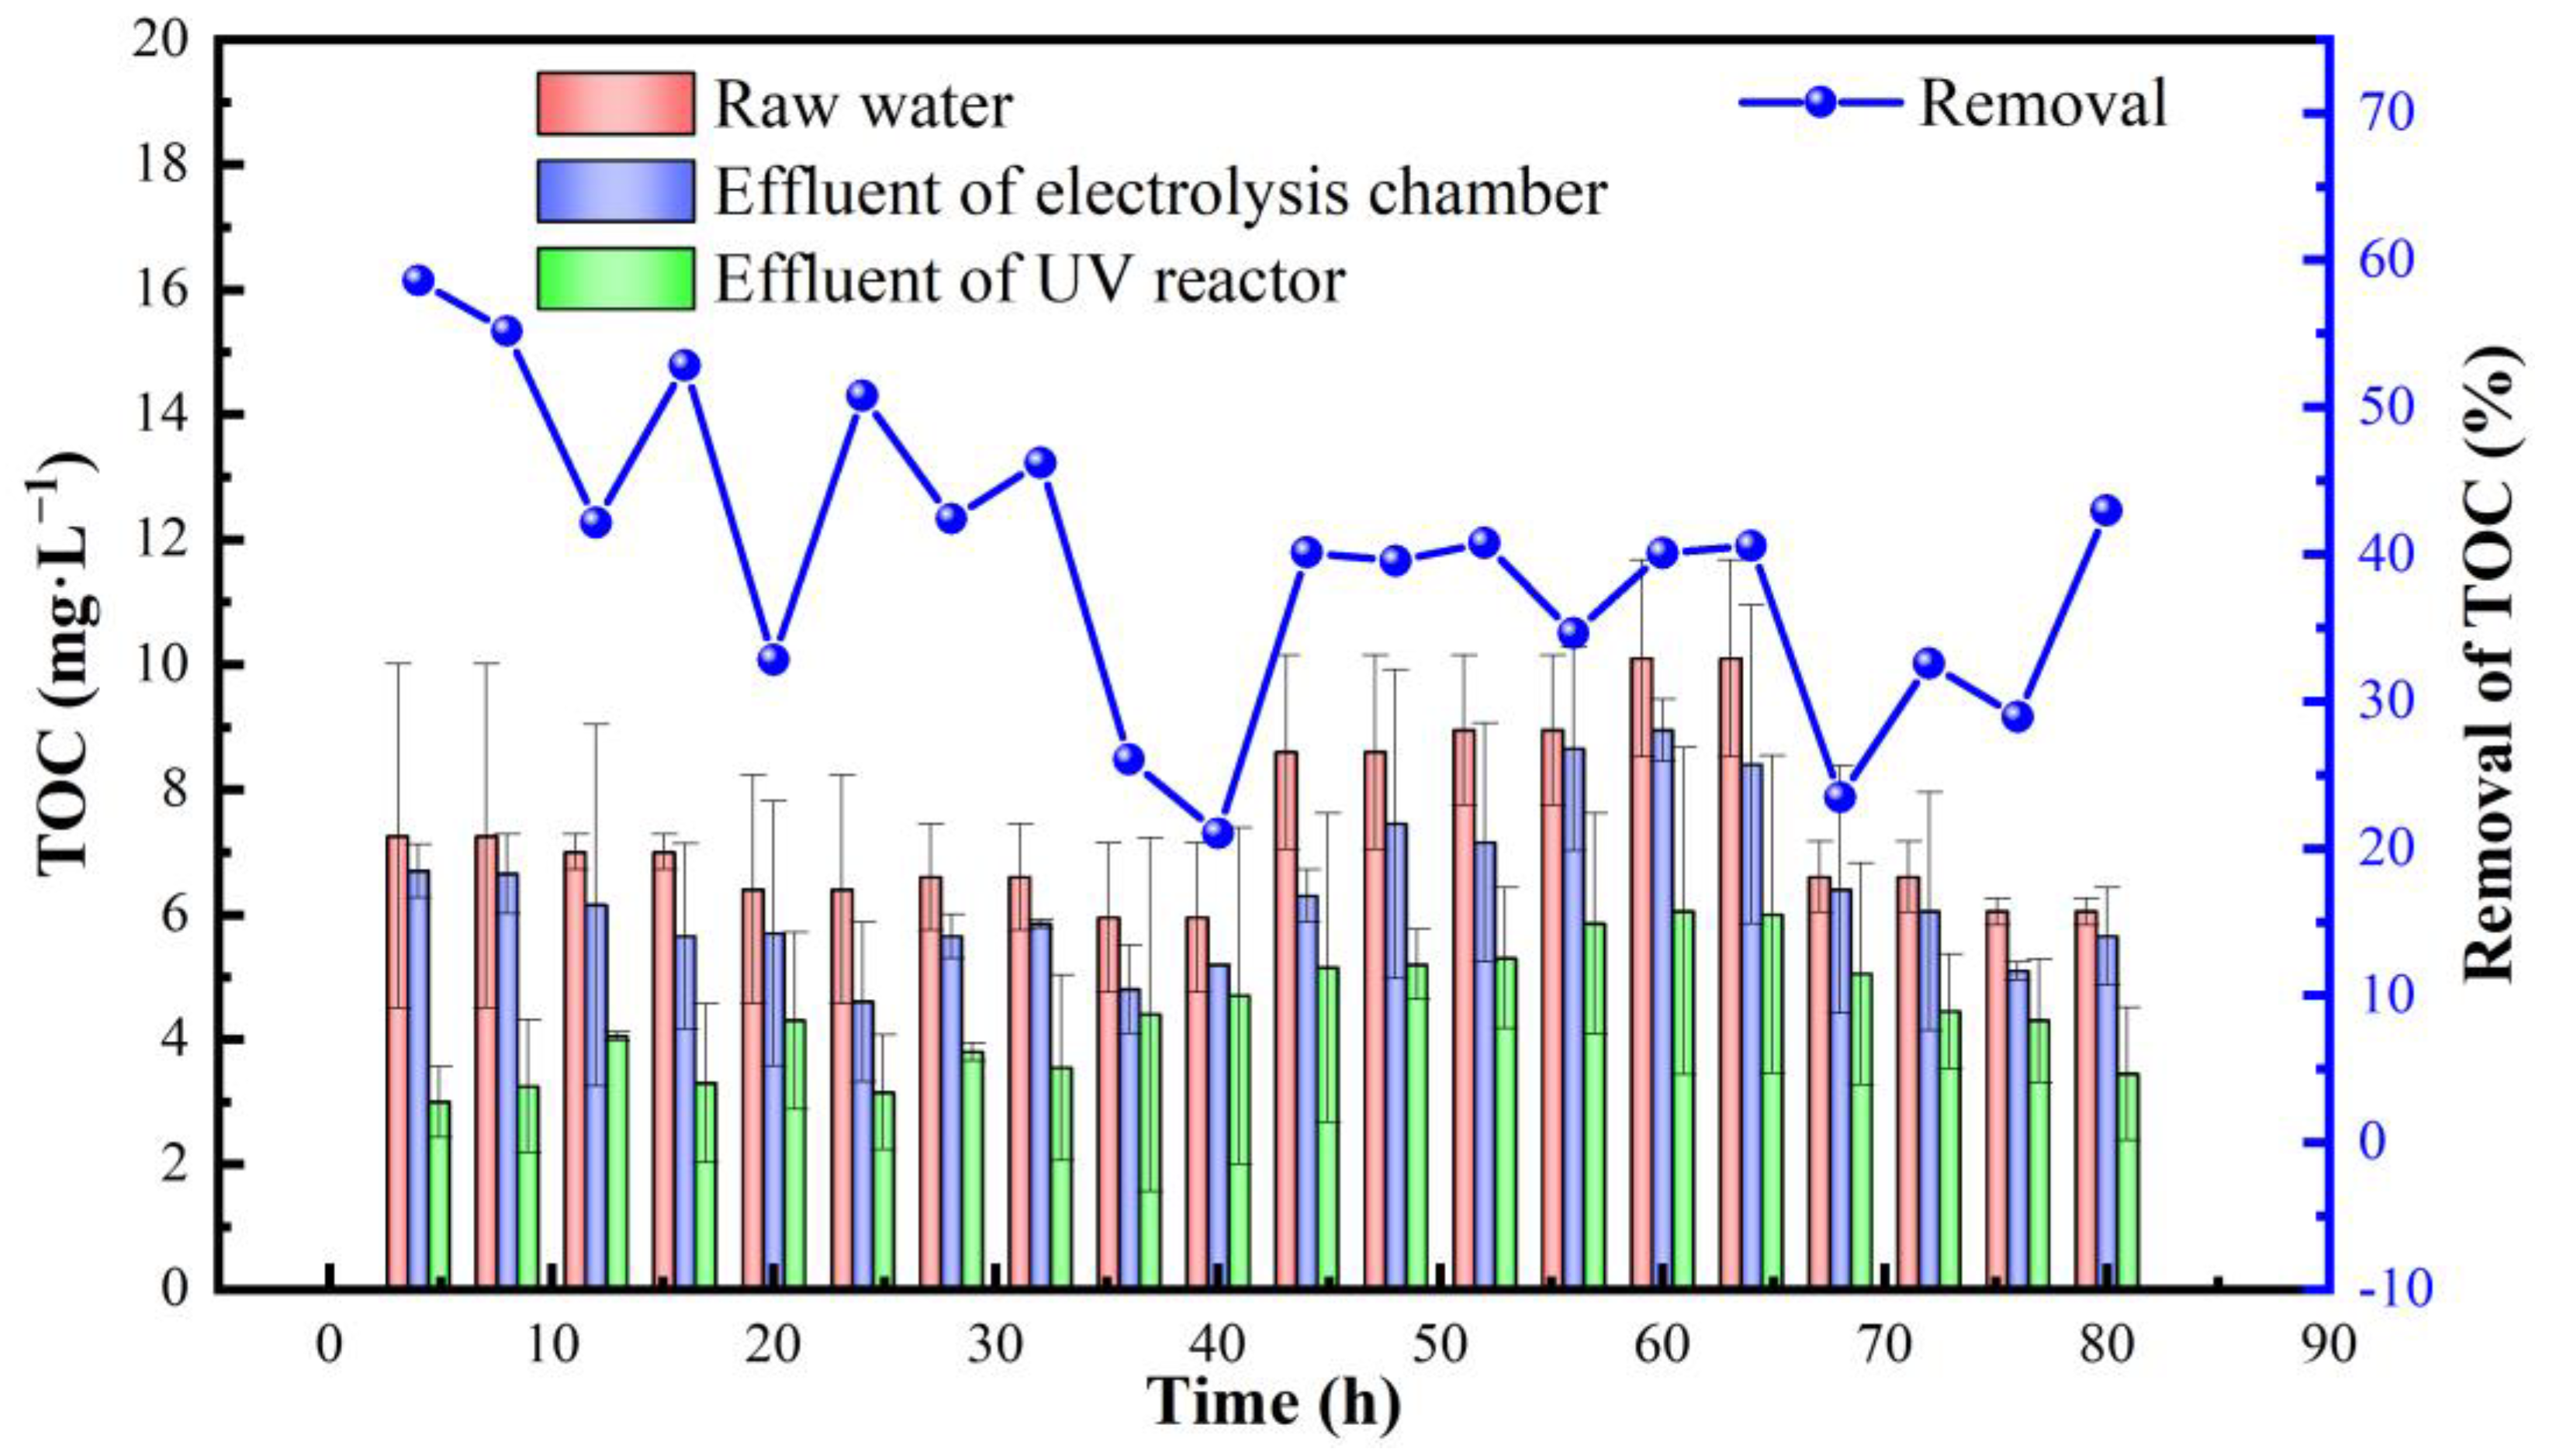
3.2. Removal of Organic Pollutants and Microorganisms

The pH of the influent water was around 7.65 and the pH of the effluent water from the UV reactor was around 6.88, with a decrease in the effluent pH compared with the influent pH. This phenomenon may be attributed to the fact that some natural organic matter in the influent water is oxidized by ·OH and degraded to weakly acidic products such as CO2, HCO3, and small-molecule carboxylic acids (Equation (6)) [30]:
R + · O H C O 2 + H 2 O
As an important indicator for assessing the content of organic matter in water, changes in A254 directly reflect the degree of degradation of macromolecular organic matter in water. When the A254 value changes, it not only indicates a decrease in the total amount of organic matter but also implies a significant change in the structure of organic matter, especially a decrease in aromaticity [31]. According to the results in Figure 5, the UV/H2O2 system has a stable reduction effect on A254. The organic content of the effluent water was significantly reduced after the raw water was treated by electrolysis and the UV reactor. The mean A254 for the influent water was found to be 0.070, whereas the A254 of the effluent water from the electrolysis chamber averaged 0.057, indicating an average reduction of 18.6% in A254. The average value of A254 in the effluent water from the UV reactor was 0.025, with an overall average reduction of 64.3% in A254. The electrolytic treatment served as a preliminary purification, while the UV reactor further improved the effluent quality.
The chemical oxygen demand concentration is a measure that reflects the level of contamination by reducing agents in water and is considered one of the significant indicators for evaluating the extent of organic pollution in aquatic environments. As depicted in Figure 6, the system exhibits a pronounced efficacy in the removal of COD, signifying that the process efficiently eliminates the reducing substances present in the water. The mean concentration of COD in the raw water was determined to be 37 mg·L−1. After the electrolysis treatment within the electrolytic cell, the mean COD concentration in the effluent water decreased to 31.7 mg·L−1, indicating an average removal efficiency of 14.3%. This result shows that the electrolysis process plays a role in the removal of COD, and parts of the reducing substances are directly oxidized on the anode surface, but there is still room for improvement in the removal effect. When the effluent from the electrolysis chamber entered the UV reactor for advanced oxidation, the average value of COD was further reduced to 23.1 mg·L−1, which was 37.6% lower than that of the raw water. The UV/H2O2 process is more efficient for COD removal, and the combination of electrolysis and UV reactor has a good synergistic effect on COD removal. The two processes can correspond to different types of pollutants, with easily oxidized pollutants being removed by anodic oxidation and difficult pollutants being removed by oxidation with strong oxidizing radicals generated by advanced oxidation reactions. The electrolysis chamber initially reduces the COD concentration, while the UV reactor further improves the removal efficiency, resulting in a significant improvement of the effluent water quality.
As illustrated in Figure 7, total organic carbon measurements were conducted on both the raw water and the water samples treated in the electrolysis chamber and UV reactor. This study aimed to assess the effectiveness of these treatments in removing organic pollutants. The average TOC content of the raw water was 7.35 mg·L−1, showing some organic pollution load. After the electrolysis reaction occurred in the electrolysis chamber, the average TOC of the effluent water was reduced to 6.35 mg·L−1, with a removal rate of 13.6%. This change indicates that the electrolysis process has an impact on the removal of organic pollutants from water. The electrolysis process reduces the TOC concentration through oxidation and reduction mechanisms. Some of the organic matter is converted to more degradable forms or is removed directly from the water column. Nevertheless, the TOC concentrations in the discharged water from the electrolysis chamber remained at relatively high levels compared with the raw water samples. This indicates that although the electrolysis process is effective to some extent, it does not completely remove all organic pollutants. Following the wastewater from the electrolysis chamber’s entry into the UV reactor and its subsequent participation in an advanced oxidation reaction, the average concentration of TOC in the wastewater was significantly reduced to 4.41 mg·L−1, with a removal rate of 40.0%. This significant decreasing trend indicates that the UV reactor is more effective at removing organic pollutants than the electrolysis process alone. The advanced oxidation reaction was able to attack the organic molecules with a strong oxidant to mineralize them into harmless small molecules, thus achieving efficient TOC removal. Meanwhile, the stability of the effluent TOC concentration indicates that the process has reliable operation.
As shown in Figure 8, (a–c) and (d–f) are the three-dimensional fluorescence spectrograms of the raw water, the effluent from the electrolysis chamber, and the effluent from the UV reactor at different sampling times, respectively. Different fluorescent substances correspond to different wavelength ranges, and blocks I, II, III, Ⅳ, and Ⅴ on the spectrograms represent tyrosine, tryptophan, fulvic acid, dissolved microbial metabolites, and humic acid, respectively. A meticulous comparison of the three-dimensional fluorescence spectrograms of the raw water and the effluent from the electrolysis chamber revealed that the Ⅰ and Ⅱ blocks exhibited more pronounced degradation, whereas the changes observed in the other blocks were less pronounced. This finding indicates that the electrolytic treatment is effective in removing some small molecules of organic matter but less so in removing large molecules of organic matter, which suggests that it is not an effective method for eliminating these organic impurities. However, analysis of the three-dimensional fluorescence spectrogram of the effluent from the UV reactor revealed a notable shift in the fluorescence peaks. It can be observed that the three organic compounds tryptophan, fulvic acid, and humic acid, have undergone a complete degradation process, while tyrosine has also been significantly altered. It can be postulated that the disparate outcomes observed in block IV may be attributed to the preferential decomposition of high-molecular-weight fluorescence-absorbing organics, which results in the generation of lower-molecular-weight fluorescence-absorbing organics [32]. The preceding analysis permits the observation of the transformation and decomposition processes of aromatic compounds in water as well as the progressive degradation of macromolecular organics. This is evidenced by a reduction in the number of conjugated bonds in the chain structure and a shift from a linear to a nonlinear ring structure. This implies a reduction in the complexity of the organic molecules and the removal of specific functional groups, such as carbonyl and hydroxyl groups. It also reflects the chemical changes in the organic matter during the treatment process, resulting in improved water quality [33,34]. The results indicate that the advanced oxidation reaction in the UV reactor has a significant impact on the degradation of organic matter. Following the treatment, the larger relative molecular mass of fulvic acid and humic acid organics may be converted into small-molecule organics, with a reduction in the aromaticity of the organic matter in the water.
Total bacterial counts, a key bioindicator, provide valuable insights into the quality of water and the efficacy of organic matter degradation. As illustrated in Figure 9, the total bacterial counts in the water samples of the raw water, the electrolysis chamber effluent, and the UV reactor effluent changed at six time points following a 24 h incubation period. Firstly, a considerable number of colonies can be observed on the total-bacterial-count plates derived from the raw water samples, which indicates the presence of a certain concentration of bacteria in the water samples. The bacteria in question may have originated from a variety of environmental contaminants, including soil, plant and animal debris, or other water bodies. Following electrolysis treatment, the number of colonies was found to be significantly reduced. This indicates that electrolysis has a significant killing effect on bacteria. Following further treatment with a UV reactor, the number of colonies was found to have decreased to zero. Ultraviolet light has the effect of destroying the DNA structure of bacteria, rendering them incapable of reproduction. At the same time, H2O2 produces the strong oxidant ·OH, which further kills the bacteria. The combined effect of this advanced oxidizing reaction was the complete removal of the total number of bacteria. The trend of total bacterial count fully proved the important role of electrolysis and UV reactor in water quality improvement and organic matter degradation.

3.3. Energy Consumption Analysis

For any technology, energy is a crucial factor that must be taken into account when evaluating its overall performance. In this paper, actual lake water samples were used as the treatment object, and according to the calculation, the operating cost of the system was 24.8 kWh·m−3, of which the energy consumption of the raw water electrolysis chamber was 0.8 kWh·m−3, that of the production of H2O2 was 3.2 kWh·m−3, and that of the ultraviolet lamp was 20.8 kWh·m−3. Some scholars have investigated the removal effect of the UV/H2O2 process on a variety of single emerging organic pollutants in a simulated drinking water environment. The results showed that the unit energy consumption of the UV/H2O2 process ranged from 0.17 to 2.38 kWh·m−3 under the condition of 90% removal of the target [35]. The unit energy consumption of the UV/H2O2 process was affected by the operation scale and the water quality [36]: from laboratory research to production tests, the unit energy consumption of the process decreased significantly with the expansion of the test scale, indicating that the expansion of the operation scale improved the energy utilization efficiency. The impact of raw water quality on the process is mainly reflected in the water transmittance and the content of free radical scavengers. The higher the concentration of scavengers (e.g., inorganic anions) and the higher the UV absorption of the raw water, the higher the unit energy consumption.

4. Conclusions

This study was undertaken to design an advanced oxidation process using electrogenerated H2O2 and UV irradiation and to evaluate the long-term performance of lake water treatment. The individual H2O2 generation chamber exhibited stable and highly efficient H2O2 production throughout the operation period of 80 h, whereas H2O2 alone could not oxidize the organic pollutants in the lake water. With the catalysis of UV, the system developed in this study showed significant mineralization capacity based on the results of A254, COD, TOC, and fluorescence. In addition, the reactor could effectively kill bacteria and improve the microbiological safety of the water body. The proposed UV/H2O2 reactor has the potential for efficient and feasible practical application in surface water treatment. This provides a new and effective means of accessing clean water in areas where it is scarce. However, more effort is needed to explore the performance of the proposed reactor for treating source waters with varied quality and quantity to comprehensively evaluate the applicability for different water requirements.

Author Contributions

Conceptualization, H.H. and S.X. (Shiwei Xie); methodology, H.H. and S.X. (Shiwei Xie); validation, H.H., Y.Y., W.J., J.L., Z.W., S.X. (Shengjie Xiang), C.X. and J.X.; formal analysis, H.H., Y.Y., W.J., J.L., Z.W., S.X. (Shengjie Xiang), C.X. and J.X.; investigation, H.H., Y.Y., W.J., J.L., Z.W., S.X. (Shengjie Xiang), C.X. and J.X.; resources, S.X. (Shiwei Xie) and N.Z.; data curation, H.H. and S.X. (Shiwei Xie); writing—original draft preparation, H.H.; writing—review and editing, H.H., S.X. (Shiwei Xie), A.Q. and N.Z.; supervision, S.X. (Shiwei Xie); project administration, H.H. and S.X. (Shiwei Xie); funding acquisition, N.Z. All authors have read and agreed to the published version of the manuscript.

Funding

This research was funded by the National Natural Science Foundation of China (NSFC, No. 42307311, 51808415), Hebei Natural Science Foundation (No. D2022111001), Central Guiding Local Science and Technology Development Foundation of Hebei Province (No. 236Z7602G), Open Foundation of State Key Laboratory of Environmental Criteria and Risk Assessment, Chinese Research Academy of Environmental Sciences (No. SKLECRA2023OFP02), Science Research Project of Hebei Education Department (No. BJK2022064), Scientific Research Project of Hengshui University (No. 2021GC16), and Hebei Academician Cooperation Key Unit of Hengshui University.

Data Availability Statement

Data will be made available on request.

Conflicts of Interest

The authors declare no conflicts of interest.

References

  1. Carpenter, S.R.; Stanley, E.H.; Zanden, M.J.V. State of the World’s Freshwater Ecosystems: Physical, Chemical, and Biological Changes. Annu. Rev. Environ. Resour. 2011, 36, 75–99. [Google Scholar] [CrossRef]
  2. Mammides, C. A global assessment of the human pressure on the world’s lakes. Glob. Environ. Chang. 2020, 63, 102084. [Google Scholar] [CrossRef]
  3. Le, C.; Zha, Y.; Li, Y.; Sun, D.; Lu, H.; Yin, B. Eutrophication of lake waters in China: Cost, causes, and control. Environ. Manag. 2010, 45, 662–668. [Google Scholar] [CrossRef] [PubMed]
  4. Ran, J.; Xiang, R.; He, J.; Zheng, B. Spatiotemporal variation and driving factors of water quality in Yunnan-Guizhou plateau lakes, China. J. Contam. Hydrol. 2023, 254, 104141. [Google Scholar] [CrossRef] [PubMed]
  5. Ho, L.T.; Goethals, P.L.M. Opportunities and Challenges for the Sustainability of Lakes and Reservoirs in Relation to the Sustainable Development Goals (SDGs). Water 2019, 11, 1462. [Google Scholar] [CrossRef]
  6. Meffe, R.; de Bustamante, I. Emerging organic contaminants in surface water and groundwater: A first overview of the situation in Italy. Sci. Total Environ. 2014, 481, 280–295. [Google Scholar] [CrossRef] [PubMed]
  7. Rodil, R.; Quintana, J.B.; Concha-Graña, E.; López-Mahía, P.; Muniategui-Lorenzo, S.; Prada-Rodríguez, D. Emerging pollutants in sewage, surface and drinking water in Galicia (NW Spain). Chemosphere 2012, 86, 1040–1049. [Google Scholar] [CrossRef] [PubMed]
  8. Bui, X.T.; Vo, T.P.T.; Ngo, H.H.; Guo, W.S.; Nguyen, T.T. Multicriteria assessment of advanced treatment technologies for micropollutants removal at large-scale applications. Sci. Total Environ. 2016, 563–564, 1050–1067. [Google Scholar] [CrossRef]
  9. Chu, W.-H.; Gao, N.-Y.; Templeton, M.R.; Yin, D.-Q. Comparison of inclined plate sedimentation and dissolved air flotation for the minimisation of subsequent nitrogenous disinfection by-product formation. Chemosphere 2011, 83, 647–651. [Google Scholar] [CrossRef]
  10. Jia, P.; Zhou, Y.; Zhang, X.; Zhang, Y.; Dai, R. Cyanobacterium removal and control of algal organic matter (AOM) release by UV/H2O2 pre-oxidation enhanced Fe(II) coagulation. Water Res. 2018, 131, 122–130. [Google Scholar] [CrossRef]
  11. Rodriguez-Narvaez, O.M.; Peralta-Hernandez, J.M.; Goonetilleke, A.; Bandala, E.R. Treatment technologies for emerging contaminants in water: A review. Chem. Eng. J. 2017, 323, 361–380. [Google Scholar] [CrossRef]
  12. Zhu, Y.; Wu, M.; Gao, N.; Chu, W.; Li, K.; Chen, S. Degradation of phenacetin by the UV/chlorine advanced oxidation process: Kinetics, pathways, and toxicity evaluation. Chem. Eng. J. 2018, 335, 520–529. [Google Scholar] [CrossRef]
  13. Lee, M.; Merle, T.; Rentsch, D.; Canonica, S.; von Gunten, U. Abatement of Polychoro-1,3-butadienes in Aqueous Solution by Ozone, UV Photolysis, and Advanced Oxidation Processes (O3/H2O2 and UV/H2O2). Environ. Sci. Technol. 2017, 51, 497–505. [Google Scholar] [CrossRef] [PubMed]
  14. Yang, Y.; Pignatello, J.J.; Ma, J.; Mitch, W.A. Effect of matrix components on UV/H2O2 and UV/S2O82− advanced oxidation processes for trace organic degradation in reverse osmosis brines from municipal wastewater reuse facilities. Water Res. 2016, 89, 192–200. [Google Scholar] [CrossRef] [PubMed]
  15. Rozas, O.; Vidal, C.; Baeza, C.; Jardim, W.F.; Rossner, A.; Mansilla, H.D. Organic micropollutants (OMPs) in natural waters: Oxidation by UV/H2O2 treatment and toxicity assessment. Water Res. 2016, 98, 109–118. [Google Scholar] [CrossRef] [PubMed]
  16. Ali, M.A.; Maafa, I.M.; Qudsieh, I.Y. Photodegradation of Methylene Blue Using a UV/H2O2 Irradiation System. Water 2024, 16, 453. [Google Scholar] [CrossRef]
  17. Song, W.; Li, C.; Du, Z.; Yue, J.; Sun, W.; Hou, L.; Liu, J.; Jia, R. Research about Organic Matter Removal and Biofilms Development of Pilot-Scale UV/H2O2-BAC Process. Water 2021, 13, 565. [Google Scholar] [CrossRef]
  18. Zhou, W.; Meng, X.; Gao, J.; Alshawabkeh, A.N. Hydrogen peroxide generation from O2 electroreduction for environmental remediation: A state-of-the-art review. Chemosphere 2019, 225, 588–607. [Google Scholar] [CrossRef] [PubMed]
  19. Salmerón, I.; Plakas, K.V.; Oller, I.S.I.; Maldonado, M.I.; Karabelas, A.J.; Malato, S. Optimization of electrocatalytic H2O2 production at pilot plant scale for solar-assisted water treatment. Appl. Catal. B Environ. Energy 2019, 242, 327–336. [Google Scholar] [CrossRef]
  20. Wang, Y.; Yu, G.; Deng, S.; Huang, J.; Wang, B. The electro-peroxone process for the abatement of emerging contaminants: Mechanisms, recent advances, and prospects. Chemosphere 2018, 208, 640–654. [Google Scholar] [CrossRef]
  21. Zhao, Y.; Deng, N.; Fan, Z.; Hu, Z.; Fan, L.; Zhou, J.; Huang, X. On-site H2O2 electro-generation process combined with ultraviolet: A promising approach for odorous compounds purification in drinking water system. Chem. Eng. J. 2022, 430, 132829. [Google Scholar] [CrossRef]
  22. Li, Y.; Zhang, Y.; Xia, G.; Zhan, J.; Yu, G.; Wang, Y. Evaluation of the technoeconomic feasibility of electrochemical hydrogen peroxide production for decentralized water treatment. Front. Environ. Sci. Eng. 2020, 15, 122417–122851. [Google Scholar] [CrossRef]
  23. Ma, Y.; Zhao, E.; Xia, G.; Zhan, J.; Yu, G.; Wang, Y. Effects of water constituents on the stability of gas diffusion electrode during electrochemical hydrogen peroxide production for water and wastewater treatment. Water Res. 2023, 229, 119503. [Google Scholar] [CrossRef] [PubMed]
  24. Liao, P.; Yuan, S.; Chen, M.; Tong, M.; Xie, W.; Zhang, P. Regulation of electrochemically generated ferrous ions from an iron cathode for Pd-catalytic transformation of MTBE in groundwater. Environ. Sci. Technol. 2013, 47, 7918–7926. [Google Scholar] [CrossRef] [PubMed]
  25. Li, L.; Li, Y.; Liang, J.; Zhao, Z. Elimination method of H2O2 interference in determination of CODCr. Exp. Technol. Manag. 2021, 38, 47–53+60. (In Chinese) [Google Scholar] [CrossRef]
  26. Liu, Y.; Quan, X.; Fan, X.; Wang, H.; Chen, S. High-yield electrosynthesis of hydrogen peroxide from oxygen reduction by hierarchically porous carbon. Angew. Chem. 2015, 54, 6837–6841. [Google Scholar] [CrossRef]
  27. Zhang, Q.; Zhou, M.; Ren, G.; Li, Y.; Li, Y.; Du, X. Highly efficient electrosynthesis of hydrogen peroxide on a superhydrophobic three-phase interface by natural air diffusion. Nat. Commun. 2020, 11, 1731. [Google Scholar] [CrossRef] [PubMed]
  28. Jin, Q.; Wang, H.; Hu, C.; Chen, Z.; Wang, X. Effects of NOM on the degradation of chloramphenicol by UV/H2O2 and the characteristics of degradation products. Sep. Purif. Technol. 2018, 191, 108–115. [Google Scholar] [CrossRef]
  29. Sarathya, S.R.; Stefan, M.I.; Royce, A.; Mohseni, M. Pilot-scale UV/H2O2 advanced oxidation process for surface water treatment and downstream biological treatment: Effects on natural organic matter characteristics and DBP formation potential. Environ. Technol. 2011, 33, 1709–1718. [Google Scholar] [CrossRef]
  30. Wang, Y.; Li, G.; Song, W.; Sun, S.; Zhang, S.; Li, M.; Jia, R. Removal Characteristics of Organic Matter in Effluent from Conventional Sand Filtration by UV/H2O2 Process. China Water Wastewater 2022, 38, 60–66. (In Chinese) [Google Scholar] [CrossRef]
  31. García-Morales, M.A.; Roa-Morales, G.; Barrera-Díaz, C.; Miranda, V.M.; Hernández, P.B.; Silva, T.B.P. Integrated Advanced Oxidation Process (Ozonation) and Electrocoagulation Treatments for Dye Removal in Denim Effluents. Int. J. Electrochem. Sci. 2013, 8, 8752–8763. [Google Scholar] [CrossRef]
  32. Valencia, S.; Marín, J.; Velásquez, J.; Restrepo, G.; Frimmel, F.H. Study of pH effects on the evolution of properties of brown-water natural organic matter as revealed by size-exclusion chromatography during photocatalytic degradation. Water Res. 2011, 46, 1198–1206. [Google Scholar] [CrossRef] [PubMed]
  33. Świetlik, J.; Sikorska, E. Application of fluorescence spectroscopy in the studies of natural organic matter fractions reactivity with chlorine dioxide and ozone. Water Res. 2004, 38, 3791–3799. [Google Scholar] [CrossRef]
  34. Valencia, S.; Marín, J.M.; Restrepo, G.; Frimmel, F.H. Evaluation of natural organic matter changes from Lake Hohloh by three-dimensional excitation–emission matrix fluorescence spectroscopy during TiO2/UV process. Water Res. 2014, 51, 124–133. [Google Scholar] [CrossRef] [PubMed]
  35. Guo, K.; Wu, Z.; Yan, S.; Yao, B.; Song, W.; Hua, Z.; Zhang, X.; Kong, X.; Li, X.; Fang, J. Comparison of the UV/chlorine and UV/H2O2 processes in the degradation of PPCPs in simulated drinking water and wastewater: Kinetics, radical mechanism and energy requirements. Water Res. 2018, 147, 184–194. [Google Scholar] [CrossRef]
  36. Miklos, D.B.; Remy, C.; Jekel, M.; Linden, K.G.; Drewes, J.E.; Hübner, U. Evaluation of advanced oxidation processes for water and wastewater treatment—A critical review. Water Res. 2018, 139, 118–131. [Google Scholar] [CrossRef]
Figure 1. Schematic diagram of the experimental setup (1: H2O2 generation chamber; 2: Raw water electrolysis chamber; 3: Excess H2O2 treatment chamber; 4: UV reactor; 5: Manganese dioxide; 6: Air diffusion electrode; 7: DSA electrode).
Water 16 01658 g001
Figure 2. (a) H2O2 concentration, (b) current efficiency, (c) energy consumption per unit, (d) H2O2 generation rate versus flow rate and current density. All experiments were performed in 50 mM sodium sulfate solution.
Water 16 01658 g002
Figure 3. (a) Variation in H2O2 concentration and current efficiency with electrolysis time (current of 50 mA, flow rate of 8 mL·min−1), (b) air diffusion electrode before electrolysis, (c) air diffusion electrode after 8 h of electrolysis.
Water 16 01658 g003
Figure 4. (a) Changes in H2O2 concentration; SEM images of the catalytic layer of the air diffusion electrode (b) before and (c) after the long-term experiment.
Water 16 01658 g004
Figure 5. Change in absorbance at 254 nm.
Water 16 01658 g005
Figure 6. Changes in chemical oxygen demand content.
Water 16 01658 g006
Figure 7. Changes in total organic carbon content.
Water 16 01658 g007
Figure 8. Three-dimensional fluorescence spectra of (a) the raw water, (b) the effluent from the electrolysis chamber, and (c) the effluent from the UV reactor for 40 h of unit operation; (d) the raw water, (e) the effluent from the electrolysis chamber, and (f) the effluent from the UV reactor for 48 h of unit operation.
Water 16 01658 g008
Figure 9. The bacterial colonies formed on the agar plates after incubation with the (I) raw water, (II) the effluent from the electrolysis chamber, and (III) the effluent from the UV reactor after (a) 8, (b) 16, (c) 24, (d) 32, (e) 40, and (f) 48 h of continuous operation of the equipment, respectively. For example, (II) (a) shows a bacterial culture plate of the effluent from the electrolysis chamber following 8 h of equipment operation.
Water 16 01658 g009
Table 1. Main water quality parameters of Huangjia Lake.
ParametersClSO42−Ca2+Mg2+CODTOC
Concentration (mg·L−1)38.9 ± 0.9963.4 ± 1.1240.8 ± 0.827.6 ± 0.1537.0 ± 5.217.35 ± 1.36
Table 2. Parameter changes during 1 h reaction of H2O2 with lake water.
Reaction TimeH2O2 (mg·L−1)COD (mg·L−1)A254
0 h63.93 ± 2.2042 ± 2.830.104 ± 0.001
1 h62.20 ± 0.7341 ± 4.240.097 ± 0.001
Disclaimer/Publisher’s Note: The statements, opinions and data contained in all publications are solely those of the individual author(s) and contributor(s) and not of MDPI and/or the editor(s). MDPI and/or the editor(s) disclaim responsibility for any injury to people or property resulting from any ideas, methods, instructions or products referred to in the content.

