Abstract
Water scarcity is commonly evaluated using the water resource stress index (WRSI). However, the conventional WRSI model cannot effectively reflect the water shortage in humid areas, which may lead to distorted evaluation results. To solve this problem, an improved WRSI has been designed. In the improved WRSI, the assessment year is first divided into multiple periods. Then, the temporal WRSI (T-WRSI) is built to evaluate water scarcity in each period. Finally, the comprehensive WRSI (C-WRSI) is constructed based on the entropy weight model (EWM) to synthetically assess the water shortage condition. The water scarcity of Yongzhou City is taken as a sample for evaluation. The results are as follows. (i) The Lingling-Lengshuitan District and Dong’an County suffer from the most serious water shortage. Their C-WRSI values are 0.464 and 0.458, respectively, both of which are “high” grades. (ii) The values of T-WRSI are more than 0.4 from August to October in most areas, indicating that the major key water shortage period is from August to October. (iii) The reasons for water shortage are that the annual runoff distribution in Yongzhou City is uneven with a uniformity coefficient (Cv) of 0.83, and the main irrigation periods are coincidentally accompanied by the retreat of rainfall. (iv) The main measures to solve water scarcity are to strengthen water resource management, to optimize plant structure, and to construct more reservoirs. (v) The C-WRSI values calculated by the improved model in each region are 95–168% larger than those of conventional WRSI. The improved WRSI has better capacities in evaluating the water shortage induced by uneven runoff within the year and identifying the key water scarcity period of humid regions.
1. Introduction
Abundant water resources are the basis of human survival and social development. However, due to rapid economic growth and population expansion, the global social water demand has increased dramatically, which has resulted in a serious water crisis in recent years. Therefore, to maintain the sustainable development of society and ecology, water resources management researchers have focused on water scarcity evaluation.
To quantify the regional water shortage condition, Charles J. Vörösmarty et al. [1] proposed a water resource stress index (WRSI) model, defined as the ratio of the annual water consumption and natural water resources of the study area, which is concise and intuitive. Furthermore, WRSI provides flexible choices of evaluation criteria according to actual regional situations. As a result, WRSI has been widely used in global water shortage research. For example, Tian et al. [2] designed an improved WRSI based on physical interpretation to evaluate water stress. Zheng et al. [3] assessed the evolutionary characteristics and spatial correlation of WRSI spatial patterns in China. Dehghanpir et al. [4] reflected regional water scarcity in Iran’s agricultural sector by combining WRSI with water footprint.
The current research on WRSI is mainly concentrated in arid areas. In such areas, as the precipitation is sparse, the annual runoff is scarce. Therefore, the water shortage in arid areas is primarily due to insufficient natural water resources [5]. As introduced above, the conventional WRSI hypothesis is that the water shortage condition of the study area is quantified by the ratio of its annual social water consumption and natural water resources. Evidently, as the total natural water resource is insufficient, the denominator is small, and the final WRSI value is relatively large, which correctly reflects the water shortage situation in the arid area.
However, the precipitation in the humid area is abundant, and its water shortage is mainly caused by the uneven annual runoff distribution. Due to the influence of monsoons, the precipitation in the dry season is relatively rare, which causes water shortage problems [6]. When the conventional WRSI model is applied in humid areas, as the annual total water resource is abundant, the WRSI value is relatively small, which easily ignores the water shortage in the dry season.
For instance, in the water supply stress evaluation of Louisiana, a typical humid region in the USA, Eldardiry et al. [7] proved that only using annual total water resources for evaluation may mask the high stresses in the dry period. Mo et al. [8] pointed out that the annual scale is not entirely suitable in the WRSI evaluation of the Guangxi Province, one of the most humid areas in China. Liu et al. [9] found that for the significant intra-annual variations in water use and availability in humid areas, a monthly scale could provide more information about the water shortage condition rather than a yearly scale.
Another typical instance is in the Hunan Province, one of the most humid areas in China. Its natural annual water resource is 209.12 billion m3, and its water consumption is 33.30 billion m3 [10]. Evidently, its WRSI is only 0.16, which shows that there is no water shortage problem [11]. However, with the influence of the East Asian monsoon, the annual runoff distribution of the Hunan Province is extremely uneven. The water resource in the rainy season (April–early August) accounts for 68.9% of the total. On the contrary, the irrigation period for late rice is from late August to October, which mainly lies in the dry season. And, the proportion of the dry season water volume to the total annual runoff is less than 15% [12]. As a result, the Hunan Province often suffers from severe water shortage problems from late August to October.
The objectives of this study are as follows: (i) According to the period division method and entropy weight model (EWM), improved WRSI is designed to evaluate the water scarcity in humid areas with uneven annual runoff distribution. (ii) The water shortage assessment of Yongzhou City, China is evaluated using the improved WRSI to test its effectiveness. (iii) The differences between the conventional and improved WRSI models are discussed.
The innovation of the improved WRSI is that the annual variations in natural water resources and social water consumption are introduced into the evaluation, which help to accurately identify the key water shortage periods and obtain more realistic assessment results of humid areas.
2. Methods and Materials
2.1. Study Area
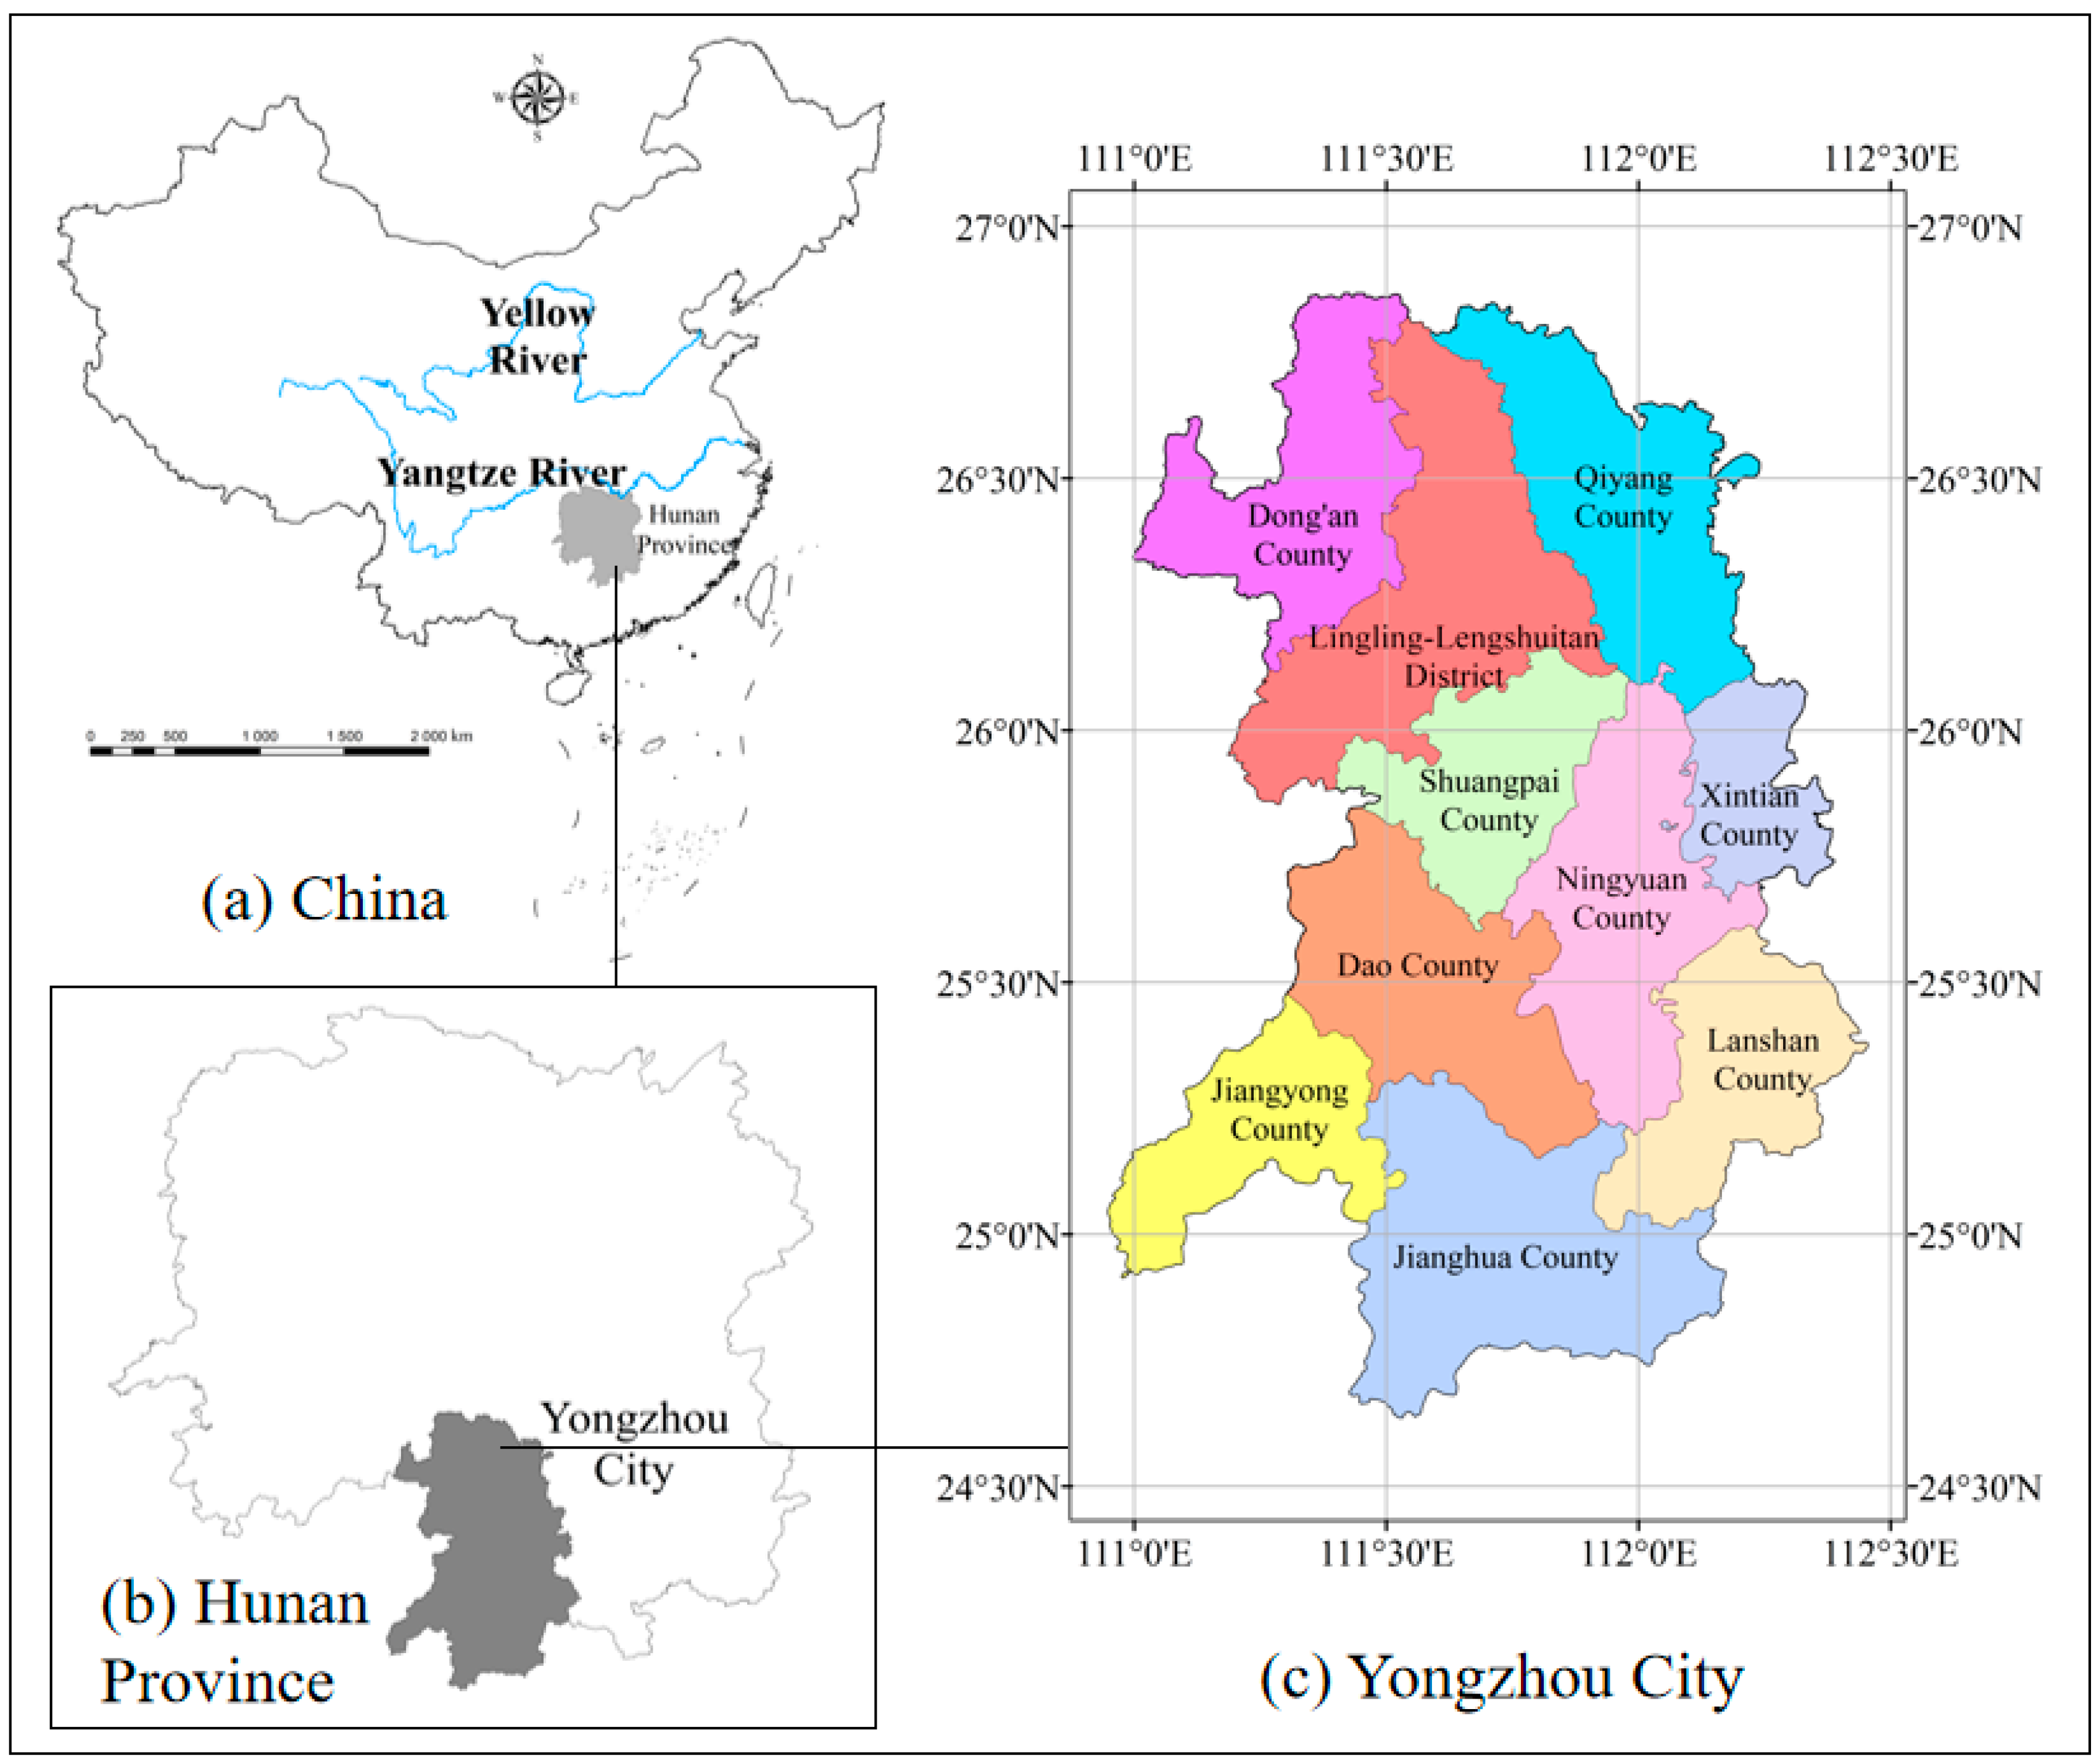
This study examines Yongzhou City, which is located in the Hunan Province, China. As shown in Figure 1, Yongzhou City is located in the south of China, with a longitude and latitude of 111°03′ E–112°21′ E and 24°39′ N–26°51′ N, respectively. According to Li and Zeng [13], Yongzhou City has an area of 22,259 km2 and a population of 5.45 million. The city had a GDP of $32.57 billion in 2021, with agriculture playing a dominant role in its economic structure. With its adequate light and heat conditions, Yongzhou City is an important producer area for rice, tobacco, soybeans, and fruits in China [14].

Figure 1.
Study area. (a) The geographical location of Hunan Province in China. (b) The geographical location of Yongzhou City in Hunan Province. (c) The regional distribution of Yongzhou City.
Yongzhou City is one of the most humid areas in China. Its annual precipitation is 1804.8 mm, which is approximately three times higher than the Chinese average precipitation. However, Yongzhou City has a typical East Asian subtropical monsoon climate, and thus, its temporal precipitation distribution is extremely uneven. According to the Yongzhou City Water Resources Bulletin [15], the precipitation of Yongzhou City in the rainy season is 1232.7 mm, accounting for 68.3% of the total annual amount. By contrast, the precipitation in the dry season is only 572.1 mm, accounting for 31.7% of the total.
In addition, the storage capacity of the reservoir in Yongzhou City is extremely weak, which exacerbates the water shortage in the dry season. The terrain of Yongzhou City is mainly mountainous and hilly, which causes great difficulties in high dam construction. According to the investigation of Zhou [16], the total storage capacity of its reservoirs is 1.61 billion m3, which only accounts for 8.3% of the annual runoff. As a result, the water resource is difficult to reserve for the dry season, which increases the water stress in this period.
Figure 1 shows that Yongzhou City is divided into 10 administrative regions: Lingling-Lengshuitan District, Qiyang County, Dong’an County, Shuangpai County, Dao County, Jiangyong County, Ningyuan County, Lanshan County, Xintian County, and Jianghua County. In this study, the natural runoff and social water consumption data are provided by the Hunan Provincial Department of Water Resources. The data sources of Yongzhou City are shown in Table 1.

Table 1.
Data sources.
This study selects the evaluation year of 2019 since its rainfall process and water consumption conditions are good representatives of Hunan’s general hydrological situations. (i) The rainfall of Yongzhou City in 2019 reached 40.17 billion m3, which equals 108.87% of the annual average value, and its water consumption was 2515.83 million m3, which equals 100.56% of the multi-year mean value. (ii) The temporal distribution of precipitation and runoff is close to the annual average hydrological situations.
What should be noticed is that the evaluation year should be selected according to the research objective. If the objective is to assess the general water shortage situation of the study region, it is suggested to evaluate the normal flow year, the runoff of which is close to the multi-year average hydrological process. The wet year will make the evaluation results overly optimistic and the dry year will make it overly pessimistic. If the objective is to analyze the trend of inter-annual changes, the long series data should be used for evaluation, which contains sufficient typical wet years, dry years, and normal flow years.
2.2. Conventional WRSI
Proposed by Charles J. Vörösmarty [1], WRSI has become a classic model for evaluating water scarcity. WRSI uses the ratio of the annual social water consumption and the natural water resource to reflect the water shortage.
Given that there are m evaluation regions, the annual social water consumption, natural water resources, and the WRSI of the ith evaluation region are denoted as xi, yi, and zi, respectively. The calculation formula of zi is
WRSI is divided into three grades, which are shown in Table 2. According to the research of Vorosmarty, C. J. et al. [1] and Wada et al. [17], when the WRSI is larger than 0.4, the ecological flow cannot be guaranteed, and the social water supply will be tight. Therefore, WRSI > 0.4 is an internationally recognized criterion to indicate the serious water shortage condition. Based on the research of Mo et al. [8], Zheng et al. [3], and Pan and Fu [18], this criterion is also applicable to the Chinese humid areas. Furthermore, according to the investigation of the Hunan Hydrology and Water Resources Bureau, when WRSI is larger than 0.4, the social water consumption can cause groundwater over-exploitation and restrict the economy’s growth. As a result, this study continues to use this criterion to determine that the water shortage grade is “high”.
Table 2.
The Classification Method of WRSI in Hunan Province.
In most of the international literature, 0.2 < WRSI ≤ 0.4 is selected to indicate the medium water shortage condition. Based on the research of Li et al. [19], this criterion is also applicable to the Yangtze River basin in China, where the Hunan Province is located. Moreover, according to the investigation of the Hunan Hydrology and Water Resources Bureau, when the WRSI lies in (0.2, 0.4], social water consumption has an undeniable impact on the natural hydrological cycle and aquatic ecosystems, and the study area has a potential water scarcity. Therefore, this study continues to use this criterion to determine that the water shortage grade is “medium”.
According to the research of Raskin et al. [20] and Pfister et al. [21], when WRSI is less than 0.2, the impact of social water consumption on the natural hydrological process is generally considered acceptable. And, this criterion is also adopted by the Hunan Hydrology and Water Resources Bureau to assess the water shortage of the Hunan Province. As a result, this study uses this criterion to determine that the water shortage grade is “low”.
At present, the WRSI has been successfully applied in arid areas but is not suitable enough in humid regions [22]. The reason is that the water shortage in humid areas is caused by the uneven annual runoff distribution instead of the inadequate total water resources. The conventional WRSI model cannot effectively reflect the annual runoff distribution and, thus, results are often distorted in its evaluation of water shortage in humid areas.
2.3. Improved WRSI
On the basis of the above discussion, we propose the following four steps for an improved WRSI model. (i) According to the actual hydrological characteristics of the study area, the evaluation year is divided into multiple time periods. (ii) The temporal WRSI (T-WRSI) is designed to assess the water shortage in each period. (iii) EWM is utilized to quantify the importance of each period. (iv) The comprehensive WRSI (C-WRSI) is constructed to comprehensively assess water scarcity in the study area.
2.3.1. Period Division Method
According to the investigations of Ji et al. [23] and Jia et al. [24], the conventional WRSI model evaluation does not include the division of time periods and is usually evaluated directly on an annual basis. However, with the development of its research, combined with the researches of Kong et al. [25] and Eldardiry et al. [7], the annual scale assessment in the WRSI model is not suitable for reflecting more information about water scarcity and may overlook the impact of seasonal changes in water intake and available water. As a result, the period division method is needed.
At present, there are various methods for dividing time periods in water resource assessment. For example, Xu et al. [26] analyzed the influence of landscape metrics on river water quality from the perspective of the dry and wet seasons. Ma and Yan [27] discussed the effects of water temperature and pH on the toxicity of ammonia nitrogen to aquatic organisms on a seasonal basis. Zhang et al. [28] studied the occurrence of extreme precipitation events on a weekly basis.
Therefore, to reflect the variations in water shortage within the year, the evaluation year needs to be further divided into several periods. The division principles are as follows: (i) To avoid errors caused by large data variations, there are no significant changes in social water consumption and natural runoff in a single period. (ii) The stronger the regulation capacity of reservoirs, the more stable the water resources are. It is difficult to reflect changes in the evaluation object during these periods, so the regulation capacities of reservoirs do not significantly influence the hydrological processes of different periods. (iii) In order for the evaluation to be feasible and truthful, the data on social water consumption and natural water resources in each period need to be easily investigated.
Supposing that the evaluation year is divided into n periods, the social water consumption and natural water resource of the ith region in the jth period are defined as xij and yij, respectively. Clearly, Equation (2) is tenable as
Under the conditions mentioned above, we suggest that the evaluation periods should be divided as finely as possible. In most cases, the water shortage does not last throughout the whole dry season but only appears in specific time periods, such as a few irrigation months or weeks. Obviously, a fine evaluation period division can help managers accurately identify the most critical water shortage period, rather than just evaluate the general entire water scarcity condition of the whole dry season. In some developing countries, due to a shortage of funds and technicians, the personnel and equipment to cope with local water shortage situations are often temporarily dispatched from the central provincial or state government. Therefore, accurately identifying the water shortage period is helpful to reduce the invalid time for personnel and equipment, which further reduces disaster relief costs.
As introduced in Section 2.1, the reservoir in Yongzhou City has a small storage capacity. Based on the survey of Zhou [16], these reservoirs can only achieve monthly regulation. Furthermore, the data on the natural hydrological processes and social water use processes can only be surveyed monthly. As a result, this study divides the evaluation period by month.
2.3.2. Temporal WRSI (T-WRSI)
T-WRSI represents the water shortage condition in each period, denoted as zij of the ith region in the jth period. The calculation method is
Evidently, Equation (3) is similar to Equation (1). The difference between them is the evaluation time. zij reflects the water shortage condition in the ith region of the jth period, which still follows the 3-grade classification method in Table 1: low [0.0, 0.2], medium (0.2, 0.4], and high (0.4, +∞).
2.3.3. EWM
EWM is an objective weighing method that is widely used in water resource management evaluation. It utilizes entropy to quantify the amount of information. The smaller the evaluation object’s information entropy is, the higher its information content is, the larger the weight is assigned, and vice versa.
Compared to other models, EWM only relies on data and can eliminate human factors, which is an extremely objective and highly flexible weighting method. In addition, the period division method is rarely applied in the WRSI model. The subjective weighting methods like the analytic hierarchy process (AHP) and fuzzy comprehensive evaluation method always rely on subjective experience, which makes it difficult to determine the importance and weight of each evaluation period directly. Therefore, EWM has better capacities for reflecting the evaluation content objectively.
The first step of EWM is standardization. Combined with Section 2.2, WRSI belongs to the smaller-the-better type, and its standardization method is
where Zij is the standardized value of the ith regional sample in the jth period. zi,max and zi,min are the maximum and minimum values of all regional calculated values in the jth period, respectively.
In denoting the entropy of the jth period as Hj, its calculation method is
According to L Hôpital’s rule, when , there is . The domain of Hj is [0, 1]. And the weight of the jth period is
Entropy is used to weigh and quantify the importance and reflect information content so that the WRSI situation is more accurately evaluated in the entire region. Combined with the situation of division periods, the higher its information contents are, the smaller the entropy is, the larger the weight of this period is assigned, and vice versa. As a result, entropy can be utilized to reflect the amount of information in the time period and, thus, be empowered.
Furthermore, there are other objective weighing methods in addition to EWM that can be employed. Interested readers can try applying other methods to process data. For example, the dynamic weighting model [29], the technique for order preference by similarity to the ideal solution [30], and the regression technique decomposition method of Adomian [31] can be utilized.
2.3.4. Comprehensive WRSI (C-WRSI)
C-WRSI represents the comprehensive water shortage condition of the study area. The C-WRSI of the ith area is denoted as Zi. Its calculation method is
Zi reflects the comprehensive water scarcity status of the ith study area in the evaluation year. The value is divided into three grades following the classification method: low [0.0, 0.2], medium (0.2, 0.4], and high (0.4, +∞).
2.3.5. Key Water Shortage Period
Water scarcity affects the stability and balance of ecosystems, as well as water supply issues. It is necessary to identify the key water shortage periods during the evaluation year, which can help water managers take effective measures for prevention and response. Based on the values of T-WRSI and C-WRSI, this study proposes the following methods for identifying critical water shortage periods:
As introduced in Section 2.3.2, when the T-WRSI value of the evaluation period is larger than 0.4, the social water consumption has a significant impact on the natural hydrological cycle and aquatic ecosystem. Therefore, as shown in Equation (9), the period when the T-WRSI value is larger than 0.4 is regarded as the key water shortage period and special attention should be paid to the drought resistance preparation of the government.
In addition, when the C-WRSI is less than 0.4 but the T-WRSI values of a few months lie in the (0.2, 0.4], this indicates that these months have potential water scarcity. According to Table 1, the study area cannot be considered as having no water shortage throughout the year but the C-WRSI values lie in the “low” grade. Therefore, the key water shortage period can also be defined as the months that satisfy Equation (10) in this study.
2.4. Comparison of Evaluation between the Two WRSI Models
As discussed in Section 2.2 and Section 2.3, the calculation process of the conventional WRSI model and improved WRSI model is shown in Figure 2.
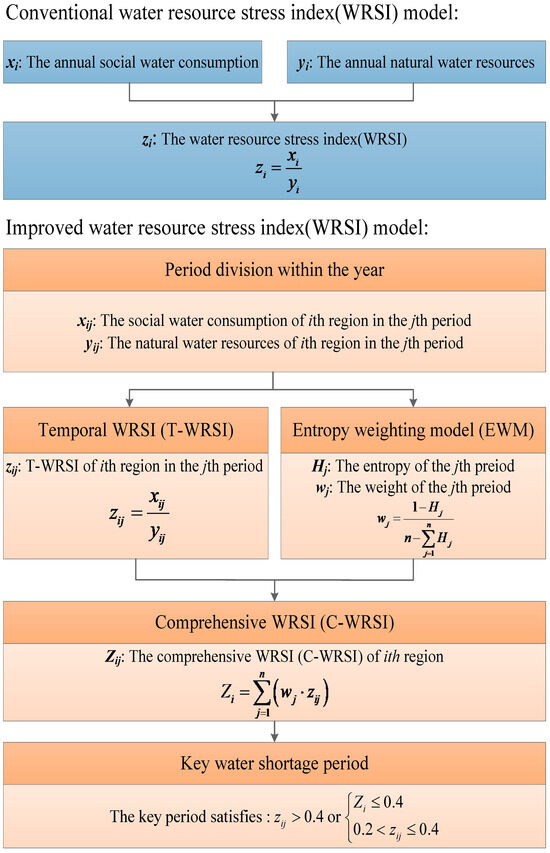
Figure 2.
Calculation process of conventional WRSI and improved WRSI.
Figure 2 shows three important distinctions between the conventional WRSI and improved WRSI.
- (i)
- The difference in their basic hypotheses
The basic hypothesis of the conventional WRSI is that the water shortage can be evaluated via the comparison of total annual water consumption and total annual water resource volume. On the contrary, the basic hypothesis of the improved WRSI is that the water shortage should be evaluated via the comparison of the water use process and the hydrological process within the year.
- (ii)
- The difference in their mathematical methods
The conventional WRSI only uses the ratio of annual water consumption to water resources. However, the improved WRSI first divides the evaluation year into multiple periods based on the natural hydrological processes, social water consumption processes, and reservoir regulation capacity. Then, T-WRSI is calculated to reflect the water scarcity condition in each period. Lastly, C-WRSI is generated to evaluate the comprehensive water shortage in the study area.
- (iii)
- The difference in their expression forms of results
The expression form of the conventional WRSI result is an isolated index, which broadly reflects the water scarcity situation. The expression form of the improved WRSI result is a collection of T-WRSI, C-WRSI, and the key water shortage period. T-WRSI reflects the water scarcity variation process within the year. C-WRSI reflects the comprehensive water shortage condition in the study area. And, the key water shortage period facilitates the drought resistance preparation of the government.
The improved WRSI model does not negate the conventional WRSI model. If the length of the period is set to the whole year, the evaluation results of the improved model are consistent with the traditional WRSI. As a consequence, the conventional model is essentially a special case of the improved model without considering the uneven runoff distribution within the year. Correspondingly, the improved model is an expansion of the conventional model in temporal analysis.
3. Results
3.1. Natural Water Resources
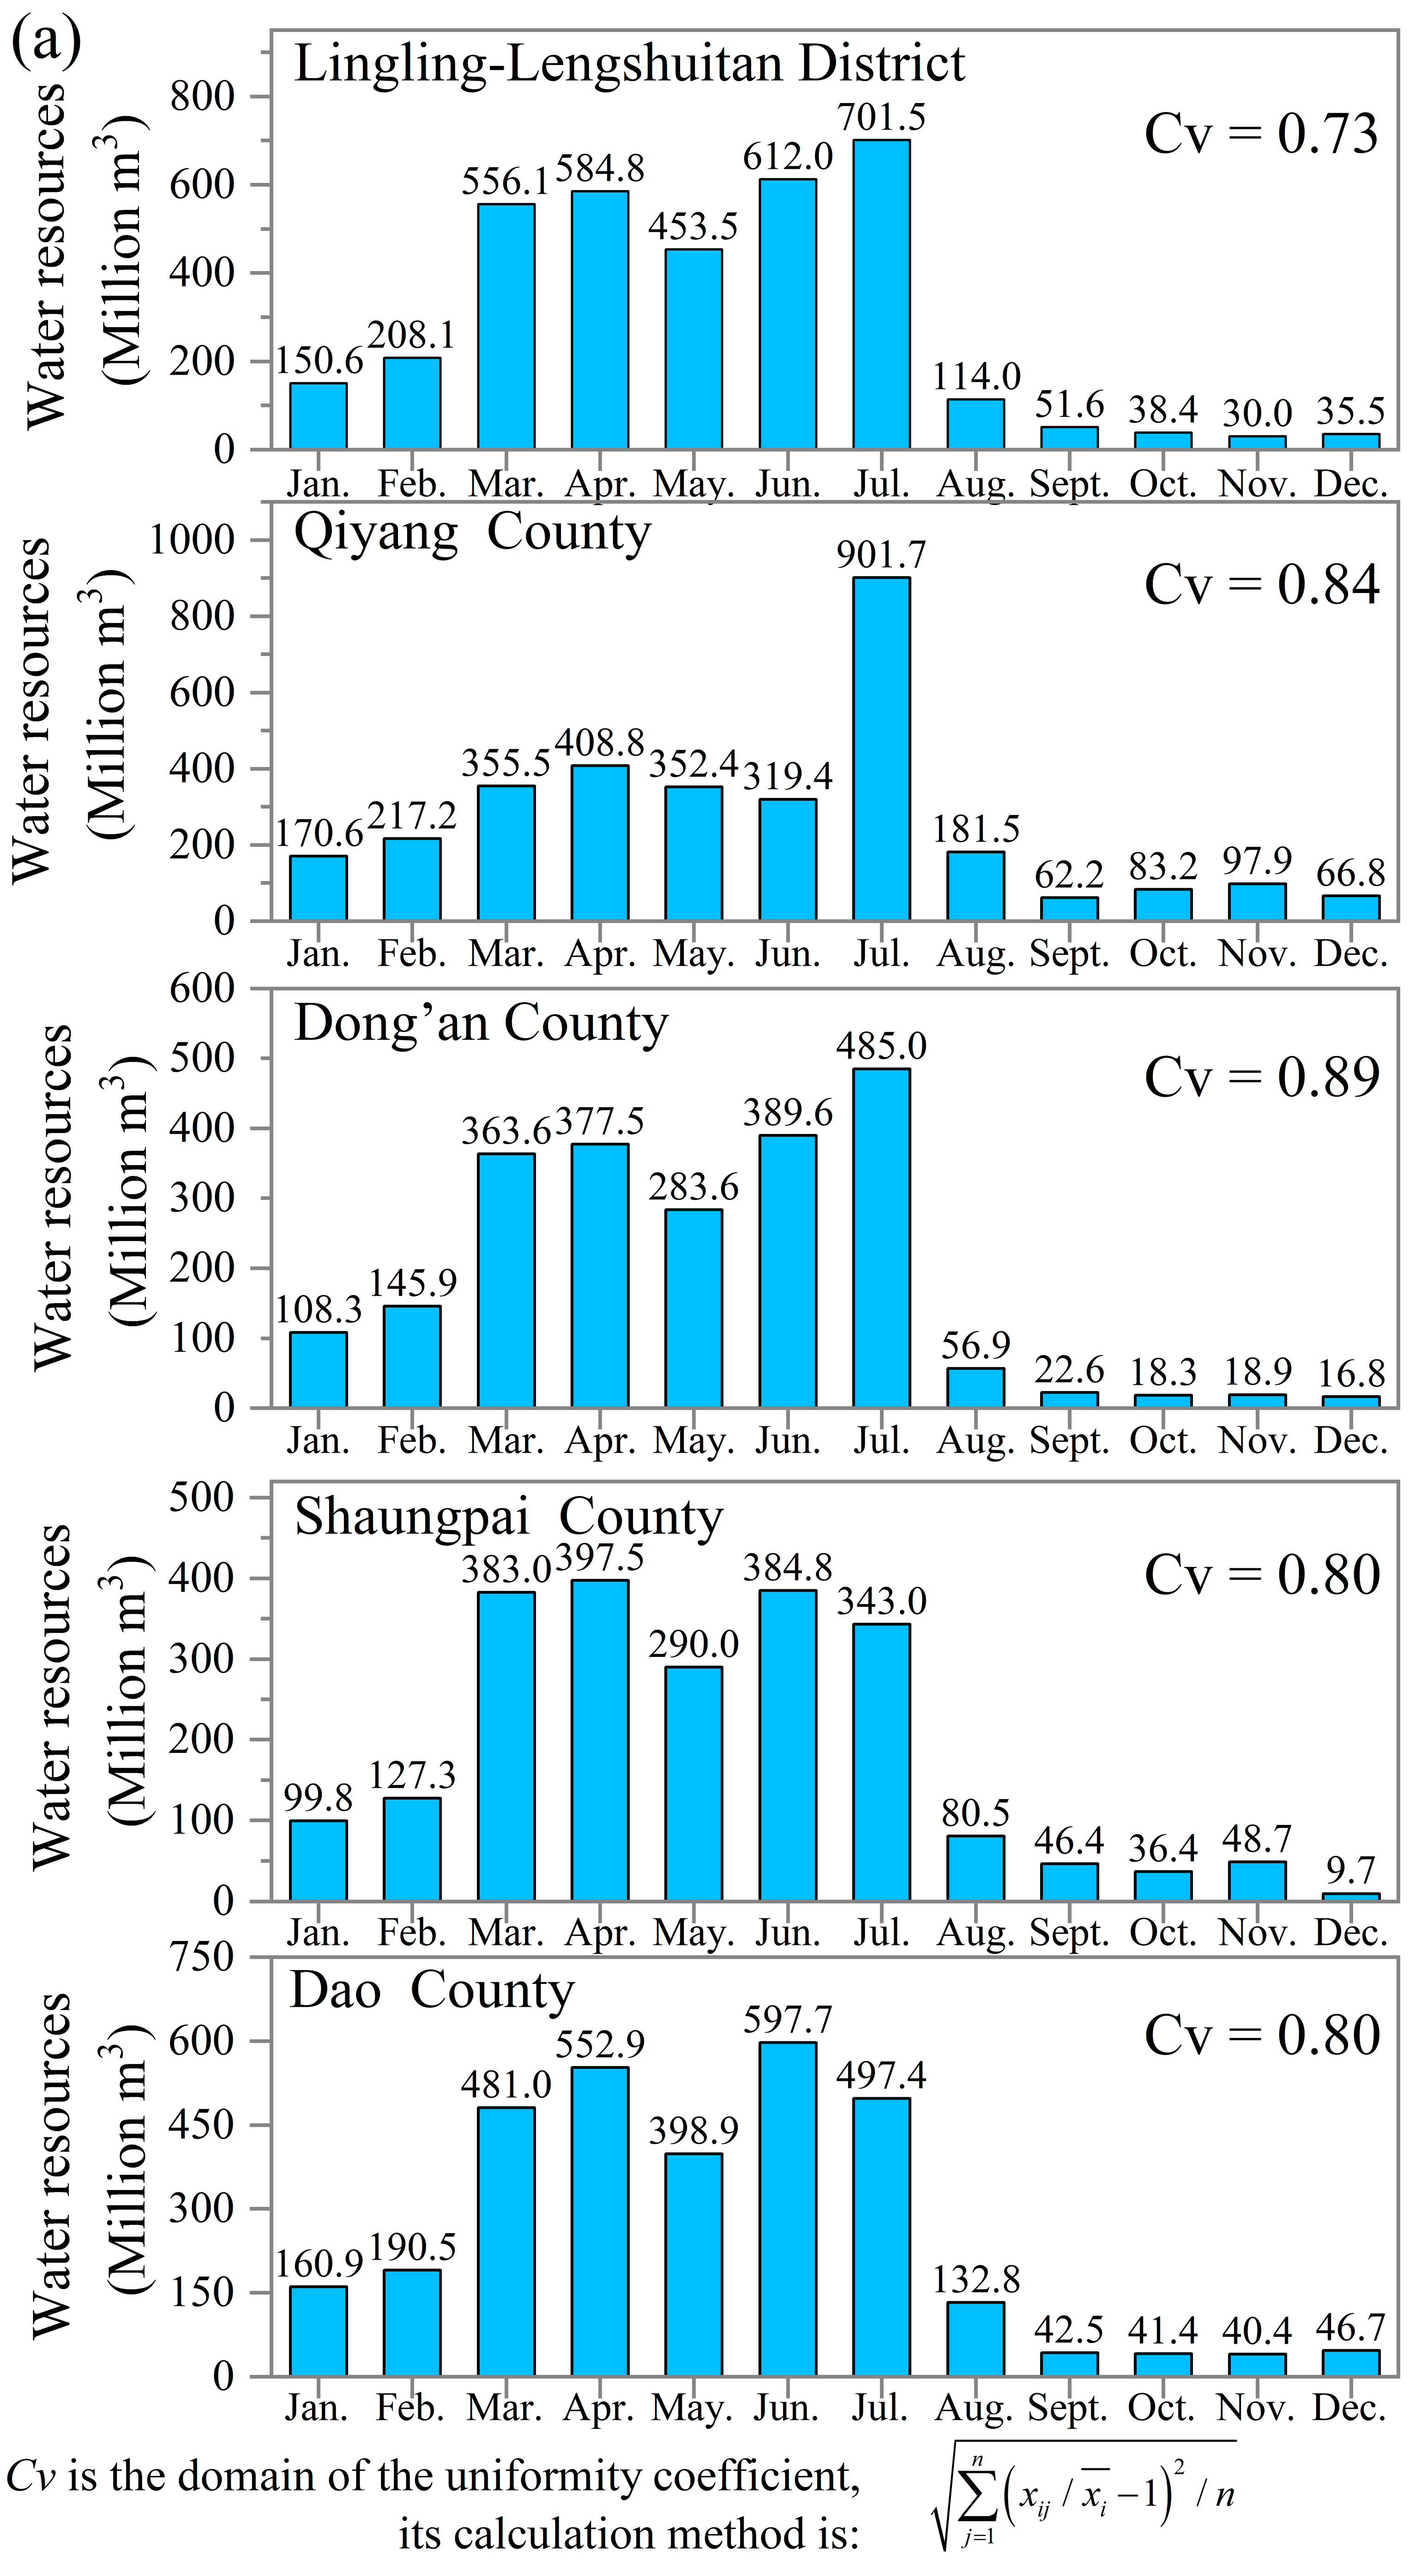
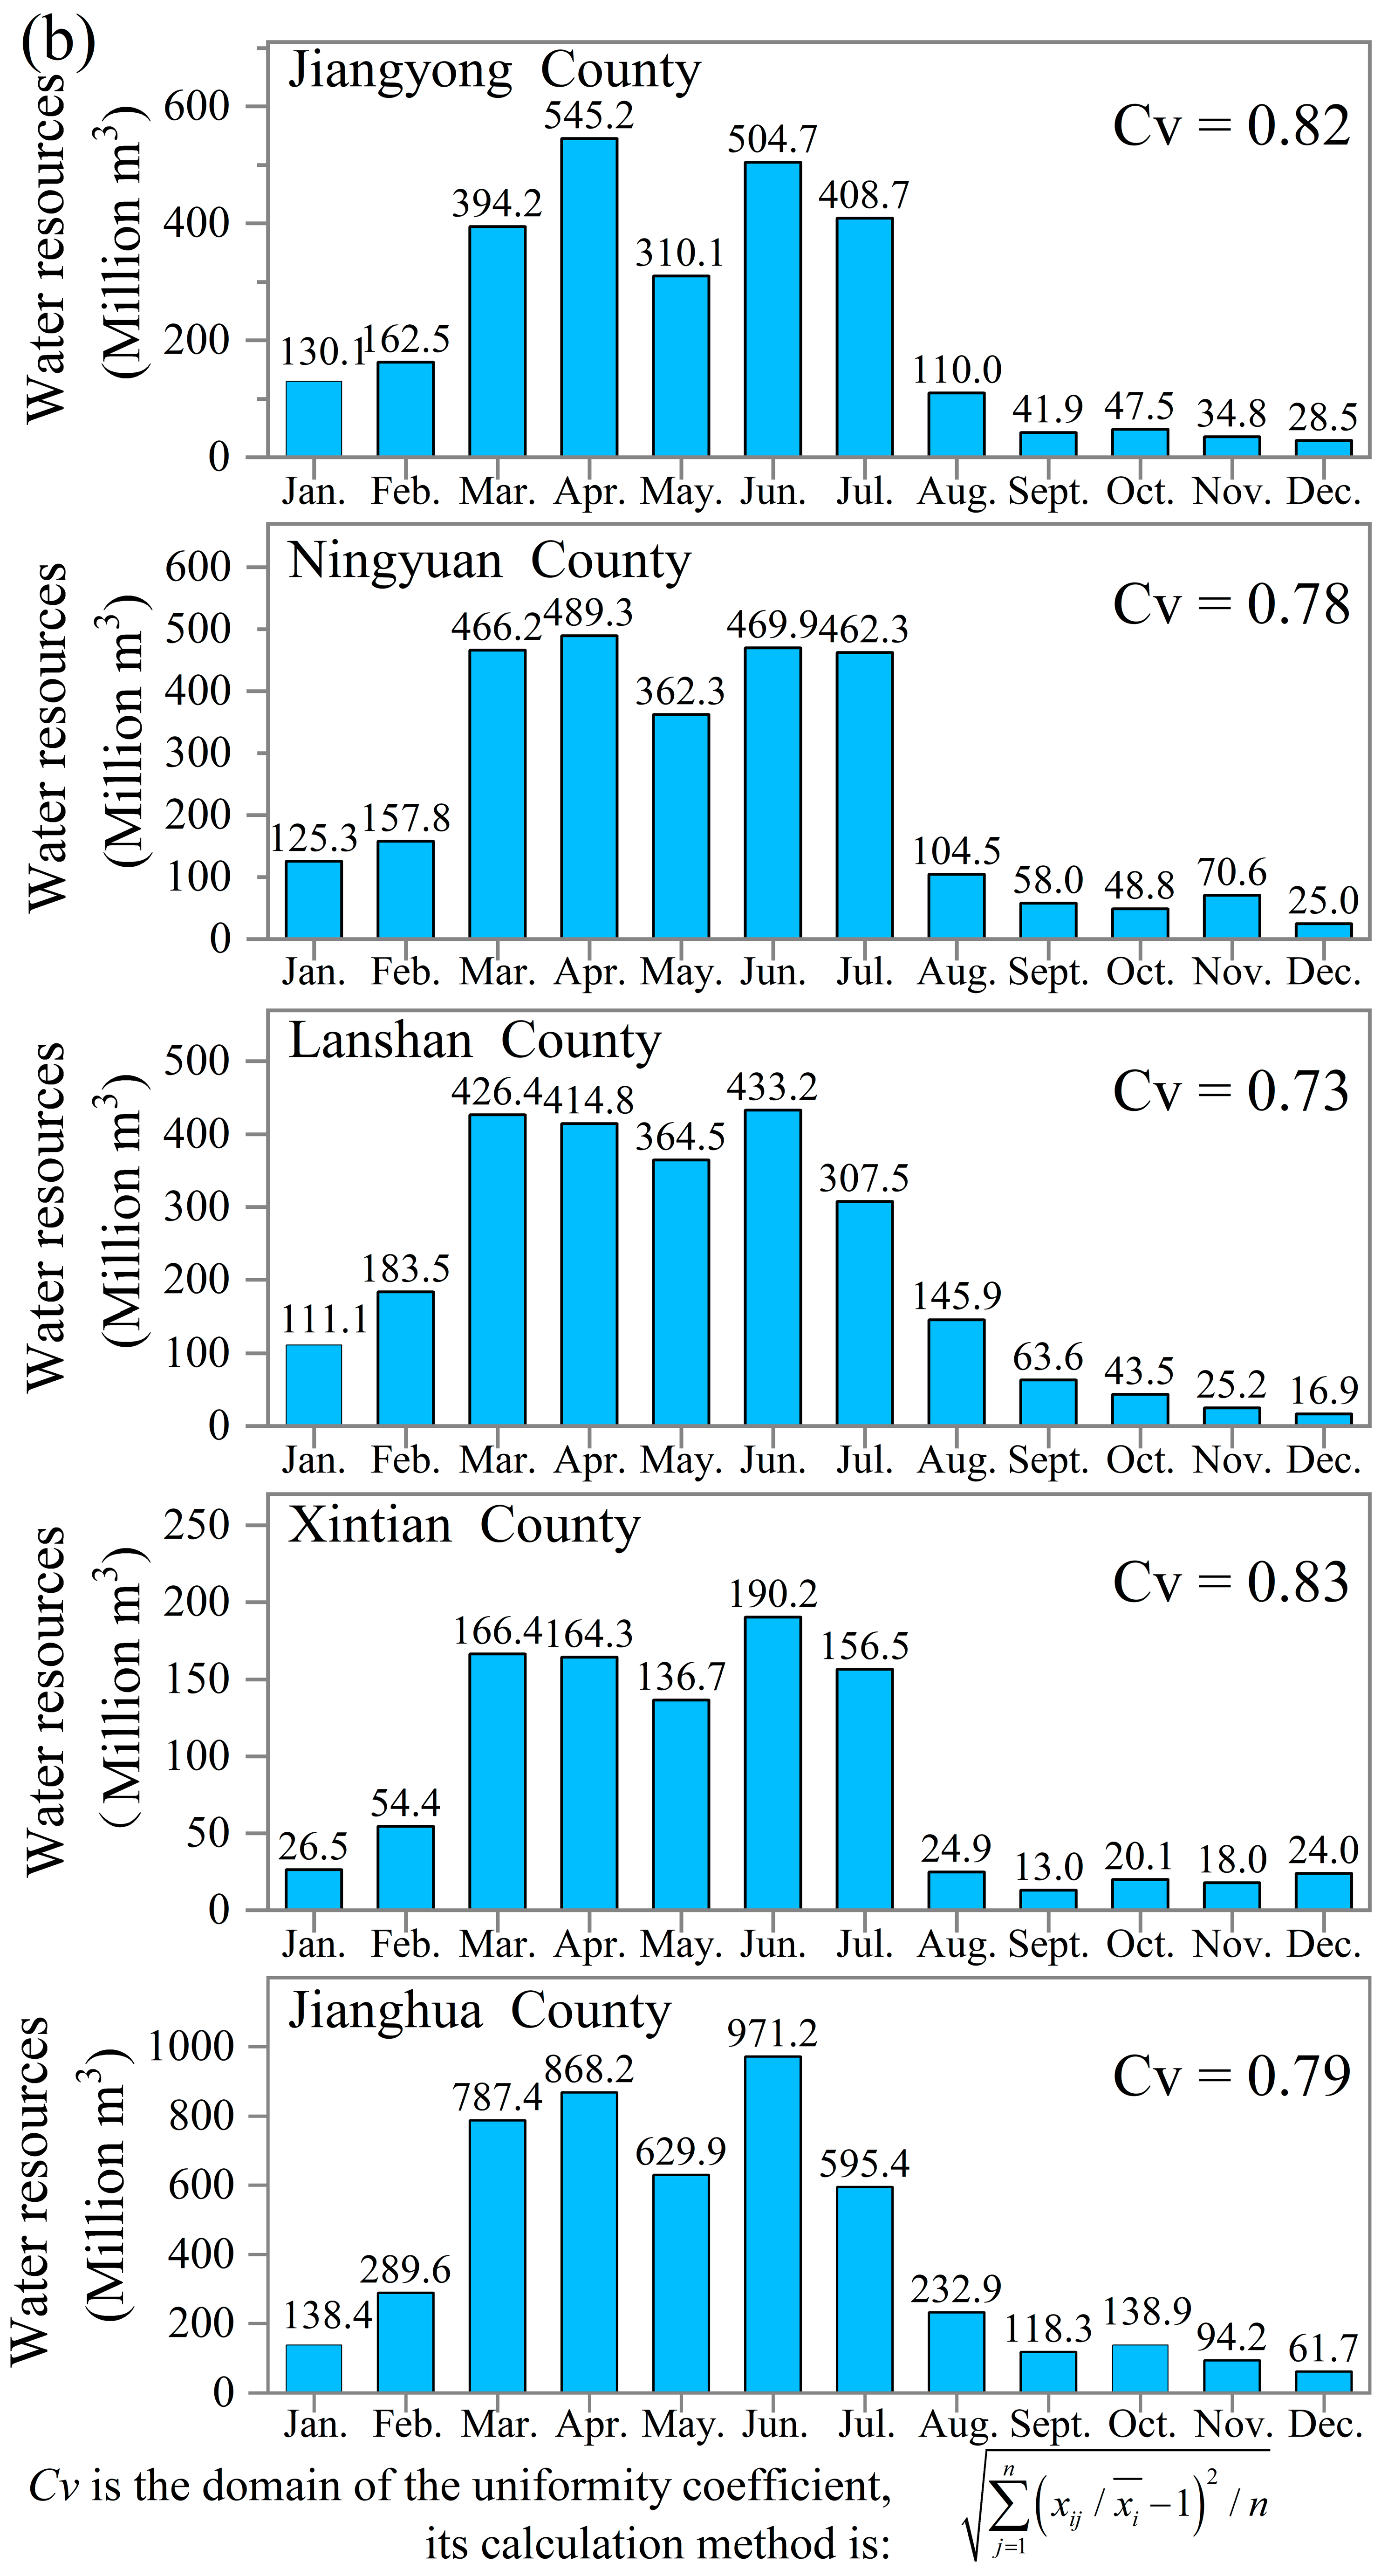
The natural water resources of Yongzhou City in 2019 are shown in Figure 3.
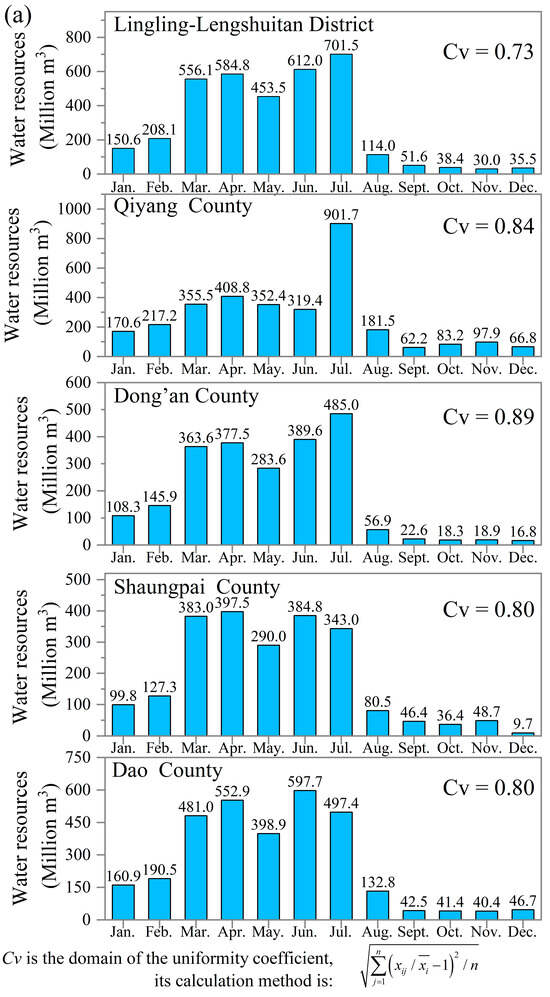
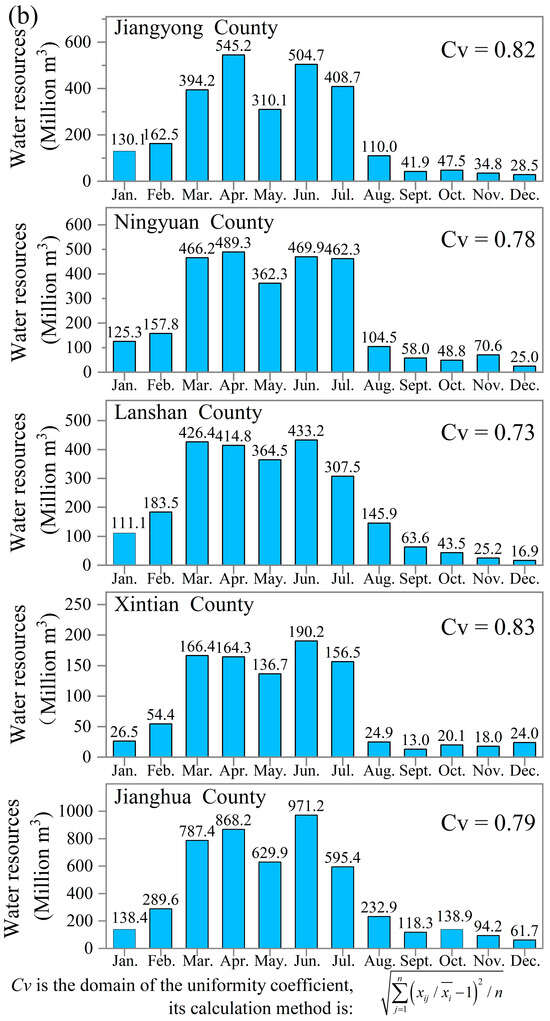
Figure 3.
(a) Natural water resources of Lingling-Lengshuitan District, Qiyang County, Dong’an County, Shuangpai County and Dao County. (b) Natural water resources of Jiangyong County, Ningyuan County, Lanshan County, Xintian County, and Jianghua County.
As shown in Figure 3, Yongzhou City has, in total, natural water resources equal to 28.485 billion m3. Its average runoff depth is 1280.2 mm, which is approximately 4.51 times greater than the average value in China. However, the temporal distribution of the water resources in Yongzhou City is uneven. As shown in Figure 3, the domain of the uniformity coefficient (Cv) values of the 10 counties in Yongzhou City is [0.78, 0.89], and their average value is 0.83, which is much larger than the Cv of the Yangtze River basin (0.45) [32]. The natural water resource of Yongzhou City during the rainy season is 19.820 billion m3, accounting for 69.6% of the total, but it is only 8.664 billion m3 during the dry season, accounting for 30.4% of the total.
From the county level, Jianghua County has the largest total natural water resources of 4926 million m3, followed by Lingling-Lengshuitan District (3536 million m3), and Qiyang County (3217 million m3), whereas Xintian County has the smallest total natural water resources of only 995 million m3. However, the Cv values of Dong’an County, Lingling-Lengshuitan District, and Qiyang County are 0.89, 0.86, and 0.84, respectively, all of which are larger than the average value of Yongzhou City. These phenomena are mainly characterized by the insufficient water resources from September to December in these regions. Based on their geographical location in Figure 1, it can be seen that they are located in the north of Yongzhou City. Overall, compared with the south part, the water resource in the north part of Yongzhou City is more uneven in temporal distribution.
3.2. Social Water Consumption
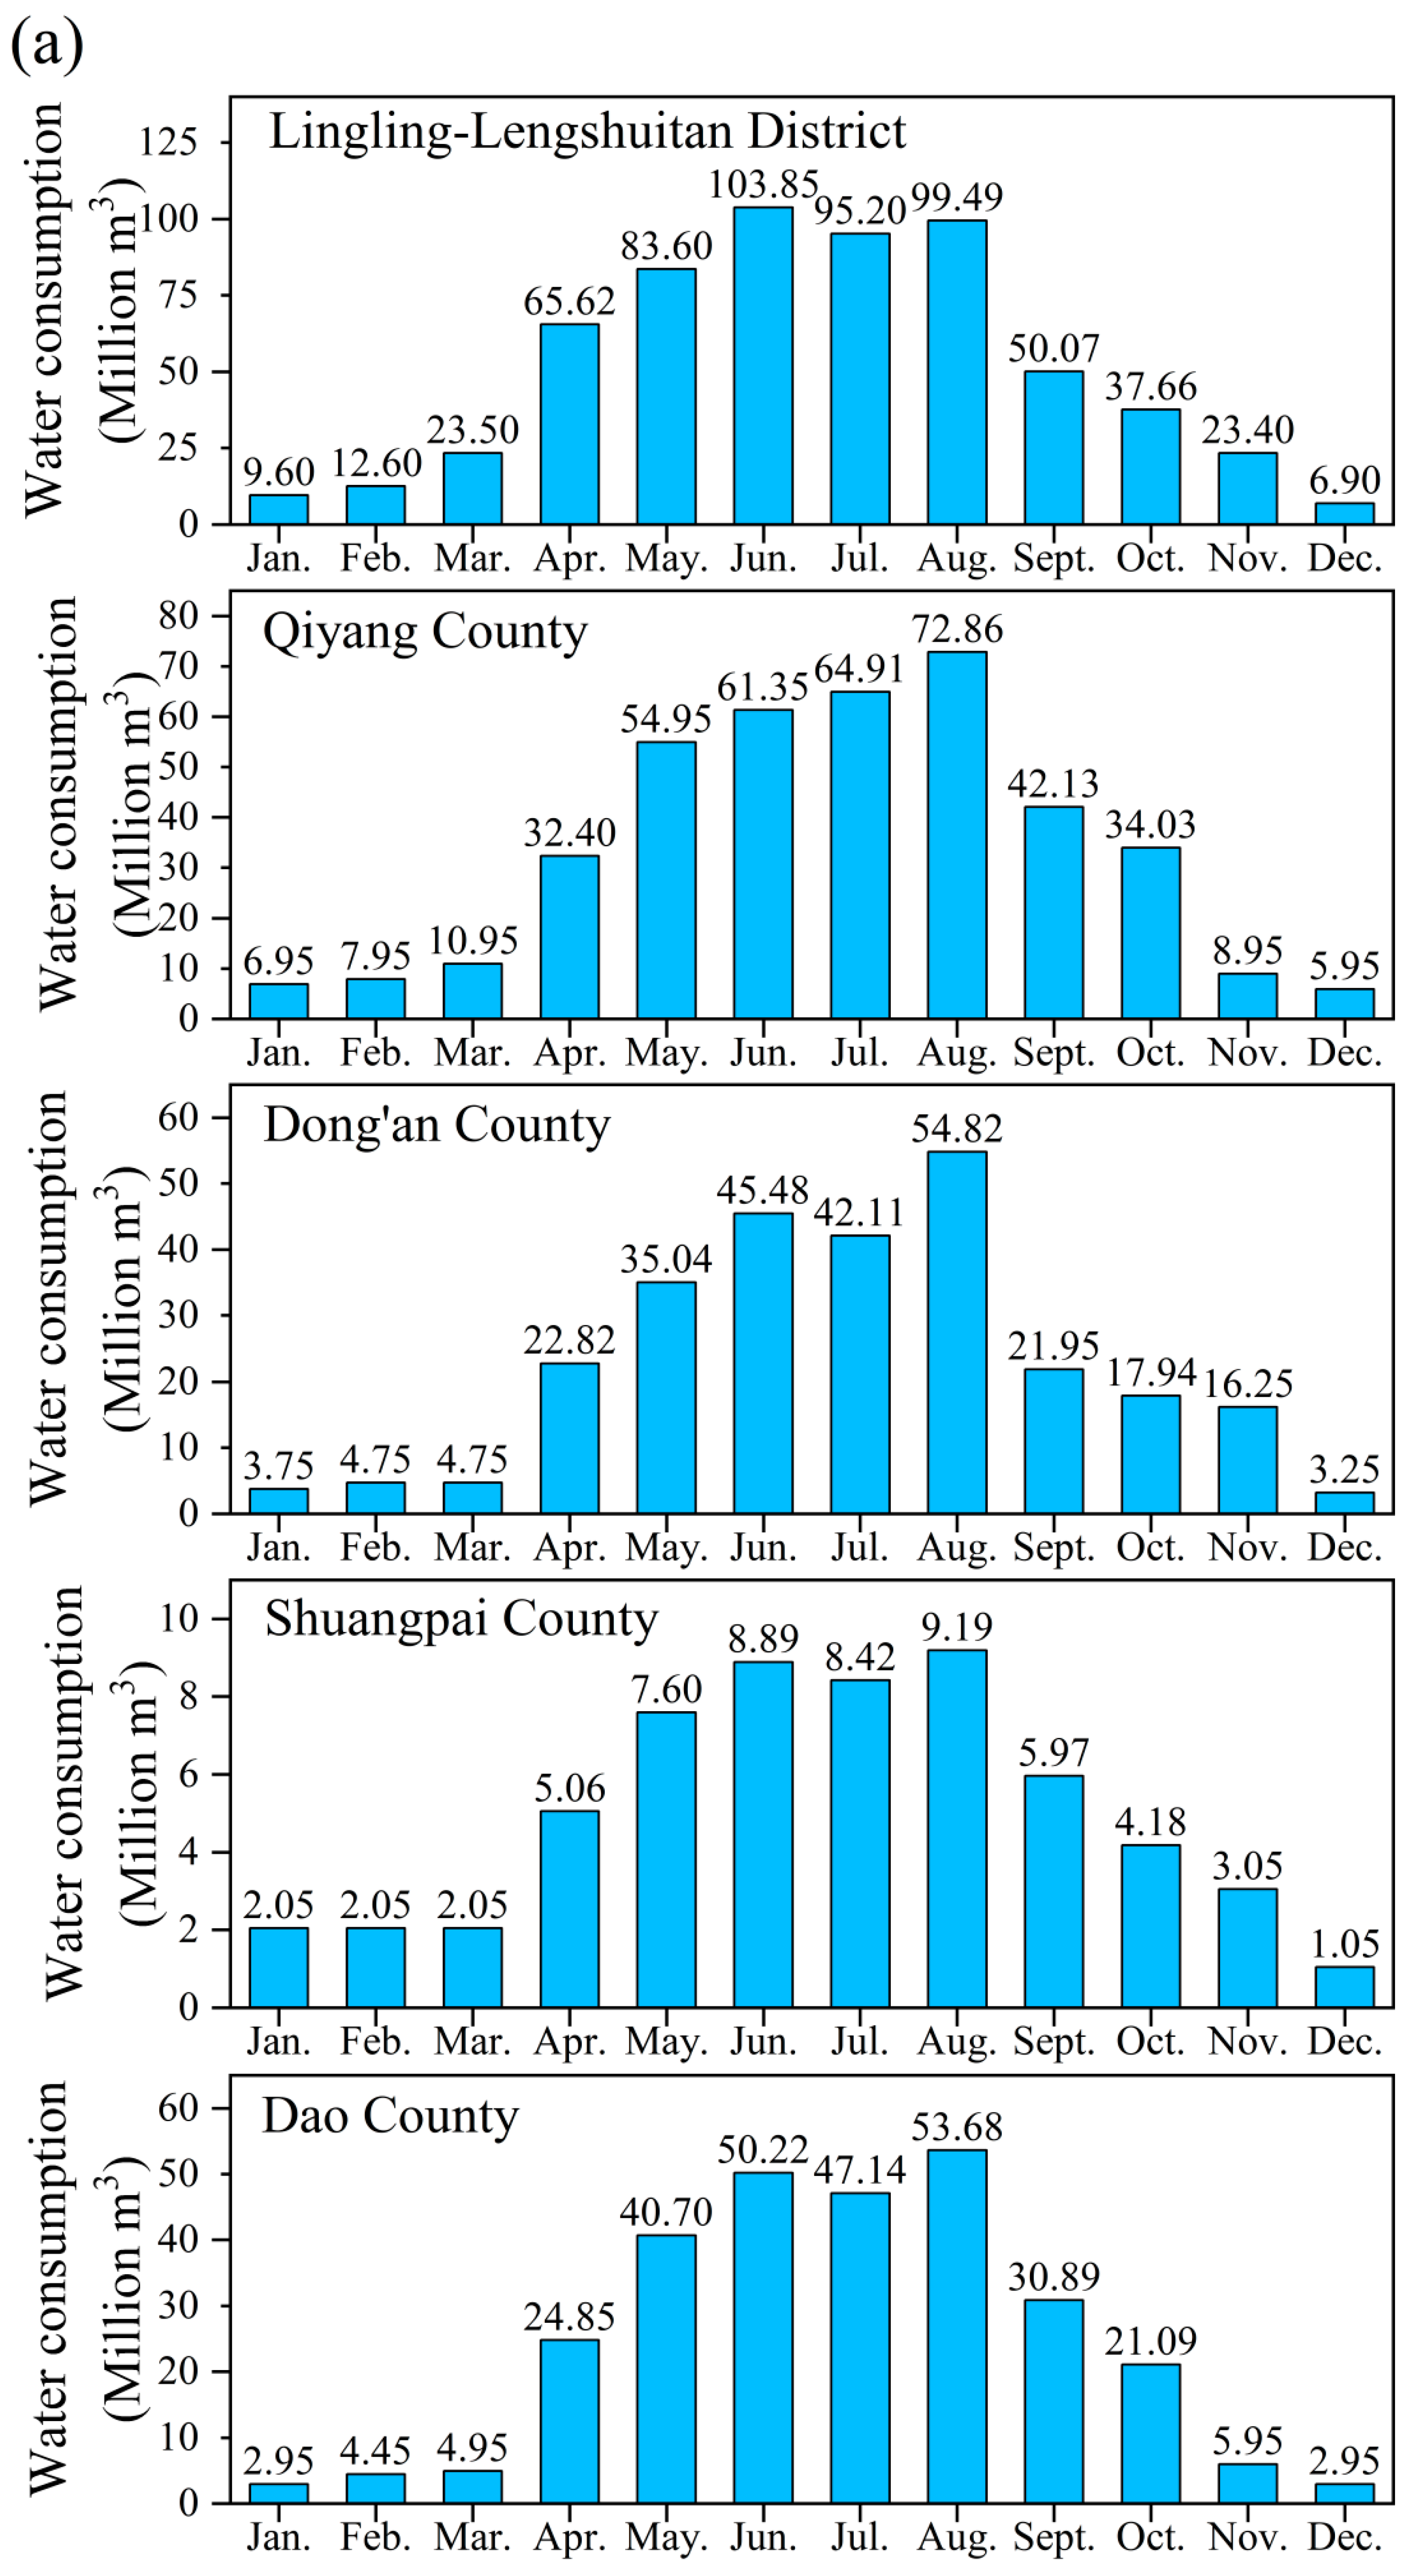
Figure 4 shows the social water consumption of Yongzhou City in 2019 according to the statistics of the Hunan Provincial Hydrology Bureau.

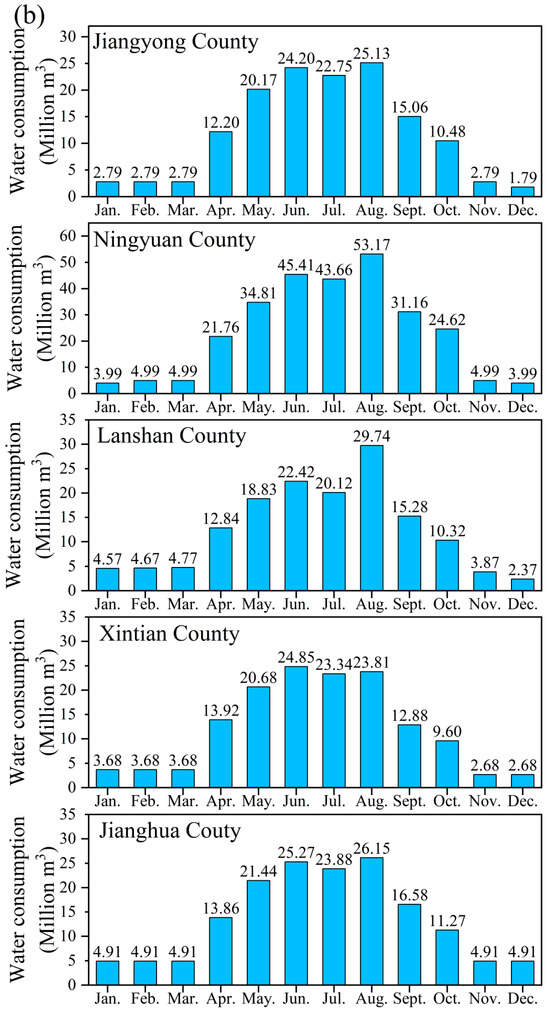
Figure 4.
(a) Social water consumption of Lingling-Lengshuitan District, Qiyang County, Dong’an County, Shuangpai County and Dao County. (b) Social water consumption of Jiangyong County, Ningyuan County, Lanshan County, Xintian County, and Jianghua County.
As shown in Figure 4, in Yongzhou City, the total social water consumption is 2515.83 million m3 and the per capita water use is 463.07 m3. According to the survey by the National Bureau of Statistics, the per capita water consumption in China is 427.7 m3 [10]. Therefore, the water usage of Yongzhou City is basically consistent with that of China.
From the county level, Lingling-Lengshuitan District has the highest social water consumption at 611.46 million m3. By contrast, Shuangpai County has the lowest social water consumption at 59.54 million m3. Meanwhile, the water consumption of Qiyang, Dao, Ningyuan, and Dong’an Counties are 403.38 million m3, 289.80 million m3, 277.55 million m3, and 272.90 million m3, respectively, all of which are higher than the average value of Yongzhou City. The phenomenon is caused by agricultural distribution. Yongzhou City is a crucial grain-producing area of the Hunan Province, and its water is mainly consumed for agriculture. Lingling-Lengshuitan District has the largest plain area, which is suitable for agricultural cultivation. However, the terrain in Shuangpai County is mainly mountainous, with small arable farmland and, therefore, has less agricultural water consumption.
From the perspective of temporal distribution, the social water consumption from April to October is 2237.84 million m3, accounting for approximately 88.95% of the total. On the contrary, the water consumption from November to March is 278 million m3, accounting for only 11.05% of the annual total. In particular, the water consumption totals from April to October of Lingling-Lengshuitan District and Qiyang County are 535.49 million m3 and 362.65 million m3, respectively, followed by Dao County (268.56 million m3) Ningyuan County (254.56 million m3), and Dong’an County (240.17 million m3), all of which are larger than the average value of Yongzhou City.
3.3. T-WRSI Evaluation Result
Based on the period division discussed in Section 2.3.1 and Equation (3) generated in Section 2.3.2, the T-WRSI of each region in Yongzhou City is shown in Figure 5.
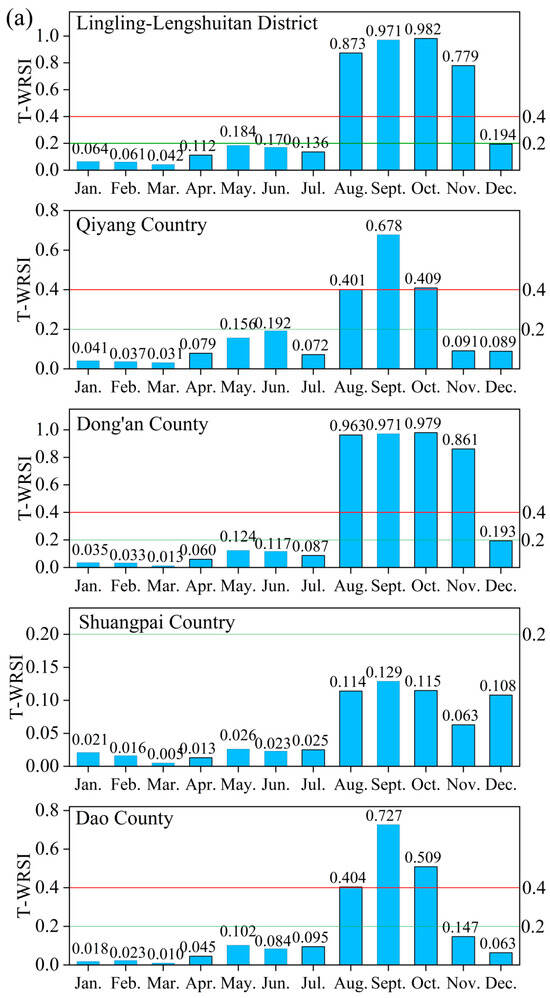
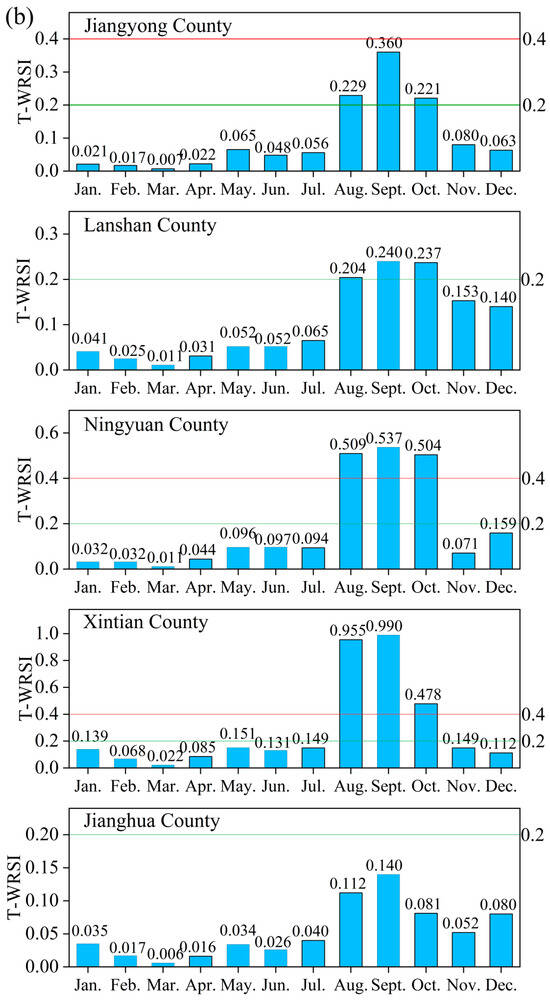
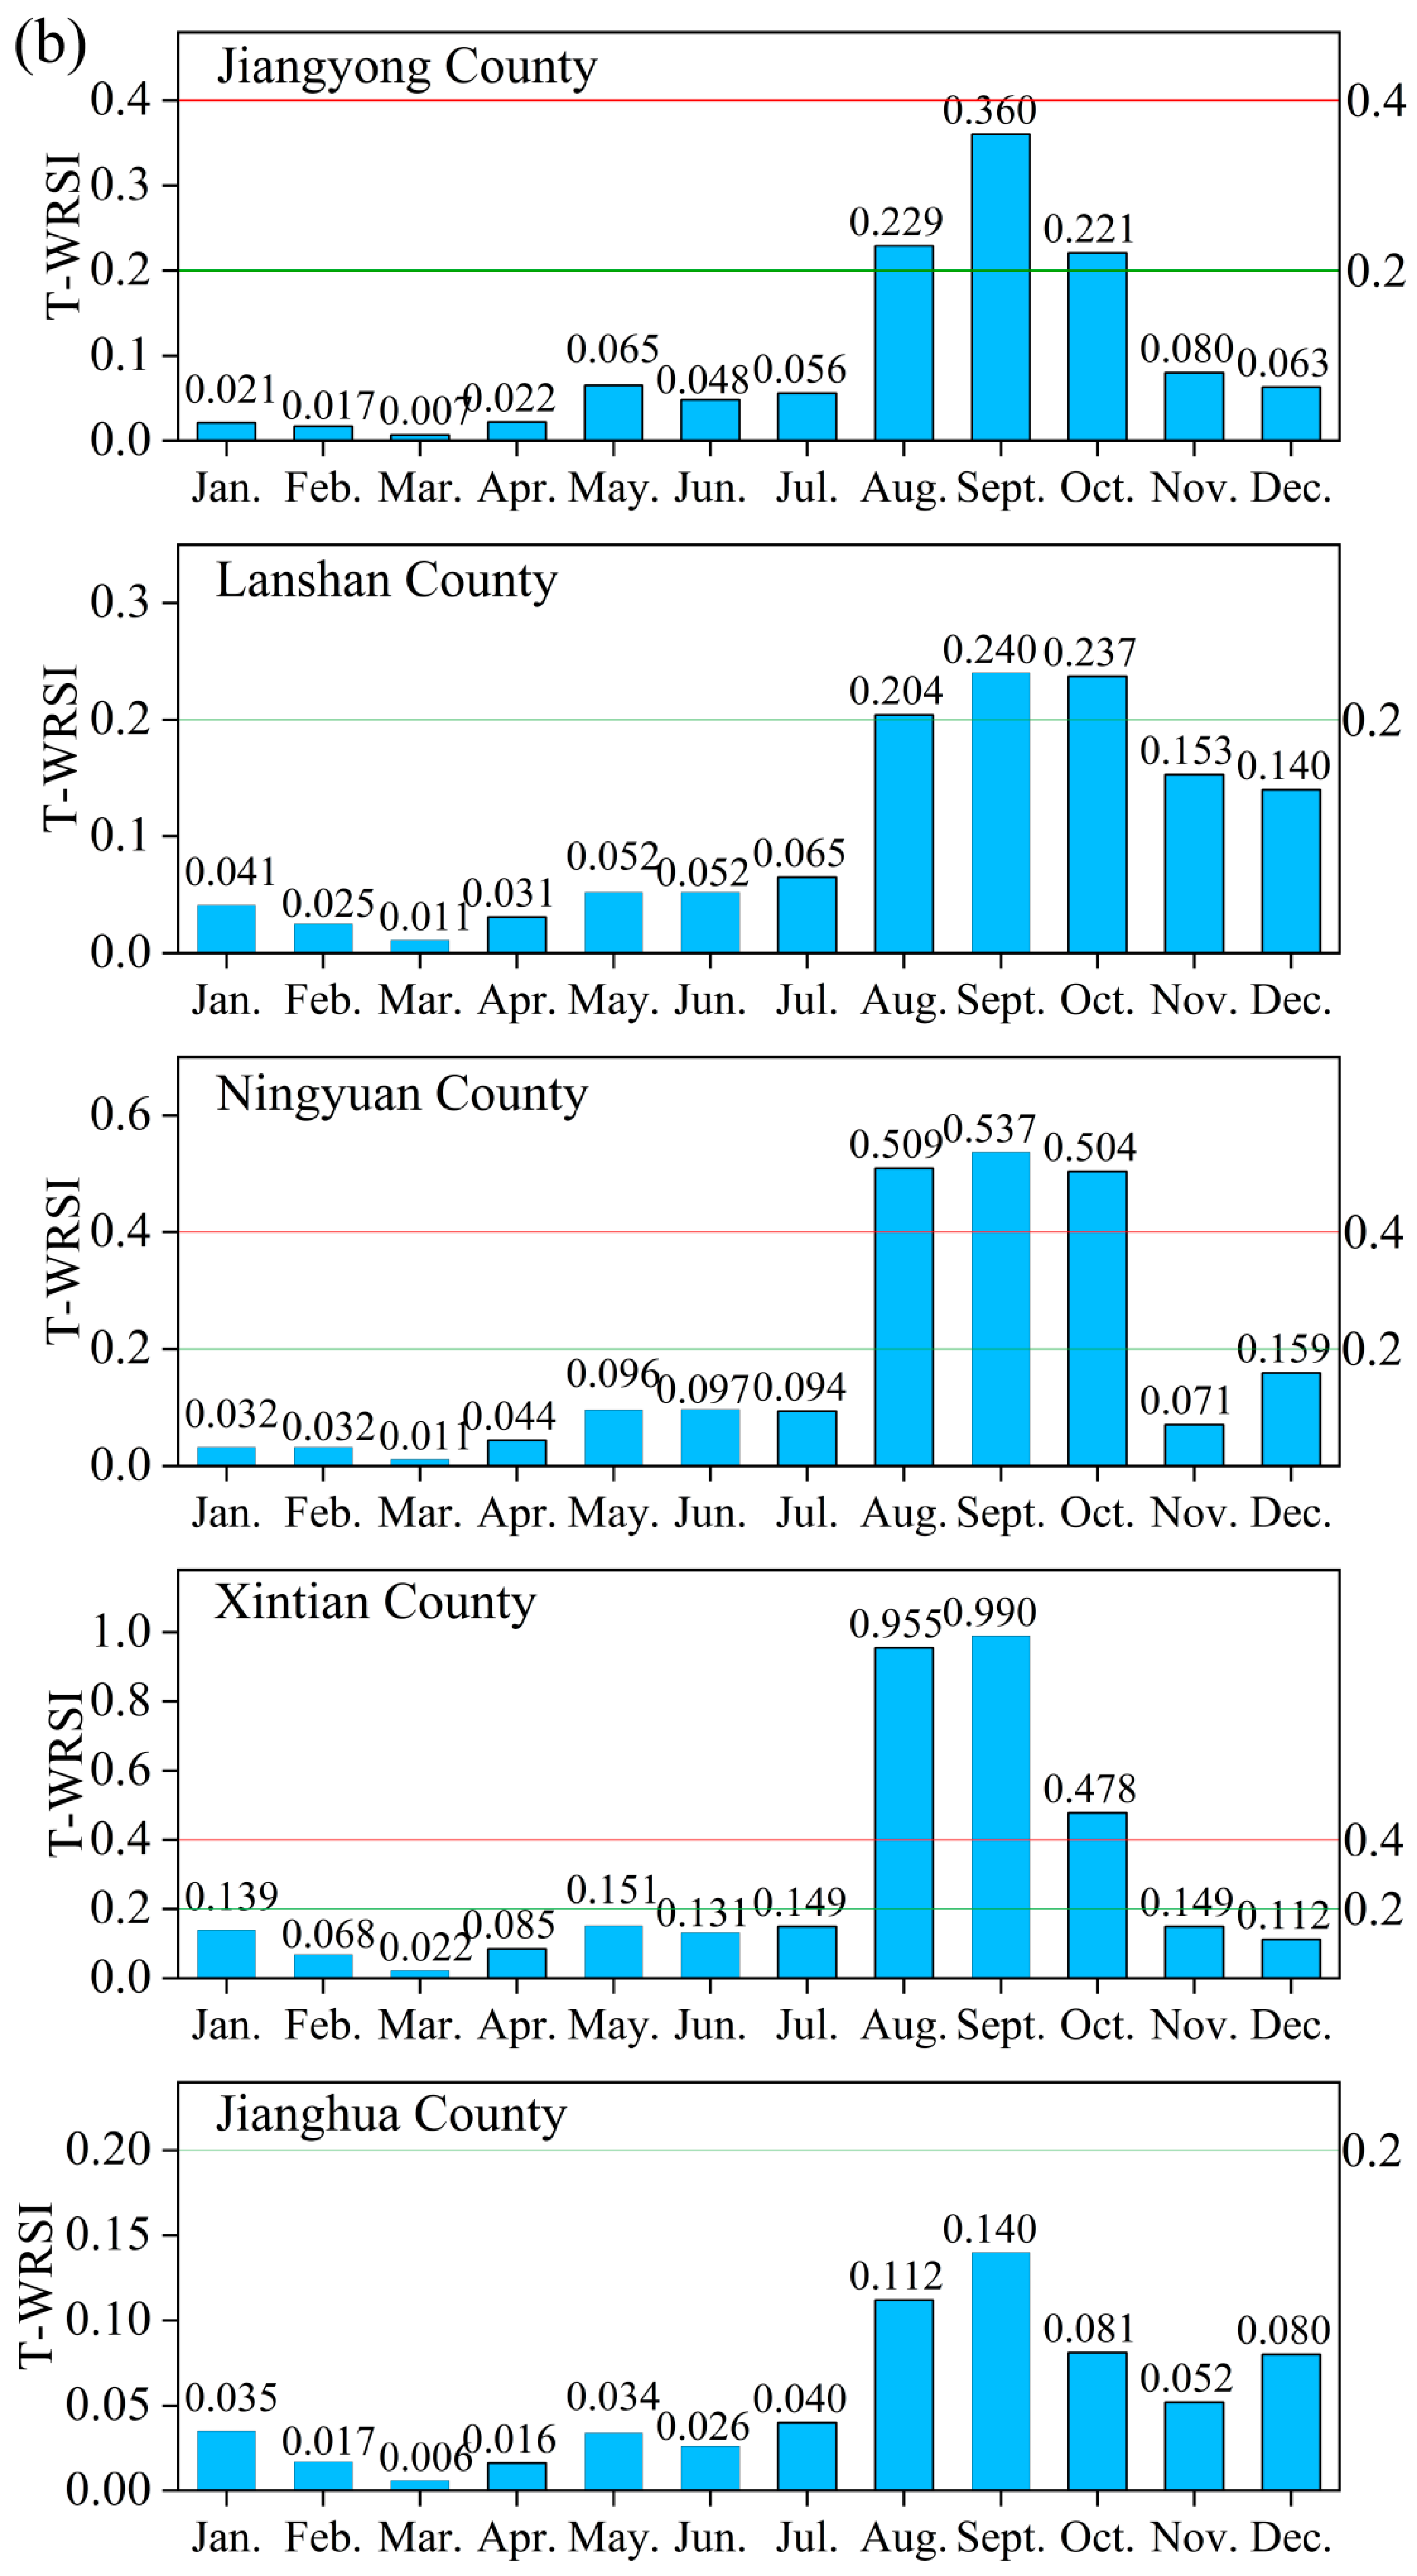
Figure 5.
(a) T-WRSIs of Lingling-Lengshuitan District, Qiyang County, Dong’an County, Shuangpai County and Dao County. (b) T-WRSIs of Jiangyong County, Ningyuan County, Lanshan County, Xintian County, and Jianghua County. (The red line refers to the lower threshold of WRSI “high” grade with 0.4. The green line refers to the upper threshold of WRSI “low” grade with 0.2).
According to Figure 5, the T-WRSI is extremely uneven in terms of temporal distribution. In particular, the T-WRSI values from August to November of Lingling-Lengshuitan District (0.873, 0.971, 0.982, and 0.779) and Dong’an County (0.963, 0.971, 0.979, and 0.961) correspond to the “high” grade, which indicates that these areas suffer from severe water shortage problems. In addition, Qiyang, Dao, Ningyuan, and Xintian County T-WRSI values from August to October are (0.401, 0.678, and 0.409), (0.404, 0.727, and 0.509), (0.509, 0.537, and 0.504), and (0.955, 0.990, and 0.478), respectively. Meanwhile, the T-WRSI values from August to October in Jiangyong (0.229, 0.360, and 0.221) and Lanshan County (0.204, 0.240, and 0.237) correspond to the “medium” grade, which indicates that these areas have a potential water scarcity. In general, the values of T-WRSI are more than 0.4 from August to October in most areas of Yongzhou City, while the values of T-WRSI in the other periods are less than 0.2, indicating no water shortage.
Combining Figure 3 and Figure 4, the variations are caused by the temporal distribution of natural water resources and social water consumption.
- (i)
- From January to March, the social water consumption is much less than the natural water resources. From April to July, the precipitation in Yongzhou City increases due to the beginning of the rainy season. Although the water consumption in the irrigation season has increased, the water resources remain sufficient. Therefore, the water shortage from January to July is not significant.
- (ii)
- From August to October, the rainfall decreases relatively as the rainy season ends. However, at the same time, the water consumption of agricultural irrigation continuously increases, which leads to the increase in T-WRSI in various regions of Yongzhou City.
- (iii)
- After November, the agricultural water consumption decreases. The main water consumption then comes from domestic and industrial use with relatively stable demand. Thus, the T-WRSI decreases.
3.4. Weighting Result of EWM
According to EWM, the weights are generated and listed in Table 3.
Table 3.
The weighting process based on EWM.
As shown in Table 3, according to EWM, the entropy of September is 0.827, which is the smallest of all. Consequently, it has the most information content and the highest weight with 0.147. The entropy of August is 0.864, which is the second smallest. Therefore, its weight is 0.116, which is the second highest. However, the entropy of January is 0.951, which is larger than that of other periods. Thus, it has the least information content and the lowest weight with 0.042.
The reason for this result is that the distinction of T-WRSI values in each period is different. For example, combined with Section 3.3, the calculated data of T-WRSI in September are distributed into three grades: “high”, “medium”, and “low”, the dispersion degree of which is the largest. Therefore, it has the highest weight, too.
Nevertheless, the values of T-WRSI in January are concentrated in the “low” level, the dispersion degree of which is the smallest. Consequently, its weight is the lowest. In general, the results of the weights calculated with EWM can correctly reflect the discrete degree of the T-WRSI values in each period.
3.5. C-WRSI Evaluation Result
Based on the C-WRSI model constructed in Section 2.3.4, the C-WRSI value of each region of Yongzhou City is calculated as shown in Figure 6.
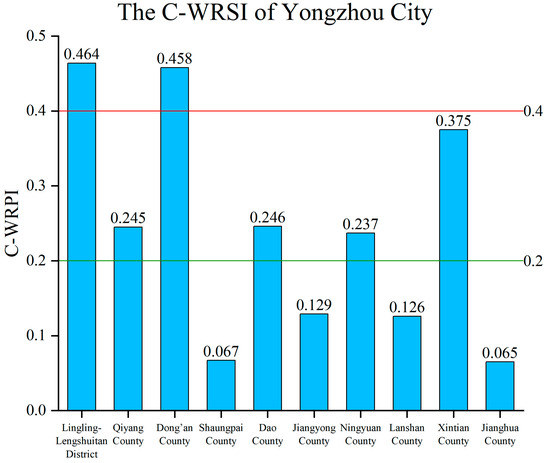
Figure 6.
The C-WRSI of Yongzhou City. (The red line refers to the lower threshold of WRSI “high” grade with 0.4. The green line refers to the upper threshold of WRSI “low” grade with 0.2).
Figure 6 shows that the C-WRSI values in Lingling-Lengshuitan District and Dong’an County are 0.464 and 0.458, respectively, both of which correspond to the “high” grade. The results indicate that these areas suffer from severe water shortages. The reasons are as follows. The social water consumption of Lingling-Lengshuitan District is the highest, accounting for approximately 24.30% of the total in Yongzhou City. Moreover, the runoff depth of Dong’an County is 1038 mm, which is the third lowest in Yongzhou City.
The values of C-WRSI in Qiyang, Dao, Ningyuan, and Xintian Counties are 0.245, 0.246, 0.237, and 0.375, respectively. These grades are all “medium” grades, which indicates a potential water scarcity in these areas. However, combined with Figure 5, it should be pointed out that the grades of T-WRSI in these regions are “high” from August to October. As such, this situation requires sufficient attention from water resource management.
The C-WRSI grades in Shuangpai, Jiangyong, Lanshan, and Jianghua Counties are “low”, indicating no water shortages in these regions. Nevertheless, the values of T-WRSI in Jiangyong County and Lanshan County are more than 0.2 from August to October, both of which correspond to the “medium” grade, which indicates potential water scarcity in these periods.
3.6. The Key Water Shortage Periods and Treatment Measures
According to the satisfaction by Equations (9) and (10) in Section 2.3.5, the key water shortage periods in each region of Yongzhou City are shown in Table 4.
Table 4.
The key water shortage periods in each county of Yongzhou City.
As shown in Table 4, all the T-WRSI values of Shuangpai County and Jianghua County throughout the year correspond to the “low” grade, indicating there was no water shortage in these regions in 2019. However, considering that 2019 was a normal flow year, the creation of contingency plans is suggested for future dry years through long-term meteorological and hydrological forecasting.
The C-WRSI values of Qiyang County, Dao County, Ningyuan County, and Xintian County correspond to the “medium” grade, and all of their key water shortage periods are from August to October. Furthermore, although the C-WRSI values of Jiangyong County and Lanshan County correspond to the “low” grade, their T-WRSI values are larger than 0.2 from August to October, too.
The C-WRSI values of Lingling-Lengshuitan District and Dong’an County correspond to the “high” grade. In addition, all of their key water shortage periods are from August to November, which is a little longer than that in the southern part of Yongzhou City. As introduced in Section 3.1, Lingling-Lengshuitan District and Dong’an County are the areas with the most uneven water resources in Yongzhou City. Furthermore, due to the lack of reservoirs, Lingling-Lengshuitan District and Dong’an County have the weakest regulations and storage capacity in Yongzhou City, too.
4. Discussion
4.1. Discussion on the Yongzhou City Water Shortage
According to Section 2.2 and Section 2.3, the evaluation results of two WRSI models are evaluated and shown in Table 5.
Table 5.
Evaluation results of the water shortage evaluation in Yongzhou City.
According to the C-WRSI values obtained using the improved model, Lingling-Lengshuitan District and Dong’an County (C-WRSI > 0.4) suffer from severe water shortage, and Qiyang, Dao, Ningyuan, and Xintian Counties (0.2 < C-WRSI ≤ 0.4) have a certain water shortage. In addition, August to October is a major key water shortage period in Yongzhou City. And in Lingling-Lengshuitan District and Dong’an County, this water shortage period has even been extended to November.
The reasons for the above phenomenon are as follows. The temporal distribution of the water resources in Yongzhou City is uneven. The northern part of Yongzhou City lies on the leeward slope of Nanling Mountain. Compared to the windward slope, the leeward slope is more difficult to form precipitation [33]. Especially in the dry season, the monsoon is relatively weak and the rainfall on the leeward slope is much less, which exacerbates the uneven distribution of the runoff in the northern part of Yongzhou City. Meanwhile, the agricultural water demand from August and October increased because this period is the main irrigation season for late rice. The traditional planting mode in most areas of the Yangtze River Basin in China is double-cropping rice [34]. The early rice is sown at the end of March and harvested in mid-July. The late rice is sown at the end of July and harvested in early November. Evidently, the main irrigation season for late rice coincidentally accompanied the retreat of rainfall and the beginning of the dry season, which induced a shortage of water resources from August to October.
To solve the water scarcity in Yongzhou City, a series of targeted measures must be taken. According to the research of Hu [35], optimizing plant structures is an available way to solve this problem, for example, by changing double-cropping rice to single-cropping rice, which is sown in April, and harvested in early September. The main irrigation season for single-cropping rice is from May to August, which roughly coincides with the flood season [36]. In addition, single-cropping rice has demonstrated effectiveness in dealing with water scarcity during the dry season in the adjacent Jiangxi Province, the climate and hydrological conditions of which are similar to Yongzhou City. As a result, it is suggested to adjust the crop structure to be more suitable for hydrological rhythms in these counties.
Furthermore, the relevant departments should strengthen water resource management, ensure the rational utilization and allocation of water resources, and reduce waste and abuse [37]. In addition, it is necessary to optimize the plant structure to reduce water consumption during the production process [38]. Furthermore, consideration should be given to building additional reservoirs to store water, in order to meet the water demand during the dry season. The effective implementation of these measures requires the joint efforts and cooperation of the government, enterprises, and society.
4.2. Discussion on the Effectiveness of Improved WRSI Model
Table 5 and Figure 7 show differences in the evaluation results of the conventional and improved WRSI models.
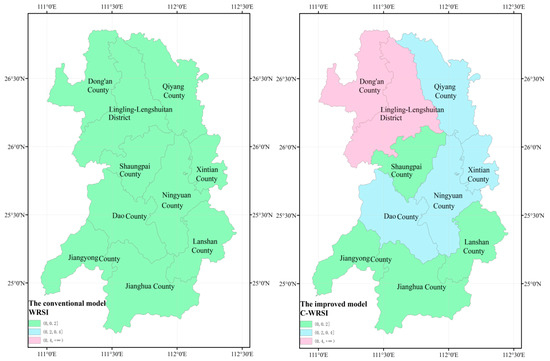
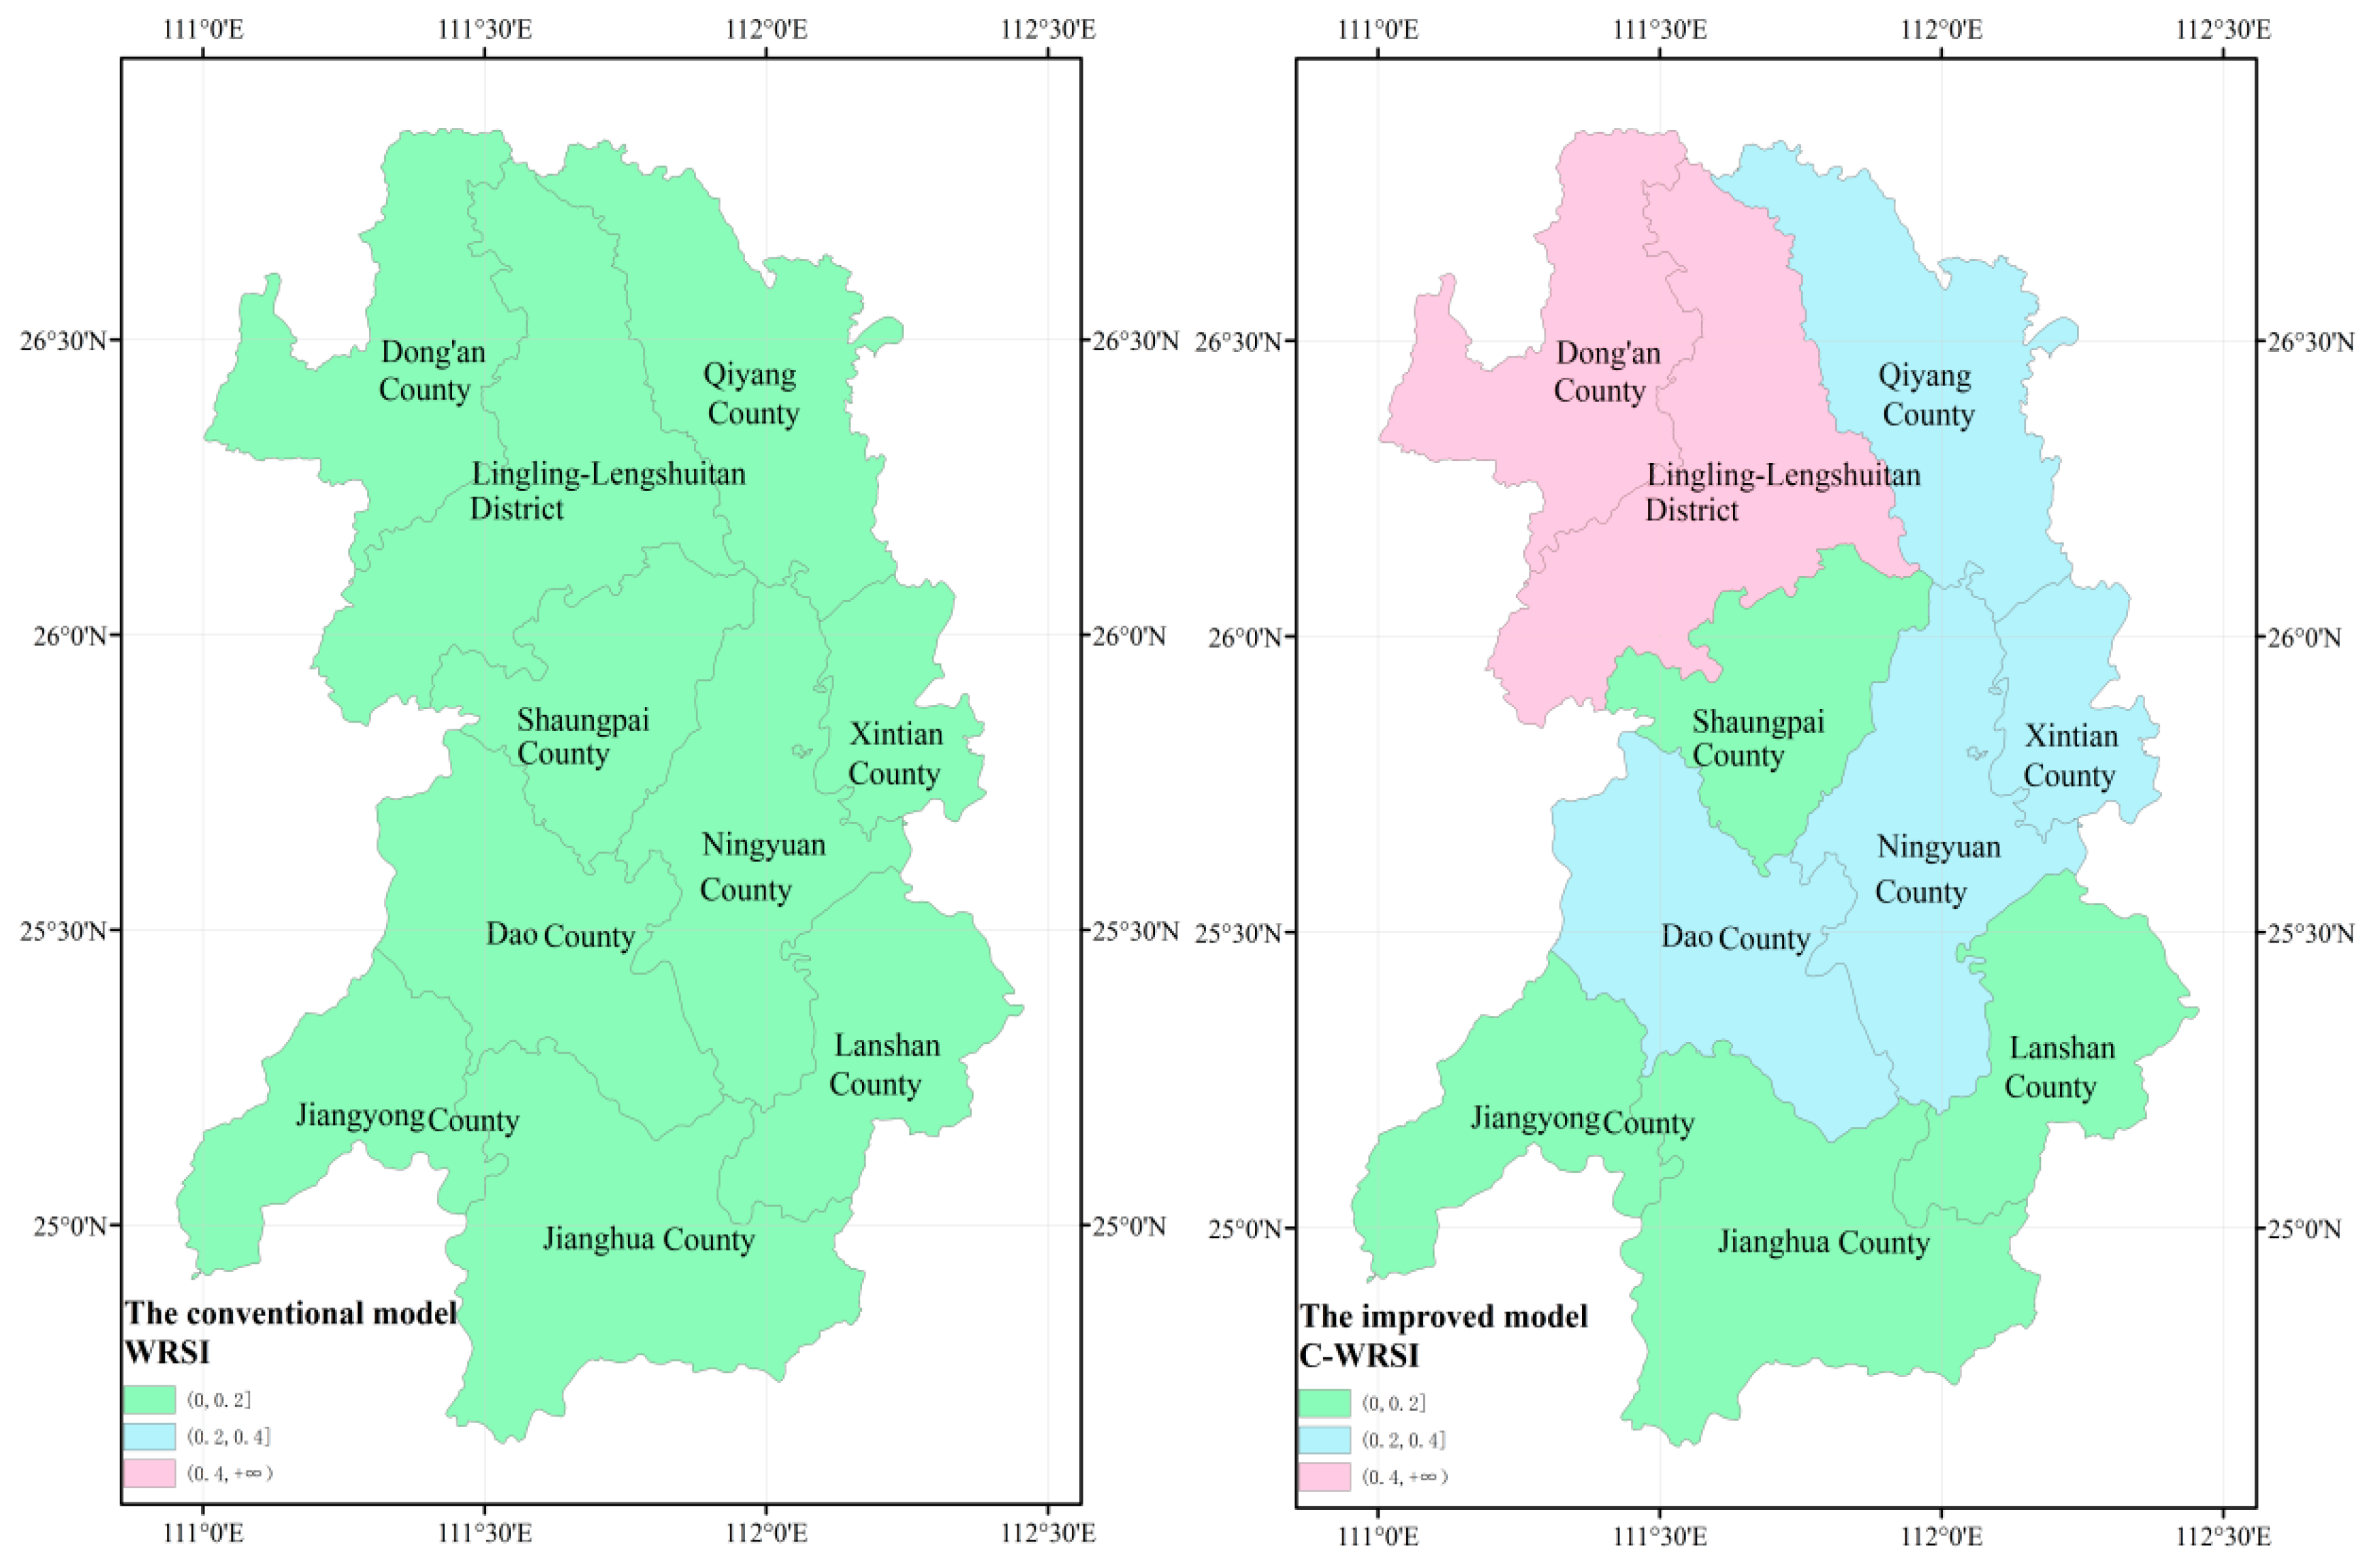
Figure 7.
Spatial distribution of WRSI and C-WRSI in Yongzhou City.
Compared with conventional methods, the improved WRSI model has more rigorous evaluation results. As discussed in Section 2.2, the conventional WRSI model evaluates water shortage using the year as the unit. Based on the WRSI values obtained using the conventional model, there was no water shortage (WRSI < 0.2) in Yongzhou City during the study period. In contrast, the improved WRSI model introduces the annual variations of social water consumption and natural water resources in the assessment. Its evaluation results express that there are varying degrees of water resource shortage in different regions. In addition, the C-WRSI values calculated using the improved model in other regions are 95–168% larger than those of conventional WRSI.
Meanwhile, in accordance with the discussion in Section 2.3 and Table 5, the improved method further utilizes the T-WRSI model for assessment, which more accurately identifies the key water shortage period caused by the unbalanced distribution of water resources in humid areas from August to October. The evaluation result is more consistent with the actual situation. However, the conventional method indicates that Yongzhou City basically had no water scarcity during the evaluation year. As such, the traditional model cannot effectively identify the critical period of water shortage, and the improved WRSI model is more suitable for application in water resource management and policy decisions made by government sectors.
Currently, there is no research evaluating the water shortage of Yongzhou City using the WRSI. However, some researchers have evaluated water scarcity using other evaluation methods. As illustrated in Table 6, according to the research of Yang et al. [39], Zhang et al. [40], Yang et al. [41], Wu et al. [42], and Liu et al. [43], Yongzhou City experiences a water shortage and drought. The results presented in this paper align with those presented in the research carried out. Clearly, the improved model is more consistent with the actual situation of the study area, whereas those of the conventional WRSI model are overoptimistic.
Table 6.
Environment investigation references of Yongzhou City.
This study’s applied methodology may be relevant to areas with similar characteristics in Yongzhou City and elsewhere. Prospectively, other numerous case studies in various humid regions of the world are necessary to enhance the model’s credibility. For example, the improved WRSI model can be extended for water shortage assessment in regions with tropical monsoon climates, tropical savanna climates, and Mediterranean climate zones, with abundant water resources and uneven distribution within the year. In addition, the improved WRSI model considers the annual variations in water resources and consumption. It is advisable to construct a model for considering the water shortage caused by other influencing factors like human activities.
5. Conclusions
Considering the heterogeneous distribution of annual runoff in humid areas, the improved WRSI further introduces the annual variations in water resources and consumption into the evaluation. The assessment year is divided into multiple periods, and the T-WRSI is built for the analysis of the water shortage process within the year. Subsequently, combined with EWM, the C-WRSI is established to evaluate the comprehensive water shortage in the study area. Lastly, the key water scarcity period is identified by combining the results of T-WRSI and C-WRSI.
Compared to the conventional WRSI, the improved method has a more rigorous evaluation result, and more accurately identifies the critical water scarcity period. The results revealed that the evaluation results via the conventional model indicate that the WRSI values in Yongzhou City are less than 0.2. However, in the improved WRSI model, Lingling-Lengshuitan District and Dong’an County have the most serious water shortage in Yongzhou City. Their C-WRSI values are 0.464 and 0.458, respectively, both of which belong to the “high” grade. The C-WRSIs of Xintian, Dao, Qiyang, and Ningyuan Counties are 0.375, 0.246, 0.245, and 0.237, respectively, all of which are in the “medium” grade. In addition, the major key water shortage period is from August to October in Yongzhou City. These results indicated that relevant departments need to pay attention to the water shortage situation in Yongzhou City. Thus, the improved WRSI method obtains a more accurate and reasonable water shortage evaluation in humid areas.
Author Contributions
F.Y., conceptualization, methodology, and writing—reviewing and editing; Y.Y., writing—original draft preparation; and H.W. data curation and investigation. All authors have read and agreed to the published version of the manuscript.
Funding
This research was funded by the National Natural Science Foundation of China (52069012).
Data Availability Statement
All the data are included in Figure 2.
Conflicts of Interest
Author Hongliang Wu was employed by the company Powerchina Guiyang Engineering Corporation Limited. The remaining authors declare that the research was conducted in the absence of any commercial or financial relationships that could be construed as a potential conflict of interest.
References
- Vorosmarty, C.J.; Green, P.; Salisbury, J.; Lammers, R.B. Global Water Resources: Vulnerability from Climate Change and Population Growth. Science 2000, 289, 284. [Google Scholar] [CrossRef] [PubMed]
- Tian, P.P.; Lu, H.W.; Liu, J.G.; Feng, K.S.; Heijungs, R.; Li, D.; Fan, X. The pattern of virtual water transfer in China: From the perspective of the virtual water hypothesis. J. Clean. Prod. 2022, 346, 131232. [Google Scholar] [CrossRef]
- Zheng, D.F.; Wang, J.Y.; Li, Y.; Jiang, J.; Lyu, L. Spatial-temporal variation of water resources stress and its influencing factors based on water-saving in China. Sci. Geogr. Sin. 2021, 41, 157–166. [Google Scholar]
- Dehghanpir, S.; Bazrafshan, O.; Ramezani Etedali, H.; Holisaz, A.; Collins, B. Water scarcity assessment in Iran’s agricultural sector using the water footprint concept. Environ. Dev. Sustain. 2023. [Google Scholar] [CrossRef]
- Al Rashed, M.; Sefelnasr, A.; Sherif, M.; Murad, A.; Alshamsi, D.; Aliewi, A.; Ebraheem, A.A. Novel concept for water scarcity quantification considering nonconventional and virtual water resources in arid countries: Application in Gulf Cooperation Council countries. Sci. Total Environ. 2023, 882, 163473. [Google Scholar] [CrossRef] [PubMed]
- Geris, J.; Comte, J.C.; Franchi, F.; Petros, A.K.; Tirivarombo, S.; Selepeng, A.T.; Villholth, K.G. Surface water-groundwater interactions and local land use control water quality impacts of extreme rainfall and flooding in a vulnerable semi-arid region of Sub-Saharan Africa. J. Hydrol. 2022, 609, 127834. [Google Scholar] [CrossRef]
- Eldardiry, H.; Habib, E.; Borrok, D.M. Accounting for Inter-Annual and Seasonal Variability in Assessment of Water Supply Stress: Perspectives from a humid region in the USA. Water Resour. Manag. 2020, 34, 2517–2534. [Google Scholar] [CrossRef]
- Mo, C.X.; Zhu, C.; Ruan, Y.L.; Lei, X.B.; Mo, X.X.; Yang, Y.C. An Analysis of the Spatial and Temporal Characteristics of Water Resource Stress of Guangxi and Prediction of Its Future State. China Rural. Water Hydropower 2021, 470, 99–104+110. [Google Scholar]
- Liu, J.G.; Yang, H.; Gosling, S.N.; Kummu, M.; Flörke, M.; Pfister, S.; Hanasaki, N.; Wada, Y.; Zhang, X.; Zheng, C.; et al. Water scarcity assessments in the past, present, and future. Earths Future 2017, 5, 545–559. [Google Scholar] [CrossRef]
- Ministry of Water Resources of the People’s Republic of China. China Water Resources Bulletin; China Water Power Press: Beijing, China, 2019.
- Zhang, Z.F.; Ni, H.Z.; Chen, G.F.; Lin, X.C. Analysis on changing trend of regional water resources pressure and suggestions on dealing with differentiation. Water Resour. Hydropower Eng. 2020, 51, 41–48. [Google Scholar]
- Hunan Provincial Water Resources Department. Hunan Provincial Water Resources Bulletin; Hunan Provincial Water Resources Department: Changsha, China, 2019.
- Li, L.; Zeng, X.P. Research on Overall Conception of Water Safety in Yongzhou City. Hunan Hydro Power 2021, 4, 54–56. [Google Scholar]
- Zhou, X.J.; Zou, D.S.; Wang, M. Analysis on Regional Comparative Advantage of Main Crops in Hunan Province. Res. Agric. Mod. 2009, 30, 712–715. [Google Scholar]
- Yongzhou Water Municipal Resources Bureau. Yongzhou Municipal Water Resources Bulletin; Yongzhou Water Municipal Resources Bureau: Yongzhou, China, 2019.
- Zhou, Z.J. Thinking and Exploration on the Construction of Farmland Water Conservancy in Yongzhou City. Hunan Hydro Power 2019, 4, 103–105. [Google Scholar]
- Wada, Y.; Beek, L.; Bierkens, M. Modelling global water stress of the recent past: On the relative importance of trends in water demand and climate variability. Hydrol. Earth Syst. Sci. 2011, 15, 3785–3808. [Google Scholar] [CrossRef]
- Pan, H.Y.; Fu, Y.Q. An Evaluation of the Utilization of Water Resources Based on Water Stress Indicator. China Rural. Water Hydropower 2018, 04, 53–56. [Google Scholar]
- Li, X.J.; Gao, Y.P.; Zhou, S.B. Structural characteristics and optimal path of water resource stress in Yangtze River Economic Belt under background of great conservation. J. Econ. Water Resour. 2021, 39, 16–23+42+78. [Google Scholar]
- Raskin, P.; Gleick, P.; Kirshen, P.; Pontius, G.; Strzepek, K. Comprehensive assessment of the freshwater resources of the world. In Water Futures: Assessment of Long-Range Patterns and Problems; Stockholm Sweden Stockholm Environment Institute: Stockholm, Sweden, 1997. [Google Scholar]
- Pfister, S.; Koehler, A.; Hellweg, S. Assessing the environmental impacts of freshwater consumption in LCA. Environ. Sci. Technol. 2009, 43, 4098–4104. [Google Scholar] [CrossRef] [PubMed]
- Yan, Y.A.; Wang, R.; Chen, S.; Zhang, Y.; Sun, Q.L. Three-dimensional agricultural water scarcity assessment based on water footprint: A study from a humid agricultural area in China. Sci. Total Environ. 2023, 857, 159407. [Google Scholar] [CrossRef]
- Ji, Y.H.; Chen, L.T.; Sun, R.J. Temporal and Spatial Variability of Water Supply Stress in the Haihe River Basin, Northern China. J. Am. Water Resour. Assoc. (JAWRA) 2012, 48, 999–1007. [Google Scholar] [CrossRef]
- Jia, X.X.; Yan, Y.; Zhu, C.Y.; Bai, X.; Hu, M.T.; Wu, G. Approaches for regional water resources stress assessment: A review. J. Nat. Resour. 2016, 31, 1783–1791. [Google Scholar]
- Kong, W.M.; Wei, M.; Hu, Y.K.; Liang, Q.X.; Zhang, X.M.; Luo, J.H.; Zhang, W. Current situation and future prediction of water stress in basins around the Asian Water Tower under the background of global warming. J. Glaciol. Geocryol. 2024, 46, 1–12. [Google Scholar]
- Xu, J.Y.; Bai, Y.; You, H.L.; Wang, X.W.; Ma, Z.F.; Zhang, H.W. Water quality assessment and the influence of landscape metrics at multiple scales in Poyang Lake basin. Ecol. Indic. 2022, 141, 109096. [Google Scholar] [CrossRef]
- Ma, X.Y.; Yan, F. Assessment of ecological risk of seasonal ammonia nitrogen to aquatic organisms in Poyang lake. J. Chang. River Sci. Res. Inst. 2024, 41, 66–74. [Google Scholar]
- Zhang, L.J.; Yang, T.T.; Gao, S.; Hong, Y.; Zhang, Q.; Wen, X.; Cheng, C.T. Improving Subseasonal-to-Seasonal forecasts in predicting the occurrence of extreme precipitation events over the contiguous U.S. using machine learning models. Atmos. Res. 2023, 281, 106502. [Google Scholar] [CrossRef]
- Yan, F.; Liu, L.; Li, Y.; Zhang, Y.; Chen, M.; Xing, X. A dynamic water quality index model based on functional data analysis. Ecol. Indic. 2015, 57, 249–258. [Google Scholar] [CrossRef]
- Hasanzadeh, R.; Mojaver, P.; Azdast, T.; Khalilarya, S.; Chitsaz, A.; Rosen, M.A. Decision analysis for plastic waste gasification considering energy, exergy, and environmental criteria using TOPSIS and grey relational analysis. Process Saf. Environ. Prot. 2023, 174, 414–423. [Google Scholar] [CrossRef]
- Mustafa, T. Nonlinear Problems via a Convergence Accelerated Decomposition Method of Adomian. Comput. Model. Eng. Sci. 2020, 127, 1–22. [Google Scholar]
- Wang, J.X.; Zhang, J.Y.; Li, Y.; Zhang, S.L. Variation trends of runoffs seasonal distribution of the six larger basins in China over the past 50 years. Adv. Water Sci. 2008, 5, 656–661. [Google Scholar]
- Du, J.K.; Jia, Y.W.; Li, X.X.; Niu, C.W.; Liu, H.; Qiu, Y.Q. Study on the spatial-temporal distribution pattern of precipitation in the Taihang Mountain region using TRMM data. Adv. Water Sci. 2019, 30, 1–13. [Google Scholar]
- Zhu, S.F.; Wang, W.G.; Ding, Y.M. Spatiotemporal variation of future heat damage of rice in the middle and lower reaches of the Yangtze River using CMIP6 projection. Trans. Chin. Soc. Agric. Eng. 2023, 39, 113–122. [Google Scholar]
- Hu, Z.P. Serious drought in Poyang Lake in 2022 and countermeasures for drought prevention and disaster reduction. China Flood Drought Manag. 2023, 33, 1–6+39. [Google Scholar]
- Ye, Q.; Yang, X.G.; Dai, S.W.; Chen, G.S.; Li, Y.; Zhang, C.X. Effects of climate change on suitable rice cropping areas, cropping systems and crop water requirements in southern China. Agric. Water Manag. 2015, 159, 35–44. [Google Scholar] [CrossRef]
- Wang, J.H.; Shang, Y.Z.; Wang, H.; Zhao, Y.; Yin, Y. Beijing’s Water Resources: Challenges and Solutions. J. Am. Water Resour. Assoc. 2015, 51, 614–623. [Google Scholar] [CrossRef]
- He, L.; Du, Y.; Wu, S.; Zhang, Z.L. Evaluation of the agricultural water resource carrying capacity and optimization of a planting-raising structure. Agric. Water Manag. 2021, 243, 106456. [Google Scholar] [CrossRef]
- Yang, Q.Y.; Mao, D.H.; Chang, J.; Cai, S.B. Water resources risk assessment on agriculture drought in Hunan province. J. Nat. Sci. Hunan Norm. Univ. 2008, 1, 125–129. [Google Scholar]
- Zhang, C.; Luo, B.L. Spatio-temporal Characteristics of Persistent Regional Meteorological Drought in Summer and Autumn in Hunan Province. J. Arid. Meteorol. 2021, 39, 193–202. [Google Scholar]
- Yang, B.C.; Zhang, J.Q.; Luo, W.C.; Yu, X.J.; Zhang, X.M. Comprehensive Evaluation of Water Resources Carrying Capacity in Hu’nan Province during 2009–2018 Based on TOPSIS and Coupling Coordination Development. Bull. Soil Water Conserv. 2021, 41, 357–364. [Google Scholar]
- Wu, Z.Y.; Fan, S.Q.; He, H.; Li, Y. Study on risk regionalization of agricultural drought disaster in Hunan Province. Water Resour. Prot. 2023, 39, 31–39. [Google Scholar]
- Liu, Y.; Min, R.; Du, H.; Guo, W.F. Assessing the performance of GNSS-R observations in drought monitoring: A case study in Jiangxi and Hunan, China. Geocarto Int. 2024, 39, 2333351. [Google Scholar] [CrossRef]


Disclaimer/Publisher’s Note: The statements, opinions and data contained in all publications are solely those of the individual author(s) and contributor(s) and not of MDPI and/or the editor(s). MDPI and/or the editor(s) disclaim responsibility for any injury to people or property resulting from any ideas, methods, instructions or products referred to in the content. |
© 2024 by the authors. Licensee MDPI, Basel, Switzerland. This article is an open access article distributed under the terms and conditions of the Creative Commons Attribution (CC BY) license (https://creativecommons.org/licenses/by/4.0/).