Review

Research Progress of Advanced Design Method, Numerical Simulation, and Experimental Technology of Pumps in Deep-Sea Resource Exploitation

by
Leilei Ji
1,2,
Xinrui He
1,2,*,
Wei Li
1,2,*,
Fei Tian
3,*,
Weidong Shi
4,
Ling Zhou
1,2,
Zhenbo Liu
1,2,
Yang Yang
5,
Cui Xiao
1,2 and
Ramesh Agarwal
6
1
National Research Center of Pumps, Jiangsu University, Zhenjiang 212013, China
2
Research Center of Fluid Machinery Engineering and Technology, National Research Center of Pumps, Jiangsu University, Zhenjiang 212013, China
3
School of Energy and Power Engineering, Jiangsu University, Zhenjiang 212013, China
4
College of Mechanical Engineering, Nantong University, Nantong 226019, China
5
College of Hydraulic Science and Engineering, Yangzhou University, Yangzhou 225009, China
6
Department of Mechanical Engineering & Materials Science, Washington University in St. Louis, St. Louis, MO 63130, USA
*
Authors to whom correspondence should be addressed.
Water 2024, 16(13), 1881; https://doi.org/10.3390/w16131881
Submission received: 28 April 2024 / Revised: 24 June 2024 / Accepted: 24 June 2024 / Published: 30 June 2024
(This article belongs to the Special Issue Design and Optimization of Fluid Machinery)

Abstract

:
Amid the escalating global demand for raw materials, the gradual exhaustion of terrestrial mineral resources, and the rise in extraction costs and energy consumption, the development of deep-sea mineral resources has become a focal point of international interest. The pipeline lifting mining system, distinguished by its superior mining efficiency and minimized environmental impact, now accounts for over 50% of the total energy consumption in mining operations. Serving as the “heart” of this system, the deep-sea lifting pump’s comprehensive performance (high pressure tolerance, non-clogging features, elevated lift capacity, wear resistance, corrosion resistance, and high reliability, etc.), is critical to transport efficiency, operational stability, and lifespan of the mining system. As a mixed transport pump for solid and liquid media under extreme conditions, its internal flow structure is exceedingly complex, incorporating gas–liquid–solid multiphase flow. A precise understanding of its internal flow mechanisms is essential for breaking through the design limitations of deep-sea lifting pumps and enhancing their operational stability and reliability under various working conditions and multiphase media, thereby providing technical support for advancing global marine resource development and offshore equipment upgrades. This paper comprehensively reviews the design theory, optimization methods, numerical simulations, and experimental studies of deep-sea lifting pumps. It discusses the application of various design optimization techniques in hydraulic lifting pumps, details the multiphase flow numerical algorithms commonly used in deep-sea lifting pumps along with their modified models, and summarizes some experimental methodologies in this field. Lastly, it outlines the forthcoming challenges in deep-sea lifting pump research and proposes potential directions to promote the commercial development of deep-sea mining, thereby offering theoretical and engineering support for the development of deep-sea mining slurry pumps.

1. Introduction

The expanse of the ocean, approximately 2.4 times that of terrestrial land, harbors abundant mineral resources [1]. Initially, there was sanguinity regarding the alleviation of pressure on terrestrial resource reservoirs through the extraction of oceanic minerals. In the early 1980s, a boom in Pacific manganese nodule exploitation ensued [2]. Countries and regions such as the United States, Europe, and Japan focused mainly on deep-sea polymetallic nodules, researching their own exploration and commercial mining schemes [3], while also conducting experimental mining technologies for cobalt-rich crusts and polymetallic sulfides, including in the Red Sea and near Japan. Nevertheless, due to the nebulous commercial outlook, nations curtailed their investment in deep-sea mining research [4]. By the late 1980s and early 1990s, South Korea, India, and China sequentially joined the expedition for deep-sea mineral resource development, endeavoring to explore commercial mining solutions (see Figure 1).
However, the absence of efficacious and steadfast deep-sea mining apparatuses at the time constrained the widescale implementation of these technological frameworks [6]. In recent years, countries around the world have turned to undersea geological reservoirs on near-shore continental shelves as a relatively low-risk and more accessible option to meet the widespread demand for metals and minerals [7]. Furthermore, the progressive evolution of deep-sea mining equipment has expedited global cognizance of oceanic resources, heralding the onset of the epoch of extensive deep-sea development. In the early 20th century, research on deep-sea mineral resources showed an increasing trend (as shown in Figure 2) according to academic standards in the fluid machinery industry. Presently, nations across the globe are embarking on individual and holistic sea trials, precipitating significant strides in the advancement of deep-sea mineral resource mining technology and equipment.
Currently, research into key technologies for deep-sea mining and the development of commercial mining solutions are focused on pipeline lift mining systems (see Figure 3). The system is mainly composed of the mining truck subsystem, lifting subsystem, mother ship subsystem with auxiliary support, and deep discharge subsystem. The systems use hydraulic or pneumatic lifting technology to efficiently transport seabed ore to the surface. Central to this process is the deep-sea lifting pump, a pivotal component of the hydraulic lifting system that directly influences the reliability of the entire mining apparatus. The deep-sea lifting pump is the key component of the hydraulic lifting system to achieve this process method, which directly determines the reliability of the entire mining system [8]. In 1978, Ocean Management Company (OMI) successfully mined 800t of nodules in the deep-sea area of the Eastern Pacific Equatorial Sea through a six-level deep-sea lifting pump with a bowl diffuser developed by KSB [9].
The slurry pump with a bowl diffuser exhibits structural similarities to a mixed-flow pump and demonstrates superior particle passage capabilities compared to traditional slurry pumps, making it particularly well-suited for the demands of deep-sea mining (see Figure 4). Building upon this advancement, the Korea Institute of Geological and Marine Resources (KIGAM) [11] and the China Changsha Research Institute of Mining and Metallurgy (CRIMM) [12] independently developed their own multistage mud pumps for deep-sea mining experimentation. Central South University conducted hydraulic tests on a six-level centrifugal pump for mud conveying at the State Key Laboratory of Deep-Sea Mineral Resources Exploitation (China) [13]. Current research indicates that during the operation of deep-sea lifting pumps, particle-induced wear on flowed passage parts and particle reflux leading to pump blockage are significant contributors to pump failure. Consequently, a thorough understanding of the intricate flow mechanisms is crucial for the design and performance optimization of deep-sea lifting systems.
In the early 20th century, computational fluid dynamics (CFD) emerged as a crucial development in the study of fluid mechanics. With the advancement of computer technology, CFD has evolved into a vital tool for analyzing complex fluid flow phenomena. Quantifying the internal flow of deep-sea lifting pumps through experimental means is challenging and expensive. CFD bridges this gap by establishing a connection between experimental observations and internal flow processes, providing a comprehensive explanation of various flow phenomena [15,16]. Currently, CFD technology is extensively employed in the field of deep-sea lifting pumps. In multiphase flow modeling, two primary methods are commonly used: the Euler–Euler method and the Euler–Lagrange method. The Euler–Euler method treats both liquid and solid phases as interpenetrating continua. In the context of simulating solid–liquid two-phase flow in a centrifugal slurry pump, the two-fluid model (TFM) is utilized. The accuracy of TFM simulations is validated by comparing numerical results with experimental performance characteristics of the pump [17]. In the context of deep-sea mining lifting systems, the solid phase primarily consists of fine particles from bottom deposits and crushers. The particle size of lifted ore can reach up to 20 mm, exhibiting a large span and coarse particle characteristics. Treating the solid phase as a two-fluid model, composed of quasi-fluid and liquid phases, fails to accurately represent the slurry of seafloor ore with such characteristics. The Euler–Lagrange method, on the other hand, tracks solid particles individually or in groups according to Newton’s laws of motion, considering particle–particle and particle–wall interactions. The computational fluid dynamics–discrete element method (CFD-DEM) has gained popularity for multiphase simulations due to its ability to interpret particle interactions realistically [18,19]. Chen et al. [20] employed the CFD-DEM coupling method to analyze contact forces and particle velocity characteristics of non-spherical particles with different shapes and spherical particles with varying sizes in a single-channel centrifugal pump. Deng et al. [13] utilized the CFD-DEM simulation method to study particle movement in a six-level deep-sea mining lifting system, obtaining slurry transport characteristic curves and particle transport and distribution characteristics.
Although numerical simulation can provide profound insights and useful predictions in many cases, its accuracy is not always guaranteed. Experimentation has become an indispensable component for validating the accuracy of numerical simulations. Through experimentation, the behavior of actual systems can be directly observed and measured, thereby validating and calibrating simulation results. In the early stages, experimental methods for deep-sea lift pumps primarily focused on the pump’s external characteristics, although they played a role in validating the accuracy of pump simulations, they could not reflect the internal particulate flow behavior. On-intrusive flow visualization optical techniques play a decisive role in the historical development of fluid mechanics. In recent years, advancements in technology such as cameras, lasers, and other devices have improved the accuracy and reliability of methods like high-speed imaging (HSI) and particle image velocimetry (PIV), making them more effective in visualizing complex transient flows [21]. By employing non-intrusive flow visualization optical techniques, researchers can intuitively observe and measure the internal particulate flow behavior, thereby validating and calibrating numerical simulation results. This integrated approach of utilizing numerical simulation and experimental techniques aids in enhancing the understanding of internal flow behavior in deep-sea lift pumps and provides reliable foundations for their design and optimization.
The current review on deep-sea lift pumps mainly focuses on the analysis of numerical simulation and experimental results. However, a systematic and comprehensive summary of the design optimization, numerical simulation, and experimental methods for the internal particle motion of deep-sea lift pumps has not yet been established. Further research is required in this field to construct a more complete theoretical framework and simulation methods, thereby enhancing the efficiency and reliability of deep-sea lift pump design and application. The Section 1 of this paper reviews the research background of deep-sea lift pumps. The Section 2 describes the design optimization methods for deep-sea lift pumps. The Section 3 introduces numerical simulation methods for the internal multiphase flow in deep-sea lift pumps, presenting the theoretical basis of computational fluid dynamics, analyzing various multiphase flow models, and providing a detailed overview of methods for modifying resistance. The Section 4 details various experimental measurement methods for deep-sea lift pumps. In Section 1, a thorough introduction to various experimental measurement methods for deep-sea lift pumps is provided. This part offers readers systematic knowledge on how to accurately measure and evaluate the performance of deep-sea lift pumps through an in-depth discussion of different experimental techniques and measurement strategies. In the Section 5 of this paper, a systematic summary of the research progress on deep-sea mining pumps is presented, focusing on significant achievements in this field. Additionally, Section 1 highlights the current shortcomings of deep-sea mining pump technology and discusses potential directions for improvement. Furthermore, future research trends for deep-sea mining pumps are outlined in order to guide and inspire subsequent research efforts, promoting the advancement of this field to a higher level.

2. Design and Optimization Methods

2.1. Performance of Pump

In engineering applications, the external characteristics of water pumps play a pivotal role. Pump performance is characterized by variations in head, power consumption, and efficiency relative to changes in flow rate. Ensuring stable operation across different flow rates is primarily achieved through understanding the head and flow characteristics. The operational range of water pumps guarantees system stability within specific flow rates and heads, thereby enhancing overall system reliability and efficiency [22,23].
The head of the deep-sea lifting pump is defined as follows:
H = p o u t p i n ρ g + ( z o u t z i n ) + ( ν o u t 2 ν i n 2 ) 2 g
where p is the pressure; ρ is the fluid density; z and v are the distance to the checkpoint and the flow rate, respectively.
The expression for the liquid hydraulic power (Ph) obtained from the pump per unit of time, and the input power of the pump, known as the shaft power (Ps), can be defined as follows:
P h = ρ g Q H 1000 × 3600
P s = ω T
where Q is the volume flow rate, ω is the angular velocity, and T is the torque in. The efficiency equation can be written as follows:
η = P h P s
Due to the fact that deep-sea lifting pumps are often multi-stage series pumps, it is essential to discuss the pump in stages. It is necessary to treat each domain of the pump as a control volume and quantitatively analyze the energy losses within each component of the pump. The definition of impeller efficiency is:
η I m p = ( p 2 p 1 ) Q T ω
where p1 is the total pressure at the impeller inlet and p2 is the total pressure at the impeller outlet.
Diffuser efficiency is defined as [24]:
η D i f = p 4 p i n p 3 p i n × 100 %
where p3 is the total pressure at diffuser inlet, p4 is the total pressure at diffuser outlet, and pin is the total pressure at pump inlet.

2.2. Performance of Deep Sea Lift Pump

Compared to the condition with clear water, the deep-sea lifting pump operates with a mixture of solid and liquid phases, which presents differences in density between the two phases. The presence of solid particles within the fluid increases flow instability. In the study of solid–liquid two-phase flow, it is necessary to consider the physical properties of the two phases, such as concentration, mixture density, particle settling velocity, and other factors, which can affect the performance of the pump.
The concentration of the mixture is further categorized into mass concentration and volume concentration.
C ν = ρ m ρ f ρ s ρ f
C m = ρ s ρ m C ν
where ρs is the solid density, ρf is the fluid density, and ρm is the mixture density:
ρ m = ( 1 C ν ) ρ f + C ν ρ s
The definition of particle settling velocity is the speed at which a particle falls or settles through a fluid under the influence of gravity. When the particles sink in the liquid, they begin to accelerate and then sink at a uniform speed in equilibrium with the resistance. For the settling velocity of the spherical particles in still water:
v t = 4 g d ρ s ρ f 3 ρ f C D
where CD is the particle resistance coefficient, the particle resistance coefficient will change in different flow modes, the specific value can be referred to [25,26].
In the solid–liquid two-phase flow pump, the performance of the pump is reduced due to the joint flow of solid particles and liquid. Therefore, how to quantify the head reduction factor is crucial for the design and operation of two-phase flow pumps to optimize their performance and efficiency. Based on the experimental data, the researchers proposed different correlation formulas to estimate the performance of pump transport of multiphase media (see Table 1 for specific formulas).
H R = H s / H w
where Hs is head developed by slurry at a given flow rate; Hw is head developed by water at the same flow rate. The head reduction factor (KH) is defined as:
K H = 1 H R
Fairbank et al. [27] demonstrated through experimental data that the total lift produced by a centrifugal pump is related to the concentration of foreign substances carried by the liquid being pumped. He postulated that the velocity of solid particles at the impeller outlet exceeds that of water alone and derived an expression to assess the theoretical head using Euler’s equation. In the correlation formula proposed by Cave et al. [28], the effect of granularity on head is considered and the granularity is expressed by the median mass diameter (d50). By using average particle diameters to characterize solid particles, Wesserroth et al. [29] experimentally observed that the characteristics of low specific velocity pumps vary greatly compared to medium specific velocity pumps, and attributed this phenomenon to differences in the flow friction path within the pump. Gahlot et al. [30] investigated the performance of centrifugal slurry pumps under different particle size distributions, by using existing empirical correlations to predict performance with large deviations compared to experimental data, due to improper calculations of the specific gravity of solids or the use of d50 as representative particle size. Kazim et al. [31] modified the head reduction factor correlation established by Gahlot et al. [30], taking into account the effects of particle size, size distribution, and concentration. Vocadlo et al. [32] report that the effect of solids on large slurry pumps is less than that of small slurry pumps. Engin et al. [33] took into account the effect of pump size on the head loss coefficient by incorporating impeller outlet diameter (D2) into the established correlation.
The efficiency reduction factor is defined by Kη. Gandhi et al. [34] show that the reduction in head is 2–10% greater than the reduction in efficiency. However, in practice, the efficiency reduction factor (Kη) is generally considered to be equal to the head drop factor (KH).
Table 1. Available correlations for estimation of head reduction factor of centrifugal slurry pump.
ReferencesExisting Correlation for Head Reduction Factor “KH
Fairbank [27] [ 1 ( 1 C V ) S m ] S C V ( U 2 V f 2 s C o t β 2 ) S m ( U 2 V f 2 w C o t β 2 )
Cave [28] 0.0385 ( S 1 ) ( 1 + 4 S ) C w ln ( d 50 0.0227 )
Wesserroth [29] 3.16 10 4 C V ψ W ( N S ) 2.46 ( Re p ) 1 3
Gahlot [30] 0.00056 ( S s 1 ) 0.72 C W S s + 3 S s , ln ( 50 d w n )
Kazim [31] 0.13 C W S 1 ln ( d w n 20 )
Vocadlo [32] C V ( S s 1 ) S m [ 0.167 + 6.02 d 50 ( S s 1 ) D ]
Engin [33] 0.11 C W ( S s 1 ) 0.64 ln ( 44 d w n )
Engin [35] 2.705 C W S 1 0.64 d w n / D 2 0.313

2.3. Design Method of Deep Sea Lift Pump

2.3.1. Enlarged Flow Design Method

Due to the working characteristics of the deep-sea lifting pump, its channel should have a wide enough cross-section to ensure the smooth passage of coarse particles. The specific speed ns of the pump is closely related to the geometry of the pump, and the higher the specific speed, the wider the flow channel of the pump.
n s = 3.65 n Q H 3 / 4
where n is the speed of the pump; Q is the flow rate; and H is the pump head.
In the process of transporting solid particles with deep-sea lifting pumps, particles collide with the blades, causing wear and vibration, thus making high speeds unsuitable. Kuntz et al. [36] increased the flow rate to increase the specific speed of the bowl diffuser slurry pump. This design method not only allows for the design of a wide flow channel suitable for particle passage but also effectively separates the pump’s operating point from the design point, thereby improving efficiency. Kang et al. [14] designed a new type of deep-sea lifting pump using the increased flow rate method. Compared to conventional methods, the pump designed using the enlarged flow design method shows a more uniform distribution of internal particles and improved flow characteristics. Due to the operating point being lower than the design point, the pump exhibits good boosting performance. The increased flow rate method can effectively enhance the anticlogging performance and has been widely applied in the field of design for deep-sea lifting pumps. The increased flow method is expressed as the following formula [37]:
Q d = K 1 Q d
N s = K 2 N s
where Q′d and Ns are the working flow rate and specific speed of the pump, respectively; Q′d and N′s are the flow and specific speed of the pump after using the increased flowrate method; K1 and K2 are the amplification coefficients of the flow rate and specific speed, respectively.
With the amplification of flow rate, the specific speed will also increase accordingly. However, when the specific speed exceeds a certain value, the performance of deep-sea lifting pumps may decrease instead. Therefore, it is essential to select a reasonable amplification factor for the increased flow rate design method. In the past, designers usually selected the amplification factor based on traditional empirical methods, but in practical applications, it was found that statistical data or empirical formulas were not accurate. Due to the limitations of traditional empirical methods, Yang et al. [38] proposed a method for calculating the reasonable amplification factor for the flow rate and specific speed of a centrifugal pump based on performance prediction. The method for determining the amplification factor is based on predicting the pump performance using CFD technology to obtain the optimal impeller blade outlet width and impeller outer diameter, ultimately resulting in the optimal amplification factor. In order to improve calculation accuracy and obtain the most precise amplification factor, Yang introduced a third equation into the general expression of the increased flow rate method:
H d = K 3 H d
where K1, K2, K3 can be expressed as [38]:
K 1 = b 2 b 2 K 3 5 / 8 4 / 3 K 2 = K 1 1 / 2 K 3 3 / 4 K 3 = σ u 2 2 D 2 D 2 K 1 1 / 4 K 3 5 / 8 v m 2 c o t β 2 u 2 σ u 2 2 v m 2 c o t β 2 u 2
where b2 is the impeller outlet width by the conventional method; b′2 is the impeller outlet width obtained by increasing the flow method; u2 is the exit peripheral speed; vm2 is the exit radial velocity; β2 is the impeller blade outlet angle; D2 is the outer diameter of the impeller obtained by the conventional method, and D′2 is the outer diameter of the impeller obtained by the increased flowrate method; σ is the Stodata slip coefficient, defined by:
σ = 1 π 2 s i n β 2
In the design process of deep-sea lifting pumps, if the increased flow rate method is used for design, the actual working flow rate will be lower than the design flow rate condition. In this situation, the pump inlet area is prone to cause backflow and flow separation phenomena, which will increase hydraulic losses and may lead to unstable operation of the pump at low flow rate conditions. To avoid these issues, careful selection of the pump’s design parameters should be made during the design phase to ensure its good performance within the expected operating range. Considering that the impeller and the volute are the main flow components inside the pump, the determination of their geometric parameters has a decisive impact on the overall pump performance. Therefore, during the design stage, it is necessary to accurately calculate and optimize these key parameters to ensure that the pump can maintain high efficiency and stable operation under various operating conditions. The selection of the main parameters can be seen in Table 2.

2.3.2. Inverse Design Method

In the hydraulic design of deep-sea lift pumps, inverse design methods are often employed. These methods involve deducing the design parameters and structural characteristics of the pump based on known performance requirements. The inverse design method was initially proposed by Hawthorne et al. [39] and Tan et al. [40], and Zangeneh et al. [41] expanding upon and applying it to the design of rotating machinery. Unlike traditional geometric parameter-based design methods, 3D inverse design methods have the design determined by blade loading distribution or pressure distribution. This approach can easily handle three-dimensional flow effects, allowing designers to understand the formation of secondary flows and how to eliminate undesirable ones. Researchers typically assume irrotational and steady flow when using inverse design methods. The depiction of blades involves the utilization of vorticity sheets, wherein the intensity is directly linked to the specified bound circulation or 2 π r v - θ . Additionally, from the conservation of angular momentum, the head can be expressed as:
g H = u ( 1 , s ) v ¯ θ ( 1 , s ) u ( 0 , s ) v ¯ θ ( 0 , s ) = ω r ( 1 , s ) v ¯ θ ( 1 , s )
where g denotes the acceleration due to gravity, u is rotational velocity, v - θ is the pitch-averaged component of absolute velocity, ω is the angular velocity of rotation, r is the radial coordinate and s is the spanwise non-dimensional coordinate.
r ν ¯ θ ( 0 , s ) = g H ω
where the r v - θ is defined as
r ν ¯ θ = N 2 π 0 2 π / N r ν ¯ θ d θ
where N denotes the blade number.
In this approach, the variables are known input parameters. The work by Zangeneh et al. [42] employs an algorithm to compute 3D blade shapes. Typically, under various initial conditions, non-penetrability conditions (22) are applied alongside Euler solvers based on numerical methods (such as finite difference or finite element methods) to achieve the final blade shape satisfying both non-penetrability conditions and the prescribed blade loading distribution.
W b l α = ( W + + W ) α 2 = 0
where ∇α is a vector normal to the blade surface and W bl is the relative velocity vector, here W+ and W are the velocities on the upper and lower surfaces of the blades.
In the realm of pump design, the optimization process based on geometric parameters often becomes highly time-consuming and computationally expensive due to the multitude of involved parameters and the complexity of the objective function. However, by integrating three-dimensional reverse engineering techniques with modern optimization algorithms, designers can gain a profound understanding of the fluid dynamics phenomena and their intimate connection with design variables [43]. This integration not only enhances the efficiency of the design process but also emphasizes meeting performance requirements and practical application objectives. Compared to traditional design methods, inverse design methods effectively achieve precise control over the expected performance indicators by systematically optimizing and adjusting design parameters. Therefore, this method provides a more efficient and goal-oriented solution for engineering design.

2.4. Optimization Methods

2.4.1. Parameter Modeling Optimization

In the design optimization of slurry pumps, orthogonal experimental design [44] or surrogate modeling methods [45] are commonly employed. Orthogonal experiments require designers to reflect overall characteristics through local characteristics by planning experimental schemes and analyzing results rationally. Shi et al. [46] optimized model pumps using orthogonal experiments and CFD techniques. The optimized pump head was increased by 2.81 m, and efficiency improved by 5.6%. This method is suitable for optimization tasks with limited targets and parameters and short cycles. However, its accuracy may be insufficient when facing optimization problems with multiple variables and objectives. Surrogate modeling, as an effective technique, has been widely applied in engineering design and scientific research. This method simulates the response or behavior of complex systems by establishing a simplified mathematical model. Its essence lies in training the surrogate model with limited sample data to significantly reduce the required computational resources and time consumption while ensuring a certain level of accuracy. Through this approach, surrogate models can effectively improve the efficiency of design and analysis, especially demonstrating significant advantages in dealing with computationally intensive problems. The construction of surrogate models should ensure both accuracy and computational efficiency. In the initial stage, experimental design methods such as orthogonal design, uniform design, or Latin hypercube design are employed to select a representative sample point set from the design space. The selection of sample points should accurately reflect the key physical characteristics of the system and their variation trends. Based on this, the objective function values are computed at selected sample points, i.e., the response of the real model, providing the foundation dataset for training the surrogate model. Finally, the predictive ability of the surrogate model is validated using an independent testing dataset, and the model parameters or structure are adjusted based on the validation results to optimize the predictive accuracy and generalization performance of the model. The significant findings regarding pump optimization utilizing optimization algorithms are summarized in Table 3.
As the most critical component for energy conversion in pumps, the impeller significantly influences pump performance and is the focus of optimization [53]. Kim et al. [54], Hao et al. [55], and Zhang et al. [56] optimized multiphase pump impellers, obtaining improved models with increased head and efficiency. Zhang et al. [57] proposed a multi-objective optimization method combining numerical computation, Latin hypercube design (LHS), Kriging surrogate modeling, and genetic algorithm (GA) to optimize the radial parameters of double-suction pump impellers. Hong et al. [58] optimized the slurry pump using the RSM method, achieving a 29.5% reduction in average impeller wear intensity while meeting the requirements for head and efficiency. As energy-consuming components, guide vanes should minimize energy losses to enhance pump performance. Kim et al. [59] optimized mixed-flow pump diffusers using radial basis neural network (RBNN) models and SQP optimization algorithms based on numerical simulation results. While optimizing the impeller or guide vanes individually can enhance pump efficiency to some extent, both impeller and guide vanes collectively determine pump performance, and optimizing them separately may not yield optimal results. Li et al. [23] treated the geometric parameters of the impeller and guide vanes as design variables, aiming to maximize efficiency at the design flow rate with the corresponding head as a constraint. The ASO optimization algorithm was employed, and Spearman correlation coefficient analysis was conducted to assess the correlation and sensitivity between variables and optimization objectives. As shown in Figure 5 this optimization method provides guidance for the design of centrifugal pumps with diffusers. Single-objective optimization often fails to meet the requirements for pump performance optimization under multiphase flow conditions. Researchers propose utilizing multi-objective optimization algorithms and machine learning methods to optimize various pump characteristics. Nourbakhsh et al. [60] optimized centrifugal pumps using multi-objective particle swarm optimization (MOPSO) and multi-objective genetic algorithm (NSGA-II), demonstrating the feasibility of multi-objective optimization algorithms for pump optimization. Gan et al. [61] proposed an improved multi-objective optimization method for centrifugal pumps combining particle swarm optimization with neural networks, resulting in significant efficiency improvements under three specified operating conditions and highlighting the correlation between impeller inlet conditions and pump performance in pipelines. Zhang et al. [62] combined BP neural networks with NSGA-II, increasing the pressure rise of a helical axial multiphase pump by 10% and improving efficiency by 3%. Shojaeefard et al. [63] optimized centrifugal pump inducers using neural networks and NSGA-II, achieving a 14.3% increase in pump head coefficient, a 0.3% increase in efficiency, and a 30.2% reduction in required net power. Xu et al. [64] improved jet pumps using NSGA-II and radial basis function (RBF) neural networks, resulting in a 30.46% increase in pump head and a slight improvement in efficiency. Cui et al. [65] optimized the impellers of multi-stage submersible electric pumps while maintaining constant blade total load and head to improve efficiency. By analyzing the performance and flow of 18-stage submersible electric pumps, an optimized scheme comprising front, intermediate, and rear stages was determined. Under design conditions, impeller outlet flow losses and pressure pulsations decreased, and the interaction between impellers and guide vanes weakened. This led to a reduction in unstable flow phenomena such as secondary flows and vortices, improving flow stability at the impeller outlet. Hu et al. [66] proposed a multi-objective optimization strategy based on genetic algorithm backpropagation (GABP) neural networks and non-dominated sorting genetic algorithm III (NSGA-III), enhancing the hydraulic performance of deep-sea mining pumps. Under rated solid–liquid two-phase flow conditions, the head still met design requirements, with a 15.64% decrease in shaft power and a 6.00% increase in efficiency. Kim et al. [67] designed multiphase pumps using multi-objective optimization design techniques, establishing optimization models using response surface methodology and analyzing the effects of GVF on multiphase flow performance in the optimization model. Peng et al. [68] jointly optimized the impeller and guide vanes of multiphase mixed-flow pumps. Initial response surface models were established using minimal point design experiments, followed by various adaptive refinement methods to improve the accuracy of the response surface.

2.4.2. Alternative Optimization Methods

Due to the continuous pressurization in multi-stage pumps, the total axial thrust on the impellers can reach several tens of tons, threatening the stable operation of the pump. Moreover, improper design of balancing devices can lead to bearing overload, collisions between moving and stationary parts, and pump shaft fractures [69]. Kang et al. [70] conducted a study on the axial thrust and hydraulic performance of deep-sea mining pumps. A computational fluid dynamics model of a two-stage centrifugal pump was established using the full-flow field method. The numerical simulation of the transportation process of pure liquids and solid–liquid mixtures was carried out using an actual mining pump as the research subject. The results indicated that the position of the balancing holes has a minimal impact on the hydraulic performance and thrust of the pump. Larger hole diameters can help increase the flow rate and the capacity to balance axial thrust, but they also lead to more significant flow losses and poorer hydraulic performance (see Figure 6).
The degree of wear particles on solid surfaces is not only related to the properties of the solid material but also depends on the geometric shape of the solid surface. Different surface geometries can change the form of interaction between particles and solid surfaces, thereby significantly affecting wear, such as the angle and speed of particle collisions, the distribution and dynamic changes in the collision region, and the impact of the flow field on particle movement. Nature has evolved biological structures that reduce drag and wear [71], such as the striped scale structures found on shark skin. These groove structures can change the structure and velocity distribution of the turbulent boundary layer on the skin surface during swimming [72]. Li et al. [73] combined drag-reduction technology of non-smooth surfaces with the solid–liquid two-phase flow in centrifugal pumps. Gu et al. [74], based on the theory of drag reduction by non-smooth surfaces (see Figure 7), established a pit-type non-smooth blade surface model and analyzed the impact of actual non-smooth surfaces on blade surfaces and the effect of solid volume fraction on centrifugal pump performance through numerical simulation. The study showed that blades treated with special surface treatments could effectively reduce the frictional resistance and energy loss between the fluid and the wall. With the same solid particle volume concentration, the shear stress produced by solid particles on non-smooth surfaces is generally lower than that on smooth surfaces. With the increase in flow rate, non-smooth surfaces show a better effect in reducing shear stress, which can effectively improve the head and efficiency of centrifugal pumps.

3. Numerical Simulation Methods

The two-phase flow in deep-sea lifting pumps involves multiscale interfacial coupling and multi-physical reaction processes [75]. Complex forces exist between fluid and solid particles, and understanding the internal flow distribution and particle motion patterns is crucial for addressing the performance of deep-sea lifting pumps. Over the past few decades, several numerical strategies have been developed to describe particle flows. At present, there are two main methods to simulate particle phase in liquid: Euler–Euler method and Euler–Lagrange method. In the mid-20th century, scientists endeavored to develop effective methodologies for describing and predicting the behavior of multiphase flow systems by solving the equations governing mass, momentum, and energy conservation in granular fluid systems using Euler–Euler methods [76,77]. The Euler–Euler modeling is suitable for one or two particle sizes, rather than a wide range of particle size distributions. Additionally, the model does not offer information regarding the residence time of individual reactive particles. To address this problem, scientists track the motion of material particles in the fluid through the Euler–Lagrange method, where the fluid is considered as a continuous phase in computational fluid dynamics (CFD) and solved by the Navier–Stokes equations, while particles are modeled using the Discrete Phase Model (DPM) introduced by Gidaspow and Strack [78]. The discrete element method (DEM) is a powerful numerical simulation tool for solving Newton’s second law and reproducing the flow of discrete media, making it suitable for numerical simulation of two-phase flow in slurry pumps [79].
Among many commercial and open-source computational fluid dynamics (CFD) software such as ANSYS Fluent, Siemens STAR-CCM+, Open FOAM, MFiX, Hyperworks CFD, users can obtain flow field information through them. As mentioned earlier, (DEM) modeling is performed at the scale of individual particles, while CFD solutions for fluid flow are implemented at the computational cell level. By combining CFD and DEM, the flow behavior of particles and fluids can be reasonably simulated. Since the pioneering CFD and DEM coupling research conducted by Tsuji et al. [80], CFD-DEM coupling models have become widely adopted methods for applications involving interactions between fluid and particle phases [81,82,83]. The Fluent and EDEM coupling method is widely used in CFD-DEM calculations, with the specific process outlined in Figure 8. The two software packages establish a data bridge through a data interface, exchanging simulation data at each time step. Fluent transfers the particle forces generated by the flow field to EDEM, where EDEM computes the Lagrange motion of particles and updates their position, velocity, and volume data through the data bridge. Fluent calculates particle forces on the fluid and updates the changes in the flow field for the next time step, while the DEM solver is responsible for tracking each particle in the computational domain.
The coupling of EDEM with the same company’s Hyperworks CFD software, with the coupling interface being updated with the latest versions, represents a more powerful method compared to EDEM and Fluent. Rocky DEM, as an emerging discrete element software, is gradually becoming a new trend in the CFD-DEM simulation field. Furthermore, Rocky DEM’s functionality surpasses that of EDEM, supporting various polyhedral particles, particle fracture models, and coupled CFD resistance algorithms. Additionally, open-source software such as MFiX and CFDEM possess powerful capabilities, albeit many functionalities requiring programming implementation. This section provides an overview of the basic theory of numerical simulation methods for hydraulic lifting pumps, including introductions to fluid models, discrete phase models, as well as basic theories and correction methods for resistance models involved in numerical simulations.

3.1. Control Equations of Fluids

The computational fluid dynamics (CFD) method has been widely used in simulating the internal fluid behavior of pumps and turbines [85,86]. Numerical methods play a crucial role in solving hydraulic machinery problems. However, the accuracy of numerical simulations largely depends on the turbulence model used. Therefore, selecting an appropriate turbulence model is essential for improving the reliability of simulation results [87,88]. For the computation of complex turbulence, analytical methods are unable to predict accurately. Hence, numerical simulation becomes one of the effective methods for studying turbulence, mainly divided into Direct Numerical Simulation (DNS), Large Eddy Simulation (LES), and Reynolds-Averaged Navier–Stokes Simulation (RANS). DNS directly solves the Navier-Stokes equations to capture all scales of vortex structures in the flow. This method does not rely on any turbulence model or approximation. However, it requires very fine grid resolution and computational time steps, demanding high computational resources [89,90]. Due to computational limitations, DNS can only solve simple turbulent problems with low Reynolds numbers. LES is a compromise solution between Direct Numerical Simulation (DNS) and Reynolds-Averaged Navier–Stokes (RANS) models. Large-scale eddies are directly resolved, while small-scale eddies are treated with subgrid scale models, enabling the simulation of complex flows with distinct advantages in capturing large-scale turbulent structures. However, it imposes high demands on grid accuracy and boundary conditions, making it difficult to achieve for conventional design purposes. RANS is one of the primary methods used in computational fluid dynamics (CFD) to simulate turbulent flow. In granular flow systems, turbulence distribution is complex, so researchers primarily focus on the time-averaged distribution characteristics of system flow, with RANS solving the fluid governing equations after time averaging. In dense granular flow systems, the Navier–Stokes equations for fluid volume fractions need to be considered:
α f ρ f t + ( α f ρ f u i ) x i = 0
( α f ρ f u i ) t + ( α f ρ j u i u j ) x j = α f p x i + x j ( α f τ f ) + α f ρ j g + F p f
τ f = μ f u f , i x j + u f , j x i + λ f 2 3 μ f u f , k x k δ i j
where ρ f , u, p are the density, velocity, and pressure of the fluid, respectively, F f p and F p f are the locally averaged particle–fluid interaction forces. where τ f is the viscous stress tensor, where λ f is the viscosity of the fluid, μ f is the shear viscosity of the fluid, and δ ij is the Kronecker function.
In the simulation research of some dense granular flow systems, the influence of turbulence is significant due to the presence of numerous vortex structures inside. Therefore, when employing the RANS method, often turbulence models such as the k-ε model, Reynolds stress model (RSM), etc., are chosen [91,92]. Ku et al. [93] considered the fluid volume fraction in the transport equations of the standard k-ε model.
t ( α f ρ f k ) + x j ( α f ρ j u j k ) = x j [ α f ( μ f + μ t σ k ) k x j ] + α f μ i u i x j ( u j x i + u i x j ) α f ρ f ε
t ( α f ρ f ε ) + x j ( α f ρ f u j ε ) = x j α f μ f + μ t σ ϵ ε x j + α f ε k C 1 μ t u i x j u j x i + u i x j C 2 ρ f ε
where C1, C2 is the calculator parameter, σ ε and σ k are the turbulent Prandtl number.
The Reynolds stress model (RSM) is an advanced turbulence model used to simulate turbulent flow. RSM directly solves the turbulent stress tensor rather than relying on the concept of turbulent viscosity, allowing the model to describe the complexity of turbulence more accurately. RSM is suitable for complex turbulent flows such as separation flows, strong shear flows, and vortex flows, thus providing more accurate calculations and predictions for complex flows and being more suitable for anisotropic rotating flows [94,95].
While Direct Numerical Simulation (DNS) provides a high-precision method for describing turbulence by solving the entire turbulent eddy, Large Eddy Simulation (LES) models consider the larger scales of eddies within the turbulent flow. However, due to the computational challenges and high demands on computational resources, they have not been widely used. In contrast, the Reynolds-Averaged Navier–Stokes (RANS) method balances computational resources and solution accuracy, making it suitable for solving most engineering problems. In multiphase flow simulations, both the k-ε model and RSM have been widely applied.

3.2. Euler–Euler Model

The distribution of particles inside deep-sea lifting pumps exhibits certain patterns, and hence the internal two-phase flow can be described by average macroscopic variables such as density, velocity, pressure, and temperature. In the Euler–Euler model, each phase (for example, gas, liquid, or solid particles) is treated as a continuous medium, and the Eulerian perspective is used to describe the motion and interactions of each phase. Currently, the Euler–Euler model has evolved into a mature framework, enhanced by the integration of some theoretical models [96]. Particularly, the incorporation of particle dynamics theories and drag models has enabled it to handle more complex and detailed multiphase flow issues. Therefore, the Euler–Euler method demonstrates significant operational advantages and substantial potential when studying the mixing and separation of large quantities of particles in deep-sea lifting pumps.

3.2.1. Two-Fluid Model

The Two-Fluid Model (TFM) treats the two phases (liquid and solid) as interpenetrating continua within the Euler–Euler framework, assuming each phase fills the entire computational domain. To simulate the interactions between solid particles, an additional conservation equation for solid phase kinetic energy needs to be solved. Each phase in the model has its own physical quantities such as density, velocity, temperature, and pressure, and the coupling between different phases is described by interphase interaction coefficients. The continuity equations have the form:
β n ρ n t + ( β n ρ n V n ) = 0
where n is either “s” or “f”, representing fluid and solid, respectively.
Momentum equations:
For fluid phase:
t ( β f ρ f V f ) + ( β f ρ f V f V f ) = β f p + τ ¯ ¯ f + β f ρ f g + M s , f ( V s V f )
For solid phase:
t ( β s ρ s V s ) + ( β s ρ s V s V s ) = β s p p s + τ ¯ ¯ s + β s ρ s g + M f , s ( V f V s )
where the fluid–solid exchange coefficient can be expressed as:
M s , f = 3 4 C D ( 1 β f ) β f ρ f | V s V f | ψ d s β f 2.65
where βn, ρn, τn, pn, and CD represent the volume fraction, density, stress tensor, pressure, and drag coefficient, respectively. The selection of specific parameters can refer to the work of Ostermeier et al. [97].

3.2.2. Mixture Model

The mixture model is based on the principle of full Eulerian multiphase model. It solves the two-phase mixing of the continuity and momentum equations. The model allows the two phases to move at different speeds by introducing the concept of slip velocity [17]. Mixture model can perform as well as a full multiphase model while solving a smaller number of variables than the full Eulerian multiphase model. The continuity equations have the form:
ρ m t + ( ρ m V m ) = 0
where V m  is the mass-averaged velocity as defined in User’s guide FLUENT below:
V m = p = 1 t β p ρ p V p ρ m
and ρ m is the mixture density expressed as:
ρ m = p = 1 t β p ρ p
Momentum equation for the mixture:
( ρ m V m ) t + ( ρ m V m V m ) = P + ρ m g + μ m V m + V m T + p = 1 n β k ρ k V d r , p V d r , p
where μ m is the viscosity of the mixture expressed as:
μ m = p = 1 t β p μ p
and V d r , p is the drift velocity for the secondary phase expressed as
V d r , p = V p V m
Wang et al. [98] simulated a centrifugal slurry pump at design flow rate using the Euler–Euler (EE) model and validated the predictions with experiments. The study revealed the influence of particle concentration on the performance of dilute slurry pumps, showing a decrease in head with increasing particle concentration. The predicted values exhibited a deviation of around 10% from experimental measurements. Building upon Wang’s work, Zhao et al. [99] employed a mixture multiphase model to investigate the performance of solid–liquid mixture pumps, examining the effects of particle size and flow rate on the internal flow field of the impeller. It was found that within the impeller, particles primarily flowed along the pressure surface and hub, while in the volute, particles predominantly flowed along the pressure surface and hub. As particle diameter increased, particles tended to aggregate on the pressure side of the impeller. Li et al. [100] utilized a mixture model to study the influence of flow rate and particle size on the performance of dilute slurry centrifugal pumps. They observed that the degradation in pump performance increased with increasing particle size and flow velocity, with deviations in head and efficiency predictions of approximately 7–8% from experimental data. Zhang et al. [101] analyzed pressure on both sides of the mid-plane of the impeller using a mixture model. Tarodiya et al. [17] compared two-phase flow models, the Euler–Euler model and the mixture model, with experimental data. Results showed closer agreement between the Euler–Euler model and the mixture model. Noon and Kim [102] utilized the Euler continuous phase model to analyze the erosion of lime slurry as it flows through a centrifugal pump, and its impact on head and efficiency loss. Peng et al. [103,104] predicted the solid phase volume fraction and slip velocity inside a slurry pump under different particle concentrations and flow conditions using the Euler–Euler model. As shown in Figure 9 the wear experiment verifies the results of numerical simulation. Early two-fluid models only considered interactions between particle and fluid phases. Yang et al. [105] simulated semi-open sewage pumps of different clearance sizes using the Euler–Euler method. They conducted a multifactorial analysis to study the comprehensive impact of different two-phase flow conditions and clearance sizes on the performance of sewage pumps. Under certain load conditions, particle concentration, and clearance size both significantly affect efficiency. Two-phase flow greatly enhances the non-steady flow intensity near the impeller inlet and outlet, which is the main reason for the decrease in sewage pump performance. Numerical solution methods for the models are continuously being improved to enhance computational efficiency and accuracy. Figure 10 illustrates the variation of the mean vorticity under different flow rates and particle concentrations, in accordance with academic standards. Researchers have started to introduce more complex mathematical models to describe particle collision and aggregation phenomena, as well as turbulent effects between particles and fluids [106].
One advantage of the Euler–Euler method is its suitability for fine computational grids due to the continuous treatment of the solid phase. Therefore, it is commonly used for predicting fluid dynamics [97] and heat transfer [107]. Additionally, it is computationally less demanding, making it a widely used method for industrial applications [108]. However, when modeling large-scale geometries, coarse computational grids must be used, and special attention must be paid to correctly implementing momentum exchange between the liquid and solid phases. The Euler–Euler model can analyze pump characteristics at a macroscopic level and is relatively fast in computation speed, making it applicable for automatic optimization design of two-stage pumps to improve efficiency, head, and wear characteristics under certain conditions. Nevertheless, it still lacks sufficient capability to acquire internal particle information.

3.3. Discrete Element Method

The (DEM), like the Lagrange method, determines the translational and rotational motion of each particle according to Newton’s Second Law of Motion. The force balance of particles is described as:
m d ν d t = F c + F c o h + F p f + m g
I d ω d t = T c + T f
where t is time, and m, I, v and ω represent the mass, inertia tensor, linear velocity and angular velocity of a single particle, respectively. Fc is the contact force between contacting particles, Fcoh is the cohesion force, Fpf is the interaction force between fluid and particle, Tc is the contact torque, and Tf is the torque caused by fluid.

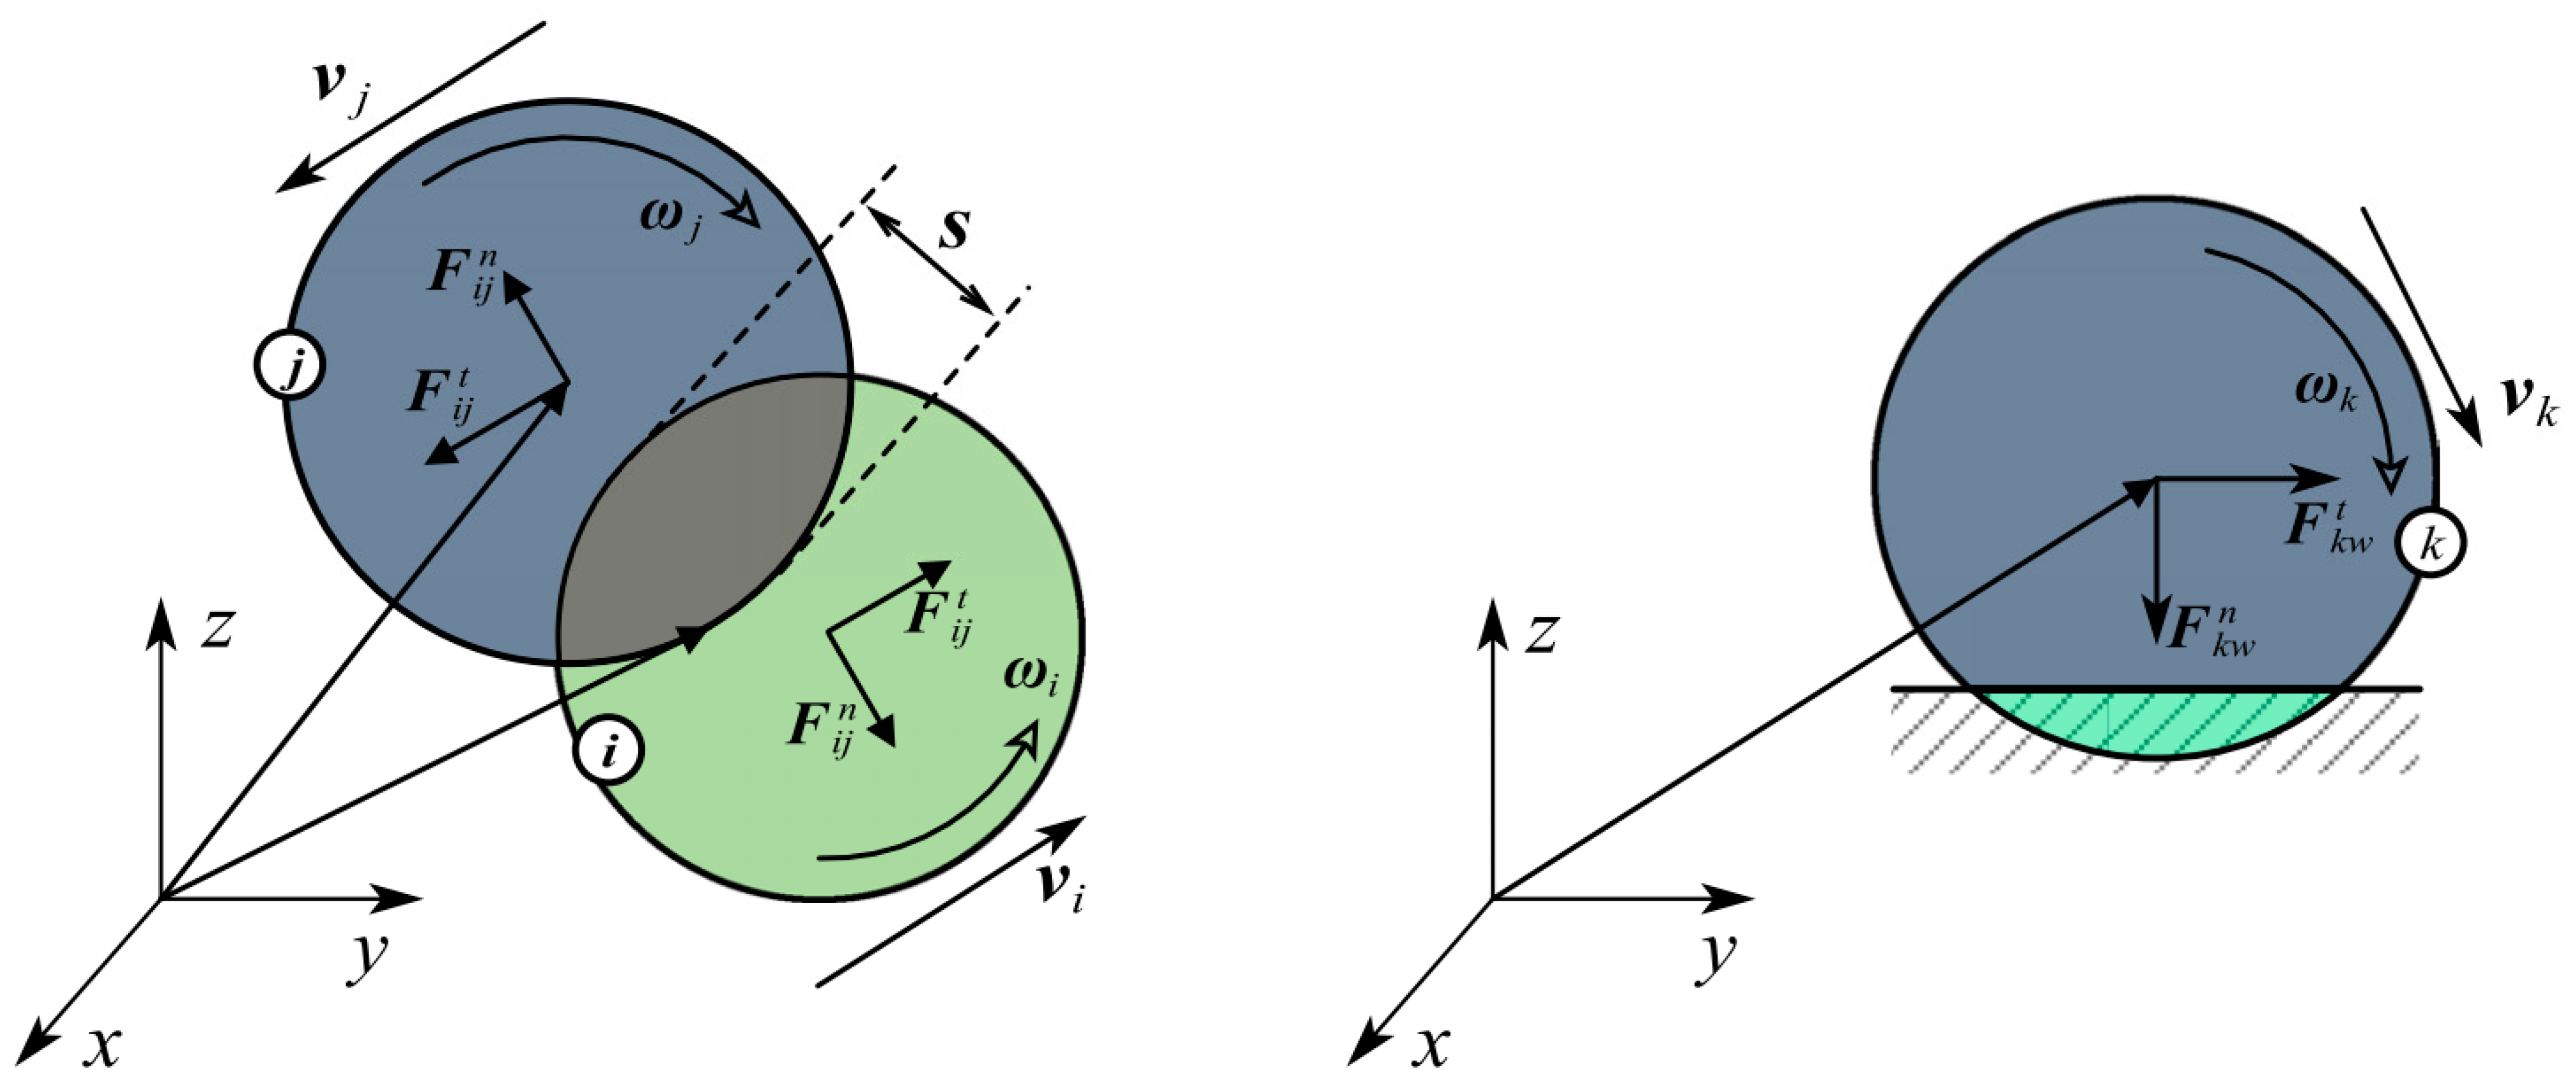
3.3.1. Soft-Sphere Models

In general, the treatment of particle collision or particle contact can be classified into two categories: the hard-sphere model and the soft-sphere model [109]. Tsuji et al. [80] first coupled DEM with multiphase flow calculations, employing both soft-sphere and hard-sphere models to compute inter-particle forces. Ye et al. [110] validated their approach in fluidized beds. While the hard-sphere model conserves some computational resources through force simplification, the soft-sphere model provides more collision information. The hard-sphere method has limited capability in handling multiple contacts and is suitable only for simulating dilute-phase flows with few particle contacts. However, due to its ability to handle multiple contacts effectively, the soft-sphere method has a wider application range, being capable of simulating both dilute and dense particle flows. Therefore, the soft-sphere method is more commonly used in DEM studies of particle discrete systems [111,112,113]. In slurry pumps, the soft-sphere model is typically chosen for contact force acquisition. Contact forces generated by particle interactions can be expressed through the viscoelasticity of particle collisions and their relationship with time. As shown in Figure 11, in the DEM model, forces between particles are calculated using a rigid spring whose direction is perpendicular to the contact surface and tangential to the contact surface. Cundall and Strack [114] first proposed the linear spring–dashpot model. The linear elastic repulsion and damping force models are widely applied in DEM due to their simple computational formulas. The hysteretic linear spring model, widely employed in numerous academic works for calculating normal contact force, does not incorporate viscous damping terms or rely on the relative velocities of colliding particles. Furthermore, it is capable of accurately determining overlap amounts that are challenging to capture [115]. Hertz introduced the Hertzian spring–dashpot model in 1882, distinguishing it from the linear spring–dashpot model by incorporating nonlinear elastic and damping components [116]. The specific formula is shown in Table 4.
The calculation of normal forces between particles is crucial for tracking particle motion behavior, but tangential forces should not be overlooked. Models used to compute tangential forces are detailed below. The linear spring Coulomb limit model represents the predominant tangential force model in use. It accounts for frictional behavior to determine the tangential force, emphasizing the significant influence of particle sliding during contact. The model’s equations are expressed as:
F i j t , T = min F i j t , T Δ T K τ Δ s τ , ϑ F i j n , T F i j t , T F i j t , T
where is the normal contact force F i j n , T at time T, ϑ is the friction coefficient, K τ is the loading normal stiffness, and Δ s τ is the tangential relative displacement per unit time step. It is worth noting that ϑ is static friction if no sliding occurs at the contact point, and ϑ is dynamic friction if sliding occurs at the contact point.

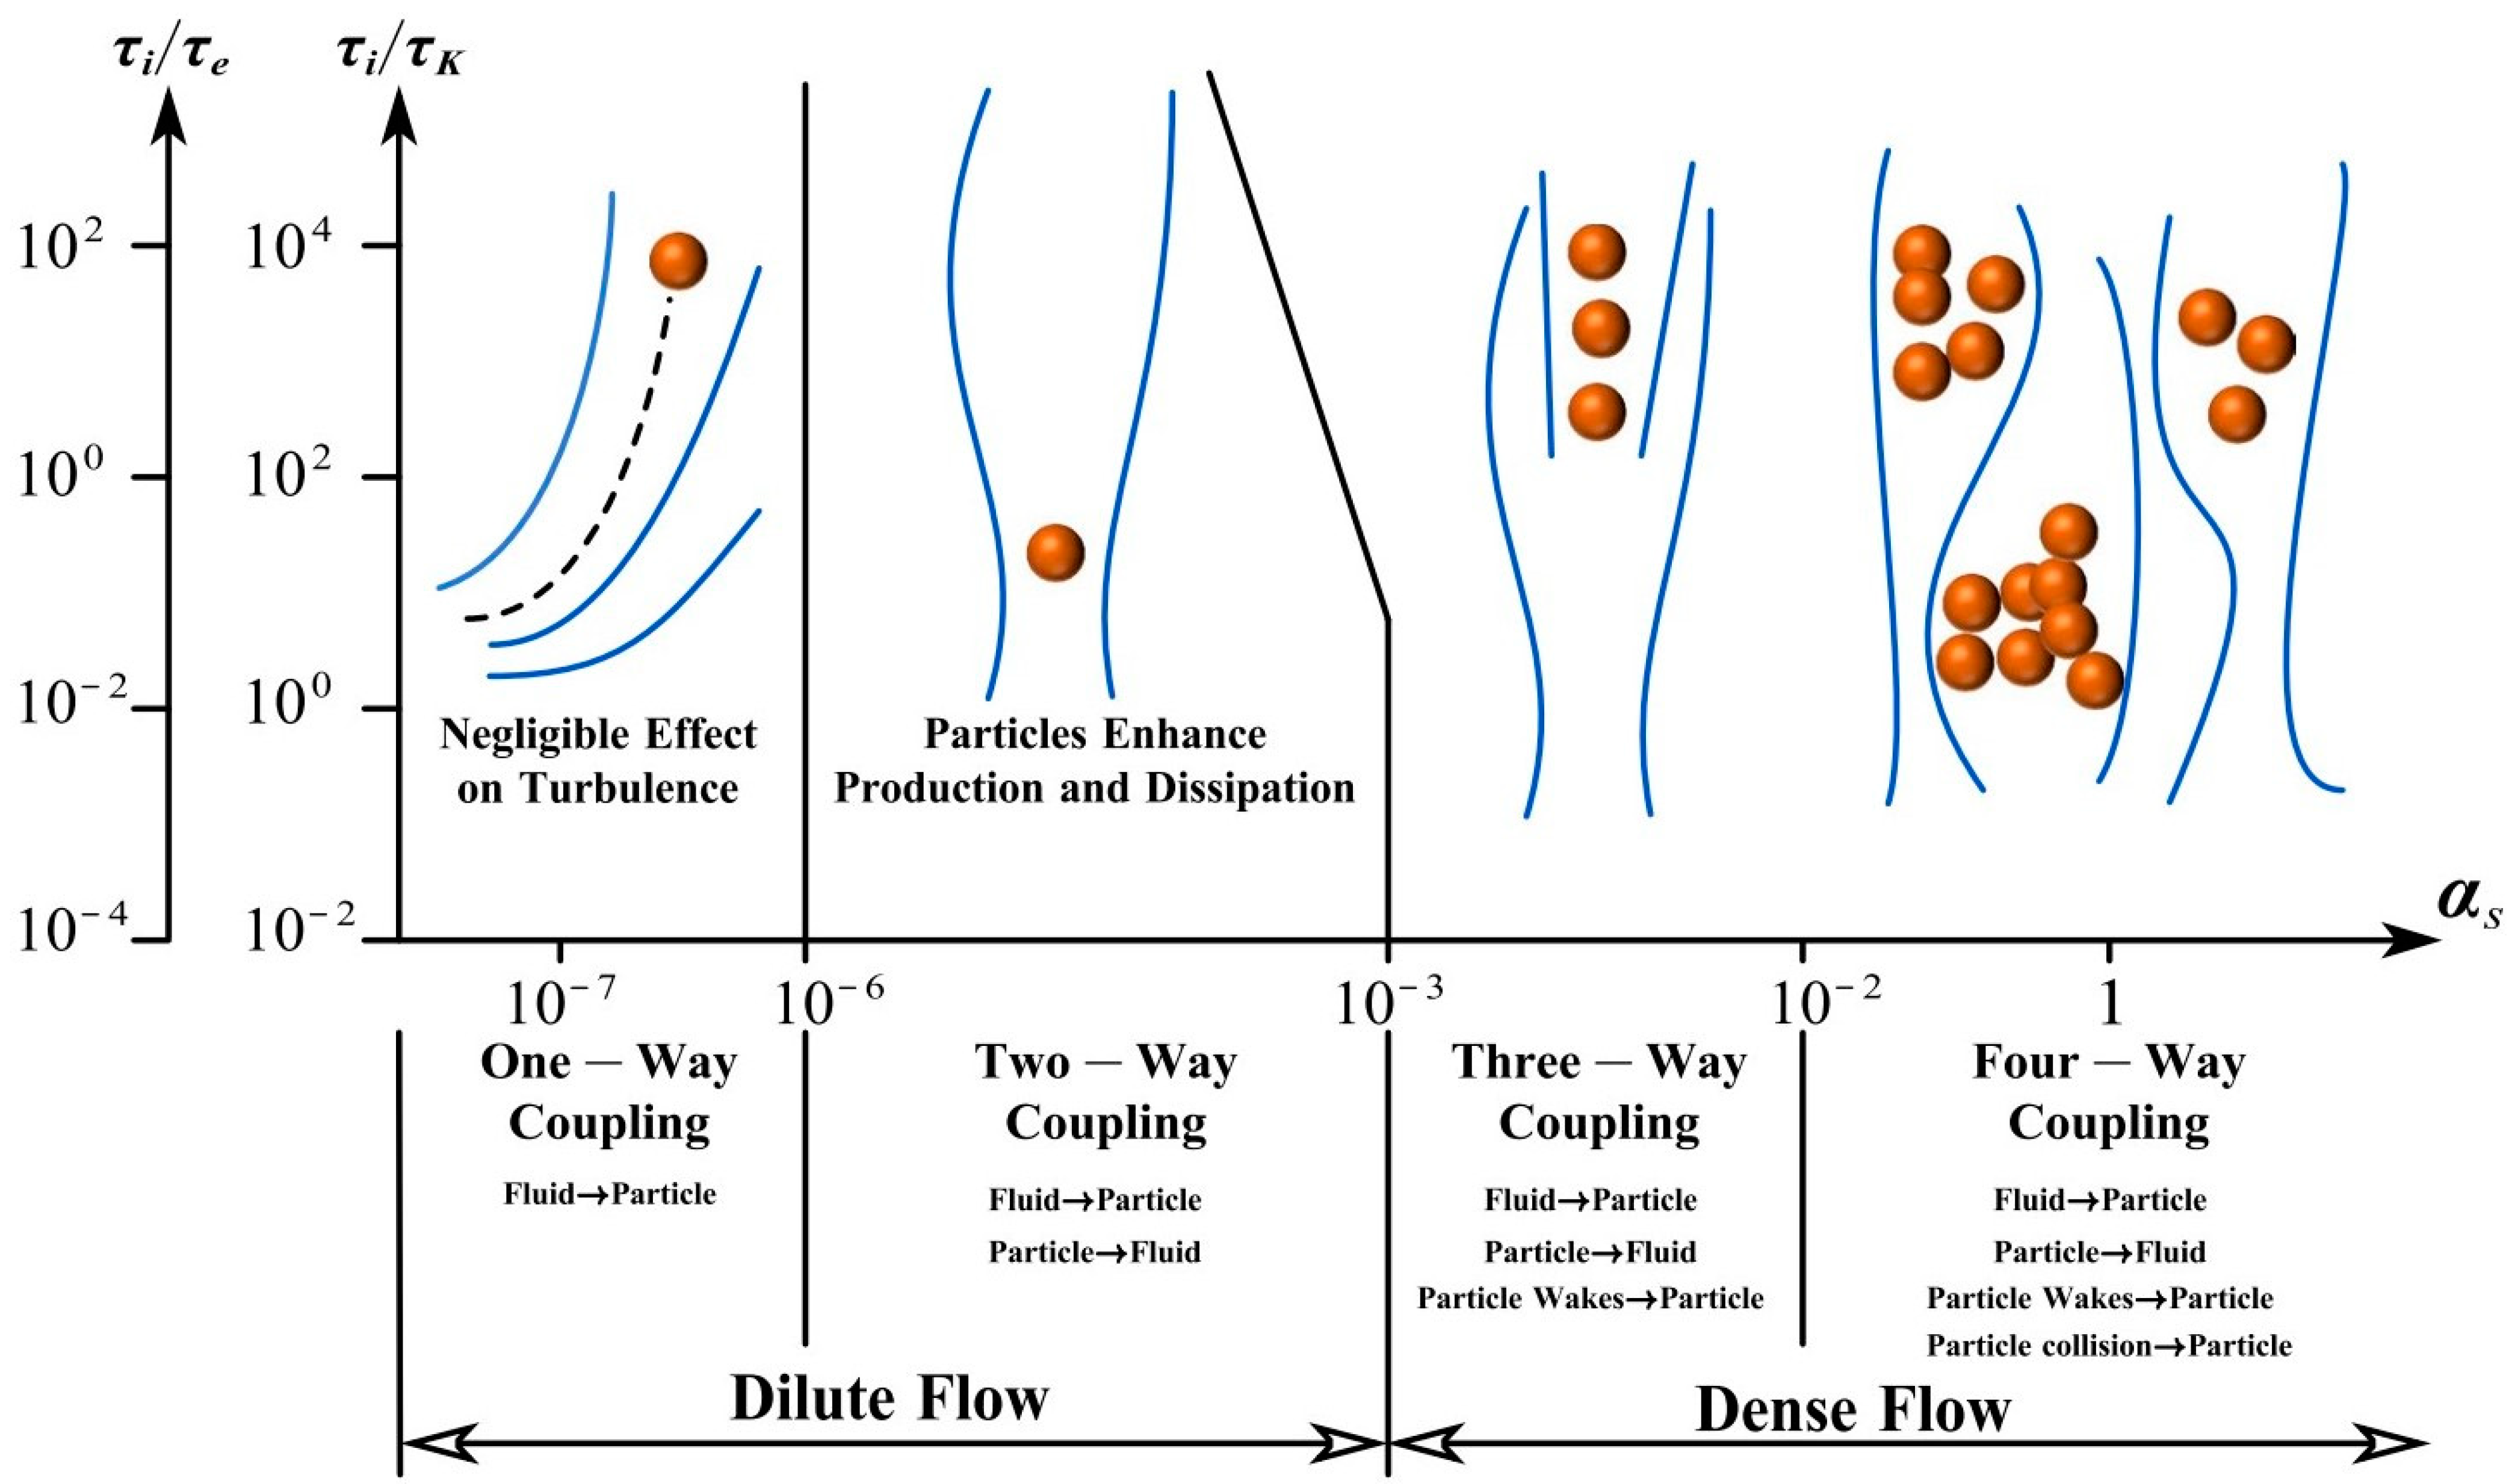
3.3.2. Particle–Fluid Interaction Forces

To accurately reproduce the behavior of particles in particle–fluid systems, the interaction forces between particles and fluids must also be considered. Specifically, the forces exerted by the fluid on the particles should be accurately calculated. Generally, the interaction forces between particles and fluids mainly include drag force, lift force, pressure gradient force, virtual mass force, Basset force, etc. To reduce the complexity of the model, only the primary forces are usually considered in simulations, while other particle–fluid interaction forces are ignored, yet still yield reasonable simulation results. For example, in gas–solid fluidized bed systems, drag force predominates [117], and since the gas superficial velocity is relatively low, lift force can reasonably be neglected. However, the internal flow of deep-sea lifting pumps is highly complex. In the simulation process, it is necessary to consider various forces acting on particles and fluids, using appropriate mechanical models to ensure more accurate numerical simulation results.
The forces acting on a single particle mainly include surface forces and physical forces. Gravity and buoyancy are the main volume forces to be considered in a multiphase flow containing particles. The surface force of the fluid on the particles can be divided into four types, namely, the drag force caused by the relative slip speed, the additional mass force caused by the acceleration and deceleration of the particles, the additional gradient force caused by the presence of pressure gradient or temperature gradient in the flow field, and the additional lift caused by the rotation of the particles.
The gravity forces arise from the mass of an object and the gravitational pull of Earth.
F g r a = m p g
The buoyancy force experienced by the particles in the fluid is related to the volume and density of the expelled fluid, in the direction opposite to gravity.
F b o u = π 6 ρ f d p 3 g
Drag force is the result of fluid acting on particles, caused by the difference in velocities between the phases and applied in the direction of relative velocity between the fluid and particles. Drag force primarily acts on the surface of particles; however, in DEM simulations, it is commonly assumed that drag force is effective at the center of the particles [118]. The drag force FD for a single particle can be calculated by the following equation [119]:
F D = ( 1 2 ρ l ) ( π 4 d 2 ) C D ( w g w l ) | w g w l |
where ρ l is the density of the fluid, d is the diameter of the projected area of the particles in the flow field, wi is the relative velocity of the fluid and the particle, CD is the drag coefficient of the particles, and CD is determined by Re.
(1)
Schiller Naumann model [26]
This model is applicable to sparse solid particles and is derived from the high Reynolds number drag model formulated by Oseen in 1913. It corrects the deviation of drag force from experiments when predicting high Reynolds number flows. For flows with Reynolds numbers less than 800, the drag force coefficient can be expressed as:
C D = 24 Re ( 1 + 0.15 Re 0.687 )
When the Reynolds number approaches 1000, its drag coefficient is consistent with the drag coefficient of a smooth sphere, which is 0.44. Therefore, its expression for different Reynolds numbers is
C D = 24 Re ( 1 + 0.15 Re 0.687 ) , Re 1000 0.44 , Re > 1000
(2)
Wen–Yu model [25]
This model, which is generally used when the solid phase volume concentration is less than 20%, was created by Wen and Yu in 1966, and the expression is as follows:
C D = 24 α fRe ( 1 + 0.15 ( α fRe ) 0.687 )
where αf is the volume fraction of the liquid phase.
(3)
Gidaspow model [120]
This model is widely used in industrial and hydraulic projects such as fluidized beds, and the expression is as follows:
C D = 24 α t Re ( 1 + 0.15 ( α t Re ) 0.667 ) α s < 0.2 C α β ( d ) = 150 ( 1 α f ) 2 μ f γ r d s 2 + 7 4 ( 1 α f ) ρ f | U f U d | d s α s > 0.2
The model is a combination of the Wen–Yu model and the Ergun model. When the solid phase volume concentration (αs) is lower than 20%, the Wen–Yu model is adopted. When the solid phase volume concentration (αs) is greater than 20%, the Ergun model is used.
(4)
Syamlal O’Brien model [121]
This model is derived based on the experimental measurement results of particle velocity in the settling bed. It was created by Syamlal and O’Brien in 1987. It uses a simplified form to express the relationship between particle settlement and void fraction.
C D = 0.63 + 4.8 Re s / ν r , s 2 Re s α g 24 ν r , s 2
where v r , s is the final velocity correlation of the solid phase; Res represents the Reynolds number of solid particles.
For non-spherical particles, accurate prediction of drag becomes more complex as particle shape and orientation can significantly influence the flow field. Therefore, besides the general drag expression mentioned above, researchers have also developed various drag coefficient correlations specifically tailored for particles with fixed shapes [122,123,124]. Additionally, some researchers have further introduced machine learning to more accurately correlate the shape, and orientation of non-spherical particles, and flow conditions with interaction forces [125,126]. If it is necessary to consider the influence of non-spherical particles, the effect of non-spherical particles can be further introduced. Table 5 summarizes the general correlation of the resistance coefficient CD of non-spherical particles.
Virtual mass forces occur when a particle accelerates or decelerates within an ideal, incompressible fluid. This motion induces fluid movement around the particle, causing the surrounding fluid to reach the particle’s velocity. This synchronization results in an apparent increase in the particle’s effective mass, thus generating virtual mass forces.
F V e r = C V e r ρ f ρ p m p a r
where ar is the relative acceleration and CVer is the correction factor.
The Basset force, also known as the history force, accounts for the viscosity effect of fluid on a particle’s surface by considering the time delay in boundary layer development.
F b a s = 3 2 d p 2 ρ f μ f π 0 t d u f v p / d τ t τ d τ
The lift force mainly includes the Saffman force due to the fluid velocity gradient over a particle and the Magnus force caused by the rotational motion of particles.
F L = 0.5 C L ρ f π 4 d p 2 | u ν | 2 e ^ L
where CL is the lift coefficient (see Table 6); e ^ l is the direction of lift force.

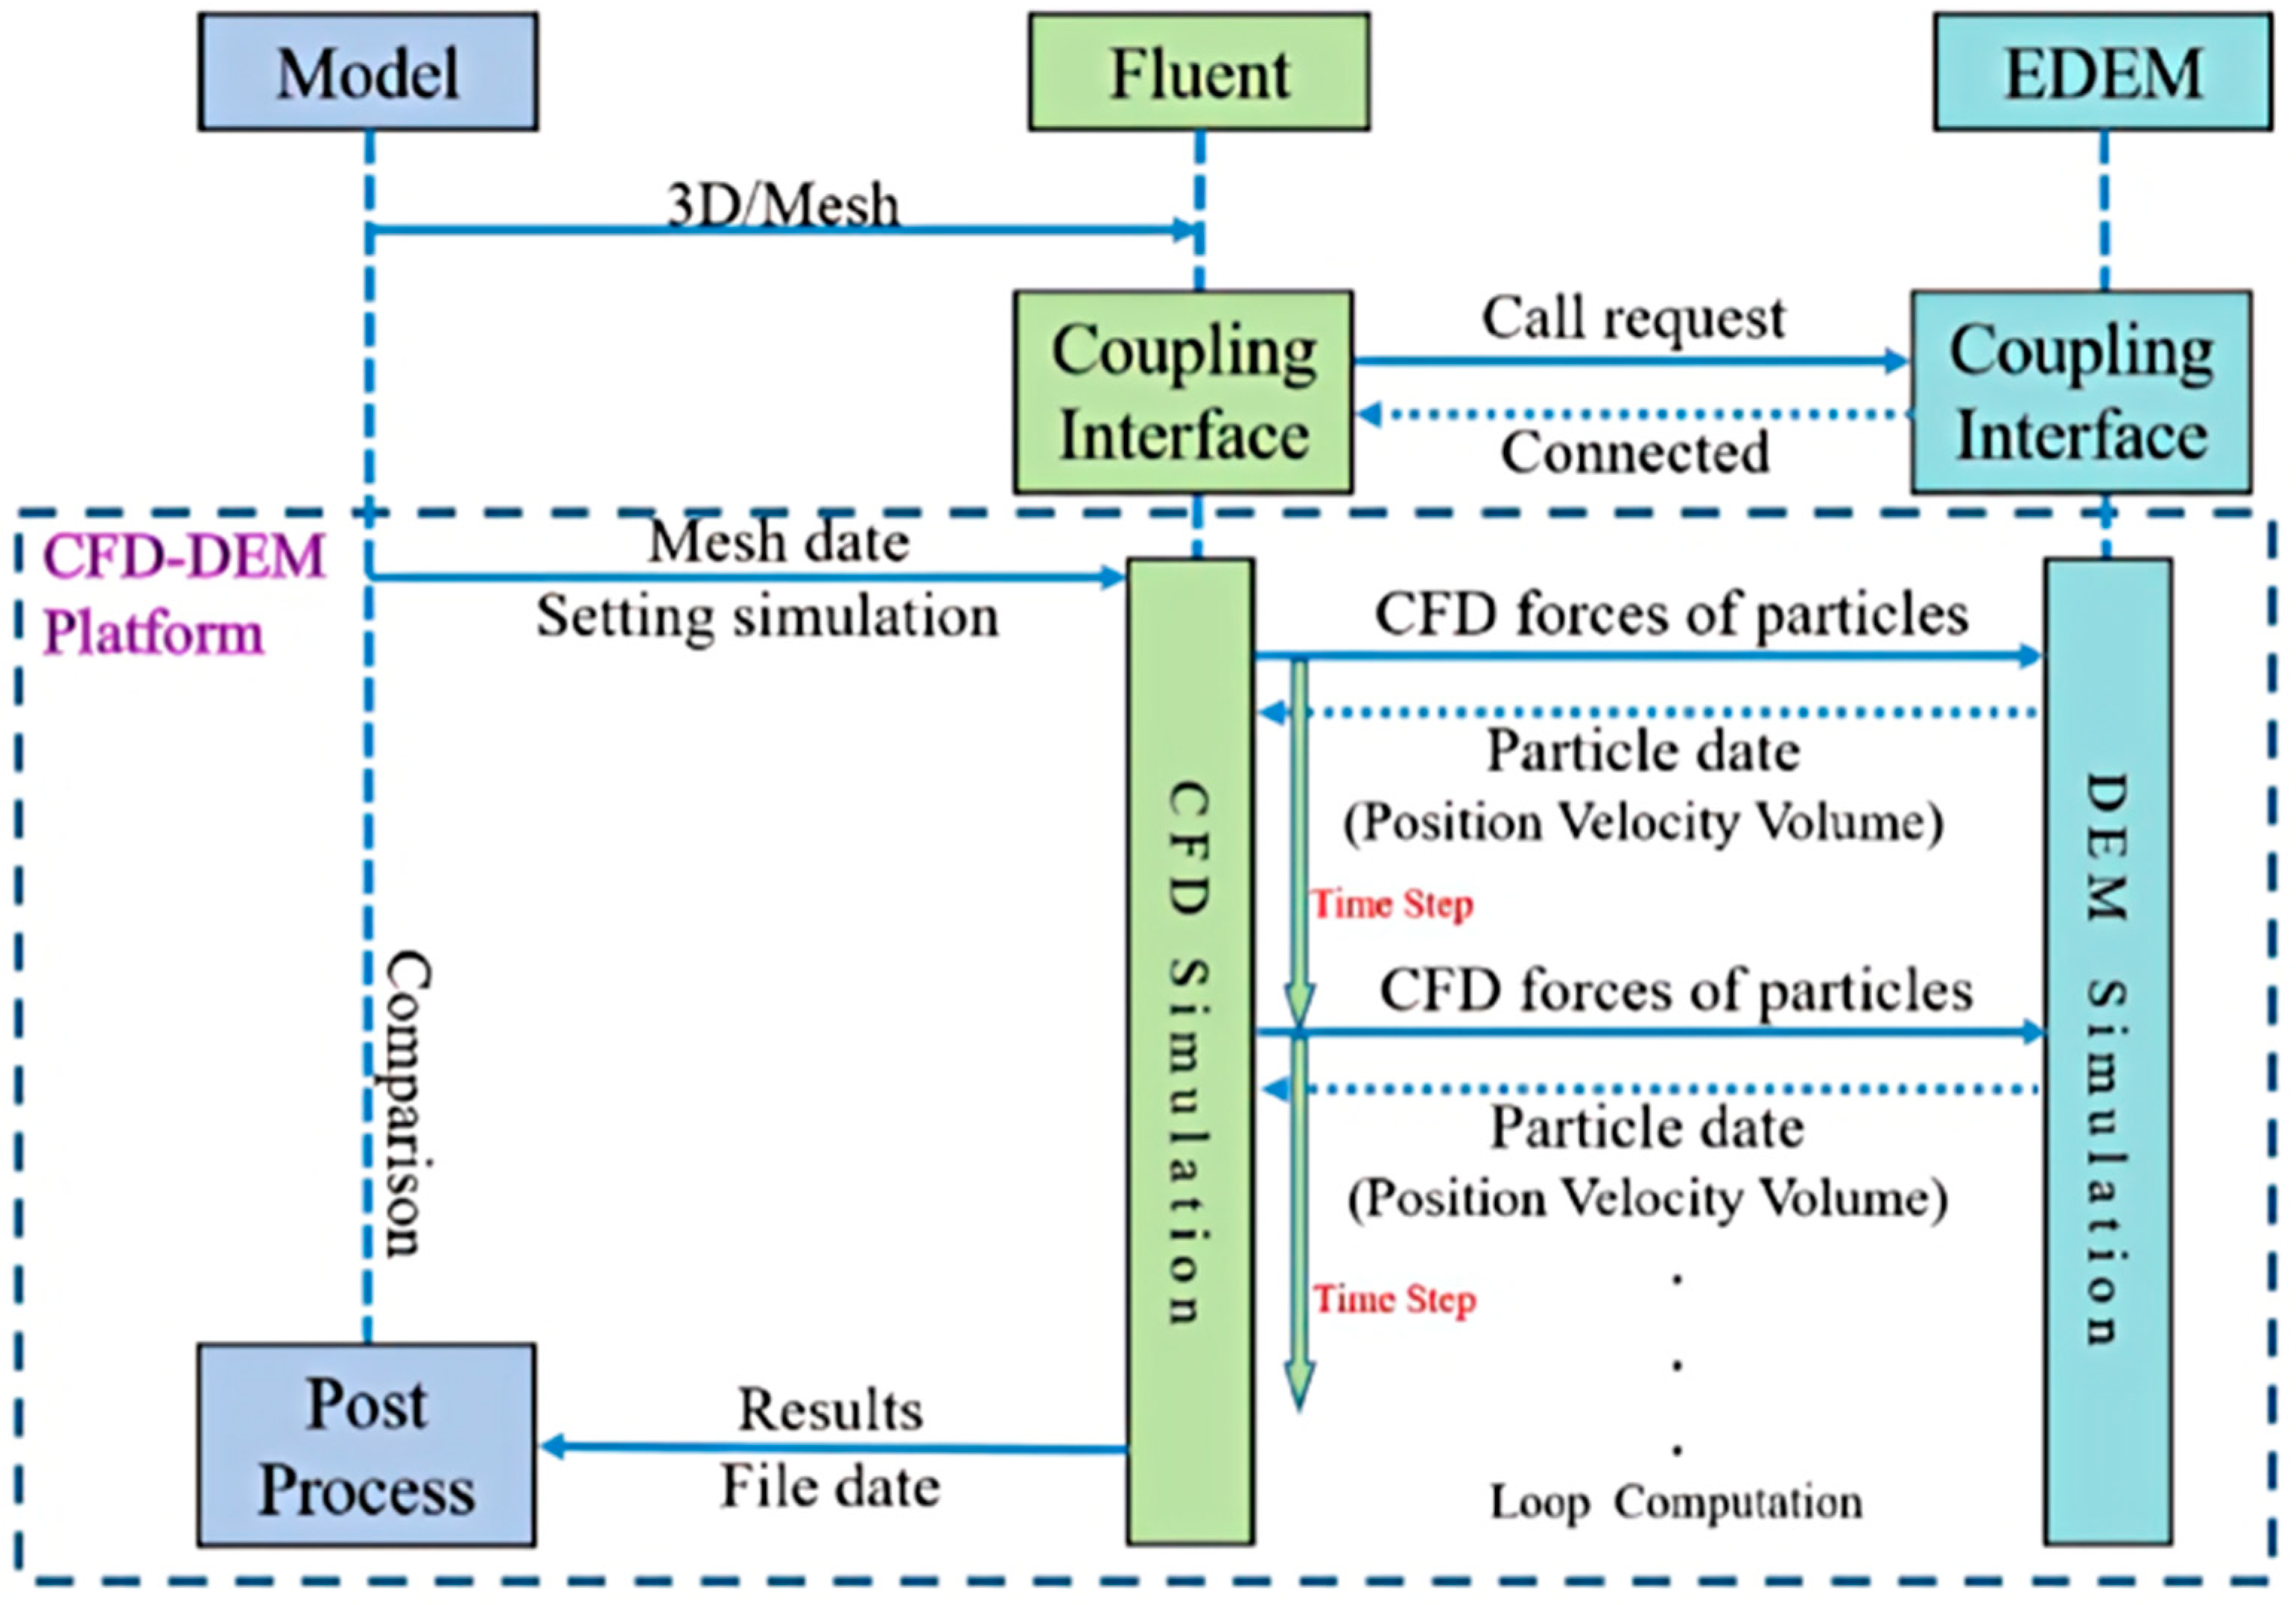
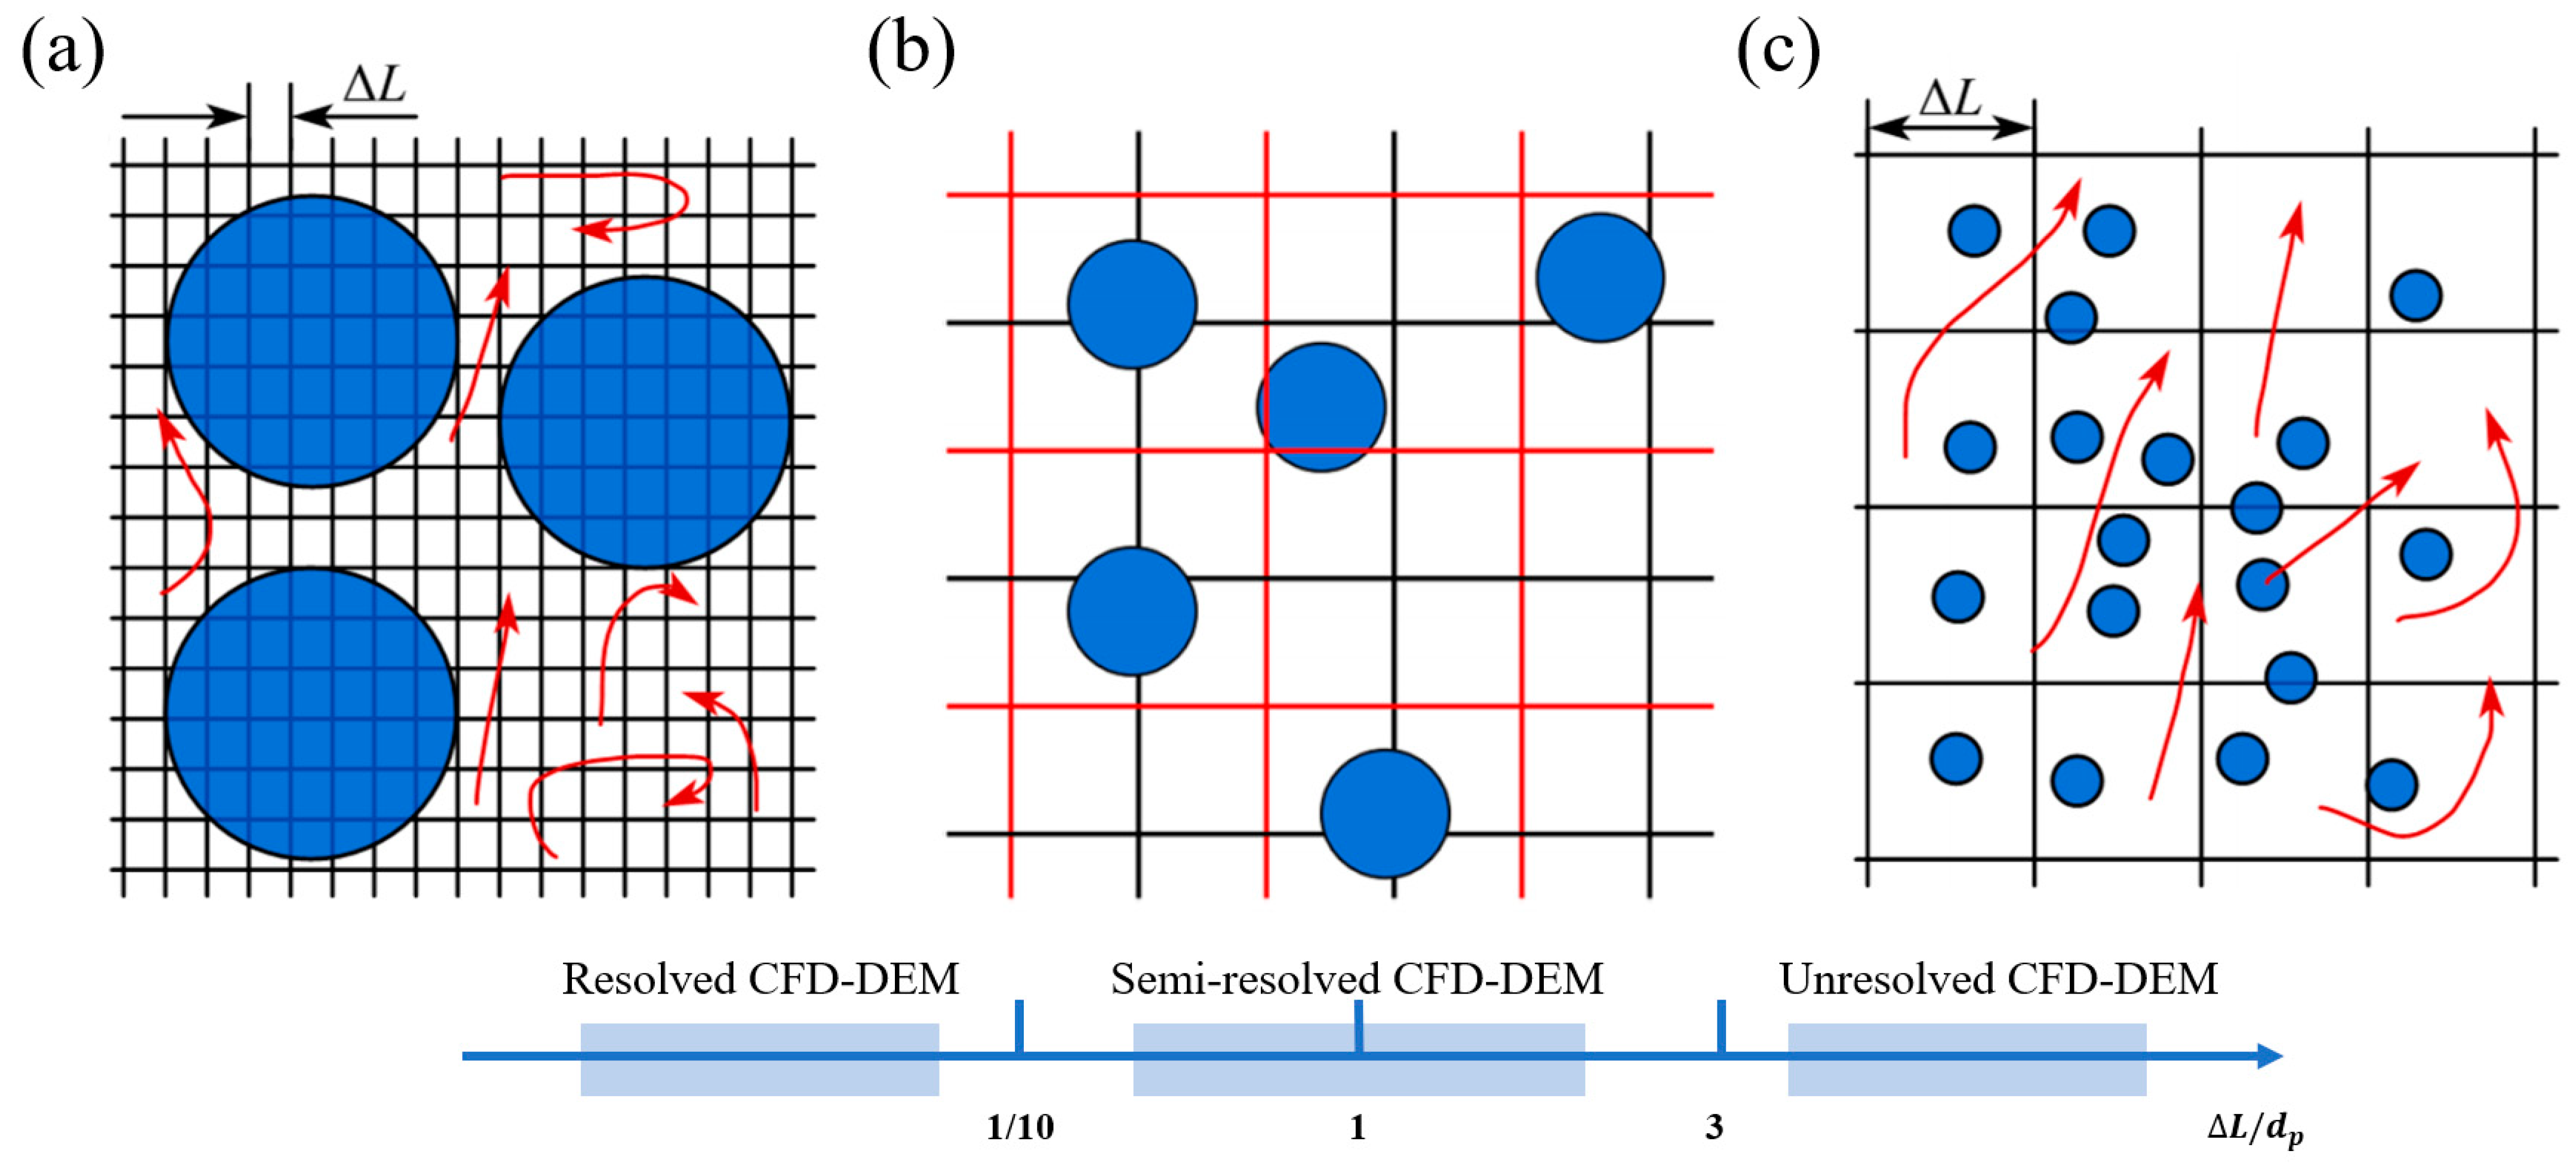
3.3.3. Coupling Scheme between CFD and DEM

In addition to traditional CFD methods, some emerging CFD techniques (such as LBM [135] and SPH [136]) can also be coupled with DEM methods. The Lattice Boltzmann Method (LBM) is a computational fluid dynamics (CFD) numerical simulation technique based on a microscopic particle model. Originating in the 1980s with contributions from Frisch, Hasslacher, Pomeau, and others, this method implicitly solves the Navier–Stokes equations by solving linear kinetic gas theory equations, greatly simplifying the modeling process. The inherent discreteness of LBM provides natural advantages for coupling with DEM. Smoothed Particle Hydrodynamics (SPH) is an adaptive mesh-free particle method, and due to its Lagrange nature, SPH differs significantly from traditional CFD methods in the Eulerian coordinate system. SPH simulates the behavior of fluid or solid media by discretizing them into a series of particles, similar to LBM, without the need to solve complex Navier–Stokes equations. Within the SPH framework, each particle carries relevant physical quantities, exhibiting highly consistent numerical algorithms and data structures with the practicality of DEM.
Although numerical solutions for fluid flow can be achieved through various solvers, the differences between various particle–fluid coupling models mainly lie in the specific programming implementations of the numerical models. In other words, whether it is CFD-DEM, LBM-DEM, SPH-DEM, or other types of particle–fluid coupling models, they generally adhere to similar fundamental principles in the coupling strategies between the fluid solver and DEM. Figure 12 presents the general process of the CFD-DEM numerical simulation algorithm.
Based on the ratio of different CFD cell sizes ΔL to particle diameters dp (hereinafter referred to as size ratio), three coupling strategies of CFD and DEM are proposed, as shown in Figure 13.
For undistinguished CFD-DEM models, a size ratio greater than 3 is recommended. For distinguished CFD-DEM models, the size ratio should be at most 1/10 of the particle diameter. Additionally, for semi-distinguished CFD-DEM, the size ratio ranges from 1/10 to 3. Unresolved CFD-DEM models are also referred to as particle–grid methods, based on the characteristic that a single CFD cell typically contains many solid particles [137]. This method solves fluid flow by introducing porosity and utilizing the Navier–Stokes equations for particle–fluid multiphase coupling based on the concept of local averaging. Unresolved CFD-DEM models do not resolve particle boundaries, thus offering superior computational convenience when simulating particle–fluid systems. It is for these reasons that the majority of models currently used in CFD-DEM research are unresolved CFD-DEM models, especially for particle–fluid systems containing a large number of particles.
When the grid size is comparable to or slightly smaller than the particle size, the porosity cannot be accurately described. Semi-resolved CFD-DEM models provide several methods for calculating cell porosity and background velocity, such as the two-grid method [138], kernel-based method [139], and diffusion-based method [140].
Compared to undistinguished and semi-distinguished CFD-DEM models using empirical interaction force models, in distinguished CFD-DEM models, the particle–fluid interaction forces are typically determined by precise particle–fluid interaction processes along the particle boundary surface. As the CFD cell size is much smaller than the particle size in resolved models, fluid flow can be fully resolved over the entire boundary surface of the particle, allowing for effortless determination of detailed flow fields around the particles. Analytical CFD-DEM methods should theoretically be considered the most accurate approach and may be the only theoretical tool capable of studying nonlinear complex phenomena in particle–fluid systems.
According to the interaction forces that can occur between particles and fluids, there are four different coupling strategies for CFD-DEM, as shown in Figure 14 [141]. For very low particle volume fractions (μs ≤ 10−6), where the influence of particles on fluid motion can be neglected, a one-way coupling strategy is used, solving particle equations independently of fluid equations. When the particle volume fraction is within the range 10−6μs ≤ 10−3, particle motion affects fluid turbulence, and numerical simulations should employ two-way coupling. The three-way coupling strategy considers particle wakes and vortices generated by particles affecting subsequent particle disturbances, building upon the two-way coupling. When the particle volume fraction is within the range of 10−3μs ≤ 1, collisions between particles affect the overall system motion, and a four-way coupling strategy should be employed.

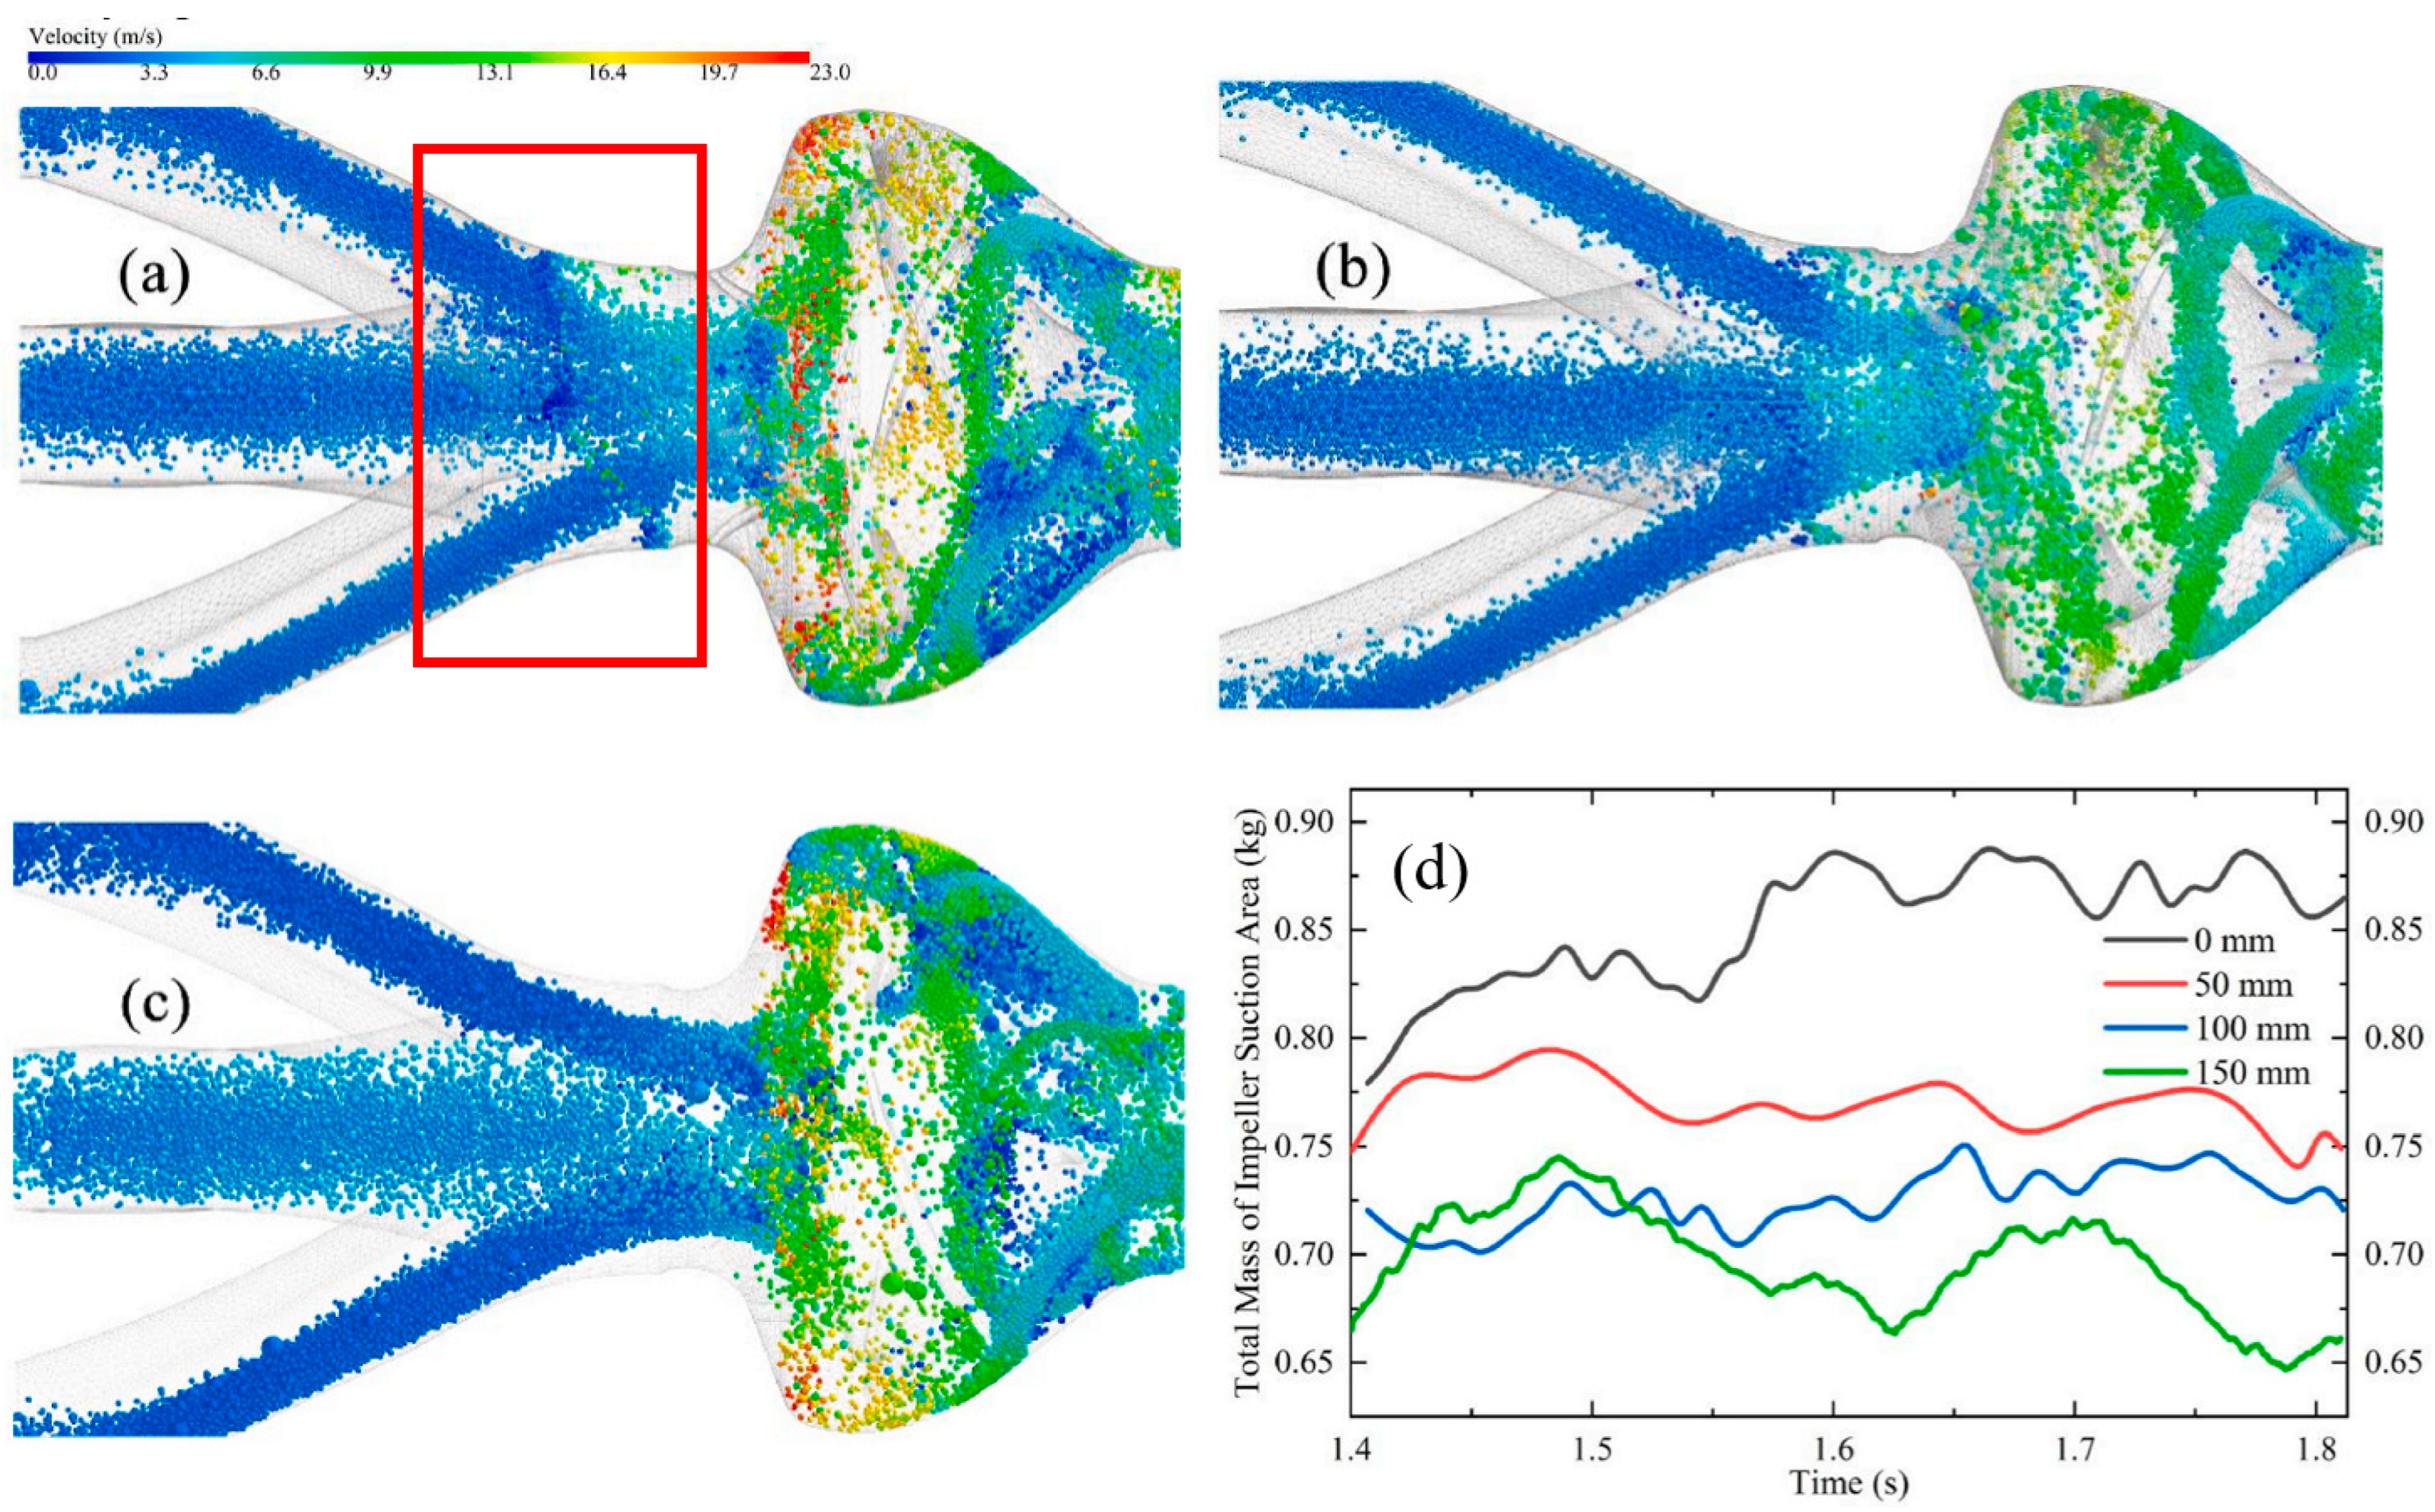
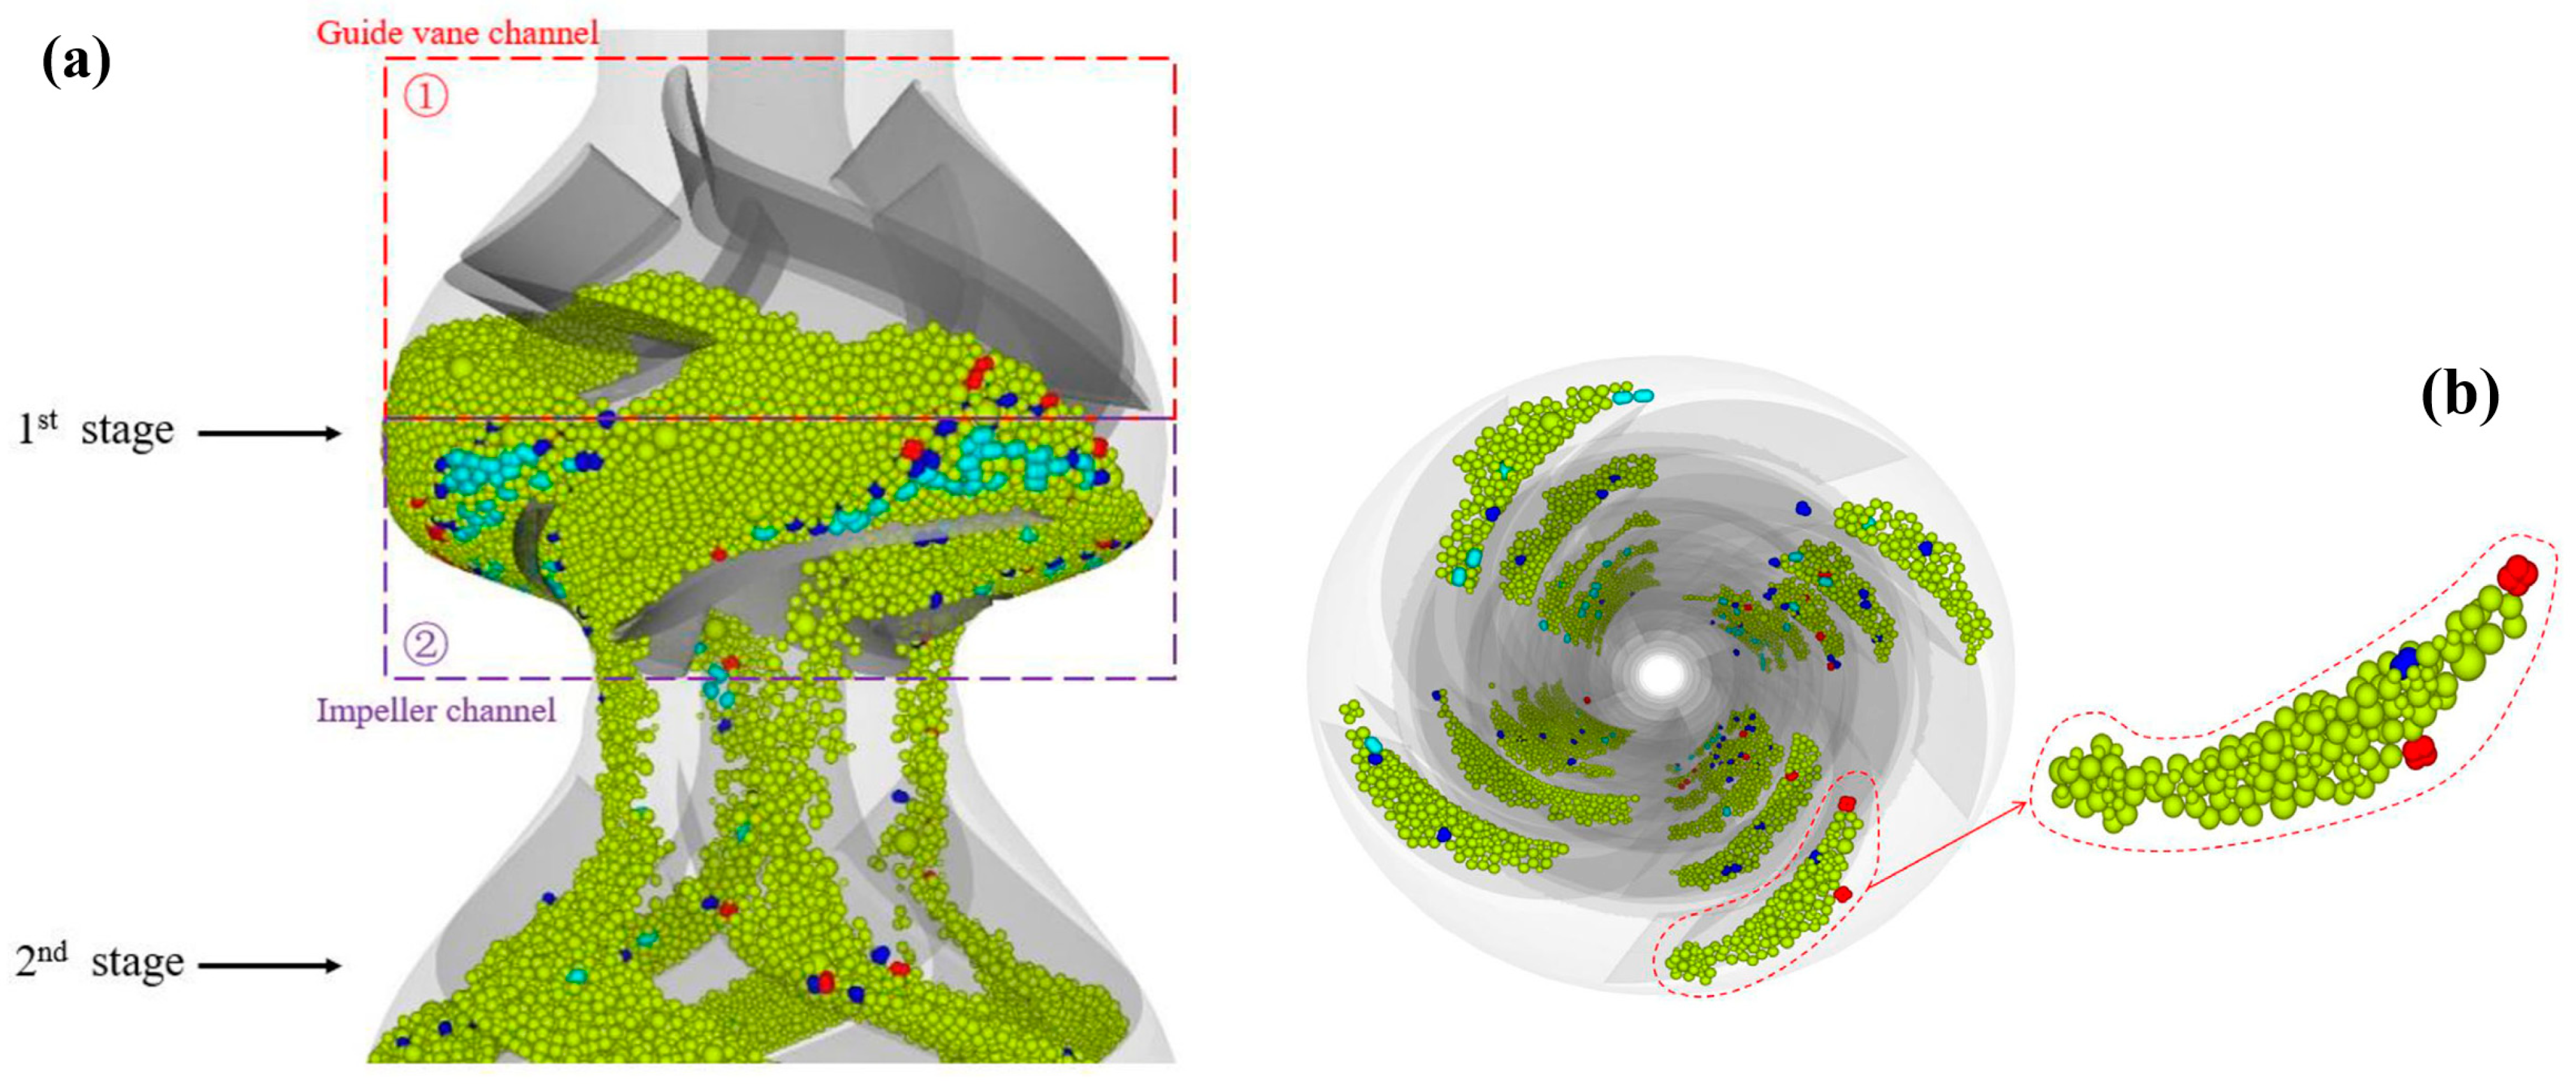
3.3.4. Applications of CFD–DEM in Deep-Sea Lift Pump

Numerical simulation methods are widely employed in the study of solid–liquid two-phase pump transportation, elucidating complex fluid and particle dynamics issues within the transportation system. Chen et al. [142] conducted coarse particle collection simulations for deep-sea mining hydraulic collectors, revealing flow and motion information including forces, displacements, velocities, angular velocities, streamlines, and wake structures. Wang et al. [143] performed CFD-DEM simulations of unsteady solid–liquid flow in a single-stage pump, analyzing the spatial distribution and motion characteristics of 5–15 mm particles with a volume concentration of 5%. It was found that particle size significantly affects the vortex intensity within the pump, with lift error and efficiency error of the CFD-DEM method being less than 1% and 5%, respectively. Li et al. [144] analyzed internal flow fields and particle motion patterns of a two-stage deep-sea lift pump at different speeds using the discrete element method coupled with computational fluid dynamics. Additionally, physical phenomena such as flow velocity, secondary flow, and particle flow were studied. Shao et al. [145] conducted CFD-DEM simulations of erosion within a mixed-flow pump impeller, revealing that erosion primarily occurs at the hub and shroud of the impeller, with particle concentration greatly influencing erosion. Cheng et al. [146] studied the impact of solid-phase characteristics on the internal flow characteristics of pumps, particularly elucidating the wear mechanism of solid particles on pump walls. The study employed a Fluent and EDEM coupled method to investigate solid–liquid two-phase flow within pumps, using the Euler–Lagrange model for numerical simulation. Results indicated that under high-flow conditions, particles tend to agglomerate within the passage, forming longer wear bands at the pressure-side blade trailing edge, while little wear was observed on the suction-side blade. Su et al. [147] applied CFD-DEM to simulate particle migration in a two-stage slurry transport pump, revealing the significant impact of collisions on particle departure velocities within the impeller, and summarizing particle motion patterns within the impeller and diffuser. Deng et al. [13] utilized CFD-DEM simulation methods to obtain slurry transport characteristic curves, particle transport, and distribution characteristics, validating the simulation method with experimental data. The study revealed that particles are transported in a pulsatile manner within the pump, with the characteristics of particles transported in the latter stage resembling those in the preceding pump stage (see Figure 15).
Hu et al. [148] simulated reflux slurry using the CFD-DEM method, analyzing the relationship between particle characteristics and blockage, demonstrating that considering particle volume and adhesion in CFD-DEM simulations of coarse particle flow results in higher accuracy. Deng et al. [13] conducted CFD-DEM simulations of a six-stage mining pump, discovering severe particle accumulation near the impeller inlet. Subsequent work by Deng [84] addressed impeller inlet particle accumulation issues by introducing a baffle plate and obtaining optimal baffle plate length through simulation. The local particle distribution at the impeller inlet with varying lengths is depicted in Figure 16, and the total particle mass within the red box area is quantified to assess the anti-accumulation effect of different diverter plates at the suction mouth. Hu et al. [149] employed CFD-DEM coupling simulations to study particle reflux motion in a six-stage pump during an emergency power failure, utilizing the JKR contact model for particle simulation and introducing irregular particles to realistically simulate reflux characteristics under deep-sea mining conditions. Figure 17 shows the behavior and distribution of the mixed particles.
Li et al. [150] performed CFD-DEM coupled simulations of external vibrations induced by ocean currents and waves in operational environments. The study indicated that in the suction chamber, as vibration frequency increases, the dynamic count of particles decreases, while the percentage of particles with velocities exceeding fluid velocity increases (see Figure 18). In the impeller passage, as vibration frequency increases, the number of collisions between particles and the impeller pressure surface decreases, leading to an increase in average energy loss per collision. Thus, external vibrations provide additional kinetic energy to particles, reducing sedimentation effects and enhancing particle passage.

3.4. Discrete Phase Model (DPM)

Similar to DEM, the standard Lagrange DPM is based on translational force balance formulated for individual particles. In standard DPM, each particle represents a particle parcel. Like DEM particles, DPM parcels are influenced by gravity, drag, pressure, Magnus force, virtual mass force, and Saffman force. The key difference from DEM is that particle–particle collisions are neglected in the DPM framework. Due to the neglect of particle–particle collisions and particle liquid displacement in DPM, the volume fraction of the liquid phase remains constant. Due to these assumptions and simplifications, DPM is only effective for dilute fluid–particle flows. Chen et al. [151] studied the flow and erosion characteristics of solid–liquid two-phase flow in an energy storage pump by establishing an improved calculation model based on modified resistance and erosion models. In the calculation model, a modified resistance model that considers the influence of turbulence intensity was proposed. As shown in Figure 19, the DPM model can track particle trajectories. A recent review of DPM-CFD modeling techniques can be found in reference [79].
The DDPM model overcomes the limitations of particle–particle interactions in DPM by considering solid–solid interaction forces between particles, calculating stress tensors using the Kinetic Theory of Granular Flow (KTGF) method, and incorporating solid volume fraction into an extended set of governing equations. The current DDPM model is suitable for transient modeling of particle–fluid flow in centrifugal slurry pumps under various solid concentrations. For details, please refer to the work of wang et al. [152].

3.5. Model Modification

Modified Drag Model

Drag force is the primary form of force experienced by solid particles in a flow field, directly related to particle characteristics and the relative motion between solid and liquid phases. Most researchers directly employ established drag models, whose coefficients are derived from free-settling data and are solely dependent on the particles’ Reynolds number. However, some studies indicate that particle drag is significantly influenced by turbulent intensity, particularly within the turbulent flows present in rotating machinery [153]. Panneerselvam et al. [154] utilized an Eulerian–Eulerian model and simulated agitators using the Brucato drag model, finding mismatches between radial and tangential velocity components in regions with high turbulent fluctuations, such as impeller zones. Lane et al. [155] coupled turbulent characteristics with drag coefficients and applied a novel turbulent drag coefficient model within stirred tanks. Building upon Lane’s work, Li et al. [119] modified the drag force model between gas–liquid phases within dynamic pumps based on the drag model proposed by Ishii and Zuber [156]. Experimental validation showed that the modified drag force model exhibited better accuracy. Ge et al. [157], based on the modified drag model, considered bubble deformation under high inlet gas volume fraction (IGVF) and numerically simulated the gas–liquid two-phase flow performance of a mixed-flow pump, validated through experiments. Due to the significant turbulence induced by strong rotation, large curvature, and complex wall constraints within slurry pumps, considering the influence of turbulence intensity and wall effects on particle drag becomes a critical research area. Existing approaches include using relative turbulence intensity and turbulent length scale compared to particle diameter to adjust the drag coefficient (CD).
For the turbulence factor Ct [158] in the former strategy, it is expressed as:
C d = 1 + 6 2 k f / 3 V f V s R e p 500 0.687
where kf is the turbulent kinetic energy of the water phase, Vf is the velocity vector of the water phase, vs. is the velocity vector of the sand phase, and Rep is the sand Reynolds number. There are different empirical formulas corresponding to different ranges of the particle Reynolds number Rep [159], and the above expression (Equation (52)) provides a uniform fitting formula in a wide range. For the latter strategy, the Brucato formula is a typical representative [153], which is given by.
C d = 1 + a 1 d p l k a 2
where λ is the Kolmogorov length scale [153]:
λ = ν 3 ε 0.25
where ν is the kinematic viscosity of fluid, and ε is the dissipation of turbulent kinetic energy, which is provided by the turbulence model.
Equations (50) and (51) can quantify the effect of water turbulence, but Cd from Equation (50) may decrease as the eddy viscous damping function decreases, which may be inconsistent with real physics. In contrast, by Equation (51) it is more efficient in engineering applications because the decomposition dissipation rate ε is almost negligible.
Chen and Tan [151] modified the drag model based on the Euler–Lagrange method, taking into account the influence of turbulence on drag, and studied the solid–liquid two-phase flow and erosion characteristics in centrifugal pumps. According to the resistance coefficients of different flow modes summarized by Brown et al. [160]:
C d 0 = 24 R e p 1 + 0.150 R e p 0.681 + 0.407 1 + 8710 R e p
where Rep is the particle Reynolds number:
R e p = ρ d p | u u p | μ
where μ is the dynamic viscosity of fluid.
The relationship between the Kolmogorov length scale and particle diameter is adopted as follows:
C d C d 0 C d 0 = 8.676 × 10 4 d p λ 3
Bring Equations (54) and (55) into Equation (57), a modified drag model, by considering the effect of turbulence intensity is proposed. The modified drag model is expressed as follows:
C d = 1 + 8.676 × 10 4 d p 4 ε ν 3 0.75 × 24 R e p 1 + 0.150 R e p 0.681 + 0.407 1 + 8710 R e p
In subsequent work, Chen [161] employed a large eddy simulation to calculate turbulent dissipation.
ε = 2 ν S i j S i j ¯ = 2 ν S i j : S i j ¯ = 2 ν S i j 2 ¯
S i j = 1 2 u i x j + u j x i
Compared to Reynolds-averaged Navier–Stokes (RANS), Large Eddy Simulation (LES) can accurately capture unsteady secondary eddies in the flow [162]. Additionally, in engineering computations, particles are typically assumed to be spherical.

4. Experimental Research

Deep-sea boosting pumps operate in harsh environments within the ocean, facing complex conditions influenced by vibrations in the deep-sea pipelines and variations in particle concentration. Numerical simulations of two-phase flow involve numerous assumptions, and the accuracy of computational fluid dynamics (CFD) results must be validated through experimentation. Therefore, offshore test data are crucial to ensure the stable operation of hydraulic boosting systems in engineering applications.

4.1. External Characteristic Experiment

In the 1970s, several semi-commercial mining trials were conducted globally. The earliest experimental efforts in deep-sea mining were undertaken by the Kennecott Consortium (KCON), Ocean Management Incorporated (OMI), Ocean Mining Association (OMA), and Ocean Minerals Corporation (OMCO), sequentially conducting mining trials of deep-sea mining systems as detailed in Table 7.
These trials validated the feasibility of deep-sea mining theory. However, they also exposed numerous engineering issues, including significant wear and blockage problems. The Pacific Ocean holds vast mineral resources, prompting research on deep-sea mining by various research institutions in Asian countries. Japan’s DOMCO conducted mining experiments in the northern Pacific Ocean. In 2017, Japan conducted a trial mining operation at a depth of 1600 m near Okinawa in its Exclusive Economic Zone (EEZ), successfully extracting 15 tons of nodules [165]. South Korea conducted slurry pump shallow-water lifting tests in nearby waters in 2007 and 2009 [166,167]. The National Institute of Ocean Technology in India conducted offshore trials of slurry pump mining systems in the Indian Ocean in 2000 and 2006 [168,169]. In June 2018, China successfully tested a 500-m seabed polymetallic nodule collection system in the South China Sea, with a slurry pump capable of lifting 50 tons per hour of polymetallic nodules. Due to confidentiality, detailed results of these tests are challenging to obtain. However, limited publicly available information reveals that hydraulic boosting pumps still face many technical challenges that need resolution before they can be deployed for commercial mining operations.
Offshore experiments often entail significant costs, and the complexities of marine environments make measurements more challenging. To minimize time, financial, and resource investments, and to conduct more comprehensive tests on slurry pumps, numerous research institutions have undertaken land-based experiments. Engelmann (1978) [170] utilized radioactive tracing to measure particle velocities in a U-shaped hydraulic lift system. They used radioactive density probes to measure mixture densities and friction in stainless steel pipes. Extensive studies were conducted on solid–liquid flow within the system, investigating the flow patterns and forces experienced by particles of varying sizes and concentrations within the riser. Empirical formulas for obtaining local slip velocities and relative friction factors were derived from experimental data. However, this experiment solely analyzed particles within hydraulic lift pipelines, and particles did not enter rotating machinery. Park et al. (2004) [171] and Yoon et al. (2004) [172] used a mining pump experimental system to measure the characteristics of two-phase flow at the outlet section of slurry pumps, discovering correlations between hydraulic gradients and solid fractions. In 2007, KIGAM enhanced their experimental system, introducing particles into the system via a screw feeder after the pipeline was filled with water. The newly generated two-phase flow was then lifted to the top of the system using a slurry pump and returned to the screw feeder after separation and metering. Compared to the original system, the upgraded system included instruments to measure pump inlet and outlet pressures. Yoon et al. (2007) [173] optimized the existing test bed by adding pressure measurement instruments at the pump inlet and outlet, using a slurry pump to obtain frictional hydraulic gradients. Hydraulic gradients increased with higher volume fractions or reduced mixed airflow velocities. As a pioneer in China’s deep-sea mining, CRIMM’s land-based slurry pump test system incorporated a closed subsystem that allowed for convenient adjustment of the pump’s operational state. Using this closed system, researchers measured speed, pressure, rotation, torque, and temperature, and observed the flow patterns of solid–liquid two-phase flows. The experiments studied pump performance under various design conditions of particle sizes and volume concentrations. Overall, pump efficiency was found to be unsatisfactory even under conditions with particles smaller than 30 mm, failing to meet commercial needs. Additionally, blockages occurred with particle diameters below 50 mm, partly due to unexpected pump shutdowns. A deep-sea mining lifting system powered by a six-stage centrifugal pump, as designed by Central South University, is shown in Figure 20. The impeller inlet is the most critical part of slurry transport within the pump, as it experiences the highest particle concentrations. Deng et al. [84] proposed the axial installation of diverters to improve transport conditions at the impeller inlet, largely resolving particle accumulation issues and enhancing the safety of deep-sea mining pumps. Kang et al. [70] conducted axial thrust and hydraulic performance tests on a dual-stage lifting pump at an open test platform operated by Tianjin Premier Electric Dust Removal Pumping System Co., Ltd., Tianjin, China.

4.2. Visualization Experiment

Experimental characterization of pump external characteristics refers to the measurement and analysis of pump inputs (such as motor power, speed, etc.), and outputs (such as flow rate, head, etc.), under certain operating conditions. Although such experiments are crucial for understanding and assessing pump performance, they may be challenging to accurately simulate actual fluid behavior for pumps handling multiphase flows or complex fluids (such as those containing solid particles or high-viscosity fluids). Numerical simulation methods for two-phase flows are still not sufficiently advanced, and the dynamics of internal particle motion must be validated through experiments. Given this necessity, there is a need to enhance understanding of the physical phenomena occurring in single-phase and two-phase flows inside impellers and diffusers, as these flow characteristics strongly influence the behavior and performance of slurry pumps. With advancements in technology, such as the widespread application of laser emitters, digital cameras, and high-performance computers, non-intrusive flow visualization optical techniques have become increasingly popular. Currently, the most commonly used techniques rely on tracking tracer particles, including Particle Tracking Velocimetry (PTV), Laser Doppler Velocimetry (LDV), and Particle Image Velocimetry (PIV) [174]. PIV is used to measure flow velocity distributions and vortex structures inside pumps in one-way flows, thereby evaluating pump performance, such as efficiency, head, and flow rate. By analyzing these data, pump designs can be optimized to improve performance and reduce energy consumption [175,176,177,178]. Keller et al. [179] conducted extensive research on single-phase flow in pumps. As shown in Figure 21, the researchers utilized a conventional 2D-2C PIV system along with a transparent pump prototype. An analysis of the fluid dynamic flow structures between the impeller outlet and volute tongue was conducted. The development of vorticity and turbulent kinetic energy at the trailing edge of the blade and the junction with the tip of the tongue is illustrated in Figure 22 and Figure 23, respectively. Particle tracking velocimetry visualization techniques are widely used in gas–liquid two-phase flows. Cubas et al. [180] evaluated the dynamics of individual gas bubbles in pump impellers based on Particle Tracking Velocimetry visualization techniques. Estevam [181] developed a prototype with a transparent impeller and analyzed bubble phenomena resulting in reduced pump performance through bubble visualization. The authors also proposed a dimensionless number-based model to predict flow patterns observed inside impellers under each operating condition. Zhang et al. [182] visualized flow using a high-speed camera with a resolution of 1280 × 1024 pixels and a capture rate of 5000 frames per second (fps), studying the influence of gas–liquid two-phase flow on the performance of a three-stage rotodynamic multiphase pump. Tan et al. [183] revealed the motion characteristics of coarse particles inside pumps by tracking single particles of different densities and diameters in a two-phase flow of coarse particles and liquid using a high-speed photography system, obtaining particle trajectories. Li et al. [150] designed and fabricated a transparent model pump, constructed an experimental platform (see Figure 24), and combined high-speed camera recordings with numerical simulation results to validate the accuracy of CFD-DEM simulation methods(see Figure 25). Cheng et al. [146] measured the velocity of particles inside a centrifugal pump through high-speed photography, tracking the trajectories of four particles in the volute.
Using high-speed cameras for flow visualization offers numerous advantages, as these devices ensure the observation of rapid transient phenomena with high spatial and temporal resolutions. However, visualization experiments require transparent casings or impellers, imposing high demands on manufacturing processes, and under some harsh conditions, the strength requirements may not be met. There is a need for a method that does not require the development of transparent prototypes but still captures the internal flow state. In recent years, due to advancements in digital data processing, radiation sources, and detectors, the spatial and temporal resolutions of Computed Tomography (CT) systems have significantly improved, making them a highly promising method for quantitatively determining the two-phase distribution of rotating machinery and its components. CT employs gamma rays (or γ-rays) and X-ray radiation to penetrate opaque materials and can be applied to real pumps with metal casings. Schüafer et al. [184,185] demonstrated the ability of gamma-ray and X-ray CT methods to reveal transient gas–liquid flow behavior in their recent studies. However, due to the inability to understand flow within pumps, the detection of flow structures such as cavities and bubbles has been indirect.
So far, few scholars have devoted themselves to using HSI and PTV to study particle–fluid flow. Nevertheless, in gas–liquid and liquid–liquid two-phase flow visualization work, researchers have overcome many difficulties, with abundant studies demonstrating that HSI and PTV are useful visualization tools for characterizing the kinetics and dynamics of bubbles in impellers. The skills and specialized knowledge in this area can readily be transferred to visualization work in solid–liquid two-phase flows.

4.3. Wear Experiment

Particle-induced wear of flow components can decrease the lifespan, performance, and reliability of fluid power machinery, leading to energy wastage and equipment failures, which is also one of the significant challenges faced in deep-sea mining systems [186,187]. The wear of moving components such as pump impellers is severe, but the wear of impellers is generally uniform. However, for slurry pumps, pump casings are often difficult to replace, so research on casing wear is equally important. Many researchers have studied the wear of impellers and volutes. Measurement of material loss due to erosion during field trials requires prolonged operations. Typically, special methods such as paint wear, wall thickness loss measurement, overall weight loss measurement, SEM analysis, etc., are employed for the components under study. Zhu et al. [188] simulated the damage caused by short-term support agent reflux in a multi-stage submersible pump using the paint wear method. The study analyzed the performance of the pump, erosion marks, and changes in erosion geometry. The results indicate that the wear mechanism in the secondary flow area (seal ring and sleeve) is believed to transition from abrasive wear to erosion-abrasion composite wear. Hong et al. [189] observed the wear of flow components in a novel deep-sea mining multi-stage pump under different flow conditions using the paint wear method. Sharma et al. [190] reported a weight loss of 1.99% in Francis turbine runners within a year due to hydraulic erosion. The trailing edge region of the runner blades was reported as highly susceptible to erosion, likely due to the micro-cutting failure mechanism. Sharma calculated the mass loss rate by measuring the weight loss of different specimens after testing. Material removal mechanisms on the surface of rotor passages were analyzed using scanning electron microscopy (SEM). As shown in Figure 26, SEM micrographs depicted variations in particle impact conditions along the passages, providing theoretical support for studying particle–blade surface contact patterns.

5. Conclusions and Outlook

5.1. Conclusions

This provides a comprehensive and advanced review of the design optimization, numerical simulation, and experimental research methods for deep-sea lifting pumps. Initially, the paper describes several classical design methods for multiphase flow transport pumps and proposes various feasible optimization strategies, including theoretical optimization, algorithm optimization, and some special optimization methods, addressing some deficiencies in current design approaches. Subsequently, it introduces numerical methods suitable for deep-sea lifting pumps, revisiting the basic theories of common continuous phase models (TFM and Mixture models) and discrete phase models (CFD-DEM, DPM). The paper analyzes the multiphase flows within deep-sea lifting pumps from different scales, using both Eulerian–Eulerian and Eulerian–Lagrange methods, with a focus on the CFD-DEM method for its excellent representation of internal particle movements, widely applied in the numerical simulation studies of deep-sea lifting pumps. Therefore, a detailed analysis of the applicability conditions and coupling strategies of the CFD-DEM method is provided. The accurate description of drag force in solid–liquid two-phase flow significantly affects the accuracy of simulations, leading to a description of recent modifications to drag models used in multiphase flow pumps. Lastly, the review covers the experimental research on deep-sea lifting pumps, where early studies investigated pump performance and issues through sea trials and base experiments but typically yielded more macroscopic measurement data. With the advancement of numerical simulations, researchers have studied the distribution and movement behavior of particles within the flow field. Traditional experimental methods could only validate the performance of the pumps and not the accuracy of numerical simulations. However, with the development of non-invasive visualization technologies, visualization experiments have demonstrated great potential in validating the accuracy of numerical simulations for deep-sea lifting pumps. This research work provides theoretical guidance for studying the evolutionary process of internal particle flow systems in deep-sea lifting pumps and offers significant insights for their development and optimization.

5.2. Outlook

Currently, researchers have conducted extensive work on deep-sea lifting pumps; however, there are deficiencies in design theory, computational methods, coupling efficiency, and handling complex scenarios. Therefore, further refinement is needed in the study of deep-sea lifting pumps.
  • Presently, no robust design methodologies exist for deep-sea lifting pumps; however, employing numerical simulations in conjunction with optimization algorithms and parametric modeling proves significantly efficacious for the design of these pumps under complex operational conditions. However, the optimization of deep-sea lifting pumps in solid–liquid two-phase flow conditions remain inadequately explored.
  • Optimization studies of deep-sea lifting pumps predominantly consider efficiency in steady-state conditions designed for constant speed. Considering the complexity of deep-sea mining applications, it is pertinent to evaluate efficiency across variable speeds and different operating states. Moreover, attention must be given to the impacts of wear on the pump’s efficiency and reliability, suggesting a shift towards optimization goals that include multi-speed, multi-state efficiency, and wear characteristics.
  • In solid–liquid two-phase flows, the presence of solid particles can induce changes in the flow pattern, particle clogging and deposition, wear, and erosion, as well as uneven particle concentration and distribution. These factors may lead to flow instability and separation, thereby triggering rotational stalls. Rotational stalls can significantly affect the efficiency of pumps, increase vibration and noise, exacerbate component wear, and lead to operational instability, negatively impacting the performance and lifespan of the pump. Therefore, to effectively prevent and mitigate the occurrence of rotational stalls, it is necessary to optimize the design of impellers and flow passages and to adjust and maintain operating conditions. These strategies are crucial for enhancing system reliability and efficiency, and for extending the service life of the equipment.
  • Considering the particle systems within deep-sea lifting pumps, which often comprise a large number of particles, the associated (DEM) simulations require substantial computational effort. The computational efficiency is further compromised when DEM is coupled with computational fluid dynamics (CFD). Thus, enhancing the computational efficiency of the integrated CFD-DEM approach is crucial for practical deployment. Integration of the Coarse-Grained Methodology (CGM) into the CFD-DEM framework could substantially lower computational demands. Modern commercial software now often incorporates GPU-accelerated parallel computation techniques to facilitate CFD-DEM solvers, as evidenced by platforms such as EDEM and Rocky DEM.
  • The CFD-DEM approach is predominantly employed for investigating solid–liquid two-phase flows in rotating machinery. However, the complex structural demands of these machines make mesh generation particularly challenging. The Smoothed Particle Hydrodynamics (SPH) method, representing a novel mesh-free approach, provides extensive potential for addressing complex challenges such as free surface flows, multiphase flows, and interactions between fluids and particles.
  • Modifications to computational models for two-phase flow pumps have traditionally focused on the effects of turbulence on drag forces. However, the influence of additional forces warrants consideration. It is imperative that these models are refined to enhance the simulation accuracy of slurry pumps.
  • Particles in deep-sea lifting pumps are typically heterogeneous and non-spherical. Much of the extant research is based on spherical particles, with a notable deficiency in studies addressing non-spherical particles and their fragmentation.
  • For visualization experiments concerning deep-sea lifting pumps, the identification and velocimetry of particles present intricate challenges. A promising resolution could involve deploying advanced image processing technologies anchored in machine learning methodologies. Such enhancements are expected to enrich the database for impellers in two-phase flow pumps significantly.

Funding

The work was sponsored by the Key International Cooperative research of National Natural Science Foundation of China (No. 52120105010). National Natural Science Foundation of China (No. 52179085). National Natural Science Foundation of China (No. 52309112). Project funded by China Postdoctoral Science Foundation (No. 2022TQ0127). Project funded by China Postdoctoral Science Foundation (No. 2023M741414). Project funded by China Postdoctoral Science Foundation (No. 2023M732979). Natural Science Foundation of Jiangsu Province (No. BK20220587). the Sixth “333 High Level Talented Person Cultivating Project ”of Jiangsu Province, Funded projects of “Blue Project ”in Jiangsu Colleges and Universities, “Belt and Road ”Innovation Cooperation Project of Jiangsu Province (No. BZ2020068). Independent Innovation Fund Project of Agricultural Science and Technology in Jiangsu Province (No. CX (20)2037). Cooperative research project of the Ministry of Education’s “Chunhui Program” (No. HZKY20220117).

Data Availability Statement

Data are contained within the article.

Conflicts of Interest

The authors declare that they have no known competing financial interests or personal relationships that could have appeared to influence the work reported in this paper.

References

  1. Hein, J.R.; Mizell, K.; Koschinsky, A.; Conrad, T.A. Deep-ocean mineral deposits as a source of critical metals for high- and green-technology applications: Comparison with land-based resources. Ore Geol. Rev. 2013, 51, 1–14. [Google Scholar] [CrossRef]
  2. Petersen, S.; Krätschell, A.; Augustin, N.; Jamieson, J.; Hein, J.R.; Hannington, M.D. News from the seabed—Geological characteristics and resource potential of deep-sea mineral resources. Mar. Policy 2016, 70, 175–187. [Google Scholar] [CrossRef]
  3. Van Wijk, J. Vertical Hydraulic Transport for Deep Sea Mining: A Study into Flow Assurance. PhD Thesis, Delft University of Technology, Delft, The Netherlands, 2016. [Google Scholar]
  4. Chung, J.S. Deep-ocean mining technology: Development II. In Proceedings of the ISOPE Ocean Mining and Gas Hydrates Symposium, Changsha, China, 9–13 October 2005; p. ISOPE–M-05-001. [Google Scholar]
  5. IUCN. DEEP-SEA MINING. Available online: https://www.iucn.org/sites/default/files/2022-07/iucn-issues-brief_dsm_update_final.pdf (accessed on 7 May 2022).
  6. Glasby, G.P. Lessons Learned from Deep-Sea Mining. Science 2000, 289, 551–553. [Google Scholar] [CrossRef] [PubMed]
  7. Hannington, M.; Petersen, S.; Krätschell, A. Subsea mining moves closer to shore. Nat. Geosci. 2017, 10, 158–159. [Google Scholar] [CrossRef]
  8. Wen, H.; Liu, S.-J.; Zou, W.-S.; Hu, X.-Z.; Dong, Z. Effects of particle diameter on erosion wear characteristic of deep-sea mining pump. In Proceedings of the 2019 International Conference on Intelligent Transportation, Big Data & Smart City (ICITBS), Changsha, China, 12–13 January 2019; pp. 507–512. [Google Scholar]
  9. Shaw, J.L. Nodule mining—Three miles deep! Mar. Georesour. Geotechnol. 1993, 11, 181–197. [Google Scholar] [CrossRef]
  10. Peacock, T.; Ouillon, R. The fluid mechanics of deep-sea mining. Annu. Rev. Fluid Mech. 2023, 55, 403–430. [Google Scholar] [CrossRef]
  11. Yoon, C.H.; Lee, D.K.; Park, Y.C.; Kwon, S.K. On-land Hydraulic Pumping Experiments of 30-meter Height Scale. In Proceedings of the Fifteenth International Offshore and Polar Engineering Conference, Seoul, Repubilc of Korea, 19–24 June 2005. [Google Scholar]
  12. Zou, W. COMRA′s research on lifting motor pump. In Proceedings of the ISOPE Ocean Mining and Gas Hydrates Symposium, Lisbon, Portugal, 1–6 July 2007; p. ISOPE–M-07-032. [Google Scholar]
  13. Deng, L.; Hu, Q.; Chen, J.; Kang, Y.; Liu, S. Particle distribution and motion in six-stage centrifugal pump by means of slurry experiment and CFD-DEM simulation. J. Mar. Sci. Eng. 2021, 9, 716. [Google Scholar] [CrossRef]
  14. Kang, Y.; Liu, S.; Zou, W.; Zhao, H.; Hu, X. Design and analysis of an innovative deep-sea lifting motor pump. Appl. Ocean Res. 2019, 82, 22–31. [Google Scholar] [CrossRef]
  15. Ji, L.; Li, W.; Shi, W.; Tian, F.; Agarwal, R. Diagnosis of internal energy characteristics of mixed-flow pump within stall region based on entropy production analysis model. Int. Commun. Heat Mass Transf. 2020, 117, 104784. [Google Scholar] [CrossRef]
  16. Li, W.; Huang, Y.; Ji, L.; Ma, L.; Agarwal, R.K.; Awais, M. Prediction model for energy conversion characteristics during transient processes in a mixed-flow pump. Energy 2023, 271, 127082. [Google Scholar] [CrossRef]
  17. Tarodiya, R.; Gandhi, B.K. Numerical simulation of a centrifugal slurry pump handling solid-liquid mixture: Effect of solids on flow field and performance. Adv. Powder Technol. 2019, 30, 2225–2239. [Google Scholar] [CrossRef]
  18. Zhou, L.; Han, C.; Bai, L.; Li, W.; El-Emam, M.A.; Shi, W. CFD-DEM bidirectional coupling simulation and experimental investigation of particle ejections and energy conversion in a spouted bed. Energy 2020, 211, 118672. [Google Scholar] [CrossRef]
  19. Zhang, A.; Jiang, M.; Thornton, C. A coupled CFD-DEM method with moving mesh for simulating undrained triaxial tests on granular soils. Granul. Matter 2020, 22, 13. [Google Scholar] [CrossRef]
  20. Chen, Q.; Xiong, T.; Zhang, X.; Jiang, P. Study of the hydraulic transport of non-spherical particles in a pipeline based on the CFD-DEM. Eng. Appl. Comput. Fluid Mech. 2020, 14, 53–69. [Google Scholar] [CrossRef]
  21. Zhao, L.; Chang, Z.; Zhang, Z.; Huang, R.; He, D. Visualization of gas-liquid flow pattern in a centrifugal pump impeller and its influence on the pump performance. Meas. Sens. 2021, 13, 100033. [Google Scholar] [CrossRef]
  22. Lobanoff, V.S.; Ross, R.R. Centrifugal Pumps: Design and Application; Elsevier: Amsterdam, The Netherlands, 2013. [Google Scholar]
  23. Li, H.; Han, Y.; Shi, W.; Tiganik, T.; Zhou, L. Automatic optimization of centrifugal pump based on adaptive single-objective algorithm and computational fluid dynamics. Eng. Appl. Comput. Fluid Mech. 2022, 16, 2222–2242. [Google Scholar] [CrossRef]
  24. Zhou, L.; Shi, W.; Lu, W.; Hu, B.; Wu, S. Numerical investigations and performance experiments of a deep-well centrifugal pump with different diffusers. J. Fluids Eng. 2012, 134, 071102. [Google Scholar] [CrossRef]
  25. Zhou, L.; Zhang, L.; Bai, L.; Shi, W.; Li, W.; Wang, C.; Agarwal, R. Experimental study and transient CFD/DEM simulation in a fluidized bed based on different drag models. RSC Adv. 2017, 7, 12764–12774. [Google Scholar] [CrossRef]
  26. Ma, H.; Zhao, Y. Investigating the fluidization of disk-like particles in a fluidized bed using CFD-DEM simulation. Adv. Powder Technol. 2018, 29, 2380–2393. [Google Scholar] [CrossRef]
  27. Fairbank, L.C., Jr. Effect on the characteristics of centrifugal pumps. Trans. Am. Soc. Civ. Eng. 1942, 107, 1564–1575. [Google Scholar] [CrossRef]
  28. Cave, I. Effects of suspended solids on the performance of centrifugal pumps. Proc. Hydro Transp. 1976, 4, 43. [Google Scholar]
  29. Wiedenroth, W. The influence of sand and gravel on the characteristics of centrifugal pumps, some aspects of wear in hydraulic transportation installations. In Proceedings of the Hydrotransport, Coventry, UK, 1–4 September 1970. [Google Scholar]
  30. Gahlot, V.K.; Seshadri, V.; Malhotra, R.C. Effect of Density, Size Distribution, and Concentration of Solid on the Characteristics of Centrifugal Pumps. J. Fluids Eng. 1992, 114, 386–389. [Google Scholar] [CrossRef]
  31. Kazim, K.A.; Maiti, B.; Chand, P. A correlation to predict the performance characteristics of centrifugal pumps handling slurries. Proc. Inst. Mech. Eng. Part A J. Power Energy 1997, 211, 147–157. [Google Scholar] [CrossRef]
  32. Vocadlo, J.; Koo, J.; Prang, A. Performance of Centrifugal Pumps in Slurry Service; The National Academies of Sciences, Engineering, and Medicine: Washington, DC, USA, 1974. [Google Scholar]
  33. Engin, T.; Gur, M. Comparative Evaluation of Some Existing Correlations to Predict Head Degradation of Centrifugal Slurry Pumps. J. Fluids Eng. 2003, 125, 149–157. [Google Scholar] [CrossRef]
  34. Gandhi, B.K.; Singh, S.; Seshadri, V. Performance characteristics of centrifugal slurry pumps. J. Fluids Eng. 2001, 123, 271–280. [Google Scholar] [CrossRef]
  35. Engin, T.; Gur, M. Performance Characteristics of a Centrifugal Pump Impeller with Running Tip Clearance Pumping Solid-Liquid Mixtures. J. Fluids Eng. -Trans. Asme 2001, 123, 532–538. [Google Scholar] [CrossRef]
  36. Kuntz, G. The technical advantages of submersible motor pumps in deep sea technology and the delivery of manganese nodules. In Proceedings of the Offshore Technology Conference, Houston, TX, USA, 30 April–3 May 1979; p. OTC–3367-MS. [Google Scholar]
  37. Hao, Y.; Hao, J.; Zuchao, Z.; Xianghui, S.; Wenqi, L.; Gruszczynski, M.; Qiangmin, D.; Panlong, G. Review of the hydraulic and structural design of high-speed centrifugal pumps. Front. Energy Res. 2022, 10, 899093. [Google Scholar] [CrossRef]
  38. Yang, J.; Zhang, R. A method for calculating the increasing coefficient of centrifugal pump with low specific speed. J. Mech. Eng. 2005, 41, 203–205. [Google Scholar] [CrossRef]
  39. Hawthorne, W.; Wang, C.; Tan, C.; McCune, J. Theory of blade design for large deflections: Part I—Two-dimensional cascade. J. Eng. Gas Turbines Power 1984, 206, 346–353. [Google Scholar] [CrossRef]
  40. Tan, C.; Hawthorne, W.; McCune, J.; Wang, C. Theory of blade design for large deflections: Part II—Annular cascades. J. Eng. Gas Turbines Power 1984, 106, 354–365. [Google Scholar] [CrossRef]
  41. Zangeneh, M. Inverse design of centrifugal compressor vaned diffusers in inlet shear flows. J. Turbomach. 1996, 118, 385–393. [Google Scholar] [CrossRef]
  42. Zangeneh, M.; Goto, A.; Harada, H. On the role of three-dimensional inverse design methods in turbomachinery shape optimization. Proc. Inst. Mech. Eng. Part C J. Mech. Eng. Sci. 1999, 213, 27–42. [Google Scholar] [CrossRef]
  43. Lu, J.; Xi, G.; Qi, D. Blade optimization of mixed-flow pump using inverse design method and neural network. Xi’an Jiaotong Daxue Xuebao (J. Xi’an Jiaotong Univ.) 2004, 38, 308–312. [Google Scholar]
  44. Mäkelä, M. Experimental design and response surface methodology in energy applications: A tutorial review. Energy Convers. Manag. 2017, 151, 630–640. [Google Scholar] [CrossRef]
  45. Wang, W.; Osman, M.K.; Pei, J.; Yuan, S.; Cao, J.; Osman, F.K. Efficiency-house optimization to widen the operation range of the double-suction centrifugal pump. Complexity 2020, 2020, 9737049. [Google Scholar] [CrossRef]
  46. Shi, G.; Li, H.; Liu, X.; Liu, Z.; Wang, B. Transport performance improvement of a multiphase pump for gas–liquid mixture based on the orthogonal test method. Processes 2021, 9, 1402. [Google Scholar] [CrossRef]
  47. Pei, J.; Wang, W.; Osman, M.K.; Gan, X. Multiparameter optimization for the nonlinear performance improvement of centrifugal pumps using a multilayer neural network. J. Mech. Sci. Technol. 2019, 33, 2681–2691. [Google Scholar] [CrossRef]
  48. Gong, X.; Pei, J.; Wang, W.; Osman, M.K.; Jiang, W.; Zhao, J.; Deng, Q. Nature-inspired modified BAT algorithm for the high-efficiency optimization of a multistage centrifugal pump for a reverse osmosis desalination system. J. Mar. Sci. Eng. 2021, 9, 771. [Google Scholar] [CrossRef]
  49. Lu, R.; Yuan, J.; Wei, G.; Zhang, Y.; Lei, X.; Si, Q. Optimization design of energy-saving mixed flow pump based on MIGA-RBF algorithm. Machines 2021, 9, 365. [Google Scholar] [CrossRef]
  50. Derakhshan, S.; Pourmahdavi, M.; Abdolahnejad, E.; Reihani, A.; Ojaghi, A. Numerical shape optimization of a centrifugal pump impeller using artificial bee colony algorithm. Comput. Fluids 2013, 81, 145–151. [Google Scholar] [CrossRef]
  51. Wu, T.; Wu, D.; Ren, Y.; Song, Y.; Gu, Y.; Mou, J. Multi-objective optimization on diffuser of multistage centrifugal pump base on ANN-GA. Struct. Multidiscip. Optim. 2022, 65, 182. [Google Scholar] [CrossRef]
  52. Wu, T.; Wu, D.; Gao, S.; Song, Y.; Ren, Y.; Mou, J. Multi-objective optimization and loss analysis of multistage centrifugal pumps. Energy 2023, 284, 128638. [Google Scholar] [CrossRef]
  53. Chen, J.; Shi, W.; Zhang, D. Influence of blade inlet edge position on performance of single-blade centrifugal pump. J. Drain. Irrig. Mach. Eng. 2021, 39, 1093–1099. [Google Scholar]
  54. Kim, J.-H.; Lee, H.-C.; Kim, J.-H.; Choi, Y.-S.; Yoon, J.-Y.; Yoo, I.-S.; Choi, W.-C. Improvement of hydrodynamic performance of a multiphase pump using design of experiment techniques. J. Fluids Eng. 2015, 137, 081301. [Google Scholar] [CrossRef]
  55. Hao, H.; Xinkai, L.; Bo, G. Hydraulic optimization of multiphase pump based on CFD and genetic algorithm. Int. J. Grid Distrib. Comput. 2015, 8, 161–170. [Google Scholar] [CrossRef]
  56. Zhang, J.-Y.; Cai, S.-J.; Li, Y.-J.; Zhou, X.; Zhang, Y.-X. Optimization design of multiphase pump impeller based on combined genetic algorithm and boundary vortex flux diagnosis. J. Hydrodyn. Ser. B 2017, 29, 1023–1034. [Google Scholar] [CrossRef]
  57. Zhang, Y.; Wu, J.; Zhang, Y.; Chen, L. Design optimization of centrifugal pump using radial basis function metamodels. Adv. Mech. Eng. 2014, 6, 457542. [Google Scholar] [CrossRef]
  58. Hong, S.; Hu, X. Optimization of impeller of deep-sea mining pump for erosive wear reduction based on response surface methodology. Mar. Georesour. Geotechnol. 2023, 41, 295–311. [Google Scholar] [CrossRef]
  59. Kim, J.-H.; Kim, K.-Y. Analysis and optimization of a vaned diffuser in a mixed flow pump to improve hydrodynamic performance. J. Fluids Eng. 2012, 134, 071104. [Google Scholar] [CrossRef]
  60. Nourbakhsh, A.; Safikhani, H.; Derakhshan, S. The comparison of multi-objective particle swarm optimization and NSGA II algorithm: Applications in centrifugal pumps. Eng. Optim. 2011, 43, 1095–1113. [Google Scholar] [CrossRef]
  61. Gan, X.; Pei, J.; Wang, W.; Yuan, S.; Lin, B. Application of a modified MOPSO algorithm and multi-layer artificial neural network in centrifugal pump optimization. Eng. Optim. 2023, 55, 580–598. [Google Scholar] [CrossRef]
  62. Zhang, J.; Zhu, H.; Yang, C.; Li, Y.; Wei, H. Multi-objective shape optimization of helico-axial multiphase pump impeller based on NSGA-II and ANN. Energy Convers. Manag. 2011, 52, 538–546. [Google Scholar] [CrossRef]
  63. Shojaeefard, M.H.; Hosseini, S.E.; Zare, J. CFD simulation and Pareto-based multi-objective shape optimization of the centrifugal pump inducer applying GMDH neural network, modified NSGA-II, and TOPSIS. Struct. Multidiscip. Optim. 2019, 60, 1509–1525. [Google Scholar] [CrossRef]
  64. Xu, K.; Wang, G.; Zhang, L.; Wang, L.; Yun, F.; Sun, W.; Wang, X.; Chen, X. Multi-objective optimization of jet pump based on RBF neural network model. J. Mar. Sci. Eng. 2021, 9, 236. [Google Scholar] [CrossRef]
  65. Cui, B.; Chen, H.; Zhu, Z.; Sun, L.; Sun, L. Optimization of low-temperature multi-stage submersible pump based on blade load. Phys. Fluids 2024, 36, 035157. [Google Scholar] [CrossRef]
  66. Hu, Q.; Zhai, X.; Li, Z. Multi-objective optimization of deep-sea mining pump based on CFD, GABP neural network and NSGA-III algorithm. J. Mar. Sci. Eng. 2022, 10, 1063. [Google Scholar] [CrossRef]
  67. Kim, J.-H.; Lee, H.-C.; Yoon, J.-Y.; Lee, K.-Y.; Lee, Y.-K.; Choi, Y.-S. Multi objective optimization of a multiphase pump for offshore plants. In Proceedings of the Fluids Engineering Division Summer Meeting, Chicago, IL, USA, 3–7 August 2014; p. V01BT10A011. [Google Scholar]
  68. Cancan, P.; Xiaodong, Z.; Zhiguang, G.; Ju, W.; Yan, G. Research on cooperative optimization of multiphase pump impeller and diffuser based on adaptive refined response surface method. Adv. Mech. Eng. 2022, 14, 16878140211072944. [Google Scholar] [CrossRef]
  69. Yang, H.; Liu, S. A new lifting pump for deep-sea mining. J. Mar. Eng. Technol. 2020, 19, 102–108. [Google Scholar] [CrossRef]
  70. Kang, Y.; Su, Q.; Liu, S. On the axial thrust and hydraulic performance of a multistage lifting pump for deep-sea mining. Ocean Eng. 2022, 265, 112534. [Google Scholar] [CrossRef]
  71. Zhou, H.; Chen, L.; Wang, W.; Ren, L.; Shan, H.; Zhang, Z. Abrasive particle wear behavior of 3Cr2W8V steel processed to bionic non-smooth surface by laser. Mater. Sci. Eng. A 2005, 412, 323–327. [Google Scholar] [CrossRef]
  72. Ma, F.; Zeng, Z.; Gao, Y.; Liu, E.; Xue, Q. Research Status and Progress of Bionic Surface Drag Reduction. China Surface Eng. 2016, 29, 7–15. [Google Scholar]
  73. Li, K. Study on Drag Reduction Capability of Bionic Dimple Impeller and Dynamic Characteristics of Centrifugal Pump. Master’s Thesis, Harbin Engineering University, Harbin, China, 2017. [Google Scholar]
  74. Gu, Y.; Liu, N.; Mou, J.; Zhou, P.; Qian, H.; Dai, D. Study on solid–liquid two-phase flow characteristics of centrifugal pump impeller with non-smooth surface. Adv. Mech. Eng. 2019, 11, 1687814019848269. [Google Scholar] [CrossRef]
  75. Ma, H.; Zhou, L.; Liu, Z.; Chen, M.; Xia, X.; Zhao, Y. A review of recent development for the CFD-DEM investigations of non-spherical particles. Powder Technol. 2022, 412, 117972. [Google Scholar] [CrossRef]
  76. Wen, C.-Y. Mechanics of Fluidization. Chem. Eng. Prog. Symp. Ser. 1966, 162, 100–111. [Google Scholar]
  77. Lun, C.K.; Savage, S.B.; Jeffrey, D.; Chepurniy, N. Kinetic theories for granular flow: Inelastic particles in Couette flow and slightly inelastic particles in a general flowfield. J. Fluid Mech. 1984, 140, 223–256. [Google Scholar] [CrossRef]
  78. Cundall, P.A.; Strack, O.D. A discrete numerical model for granular assemblies. Geotechnique 1979, 29, 47–65. [Google Scholar] [CrossRef]
  79. Deen, N.; Annaland, M.V.S.; Van der Hoef, M.A.; Kuipers, J. Review of discrete particle modeling of fluidized beds. Chem. Eng. Sci. 2007, 62, 28–44. [Google Scholar] [CrossRef]
  80. Tsuji, Y.; Kawaguchi, T.; Tanaka, T. Discrete particle simulation of two-dimensional fluidized bed. Powder Technol. 1993, 77, 79–87. [Google Scholar] [CrossRef]
  81. Zhong, W.; Yu, A.; Liu, X.; Tong, Z.; Zhang, H. DEM/CFD-DEM modelling of non-spherical particulate systems: Theoretical developments and applications. Powder Technol. 2016, 302, 108–152. [Google Scholar] [CrossRef]
  82. Zhu, H.; Zhou, Z.; Yang, R.; Yu, A. Discrete particle simulation of particulate systems: A review of major applications and findings. Chem. Eng. Sci. 2008, 63, 5728–5770. [Google Scholar] [CrossRef]
  83. Zhu, H.P.; Zhou, Z.Y.; Yang, R.; Yu, A. Discrete particle simulation of particulate systems: Theoretical developments. Chem. Eng. Sci. 2007, 62, 3378–3396. [Google Scholar] [CrossRef]
  84. Deng, L.; Lu, H.; Liu, S.; Hu, Q.; Yang, J.; Kang, Y.; Sun, P. Particle anti-accumulation design at impeller suction of deep-sea mining pump and evaluation by CFD-DEM simulation. Ocean Eng. 2023, 279, 114598. [Google Scholar] [CrossRef]
  85. Alfonsi, G. On direct numerical simulation of turbulent flows. Appl. Mech. Rev. 2011, 64, 020802. [Google Scholar] [CrossRef]
  86. Ran, H.; Luo, X.; Zhang, Y.; Zhuang, B.; Xu, H. Numerical simulation of the unsteady flow in a high-head pump turbine and the runner improvement. In Proceedings of the Fluids Engineering Division Summer Meeting, Jacksonville, FL, USA, 10–14 August 2008; pp. 1115–1123. [Google Scholar]
  87. Lu, G.; Zuo, Z.; Sun, Y.; Liu, D.; Tsujimoto, Y.; Liu, S. Experimental evidence of cavitation influences on the positive slope on the pump performance curve of a low specific speed model pump-turbine. Renew. Energy 2017, 113, 1539–1550. [Google Scholar] [CrossRef]
  88. Zhang, X.; Burgstaller, R.; Lai, X.; Gehrer, A.; Kefalas, A.; Pang, Y. Experimental and numerical analysis of performance discontinuity of a pump-turbine under pumping mode. In Proceedings of the IOP Conference Series: Earth and Environmental Science, Grenoble, France, 4–8 July 2016; p. 042003. [Google Scholar]
  89. Tang, Y.; Lau, Y.; Deen, N.; Peters, E.; Kuipers, J. Direct numerical simulations and experiments of a pseudo-2D gas-fluidized bed. Chem. Eng. Sci. 2016, 143, 166–180. [Google Scholar] [CrossRef]
  90. Luo, K.; Tan, J.; Wang, Z.; Fan, J. Particle-resolved direct numerical simulation of gas–solid dynamics in experimental fluidized beds. AIChE J. 2016, 62, 1917–1932. [Google Scholar] [CrossRef]
  91. Blais, B.; Bertrand, F. CFD-DEM investigation of viscous solid–liquid mixing: Impact of particle properties and mixer characteristics. Chem. Eng. Res. Des. 2017, 118, 270–285. [Google Scholar] [CrossRef]
  92. Cao, W.; Jia, Z.; Zhao, Z.; Zhou, L. Validation and simulation of cavitation flow in a centrifugal pump by filter-based turbulence model. Eng. Appl. Comput. Fluid Mech. 2022, 16, 1724–1738. [Google Scholar] [CrossRef]
  93. Ku, X.; Li, T.; Løvås, T. CFD–DEM simulation of biomass gasification with steam in a fluidized bed reactor. Chem. Eng. Sci. 2015, 122, 270–283. [Google Scholar] [CrossRef]
  94. Di Renzo, A.; Di Maio, F.P. Comparison of numerical models for the simulation of binary solid-liquid fluidized beds. Chem. Eng. Process. Process Intensif. 2004, 43, 1187–1201. [Google Scholar]
  95. Squires, K.D.; Eaton, J.K. Particle response and turbulence modification in isotropic turbulence. Phys. Fluids A Fluid Dyn. 1990, 2, 1191–1203. [Google Scholar] [CrossRef]
  96. Zhang, Y.; Ran, Z.; Jin, B.; Zhang, Y.; Zhou, C.; Sher, F. Simulation of particle mixing and separation in multi-component fluidized bed using Eulerian-Eulerian method: A review. Int. J. Chem. React. Eng. 2019, 17, 20190064. [Google Scholar] [CrossRef]
  97. Ostermeier, P.; Vandersickel, A.; Gleis, S.; Spliethoff, H. Three dimensional multi fluid modeling of Geldart B bubbling fluidized bed with complex inlet geometries. Powder Technol. 2017, 312, 89–102. [Google Scholar] [CrossRef]
  98. Wang, P.; Zhao, J.; Zou, W.; Hu, S. Experimental study and numerical simulation of the solid-phase particles′ influence on outside characteristics of slurry pump. In Proceedings of the IOP Conference Series: Earth and Environmental Science, Beijing, China, 19–23 August 2012; p. 062057. [Google Scholar]
  99. Zhao, B.; Huang, Z.; Chen, H.; Hou, D. Numerical investigation of solid-liquid two phase flow in a non-clogging centrifugal pump at off-design conditions. In Proceedings of the IOP Conference Series: Earth and Environmental Science, Beijing, China, 19–23 August 2012; p. 062020. [Google Scholar]
  100. Li, Y.; Zhu, Z.; He, W.; He, Z. Numerical simulation and experimental research on the influence of solid-phase characteristics on centrifugal pump performance. Chin. J. Mech. Eng. 2012, 25, 1184–1189. [Google Scholar] [CrossRef]
  101. Zhang, Y.; Li, Y.; Cui, B.; Zhu, Z.; Dou, H. Numerical simulation and analysis of solid-liquid two-phase flow in centrifugal pump. Chin. J. Mech. Eng. 2013, 26, 53–60. [Google Scholar] [CrossRef]
  102. Noon, A.A.; Kim, M.-H. Erosion wear on centrifugal pump casing due to slurry flow. Wear 2016, 364, 103–111. [Google Scholar] [CrossRef]
  103. Peng, G.; Fan, F.; Zhou, L.; Huang, X.; Ma, J. Optimal hydraulic design to minimize erosive wear in a centrifugal slurry pump impeller. Eng. Fail. Anal. 2021, 120, 105105. [Google Scholar] [CrossRef]
  104. Peng, G.; Chen, Q.; Bai, L.; Hu, Z.; Zhou, L.; Huang, X. Wear mechanism investigation in a centrifugal slurry pump impeller by numerical simulation and experiments. Eng. Fail. Anal. 2021, 128, 105637. [Google Scholar] [CrossRef]
  105. Yang, Y.; Wang, H.; Hu, Q.; Ji, L.; He, Z.; Shi, W.; Song, X.; Zhou, L. Two-phase flow investigation of sewage pumps with different tip clearance via computational fluid dynamics and multi-factor ANOVA. Eng. Appl. Comput. Fluid Mech. 2024, 18, 2322514. [Google Scholar] [CrossRef]
  106. Wang, L.; Chu, X. Validation of an improved two-fluid model with particle rotation for gas-solid fluidized bed. Particuology 2023, 81, 149–161. [Google Scholar] [CrossRef]
  107. Ostermeier, P.; Dawo, F.; Vandersickel, A.; Gleis, S.; Spliethoff, H. Numerical calculation of wall-to-bed heat transfer coefficients in Geldart B bubbling fluidized beds with immersed horizontal tubes. Powder Technol. 2018, 333, 193–208. [Google Scholar] [CrossRef]
  108. Nikolopoulos, A.; Papafotiou, D.; Nikolopoulos, N.; Grammelis, P.; Kakaras, E. An advanced EMMS scheme for the prediction of drag coefficient under a 1.2 MWth CFBC isothermal flow—Part I: Numerical formulation. Chem. Eng. Sci. 2010, 65, 4080–4088. [Google Scholar] [CrossRef]
  109. Di Renzo, A.; Di Maio, F.P. Comparison of contact-force models for the simulation of collisions in DEM-based granular flow codes. Chem. Eng. Sci. 2004, 59, 525–541. [Google Scholar] [CrossRef]
  110. Ye, M.; van der Hoef, M.A.; Kuipers, J. A numerical study of fluidization behavior of Geldart A particles using a discrete particle model. Powder Technol. 2004, 139, 129–139. [Google Scholar] [CrossRef]
  111. El-Emam, M.A.; Zhou, L.; Shi, W.; Han, C.; Bai, L.; Agarwal, R. Theories and applications of CFD–DEM coupling approach for granular flow: A review. Arch. Comput. Methods Eng. 2021, 28, 4979–5020. [Google Scholar] [CrossRef]
  112. Mangadoddy, N.; Vakamalla, T.R.; Kumar, M.; Mainza, A. Computational modelling of particle-fluid dynamics in comminution and classification: A review. Miner. Process. Extr. Metall. 2020, 129, 145–156. [Google Scholar] [CrossRef]
  113. Kieckhefen, P.; Pietsch, S.; Dosta, M.; Heinrich, S. Possibilities and limits of computational fluid dynamics–discrete element method simulations in process engineering: A review of recent advancements and future trends. Annu. Rev. Chem. Biomol. Eng. 2020, 11, 397–422. [Google Scholar] [CrossRef] [PubMed]
  114. Rauchenzauner, S.; Schneiderbauer, S. A dynamic spatially averaged two-fluid model for heat transport in moderately dense gas–particle flows. Phys. Fluids 2020, 32, 063307. [Google Scholar] [CrossRef]
  115. Zhao, Z.; Zhou, L.; Bai, L.; Lv, W.; Agarwal, R.K. Effects of particle diameter and inlet flow rate on gas–solid flow patterns of fluidized bed. ACS Omega 2023, 8, 7151–7162. [Google Scholar] [CrossRef] [PubMed]
  116. Antypov, D.; Elliott, J. On an analytical solution for the damped Hertzian spring. Europhys. Lett. 2011, 94, 50004. [Google Scholar] [CrossRef]
  117. Zhou, C.; Zhao, Y. Discrete element method and its applications in fluidization. CIESC J. 2014, 65, 2520–2534. [Google Scholar]
  118. Ibrahim, A.; Meguid, M.A. On the development and challenges of particulate flow modeling in geotechnical engineering: A review. In Proceedings of the GeoVirual 2020, Canadian Geotechnical Society, Calgary, AB, Canada, 14–16 September 2020. [Google Scholar]
  119. Li, Y.; Yu, Z.; Sun, W. Drag coefficient modification for turbulent gas-liquid two-phase flow in a rotodynamic pump. Chem. Eng. J. 2021, 417, 128570. [Google Scholar] [CrossRef]
  120. Gidaspow, D. Multiphase Flow and Fluidization; Academic Press: San Diego, CA, USA, 1994. [Google Scholar]
  121. Nezami, E.G.; Hashash, Y.M.A.; Zhao, D.; Ghaboussi, J. Shortest link method for contact detection in discrete element method. Int. J. Numer. Anal. Methods Geomech. 2006, 30, 783–801. [Google Scholar] [CrossRef]
  122. Zhou, C.; Su, J.; Chen, H.; Shi, Z. Terminal velocity and drag coefficient models for disc-shaped particles based on the imaging experiment. Powder Technol. 2022, 398, 117062. [Google Scholar] [CrossRef]
  123. Cao, Z.; Tafti, D. Fluid forces and torques in suspensions of oblate cylinders with aspect ratio 1:4. Int. J. Multiph. Flow 2020, 131, 103394. [Google Scholar] [CrossRef]
  124. Zastawny, M.; Mallouppas, G.; Zhao, F.; Van Wachem, B. Derivation of drag and lift force and torque coefficients for non-spherical particles in flows. Int. J. Multiph. Flow 2012, 39, 227–239. [Google Scholar] [CrossRef]
  125. Luo, K.; Wang, D.; Jin, T.; Wang, S.; Wang, Z.; Tan, J.; Fan, J. Analysis and development of novel data-driven drag models based on direct numerical simulations of fluidized beds. Chem. Eng. Sci. 2021, 231, 116245. [Google Scholar] [CrossRef]
  126. Presa-Reyes, M.; Mahyawansi, P.; Hu, B.; McDaniel, D.; Chen, S.-C. DCC-DNN: A deep neural network model to predict the drag coefficients of spherical and non-spherical particles aided by empirical correlations. Powder Technol. 2024, 435, 119388. [Google Scholar] [CrossRef]
  127. Haider, A.; Levenspiel, O. Drag coefficient and terminal velocity of spherical and nonspherical particles. Powder Technol. 1989, 58, 63–70. [Google Scholar] [CrossRef]
  128. Ganser, G.H. A rational approach to drag prediction of spherical and nonspherical particles. Powder Technol. 1993, 77, 143–152. [Google Scholar] [CrossRef]
  129. Leith, D. Drag on nonspherical objects. Aerosol Sci. Technol. 1987, 6, 153–161. [Google Scholar] [CrossRef]
  130. Tran-Cong, S.; Gay, M.; Michaelides, E.E. Drag coefficients of irregularly shaped particles. Powder Technol. 2004, 139, 21–32. [Google Scholar] [CrossRef]
  131. Hölzer, A.; Sommerfeld, M. New simple correlation formula for the drag coefficient of non-spherical particles. Powder Technol. 2008, 184, 361–365. [Google Scholar] [CrossRef]
  132. Sanjeevi, S.K.; Kuipers, J.; Padding, J.T. Drag, lift and torque correlations for non-spherical particles from Stokes limit to high Reynolds numbers. Int. J. Multiph. Flow 2018, 106, 325–337. [Google Scholar] [CrossRef]
  133. Cao, Z.; Tafti, D.K. Investigation of drag, lift and torque for fluid flow past a low aspect ratio (1:4) cylinder. Comput. Fluids 2018, 177, 123–135. [Google Scholar] [CrossRef]
  134. Richter, A.; Nikrityuk, P.A. New correlations for heat and fluid flow past ellipsoidal and cubic particles at different angles of attack. Powder Technol. 2013, 249, 463–474. [Google Scholar] [CrossRef]
  135. Krüger, T.; Kusumaatmaja, H.; Kuzmin, A.; Shardt, O.; Silva, G.; Viggen, E.M. The Lattice Boltzmann Method; Springer International Publishing: Berlin/Heidelberg, Germany, 2017; Volume 10, pp. 4–15. [Google Scholar]
  136. Fraga Filho, C.A.D. Smoothed Particle Hydrodynamics; Springer: Berlin/Heidelberg, Germany, 2019. [Google Scholar]
  137. He, L.; Liu, Z.; Zhao, Y. An extended unresolved CFD-DEM coupling method for simulation of fluid and non-spherical particles. Particuology 2022, 68, 1–12. [Google Scholar] [CrossRef]
  138. Deb, S.; Tafti, D.K. A novel two-grid formulation for fluid–particle systems using the discrete element method. Powder Technol. 2013, 246, 601–616. [Google Scholar] [CrossRef]
  139. Wang, Z.; Teng, Y.; Liu, M. A semi-resolved CFD–DEM approach for particulate flows with kernel based approximation and Hilbert curve based searching strategy. J. Comput. Phys. 2019, 384, 151–169. [Google Scholar] [CrossRef]
  140. Sun, R.; Xiao, H. Diffusion-based coarse graining in hybrid continuum–discrete solvers: Theoretical formulation and a priori tests. Int. J. Multiph. Flow 2015, 77, 142–157. [Google Scholar] [CrossRef]
  141. Zhao, Z.; Zhou, L.; Bai, L.; Wang, B.; Agarwal, R. Recent advances and perspectives of CFD–DEM simulation in fluidized bed. Arch. Comput. Methods Eng. 2024, 31, 871–918. [Google Scholar] [CrossRef]
  142. Chen, Y.; Xiong, H.; Cheng, H.; Yu, C.; Xie, J. Effect of particle motion on the hydraulic collection of coarse spherical particles. Acta Mech. Sin. 2020, 36, 72–81. [Google Scholar] [CrossRef]
  143. Wang, L.; Liu, H.; Wang, K.; Zhou, L.; Jiang, X.; Li, Y. Numerical simulation of the sound field of a five-stage centrifugal pump with different turbulence models. Water 2019, 11, 1777. [Google Scholar] [CrossRef]
  144. Yuanwen, L.; Zhiming, G.; Liu, S.; Xiaozhou, H. Flow field and particle flow of two-stage deep-sea lifting pump based on DEM-CFD. Front. Energy Res. 2022, 10, 884571. [Google Scholar] [CrossRef]
  145. Shao, W.; Zhao, R.; Zhang, D. Erosion of multistage mixed flow pump based on fully coupled CFD-DEM method. Chin. J. Hydrodyn. 2020, 35, 640–648. [Google Scholar]
  146. Cheng, W.; Fan, H.; Cheng, W.; Shao, C. Investigation on wear induced by solid-liquid two-phase flow in a centrifugal pump based on EDEM-Fluent coupling method. Flow Meas. Instrum. 2024, 96, 102542. [Google Scholar] [CrossRef]
  147. Su, X.; Tang, Z.; Li, Y.; Zhu, Z.; Mianowicz, K.; Balaz, P. Research of particle motion in a two-stage slurry transport pump for deep-ocean mining by the CFD-DEM method. Energies 2020, 13, 6711. [Google Scholar] [CrossRef]
  148. Hu, Q.; Chen, J.; Deng, L.; Kang, Y.; Liu, S. CFD-DEM simulation of backflow blockage of deep-sea multistage pump. J. Mar. Sci. Eng. 2021, 9, 987. [Google Scholar] [CrossRef]
  149. Hu, Q.; Zhu, J.; Deng, L.; Chen, J.; Wang, Y. Effect of Particle Factors on the Reflux and Blockage of a Deep-Sea Six-Stage Pump Based on CFD-DEM. Adv. Theory Simul. 2024, 7, 2300931. [Google Scholar] [CrossRef]
  150. Li, Y.; Liu, D.; Cui, B.; Lin, Z.; Zheng, Y.; Ishnazarov, O. Studying particle transport characteristics in centrifugal pumps under external vibration using CFD-DEM simulation. Ocean Eng. 2024, 301, 117538. [Google Scholar] [CrossRef]
  151. Chen, M.; Tan, L. Solid-liquid multiphase flow and erosion in the energy storage pump using modified drag model and erosion model. J. Energy Storage 2023, 73, 108859. [Google Scholar] [CrossRef]
  152. Wang, H.; Tan, Z.; Kuang, S.; Yu, A. Systematic investigation of centrifugal slurry pump under different operating condition by DDPM method. Powder Technol. 2023, 430, 119024. [Google Scholar] [CrossRef]
  153. Brucato, A.; Grisafi, F.; Montante, G. Particle drag coefficients in turbulent fluids. Chem. Eng. Sci. 1998, 53, 3295–3314. [Google Scholar] [CrossRef]
  154. Panneerselvam, R.; Savithri, S.; Surender, G.D. CFD modeling of gas–liquid–solid mechanically agitated contactor. Chem. Eng. Res. Des. 2008, 86, 1331–1344. [Google Scholar] [CrossRef]
  155. Lane, G.; Schwarz, M.; Evans, G.M. Numerical modelling of gas–liquid flow in stirred tanks. Chem. Eng. Sci. 2005, 60, 2203–2214. [Google Scholar] [CrossRef]
  156. Goossens, W.R. Review of the empirical correlations for the drag coefficient of rigid spheres. Powder Technol. 2019, 352, 350–359. [Google Scholar] [CrossRef]
  157. Peng, C.; Wang, L.-P. Mechanisms and models of particle drag enhancements in turbulent environments. J. Fluid Mech. 2023, 959, A30. [Google Scholar] [CrossRef]
  158. Zhang, Z. Investigation on Sediment Erosion Characteristics of Double Suction Centrifugal Pump; China Agricultural University: Beijing, China, 2016. [Google Scholar]
  159. Michaelides, E.E.; Sommerfeld, M.; van Wachem, B. Multiphase Flows with Droplets and Particles; CRC Press: Boca Raton, FL, USA, 2022. [Google Scholar]
  160. Brown, P.P.; Lawler, D.F. Sphere drag and settling velocity revisited. J. Environ. Eng. 2003, 129, 222–231. [Google Scholar] [CrossRef]
  161. Chen, M.; Tan, L. An improved method combined modified drag model and modified erosion model based on LES for solid-liquid multiphase flow and erosion with application in a 90° elbow. Wear 2024, 538, 205214. [Google Scholar] [CrossRef]
  162. Röhrig, R.; Jakirlić, S.; Tropea, C. Comparative computational study of turbulent flow in a 90 pipe elbow. Int. J. Heat Fluid Flow 2015, 55, 120–131. [Google Scholar] [CrossRef]
  163. Chung, J.S. An articulated pipe-miner system with thrust control for deep-ocean crust mining. Mar. Georesour. Geotechnol. 1998, 16, 253–271. [Google Scholar] [CrossRef]
  164. Xiao, L.; Fang, M.; Zhang, W. Advance and present state of the research in oceanic metalliferous nodule mining. Met. Mine 2000, 8, 11–14. [Google Scholar]
  165. Okamoto, N.; Shiokawa, S.; Kawano, S.; Yamaji, N.; Sakurai, H.; Kurihara, M. World’s first lifting test for seafloor massive sulphides in the Okinawa Trough in the EEZ of Japan. In Proceedings of the ISOPE International Ocean and Polar Engineering Conference, Honolulu, HI, USA, 16–21 June 2019; p. ISOPE–I-19-655. [Google Scholar]
  166. Hong, S.; Kim, H.-W.; Choi, J.-S. A way to accomplish the mining technology for poly-metallic nodules. In Proceedings of the ISA Workshop on Polymetallic Nodule Mining Technology, Chennai, India, 18–22 February 2008. [Google Scholar]
  167. Yoon, C.H.; Park, J.-M.; Kang, J.S.; Kim, Y.; Park, Y.C.; Park, S.G.; Kim, C.; Kang, S.S.; Kim, S.B.; Kim, W.T. Shallow lifting test for the development of deep ocean mineral resources in Korea. In Proceedings of the ISOPE Ocean Mining and Gas Hydrates Symposium, Maui, HI, USA, 19–24 June 2011; p. ISOPE–M-11-014. [Google Scholar]
  168. Deepak, C.; Shajahan, M.; Atmanand, M.; Annamalai, K.; Jeyamani, R.; Ravindran, M.; Schulte, E.; Handschuh, R.; Panthel, J.; Grebe, H. Developmental tests on the underwater mining system using flexible riser concept. In Proceedings of the ISOPE Ocean Mining and Gas Hydrates Symposium, Stavanger, Norway, 17–22 June 2001; p. ISOPE–M-01-016. [Google Scholar]
  169. Deepak, C.; Ramji, S.; Ramesh, N.; Babu, S.; Abraham, R.; Shajahan, M.; Atmanand, M. Development and testing of underwater mining systems for long term operations using flexible riser concept. In Proceedings of the ISOPE Ocean Mining and Gas Hydrates Symposium, Lisbon, Portugal, 1–6 July 2007; p. ISOPE–M-07-025. [Google Scholar]
  170. Engelmann, H. Vertical Hydraulic Lifting of Large-Size Particles—A Contribution to Marine Mining. In Proceedings of the Offshore Technology Conference, Houston, TX, USA, 7–10 May 1978. [Google Scholar]
  171. Park, Y.-C.; Yoon, C.-H.; Lee, D.-K.; Kwon, S.-K. Experimental Studies on Hydraulic Lifting of Solid-liquid Two-phase Flow. Ocean Polar Res. 2004, 26, 647–653. [Google Scholar] [CrossRef]
  172. Yoon, C.; Lee, D.K.; Park, Y.C.; Kwon, S.K. Design and test of hydraulic pumping system with 30 m height scale. In Proceedings of the ISOPE International Ocean and Polar Engineering Conference, Toulon, France, 23–28 May 2004; pp. 61–65. [Google Scholar]
  173. Chi-Ho Yoon, Y.-C.P.Y.-J.K.J.-M.P.; Seok-ki, K. A Study on Flow Analysis of Lifting Pump and Flexible Hose for Sea-Test. J. Korean Soc. Miner. Energy Resour. Eng. 2007, 44, 308–313. [Google Scholar]
  174. Hinsch, K. Particle image velocimetry. In Speckle Metrology; CRC Press: Boca Raton, FL, USA, 2020; pp. 235–324. [Google Scholar]
  175. Li, W.; Zhou, L.; Shi, W.-D.; Ji, L.; Yang, Y.; Zhao, X. PIV experiment of the unsteady flow field in mixed-flow pump under part loading condition. Exp. Therm. Fluid Sci. 2017, 83, 191–199. [Google Scholar] [CrossRef]
  176. Li, W.; Ji, L.; Shi, W.; Li, E.; Yang, Z. Particle image velocimetry measurement of flow fields in a mixed-flow pump with non-uniform tip clearance. J. Vis. 2021, 24, 29–45. [Google Scholar] [CrossRef]
  177. Keller, J.; Blanco, E.; Barrio, R.; Parrondo, J. PIV measurements of the unsteady flow structures in a volute centrifugal pump at a high flow rate. Exp. Fluids 2014, 55, 1820. [Google Scholar] [CrossRef]
  178. Li, X.; Chen, B.; Luo, X.; Zhu, Z. Effects of flow pattern on hydraulic performance and energy conversion characterisation in a centrifugal pump. Renew. Energy 2020, 151, 475–487. [Google Scholar] [CrossRef]
  179. Keller, J. Fluid-Dynamic Fluctuations and Flow Structures in Centrifugal Pumps due to Rotor-Stator Interaction. Ph.D. Thesis, Universidad de Oviedo, Oviedo, Spain, 2014. [Google Scholar]
  180. Cubas, J.M.; Stel, H.; Ofuchi, E.M.; Neto, M.A.M.; Morales, R.E. Visualization of two-phase gas-liquid flow in a radial centrifugal pump with a vaned diffuser. J. Pet. Sci. Eng. 2020, 187, 106848. [Google Scholar] [CrossRef]
  181. Estevam, V. A Phenomenological Analysis about Centrifugal Pump in Two-Phase Flow Operation. Ph.D. Thesis, Faculdade de Engenharia Mecânica, Universidade Estadual de Campinas, São Paulo, Brazil, 2002. [Google Scholar]
  182. Zhang, J.; Cai, S.; Li, Y.; Zhu, H.; Zhang, Y. Visualization study of gas–liquid two-phase flow patterns inside a three-stage rotodynamic multiphase pump. Exp. Therm. Fluid Sci. 2016, 70, 125–138. [Google Scholar] [CrossRef]
  183. Tan, M.; Wang, X.; Wu, X.; Liu, H.; Lian, Y. Single particle motion visualization test of solid-liquid two-phase flow in a double-blade pump. J. Harbin Eng. Univ. 2020, 41, 676–683. [Google Scholar]
  184. Schäfer, T.; Neumann, M.; Bieberle, A.; Hampel, U. Experimental investigations on a common centrifugal pump operating under gas entrainment conditions. Nucl. Eng. Des. 2017, 316, 1–8. [Google Scholar] [CrossRef]
  185. Schäfer, T.; Neumann-Kipping, M.; Bieberle, A.; Bieberle, M.; Hampel, U. Ultrafast X-ray computed tomography imaging for hydrodynamic investigations of gas–liquid two-phase flow in centrifugal pumps. J. Fluids Eng. 2020, 142, 041502. [Google Scholar] [CrossRef]
  186. Sharma, S.; Gandhi, B.K.; Pandey, L. Measurement and analysis of sediment erosion of a high head Francis turbine: A field study of Bhilangana-III hydropower plant, India. Eng. Fail. Anal. 2021, 122, 105249. [Google Scholar] [CrossRef]
  187. Tarodiya, R.; Gandhi, B.K. Numerical investigation of erosive wear of a centrifugal slurry pump due to solid–liquid flow. J. Tribol. 2021, 143, 101702. [Google Scholar] [CrossRef]
  188. Zhu, H.; Zhu, J.; Rutter, R.; Zhang, H.-Q. Experimental Study on Deteriorated Performance, Vibration, and Geometry Changes of an Electrical Submersible Pump Under Sand Water Flow Condition. J. Energy Resour. Technol. 2021, 143, 082104. [Google Scholar] [CrossRef]
  189. Hong, S.; Hu, X. Study on the Non-Steady-State Wear Characteristics and Test of the Flow Passage Components of Deep-Sea Mining Pumps. Appl. Sci. 2022, 12, 782. [Google Scholar] [CrossRef]
  190. Sharma, S.; Gandhi, B.K. Experimental investigation on rotating domain wear of hydrodynamic machine due to particulate flow. Powder Technol. 2022, 410, 117884. [Google Scholar] [CrossRef]
Figure 1. Exploration for minerals in the area [5].
Water 16 01881 g001
Figure 2. List of the number of research articles on deep-sea ores published year by year (Web of Science).
Water 16 01881 g002
Figure 3. Pipeline-lifting mining systems: (A) a polymetallic nodule mining operation using a single collector vehicle and (B) possible associated return water discharge. (C) A seafloor massive sulfide mining operation around a hydrothermal vent site. (D) A cobalt crust mining operation on the flank of a seamount. (E) deep-sea lifting pump [10].
Water 16 01881 g003
Figure 4. Deep-sea lift pump with bowl diffuser [14]. 1—Impeller, 2—Sand tray, 3—Shaft sleeve, 4—Bearing, 5—Bowl diffuser.
Water 16 01881 g004
Figure 5. ASO optimization design flowchart [23].
Water 16 01881 g005
Figure 6. Hydraulic axial loads and reduction indexes with different values of Db. Schematic diagram of axial load components on the impeller [70].
Water 16 01881 g006
Figure 7. Blade of non-smooth surface, and distribution of pit on the blade [74].
Water 16 01881 g007
Figure 8. Schematic diagram of CFD-DEM coupling [84].
Water 16 01881 g008
Figure 9. Comparison of the observed wear with predicted slip velocity and solid volume fraction [104].
Water 16 01881 g009
Figure 10. Variation of mean vorticity under different flow rates and particle concentrations [105].
Water 16 01881 g010
Figure 11. Force analysis of particles in collision [115].
Water 16 01881 g011
Figure 12. CFD–DEM numerical algorithm flow schematic.
Water 16 01881 g012
Figure 13. Schematic diagram of grid size and particle size under three coupling strategies.(a) resolved CFD-DEM, (b) semi-resolved CFD-DEM, and (c) unresolved CFD-DEM.
Water 16 01881 g013
Figure 14. Coupling strategies and their effects on turbulence.
Water 16 01881 g014
Figure 15. (a) Particle trajectory of a representative particle; (b) velocity of the particle; (c) partial zoom of particle trajectory [13].
Water 16 01881 g015
Figure 16. Particle distribution comparison near the suction port with different splitter plate lengths. (a) 50 mm; (b) 100 mm; (c) 150 mm. (d) Mass comparison of impeller suction area with different length plates. The red area in (a) is the inlet quality control area of the impeller [84].
Water 16 01881 g016
Figure 17. (a) Behavior and distribution of the mixed particle. (b) Residual position of the mixed particles [149].
Water 16 01881 g017
Figure 18. (a) Distribution and velocity of particles in the centrifugal pump at different vibration frequencies. (b) Dynamic number of particles in the suction chamber [150].
Water 16 01881 g018
Figure 19. Particle trajectories in pump and impeller [151].
Water 16 01881 g019
Figure 20. Structure of the deep-sea mining pump: (a) the pump under test; (b) overall structure; (c) Impellers and diffusers; and (d) partial enlarged drawing near the impeller suction [84].
Water 16 01881 g020
Figure 21. Facility used to perform 2D-2C PIV experiments [179].
Water 16 01881 g021
Figure 22. Vorticity next to the volute tongue. The impeller rotation sense is counterclockwise. The maximum negative vorticity sheet is formed at the blade trailing edge and intercepts the tongue tip [179].
Water 16 01881 g022
Figure 23. Turbulent kinetic energy production next to the volute tongue. The maximum turbulent kinetic energy production occurs at blade trailing edge when it aligns with tongue tip [179].
Water 16 01881 g023
Figure 24. Simulated experimental platform for externally induced vibration in the model pump [150].
Water 16 01881 g024
Figure 25. Comparison of the particle distribution between simulation and experiment [150].
Water 16 01881 g025
Figure 26. Wear of suction surface and pressure surface of blade under electron microscope [190].
Water 16 01881 g026
Table 2. Solid–liquid two-phase flow pump design parameters.
ParameterEquation
Impeller inlet diameter D j = D 0 2 + d h 2
D 0 = K 0 Q n
K 0 = 3.8 ~ 4.5
Impeller blade outlet width b 2 = k b Q n 3
k b = 0.64 k b 2 ( n s 100 ) 5 / 6
Impeller outlet diameter D 2 = 60 n π ν m 2 2 t a n β 2 + ν m 2 2 t a n β 2 + g H t + u 1 ν u 1
Number of impeller blades Z 1 = 3 ~ 6
The width of diffuser blades b 3 = b 2 + ( 3 5 ) mm
Number of diffuser blades Z 2 = Z 1 + 1
Table 3. Summary of algorithm optimization of pump.
AuthorsOptimization AlgorithmPump TypeEfficiency
Optimization
Head
Optimization
Pei et al. [47]Improved
particle swarm
optimization
Centrifugal pump--
Gong et al. [48]Improved bat algorithmSeawater desalination high pressure multistage pump+3.98%-
Lu et al. [49]Radial basis function (RBF) neural network
multi-islands genetic
algorithm (MIGA)
Mixed-flow pump+4.3%-
Derakhshan et al. [50]Artificial colony algorithmCentrifugal pump+3.59%+6.89 m
Wu et al. [51,52]Artificial neural network
Genetic algorithm
Multistage centrifugal pump+2.8%,
(CMEI decreases by 1.34%)
+8.8%
Table 4. Normal contact force calculation formula.
Normal Contact ForceEquation
Linear spring–dashpot model [114] F i j n = K n l s n + C n s ˙ n
Hysteretic linear spring model [115] F i j n = min K n l s n t , F i j t Δ t + K n u Δ s n     Δ s n 0 max F i j t Δ t + K n u Δ s n , λ K n l s n t Δ s n < 0
Hertzian spring–dashpot model [116] F i j n = K ^ H s n 3 / 2 + C ^ H s n 1 / 4 s ˙ n
Table 5. General correlations for the drag coefficient CD of non-spherical particles.
ReferencesCorrelations
Haider and Levenspiel [127] C D = 24 1 + A 1 R e p A 2 / R e p + A 3 / 1 + A 4 / R e p , A 1 = exp 2.3288 6.4581 ϕ + 2.4486 ϕ 2 , A 2 = 0.0964 + 0.5565 ϕ , A 3 = exp ( 4.905 13.8944 ϕ + 18.4222 ϕ 2 10.2599 ϕ 3 ) , A 4 = exp ( 1.4681 + 12.2584 ϕ 20.7322 ϕ 2 + 15.8855 ϕ 3 )
Ganser [128] C D K 2 = 24 R e p K 1 K 2 1 + 0.1118 R e p K 1 K 2 0.6567 + 0.4305 1 + 3305 / R e p K 1 K 2 K 1 1 = 1 3 + 2 3 ϕ 0.5 , l o g K 2 = 1.8148 ( l o g ϕ ) 0.5743 , R e p K 1 K 2 10 5
Leith [129] C D = 8 R e p 1 ϕ + 16 R e p 1 ϕ
Tran-Cong et al. [130] C D = 8 R e p 1 ϕ + 16 R e p 1 ϕ
Hölzer and Sommerfeld [131] C D = 8 R e p 1 ϕ + 16 R e p 1 ϕ + 3 R e p 1 ϕ 3 / 4 + 0.42 × 10 0.4 ( l o g ϕ ) 0.2 1 ϕ
Table 6. Correlations of calculating the lift coefficient CL for non-spherical particles.
ReferencesCorrelationsNotes
Sanjeevi et al. [132] C L = a 1 R e p + a 2 R e p a 3 + a 4 R e p a 5 ( s i n α L ) 1 + a 6 R e p a 7 c o s α L 1 + a 8 R e p a 9 For spherocylinder and ellipsoid
Valid when 0.1 ≤ Rep ≤ 2000
Zastawny et al. [124] C L = b 1 R e p b 1 + b 3 R e p b 4 ( s i n α L ) b 5 + b 6 R e p b 7 ( c o s α L ) b 8 + b 9 R e p b 10 For spherocylinder and ellipsoid
Valid when 0.1 ≤ Rep ≤ 300
Cao and Tafti [133] C L = 1.688 + 6.617 R e p 1.063 ( sin α L ) 0.8222 ( cos α L ) 0.9796 For cylinder with w = 0.25
Valid when 10 ≤ Rep ≤ 300
Richter and Nikrityuk [134] C L = 0.97 R e p 0.25 s i n ( 2 α ˜ L ) 0.0262 R e p 0.25 c o s ( 2 α ˜ L )
α ˜ L = | [ ( α L + 90 ) mod 180 ] 180 |
For ellipsoid with w = 2
Valid when 10 ≤ Rep ≤ 200
Table 7. Mining test of early deep-sea mining system.
ConsortiumKCON (Kennecott Consortium)OMA (Ocean Mining Association)OMI (Ocean Management Incorporated)OMCO (Ocean Mineral Company)
Established1974197419751977
Mining1975–1976; collector model test at depth of 5000 m (Shaw [9])1970; mining system test at the depth of 800 m1976; collector test in deep sea1978; mining system test in shallower water
Test1978; lift up test on-land1978; mining pilot test in the DOMES site C (4400 m) and lift up 500 t nodules1978; pilot miner test in the DOMES A(5000–5200 m) and lift up 500 t nodules (Chung [163])1979; mining system test in deep sea (Xiao [164])
TargetNi, Co, CuNi, Cu, Co, MnNi, Cu, Co-
Disclaimer/Publisher’s Note: The statements, opinions and data contained in all publications are solely those of the individual author(s) and contributor(s) and not of MDPI and/or the editor(s). MDPI and/or the editor(s) disclaim responsibility for any injury to people or property resulting from any ideas, methods, instructions or products referred to in the content.

