
The Influence of Snow Cover Variability on the Runoff in Syr Darya Headwater Catchments between 2000 and 2022 Based on the Analysis of Remote Sensing Time Series

Abstract
:1. Introduction
Theoretical Background
- To analyze which aspects of snow cover phenology influence the runoff behavior in the Syr Darya headwaters.
- To analyze what trends in snow cover and runoff behavior exist.
- To give an assessment of future runoff changes based on snow cover variability and trends.
2. Materials and Methods
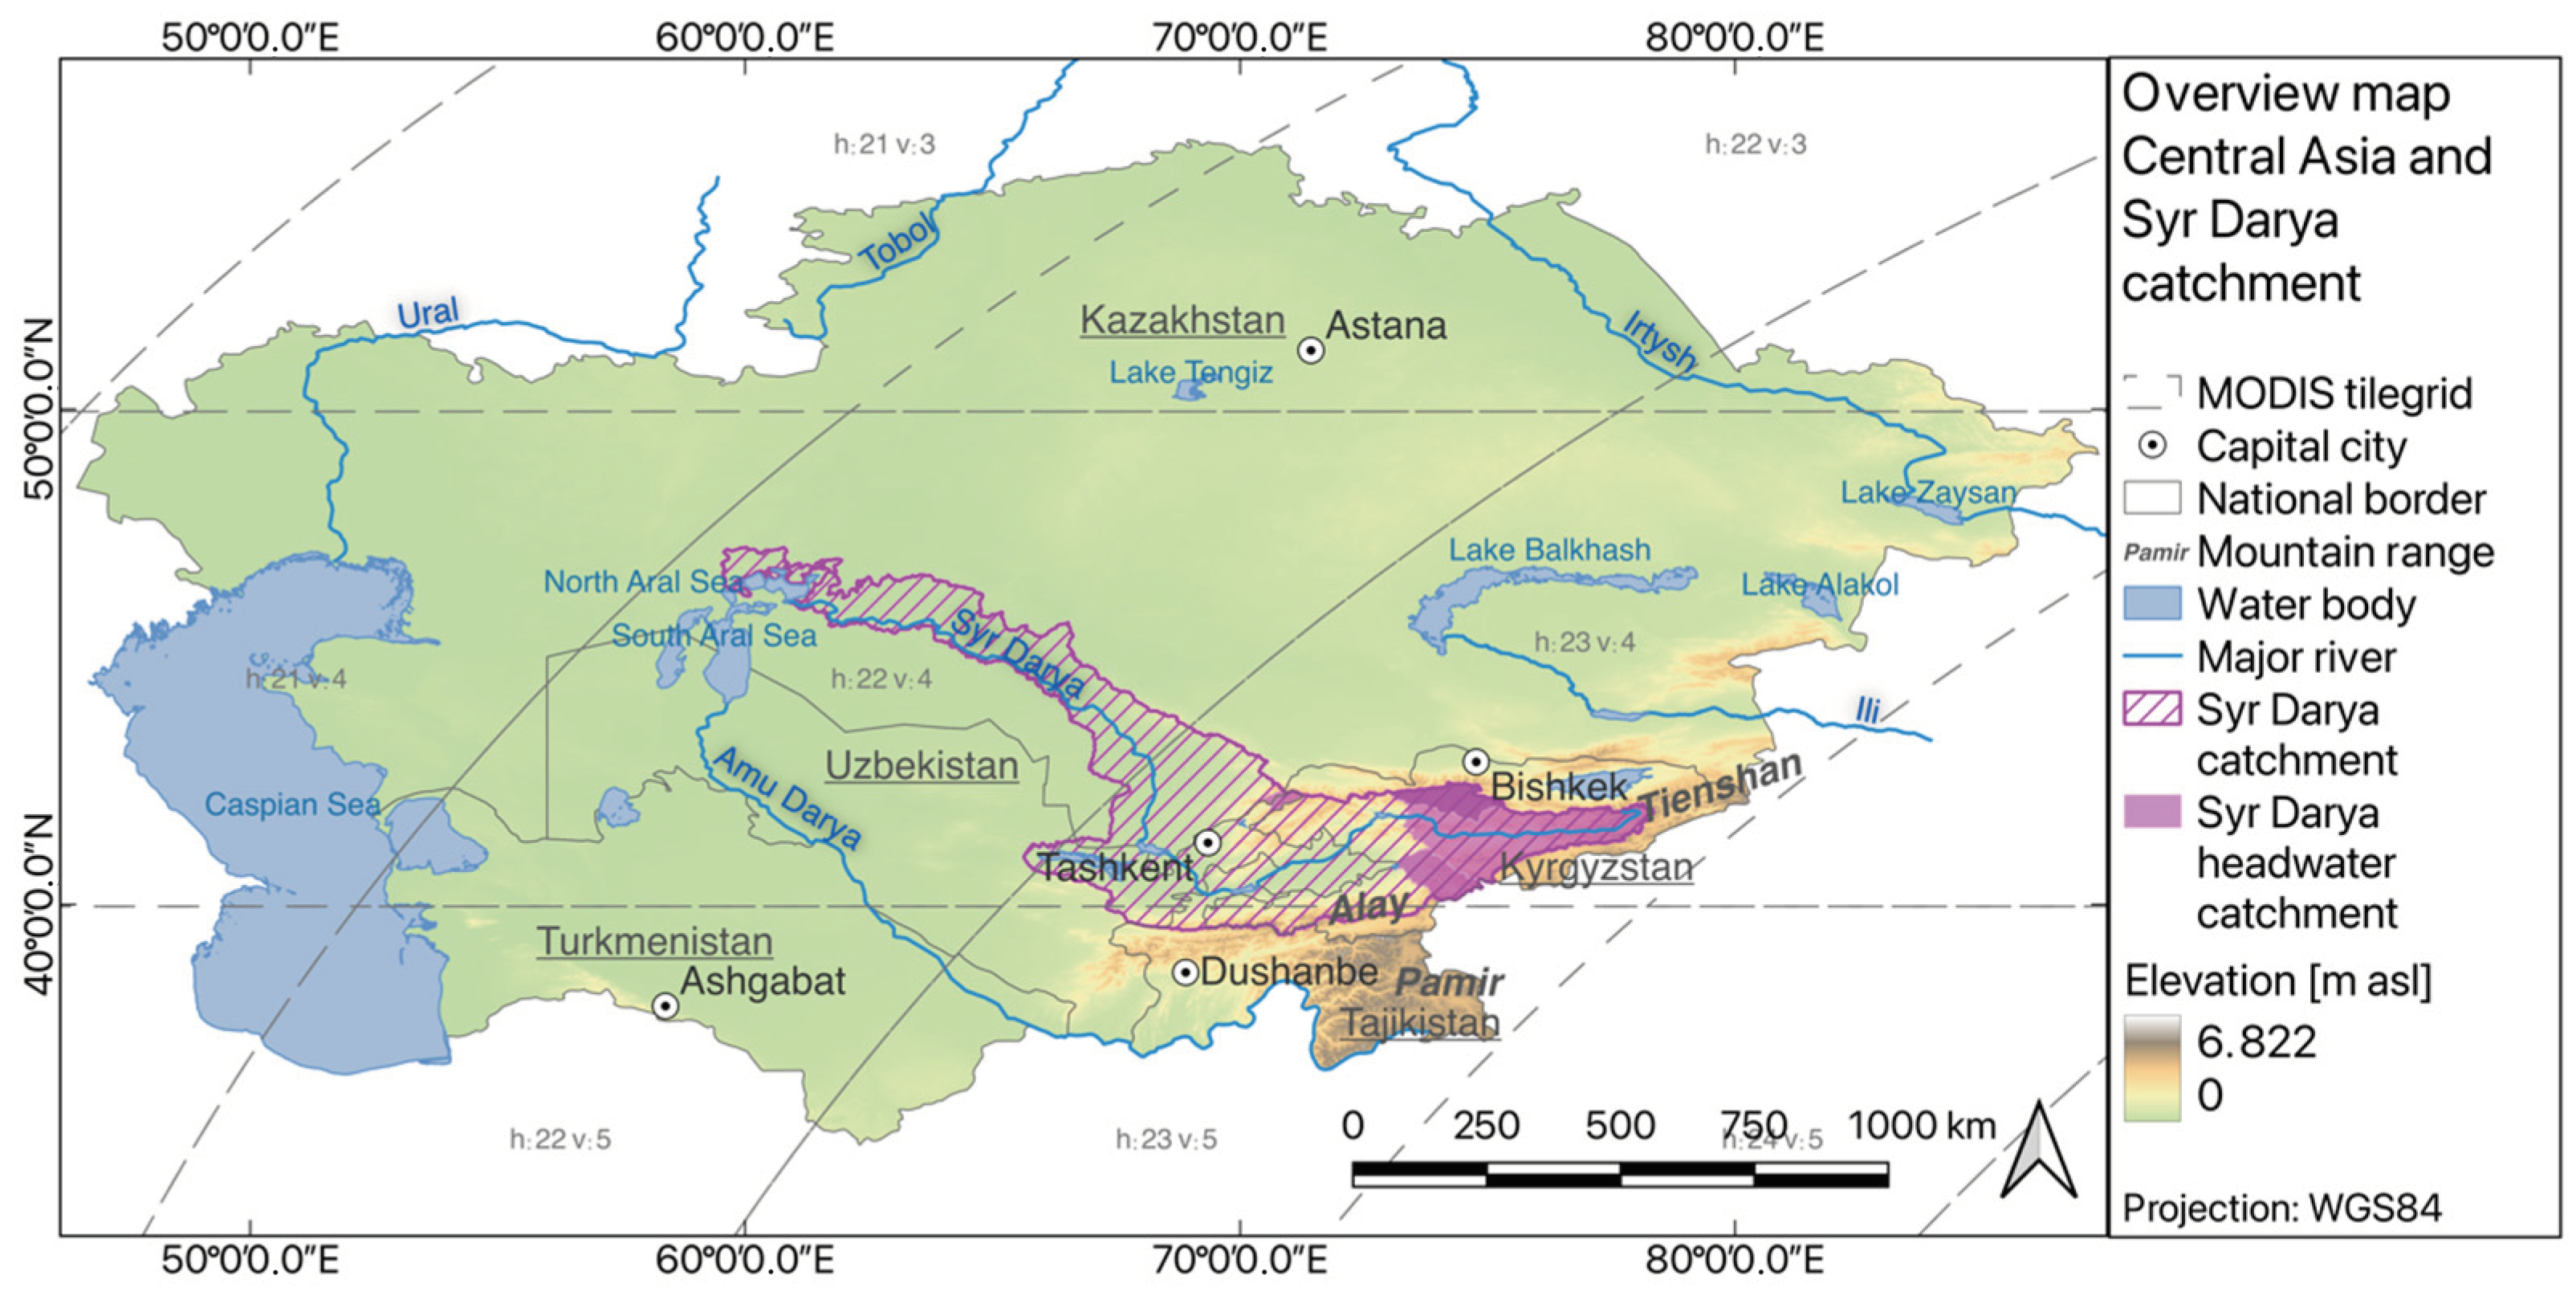
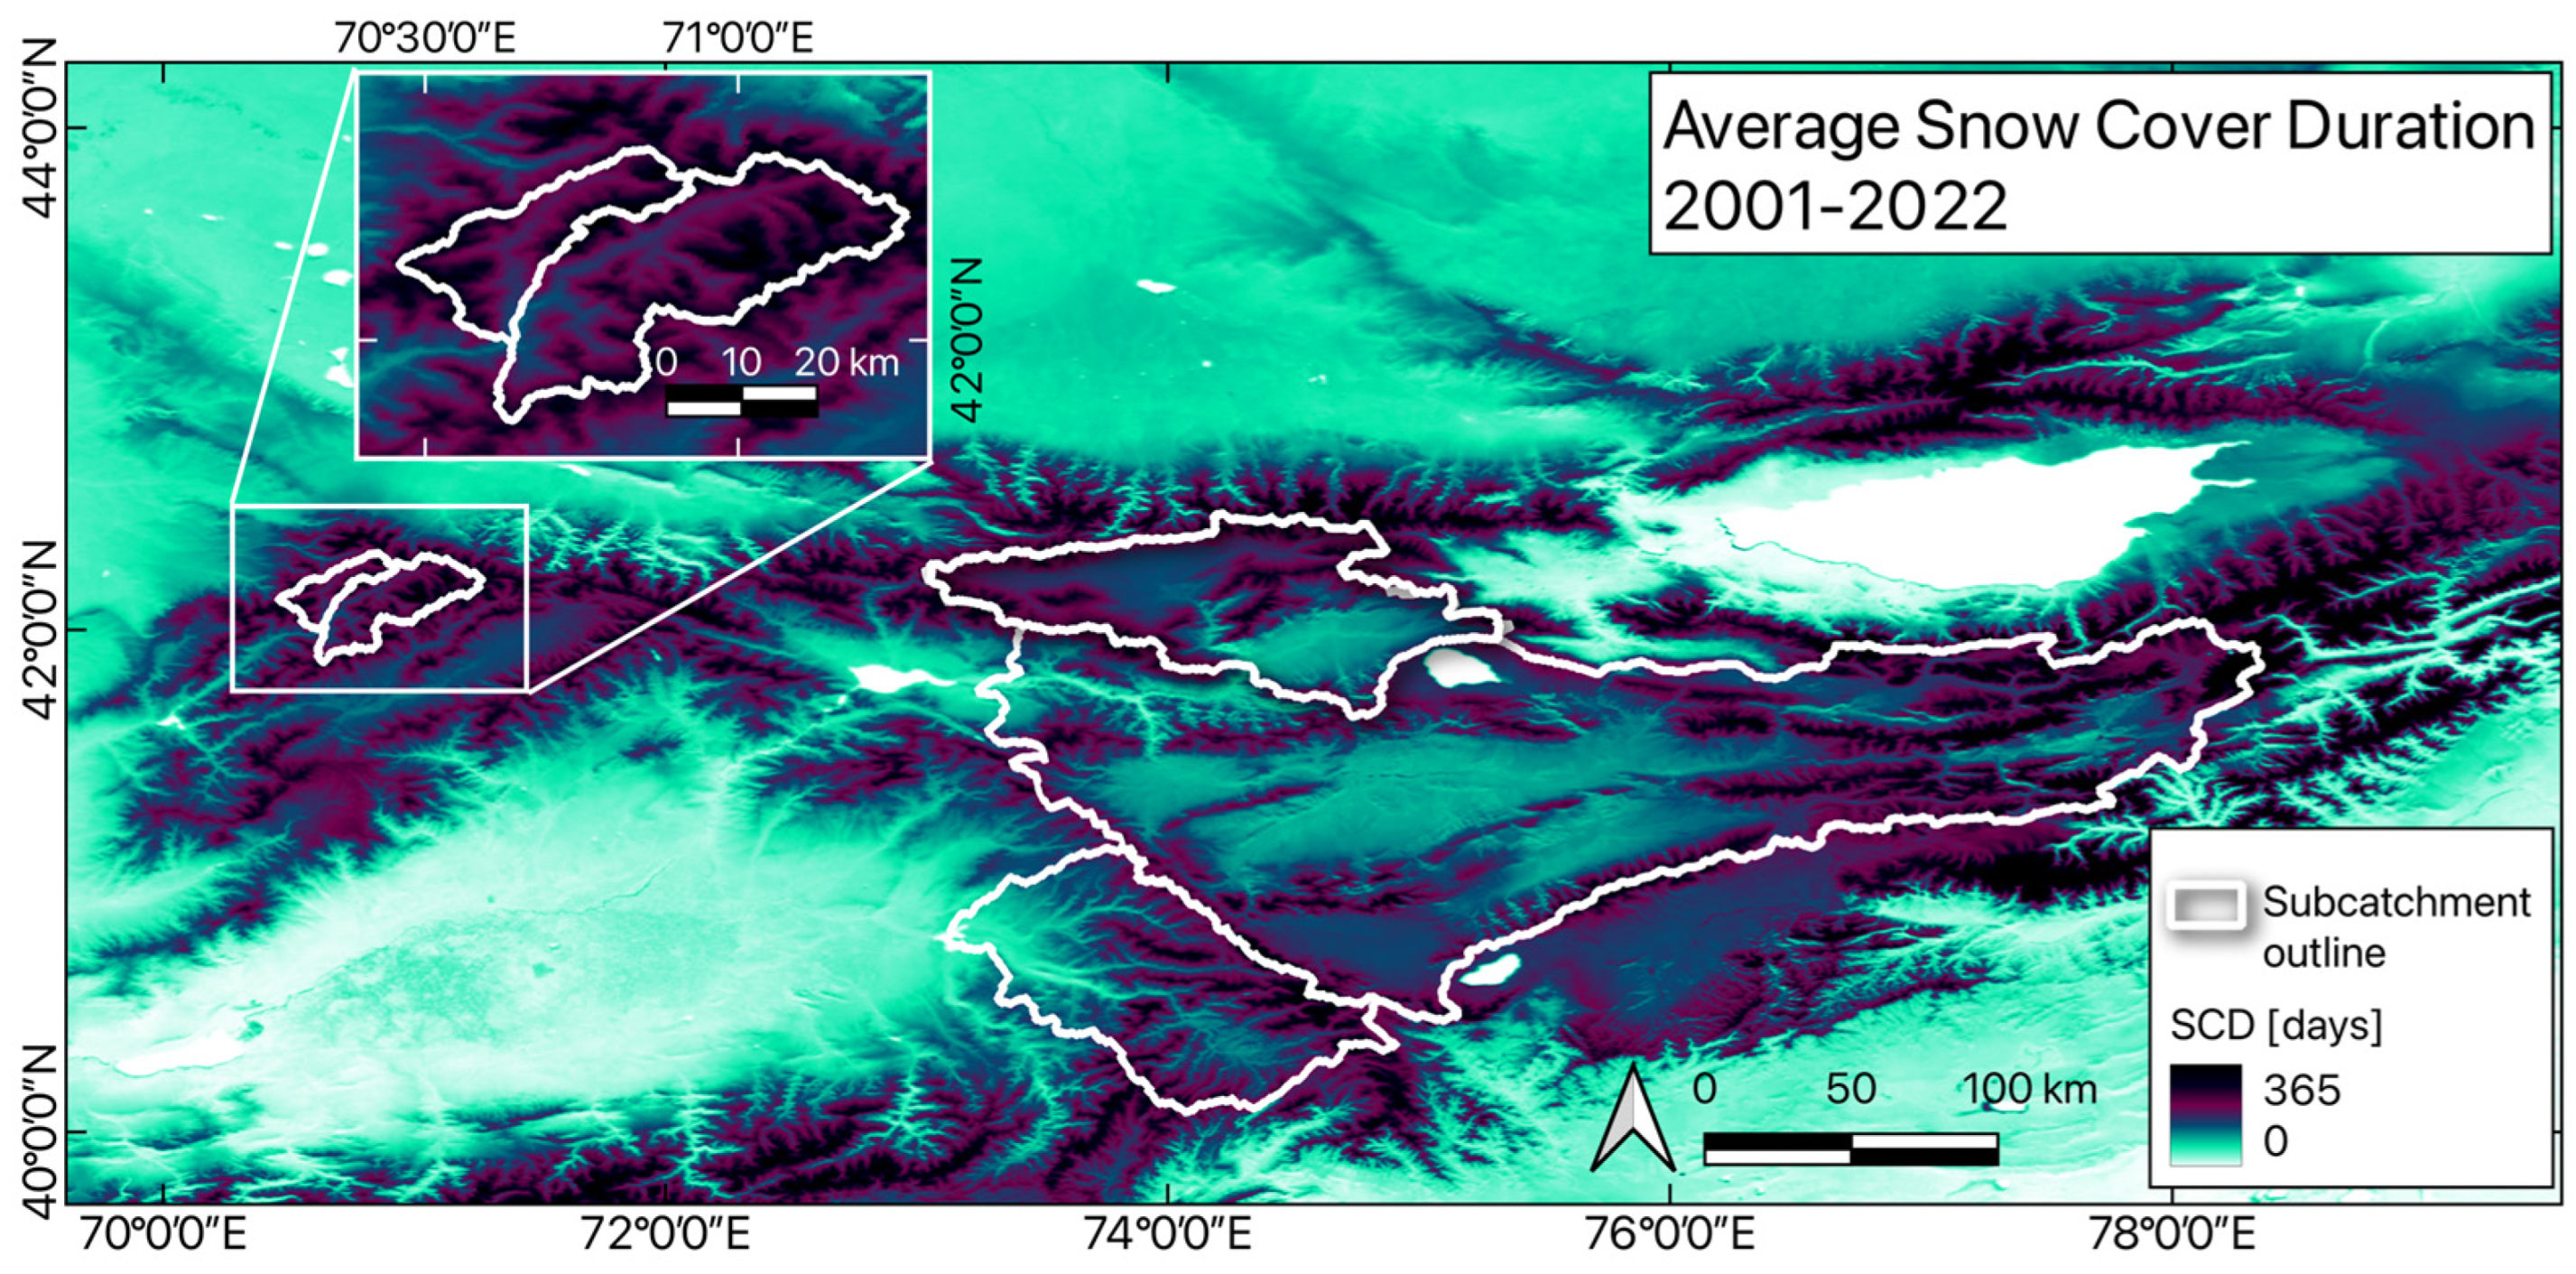
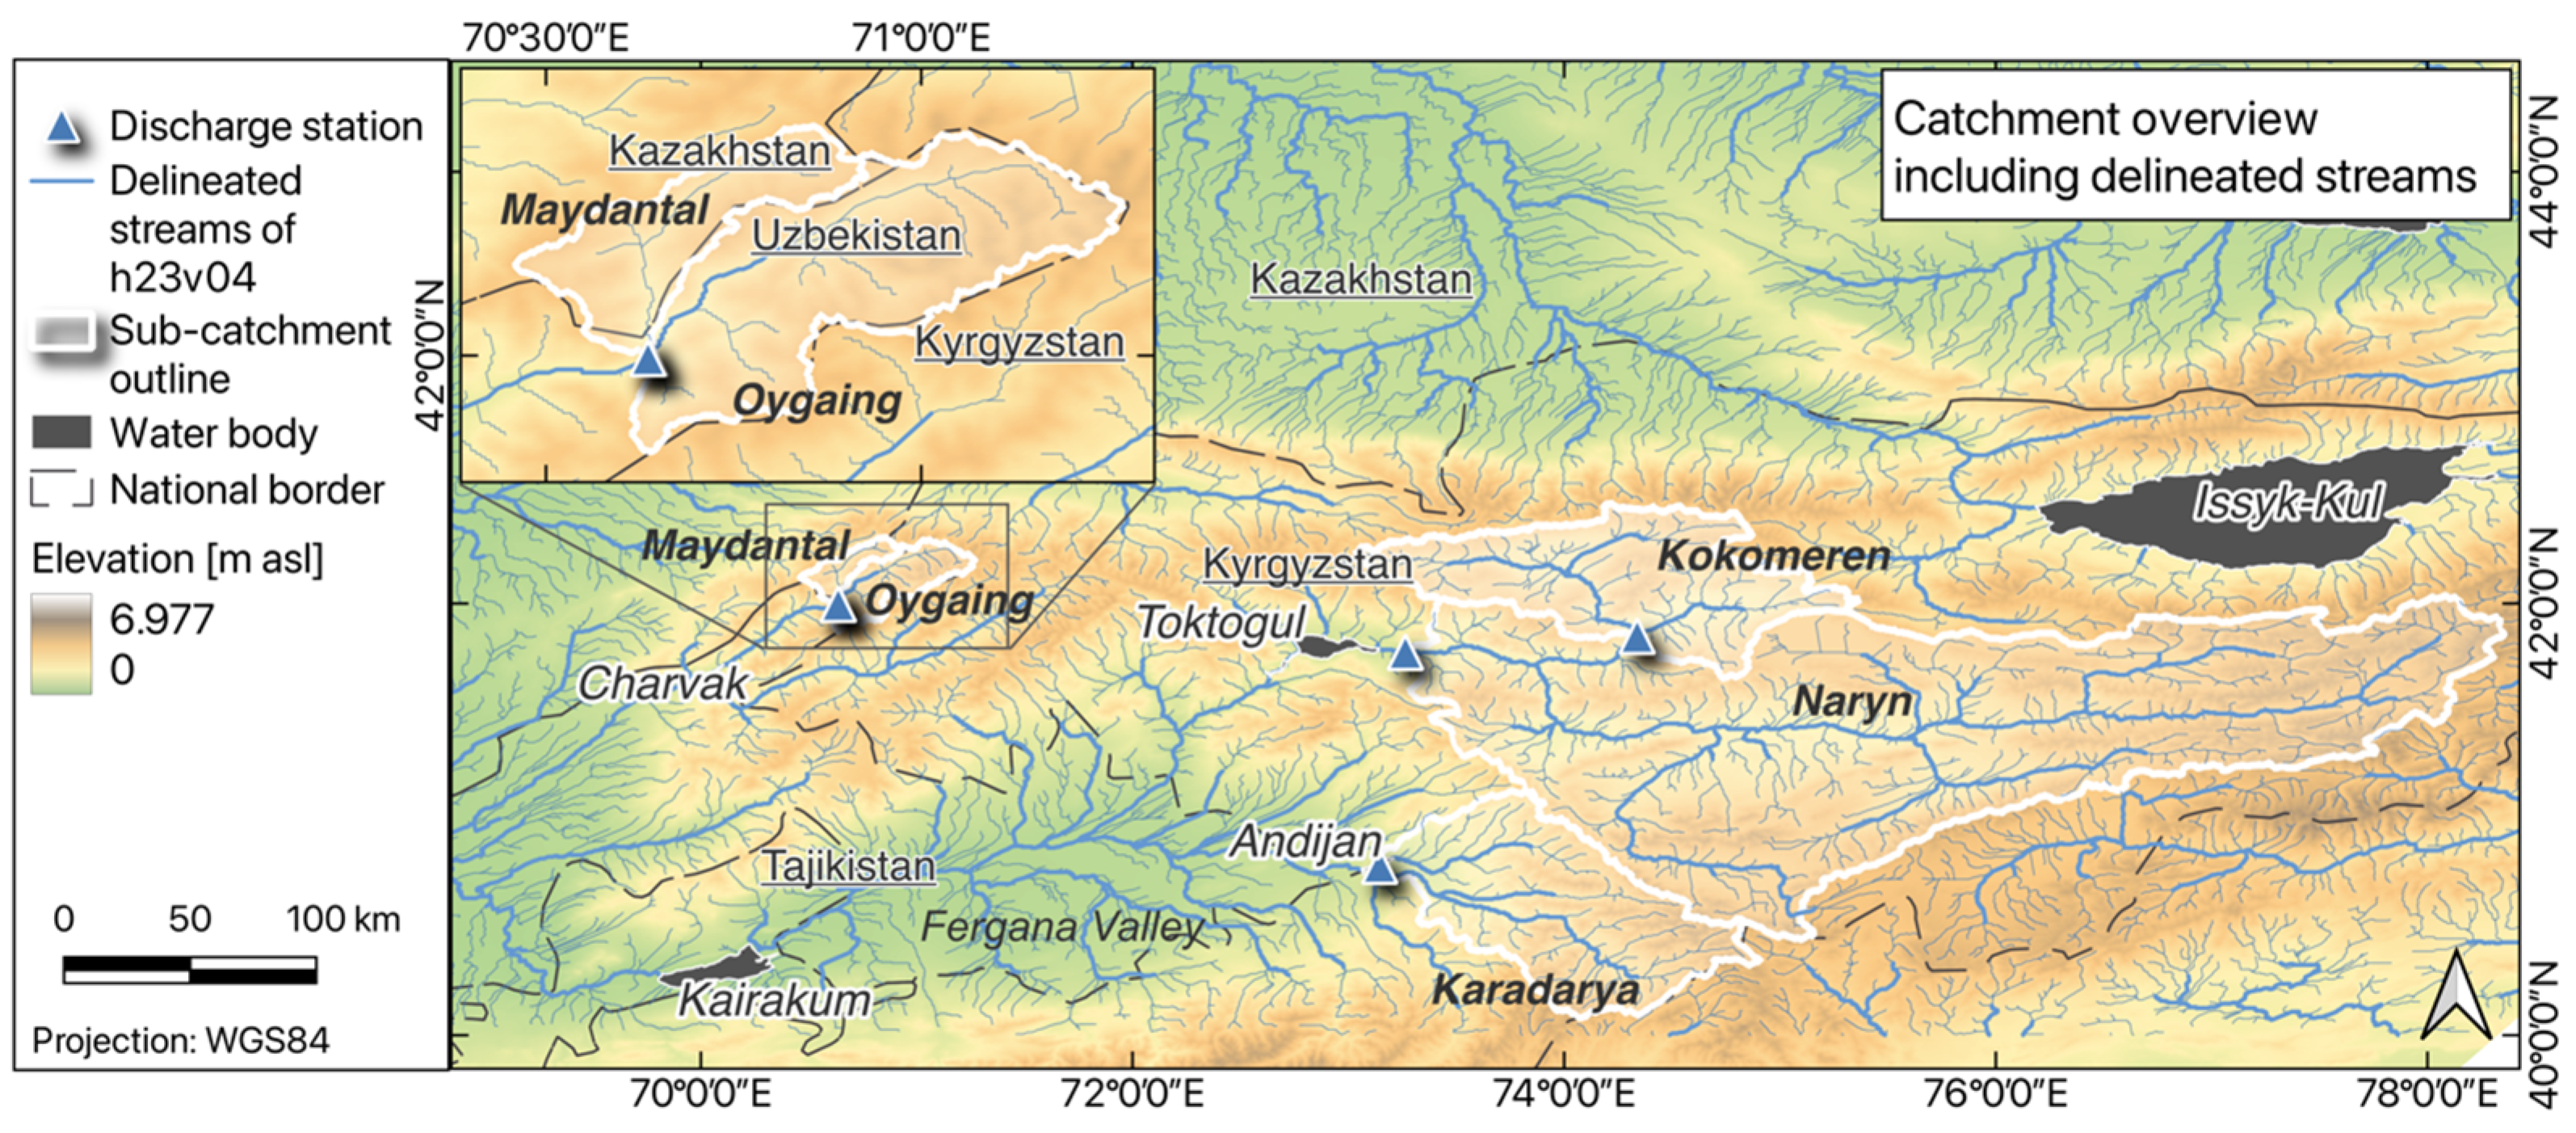
2.1. Study Area
2.2. Snow Cover
2.3. Hydrology
2.4. Statistics
2.4.1. Pearson’s Correlation
2.4.2. Mann–Kendall Trend Test
3. Results
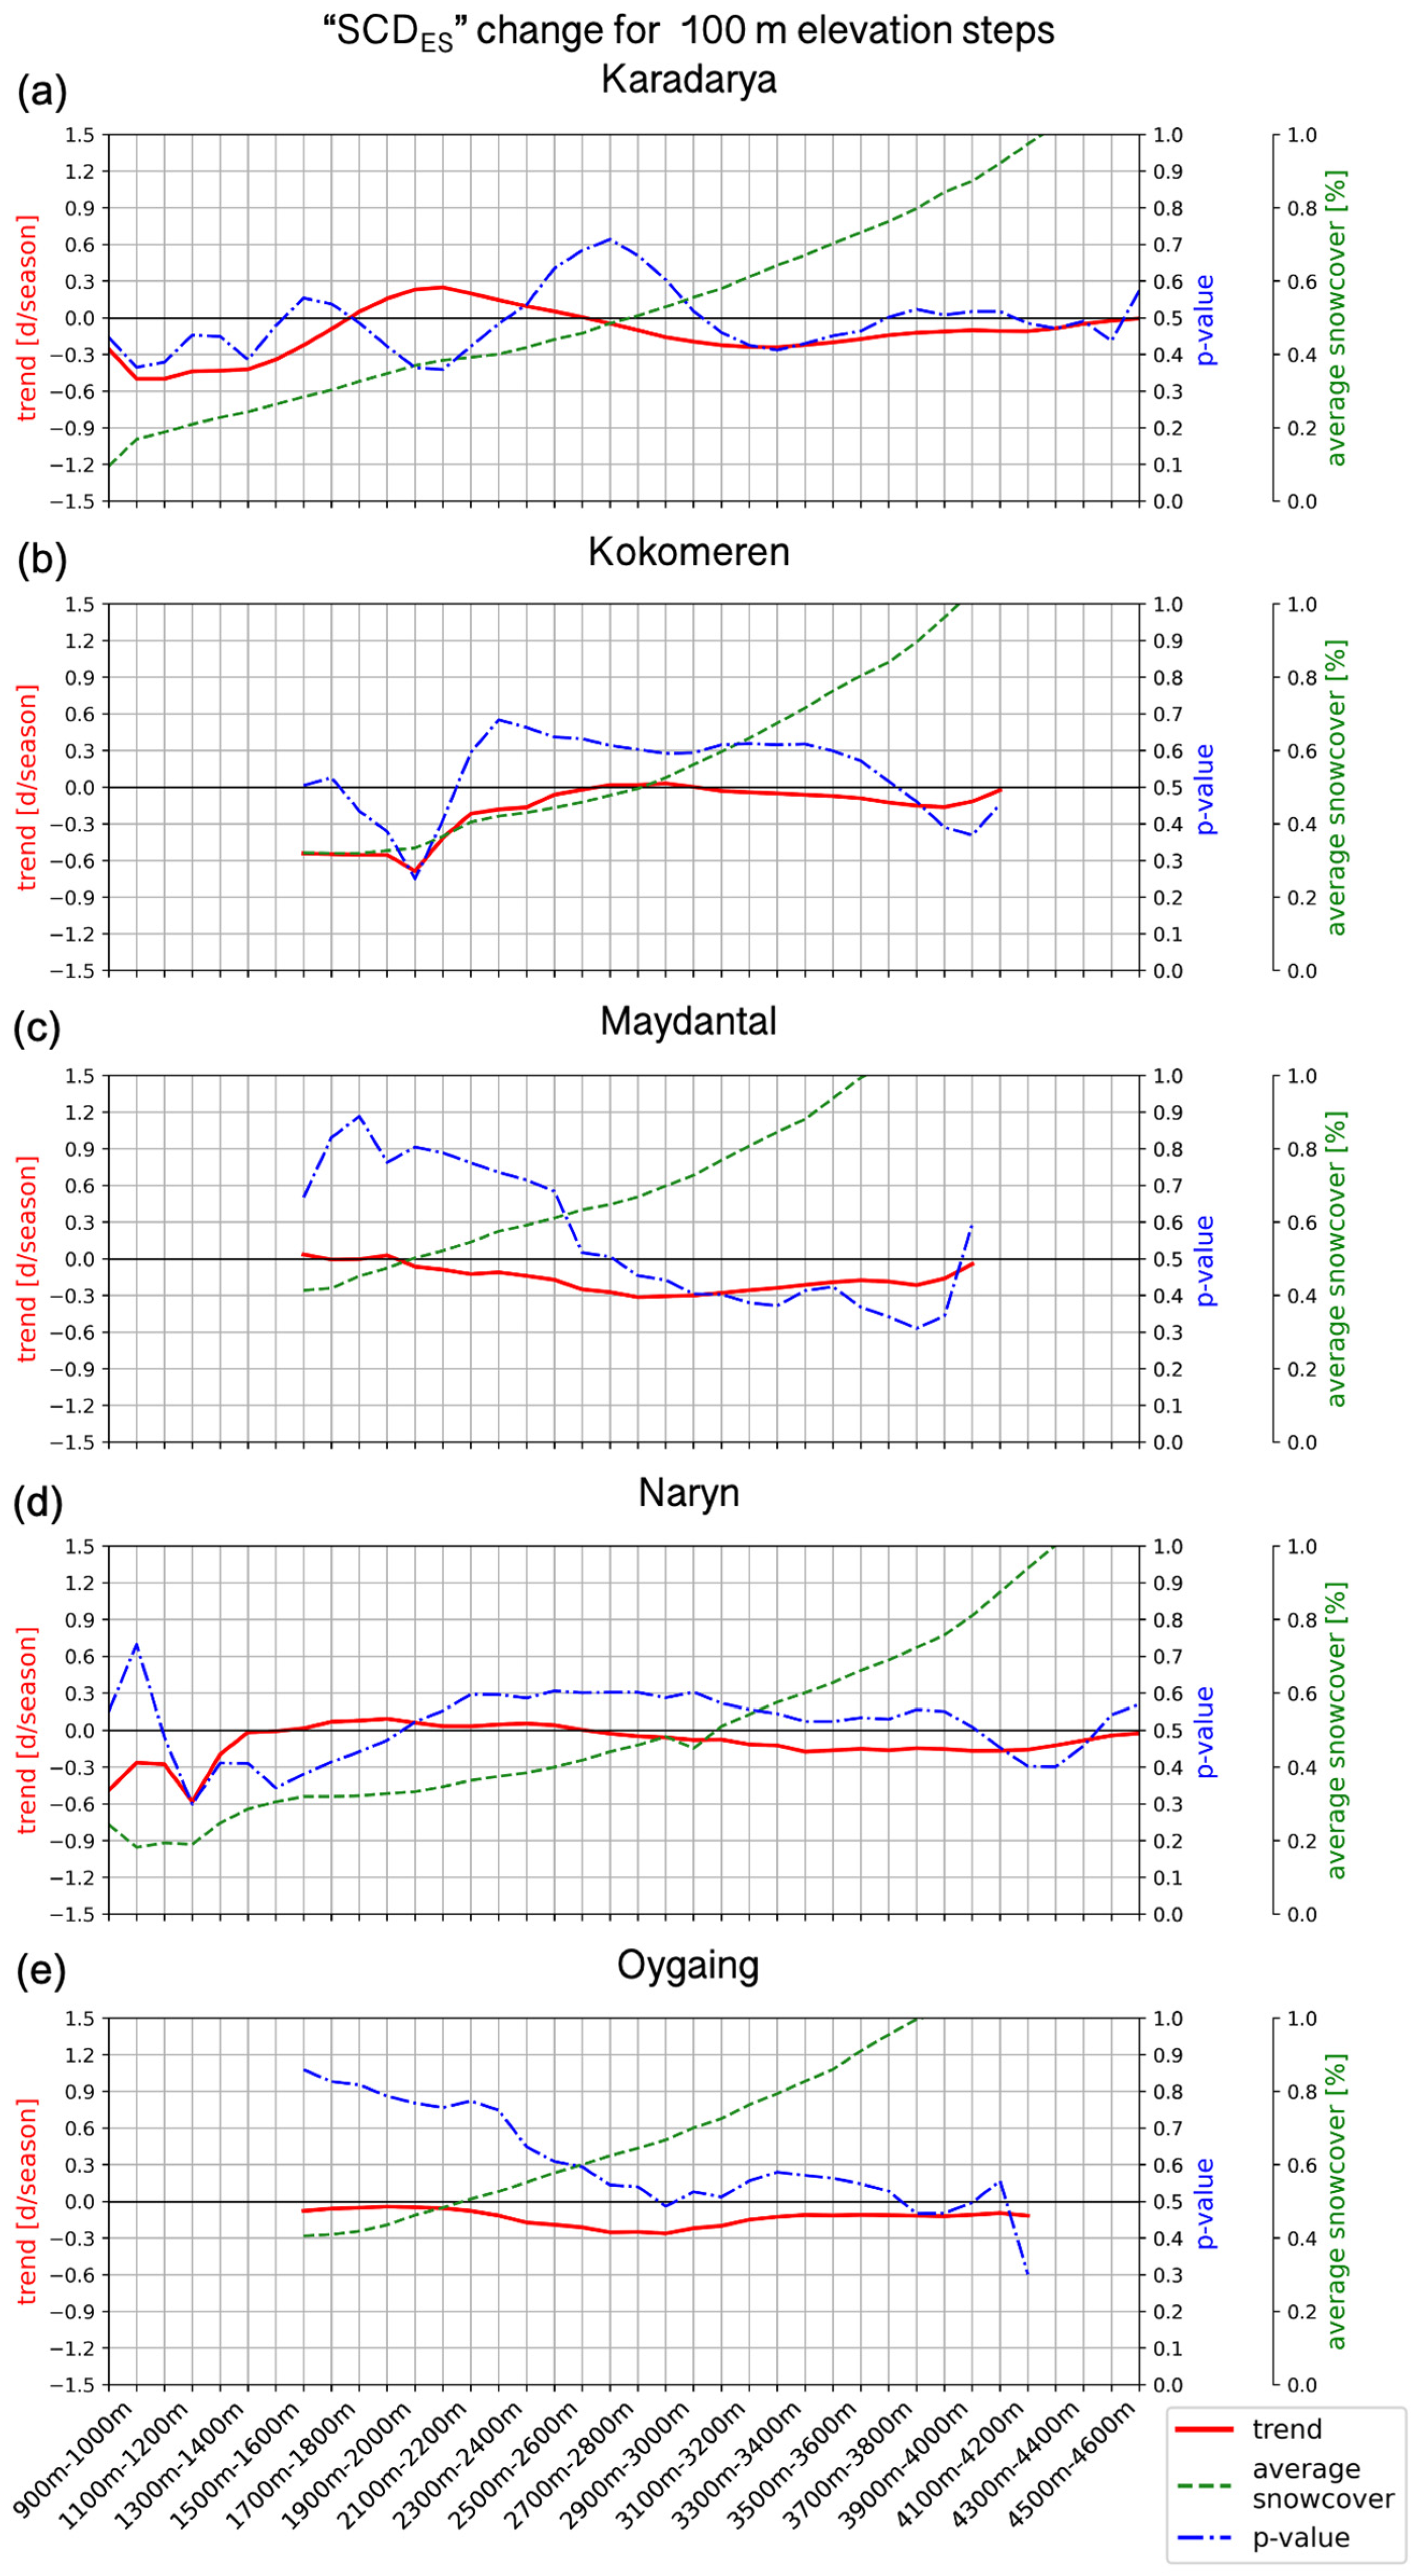
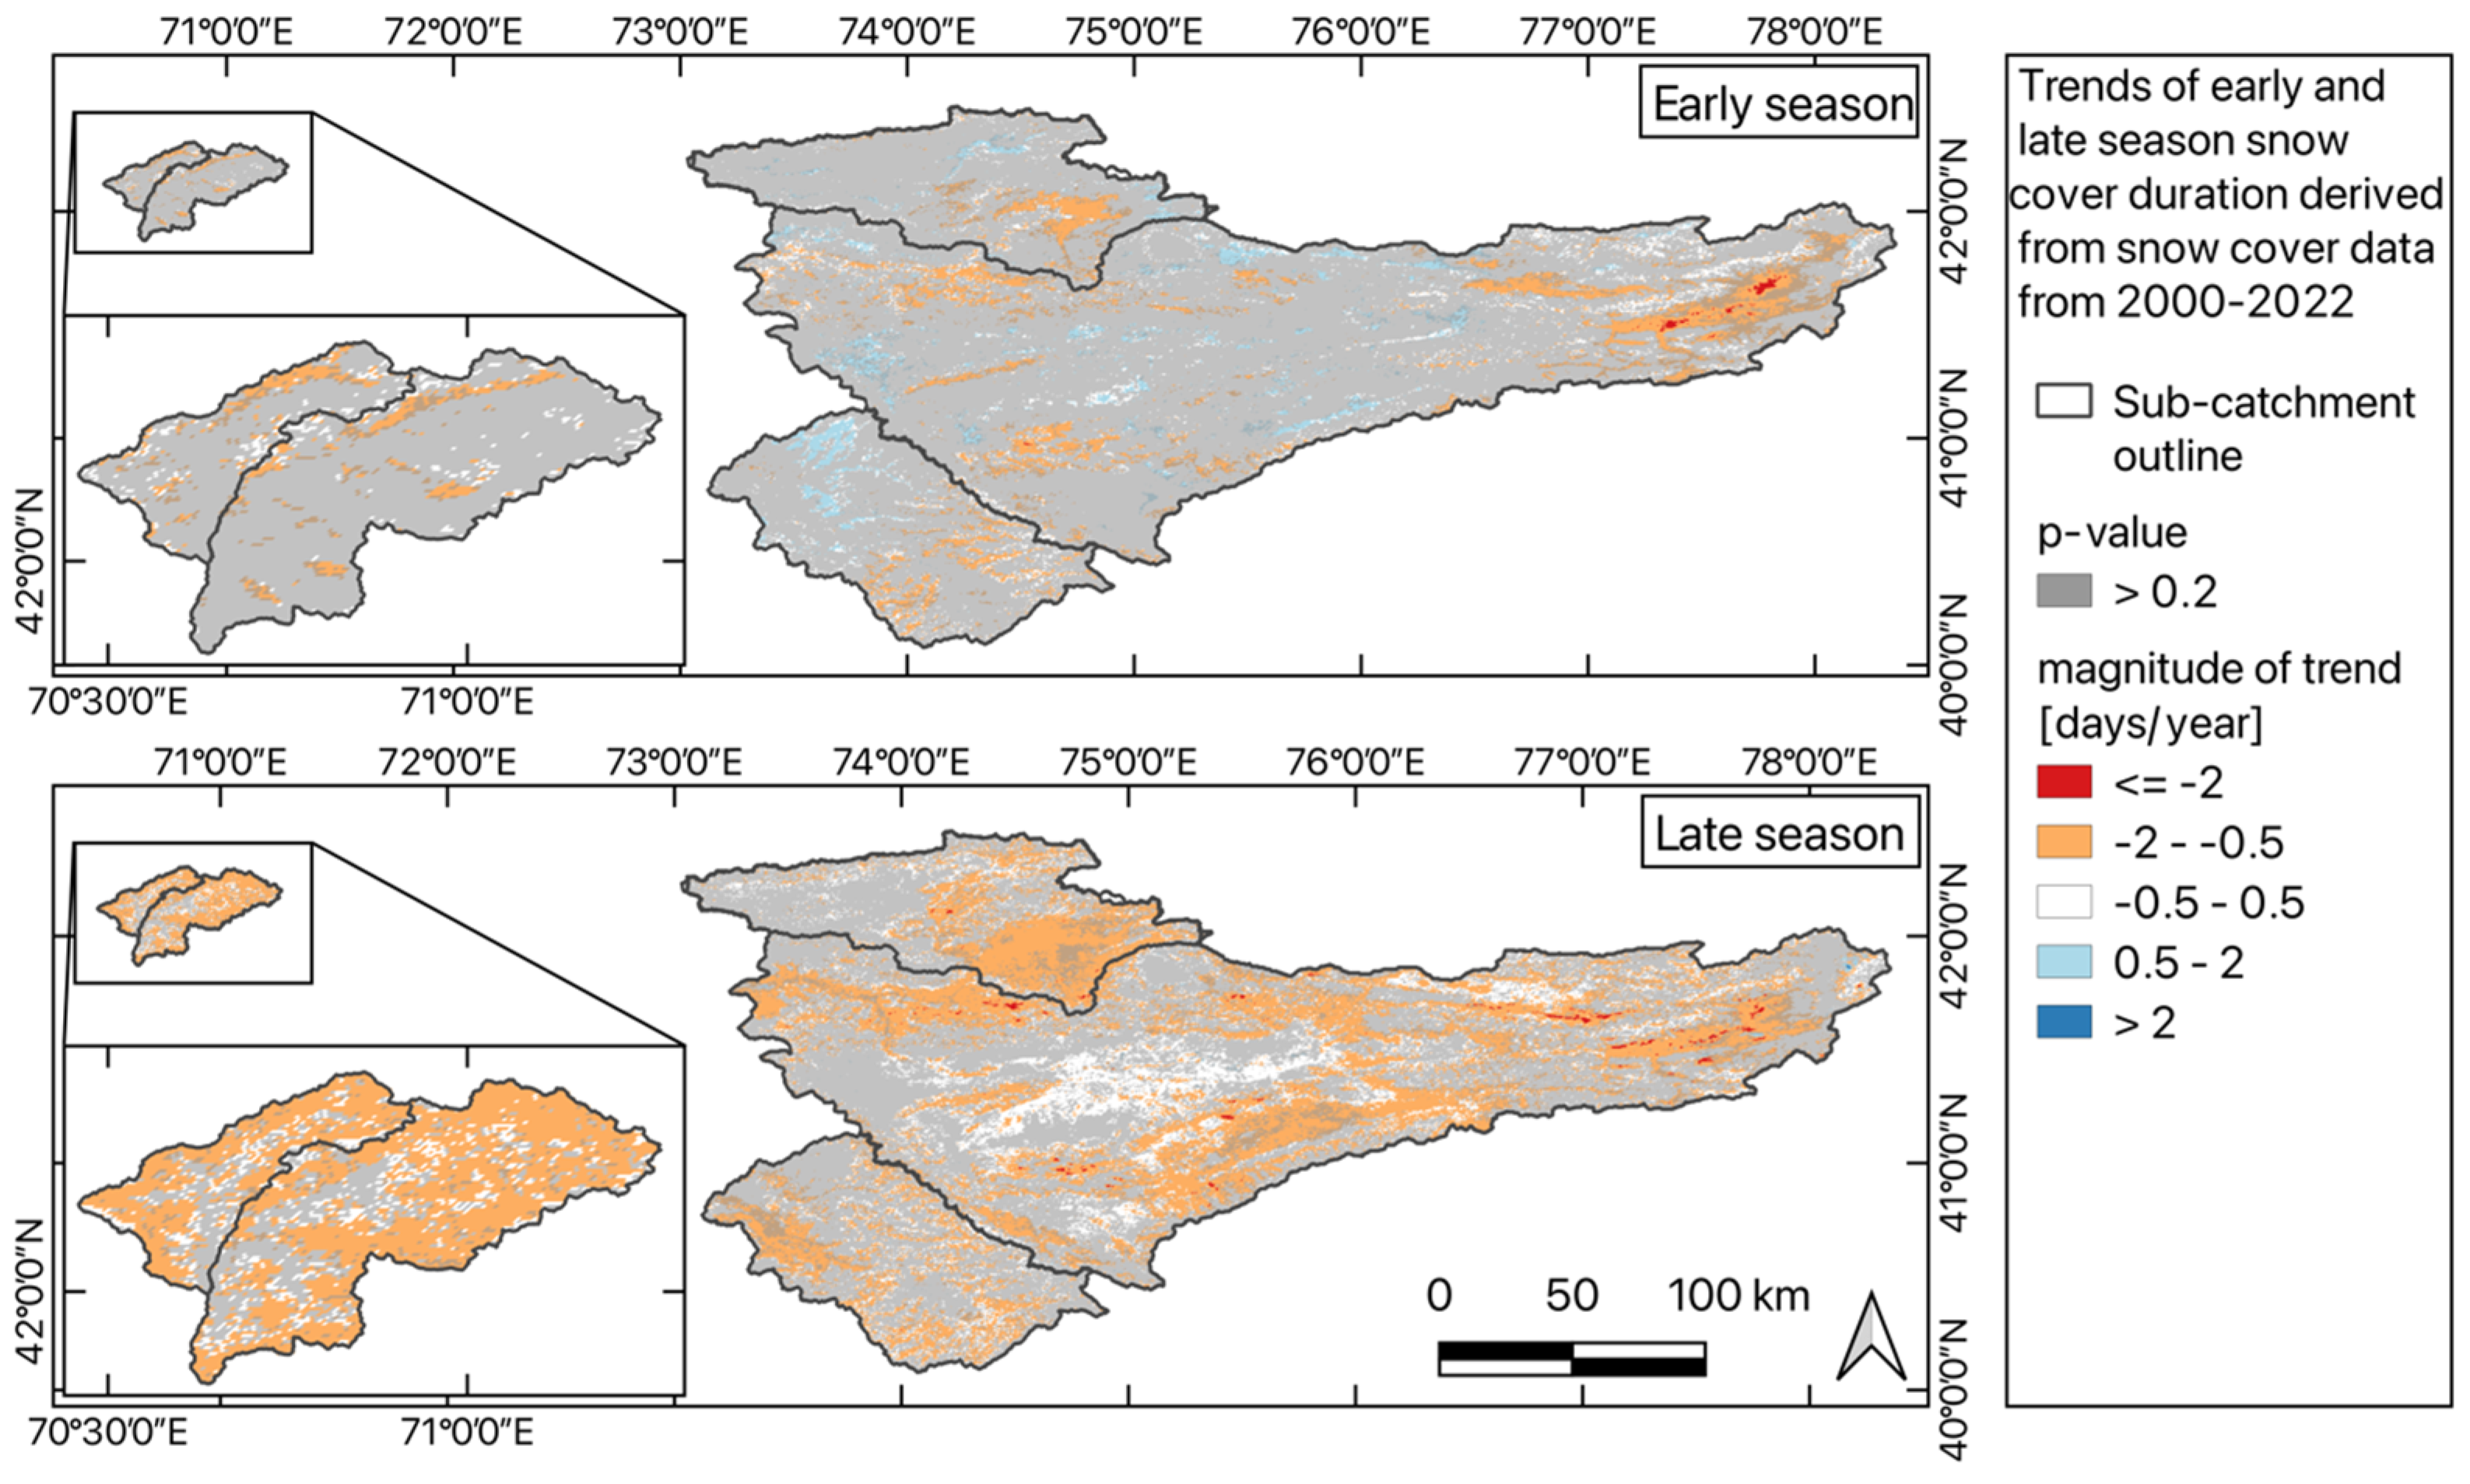
3.1. Snow Cover
3.2. Hydrology
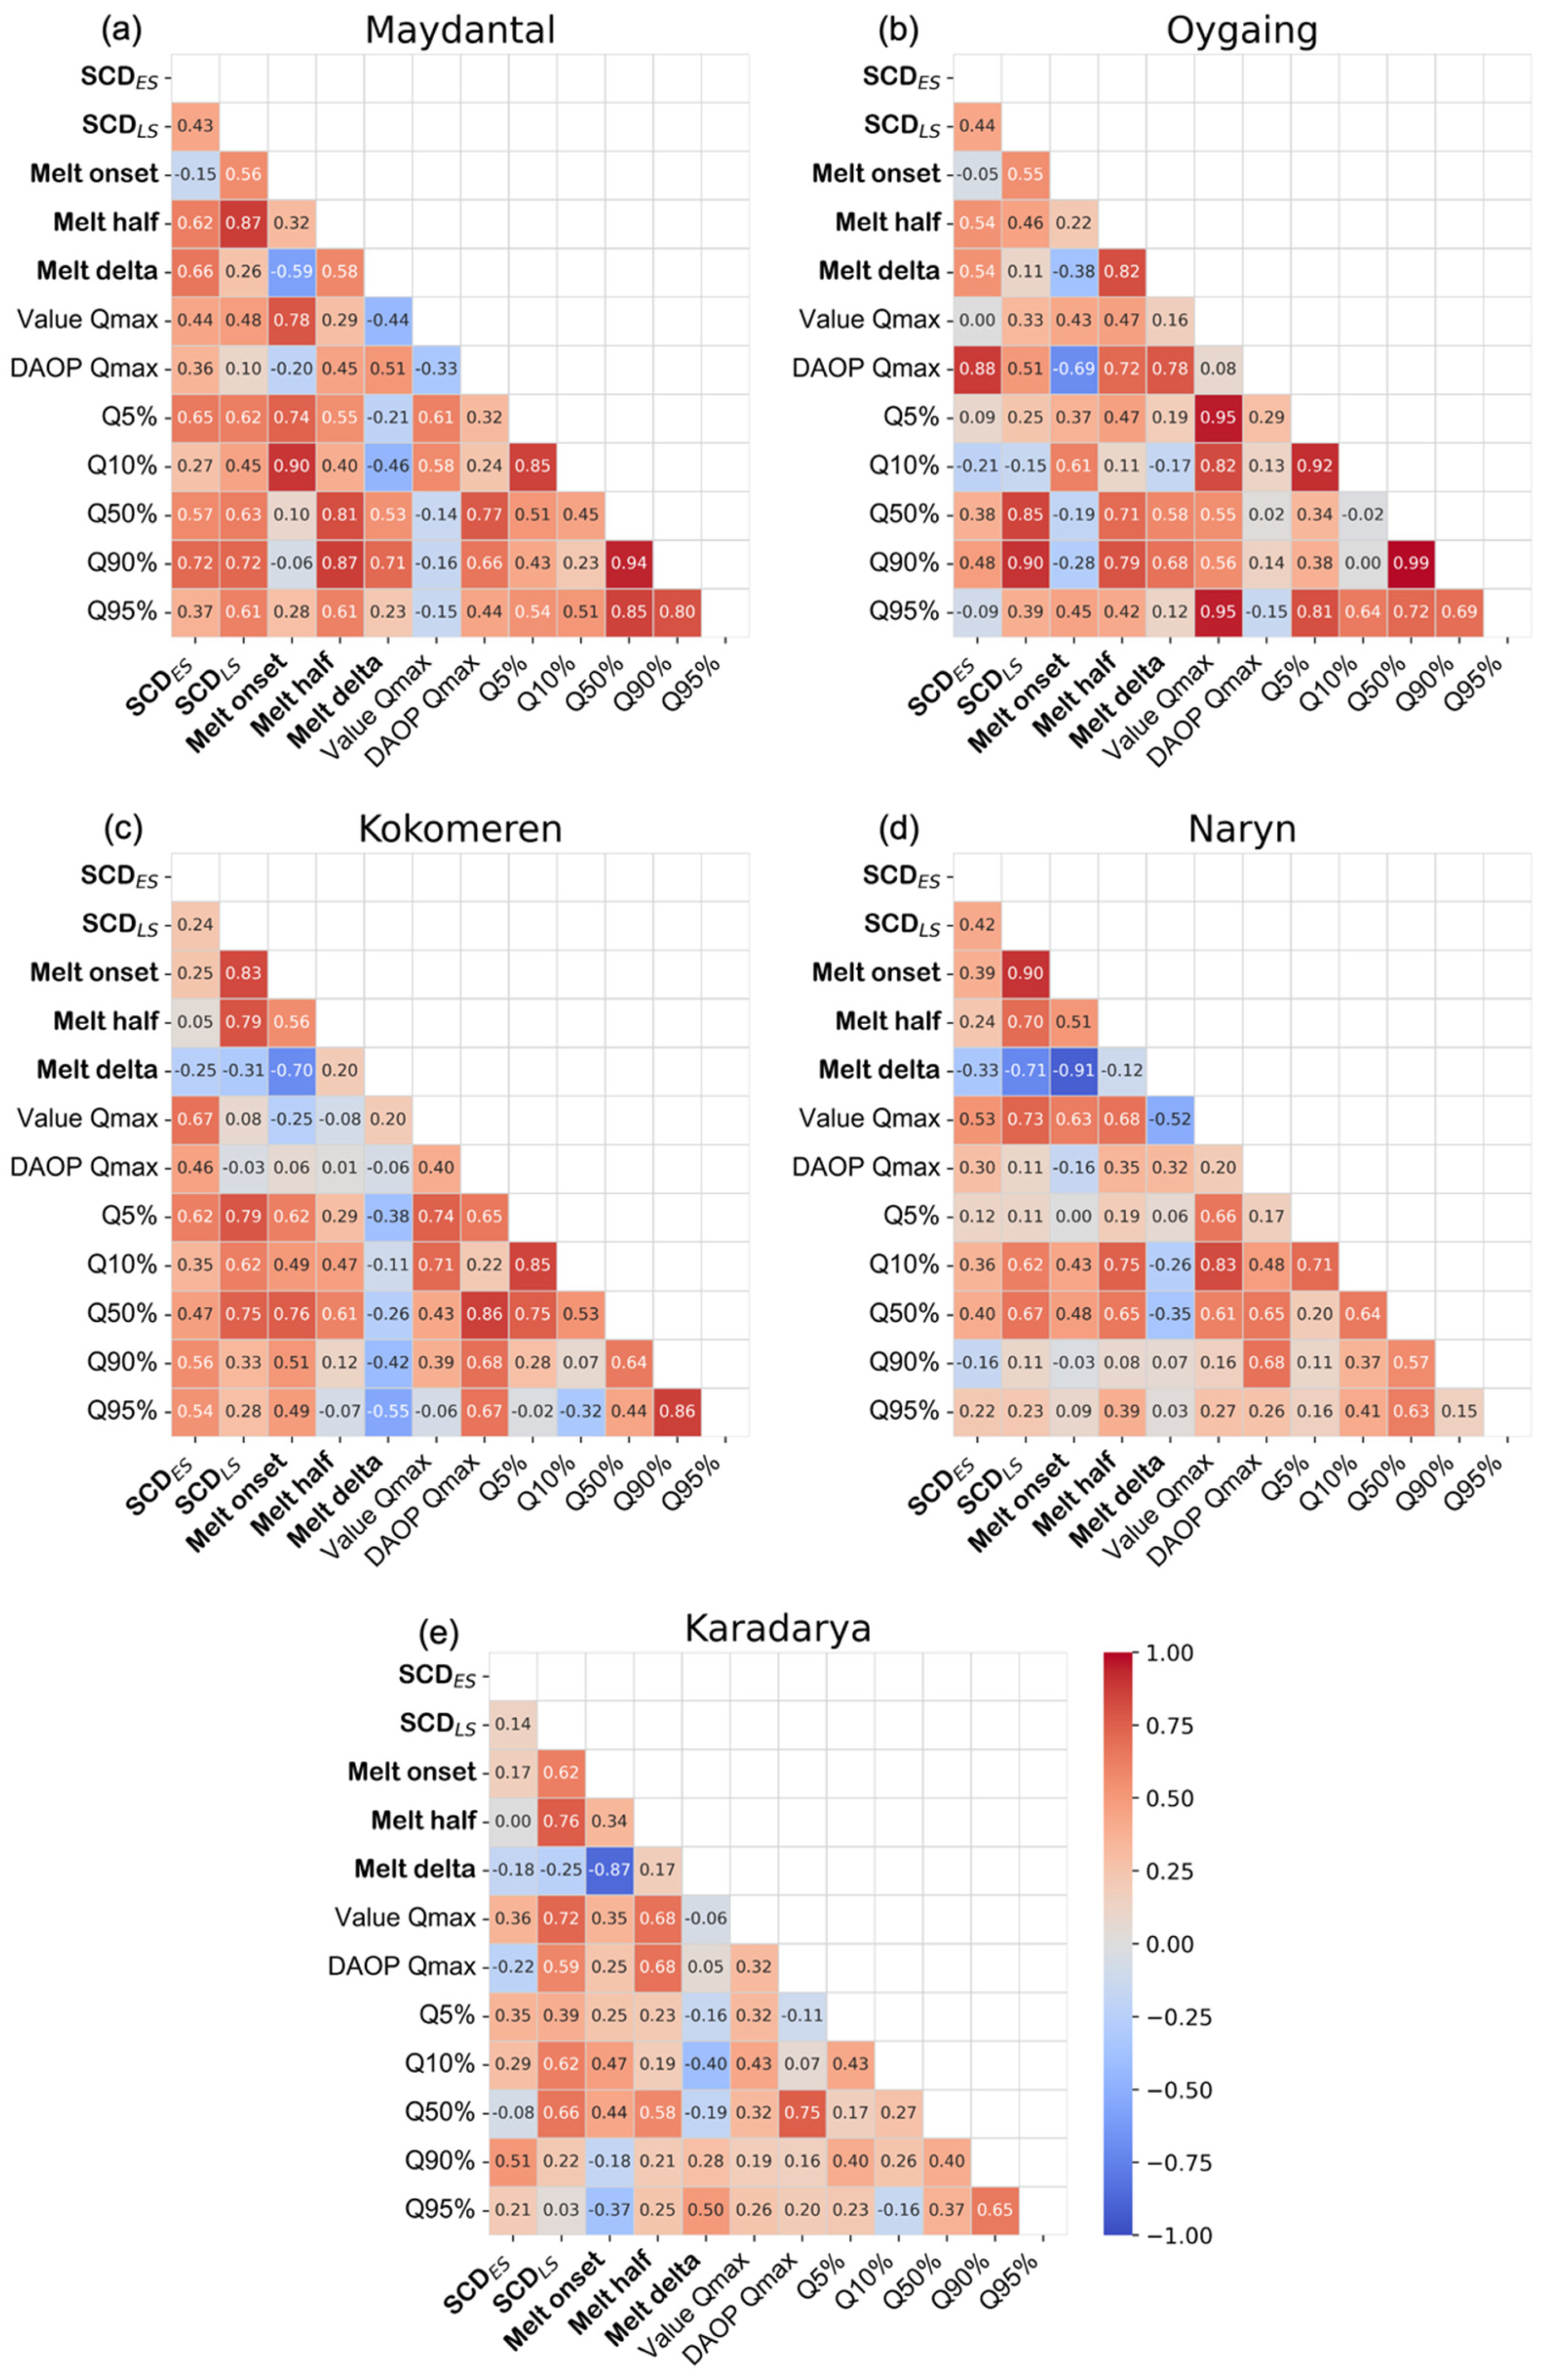
3.3. Pearson’s Correlation
4. Discussion
4.1. Relationship between Snow and Runoff Parameters
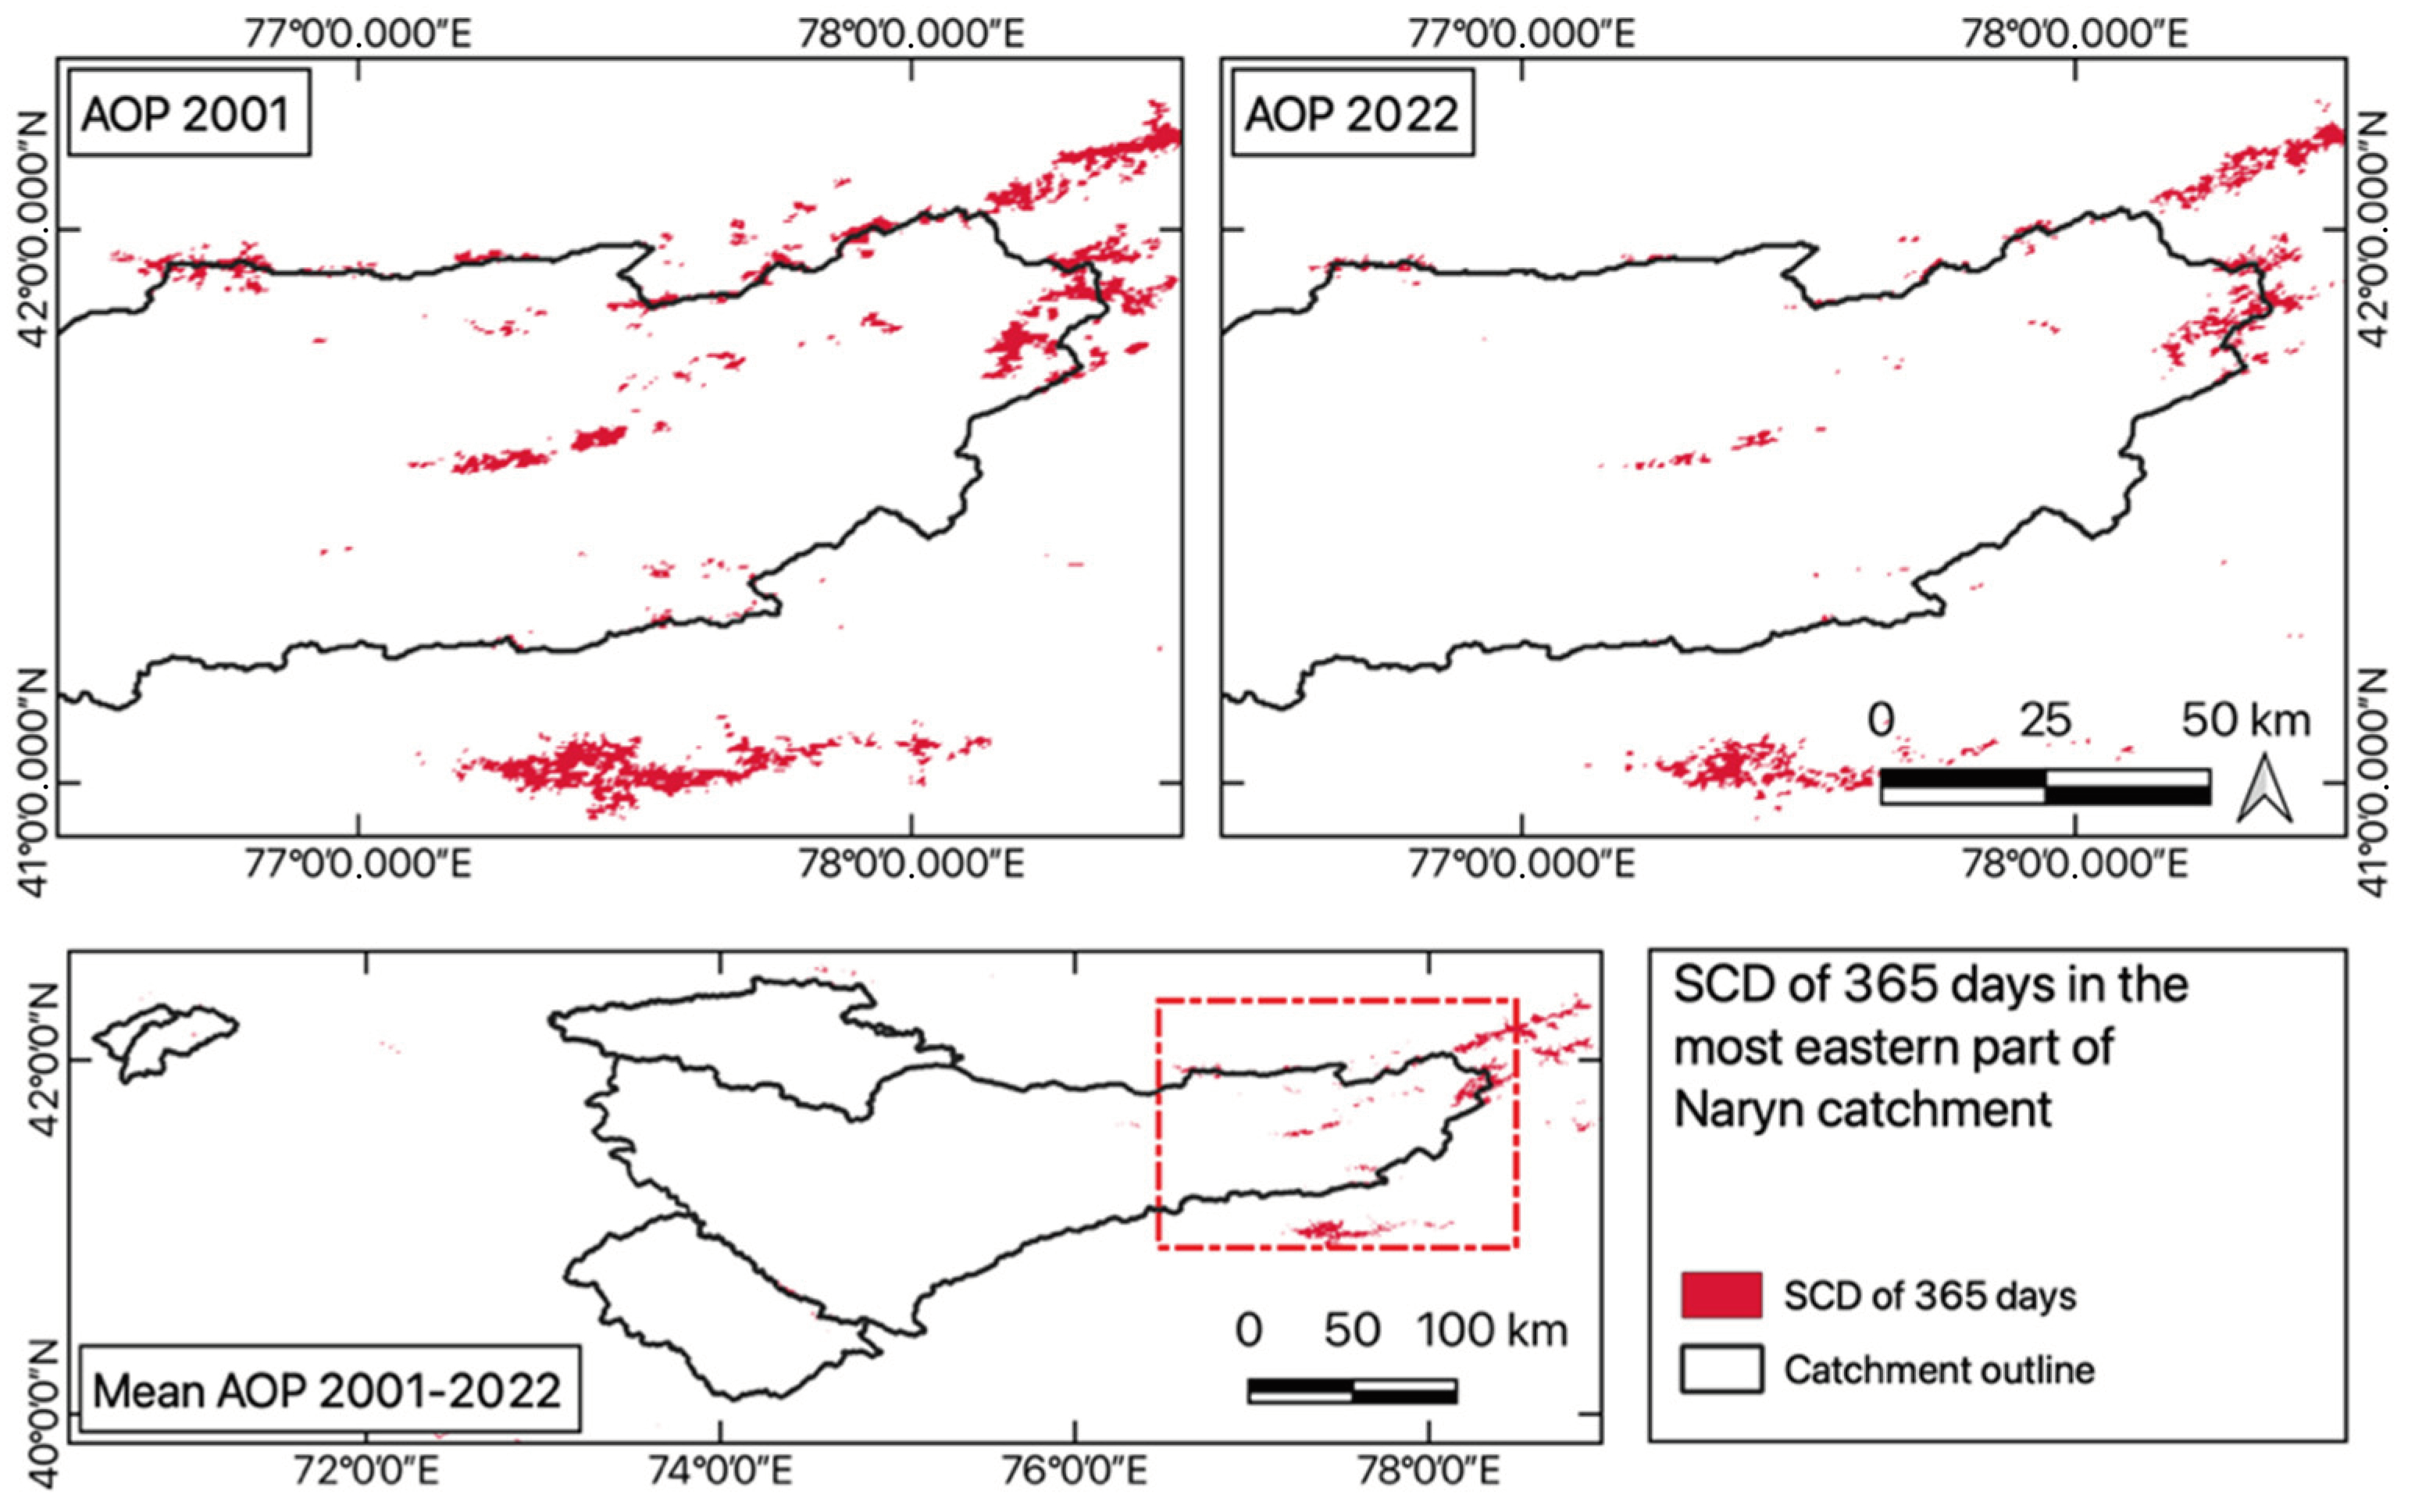
4.2. Trends
4.3. Outlook on Future Developments
4.4. Limitations
- (1)
- Runoff data do not fulfill the needed requirements of homogenous long-term datasets [47]. Especially the data from SDSS stations only covered a few years and included data gaps in the spring runoff period. Limited data availability reduced the possibility of putting extreme snow events in relation to runoff information for some years.
- (2)
- An analysis of trends within hydrometeorological data requires long datasets. Time series of only a few decades of snow cover data may be influenced by short-term trends, so that long-term developments are concealed [65].
- (3)
- By attempting to link satellite-derived snow cover information with spring runoff measures and determine runoff timing from snow cover alone, important factors were not included. As runoff behavior cannot be reduced to a simple function of snow cover change, trends and relationships cannot be interpreted without additional information on temperature, precipitation, land cover, soil type, glaciation, relief, exposition, and slope, which have consequences on snow distribution and melt as well as runoff behavior [30]. Limitations also stem from the study design. The defined time frame of spring runoff poses an oversimplification of “complex runoff distributions” that respond to “highly variable spring weather” [47]. An alternative method could be defining the spring flood date for every year individually [29]. Furthermore, the influence of glacier melt is difficult to quantify because late summer months are not included in the spring runoff time frame.
- (4)
- The use of multispectral satellite data limits the observations to snow extent. None of the used parameters measured snow depth so changes in SWE remain uncertain.
- (5)
- The construction of the Kambarata II dam in 2007–2010 may have distorted the natural inflow into the Toktogul reservoir of the Naryn catchment.
5. Conclusions
Author Contributions
Funding
Data Availability Statement
Conflicts of Interest
Appendix A

Appendix B

| AOP | Karadarya | Kokomeren | Maydantal | Naryn | Oygaing | |||||
|---|---|---|---|---|---|---|---|---|---|---|
| SCDES | SCDLS | SCDES | SCDLS | SCDES | SCDLS | SCDES | SCDLS | SCDES | SCDLS | |
| 2001 | 77.47 | 115.39 | 76.7 | 121.59 | 95.6 | 167.21 | 72.01 | 116.18 | 94.97 | 163.42 |
| 2002 | 62.97 | 122.32 | 69.04 | 134.84 | 95.07 | 191.76 | 67.97 | 128.4 | 94.21 | 185.45 |
| 2003 | 56.44 | 131.84 | 53.97 | 144.11 | 76.33 | 186.81 | 58.08 | 141.12 | 74.78 | 180.99 |
| 2004 | 65.5 | 121.02 | 65.79 | 133.14 | 82.61 | 174.68 | 65.6 | 128.71 | 80.78 | 171.04 |
| 2005 | 55.9 | 119.75 | 61.57 | 133.19 | 84.98 | 179.16 | 55.71 | 126.03 | 84.81 | 174.18 |
| 2006 | 56.99 | 120.16 | 55.83 | 128.49 | 71.9 | 167.35 | 52.65 | 123.22 | 73.46 | 163.07 |
| 2007 | 54.72 | 89.03 | 59.61 | 108.61 | 87.78 | 172.51 | 51.98 | 81.32 | 87.54 | 166.58 |
| 2008 | 44.77 | 113.37 | 52.44 | 119.35 | 70.13 | 153.49 | 49.98 | 115.42 | 66.23 | 149.94 |
| 2009 | 52.47 | 127.55 | 70.16 | 140.71 | 86.86 | 188.78 | 64.86 | 134.05 | 86.77 | 184.55 |
| 2010 | 60.65 | 134.3 | 60.68 | 135.93 | 77.84 | 185.33 | 61.9 | 136.55 | 77.05 | 177.39 |
| 2011 | 58.46 | 116.74 | 53.41 | 116.22 | 80.54 | 165.95 | 55.84 | 113.02 | 82.83 | 161.58 |
| 2012 | 65.14 | 123.82 | 69.11 | 126.7 | 79.65 | 172.1 | 69.73 | 122.99 | 80.68 | 166.86 |
| 2013 | 66.58 | 116.27 | 67.86 | 120.17 | 75.56 | 175.89 | 62.96 | 113.36 | 74.87 | 170.16 |
| 2014 | 51.25 | 118.23 | 56.58 | 126.26 | 72.06 | 174.38 | 50.67 | 110.44 | 73.55 | 166.11 |
| 2015 | 65.11 | 120.14 | 69.31 | 131.51 | 86.58 | 171.91 | 66.88 | 124.85 | 87.57 | 165.76 |
| 2016 | 61.19 | 101.82 | 71.13 | 121.5 | 90.52 | 171.96 | 62.53 | 112.08 | 89.26 | 166.75 |
| 2017 | 66.48 | 127.13 | 74.25 | 134.83 | 88.51 | 176.07 | 67.2 | 131.53 | 88.1 | 172.72 |
| 2018 | 53.68 | 112.93 | 57.16 | 127.5 | 83.35 | 168.31 | 57.59 | 119.72 | 83.29 | 164.69 |
| 2019 | 65.25 | 113.23 | 65.77 | 126.37 | 86.48 | 176.98 | 61.7 | 116.35 | 84.19 | 170.39 |
| 2020 | 49.44 | 108.45 | 64.56 | 121.5 | 73.67 | 165.05 | 53.63 | 113.26 | 77.06 | 160.23 |
| 2021 | 59.24 | 117.51 | 55.45 | 113.52 | 67.27 | 160.95 | 59.44 | 114.31 | 72.19 | 156.11 |
| 2022 | 65.78 | 110.07 | 57.12 | 117.73 | 81.28 | 162.54 | 61.38 | 114.46 | 80.47 | 157.9 |
| Mean | 59.79 | 117.32 | 63.07 | 126.54 | 81.57 | 173.14 | 60.47 | 119.88 | 81.58 | 167.99 |
| Standard Deviation | 7.34 | 9.84 | 7.27 | 8.98 | 7.88 | 9.41 | 6.43 | 12.30 | 7.40 | 8.88 |
| AOP | Karadarya | Kokomeren | Maydantal | Naryn | Oygaing | |||||
|---|---|---|---|---|---|---|---|---|---|---|
| Melt Onset | Melt Half | Melt Onset | Melt Half | Melt Onset | Melt Half | Melt Onset | Melt Half | Melt Onset | Melt Half | |
| 2001 | 177.12 | 241.17 | 196.13 | 247.17 | 239.16 | 306.21 | 188.13 | 247.17 | 225.15 | 306.21 |
| 2002 | 193.13 | 248.17 | 208.14 | 262.18 | 239.16 | 329.23 | 208.14 | 246.17 | 234.16 | 315.22 |
| 2003 | 196.13 | 256.18 | 211.14 | 268.18 | 263.18 | 309.21 | 213.15 | 259.18 | 253.17 | 300.21 |
| 2004 | 173.64 | 244.50 | 210.57 | 252.48 | 242.50 | 302.38 | 206.58 | 243.50 | 235.52 | 294.40 |
| 2005 | 183.13 | 262.18 | 201.14 | 267.18 | 257.18 | 298.20 | 199.14 | 238.16 | 241.17 | 298.20 |
| 2006 | 184.13 | 239.16 | 205.14 | 248.17 | 239.16 | 292.20 | 202.14 | 237.16 | 236.16 | 285.20 |
| 2007 | 98.07 | 222.15 | 148.10 | 231.16 | 235.16 | 292.20 | 103.07 | 226.15 | 231.16 | 295.20 |
| 2008 | 187.61 | 239.51 | 195.60 | 244.50 | 235.52 | 281.42 | 195.60 | 237.51 | 212.56 | 273.44 |
| 2009 | 168.12 | 252.17 | 205.14 | 267.18 | 268.18 | 316.22 | 201.14 | 254.17 | 246.17 | 311.21 |
| 2010 | 178.12 | 257.18 | 209.14 | 252.17 | 255.17 | 308.21 | 214.15 | 248.17 | 238.16 | 299.20 |
| 2011 | 199.14 | 229.16 | 189.13 | 235.16 | 242.17 | 289.20 | 189.13 | 231.16 | 235.16 | 289.20 |
| 2012 | 205.58 | 231.52 | 212.56 | 234.52 | 244.50 | 292.40 | 212.56 | 230.53 | 230.53 | 287.41 |
| 2013 | 184.13 | 234.16 | 189.13 | 239.16 | 247.17 | 303.21 | 193.13 | 231.16 | 233.16 | 303.21 |
| 2014 | 197.13 | 241.17 | 200.14 | 264.18 | 259.18 | 300.21 | 192.13 | 242.17 | 250.17 | 290.20 |
| 2015 | 197.13 | 245.17 | 205.14 | 249.17 | 242.17 | 303.21 | 203.14 | 237.16 | 237.16 | 359.25 |
| 2016 | 167.66 | 225.54 | 180.63 | 245.50 | 225.54 | 303.38 | 175.64 | 227.53 | 213.56 | 289.41 |
| 2017 | 186.13 | 249.17 | 212.15 | 255.17 | 253.17 | 301.21 | 214.15 | 251.17 | 251.17 | 294.20 |
| 2018 | 175.12 | 236.16 | 195.13 | 249.17 | 240.16 | 302.21 | 195.13 | 249.17 | 224.15 | 299.20 |
| 2019 | 175.12 | 224.15 | 197.13 | 247.17 | 250.17 | 307.21 | 192.13 | 224.15 | 224.15 | 305.21 |
| 2020 | 176.64 | 228.53 | 194.60 | 238.51 | 229.53 | 291.40 | 183.62 | 231.52 | 226.53 | 279.43 |
| 2021 | 181.12 | 241.17 | 179.12 | 249.17 | 253.17 | 284.19 | 189.13 | 239.16 | 239.16 | 278.19 |
| 2022 | 205.14 | 240.16 | 178.12 | 239.16 | 236.16 | 289.20 | 175.12 | 240.16 | 226.15 | 285.20 |
| Mean | 181.32 | 240.38 | 196.51 | 249.38 | 245.34 | 300.11 | 193.01 | 239.65 | 233.84 | 297.21 |
| Standard Deviation | 21.70 | 11.01 | 15.15 | 11.03 | 10.94 | 10.89 | 23.15 | 9.49 | 10.85 | 17.44 |
| AOP | Karadarya | Kokomeren | Maydantal | Naryn | Oygaing |
|---|---|---|---|---|---|
| 2001 | 64 | 51 | 67 | 59 | 81 |
| 2002 | 55 | 54 | 90 | 38 | 81 |
| 2003 | 60 | 57 | 46 | 46 | 47 |
| 2004 | 71 | 42 | 60 | 37 | 59 |
| 2005 | 79 | 66 | 41 | 39 | 57 |
| 2006 | 55 | 43 | 53 | 35 | 49 |
| 2007 | 124 | 83 | 57 | 123 | 64 |
| 2008 | 52 | 49 | 46 | 42 | 61 |
| 2009 | 84 | 62 | 48 | 53 | 65 |
| 2010 | 79 | 43 | 53 | 34 | 61 |
| 2011 | 30 | 46 | 47 | 42 | 54 |
| 2012 | 26 | 22 | 48 | 18 | 57 |
| 2013 | 50 | 50 | 56 | 38 | 70 |
| 2014 | 44 | 64 | 41 | 50 | 40 |
| 2015 | 48 | 44 | 61 | 34 | 122 |
| 2016 | 58 | 65 | 78 | 52 | 76 |
| 2017 | 63 | 43 | 48 | 37 | 43 |
| 2018 | 61 | 54 | 62 | 54 | 75 |
| 2019 | 49 | 50 | 57 | 32 | 81 |
| 2020 | 52 | 44 | 62 | 48 | 53 |
| 2021 | 60 | 70 | 31 | 50 | 39 |
| 2022 | 35 | 61 | 53 | 65 | 59 |
| Mean | 59.05 | 52.86 | 54.77 | 46.64 | 63.36 |
| Standard Deviation | 20.71 | 12.76 | 12.76 | 19.99 | 18.34 |
| AOP | DAOP Qmax | Value Qmax | Q5% | Q10% | Q50% | Q90% | Q95% |
|---|---|---|---|---|---|---|---|
| DAOP | m3/s | DAOP | DAOP | DAOP | DAOP | DAOP | |
| 2002 | 233.16 | 558.9 | 202.14 | 213.15 | 263.18 | 304.21 | 314.22 |
| 2003 | 274.19 | 506.9 | 213.15 | 213.15 | 263.18 | 304.21 | 314.22 |
| 2004 | 253.48 | 412.1 | 192.6 | 213.56 | 253.48 | 304.38 | 314.35 |
| 2005 | 284.19 | 449.5 | 192.13 | 202.14 | 263.18 | 304.21 | 314.22 |
| 2006 | 253.17 | 478 | 192.13 | 213.15 | 253.17 | 294.2 | 304.21 |
| 2007 | 223.15 | 182.4 | 192.13 | 202.14 | 243.17 | 304.21 | 314.22 |
| 2008 | 253.48 | 276.8 | 182.62 | 202.58 | 253.48 | 284.42 | 304.38 |
| 2009 | 294.2 | 328.8 | 192.13 | 213.15 | 274.19 | 314.22 | 314.22 |
| 2010 | 294.2 | 730.6 | 192.13 | 213.15 | 263.18 | 304.21 | 314.22 |
| 2011 | 253.17 | 364.4 | 192.13 | 213.15 | 263.18 | 304.21 | 314.22 |
| 2012 | 233.52 | 331.5 | 202.58 | 213.56 | 253.48 | 304.38 | 304.38 |
| 2013 | 274.19 | 332.1 | 192.13 | 202.14 | 263.18 | 304.21 | 314.22 |
| 2014 | 284.19 | 270.1 | 192.13 | 213.15 | 263.18 | 294.2 | 304.21 |
| 2015 | 253.17 | 429.8 | 192.13 | 213.15 | 253.17 | 304.21 | 304.21 |
| Mean | 261.53 | 403.71 | 194.45 | 210.09 | 259.03 | 302.11 | 310.68 |
| Standard Deviation | 23.01 | 138.78 | 7.16 | 5.15 | 7.66 | 6.96 | 4.95 |
| AOP | DAOP Qmax | Value Qmax | Q5% | Q10% | Q50% | Q90% | Q95% |
|---|---|---|---|---|---|---|---|
| DAOP | m3/s | DAOP | DAOP | DAOP | DAOP | DAOP | |
| 2014 | 274.19 | 208.29 | 208.29 | 237.16 | 281.19 | 320.22 | 327.22 |
| 2015 | 283.19 | 265.87 | 265.87 | 236.16 | 281.19 | 321.22 | 327.22 |
| 2016 | 289.41 | 317.61 | 317.61 | ||||
| 2019 | 310.21 | 247.65 | 247.65 | 241.17 | 285.2 | 322.22 | 328.22 |
| 2020 | 272.44 | 204.61 | 204.61 | 227.53 | 272.44 | 321.34 | 328.33 |
| 2021 | 253.17 | 246.98 | 246.98 | 239.16 | 274.19 | 321.22 | 327.22 |
| 2022 | 252.17 | 222.61 | 222.61 | 233.16 | 269.18 | 318.22 | 326.22 |
| Mean | 276.40 | 244.80 | 244.80 | 235.72 | 277.23 | 320.74 | 327.41 |
| Standard Deviation | 252.17 | 204.61 | 39.16 | 4.85 | 6.19 | 1.39 | 0.78 |
| AOP | DAOP Qmax | Value Qmax | Q5% | Q10% | Q50% | Q90% | Q95% |
|---|---|---|---|---|---|---|---|
| DAOP | m3/s | DAOP | DAOP | DAOP | DAOP | DAOP | |
| 2017 | 273.19 | 6298.17 | 224.15 | 237.16 | 280.19 | 321.22 | 327.22 |
| 2018 | 315.22 | 5542.33 | 219.15 | 236.16 | 286.2 | 322.22 | 327.22 |
| 2019 | 311.21 | 5397.77 | 227.16 | 241.17 | 292.2 | 324.22 | 329.23 |
| 2020 | 281.42 | 4902.61 | 209.57 | 227.53 | 280.42 | 321.34 | 327.33 |
| 2021 | 281.19 | 5617.88 | 219.15 | 239.16 | 278.19 | 319.22 | 327.22 |
| 2022 | 304.21 | 5293.17 | 221.15 | 233.16 | 281.19 | 321.22 | 327.22 |
| 2017 | 273.19 | 6298.17 | 224.15 | 237.16 | 280.19 | 321.22 | 327.22 |
| Mean | 294.41 | 5508.66 | 220.06 | 235.72 | 283.07 | 321.57 | 327.57 |
| Standard Deviation | 17.92 | 460.96 | 6.00 | 4.85 | 5.21 | 1.63 | 0.81 |
| AOP | DAOP Qmax | Value Qmax | Q5% | Q10% | Q50% | Q90% | Q95% |
|---|---|---|---|---|---|---|---|
| DAOP | m3/s | DAOP | DAOP | DAOP | DAOP | DAOP | |
| 2000 | 294.40 | 940.3 | 192.6 | 213.56 | 274.44 | 314.35 | 314.35 |
| 2001 | 274.19 | 1078.8 | 192.13 | 213.15 | 263.18 | 304.21 | 314.22 |
| 2002 | 284.19 | 1770.8 | 213.15 | 223.15 | 274.19 | 314.22 | 314.22 |
| 2003 | 294.20 | 1446.9 | 202.14 | 223.15 | 274.19 | 314.22 | 314.22 |
| 2004 | 284.42 | 1207.2 | 192.6 | 213.56 | 274.44 | 314.35 | 314.35 |
| 2005 | 284.19 | 1268.9 | 192.13 | 213.15 | 274.19 | 314.22 | 314.22 |
| 2006 | 253.17 | 1145.9 | 202.14 | 213.15 | 263.18 | 304.21 | 314.22 |
| 2007 | 294.20 | 833.9 | 202.14 | 213.15 | 263.18 | 314.22 | 314.22 |
| 2008 | 263.46 | 911.0 | 192.6 | 213.56 | 263.46 | 314.35 | 314.35 |
| 2009 | 294.20 | 1433.1 | 202.14 | 223.15 | 284.19 | 314.22 | 324.22 |
| 2010 | 294.20 | 1857.4 | 202.14 | 223.15 | 274.19 | 314.22 | 314.22 |
| Mean | 283.17 | 1263.11 | 198.72 | 216.90 | 271.17 | 312.44 | 315.16 |
| Standard Deviation | 14.09 | 337.18 | 6.83 | 4.96 | 6.92 | 4.07 | 3.00 |
| AOP | DAOP Qmax | Value Qmax | Q5% | Q10% | Q50% | Q90% | Q95% |
|---|---|---|---|---|---|---|---|
| DAOP | m3/s | DAOP | DAOP | DAOP | DAOP | DAOP | |
| 2019 | 303.21 | 3180.15 | 198.14 | 212.15 | 280.19 | 323.22 | 328.22 |
| 2020 | 282.42 | 2817.92 | 195.6 | 208.57 | 276.43 | 321.34 | 327.33 |
| 2021 | 280.19 | 3179.15 | 198.14 | 214.15 | 276.19 | 321.22 | 328.22 |
| 2022 | 305.21 | 2926.51 | 197.13 | 212.15 | 273.19 | 320.22 | 327.22 |
| Mean | 292.76 | 3025.93 | 197.25 | 211.76 | 276.50 | 321.50 | 327.75 |
| Standard Deviation | 13.28 | 182.95 | 1.20 | 2.32 | 2.87 | 1.25 | 0.55 |
References
- Smith, D.R. Environmental Security and Shared Water Resources in Post-Soviet Central Asia. Post-Sov. Geogr. 1995, 36, 351–370. [Google Scholar] [CrossRef]
- Siegfried, T.; Bernauer, T.; Guiennet, R.; Sellars, S.; Robertson, A.W.; Mankin, J.; Bauer-Gottwein, P.; Yakovlev, A. Will Climate Change Exacerbate Water Stress in Central Asia? Clim. Chang. 2012, 112, 881–899. [Google Scholar] [CrossRef]
- Prowse, T.; Wrona, F.; Reist, J.; Hobbie, J.; Lévesque, L.; Vincent, W. General Features of the Arctic Relevant to Climate Change in Freshwater Ecosystems. Ambio 2006, 35, 330–338. [Google Scholar] [CrossRef] [PubMed]
- Barry, R.G. The Role of Snow and Ice in the Global Climate System: A Review. Polar Geogr. 2002, 26, 235–246. [Google Scholar] [CrossRef]
- Barry, R.G. The Parameterization of Surface Albedo for Sea Ice and Its Snow Cover. Prog. Phys. Geogr. 1996, 20, 63–79. [Google Scholar] [CrossRef]
- Rößler, S.; Dietz, A.J. Development of Global Snow Cover—Trends from 23 Years of Global SnowPack. Earth 2023, 4, 1–22. [Google Scholar] [CrossRef]
- Barnett, T.P.; Adam, J.C.; Lettenmaier, D.P. Potential Impacts of a Warming Climate on Water Availability in Snow-Dominated Regions. Nature 2005, 438, 303–309. [Google Scholar] [CrossRef] [PubMed]
- Bernauer, T.; Siegfried, T. Climate Change and International Water Conflict in Central Asia. J. Peace Res. 2012, 49, 227–239. [Google Scholar] [CrossRef]
- Viviroli, D.; Weingartner, R.; Messerli, B. Assessing the Hydrological Significance of the World’s Mountains. Mt. Res. Dev. 2003, 23, 32–40. [Google Scholar] [CrossRef]
- Armstrong, R.L.; Rittger, K.; Brodzik, M.J.; Racoviteanu, A.; Barrett, A.P.; Khalsa, S.-J.S.; Raup, B.; Hill, A.F.; Khan, A.L.; Wilson, A.M.; et al. Runoff from Glacier Ice and Seasonal Snow in High Asia: Separating Melt Water Sources in River Flow. Reg. Environ. Chang. 2019, 19, 1249–1261. [Google Scholar] [CrossRef]
- Smith, T.; Bookhagen, B. Changes in Seasonal Snow Water Equivalent Distribution in High Mountain Asia (1987 to 2009). Sci. Adv. 2018, 4, e1701550. [Google Scholar] [CrossRef]
- Yang, T.; Li, Q.; Ahmad, S.; Zhou, H.; Lanhai, L. Changes in Snow Phenology from 1979 to 2016 over the Tianshan Mountains, Central Asia. Remote Sens. 2019, 11, 499. [Google Scholar] [CrossRef]
- Saks, T.; Pohl, E.; Machguth, H.; Dehecq, A.; Barandun, M.; Kenzhebaev, R.; Kalashnikova, O.; Hoelzle, M. Glacier Runoff Variation Since 1981 in the Upper Naryn River Catchments, Central Tien Shan. Front. Environ. Sci. 2022, 9, 780466. [Google Scholar] [CrossRef]
- Pohl, E.; Gloaguen, R.; Andermann, C.; Knoche, M. Glacier Melt Buffers River Runoff in the Pamir Mountains. Water Resour. Res. 2017, 53, 2467–2489. [Google Scholar] [CrossRef]
- Malsy, M.; Aus der Beek, T.; Eisner, S.; Flörke, M. Climate Change Impacts on Central Asian Water Resources. Adv. Geosci. 2012, 32, 77–83. [Google Scholar] [CrossRef]
- IPCC Ocean, Cryosphere and Sea Level Change. In Climate Change 2021: The Physical Science Basis. Contribution of Working Group I to the Sixth Assessment Report of the Intergovernmental Panel on Climate Change; Cambridge University Press: Cambridge, UK; New York, NY, USA, 2021; pp. 1211–1362.
- Sturm, M.; Wagner, A. Using Repeated Patterns in Snow Distribution Modeling: An Arctic Example. Water Resour. Res. 2010, 46, 14. [Google Scholar] [CrossRef]
- Fassnacht, S.R.; Dressler, K.A.; Hultstrand, D.M.; Bales, R.C.; Patterson, G. Temporal Inconsistencies in Coarse-Scale Snow Water Equivalent Patterns: Colorado River Basin Snow Telemetry-Topography Regressions. Pirineos 2012, 167, 165–185. [Google Scholar] [CrossRef]
- Notarnicola, C. Overall Negative Trends for Snow Cover Extent and Duration in Global Mountain Regions over 1982–2020. Sci. Rep. 2022, 12, 13731. [Google Scholar] [CrossRef]
- Dietz, A.J.; Künzer, C.; Gessner, U.; Dech, S. Remote Sensing of Snow—A Review of Available Methods. Int. J. Remote Sens. 2012, 33, 4094–4134. [Google Scholar] [CrossRef]
- Kapnick, S.B.; Delworth, T.L.; Ashfaq, M.; Malyshev, S.; Milly, P.C.D. Snowfall Less Sensitive to Warming in Karakoram than in Himalayas Due to a Unique Seasonal Cycle. Nat. Geosci 2014, 7, 834–840. [Google Scholar] [CrossRef]
- Körner, C. Alpine Plant Life, 3rd ed.; Springer Nature Switzerland AG: Cham, Switzerland, 2021; ISBN 978-3-540-65438-4. [Google Scholar]
- Stigter, E.E.; Wanders, N.; Saloranta, T.M.; Shea, J.M.; Bierkens, M.F.P.; Immerzel, W.W. Assimilation of Snow Cover and Snow Depth into a Snow Model to Estimate Snow Water Equivalent and Snowmelt Runoff in a Himalayan Catchment. Cryosphere 2017, 11, 1647–1664. [Google Scholar] [CrossRef]
- Dong, J.; Walker, J.P.; Houser, P.R. Factors Affecting Remotely Sensed Snow Water Equivalent Uncertainty. Remote Sens. Environ. 2005, 97, 68–82. [Google Scholar] [CrossRef]
- Hall, D.K.; Riggs, G.A.; Salomonson, V.V.; DiGirolamo, N.E.; Bayr, K.J. MODIS Snow-Cover Products. Remote Sens. Environ. 2002, 83, 181–194. [Google Scholar] [CrossRef]
- Ma, X.; Yan, W.; Zhao, C.; Kundzewicz, Z.W. Snow-Cover Area and Runoff Variation under Climate Change in the West Kunlun Mountains. Water 2019, 11, 2246. [Google Scholar] [CrossRef]
- Hall, D.K.; Riggs, G.A.; Salomonson, V.V. Development of Methods for Mapping Global Snow Cover Using Moderate Resolution Imaging Spectroradiometer Data. Remote Sens. Environ. 1995, 54, 127–140. [Google Scholar] [CrossRef]
- Martinec, J. Snowmelt-Runoff Model for Streamflow Forecast. Hydrol. Res. 1975, 6, 145–154. [Google Scholar] [CrossRef]
- Burn, D.H. Climatic Influences on Streamflow Timing in the Headwaters of the Mackenzie River Basin. J. Hydrol. 2008, 352, 225–238. [Google Scholar] [CrossRef]
- Rößler, S.; WItt, M.S.; Ikonen, J.; Brown, I.A.; Dietz, A.J. Remote Sensing of Snow Cover Variability and Its Influence on the Runoff of Sápmi’s Rivers. Geosciences 2021, 11, 130. [Google Scholar] [CrossRef]
- The World Bank. World Bank in Central Asia. Available online: https://www.worldbank.org/en/region/eca/brief/central-asia (accessed on 29 December 2022).
- De Pauw, E. Principal Biomes of Central Asia. In Climate Change and Terrestrial Carbon Sequestration in Central Asia; Taylor & Francis: London, UK, 2007; pp. 3–24. ISBN 978-0-429-22422-5. [Google Scholar]
- Esri. World Water Bodies. 2022. Available online: https://hub.arcgis.com/search?tags=2022 (accessed on 15 November 2022).
- UNESCO World Rivers 2017. Available online: https://ihp-wins.unesco.org/dataset/world-rivers (accessed on 15 November 2022).
- Esri. World Cities. 2022. Available online: https://www.arcgis.com/home/item.html?id=dfab3b294ab24961899b2a98e9e8cd3d (accessed on 15 November 2022).
- Lehner, B.; Grill, G. Global River Hydrography and Network Routing: Baseline Data and New Approaches to Study the World’s Large River Systems. Hydrol. Process. 2013, 27, 2171–2186. [Google Scholar] [CrossRef]
- Esri. World Countries—Generalized. 2022. Available online: https://hub.arcgis.com/datasets/esri::world-countries-generalized/about (accessed on 15 November 2022).
- Chen, Y.; Weihong, L.; Deng, H.; Fang, G.; Li, Z. Changes in Central Asia’s Water Tower: Past, Present and Future. Sci. Rep. 2016, 6, 35458. [Google Scholar] [CrossRef]
- Dietz, A.J.; Künzer, C.; Conrad, C. Snow-Cover Variability in Central Asia between 2000 and 2011 Derived from Improved MODIS Daily Snow-Cover Products. Int. J. Remote Sens. 2013, 34, 3879–3902. [Google Scholar] [CrossRef]
- Guan, X.; Yao, J.; Schneider, C. Variability of the Precipitation over the Tianshan Mountains, Central Asia. Part I: Linear and Nonlinear Trends of the Annual and Seasonal Precipitation. Int. J. Climatol. 2022, 42, 118–138. [Google Scholar] [CrossRef]
- Aizen, V.B.; Kuzmichenok, V.A.; Surazakov, A.B.; Aizen, E.M. Glacier Changes in the Tien Shan as Determined from Topographic and Remotely Sensed Data. Glob. Planet. Chang. 2007, 56, 328–340. [Google Scholar] [CrossRef]
- Khromova, T.E.; Osipova, G.B.; Tsvetkov, D.G.; Dyurgerov, M.B.; Barry, R.G. Changes in Glacier Extent in the Eastern Pamir, Central Asia, Determined from Historical Data and ASTER Imagery. Remote Sens. Environ. 2006, 102, 24–32. [Google Scholar] [CrossRef]
- Dietz, A.J.; Künzer, C.; Dech, S. Global SnowPack: A New Set of Snow Cover Parameters for Studying Status and Dynamics of the Planetary Snow Cover Extent. Remote Sens. Lett. 2015, 6, 844–853. [Google Scholar] [CrossRef]
- Gocic, M.; Trajkovic, S. Analysis of Changes in Meteorological Variables Using Mann-Kendall and Sen’s Slope Estimator Statistical Tests in Serbia. Glob. Planet. Chang. 2013, 100, 172–182. [Google Scholar] [CrossRef]
- Shi, X.; Marsh, P.; Yang, D. Warming Spring Air Temperatures, but Delayed Spring Streamflow in an Arctic Headwater Basin. Environ. Res. Lett. 2015, 10, 064003. [Google Scholar] [CrossRef]
- Aigang, L.; Tianming, W.; Shichang, K.; Deqian, P. On the Relationship between Latitude and Altitude Temperature Effects. In Proceedings of the 2009 International Conference on Environmental Science and Information Application Technology, Wuhan, China, 4–5 July 2009; Volume 2, pp. 55–58. [Google Scholar]
- Moore, J.N.; Harper, J.T.; Greenwood, M.C. Significance of Trends toward Earlier Snowmelt Runoff, Columbia and Missouri Basin Headwaters, Western United States. Geophys. Res. Lett. 2007, 34, 1–4. [Google Scholar] [CrossRef]
- Danielson, J.J.; Gesch, D.B. Global Multi-Resolution Terrain Elevation Data 2010 (GMTED2010); U.S. Geological Survey Open-File Report 2011-1073; U.S. Geological Survey: Reston, VA, USA, 2011; p. 26.
- Zech, C. Kokomeren Station Exposure Description 2020. Available online: https://datapub.gfz-potsdam.de/download/10.5880.GFZ.1.2.2020.002_CAWa/KEKI/KEKI_HMT-SED-GFZ.pdf (accessed on 19 November 2022).
- Court, A. Measures of Streamflow Timing. J. Geophys. Res. 1962, 67, 4335–4339. [Google Scholar] [CrossRef]
- McKinney, W. Data Structures for Statistical Computing in Python. In Proceedings of the 9th Python in Science Conference, Austin, TX, USA, 28 June–3 July 2010; Volume 445, pp. 51–56. [Google Scholar] [CrossRef]
- The Pandas Development Team. Pandas-Dev/Pandas: Pandas. 2022. Available online: https://zenodo.org/records/10957263 (accessed on 22 November 2022).
- Kendall, M.G. A New Measure of Rank Correlation. Biometrika 1938, 30, 81–93. [Google Scholar] [CrossRef]
- Mann, H.B. Nonparametric Tests Against Trend. Econometrica 1945, 13, 245–259. [Google Scholar] [CrossRef]
- Sen, P.K. Estimates of the Regression Coefficient Based on Kendall’s Tau. J. Am. Stat. Assoc. 1968, 63, 1379–1389. [Google Scholar] [CrossRef]
- Kour, R.; Patel, N.; Krishna, A. Assessment of Temporal Dynamics of Snow Cover and Its Validation with Hydro-Meteorological Data in Parts of Chenab Basin, Western Himalayas. Sci. China Earth Sci. 2016, 59, 1081–1094. [Google Scholar] [CrossRef]
- Hussain, M.M.; Mahmud, I. pyMannKendall: A Python Package for Non Parametric Mann Kendall Family of Trend Tests. J. Open Source Softw. 2019, 4, 1556. [Google Scholar] [CrossRef]
- Virtanen, P.; Gommers, R.; Oliphant, T.E.; Haberland, M.; Reddy, T.; Cournapeau, D.; Burovski, E.; Peterson, P.; Weckesser, W.; Bright, J.; et al. SciPy 1.0: Fundamental Algorithms for Scientific Computing in Python. Nat Methods 2020, 17, 261–272. [Google Scholar] [CrossRef]
- Helbig, N.; van Herwijnen, A.; Magnusson, J.; Jonas, T. Fractional Snow-Covered Area Parameterization over Complex Topography. Hydrol. Earth Syst. Sci. 2015, 19, 1339–1351. [Google Scholar] [CrossRef]
- Sriwongsitanon, N.; Taesombat, W. Effects of Land Cover on Runoff Coefficient. J. Hydrol. 2011, 410, 226–238. [Google Scholar] [CrossRef]
- Musselman, K.N.; Clark, M.P.; Liu, C.; Ikeda, K.; Rasmussen, R. Slower Snowmelt in a Warmer World. Nat. Clim Chang. 2017, 7, 214–219. [Google Scholar] [CrossRef]
- Berghuijs, W.R.; Woods, R.A.; Hrachowitz, M. A Precipitation Shift from Snow towards Rain Leads to a Decrease in Streamflow. Nat. Clim Chang. 2014, 4, 583–586. [Google Scholar] [CrossRef]
- Unger-Shayesteh, K.; Vorogushyn, S.; Farinotti, D.; Gafurov, A.; Duethmann, D.; Mandychev, A.; Merz, B. What Do We Know about Past Changes in the Water Cycle of Central Asian Headwaters? A Review. Glob. Planet. Chang. 2013, 110, 4–25. [Google Scholar] [CrossRef]
- Khamidov, M. Experience of Coordinated Water Resources Use of the Syrdarya River Basin States. In Proceedings of the Water and Food Security in Central Asia; Madramootoo, C., Dukhovny, V., Eds.; Springer Netherlands: Dordrecht, The Netherlands, 2011; pp. 85–90. [Google Scholar]
- de Lima, M.I.P.; Carvalho, S.C.P.; de Lima, J.L.M.P.; Coelho, M.F.E.S. Trends in Precipitation: Analysis of Long Annual and Monthly Time Series from Mainland Portugal. Adv. Geosci. 2010, 25, 155–160. [Google Scholar] [CrossRef]


| Catchment | Coordinates of Station | Data Source | Time of Recording | Missing Spring Runoff Measurements | Years Removed | Number of Used Spring Runoff Measurements | |
|---|---|---|---|---|---|---|---|
| First | Last | ||||||
| Karadarya | 40°46′59.4546″ N, 73°8′42.7122″ E | CAREWIB | 1 January 2000 | 21 April 2016 | - | 2000, 2001 | 211 |
| Kokomeren | 37°50′32.8164″ N, 65°13′42.2934″ E | SDSS | 23 September 2013 | 10 October 2022 | 272 | 2016, 2017, 2018 | 919 |
| Maydantal | 41°59′47.0616″ N, 70°38′9.7296″ E | SDSS | 16 March 2015 | 10 October 2022 | 249 | 2015, 2016 | 919 |
| Naryn | 41°46′26.814″ N, 73°15′51.9798″ E | CAREWIB | 1 January 2000 | 21 April 2016 | - | 2010–2015 | 166 |
| Oygaing | 41°59′45.42″ N, 70°38′21.3678″ E | SDSS | 8 October 2018 | 10 October 2022 | - | - | 613 |
| Abbreviation | Unit | Description | Data Source |
|---|---|---|---|
| SCDES | Days | Early-season snow cover duration | GSP |
| SCDLS | Days | Late-season snow cover duration | GSP |
| Melt onset | DAOP | Snowmelt start time derived from snow cover data | GSP |
| Melt half | DAOP | Snowmelt half-time derived from snow cover data | GSP |
| Melt delta | Days | Number of days between Melt onset and Melt half | GSP |
| Value Qmax | m3/s | Peak runoff volume | SDSS/CAREWIB |
| DAOP Qmax | DAOP | Time of peak runoff | SDSS/CAREWIB |
| Q5% | DAOP | Time when 5% of cumulated discharge occurred | SDSS/CAREWIB |
| Q10% | DAOP | Time when 10% of cumulated discharge occurred | SDSS/CAREWIB |
| Q50% | DAOP | Time when 50% of cumulated discharge occurred | SDSS/CAREWIB |
| Q90% | DAOP | Time when 90% of cumulated discharge occurred | SDSS/CAREWIB |
| Q95% | DAOP | Time when 95% of cumulated discharge occurred | SDSS/CAREWIB |
| Parameter | Unit | Karadarya | Kokomeren | Maydantal | Naryn | Oygaing |
|---|---|---|---|---|---|---|
| SCDES | Days | 59.79 ± 7.34 | 63.07 ± 7.27 | 81.57 ± 7.88 | 60.47 ± 6.43 | 81.58 ± 7.4 |
| SCDLS | Days | 117.32 ± 9.84 | 126.54 ± 8.98 | 173.14 ± 9.41 | 119.88 ± 12.3 | 167.99 ± 8.88 |
| Melt onset | DAOP | 181.32 ± 21.7 | 196.51 ± 15.15 | 245.34 ± 10.94 | 193.01 ± 23.15 | 233.84 ± 10.85 |
| Melt half | DAOP | 240.38 ± 11.01 | 249.38 ± 11.03 | 300.11 ± 10.89 | 239.65 ± 9.49 | 297.21 ± 17.44 |
| Melt delta | Days | 59.05 ± 20.71 | 52.86 ± 12.76 | 54.77 ± 12.76 | 47 ± 20.05 | 63.36 ± 18.34 |
| Parameter | Unit | Karadarya | Kokomeren | Maydantal | Naryn | Oygaing |
|---|---|---|---|---|---|---|
| SCDES | Days | 0.016 | −0.08 | −0.4 | −0.21 | −0.33 |
| SCDLS | Days | −0.53 ** | −0.65 ** | −0.73 *** | −0.63 ** | −0.67 *** |
| Melt onset | DAOP | 0.11 | −0.83 *** | −0.17 | −0.9 ** | −0.36 |
| Melt half | DAOP | −0.71 * | −0.5 * | −0.53 * | −0.63 * | −0.75 * |
| Melt delta | DAOP | −0.83 * | 0.1 | 0 | 0.12 | −0.27 |
| Parameter | Unit | Karadarya | Kokomeren | Maydantal | Naryn | Oygaing |
|---|---|---|---|---|---|---|
| 2002–2015 | 2014–2022 | 2017–2022 | 2001–2010 | 2019–2022 | ||
| SCDES | Days | −0.18 | −1.08 | −4.84 * | −1.62 *** | −3.06 |
| SCDLS | Days | −0.34 | −1.85 * | −2.71 * | −0.16 | −4.15 |
| Melt onset | DAOP | 1.17 | −2.64 *** | −1.5 | −0.33 | 1.52 |
| Melt half | DAOP | −1.07 | −2.14 ** | −3.27 | −1.22 | −3.96 |
| Melt delta | DAOP | −1.5 ** | 0.42 | −1.33 | −0.5 | −10.67 |
| Parameter | Unit | Karadarya | Kokomeren | Maydantal | Naryn | Oygaing |
|---|---|---|---|---|---|---|
| Value Qmax | m3/s | 403.71 ± 34.4% | 244.8 ± 16% | 5508.66 ± 8.4% | 1263.17 ± 27% | 3025.93 ± 6% |
| DAOP Qmax | DAOP | 261.53 ± 23.01 | 276.4 ± 20.44 | 294.41 ± 17.92 | 283.17 ± 14.09 | 292.76 ± 13.28 |
| Q5% | DAOP | 194.45 ± 7.16 | 202.38 ± 3.2 | 220 ± 6 | 198.72 ± 6.83 | 197.25 ± 1.2 |
| Q10% | DAOP | 210.09 ± 5.15 | 235,72 ± 4,85 | 235.72 ± 4.85 | 216.9 ± 4.96 | 211.76 ± 2.32 |
| Q50% | DAOP | 259.03 ± 7.66 | 277.23 ± 6.19 | 283.07 ± 5.21 | 271.17 ± 6.92 | 276.5 ± 2.87 |
| Q90% | DAOP | 302.11 ± 6.96 | 320.74 ± 1.39 | 321.57 ± 1.63 | 312.44 ± 4.07 | 321.5 ± 1.25 |
| Q95% | DAOP | 310.68 ± 4.95 | 327.41 ± 0.78 | 327.57 ± 0.81 | 315.16 ± 3 | 327.75 ± 0.55 |
| Unit | Karadarya | Kokomeren | Maydantal | Naryn | Oygaing | |
|---|---|---|---|---|---|---|
| 2002–2015 | 2014–2022 | 2017–2022 | 2000–2015 | 2019–2022 | ||
| Value Qmax | m3/s | −14.68 * | −5.37 | −170.07 | 34.27 | −42.52 |
| DAOP Qmax | DAOP | 0.04 | −2.88 | −0.23 | 0 | −0.78 |
| Q5% | DAOP | 0 * | −1.18 | −0.6 | 0 | −0.17 |
| Q10% | DAOP | 0 | −1 * | −0.8 | 0 | 0.5 |
| Q50% | DAOP | 0 | −2.4 * | −0.5 | 0 | −2.17 ** |
| Q90% | DAOP | 0 | −0.12 | −0.25 | 0 | −1 ** |
| Q95% | DAOP | 0 ** | 0 | 0 | 0 | −0.19 |
Disclaimer/Publisher’s Note: The statements, opinions and data contained in all publications are solely those of the individual author(s) and contributor(s) and not of MDPI and/or the editor(s). MDPI and/or the editor(s) disclaim responsibility for any injury to people or property resulting from any ideas, methods, instructions or products referred to in the content. |
© 2024 by the authors. Licensee MDPI, Basel, Switzerland. This article is an open access article distributed under the terms and conditions of the Creative Commons Attribution (CC BY) license (https://creativecommons.org/licenses/by/4.0/).
Share and Cite
Vydra, C.; Dietz, A.J.; Roessler, S.; Conrad, C. The Influence of Snow Cover Variability on the Runoff in Syr Darya Headwater Catchments between 2000 and 2022 Based on the Analysis of Remote Sensing Time Series. Water 2024, 16, 1902. https://doi.org/10.3390/w16131902
Vydra C, Dietz AJ, Roessler S, Conrad C. The Influence of Snow Cover Variability on the Runoff in Syr Darya Headwater Catchments between 2000 and 2022 Based on the Analysis of Remote Sensing Time Series. Water. 2024; 16(13):1902. https://doi.org/10.3390/w16131902
Chicago/Turabian StyleVydra, Clara, Andreas J. Dietz, Sebastian Roessler, and Christopher Conrad. 2024. "The Influence of Snow Cover Variability on the Runoff in Syr Darya Headwater Catchments between 2000 and 2022 Based on the Analysis of Remote Sensing Time Series" Water 16, no. 13: 1902. https://doi.org/10.3390/w16131902