Article

The Influence of Snow Cover Variability on the Runoff in Syr Darya Headwater Catchments between 2000 and 2022 Based on the Analysis of Remote Sensing Time Series

1
Department of Geoecology, Institute of Geosciences and Geography, Martin Luther University Halle-Wittenberg, 06120 Halle (Saale), Germany
2
German Remote Sensing Data Center (DFD), German Aerospace Center (DLR), Muenchener Strasse 20, 82234 Wessling, Germany
*
Author to whom correspondence should be addressed.
Water 2024, 16(13), 1902; https://doi.org/10.3390/w16131902
Submission received: 11 June 2024 / Revised: 28 June 2024 / Accepted: 29 June 2024 / Published: 3 July 2024

Abstract

:
Climate change is affecting the snow cover conditions on a global scale, leading to changes in the extent and duration of snow cover as well as variations in the start and end of snow cover seasons. These changes can have a paramount impact on runoff and water availability, especially in catchments that are characterized by nival runoff regimes, e.g., the Syr Darya in Central Asia. This time series analyses of daily MODIS snow cover products and in situ data from hydrological stations for the time series from 2000 through 2022 reveal the influences of changing snow cover on the runoff regime. All catchments showed a decrease in spring snow cover duration of −0.53 to −0.73 days per year over the 22-year period. Catchments located farther west are generally characterized by longer snow cover duration and experience a stronger decreasing trend. Runoff timing was found to be influenced by late winter and spring snow cover duration, pointing towards earlier snowmelt in most of the regions, which affects the runoff in some tributaries of the river. The results of this study indicate that the decreasing snow cover duration trends lead to an earlier runoff, which demands more coordinated water resource management in the Syr Darya catchment. Further research is recommended to understand the implications of snow cover dynamics on water resources in Central Asia, crucial for agriculture and hydropower production.

1. Introduction

“Nowhere in the world is the potential for conflict over the use of natural resources as strong as in Central Asia” states Smith in his assessment of water-related politics in the former Soviet Union countries [1]. Siegfried et al. further include the danger from natural hazards due to changes in the cryosphere as well as political risks that come with the uncertain future of Central Asia’s (CA) water resources [2]. Due to its ability to form seasonal freshwater reservoirs [3], its high solar reflectivity (albedo) and thermal insulation [4,5] snow cover plays a crucial role in hydrological and climatic systems [4]. With about a quarter of catchments worldwide dependent on snow and ice melt for freshwater supply [6,7], the investigation of mountain snow cover and its influences on runoff is vital for downstream ecosystems and human activity [8]. This includes irrigation in the densely populated agricultural production systems of the arid lowlands in Central Asia (CA) hydropower production in the Tien Shan mountains (TS) [2,9]. Snowmelt is the most important water source for the major rivers of the Aral Sea basin of the Syr Darya and Amu Darya catchments [10]. The interrelation of snowmelt and river runoff in High-Mountain Asia (HMA) has been subject to research in the past years [11,12,13,14], but catchment-specific variations are possible, making it important to conduct research about snow cover, runoff, droughts, and floods at a sub-catchment scale [15].

Theoretical Background

Snow cover characteristics are defined by snow phenology (onset/melt timing and snow cover duration), the snow depth/snow water equivalent, and the spatial snow cover extent on the ground [16]. These parameters are mainly determined by temperature and precipitation but are also influenced by elevation, aspect, slope, vegetation, and strong winds [17,18]. The response of nival systems to a changing climate is thus not only a function of temperature. While a reduction in global snow cover has been detected since the middle of the 20th century [19,20], with further decrease being very likely under current warming conditions [16], snow cover might increase at high altitudes when precipitation increases and temperatures are below 0 °C [21]. Temperature and precipitation vary with elevation (temperature gradient of −0.5 °C to −1 °C per 100 m altitude change can be expected, depending on air moisture [22]).
An important measure for hydrologic forecasting and management [23] is the snow water equivalent (SWE), which indicates the actual amount of water stored in a snowpack. The snow depth information [24] can be derived from satellite-based passive microwave sensing, but this method is prone to errors on wet snow, at the sub-catchment scale, and in mountainous regions due to coarse spatial resolution and the high relief variability [24]. Alternatively, information about the snow cover extent can be retrieved from multispectral optical satellite data [20], where the temporal and spatial resolution is high enough for investigating hydrological processes and running climatic and hydrological models [23,25,26]. The normalized difference snow index (NDSI) has proven to be a good indicator of the presence of snow and can be calculated from bands covering visible light and short-wave infrared radiation [27]. Snow phenology parameters can be extracted from snow cover data; however, multispectral data do not quantify snow depth, which creates uncertainty about the SWE of a snowpack [16]. While remotely sensed snow cover provides information covering larger spatial scales, in situ data provide more accurate point-based information [20].
Freshwater from high mountain water storages such as glaciers or existing snowpacks is released with a temporal delay in spring and summer months when it is most needed by plants and for agricultural irrigation [2], but timing and volume are often determined by snow volume, distribution, and melt timing [28]. Runoff can be measured at in situ gauging stations, which monitor the water volume that passes in a certain period (e.g., m3/s). Earlier snowmelt has been found to cause an earlier spring flood, meaning the beginning of a rising runoff volume in spring, as well as an earlier discharge peak [29]. The premature drainage of water storage (e.g., due to higher temperatures in early spring) causes reduced water availability in crop-growing seasons in later spring/summer [12] and increased flood risk in undammed catchments [2]. Flood formation is likely if high snow precipitation in the accumulation season is followed by a sharp temperature increase in the melt season. Higher spring temperatures also favor the occurrence of rain-on-snow (ROS) events, which cause quick snowmelt and high discharge peaks [30].
Apart from the seasonal influence of snow cover, glaciers, frozen soil [4], and land cover play a role in runoff behavior. Frozen soil inhibits the percolation of meltwater into the ground, making it drain off the surface and, hence, changing the relation of surface to groundwater runoff [26]. In times of low precipitation, the runoff level may be balanced by increased glacier melt, as glacial meltwater is an important freshwater source in the dry periods from July to September [10]. Continuously negative glacier mass balance increases the fraction of glacial discharge to total runoff at first. However, ongoing glacier retreat decreases the available water stored in glaciers and thus the capacity to buffer droughts due to less meltwater runoff [14]. A decrease in glaciated area could move runoff more towards the beginning of the year and increase interannual variations of runoff due to a reduced baseflow [14].
The Syr Darya, fed mainly by snowmelt, is one of the two major rivers supplying the Aral Sea basin of Central Asia with freshwater. Due to the high aridity in the Syr Darya lowlands, the water supply of the catchment is determined in its headwaters (in the TS). Research objectives will therefore be as follows:
  • To analyze which aspects of snow cover phenology influence the runoff behavior in the Syr Darya headwaters.
  • To analyze what trends in snow cover and runoff behavior exist.
  • To give an assessment of future runoff changes based on snow cover variability and trends.
In the second section, the study area and investigated sub-catchments will be described. Afterward, materials and methods are explained, followed by the presentation and discussion of results.

2. Materials and Methods

2.1. Study Area

The countries included under the term “Central Asia” (CA) are not always the same but can vary in different contexts. On the basis of a shared Soviet Union history, it will include Uzbekistan, Kazakhstan, Tadzhikistan, Turkmenistan, and Kyrgyzstan in this study [31]. CA stretches from 46° to 80° east and from 55° to 35° north, with an area of about 4.2 million km2.
CA is characterized by a high geophysical variability. In the north lie the vast steppes of Kazakhstan, in the south the endorheic Aral Sea drainage basin, and in the west the mountain ranges of Pamir, Alay, and Tien Shan (TS), which encompass peaks up to 7500 m [32]. The most important water supply to the plains in the west are Amu Darya and Syr Darya rivers [9], which are fed by glaciers and snowmelt in the Pamir and TS mountains and terminate in the Aral Sea. The rivers are managed heavily through the damming of water. Of the Syr Darya mean annual flow, about 90% is regulated by reservoirs [8]. Figure 1 gives an overview of major rivers and water bodies in CA [33,34,35,36,37]. The TS has a glaciated area of about 10,000 km2, of which 80% are located in Kyrgyzstan and Kazakhstan [32].
Spring/summer meltwater discharge in the Syr Darya headwater catchment usually starts in April and peaks in June/July, with snow contributing around 72% and glacier melt about 2% of total runoff volume [2,10]. While winter precipitation, and thus snowfall, of the western TS has been found to increase [38,39], the opposite is the case for spring precipitation [40]. As average annual temperatures increase, natural water storages of snow and ice in high mountain areas of CA have been found to start melting earlier in the year [12,38,41,42]. Decreasing meltwater availability in the spring and summer months increases the prospects of water needs not met [2,7].

2.2. Snow Cover

To be able to derive trends in snow cover duration and to identify the exact dates of the onset or melt of snow, daily, gap-free snow cover information is required for the whole study region. The most commonly used remote sensing-based daily snow cover product M*D10A1 is provided by the National Snow and Ice Data Center (NSIDC). It is based on multispectral satellite imagery from the Moderate Resolution Imaging Spectroradiometer (MODIS) and the Visible Infrared Imaging Radiometer Suite (VIIRS). Because M*D10A1 contains data gaps caused by cloud cover and polar darkness, the German Aerospace Center (DLR) has developed the “Global SnowPack” (GSP) based on these datasets [43]. The processing chain for GSP contains several interpolation techniques designed in a way to eliminate all data gaps while ensuring the highest quality of the final result. Its overall accuracy ranges from 77% to 84% with an overestimation of SCD as a predominant error source [43].
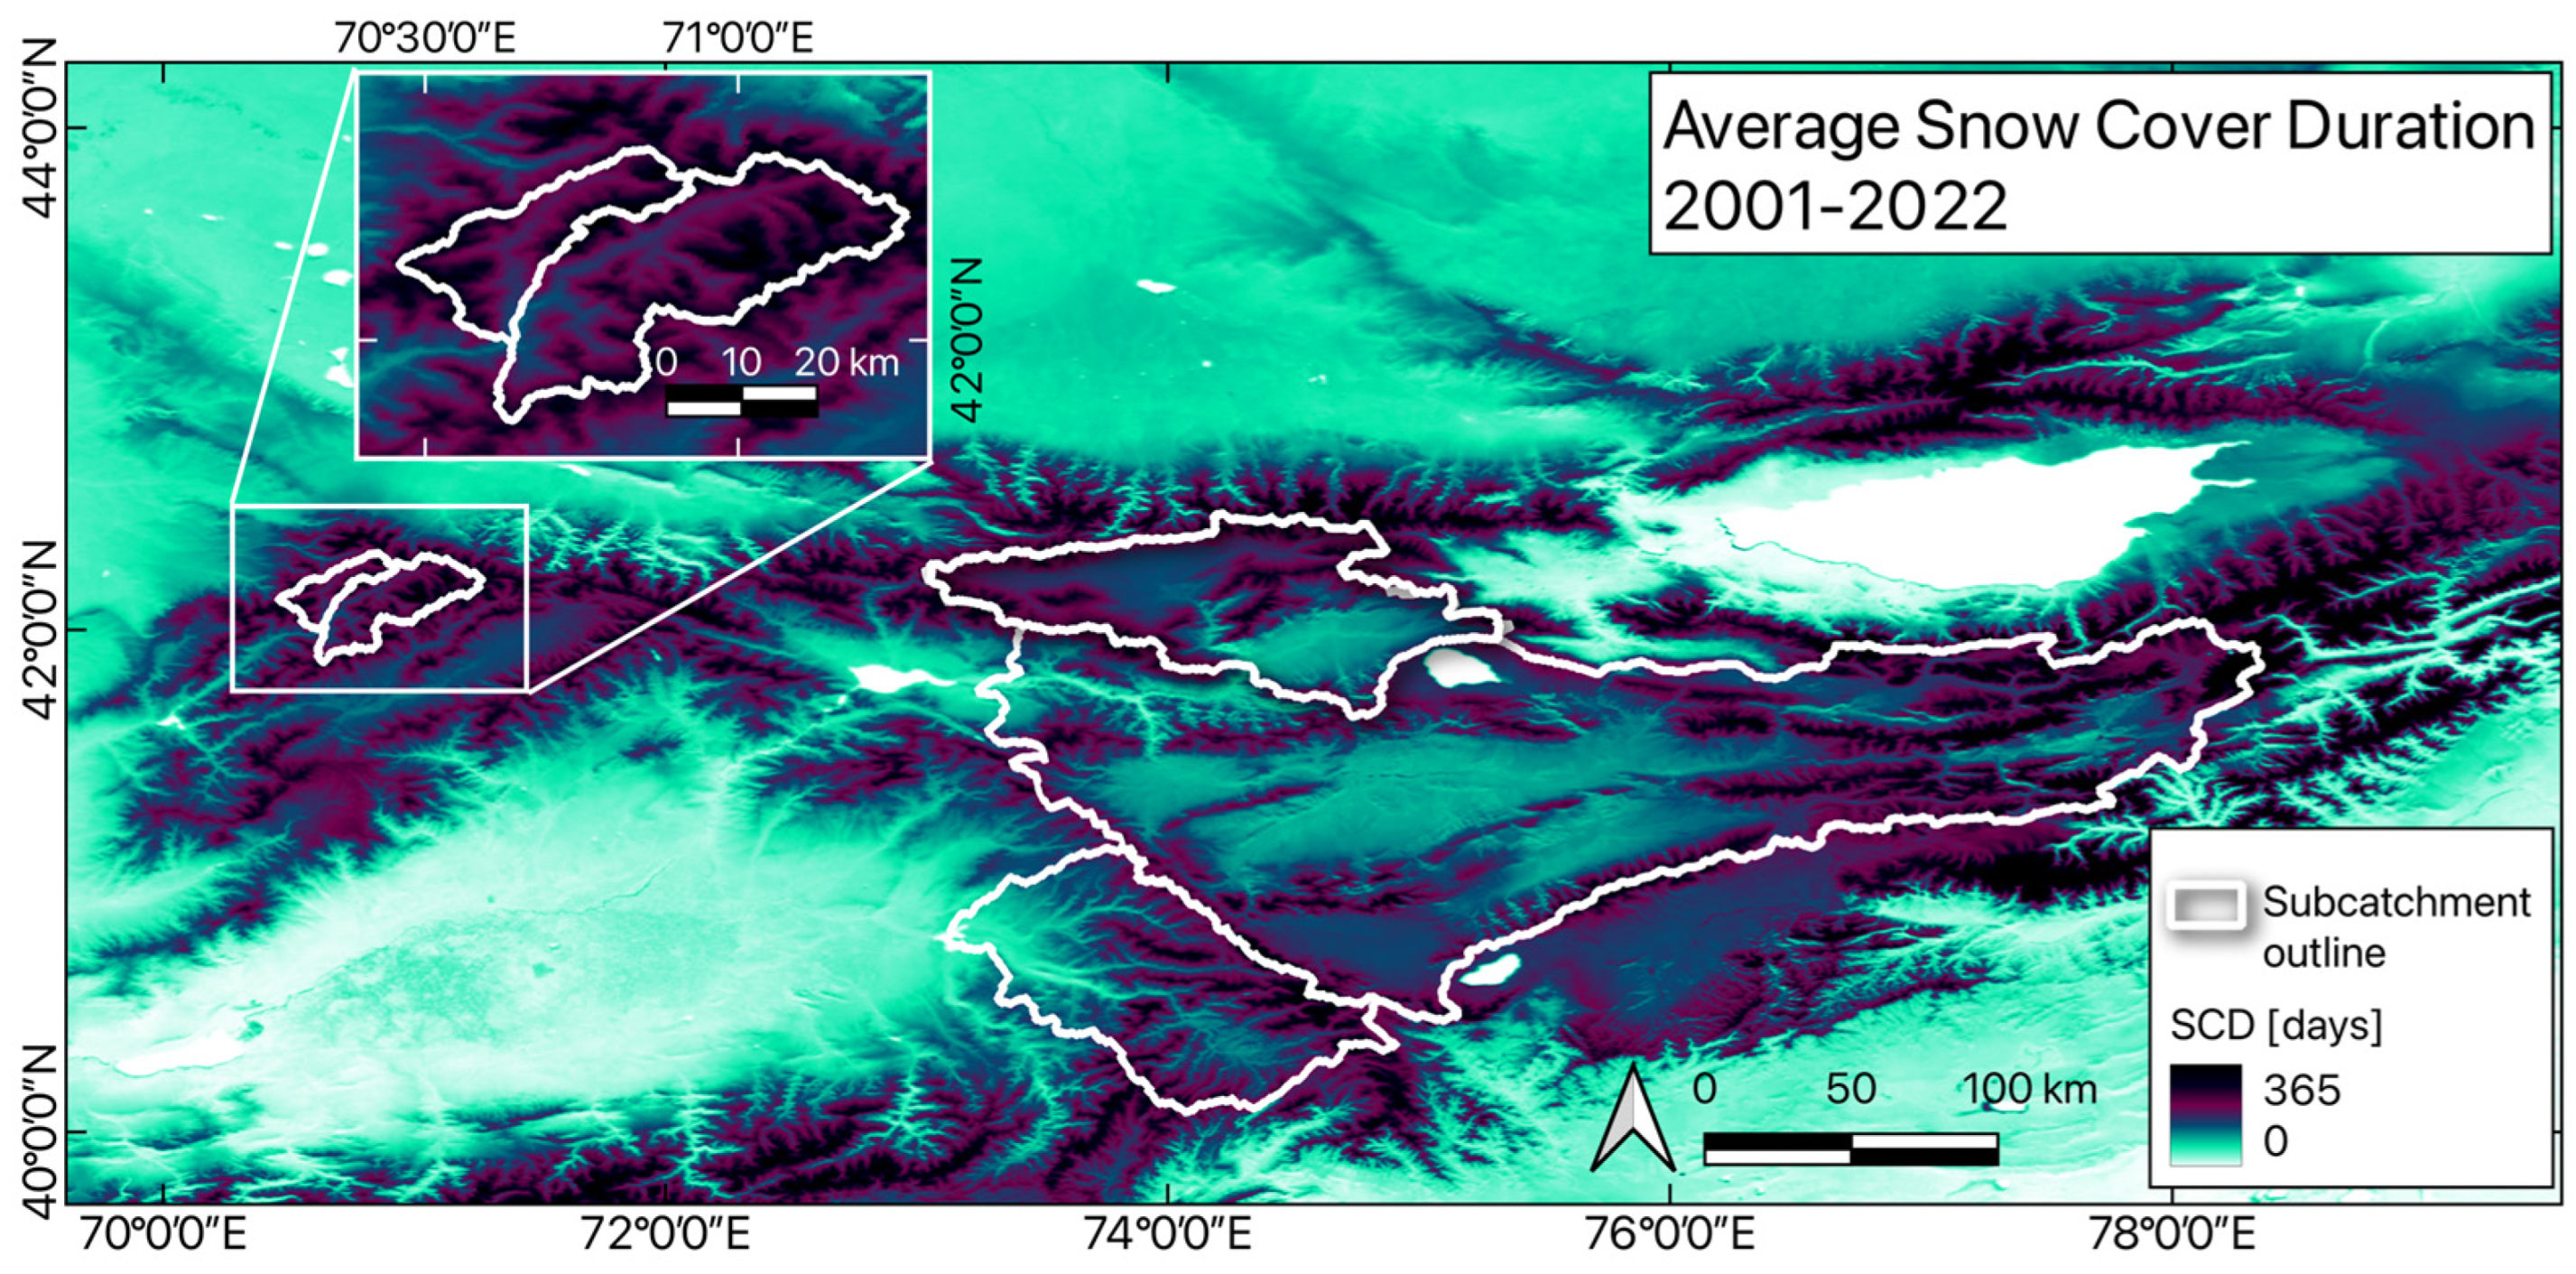
Figure 2 illustrates the mean snow cover duration for the study region derived from GSP. The dataset is available as a daily, binary product since September 2000, containing information about the presence/absence of snow. It can be used to derive products such as “Snow Cover Duration” (SCD), Early- or Late-Season SCD, as well as trends of the aforementioned duration products.
To determine annual snow cover parameters, annual observation periods (AOPs) are used. These do not start on 1 January, like Julian years, but are set to begin around the time of minimum snow cover in the research area [12,39]. The first day of an AOP is the 1 September and the last day the 31 August of the following year. AOPs are named after the years they end in. Therefore, the time period begins with AOP 2001 and ends with AOP 2022, comprising 22 years of snow cover data.
Snow cover duration is calculated from the GSP, by cumulating pixel values over the length of the AOPs with Equation (1):
S C D = i = 1 n s i
where n is the length of the AOP, either 365 or 366, i is an index, which represents the day of the AOP running from 1 to 365/366, and s i is the binary snow information (1 for “snow-covered”, 0 for “snow free”) [43]. The result is a pixel value ranging from 0 (no snow cover over the whole year) to 365/366 (covered with snow throughout the year). In order to achieve comparable values for leap years and common years, the SCD value is divided by the number of days of the AOP and multiplied by 365.25 [6].
Early and late seasons are defined to enable observing shifts in snow patterns towards the beginning or end of the snow-covered period. These can have effects on the radiation budget and on run-off characteristics due to changes in snowmelt [43]. Seasons are separated at the beginning of the mean maximum snow cover extension [12], which occurs around December/January. Seasonal SCD is then calculated according to Equations (2) and (3):
S C D E S = F d S C D b F d
S C D L S = F d S C D a F d
where F d is the fixed date when seasons are separated (1 January), and S C D b F d and S C D a F d are the SCD before and after the fixed date, respectively [30]. This results in an early season (ES) lasting from 1 September to 31 December (122 days) and a late season (LS) from 1 January to 31 August (243/244 days) [39]. Late-season values are normalized in the same way as the full AOP, by dividing them by the number of days of the late season and then multiplying them by 243.25.
In the next step, the SCD raster data are clipped with shapefiles outlining the catchments upstream of the discharge measuring stations to extract snow cover duration for catchment areas [30].
The arithmetic mean of all pixel values within a catchment was calculated for every season (SCDES for early season, SCDLS for late season) to enable investigation of interannual and intra-annual snow cover changes [30], as the mean is more sensitive to outliers within the data than the median. In addition, the standard deviation gives information on the variability of values over the AOPs [44].
Apart from snow cover duration, snow cover melt timing can have influences on the hydrograph [12]. The snow cover melt day can be parametrized using temperature data [30], for example, by determining the first day after the last five consecutive days with an average temperature above 0 °C [45]. In an attempt to derive melt timing on a catchment level from snow cover data alone, fractional snow cover per day for each catchment and AOP was determined and normalized by using the maximum value per AOP as 100% (SCFnorm). The last day of an AOP (DAOP), when the SCFnorm of a catchment was 95% or over, was determined as Melt onset.
Using only one snowmelt date has been suspected to be insensitive to snowfall occurring after the calculated day [12]. To take late snowfall into account, the last day of the AOP when SCFnorm ranged between 55% and 45% was calculated and used as Melt half. The number of days between Melt onset and Melt half (Melt delta) is used to derive the duration of snowmelt and enable observing the effects of the latter on runoff behavior. Melt onset and Melt half were normalized as well by dividing them by the number of days of the AOP and multiplying them by 365.25.
A mask separating the watersheds into elevation bands of 100 m was generated, as snow cover duration is expected to increase with altitude [13,39,46]. This mask was subsequently used to conduct an elevation-dependent analysis.

2.3. Hydrology

Remotely sensed snow cover data have proven to give good results in combination with single-point in situ discharge measurements [12,30]. Runoff information was obtained from the Sensor Data Storage System (SDSS, https://sdss.caiag.kg/sdss/, accessed 10 November 2022) and the Central Asia Regional Water Information Base (CAREWIB, cawater-info.net, accessed 1 November 2022).
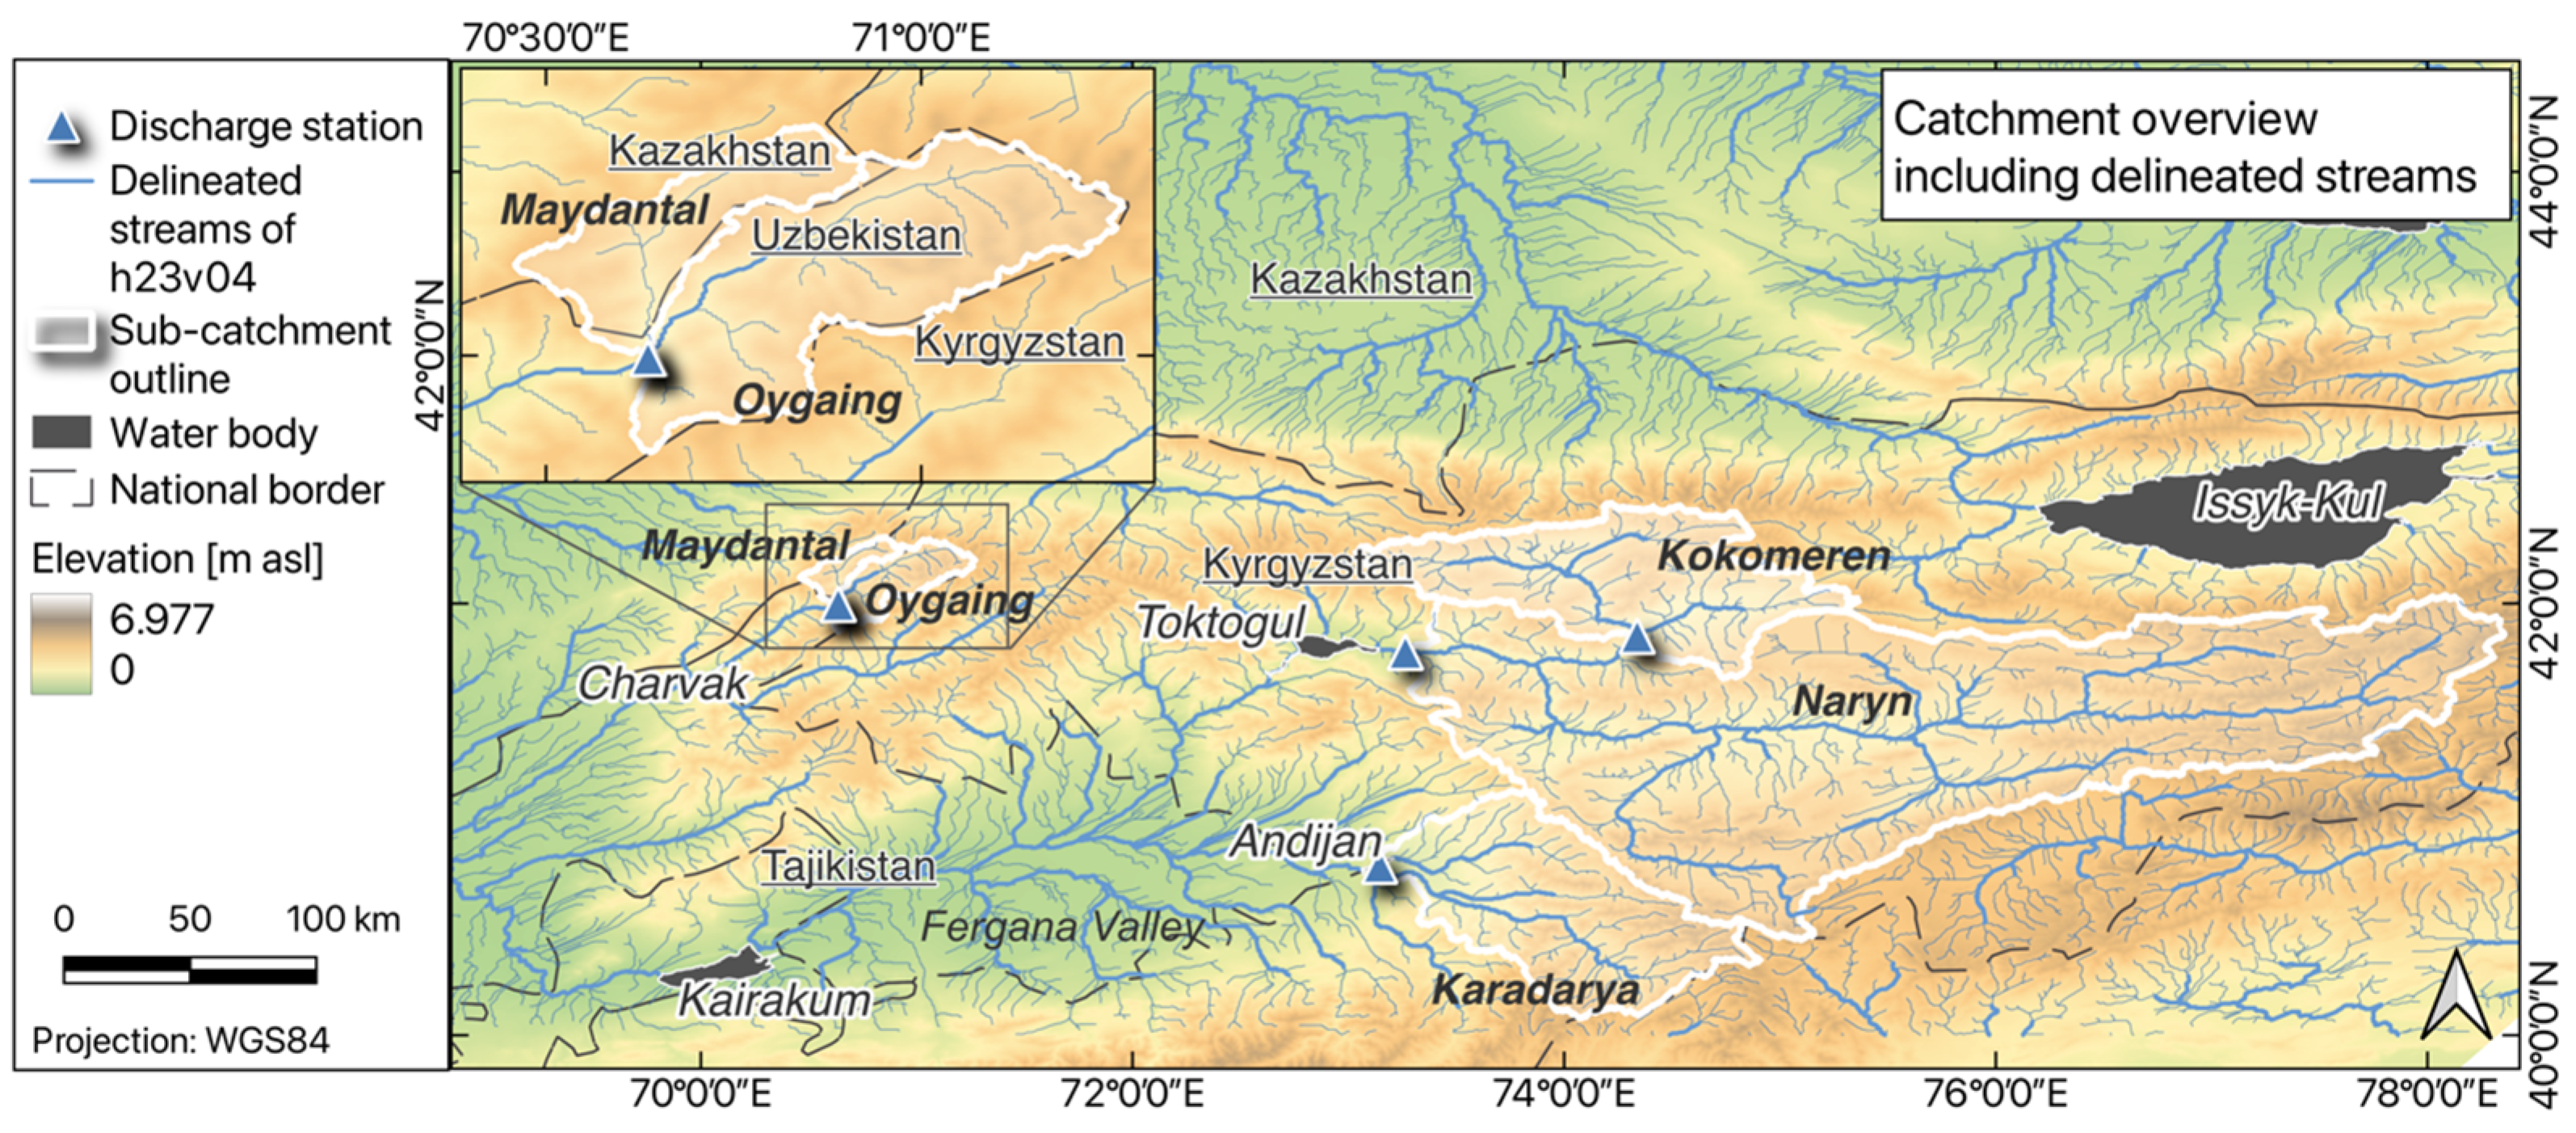
Gauges measuring catchment discharge were required to be located in the mountainous headwater area of the catchment and upstream of any water reservoir or major withdrawal that would distort runoff data [39,47]. Five discharge stations gauging headwater catchments of the Syr Darya were selected (see Figure 3). Water bodies and national borders were obtained from Esri [33,37], elevation data from the GMTED2010 [48]. The catchment area upstream of a measuring station was named after the gauged river. CAREWIB station data were available for the AOPs from 2000 to 2015 in the form of runoff measurements every 10 days. The stations measure the inflow into the reservoir lakes Toktogul (Naryn River) and Andijan (Karadarya River). Due to the construction of the Kambarata II dam and its installation from 2007 to 2010, data from the Naryn River were not used from the AOP 2011 onward. The Karadarya measurements showed no runoff peak for the years 2000 and 2001, which is why the data were removed to prevent distortion of trends.
Kokomeren station measures the discharge of Kokomeren River about 100 km upstream of Toktogul reservoir. At the confluence of the Maydantal and Oygaing rivers, two stations gauge the respective streams. SDSS data were not available for the same time period as CAREWIB data (Table 1), which significantly reduces the possibilities of statistical analysis. Furthermore, the stations Kokomeren and Maydantal showed major gaps, which could have been caused by sensor malfunctions due to low water levels [49].
To isolate headwater discharge connected to spring snowmelt, only the months of spring runoff (1 March (DAOP 183) to 31 July (DAOP 335)) were selected [30,45]. SDSS discharge measurements did not always have regular intervals. This was countered by creating daily runoff means and removing annual observation periods that did not exhibit continuous spring/summer runoff measurements.
Runoff parameters were selected to display the timing and amount of runoff caused by spring snowmelt. The value (Value Qmax) and date (DAOP Qmax) of maximum stream flow indicate when and with which intensity a runoff peak occurred [50]. Additionally, the days of fixed quantiles of spring runoff have proven to be robust timing measures [50]. For the 5th percentile date, this is the day of the annual observation period when 5% of cumulated spring runoff has passed the gauge [29,30,45,47]. The 10th, 50th, 90th, and 95th percentiles were calculated in an analogous way. Q5% and Q10% are expected to display changes in the early stages of spring runoff. Q50% gives information on mid-season changes. Q90% and Q95% include the end of spring runoff when the runoff peak from snowmelt has passed and rainfall may influence the hydrograph [45]. Just like melt timing measures, runoff timings were normalized to level the difference between leap and normal years. All 12 used parameters of snow cover and runoff timing are listed in Table 2.
Discharge data for Kokomeren in the AOP 2016 included a runoff peak but were not available from DAOP 318 to DAOP 335, which is why runoff percentiles were not used, but Value Qmax and DAOP Qmax were used. Table 1 summarizes the location and measurement specifications of the gauges, and Figure 4 visualizes what AOPs of discharge data were used.

2.4. Statistics

2.4.1. Pearson’s Correlation

The relationships between parameters of snow and runoff timing are examined by using Pearson’s correlation coefficient, which has proven to give good results for this kind of inquiry [30]. Pearson’s correlation coefficient detects linear connections. It can take on a value between 0 and 1. The closer it is to 1 the stronger the correlation, 0 meaning no relationship at all. The sign indicates if the relationship is positive or negative. An increase in one parameter is either linked to an increase (positive correlation) or a decrease in another (negative correlation). A relationship is regarded as strong if it is larger than 0.8, moderate if it is larger than 0.6, and weak if it is larger than 0.4 [30].
Pearson’s correlation was calculated using the “pandas” module Python [51,52]. Due to the differing availability of the data, correlation coefficients were only calculated for the shorter of the two timeframes for every pair of variables. Thus, snow cover parameters were correlated over the whole time period, while runoff data and snow cover data were correlated over the time period with available in situ data.

2.4.2. Mann–Kendall Trend Test

The Mann–Kendall non-parametric trend test (MK test) [53,54] was applied to determine if and at what significance level trends occurred. Significance levels of 0.05, 0.1, and 0.2 were used [19,30]. Theil–Sen’s slope estimator [55] is used to determine the magnitude of the trend. It is more robust towards outliers than a simple linear regression and is thus used to calculate the slope of the trend per time unit [6]. MK test and Theil–Sen slope have proven to be useful tools for detecting changes in hydrometeorological time series [29,30,44,56]. The slope and significance of a trend were calculated for the whole time period of available snow cover data as well as for the limited time period when runoff data were available to aid comparison between snow cover and runoff trends [6].
Trend analysis was carried out in Python using the “original_test” of the “pymannkendall” module [57]. The pixel-based trend analysis used for elevation-specific investigation was calculated with the “scipy.stats” module [58].

3. Results

3.1. Snow Cover

Snow cover was heterogeneously distributed over the area and years. Figure 2 shows the mean snow cover duration for the years 2001 to 2022, with water bodies such as Issyk-Kul Lake and Toktogul Reservoir being easily recognizable with an average snow cover duration of zero. These are contrasted with regions covered with snow year-round, likely glaciated areas [39]. The Fergana Valley in the southwest of the investigated catchments is identifiable by its shorter SCD.
Table 3 shows the mean values of SCD and melt timing measures and their standard deviation. The distribution of values between the catchments turned out to be similar for most parameters. The lowest SCD was observed for Karadarya for both seasons, with an average of 177.12 days per AOP; it also exhibited the earliest Melt onset and Melt half day. The average SCD per annual observation period of Maydantal was about 44% higher at 254.71 days; Melt onset and Melt half days were the latest for this catchment. Naryn, Kokomeren, and Oygaing snow cover duration and melt parameters are in between with increasing values. Melt delta length was distributed differently with Oygaing having the longest and Naryn the shortest. Naryn had the shortest (6.43 days SCDES) and longest (12.3 days SCDLS) standard deviation for the early and late seasons of all catchments. Naryn and Karadarya had the lowest standard deviation for SCDES and the highest for SCDLS and Melt onset. The Oygaing standard deviation for the Melt half was almost twice the number of the other catchments. The Melt delta standard deviation was around 13 days for Maydantal and Kokomeren and around 20 days for the other catchments.
Mean values of snow cover duration and melt timing provide an overview of differences between the catchments. However, for the analysis of anomalies and extreme events, single-year values are more useful [39]. Figure 5 shows the daily fractional snow cover of the catchments for the AOPs 2001 to 2022. Maydantal and Oygaing SCD is visibly longer and melt occurs later compared to the other catchments. Karadarya, and Naryn with its sub-catchment Kokomeren have similar snow cover patterns due to later snow presence and earlier snow disappearance. Karadarya snow cover seems “patchier” with a higher variability within the time of snow cover. As no parameter was fit to measure this kind of snow cover variability during the snow season, this would need to be verified in further studies.
At first glance, a very early Melt onset day in 2007 is noticeable for Karadarya, Kokomeren, and Naryn. For Naryn, it occurred 90 days earlier than the average. SCD was very low that year for the named catchments. Naryn’s early season was 8.5 days shorter than the average and late season was 38.5 days shorter. Snow cover remained low for the rest of the AOP, but only fell below 45% of SCFnorm after DAOP 226, creating an exceptionally long Melt delta (76 days longer than mean). Maydantal and Oygaing had average SCD in 2007. For these catchments, minimum SCD occurred a year later in 2008. Early and late season both were shorter than usual so that total SCD lasted about 32 days shorter. Earlier Melt onset and Melt half led to the Melt delta being 8.8 (Maydantal) and 2.4 (Oygaing) days shorter than average.
Maximum SCD occurred in 2002 for Maydantal and Oygaing, in 2003 for Naryn, and in 2017 for Karadarya and Kokomeren. Snow cover parameters behaved differently for these years. The 2002 Melt delta was 18 and 35 days longer for Maydantal and Oygaing, respectively, due to the later Melt half. The 2003 Melt delta was just one day longer for Naryn but Melt onset and Melt half were around 20 days later. The 2017 Melt delta was 4 days longer for Karadarya, due to the later Melt half, but was almost 10 days shorter for Kokomeren due to the later Melt onset. The very late Melt half day of Oygaing in 2015 (DAOP 359) occurred when snowfalls in August raised the normalized snow cover by over 45%. A long SCDES occurred afterwards, in 2016.
The Mann–Kendall test was applied to detect trends in snow cover and melt measures. Trend results and their level of statistical significance are shown in Table 4 for the whole time period of available snow cover data and in Table 5 for the time periods when runoff data were available. In the following, the time frame to which the trend applies is indicated in brackets. No significant trends of SCD or melt parameter increase occurred. At the significance level of p < 0.05, Oygaing SCDLS (long) decreased by 0.66 days per year. With an increased threshold, at the significance level of p < 0.1, SCDLS showed a decreasing trend for the catchments Karadarya, Kokomeren, and Maydantal (long). Melt onset fell for Kokomeren (short and long) and Naryn (long). Melt half advanced for Kokomeren and Naryn (short). At the significance level of p < 0.2, Maydantal late-season snow cover duration decreased (short) by 4.84 days per year. SCDLS decreased for Naryn (long) and for Maydantal and Kokomeren (short). Melt half advanced for Karadarya, Kokomeren, Maydantal, and Oygaing (long). Melt delta decreased for Karadarya (short and long), with a steeper slope for the shorter time period (−1.5 days per year).
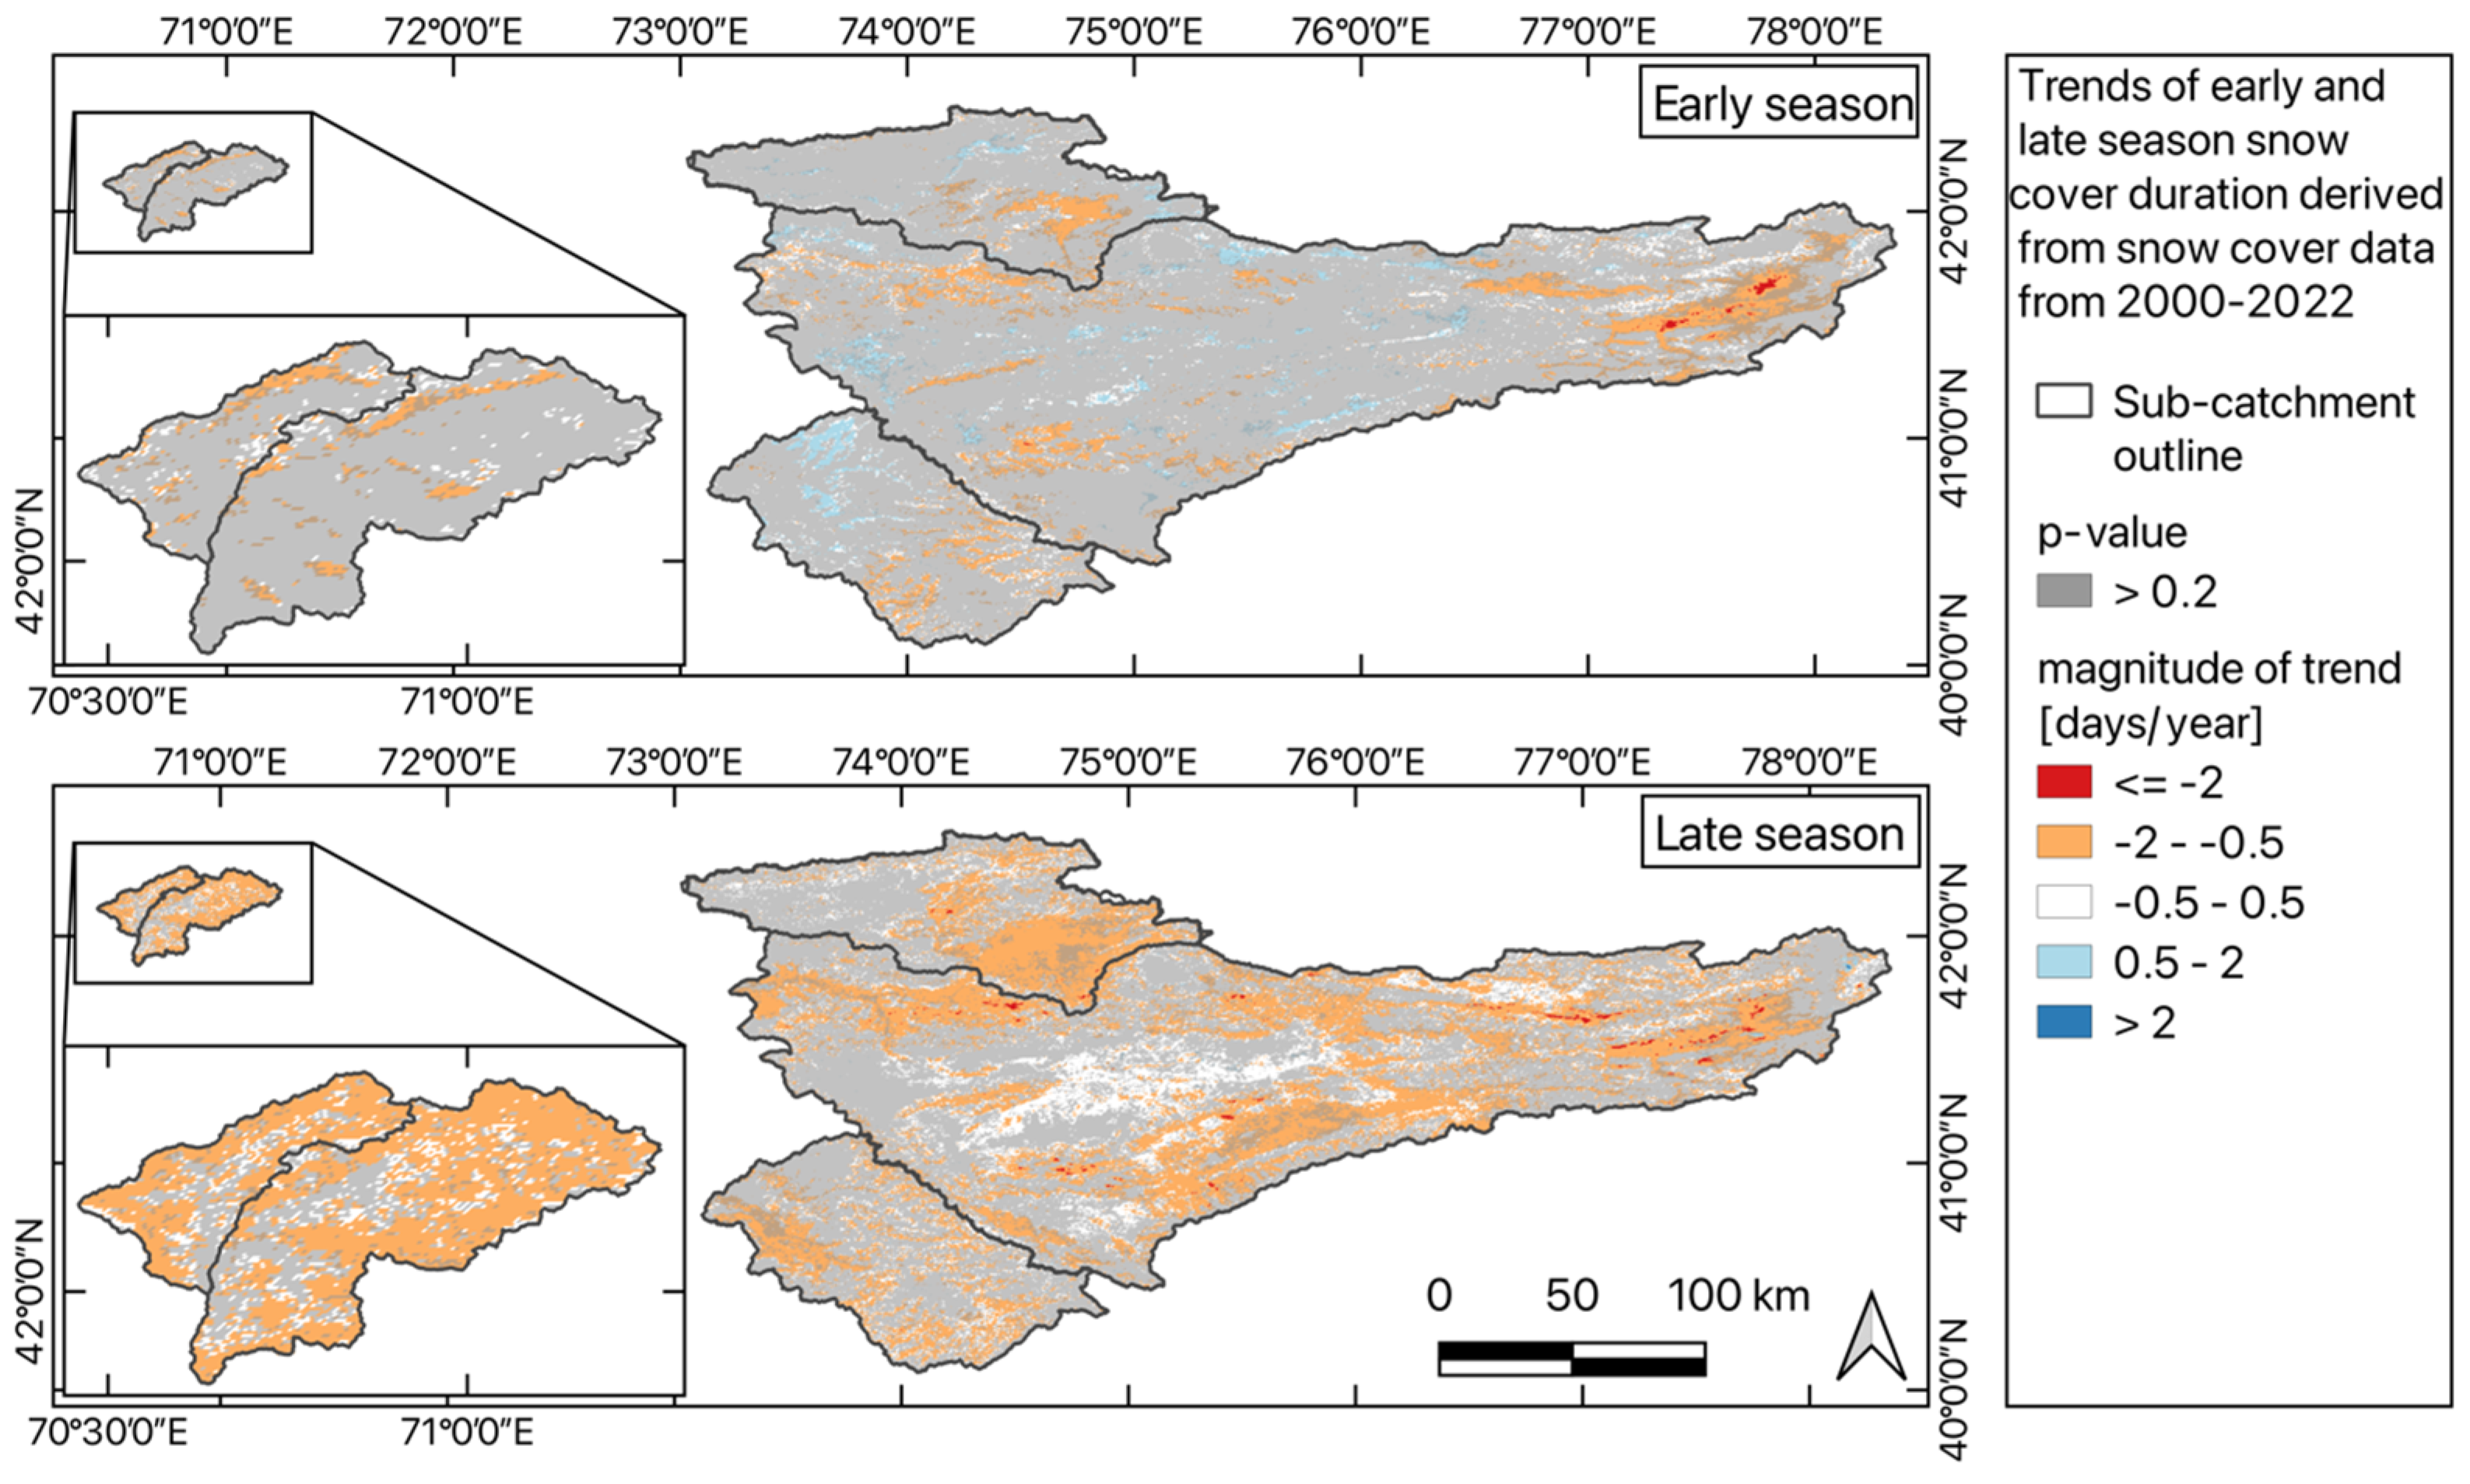
In Figure 6, the snow cover duration trend is shown for every pixel for both, the early and late seasons. Visible is the dominance of a decrease in SCD over an increase in SCD. SCDLS trends were more significant, especially for the catchments Oygaing and Maydantal. Kokomeren snow cover duration decreased especially in the south-east of the catchment; Naryn SCD furthermore had negative trends in the very eastern part.
Altitude-related SCD change graphs can be found in Appendix A. Late-season trends were significant at a threshold of p < 0.2 for Maydantal and Oygaing as well as Kokomeren. There were no significant trends of increasing SCD. Maydantal and Oygaing showed decreasing SCD trends for the two upper thirds of the catchments (around 2500 m upward) of about 0.35 to 0.75 days per year. Maydantal p-value increases over 0.2 for the last two elevation steps. Kokomeren had significant negative trends in the lower fifth of the catchment (1500 m to 2000 m) with a decrease of around one day per year. A higher SCD for Maydantal and Oygaing is visible. Average snow cover [%] is higher than the snow cover at the same elevations for the other catchments.

3.2. Hydrology

Absolute discharge volumes of the catchments varied drastically. Kokomeren had the smallest, and Maydantal had the largest volume, around 20 times that of Kokomeren. Oygaing catchment had a lower contrast between winter and summer runoff than the other catchments. Table 6 shows the average values of runoff parameters.
Value Qmax standard deviation is displayed as a fraction of the mean to allow for better comparability as absolute maximum discharge volume varied greatly over the catchments [59]. Value Qmax was more variable in Karadarya and Naryn than for the other catchments, and ranking catchments by DAOP Qmax created a similar succession as ordering them by snow cover measures. Karadarya had the earliest mean peak discharge and Oygaing and Maydantal had the latest. Kokomeren’s average peak discharge was earlier than that of Naryn, but the other runoff timing measures occurred after those of Naryn. Kokomeren was the only catchment where DAOP Qmax occurred before the 50th runoff percentile. The standard deviation was lowest for Oygaing runoff timing measures.
Figure 7 shows mean daily (SDSS data) and 10-day (CAREWIB data) runoff values.
Years of low Value Qmax were 2020 (Oygaing −7%, Maydantal −11%, Kokomeren −16%) and 2007, when Karadarya (−55%) and Naryn (−34%) had particularly low peak discharge values. While peak discharge occurred early for Karadarya (−38.38 days), Naryn’s peak discharge was later than usual (+11.03 days) that year. High Value Qmax of the catchments was in 2010 (Karadarya +81%, Naryn +59%), which was later than usual. Around the same time, the discharge peak occurred a year before, but it was much lower. Maydantal peak discharge in 2017 was higher (+14%) and earlier than the average. Highest Kokomeren peak discharge occurred in 2016 (+30%). All snow cover and runoff values can be found in Appendix B.
The results of the MK test for runoff parameters are shown in Table 7. There were no trends at the significance level of p < 0.05. For p < 0.1, Oygaing Q50% and Q90% showed a decrease of −2.17 and −1 days per year, respectively. For p < 0.2, there was a decrease in Karadarya Value Qmax by −14.68 m3/s per year, which is around −3.64% of the average Value Qmax. Kokomeren Q10% and Q50% decreased by −0.4 and −1.5 days, respectively. Naryn Q5% decreased by 0.07 days per year.

3.3. Pearson’s Correlation

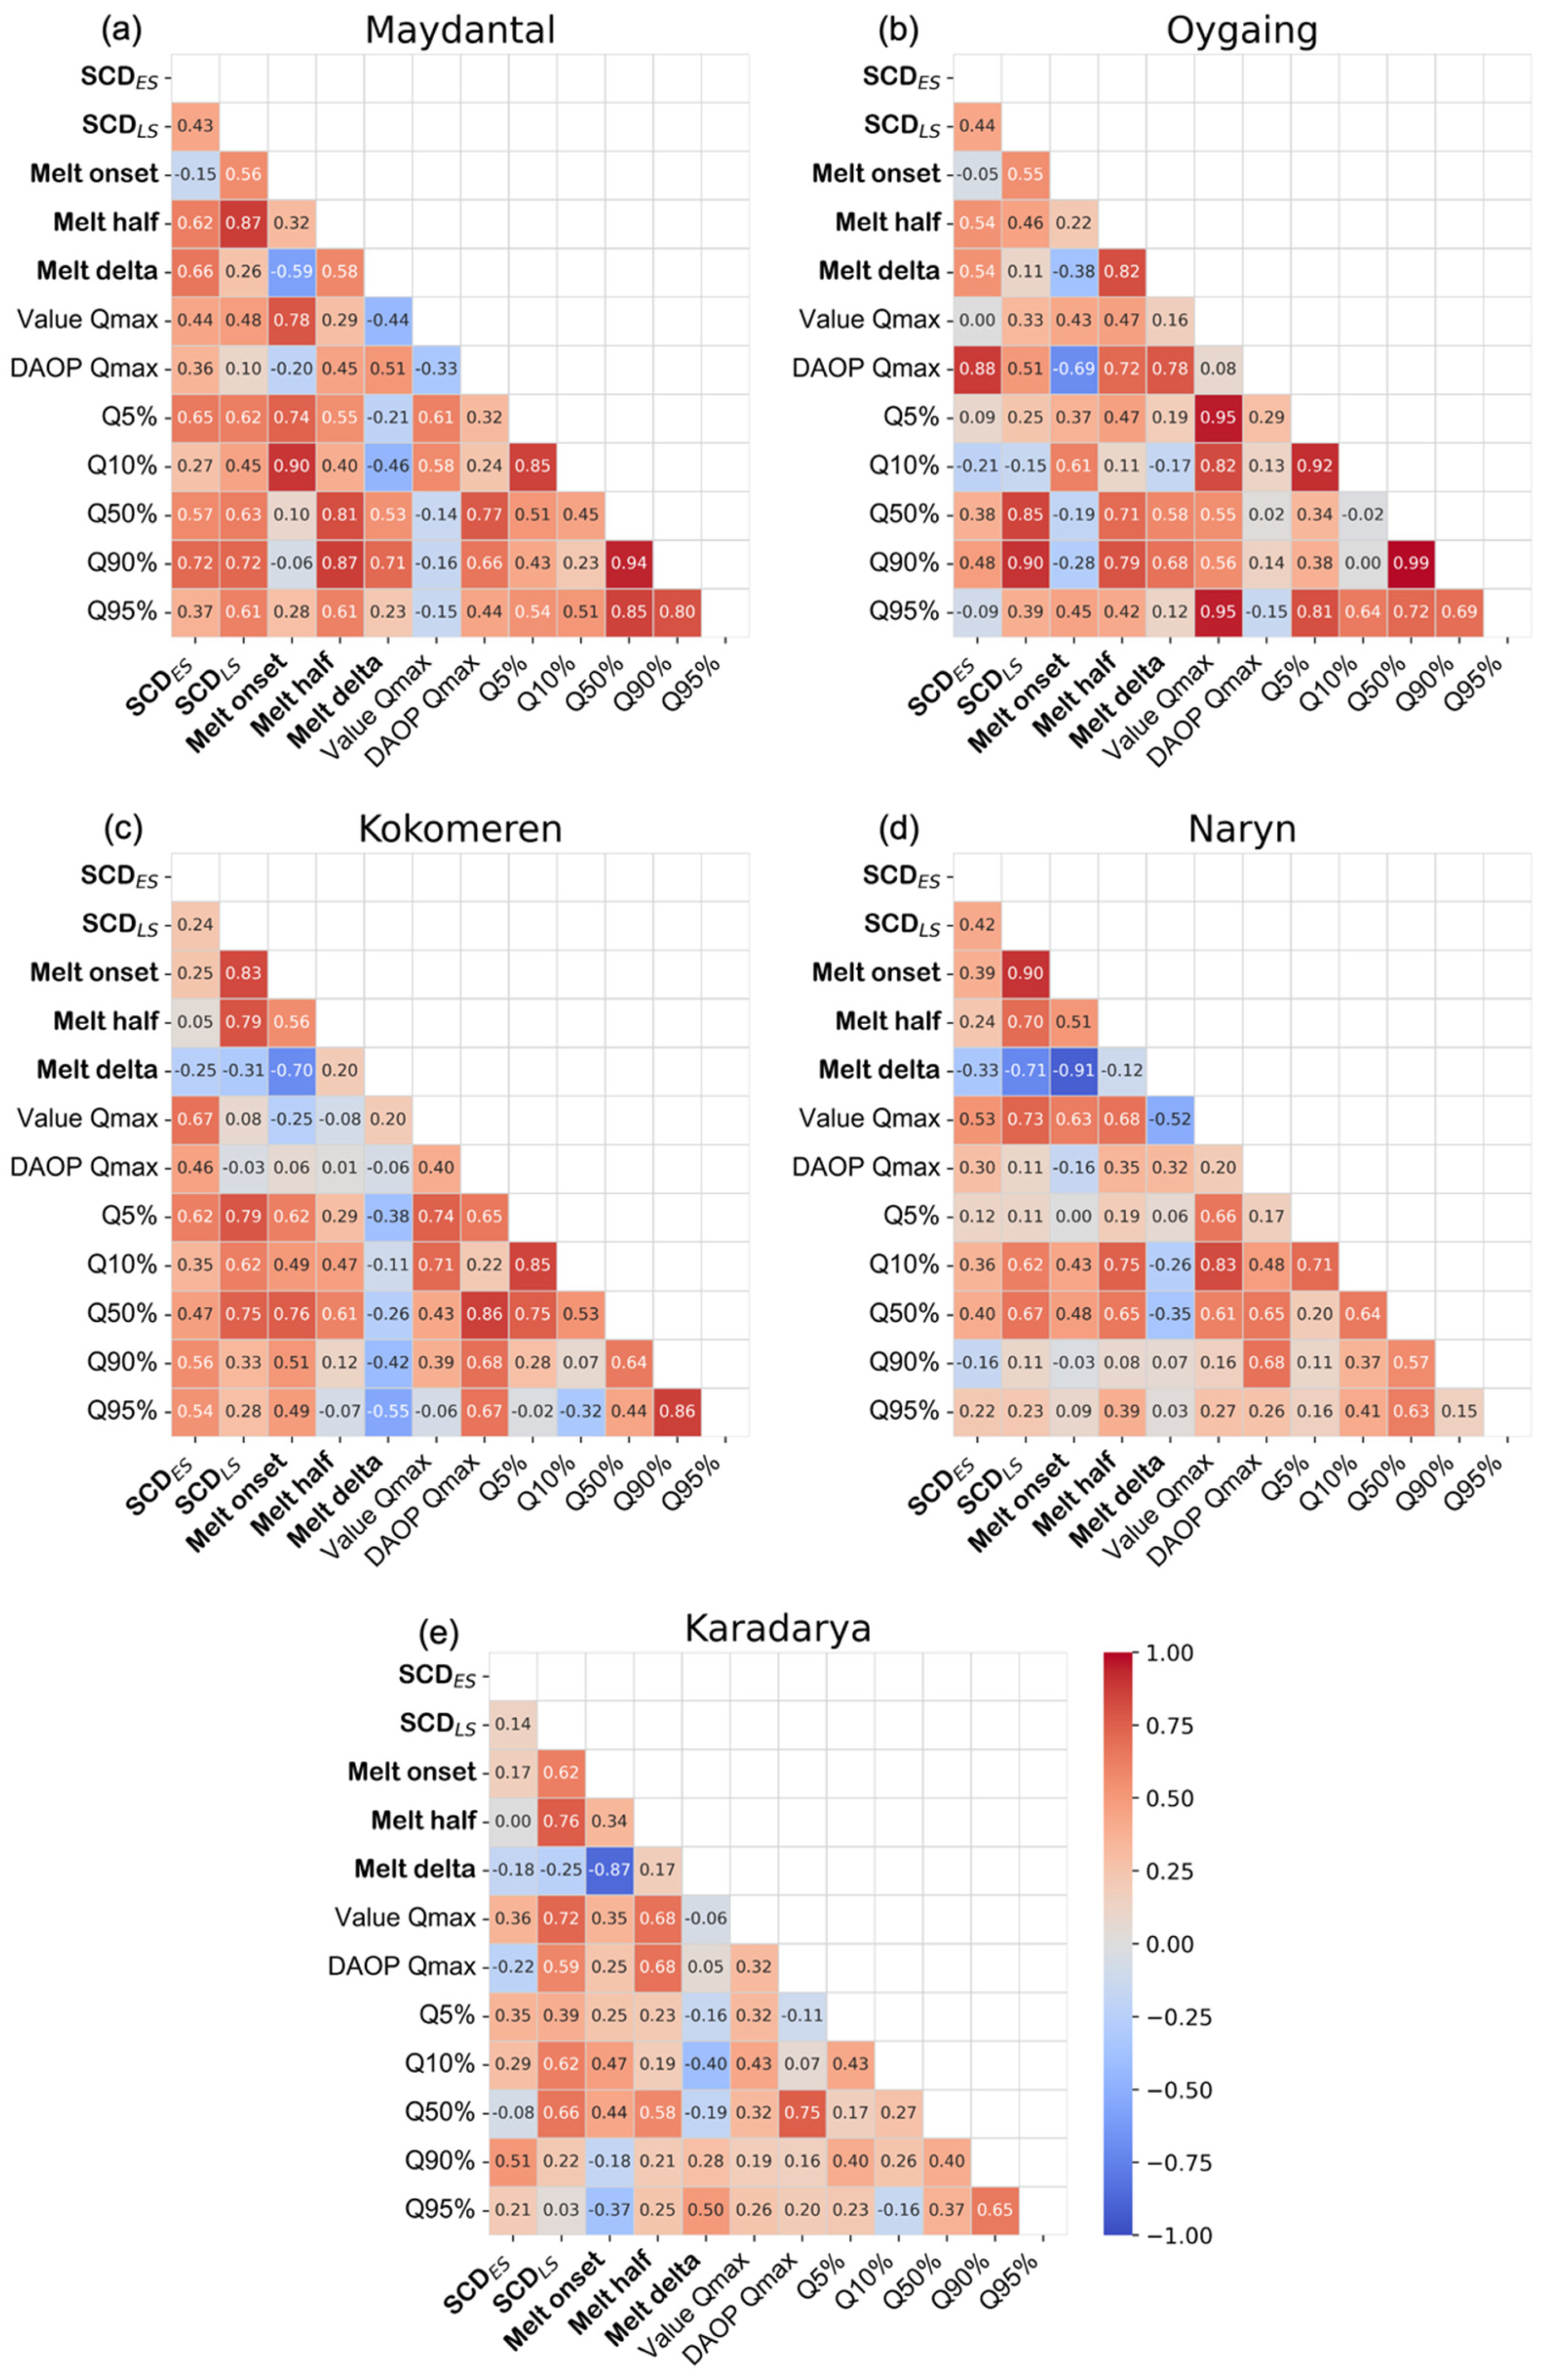
Figure 8 shows correlation matrices of the parameters for the different catchment areas. All catchments exhibited positive correlations between late-season snow cover duration (SCDLS) and Melt onset as well as Melt half. Apart from Oygaing, all catchments had negative correlations of Melt onset and Melt delta. These were strong for Naryn and Karadarya. Value Qmax generally had stronger correlations with earlier runoff measures, and DAOP Qmax with later runoff timing measures. The most correlations classified as “strong” had Oygaing, the fewest Karadarya.
Snow cover parameters SCDES and SCDLS correlated positively with runoff percentile dates. Correlations were stronger for SCDLS than for SCDES. SCDLS had a positive correlation with Q50% for all catchments, which was weak for Naryn and strong for Oygaing. For the three larger catchments, SCDLS correlated only with runoff timing measures up to Q50%. Maydantal SCDLS correlated weakly to moderately with all runoff timing measures. Oygaing SCDLS correlated strongly with Q90%.
Snowmelt parameter Melt onset correlated positively with all runoff timing measures of Kokomeren and with early runoff timing measures for Maydantal and Oygaing. Melt half correlated positively with most runoff timing measures of Maydantal and Oygaing, apart from Q10% for Oygaing. For Kokomeren and Naryn, the Melt half correlated with early to middle runoff parameters. For Karadarya, there was a weak correlation with Q50%. Melt delta correlated positively with middle to late runoff for Maydantal and Oygaing, but weakly negative for late Kokomeren runoff parameters.
While runoff percentile dates generally showed similar correlations for catchments with similar characteristics, DAOP Qmax and Value Qmax were more complex in their relationships with other parameters. For Value Qmax, a positive correlation existed with SCDES for Maydantal and Kokomeren and with SCDLS for Maydantal, Karadarya, and Naryn. It correlated positively with Melt onset and negatively with Melt delta for Maydantal. Correlations with Melt half existed for Naryn and Karadarya. Oygaing had a strong correlation with Value max for Q5% and Q10%, as well as with Naryn for Q10%.
DAOP Qmax correlated positively with SCDES for Oygaing and Kokomeren as well as with SCDLS for Oygaing, Kokomeren, and Karadarya. Melt onset correlated negatively with DAOP Qmax for Oygaing and positively for Kokomeren as well as positively with Melt half for Oygaing, Maydantal, and Karadarya. It correlated positively with Melt delta for Maydantal and Oygaing and negatively for Kokomeren. Runoff timing measures showed the following connections. Maydantal, Kokomeren, and Karadarya had positive correlations of DAOP Qmax and Q50%. DAOP Qmax and Q90% had a negative correlation for Oygaing but a positive one for Maydantal and Kokomeren; Kokomeren furthermore of DAOP Qmax and Q95%. Only one (weak) correlation existed for Naryn between DAOP Qmax and runoff timing measures. No correlations existed between Value Qmax and DAOP Qmax.
DAOP Qmax correlated positively with SCDES for Oygaing and Kokomeren as well as with SCDLS for Oygaing, Kokomeren, and Karadarya. Melt onset correlated negatively with DAOP Qmax for Oygaing and positively for Kokomeren as well as positively with Melt half for Oygaing, Maydantal, and Karadarya. It correlated positively with Melt delta for Maydantal and Oygaing and negatively for Kokomeren. Runoff timing measures showed the following connections. Maydantal, Kokomeren, and Karadarya had positive correlations of DAOP Qmax and Q50%. DAOP Qmax and Q90% had a negative correlation for Oygaing, but a positive one for Maydantal and Kokomeren; Kokomeren furthermore of DAOP Qmax and Q95%. Only one (weak) correlation existed for Naryn between DAOP Qmax and runoff timing measures. No correlations existed between Value Qmax and DAOP Qmax.

4. Discussion

4.1. Relationship between Snow and Runoff Parameters

Snow cover duration was higher at higher elevations as temperatures decreased with altitude, and rainshadow effects caused precipitation to be higher at mountain peaks than in valleys [18,32,39]. Measures of SCD, Melt onset, and Melt half were lowest for Karadarya, followed by Naryn, Kokomeren, Oygaing, and Maydantal. Longer SCD of Maydantal and Oygaing can be linked to their elevation distribution and their geographic location. High SCD of the smaller catchments to the west is likely caused by lower average temperatures and more precipitation during the accumulation season (in the form of snow). While Karadarya and Naryn include areas at lower altitudes (12.5% and 1.2% of catchment area below 1500 m, respectively), the smaller catchments are located exclusively above 1500 m and thus will be affected by temperature-induced melt later than the others, when mean temperatures are higher at lower elevations.
Late-season snow cover duration influenced runoff timing. For every catchment, SCDLS was positively correlated with runoff timing measures so that a long SCDLS was more likely to lead to late runoff timing and vice versa [30]. The smaller catchments Maydantal and Oygaing had correlations of SCDLS with Q90%. The longer average SCDLS possibly leads to late runoff parameters within the fixed time period of “spring runoff” to be influenced by snowmelt. The same hypothesis would explain the positive correlation of Melt half with early runoff timings for Kokomeren, Naryn, and Karadarya and with later ones for Maydantal and Oygaing. Oygaing’s early runoff “insensitivity” to SCDLS could be caused by the catchments’ high winter baseflow. For Kokomeren, Naryn, and Karadarya, the runoff measures Q90% and Q95% did not correlate with SCDLS. The long distance from the furthest point of the gauge until the measuring station might increase the possibility of distortions from land cover type, land use, or other factors. Karadarya has the largest fraction of irrigated agriculture (25%) and forest cover (17%), which influences runoff behavior. Soil moisture, for example, is retained longer in forested areas. Saturation and subsequently runoff are reached earlier [60]. Like SCDLS, Melt onset had an influence on early runoff timings. The correlation of Melt onset with runoff start was strong for the small catchment Maydantal. For the smaller catchments, the beginning of snowmelt is more likely to occur closer to the gauge and thus affect runoff earlier. The difference in correlation intensity of the almost equally sized Kokomeren and Karadarya could be related to the different land cover before the gauge as well.
Like Melt half, Melt delta correlated positively with late runoff measures of Maydantal and Oygaing. An elongated snowmelt leads to later late runoff timing. Due to the shorter average SCD, late runoff timing of the more eastern catchments was less affected by snowmelt, but likely by spring and summer precipitation.
The correlation of SCDES and runoff timing was strongest for Maydantal and Kokomeren. They also exhibited correlations of SCDES and Value Qmax. SCDES and SCDLS have only weak or absent correlations. An influence of long early-season SCD on the latter could be due to lower land surface (caused by insulation) and air (caused by albedo) temperatures. However, the influence of early-season SCD on late runoff timing would need to be further investigated as Pearson’s correlation does not prove causality but only indicates analogous change. SCDES is likely not a reliable indicator for late runoff timing [29].
Runoff volume was by far the highest for the smallest catchments of Maydantal and Oygaing. These catchments had the longest SCD and the largest fraction of the area covered with snow. For the larger catchments, water has more time to evaporate and percolate. Irrigated agriculture and urban areas within the catchment area can contribute to a reduction in runoff volume. Nevertheless, sensor malfunction or measuring differences cannot be ruled out, especially as runoff data were obtained from two different sources.
Average peak discharge was the earliest for Karadarya and the latest for Maydantal, which is in accordance with the succession of SCDLS and Melt onset over the catchments. Although Kokomeren had a longer SCDLS, the average peak discharge was earlier than that of Naryn. This might be explained by the larger contribution of glacial meltwater to runoff for Naryn, which delays the discharge peak [13]. While glaciated areas covered a larger fraction of Maydantal and Oygaing, the total area was larger for Naryn and Karadarya. The less glaciated area might lead to higher variability in runoff percentile timing and peak value. However, as the discharge of the observed catchments is mainly influenced by snowmelt, SCDLS variability (slightly higher for Naryn and Karadarya) is likely dominating peak value magnitude.
Melt onset was negatively correlated with Melt delta for every catchment and more strongly so for the more eastern catchments. An extreme example of an early snowmelt leading to an elongated Melt delta was the AOP 2007 [13,39]. Musselman et al. found ablation rates to be low in regions with a low SWE [61]. Low snow cover, leading to an early Melt onset, could indicate a low SWE and outstretched melt duration, as the energy availability to melt the snowpack in winter and early spring is not as high as in late spring and summer.

4.2. Trends

SCDLS showed decreasing trends of −0.53 to −0.73 days per AOP for every catchment over the 22-year observation period. An advance in melt onset and/or melt half day was detected for every sub-catchment of this study. This is in accordance with the findings of Dietz et al. [39] and Yang et al. The latter found an SCD decrease of −0.26 days per year for the whole TS from 1979 to 2016 due to rising temperatures (up to +0.07 °C per year) and a decreased snow-end day, especially in high-altitude regions and the Fergana Valley [12].
Maydantal and Oygaing had the longest average SCDLS but also the strongest SCDLS reduction. Catchments without high-altitude peaks are more prone to temperature-driven reduction in SCD [2]. The most significant SCD change occurred within the upper third of the catchments for SCDLS, where SCD is higher and land cover mostly consists of bare/sparsely vegetated and glaciated areas. In these areas, snow cover is more likely to be exposed to high energy in late spring and early summer, leading to an accelerated snowmelt, especially with gradually rising temperatures. The reduction in SCD at higher altitudes might lead to the advancing Melt half trend.
Runner-up of late-season SCD decrease, Kokomeren, experienced significant negative trends at lower altitudes, which is likely connected to an increase in temperature and possible melt season rainfall. The affected area is located in a depression in the southeast of the catchment and is partly used for agriculture. The advance of Kokomeren Melt onset could be linked to shorter SCDLS at lower elevations. This change did not show at the same elevation level of Naryn as other areas in the same elevation band did not experience a significant reduction in snow cover duration. Although the other catchments did not experience a significant elevation-specific reduction in SCD, some areas had stronger negative trends than others. For example, in the east of the Naryn catchment, a mostly bare and sparsely vegetated area experienced a significant decrease in early- and late-season SCD (Figure 6).
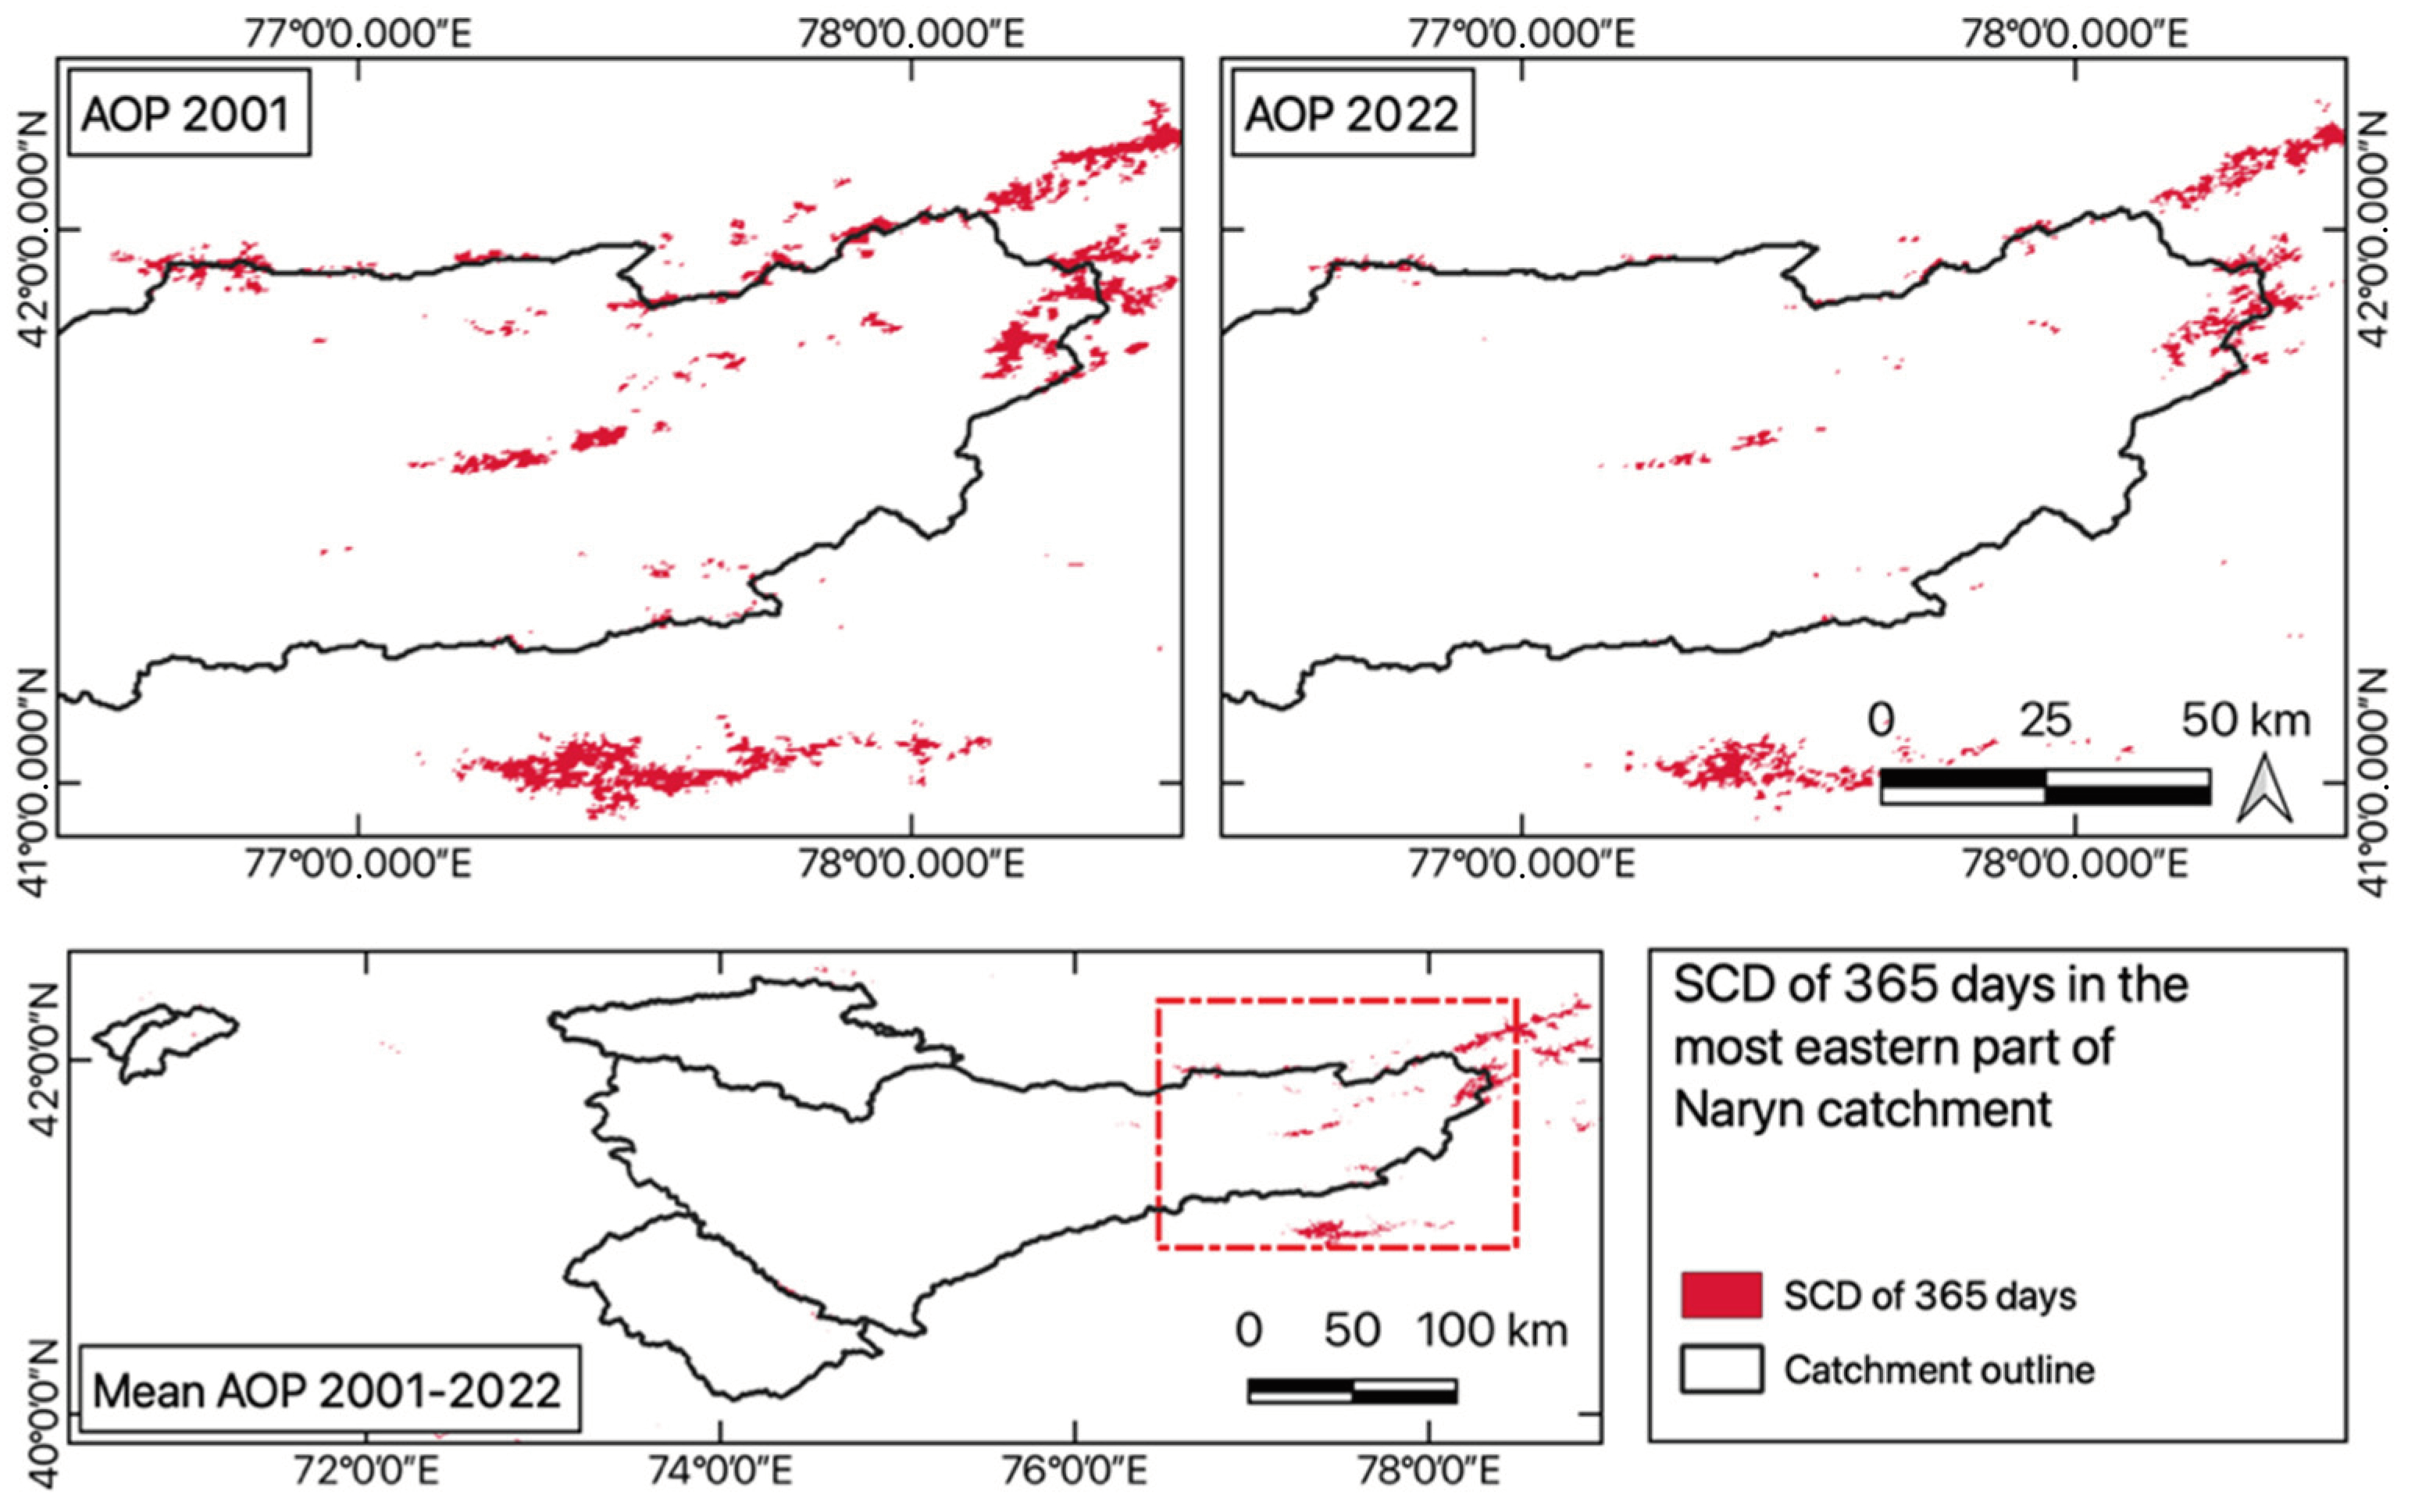
At the spatial resolution of 500 m, areas of perennial snow and ice in the Naryn catchment can be extracted from SCD as pixels having snow cover all year round (Figure 9). A decrease from AOP 2001 (1643 pixels) to AOP 2022 (608 pixels) is visible. A negative overall glacier mass balance of glaciers in Naryn may cause an increased contribution of glacial meltwater to summer and autumn discharge from glaciated areas [13]. Due to the short time period of measurements, this could not be verified but might be one of the causes why the Naryn catchment did not experience an advance in runoff timing measures.
Runoff seasonality change has been the main runoff trend in many catchments of the northern hemisphere [29,47] as well as in the TS [12]. The larger ones of the observed catchments, Naryn and Karadarya, as well as Maydantal did not exhibit changes in runoff timing. An advance occurred for Kokomeren in early and Oygaing in medium parameters. Kokomeren advancing Q10% and Q50% were positively correlated with SCDLS and Melt onset day, both of which advanced too. Thus, Karadarya changes in early runoff timing are likely linked to SCD change at lower elevations. Oygaing advancing Q50% and Q90% were strongly correlated with SCDLS. The advance of later runoff timing may be linked to reduced SCD at higher elevations as well as less influence of glacier melt. SCDLS at low elevations did not decrease significantly, and thus, meltwater from these areas did not run off earlier. The reduction in SCDLS at higher elevations may contribute to advancing medium to later runoff timing measures.
A generally positive correlation of SCDLS and runoff timing measures for all catchments indicates that even though trends of advancing runoff are not measurable within the short time series available, they might surface in the future. All catchments apart from Oygaing had positive correlations of (late) runoff timing and DAOP Qmax. An advance of peak discharge was not measured (like for catchments in the eastern TS [12]) and predicted for later in the century for Syr Darya headwater catchments [2].
Although it experienced the least reduction in SCD, Karadarya was the only catchment with a decreasing Value Qmax. This might be caused by a decreased buffer capacity of glacier melt, a lower SWE, or human activity like agricultural irrigation in the catchment area. Time series were not long enough to allow for statements about runoff volume trends in the other catchments.

4.3. Outlook on Future Developments

Although a slight to strong decrease in peak discharge volume due to snow and glacier ice reduction is projected for all investigated catchments, it was observed for only one of them. It might surface when observing longer time series [2]. Decreasing late-season SCD might cause changes in runoff seasonality for the selected headwater catchments. Catchments without high-altitude peaks might experience these changes earlier, depending on regional precipitation patterns. Glaciated areas, land cover, permafrost, and relief influence the trends and will need to be investigated in further studies to determine the magnitude of changes and the reasons behind changes in snow phenology, runoff volume, and timing. Higher winter temperatures may furthermore lead to permafrost degradation, an increased basin runoff in winter, and an increased groundwater storage capacity [26].
Glacial melt can buffer or amplify the trend of an advancing runoff peak [13], and it will likely continue to contribute to runoff in Syr Darya headwater catchments during the first half of the 21st century [2]. However, after an initial runoff increase, meltwater discharge and thus water availability in the summer and autumn months will be reduced after a melt-induced maximum is surpassed [14]. The discharge will be more dependent on snow cover melt and thus likely decrease and exhibit more interannual variability [62,63]. The risk of natural hazards is increased when meltwater accumulates in front of receding glacier fronts. This poses a threat in unregulated catchments (for example in the north of the Fergana Valley) as flood protection is not ensured by dams [2].
All the rivers observed in this study feed into reservoirs in the high mountains, making changes in the timing of runoff most important for the population living upstream of the dammed water body. However, variation in water availability also affects downstream communities and international politics between the Central Asian countries. Transboundary institutions like the Interstate Commission for Water Coordination (ICWC) and its executive body the Syr Darya Basin Water Organization (BWO Syr Darya) are necessary to supervise sustainable water management measures [64] and find ways to ensure sufficient water availability for irrigation in downstream countries during spring and summer months as well as hyperpower generation in winter for upstream countries [8].

4.4. Limitations

Five main factors limit the validity of the results produced in this thesis.
(1)
Runoff data do not fulfill the needed requirements of homogenous long-term datasets [47]. Especially the data from SDSS stations only covered a few years and included data gaps in the spring runoff period. Limited data availability reduced the possibility of putting extreme snow events in relation to runoff information for some years.
(2)
An analysis of trends within hydrometeorological data requires long datasets. Time series of only a few decades of snow cover data may be influenced by short-term trends, so that long-term developments are concealed [65].
(3)
By attempting to link satellite-derived snow cover information with spring runoff measures and determine runoff timing from snow cover alone, important factors were not included. As runoff behavior cannot be reduced to a simple function of snow cover change, trends and relationships cannot be interpreted without additional information on temperature, precipitation, land cover, soil type, glaciation, relief, exposition, and slope, which have consequences on snow distribution and melt as well as runoff behavior [30]. Limitations also stem from the study design. The defined time frame of spring runoff poses an oversimplification of “complex runoff distributions” that respond to “highly variable spring weather” [47]. An alternative method could be defining the spring flood date for every year individually [29]. Furthermore, the influence of glacier melt is difficult to quantify because late summer months are not included in the spring runoff time frame.
(4)
The use of multispectral satellite data limits the observations to snow extent. None of the used parameters measured snow depth so changes in SWE remain uncertain.
(5)
The construction of the Kambarata II dam in 2007–2010 may have distorted the natural inflow into the Toktogul reservoir of the Naryn catchment.

5. Conclusions

In this study, snow cover variability and its influence on the runoff behavior of the Syr Darya headwater catchments in the western Tien Shan mountains were investigated. Snow cover duration, melt timing, and runoff timing were derived from a long time series of remote sensing observations and hydrological stations for five sub-catchments with varying physical characteristics and availability of in situ runoff data. Furthermore, parameters were examined on the existence of trends over the observed time period. Catchments differed regarding their location, area, slope, glaciation, land cover, and altitude, resulting in varying snow cover and runoff characteristics.
However, all catchments had decreasing trends of late-season (spring) snow cover duration. Catchments more to the west exhibited longer snow cover duration due to different precipitation patterns but also had stronger decreasing trends over the observed 22 years. This can be related to a lack of high-altitude peaks and thus a higher susceptibility to rising temperatures.
Runoff timing was generally influenced by the snow cover duration of late winter and spring. The larger catchments more to the east had weaker relationships between snow and runoff parameters, likely due to a shorter snow-covered period and their larger size creating opportunities for runoff to percolate, evaporate, or be used for human activity.
Decreasing snow cover duration trends of the observed time period may have led to the advance of runoff timing parameters for two of the observed catchments. With temperatures projected to keep rising in the Tien Shan, a further advance of spring flood, as well as a reduction in runoff volume, is likely, requiring a coordinated management of water resources in the Syr Darya catchment. Further research in this area is necessary to investigate the state and development of snow cover and its effects on water resources in Central Asia as runoff volume and seasonality affect the water availability for agriculture and hydropower production.

Author Contributions

Conceptualization, methodology, analysis, and writing—original draft preparation, C.V.; writing—review and editing, A.J.D., S.R. and C.C.; supervision, C.C. and A.J.D. All authors have read and agreed to the published version of the manuscript.

Funding

This research received no external funding.

Data Availability Statement

Global SnowPack data are openly available on https://geoservice.dlr.de (Accessed on 15 October 2022).

Conflicts of Interest

The authors declare no conflicts of interest.

Appendix A

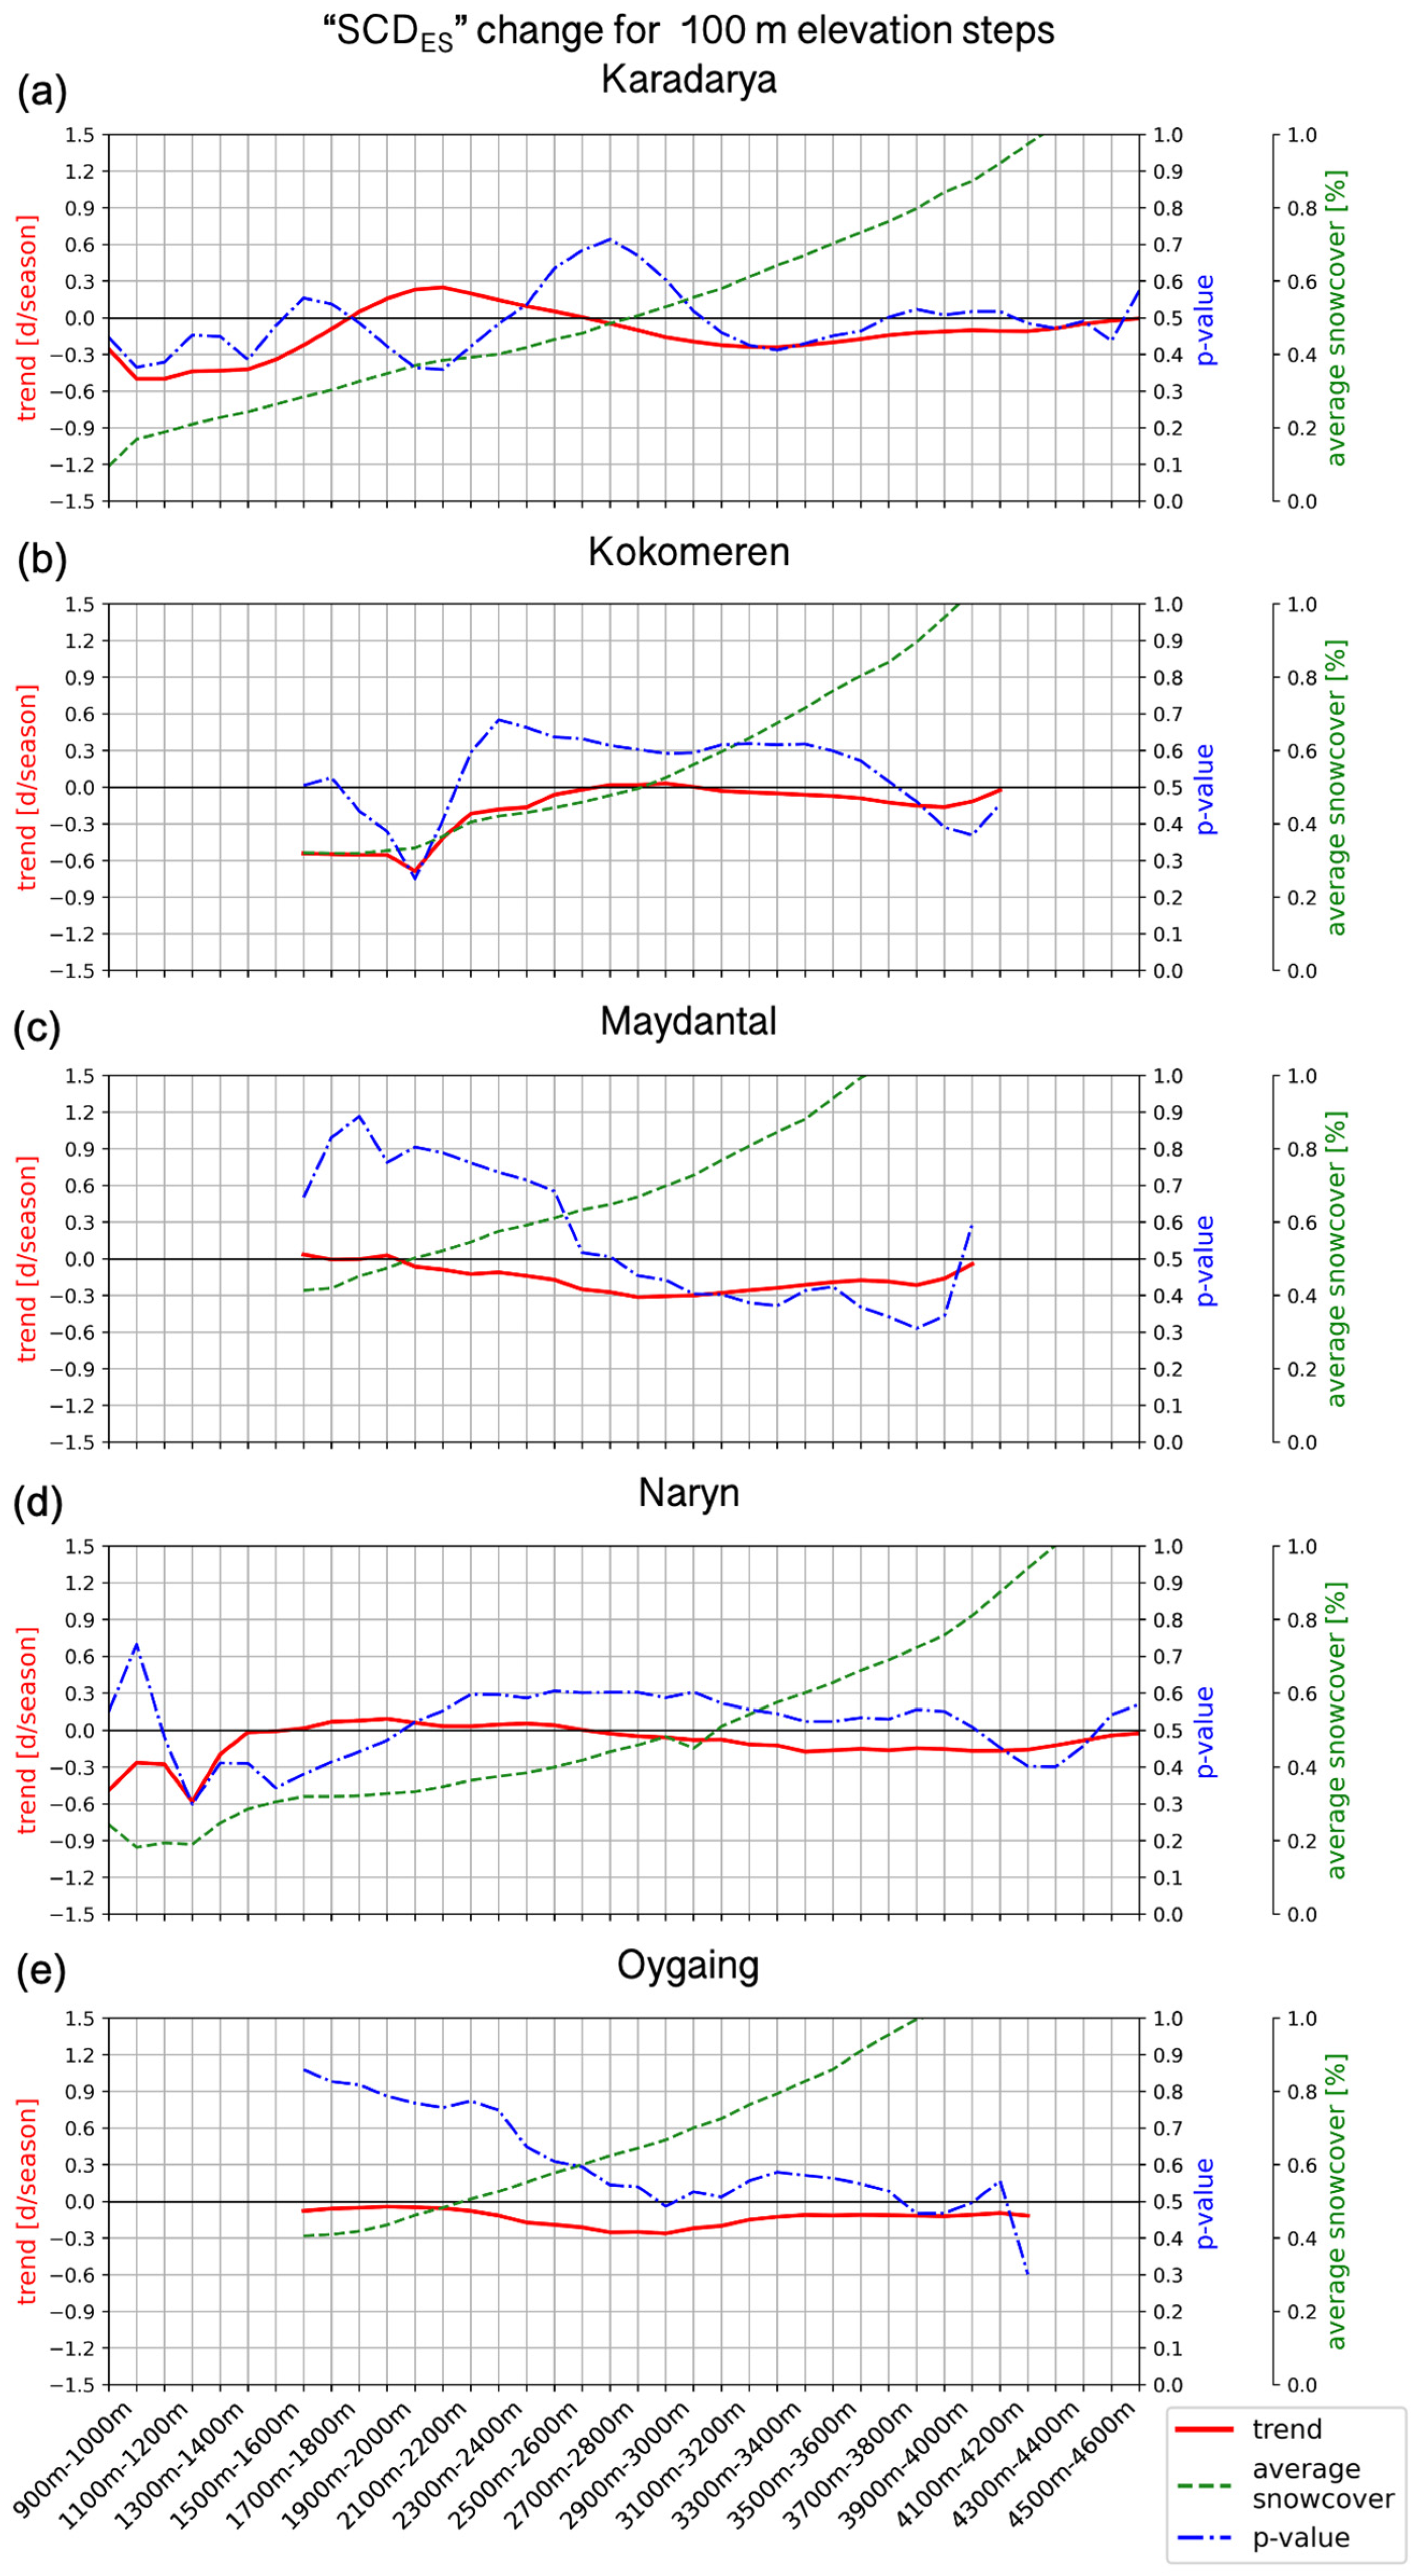
Altitude-related change is visualized in Figure A1 for SCDES and Figure A2 for SCDLS. On the x-axis, altitude steps of 100 m are shown. The number of pixels per elevation band varies for the catchments. For every step, the mean fractional snow cover (green dashed line), the change in days per AOP (red line), and the trend significance (blue dash-dot line) are shown. SCDES trends had a p-value of > 0.2 for all altitude steps.
Figure A1. SCDES change for 100 m altitude levels for the sub-catchments (a) Karadarya, (b) Kokomeren, (c) Maydantal, (d) Naryn and (e) Oygaing.
Water 16 01902 g0a1
Figure A2. SCDLS change for 100 m altitude levels for the sub-catchments (a) Karadarya, (b) Kokomeren, (c) Maydantal, (d) Naryn and (e) Oygaing.
Water 16 01902 g0a2

Appendix B

The following tables include all values of snow cover phenology and runoff timing generated. Values have been rounded to two decimal places.
Table A1. Mean snow cover duration (days) of the investigated catchments over the time period 2000 to 2022 for early and late seasons.
AOPKaradaryaKokomerenMaydantalNarynOygaing
SCDESSCDLSSCDESSCDLSSCDESSCDLSSCDESSCDLSSCDESSCDLS
200177.47115.3976.7121.5995.6167.2172.01116.1894.97163.42
200262.97122.3269.04134.8495.07191.7667.97128.494.21185.45
200356.44131.8453.97144.1176.33186.8158.08141.1274.78180.99
200465.5121.0265.79133.1482.61174.6865.6128.7180.78171.04
200555.9119.7561.57133.1984.98179.1655.71126.0384.81174.18
200656.99120.1655.83128.4971.9167.3552.65123.2273.46163.07
200754.7289.0359.61108.6187.78172.5151.9881.3287.54166.58
200844.77113.3752.44119.3570.13153.4949.98115.4266.23149.94
200952.47127.5570.16140.7186.86188.7864.86134.0586.77184.55
201060.65134.360.68135.9377.84185.3361.9136.5577.05177.39
201158.46116.7453.41116.2280.54165.9555.84113.0282.83161.58
201265.14123.8269.11126.779.65172.169.73122.9980.68166.86
201366.58116.2767.86120.1775.56175.8962.96113.3674.87170.16
201451.25118.2356.58126.2672.06174.3850.67110.4473.55166.11
201565.11120.1469.31131.5186.58171.9166.88124.8587.57165.76
201661.19101.8271.13121.590.52171.9662.53112.0889.26166.75
201766.48127.1374.25134.8388.51176.0767.2131.5388.1172.72
201853.68112.9357.16127.583.35168.3157.59119.7283.29164.69
201965.25113.2365.77126.3786.48176.9861.7116.3584.19170.39
202049.44108.4564.56121.573.67165.0553.63113.2677.06160.23
202159.24117.5155.45113.5267.27160.9559.44114.3172.19156.11
202265.78110.0757.12117.7381.28162.5461.38114.4680.47157.9
Mean59.79117.3263.07126.5481.57173.1460.47119.8881.58167.99
Standard Deviation7.349.847.278.987.889.416.4312.307.408.88
Table A2. Melt onset and Melt half days (day of the annual observation period) of the investigated catchments over the annual observation periods 2000 to 2022.
AOPKaradaryaKokomerenMaydantalNarynOygaing
Melt OnsetMelt HalfMelt OnsetMelt HalfMelt OnsetMelt HalfMelt OnsetMelt HalfMelt OnsetMelt Half
2001177.12241.17196.13247.17239.16306.21188.13247.17225.15306.21
2002193.13248.17208.14262.18239.16329.23208.14246.17234.16315.22
2003196.13256.18211.14268.18263.18309.21213.15259.18253.17300.21
2004173.64244.50210.57252.48242.50302.38206.58243.50235.52294.40
2005183.13262.18201.14267.18257.18298.20199.14238.16241.17298.20
2006184.13239.16205.14248.17239.16292.20202.14237.16236.16285.20
200798.07222.15148.10231.16235.16292.20103.07226.15231.16295.20
2008187.61239.51195.60244.50235.52281.42195.60237.51212.56273.44
2009168.12252.17205.14267.18268.18316.22201.14254.17246.17311.21
2010178.12257.18209.14252.17255.17308.21214.15248.17238.16299.20
2011199.14229.16189.13235.16242.17289.20189.13231.16235.16289.20
2012205.58231.52212.56234.52244.50292.40212.56230.53230.53287.41
2013184.13234.16189.13239.16247.17303.21193.13231.16233.16303.21
2014197.13241.17200.14264.18259.18300.21192.13242.17250.17290.20
2015197.13245.17205.14249.17242.17303.21203.14237.16237.16359.25
2016167.66225.54180.63245.50225.54303.38175.64227.53213.56289.41
2017186.13249.17212.15255.17253.17301.21214.15251.17251.17294.20
2018175.12236.16195.13249.17240.16302.21195.13249.17224.15299.20
2019175.12224.15197.13247.17250.17307.21192.13224.15224.15305.21
2020176.64228.53194.60238.51229.53291.40183.62231.52226.53279.43
2021181.12241.17179.12249.17253.17284.19189.13239.16239.16278.19
2022205.14240.16178.12239.16236.16289.20175.12240.16226.15285.20
Mean181.32240.38196.51249.38245.34300.11193.01239.65233.84297.21
Standard Deviation21.7011.0115.1511.0310.9410.8923.159.4910.8517.44
Table A3. Melt delta (day of the annual observation period) of the investigated catchments over the annual observation periods 2000 to 2022.
AOPKaradaryaKokomerenMaydantalNarynOygaing
20016451675981
20025554903881
20036057464647
20047142603759
20057966413957
20065543533549
2007124835712364
20085249464261
20098462485365
20107943533461
20113046474254
20122622481857
20135050563870
20144464415040
201548446134122
20165865785276
20176343483743
20186154625475
20194950573281
20205244624853
20216070315039
20223561536559
Mean59.0552.8654.7746.6463.36
Standard Deviation20.7112.7612.7619.9918.34
Table A4. Peak discharge and runoff timing parameters for Karadarya.
AOPDAOP QmaxValue QmaxQ5%Q10%Q50%Q90%Q95%
DAOPm3/sDAOPDAOPDAOPDAOPDAOP
2002233.16558.9202.14213.15263.18304.21314.22
2003274.19506.9213.15213.15263.18304.21314.22
2004253.48412.1192.6213.56253.48304.38314.35
2005284.19449.5192.13202.14263.18304.21314.22
2006253.17478192.13213.15253.17294.2304.21
2007223.15182.4192.13202.14243.17304.21314.22
2008253.48276.8182.62202.58253.48284.42304.38
2009294.2328.8192.13213.15274.19314.22314.22
2010294.2730.6192.13213.15263.18304.21314.22
2011253.17364.4192.13213.15263.18304.21314.22
2012233.52331.5202.58213.56253.48304.38304.38
2013274.19332.1192.13202.14263.18304.21314.22
2014284.19270.1192.13213.15263.18294.2304.21
2015253.17429.8192.13213.15253.17304.21304.21
Mean261.53403.71194.45210.09259.03302.11310.68
Standard Deviation23.01138.787.165.157.666.964.95
Table A5. Peak discharge and runoff timing parameters for Kokomeren.
AOPDAOP QmaxValue QmaxQ5%Q10%Q50%Q90%Q95%
DAOPm3/sDAOPDAOPDAOPDAOPDAOP
2014274.19208.29208.29237.16281.19320.22327.22
2015283.19265.87265.87236.16281.19321.22327.22
2016289.41317.61317.61
2019310.21247.65247.65241.17285.2322.22328.22
2020272.44204.61204.61227.53272.44321.34328.33
2021253.17246.98246.98239.16274.19321.22327.22
2022252.17222.61222.61233.16269.18318.22326.22
Mean276.40244.80244.80235.72277.23320.74327.41
Standard Deviation252.17204.6139.164.856.191.390.78
Table A6. Peak discharge and runoff timing parameters for Maydantal.
AOPDAOP QmaxValue QmaxQ5%Q10%Q50%Q90%Q95%
DAOPm3/sDAOPDAOPDAOPDAOPDAOP
2017273.196298.17224.15237.16280.19321.22327.22
2018315.225542.33219.15236.16286.2322.22327.22
2019311.215397.77227.16241.17292.2324.22329.23
2020281.424902.61209.57227.53280.42321.34327.33
2021281.195617.88219.15239.16278.19319.22327.22
2022304.215293.17221.15233.16281.19321.22327.22
2017273.196298.17224.15237.16280.19321.22327.22
Mean294.415508.66220.06235.72283.07321.57327.57
Standard Deviation17.92460.966.004.855.211.630.81
Table A7. Peak discharge and runoff timing parameters for Naryn.
AOPDAOP QmaxValue QmaxQ5%Q10%Q50%Q90%Q95%
DAOPm3/sDAOPDAOPDAOPDAOPDAOP
2000294.40940.3192.6213.56274.44314.35314.35
2001274.191078.8192.13213.15263.18304.21314.22
2002284.191770.8213.15223.15274.19314.22314.22
2003294.201446.9202.14223.15274.19314.22314.22
2004284.421207.2192.6213.56274.44314.35314.35
2005284.191268.9192.13213.15274.19314.22314.22
2006253.171145.9202.14213.15263.18304.21314.22
2007294.20833.9202.14213.15263.18314.22314.22
2008263.46911.0192.6213.56263.46314.35314.35
2009294.201433.1202.14223.15284.19314.22324.22
2010294.201857.4202.14223.15274.19314.22314.22
Mean283.171263.11198.72216.90271.17312.44315.16
Standard Deviation14.09337.186.834.966.924.073.00
Table A8. Peak discharge and runoff timing parameters for Oygaing.
AOPDAOP QmaxValue QmaxQ5%Q10%Q50%Q90%Q95%
DAOPm3/sDAOPDAOPDAOPDAOPDAOP
2019303.213180.15198.14212.15280.19323.22328.22
2020282.422817.92195.6208.57276.43321.34327.33
2021280.193179.15198.14214.15276.19321.22328.22
2022305.212926.51197.13212.15273.19320.22327.22
Mean292.763025.93197.25211.76276.50321.50327.75
Standard Deviation13.28182.951.202.322.871.250.55

References

  1. Smith, D.R. Environmental Security and Shared Water Resources in Post-Soviet Central Asia. Post-Sov. Geogr. 1995, 36, 351–370. [Google Scholar] [CrossRef]
  2. Siegfried, T.; Bernauer, T.; Guiennet, R.; Sellars, S.; Robertson, A.W.; Mankin, J.; Bauer-Gottwein, P.; Yakovlev, A. Will Climate Change Exacerbate Water Stress in Central Asia? Clim. Chang. 2012, 112, 881–899. [Google Scholar] [CrossRef]
  3. Prowse, T.; Wrona, F.; Reist, J.; Hobbie, J.; Lévesque, L.; Vincent, W. General Features of the Arctic Relevant to Climate Change in Freshwater Ecosystems. Ambio 2006, 35, 330–338. [Google Scholar] [CrossRef] [PubMed]
  4. Barry, R.G. The Role of Snow and Ice in the Global Climate System: A Review. Polar Geogr. 2002, 26, 235–246. [Google Scholar] [CrossRef]
  5. Barry, R.G. The Parameterization of Surface Albedo for Sea Ice and Its Snow Cover. Prog. Phys. Geogr. 1996, 20, 63–79. [Google Scholar] [CrossRef]
  6. Rößler, S.; Dietz, A.J. Development of Global Snow Cover—Trends from 23 Years of Global SnowPack. Earth 2023, 4, 1–22. [Google Scholar] [CrossRef]
  7. Barnett, T.P.; Adam, J.C.; Lettenmaier, D.P. Potential Impacts of a Warming Climate on Water Availability in Snow-Dominated Regions. Nature 2005, 438, 303–309. [Google Scholar] [CrossRef] [PubMed]
  8. Bernauer, T.; Siegfried, T. Climate Change and International Water Conflict in Central Asia. J. Peace Res. 2012, 49, 227–239. [Google Scholar] [CrossRef]
  9. Viviroli, D.; Weingartner, R.; Messerli, B. Assessing the Hydrological Significance of the World’s Mountains. Mt. Res. Dev. 2003, 23, 32–40. [Google Scholar] [CrossRef]
  10. Armstrong, R.L.; Rittger, K.; Brodzik, M.J.; Racoviteanu, A.; Barrett, A.P.; Khalsa, S.-J.S.; Raup, B.; Hill, A.F.; Khan, A.L.; Wilson, A.M.; et al. Runoff from Glacier Ice and Seasonal Snow in High Asia: Separating Melt Water Sources in River Flow. Reg. Environ. Chang. 2019, 19, 1249–1261. [Google Scholar] [CrossRef]
  11. Smith, T.; Bookhagen, B. Changes in Seasonal Snow Water Equivalent Distribution in High Mountain Asia (1987 to 2009). Sci. Adv. 2018, 4, e1701550. [Google Scholar] [CrossRef]
  12. Yang, T.; Li, Q.; Ahmad, S.; Zhou, H.; Lanhai, L. Changes in Snow Phenology from 1979 to 2016 over the Tianshan Mountains, Central Asia. Remote Sens. 2019, 11, 499. [Google Scholar] [CrossRef]
  13. Saks, T.; Pohl, E.; Machguth, H.; Dehecq, A.; Barandun, M.; Kenzhebaev, R.; Kalashnikova, O.; Hoelzle, M. Glacier Runoff Variation Since 1981 in the Upper Naryn River Catchments, Central Tien Shan. Front. Environ. Sci. 2022, 9, 780466. [Google Scholar] [CrossRef]
  14. Pohl, E.; Gloaguen, R.; Andermann, C.; Knoche, M. Glacier Melt Buffers River Runoff in the Pamir Mountains. Water Resour. Res. 2017, 53, 2467–2489. [Google Scholar] [CrossRef]
  15. Malsy, M.; Aus der Beek, T.; Eisner, S.; Flörke, M. Climate Change Impacts on Central Asian Water Resources. Adv. Geosci. 2012, 32, 77–83. [Google Scholar] [CrossRef]
  16. IPCC Ocean, Cryosphere and Sea Level Change. In Climate Change 2021: The Physical Science Basis. Contribution of Working Group I to the Sixth Assessment Report of the Intergovernmental Panel on Climate Change; Cambridge University Press: Cambridge, UK; New York, NY, USA, 2021; pp. 1211–1362.
  17. Sturm, M.; Wagner, A. Using Repeated Patterns in Snow Distribution Modeling: An Arctic Example. Water Resour. Res. 2010, 46, 14. [Google Scholar] [CrossRef]
  18. Fassnacht, S.R.; Dressler, K.A.; Hultstrand, D.M.; Bales, R.C.; Patterson, G. Temporal Inconsistencies in Coarse-Scale Snow Water Equivalent Patterns: Colorado River Basin Snow Telemetry-Topography Regressions. Pirineos 2012, 167, 165–185. [Google Scholar] [CrossRef]
  19. Notarnicola, C. Overall Negative Trends for Snow Cover Extent and Duration in Global Mountain Regions over 1982–2020. Sci. Rep. 2022, 12, 13731. [Google Scholar] [CrossRef]
  20. Dietz, A.J.; Künzer, C.; Gessner, U.; Dech, S. Remote Sensing of Snow—A Review of Available Methods. Int. J. Remote Sens. 2012, 33, 4094–4134. [Google Scholar] [CrossRef]
  21. Kapnick, S.B.; Delworth, T.L.; Ashfaq, M.; Malyshev, S.; Milly, P.C.D. Snowfall Less Sensitive to Warming in Karakoram than in Himalayas Due to a Unique Seasonal Cycle. Nat. Geosci 2014, 7, 834–840. [Google Scholar] [CrossRef]
  22. Körner, C. Alpine Plant Life, 3rd ed.; Springer Nature Switzerland AG: Cham, Switzerland, 2021; ISBN 978-3-540-65438-4. [Google Scholar]
  23. Stigter, E.E.; Wanders, N.; Saloranta, T.M.; Shea, J.M.; Bierkens, M.F.P.; Immerzel, W.W. Assimilation of Snow Cover and Snow Depth into a Snow Model to Estimate Snow Water Equivalent and Snowmelt Runoff in a Himalayan Catchment. Cryosphere 2017, 11, 1647–1664. [Google Scholar] [CrossRef]
  24. Dong, J.; Walker, J.P.; Houser, P.R. Factors Affecting Remotely Sensed Snow Water Equivalent Uncertainty. Remote Sens. Environ. 2005, 97, 68–82. [Google Scholar] [CrossRef]
  25. Hall, D.K.; Riggs, G.A.; Salomonson, V.V.; DiGirolamo, N.E.; Bayr, K.J. MODIS Snow-Cover Products. Remote Sens. Environ. 2002, 83, 181–194. [Google Scholar] [CrossRef]
  26. Ma, X.; Yan, W.; Zhao, C.; Kundzewicz, Z.W. Snow-Cover Area and Runoff Variation under Climate Change in the West Kunlun Mountains. Water 2019, 11, 2246. [Google Scholar] [CrossRef]
  27. Hall, D.K.; Riggs, G.A.; Salomonson, V.V. Development of Methods for Mapping Global Snow Cover Using Moderate Resolution Imaging Spectroradiometer Data. Remote Sens. Environ. 1995, 54, 127–140. [Google Scholar] [CrossRef]
  28. Martinec, J. Snowmelt-Runoff Model for Streamflow Forecast. Hydrol. Res. 1975, 6, 145–154. [Google Scholar] [CrossRef]
  29. Burn, D.H. Climatic Influences on Streamflow Timing in the Headwaters of the Mackenzie River Basin. J. Hydrol. 2008, 352, 225–238. [Google Scholar] [CrossRef]
  30. Rößler, S.; WItt, M.S.; Ikonen, J.; Brown, I.A.; Dietz, A.J. Remote Sensing of Snow Cover Variability and Its Influence on the Runoff of Sápmi’s Rivers. Geosciences 2021, 11, 130. [Google Scholar] [CrossRef]
  31. The World Bank. World Bank in Central Asia. Available online: https://www.worldbank.org/en/region/eca/brief/central-asia (accessed on 29 December 2022).
  32. De Pauw, E. Principal Biomes of Central Asia. In Climate Change and Terrestrial Carbon Sequestration in Central Asia; Taylor & Francis: London, UK, 2007; pp. 3–24. ISBN 978-0-429-22422-5. [Google Scholar]
  33. Esri. World Water Bodies. 2022. Available online: https://hub.arcgis.com/search?tags=2022 (accessed on 15 November 2022).
  34. UNESCO World Rivers 2017. Available online: https://ihp-wins.unesco.org/dataset/world-rivers (accessed on 15 November 2022).
  35. Esri. World Cities. 2022. Available online: https://www.arcgis.com/home/item.html?id=dfab3b294ab24961899b2a98e9e8cd3d (accessed on 15 November 2022).
  36. Lehner, B.; Grill, G. Global River Hydrography and Network Routing: Baseline Data and New Approaches to Study the World’s Large River Systems. Hydrol. Process. 2013, 27, 2171–2186. [Google Scholar] [CrossRef]
  37. Esri. World Countries—Generalized. 2022. Available online: https://hub.arcgis.com/datasets/esri::world-countries-generalized/about (accessed on 15 November 2022).
  38. Chen, Y.; Weihong, L.; Deng, H.; Fang, G.; Li, Z. Changes in Central Asia’s Water Tower: Past, Present and Future. Sci. Rep. 2016, 6, 35458. [Google Scholar] [CrossRef]
  39. Dietz, A.J.; Künzer, C.; Conrad, C. Snow-Cover Variability in Central Asia between 2000 and 2011 Derived from Improved MODIS Daily Snow-Cover Products. Int. J. Remote Sens. 2013, 34, 3879–3902. [Google Scholar] [CrossRef]
  40. Guan, X.; Yao, J.; Schneider, C. Variability of the Precipitation over the Tianshan Mountains, Central Asia. Part I: Linear and Nonlinear Trends of the Annual and Seasonal Precipitation. Int. J. Climatol. 2022, 42, 118–138. [Google Scholar] [CrossRef]
  41. Aizen, V.B.; Kuzmichenok, V.A.; Surazakov, A.B.; Aizen, E.M. Glacier Changes in the Tien Shan as Determined from Topographic and Remotely Sensed Data. Glob. Planet. Chang. 2007, 56, 328–340. [Google Scholar] [CrossRef]
  42. Khromova, T.E.; Osipova, G.B.; Tsvetkov, D.G.; Dyurgerov, M.B.; Barry, R.G. Changes in Glacier Extent in the Eastern Pamir, Central Asia, Determined from Historical Data and ASTER Imagery. Remote Sens. Environ. 2006, 102, 24–32. [Google Scholar] [CrossRef]
  43. Dietz, A.J.; Künzer, C.; Dech, S. Global SnowPack: A New Set of Snow Cover Parameters for Studying Status and Dynamics of the Planetary Snow Cover Extent. Remote Sens. Lett. 2015, 6, 844–853. [Google Scholar] [CrossRef]
  44. Gocic, M.; Trajkovic, S. Analysis of Changes in Meteorological Variables Using Mann-Kendall and Sen’s Slope Estimator Statistical Tests in Serbia. Glob. Planet. Chang. 2013, 100, 172–182. [Google Scholar] [CrossRef]
  45. Shi, X.; Marsh, P.; Yang, D. Warming Spring Air Temperatures, but Delayed Spring Streamflow in an Arctic Headwater Basin. Environ. Res. Lett. 2015, 10, 064003. [Google Scholar] [CrossRef]
  46. Aigang, L.; Tianming, W.; Shichang, K.; Deqian, P. On the Relationship between Latitude and Altitude Temperature Effects. In Proceedings of the 2009 International Conference on Environmental Science and Information Application Technology, Wuhan, China, 4–5 July 2009; Volume 2, pp. 55–58. [Google Scholar]
  47. Moore, J.N.; Harper, J.T.; Greenwood, M.C. Significance of Trends toward Earlier Snowmelt Runoff, Columbia and Missouri Basin Headwaters, Western United States. Geophys. Res. Lett. 2007, 34, 1–4. [Google Scholar] [CrossRef]
  48. Danielson, J.J.; Gesch, D.B. Global Multi-Resolution Terrain Elevation Data 2010 (GMTED2010); U.S. Geological Survey Open-File Report 2011-1073; U.S. Geological Survey: Reston, VA, USA, 2011; p. 26.
  49. Zech, C. Kokomeren Station Exposure Description 2020. Available online: https://datapub.gfz-potsdam.de/download/10.5880.GFZ.1.2.2020.002_CAWa/KEKI/KEKI_HMT-SED-GFZ.pdf (accessed on 19 November 2022).
  50. Court, A. Measures of Streamflow Timing. J. Geophys. Res. 1962, 67, 4335–4339. [Google Scholar] [CrossRef]
  51. McKinney, W. Data Structures for Statistical Computing in Python. In Proceedings of the 9th Python in Science Conference, Austin, TX, USA, 28 June–3 July 2010; Volume 445, pp. 51–56. [Google Scholar] [CrossRef]
  52. The Pandas Development Team. Pandas-Dev/Pandas: Pandas. 2022. Available online: https://zenodo.org/records/10957263 (accessed on 22 November 2022).
  53. Kendall, M.G. A New Measure of Rank Correlation. Biometrika 1938, 30, 81–93. [Google Scholar] [CrossRef]
  54. Mann, H.B. Nonparametric Tests Against Trend. Econometrica 1945, 13, 245–259. [Google Scholar] [CrossRef]
  55. Sen, P.K. Estimates of the Regression Coefficient Based on Kendall’s Tau. J. Am. Stat. Assoc. 1968, 63, 1379–1389. [Google Scholar] [CrossRef]
  56. Kour, R.; Patel, N.; Krishna, A. Assessment of Temporal Dynamics of Snow Cover and Its Validation with Hydro-Meteorological Data in Parts of Chenab Basin, Western Himalayas. Sci. China Earth Sci. 2016, 59, 1081–1094. [Google Scholar] [CrossRef]
  57. Hussain, M.M.; Mahmud, I. pyMannKendall: A Python Package for Non Parametric Mann Kendall Family of Trend Tests. J. Open Source Softw. 2019, 4, 1556. [Google Scholar] [CrossRef]
  58. Virtanen, P.; Gommers, R.; Oliphant, T.E.; Haberland, M.; Reddy, T.; Cournapeau, D.; Burovski, E.; Peterson, P.; Weckesser, W.; Bright, J.; et al. SciPy 1.0: Fundamental Algorithms for Scientific Computing in Python. Nat Methods 2020, 17, 261–272. [Google Scholar] [CrossRef]
  59. Helbig, N.; van Herwijnen, A.; Magnusson, J.; Jonas, T. Fractional Snow-Covered Area Parameterization over Complex Topography. Hydrol. Earth Syst. Sci. 2015, 19, 1339–1351. [Google Scholar] [CrossRef]
  60. Sriwongsitanon, N.; Taesombat, W. Effects of Land Cover on Runoff Coefficient. J. Hydrol. 2011, 410, 226–238. [Google Scholar] [CrossRef]
  61. Musselman, K.N.; Clark, M.P.; Liu, C.; Ikeda, K.; Rasmussen, R. Slower Snowmelt in a Warmer World. Nat. Clim Chang. 2017, 7, 214–219. [Google Scholar] [CrossRef]
  62. Berghuijs, W.R.; Woods, R.A.; Hrachowitz, M. A Precipitation Shift from Snow towards Rain Leads to a Decrease in Streamflow. Nat. Clim Chang. 2014, 4, 583–586. [Google Scholar] [CrossRef]
  63. Unger-Shayesteh, K.; Vorogushyn, S.; Farinotti, D.; Gafurov, A.; Duethmann, D.; Mandychev, A.; Merz, B. What Do We Know about Past Changes in the Water Cycle of Central Asian Headwaters? A Review. Glob. Planet. Chang. 2013, 110, 4–25. [Google Scholar] [CrossRef]
  64. Khamidov, M. Experience of Coordinated Water Resources Use of the Syrdarya River Basin States. In Proceedings of the Water and Food Security in Central Asia; Madramootoo, C., Dukhovny, V., Eds.; Springer Netherlands: Dordrecht, The Netherlands, 2011; pp. 85–90. [Google Scholar]
  65. de Lima, M.I.P.; Carvalho, S.C.P.; de Lima, J.L.M.P.; Coelho, M.F.E.S. Trends in Precipitation: Analysis of Long Annual and Monthly Time Series from Mainland Portugal. Adv. Geosci. 2010, 25, 155–160. [Google Scholar] [CrossRef]
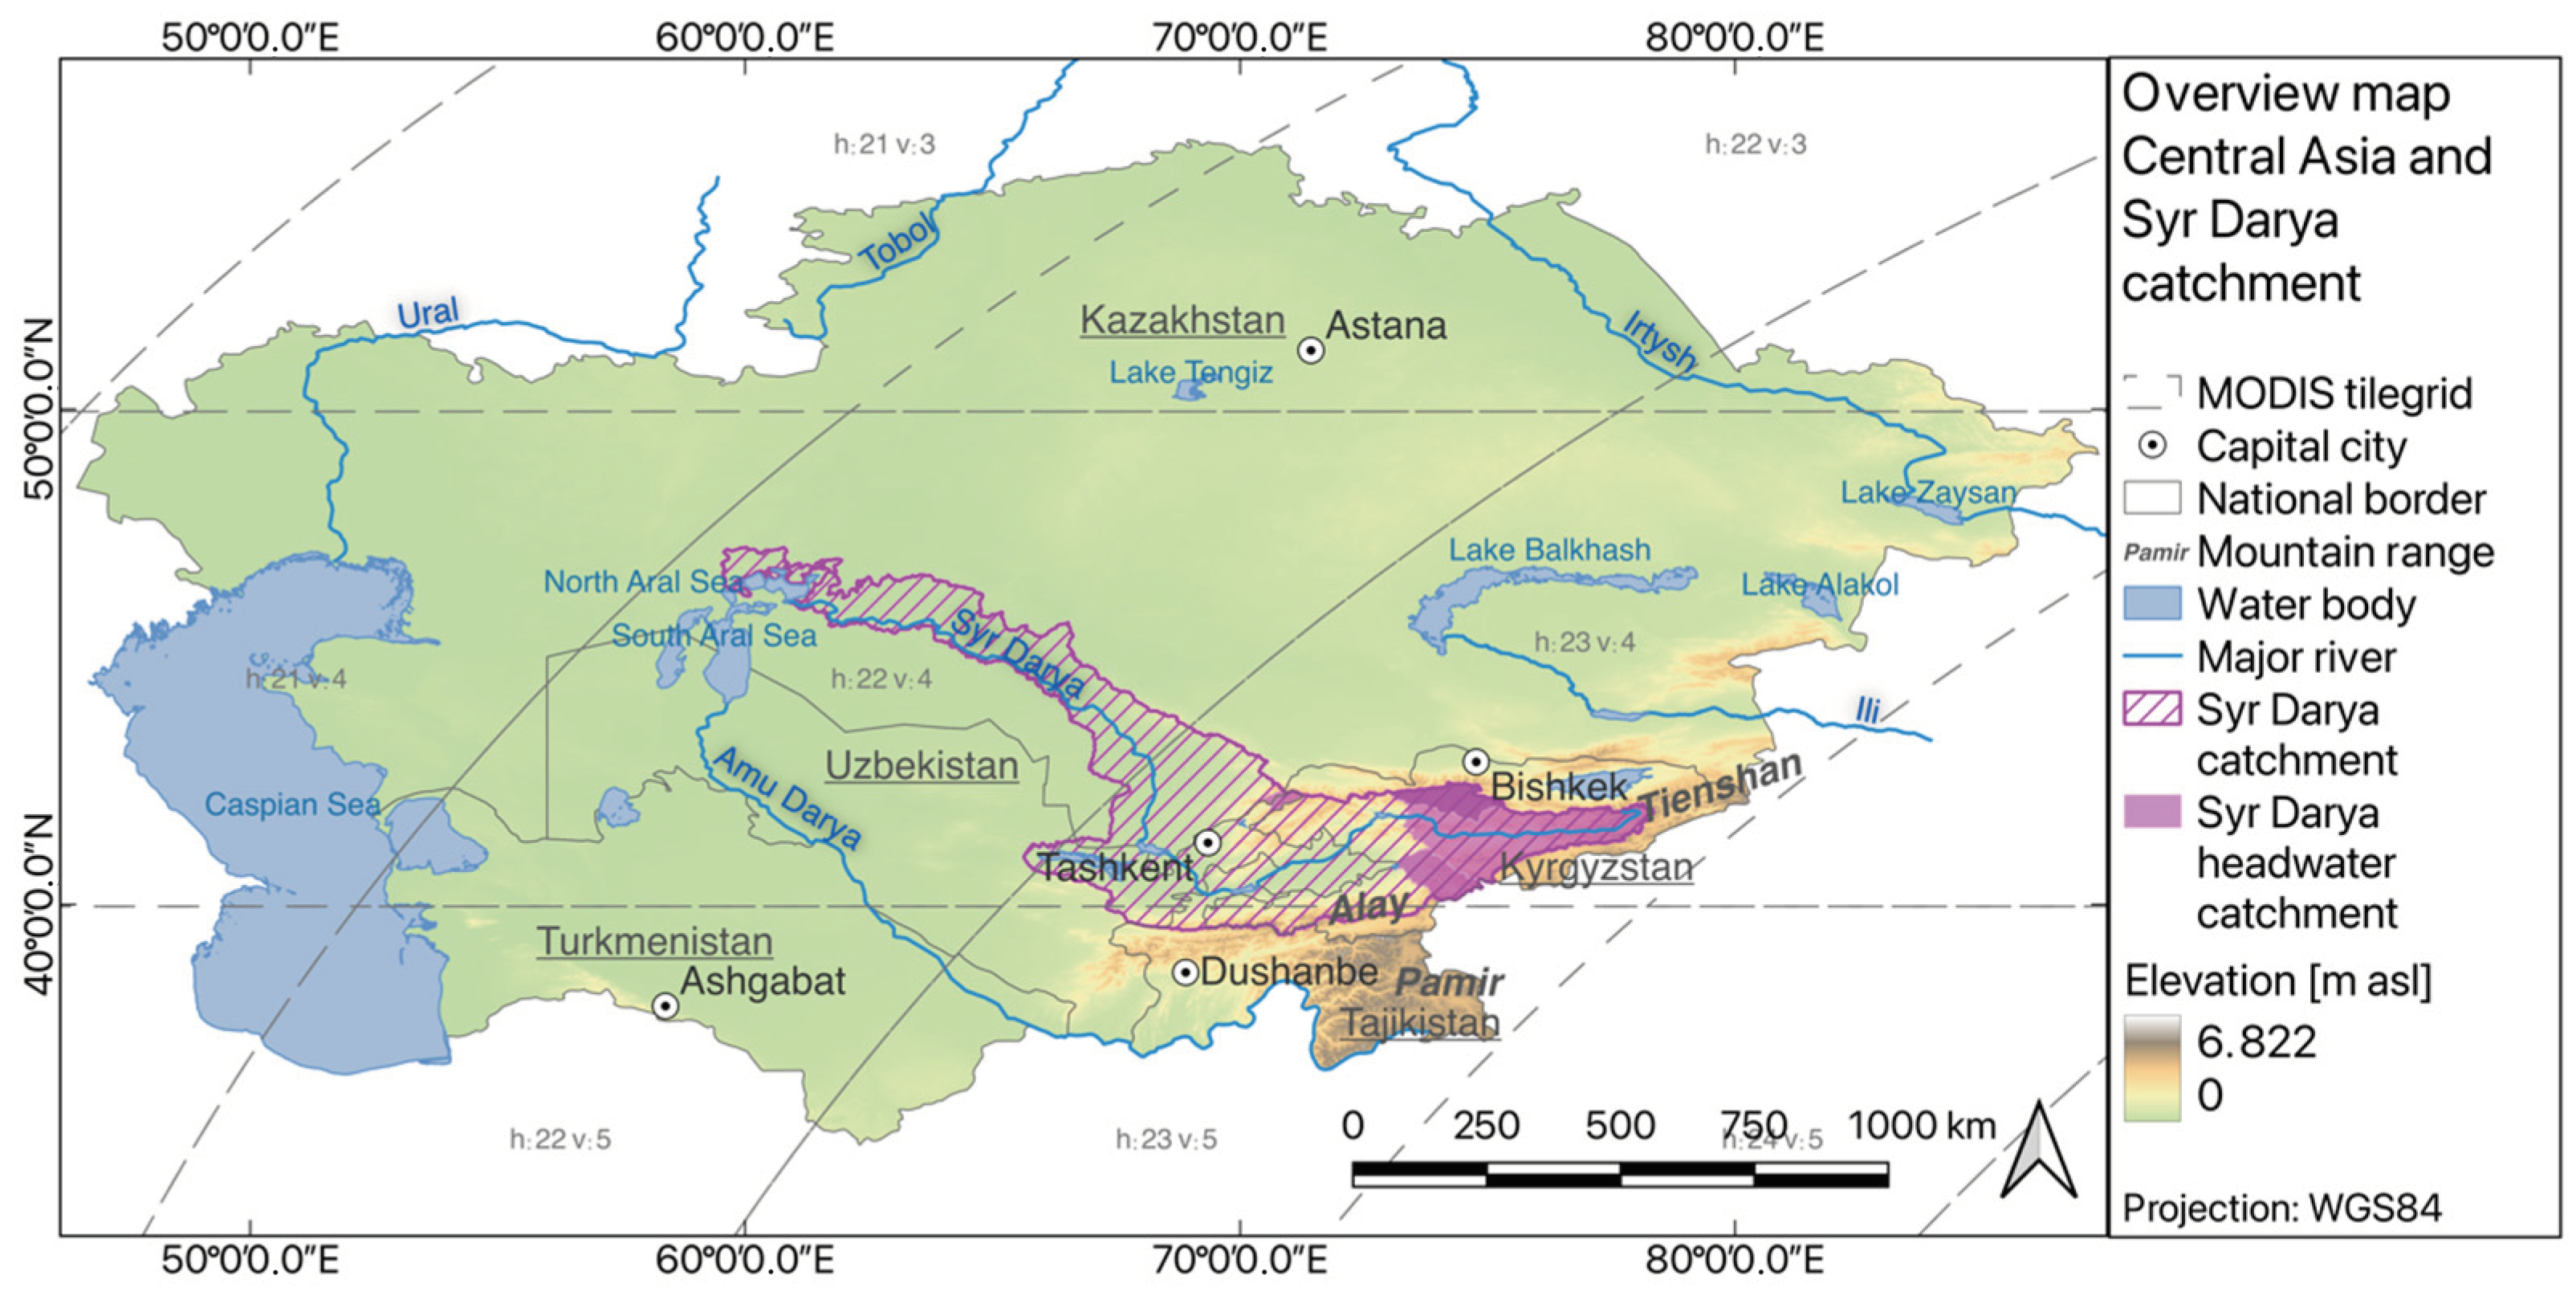
Figure 1. Overview of Central Asia with the Syr Darya catchment and the investigated sub-catchments marked in pink.
Water 16 01902 g001
Figure 2. Mean snow cover duration (2000–2022) for the study region derived from DLRs Global SnowPack product.
Water 16 01902 g002
Figure 3. Overview of investigated Syr Darya sub-catchments.
Water 16 01902 g003
Figure 4. Data availability of runoff data for the different stations for the years 2000 to 2022. Dark green areas marked included annual observation periods (AOPs), light green areas marked AOPs that were removed, and dark yellow is for Kokomeren AOP 2016, when only peak discharge measures were used. Red indicates missing measurements.
Water 16 01902 g004
Figure 5. Fractional snow cover of sub-catchments (a) Maydantal, (b) Oygaing, (c) Kokomeren, (d) Naryn, and (e) Karadarya for the annual observation periods 2001 to 2022. Red lines indicate the day that separates the early and late seasons (1st of January). The black line marks the calculated Melt onset day, the white line Melt half day.
Water 16 01902 g005
Figure 6. Snow cover trends for the five catchments as obtained from the Global SnowPack. Pixels with a p-value > 0.2 are marked in grey. Red and orange indicate a negative trend of SCD and blue indicates a positive one.
Water 16 01902 g006
Figure 7. Measured runoff values of the sub-catchments (a) Maydantal, (b) Oygaing, (c) Kokomeren, (d) Naryn, and (e) Karadarya. Measurements have daily intervals for Kokomeren, Maydantal, and Oygaing and 10-day intervals for Karadarya and Naryn. The black lines limit spring runoff (1 March to 31 July). Blue diamonds mark the peak discharge of the AOP. Grey boxes cover annual observation periods that were not included in calculations due to poor data availability or quality. For 2016, Kokomeren peak runoff measures were included but no other timing measures due to missing data towards the end of spring runoff (runoff data: SDSS (https://sdss.caiag.kg/sdss/) and CAREWIB (cawater-info.net)).
Water 16 01902 g007
Figure 8. Correlation matrices of snow cover and runoff timing measures for the selected sub-catchments: (a) Maydantal, (b) Oygaing, (c) Kokomeren, (d) Naryn, and (e) Karadarya. A relationship is regarded as strong if it is larger than 0.8, moderate if it is larger than 0.6, and weak if it is larger than 0.4.
Water 16 01902 g008
Figure 9. SCD of 365 days for the AOPs 2001 and 2022 in the most eastern part of the Naryn catchment, where glaciers lay the foundation for the stream.
Water 16 01902 g009
Table 1. Discharge station data availability for stations gauging Karadarya, Kokomeren, Maydantal, Naryn, and Oygaing rivers. Data were obtained from the Sensor Data Storage System (SDSS, https://sdss.caiag.kg/sdss/) and the Central Asia Regional Water Information Base (CAREWIB, cawater-info.net).
CatchmentCoordinates of StationData SourceTime of RecordingMissing Spring Runoff MeasurementsYears
Removed
Number of Used Spring Runoff Measurements
FirstLast
Karadarya40°46′59.4546″ N,
73°8′42.7122″ E
CAREWIB1 January 200021 April 2016-2000, 2001211
Kokomeren37°50′32.8164″ N,
65°13′42.2934″ E
SDSS23 September 201310 October 20222722016, 2017, 2018919
Maydantal41°59′47.0616″ N,
70°38′9.7296″ E
SDSS16 March 201510 October 20222492015, 2016919
Naryn41°46′26.814″ N,
73°15′51.9798″ E
CAREWIB1 January 200021 April 2016-2010–2015166
Oygaing41°59′45.42″ N,
70°38′21.3678″ E
SDSS8 October 201810 October 2022--613
Table 2. Overview of snow and spring flood measures: snow cover duration for early and late seasons (SCDES and SCDLS) as well as Melt delta, measured in days, and melt and runoff timing measures (runoff quantiles as Q5%, Q10%, …) were quantified through the day of the hydrological year (DAOP).
AbbreviationUnitDescriptionData Source
SCDESDaysEarly-season snow cover durationGSP
SCDLSDaysLate-season snow cover durationGSP
Melt onsetDAOPSnowmelt start time derived from snow cover dataGSP
Melt halfDAOPSnowmelt half-time derived from snow cover dataGSP
Melt deltaDaysNumber of days between Melt onset and Melt halfGSP
Value Qmaxm3/sPeak runoff volumeSDSS/CAREWIB
DAOP QmaxDAOPTime of peak runoffSDSS/CAREWIB
Q5%DAOPTime when 5% of cumulated discharge occurredSDSS/CAREWIB
Q10%DAOPTime when 10% of cumulated discharge occurredSDSS/CAREWIB
Q50%DAOPTime when 50% of cumulated discharge occurredSDSS/CAREWIB
Q90%DAOPTime when 90% of cumulated discharge occurredSDSS/CAREWIB
Q95%DAOPTime when 95% of cumulated discharge occurredSDSS/CAREWIB
Table 3. Average values of snow cover duration (SCD) and snowmelt parameters (Melt onset and Melt half were quantified through their day of annual observation period (DAOP)) as well as their standard deviation for the selected sub-catchments (rounded to two decimal places).
ParameterUnitKaradaryaKokomerenMaydantalNarynOygaing
SCDESDays59.79 ± 7.3463.07 ± 7.2781.57 ± 7.8860.47 ± 6.4381.58 ± 7.4
SCDLSDays117.32 ± 9.84126.54 ± 8.98173.14 ± 9.41119.88 ± 12.3167.99 ± 8.88
Melt onsetDAOP181.32 ± 21.7196.51 ± 15.15245.34 ± 10.94193.01 ± 23.15233.84 ± 10.85
Melt halfDAOP240.38 ± 11.01249.38 ± 11.03300.11 ± 10.89239.65 ± 9.49297.21 ± 17.44
Melt deltaDays59.05 ± 20.7152.86 ± 12.7654.77 ± 12.7647 ± 20.0563.36 ± 18.34
Table 4. Trends with corresponding p-values resulting from Mann–Kendall tests for early- and late-season snow cover duration (SCDES and SCDLS) as well as melt parameters (Melt onset, Melt half, and Melt delta). Melt parameters were quantified through their day of annual observation period (DAOP). Statistical significance is indicated by an asterisk.
ParameterUnitKaradaryaKokomerenMaydantalNarynOygaing
SCDESDays0.016−0.08−0.4−0.21−0.33
SCDLSDays−0.53 **−0.65 **−0.73 ***−0.63 **−0.67 ***
Melt onsetDAOP0.11−0.83 ***−0.17−0.9 **−0.36
Melt halfDAOP−0.71 *−0.5 *−0.53 *−0.63 *−0.75 *
Melt deltaDAOP−0.83 *0.100.12−0.27
Note: *** p-value < 0.05, ** p-value < 0.1, * p-value < 0.2, no * p-value ≥ 0.2.
Table 5. Trends with corresponding p-values resulting from Mann–Kendall tests for early- and late-season snow cover duration (SCDES and SCDLS) as well as melt parameters (Melt onset, Melt half, and Melt delta) for the time periods when runoff data were available. Melt parameters were quantified through their day of annual observation period (DAOP). Statistical significance is indicated by an asterisk.
ParameterUnitKaradaryaKokomerenMaydantalNarynOygaing
2002–20152014–20222017–20222001–20102019–2022
SCDESDays−0.18−1.08−4.84 *−1.62 ***−3.06
SCDLSDays−0.34−1.85 *−2.71 *−0.16−4.15
Melt onsetDAOP1.17−2.64 ***−1.5−0.331.52
Melt halfDAOP−1.07−2.14 **−3.27−1.22−3.96
Melt deltaDAOP−1.5 **0.42−1.33−0.5−10.67
Note: *** p-value < 0.05, ** p-value < 0.1, * p-value < 0.2, no * p-value ≥ 0.2.
Table 6. Average values of runoff parameters as well as their standard deviation for the selected sub-catchments. DAOP Qmax and runoff percentiles (Q5% to Q95%) were quantified through the day of the annual observation period (DAOP).
ParameterUnitKaradaryaKokomerenMaydantalNarynOygaing
Value Qmaxm3/s403.71 ± 34.4%244.8 ± 16%5508.66 ± 8.4%1263.17 ± 27%3025.93 ± 6%
DAOP QmaxDAOP261.53 ± 23.01276.4 ± 20.44294.41 ± 17.92283.17 ± 14.09292.76 ± 13.28
Q5%DAOP194.45 ± 7.16202.38 ± 3.2220 ± 6198.72 ± 6.83197.25 ± 1.2
Q10%DAOP210.09 ± 5.15235,72 ± 4,85235.72 ± 4.85216.9 ± 4.96211.76 ± 2.32
Q50%DAOP259.03 ± 7.66277.23 ± 6.19283.07 ± 5.21271.17 ± 6.92276.5 ± 2.87
Q90%DAOP302.11 ± 6.96320.74 ± 1.39321.57 ± 1.63312.44 ± 4.07321.5 ± 1.25
Q95%DAOP310.68 ± 4.95327.41 ± 0.78327.57 ± 0.81315.16 ± 3327.75 ± 0.55
Table 7. Trends with corresponding p-values resulting from Mann–Kendall tests for runoff measures (DAOP meaning day of annual observation period). For Kokomeren, the years 2017 and 2018 were not included as well as quantile measures Q5% to Q95% for 2016.
UnitKaradaryaKokomerenMaydantalNarynOygaing
2002–20152014–20222017–20222000–20152019–2022
Value Qmaxm3/s−14.68 *−5.37−170.0734.27−42.52
DAOP QmaxDAOP0.04−2.88−0.230−0.78
Q5%DAOP0 *−1.18−0.60−0.17
Q10%DAOP0−1 *−0.800.5
Q50%DAOP0−2.4 *−0.50−2.17 **
Q90%DAOP0−0.12−0.250−1 **
Q95%DAOP0 **000−0.19
Note: ** p-value < 0.1, * p-value < 0.2, no * p-value ≥ 0.2.
Disclaimer/Publisher’s Note: The statements, opinions and data contained in all publications are solely those of the individual author(s) and contributor(s) and not of MDPI and/or the editor(s). MDPI and/or the editor(s) disclaim responsibility for any injury to people or property resulting from any ideas, methods, instructions or products referred to in the content.