


Optimization of Liquid-State Anaerobic Digestion by Defining the Optimal Composition of a Complex Mixture of Substrates Using a Simplex Centroid Design


 and
and 
Abstract
1. Introduction
2. Materials and Methods
2.1. Substrates
Analytical Testing
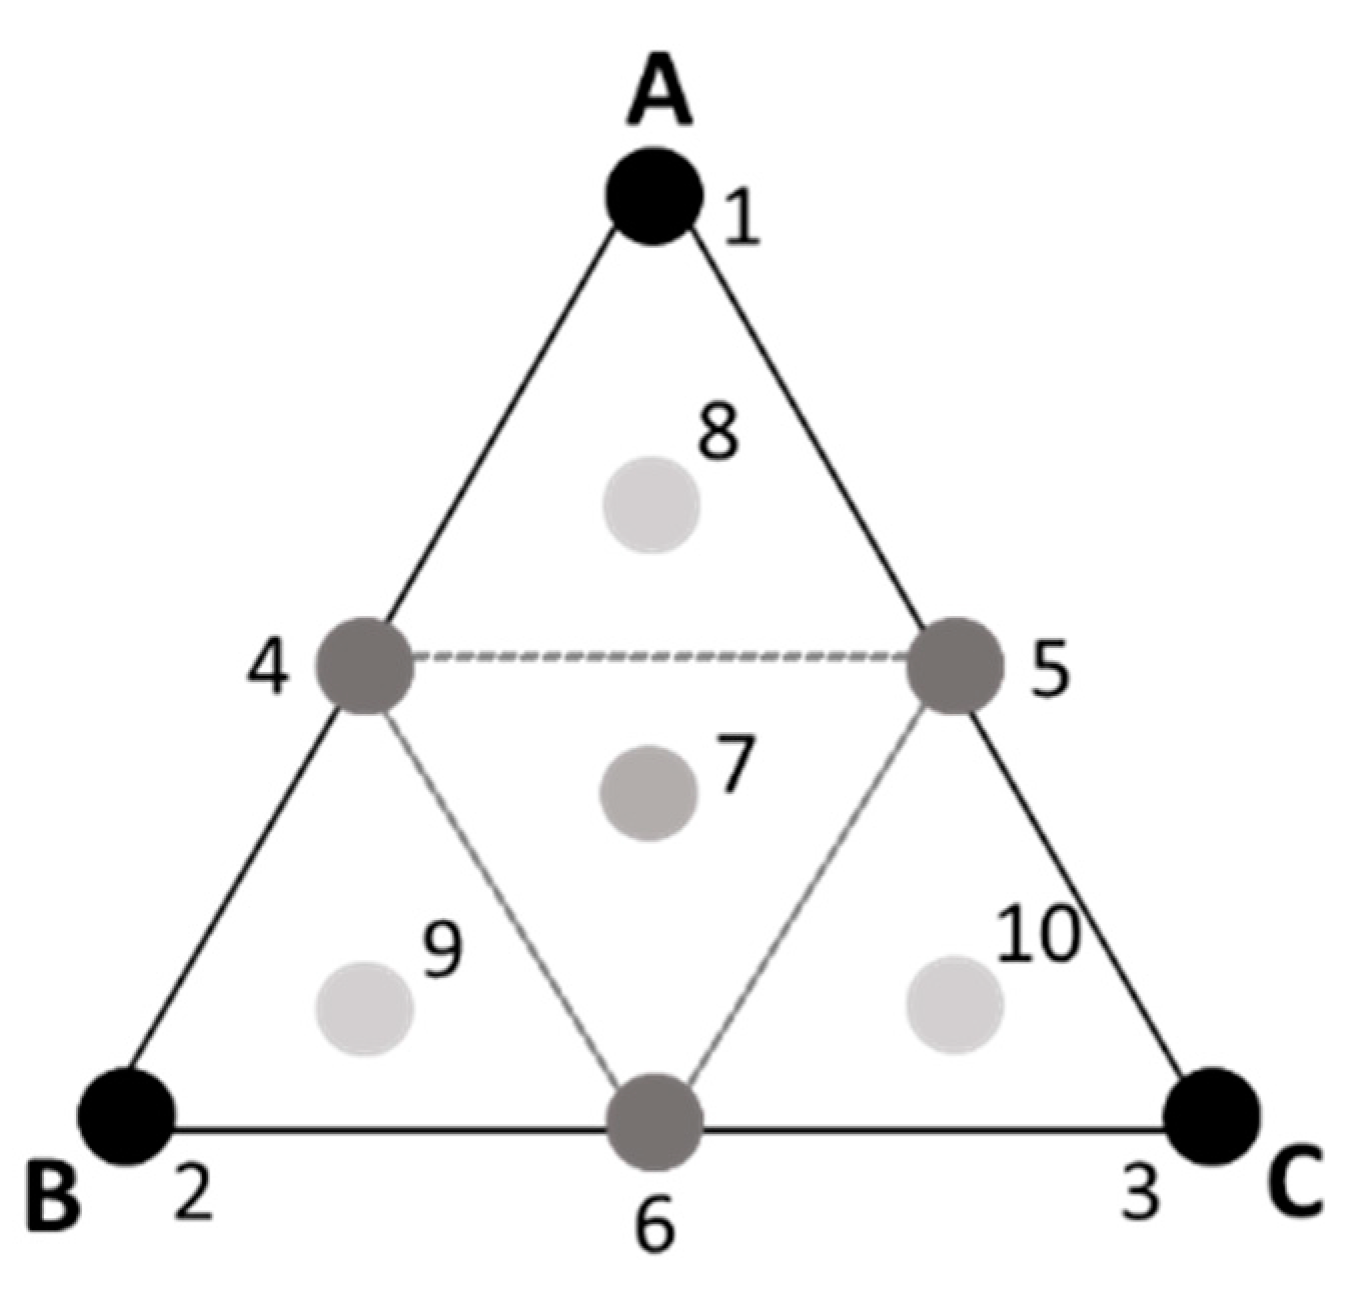
2.2. Mixture Design Methodology
2.3. Experimental Setup
2.3.1. Digesters
AMPTS
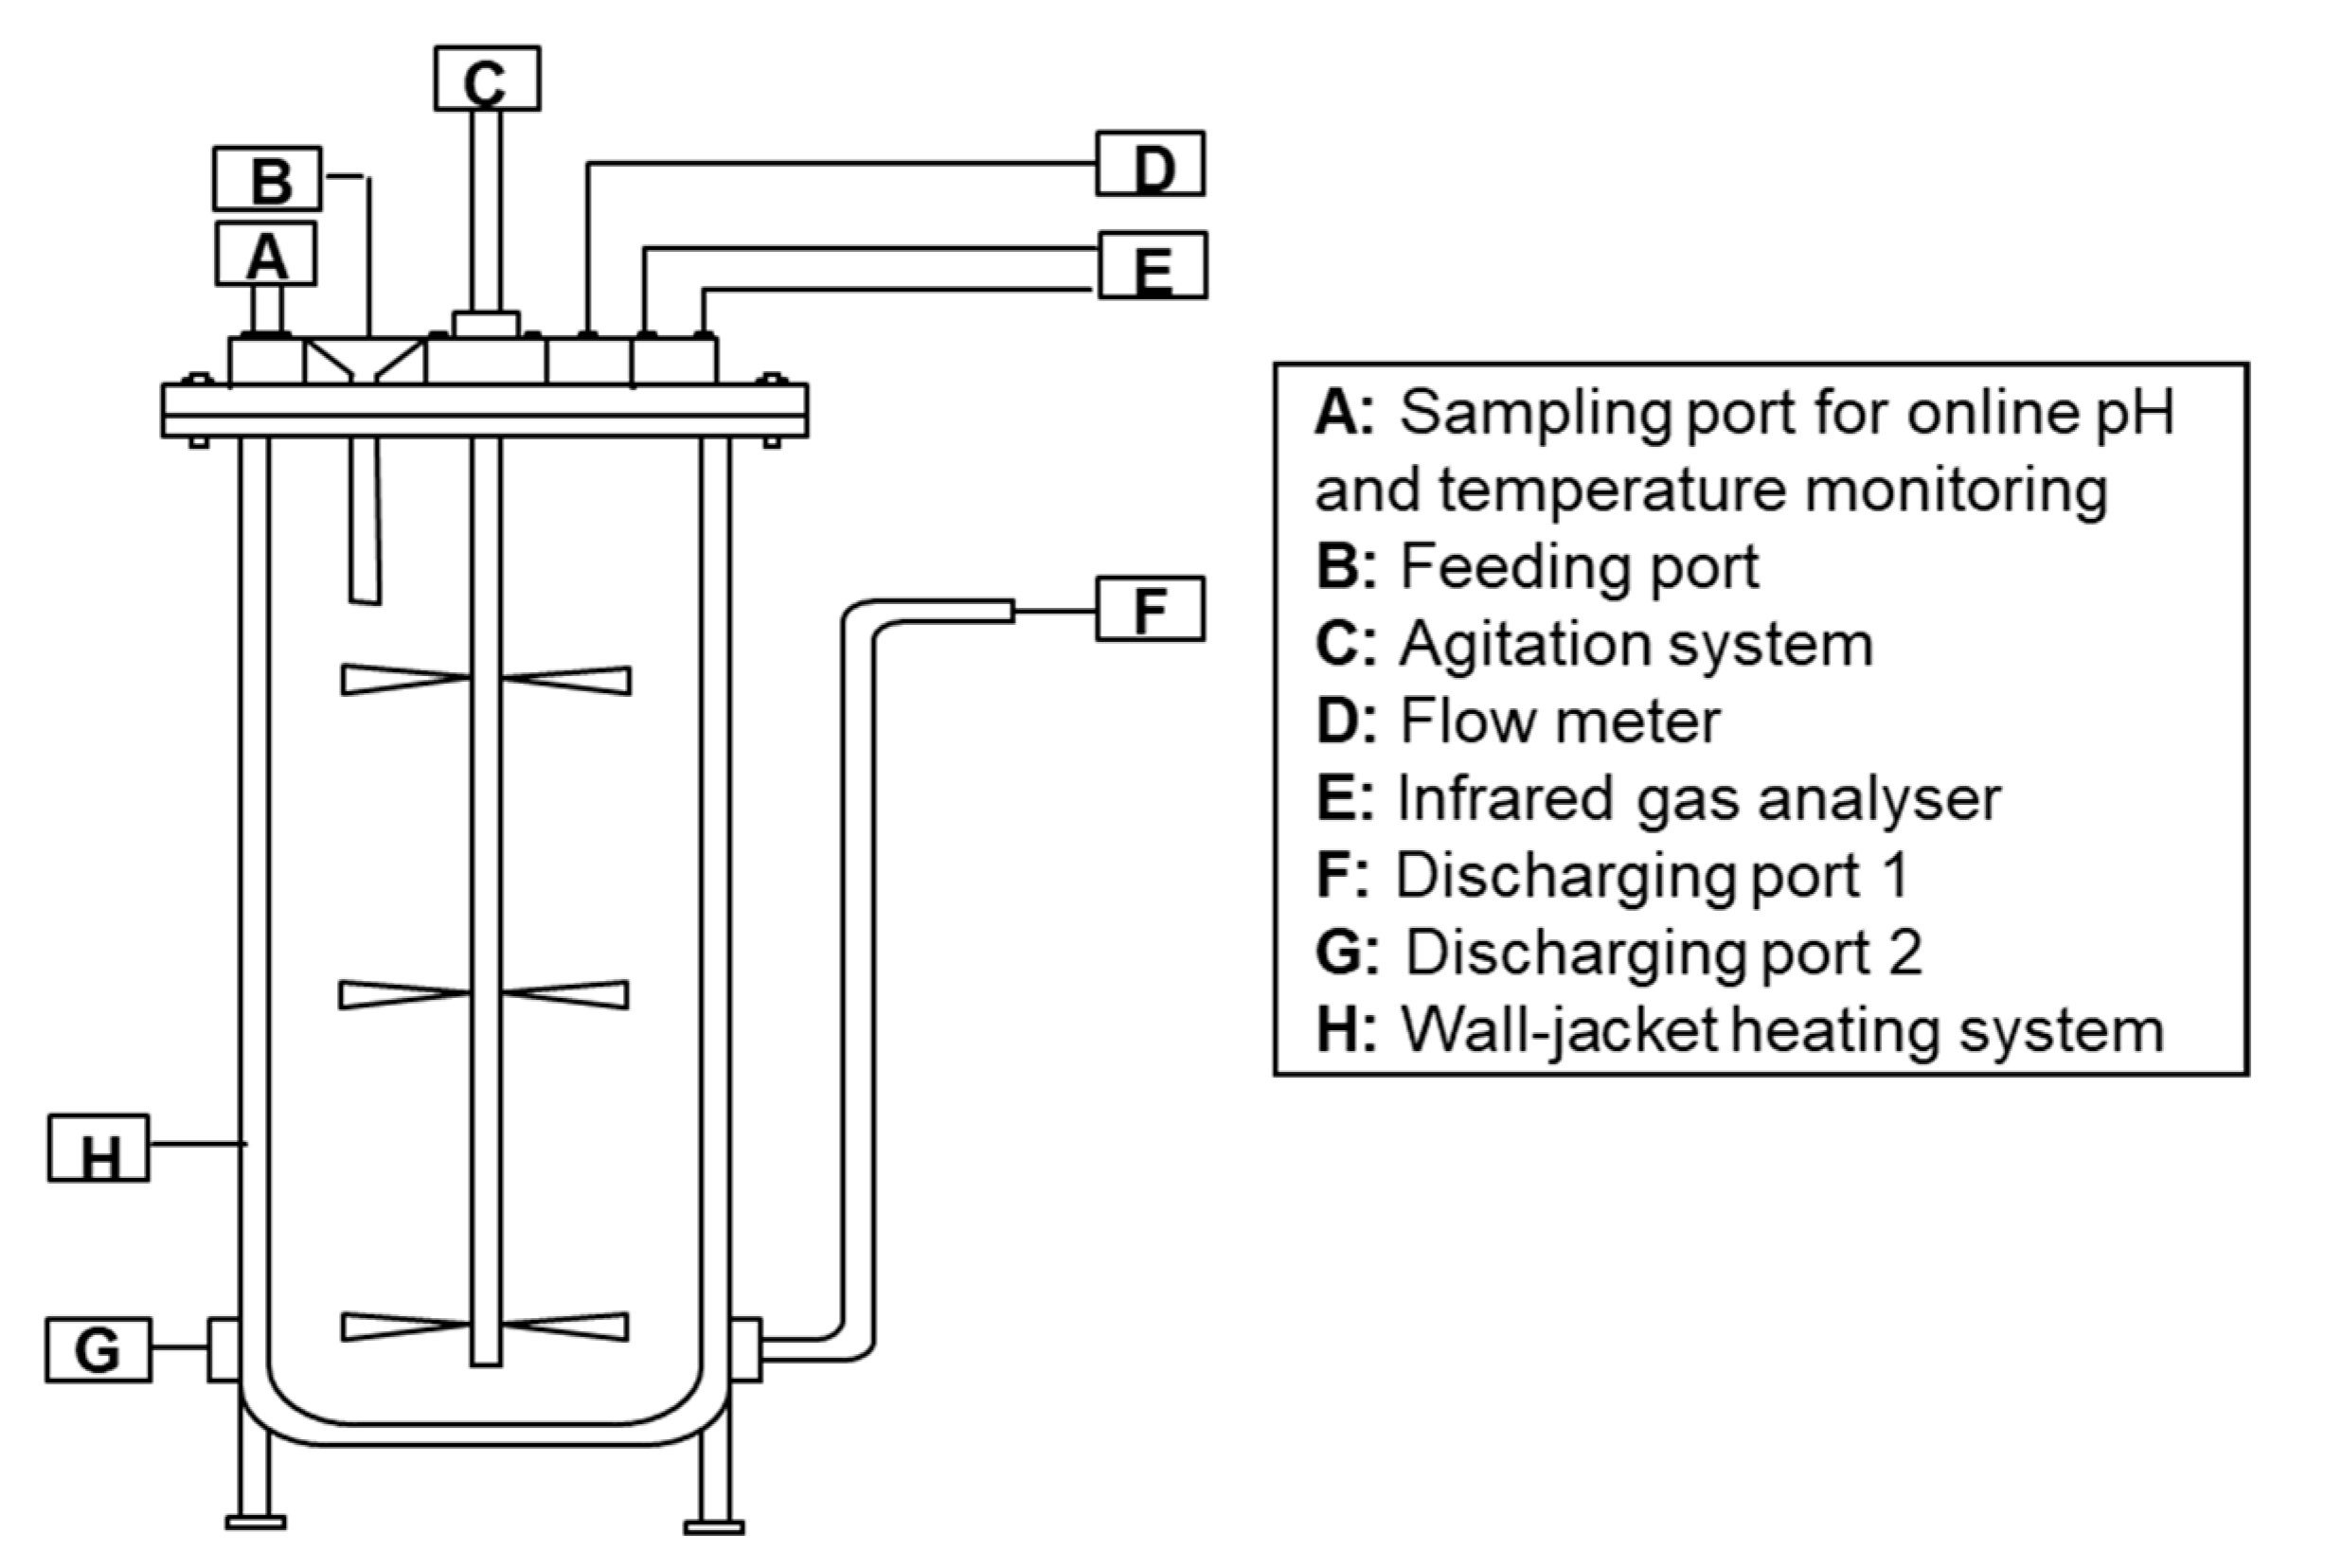
Ten-Liter Digesters
2.3.2. Experimental Procedure
Definition of the Best Mixture of Substrates by AMPTS
Validation at the Small Pilot Scale
2.4. Statistical Analysis of the Model: Calibration and Validation
3. Results and Discussion
3.1. Experimental Methane Yield Results
3.2. Calibration and Validation of the Prediction Model
3.2.1. Calibration of the Prediction Model
3.2.2. Validation of the Mathematical Prediction Model with Experimental Points
3.2.3. Graphical Presentation of Optimal Zones
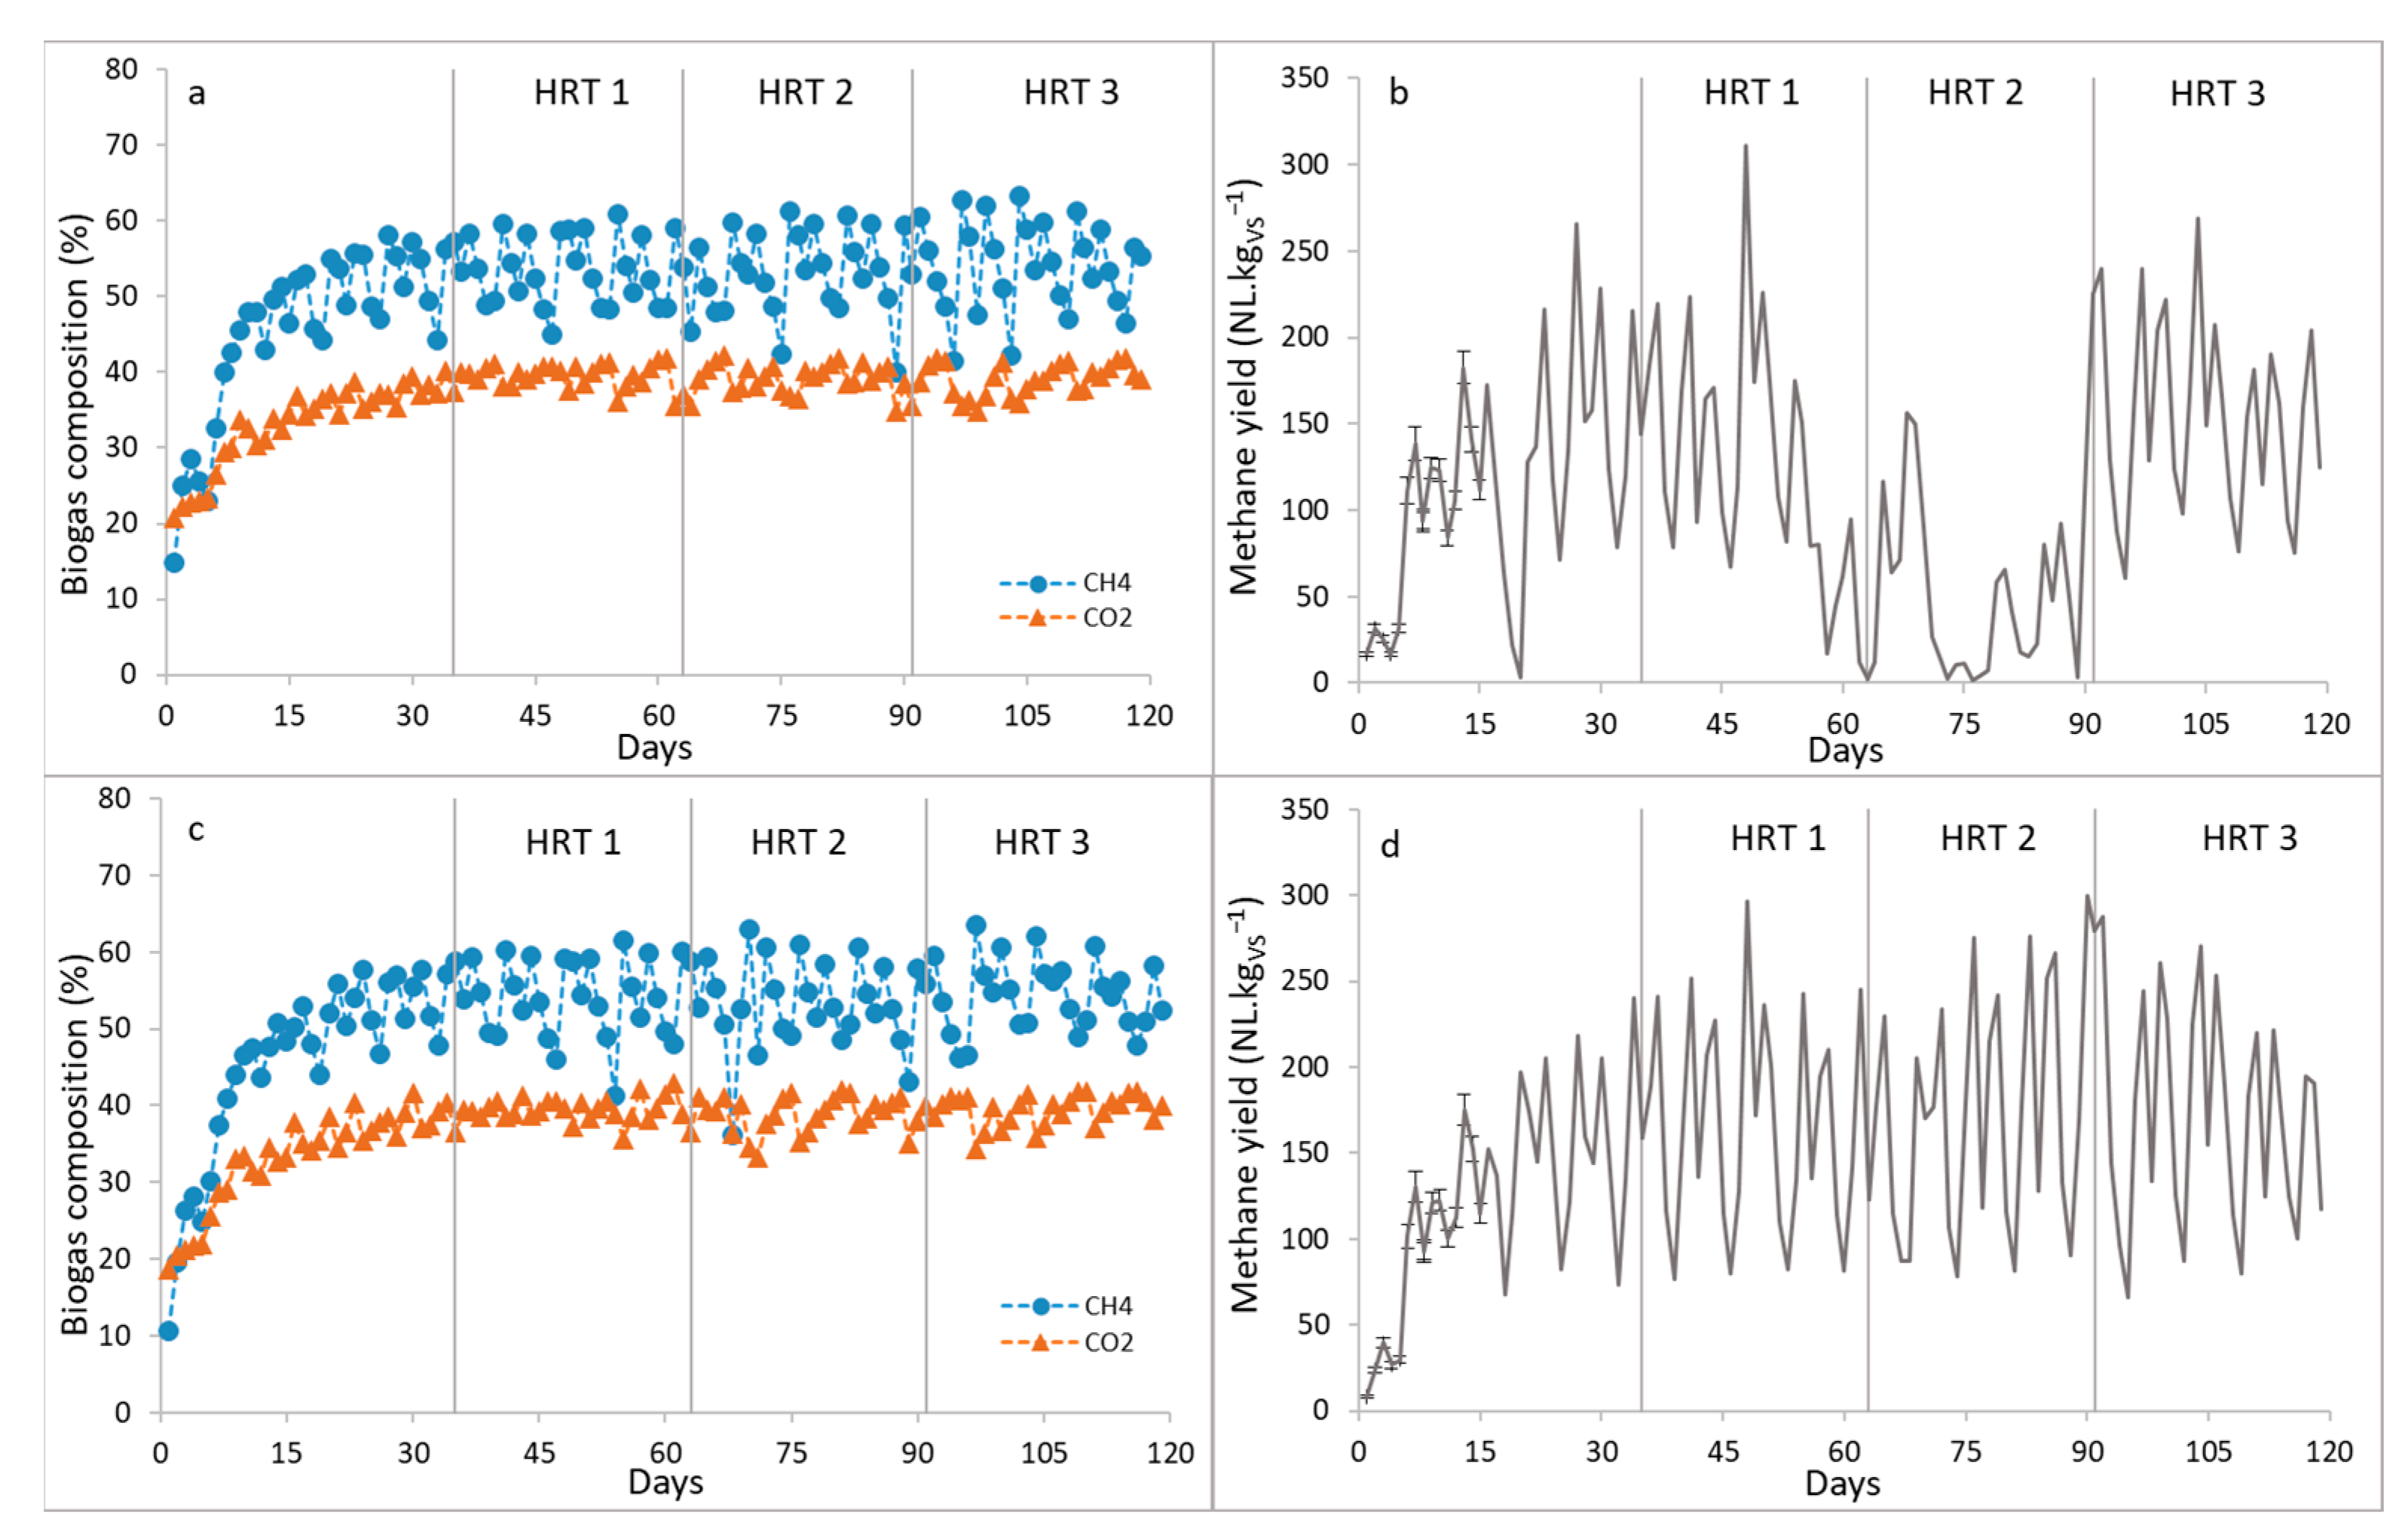
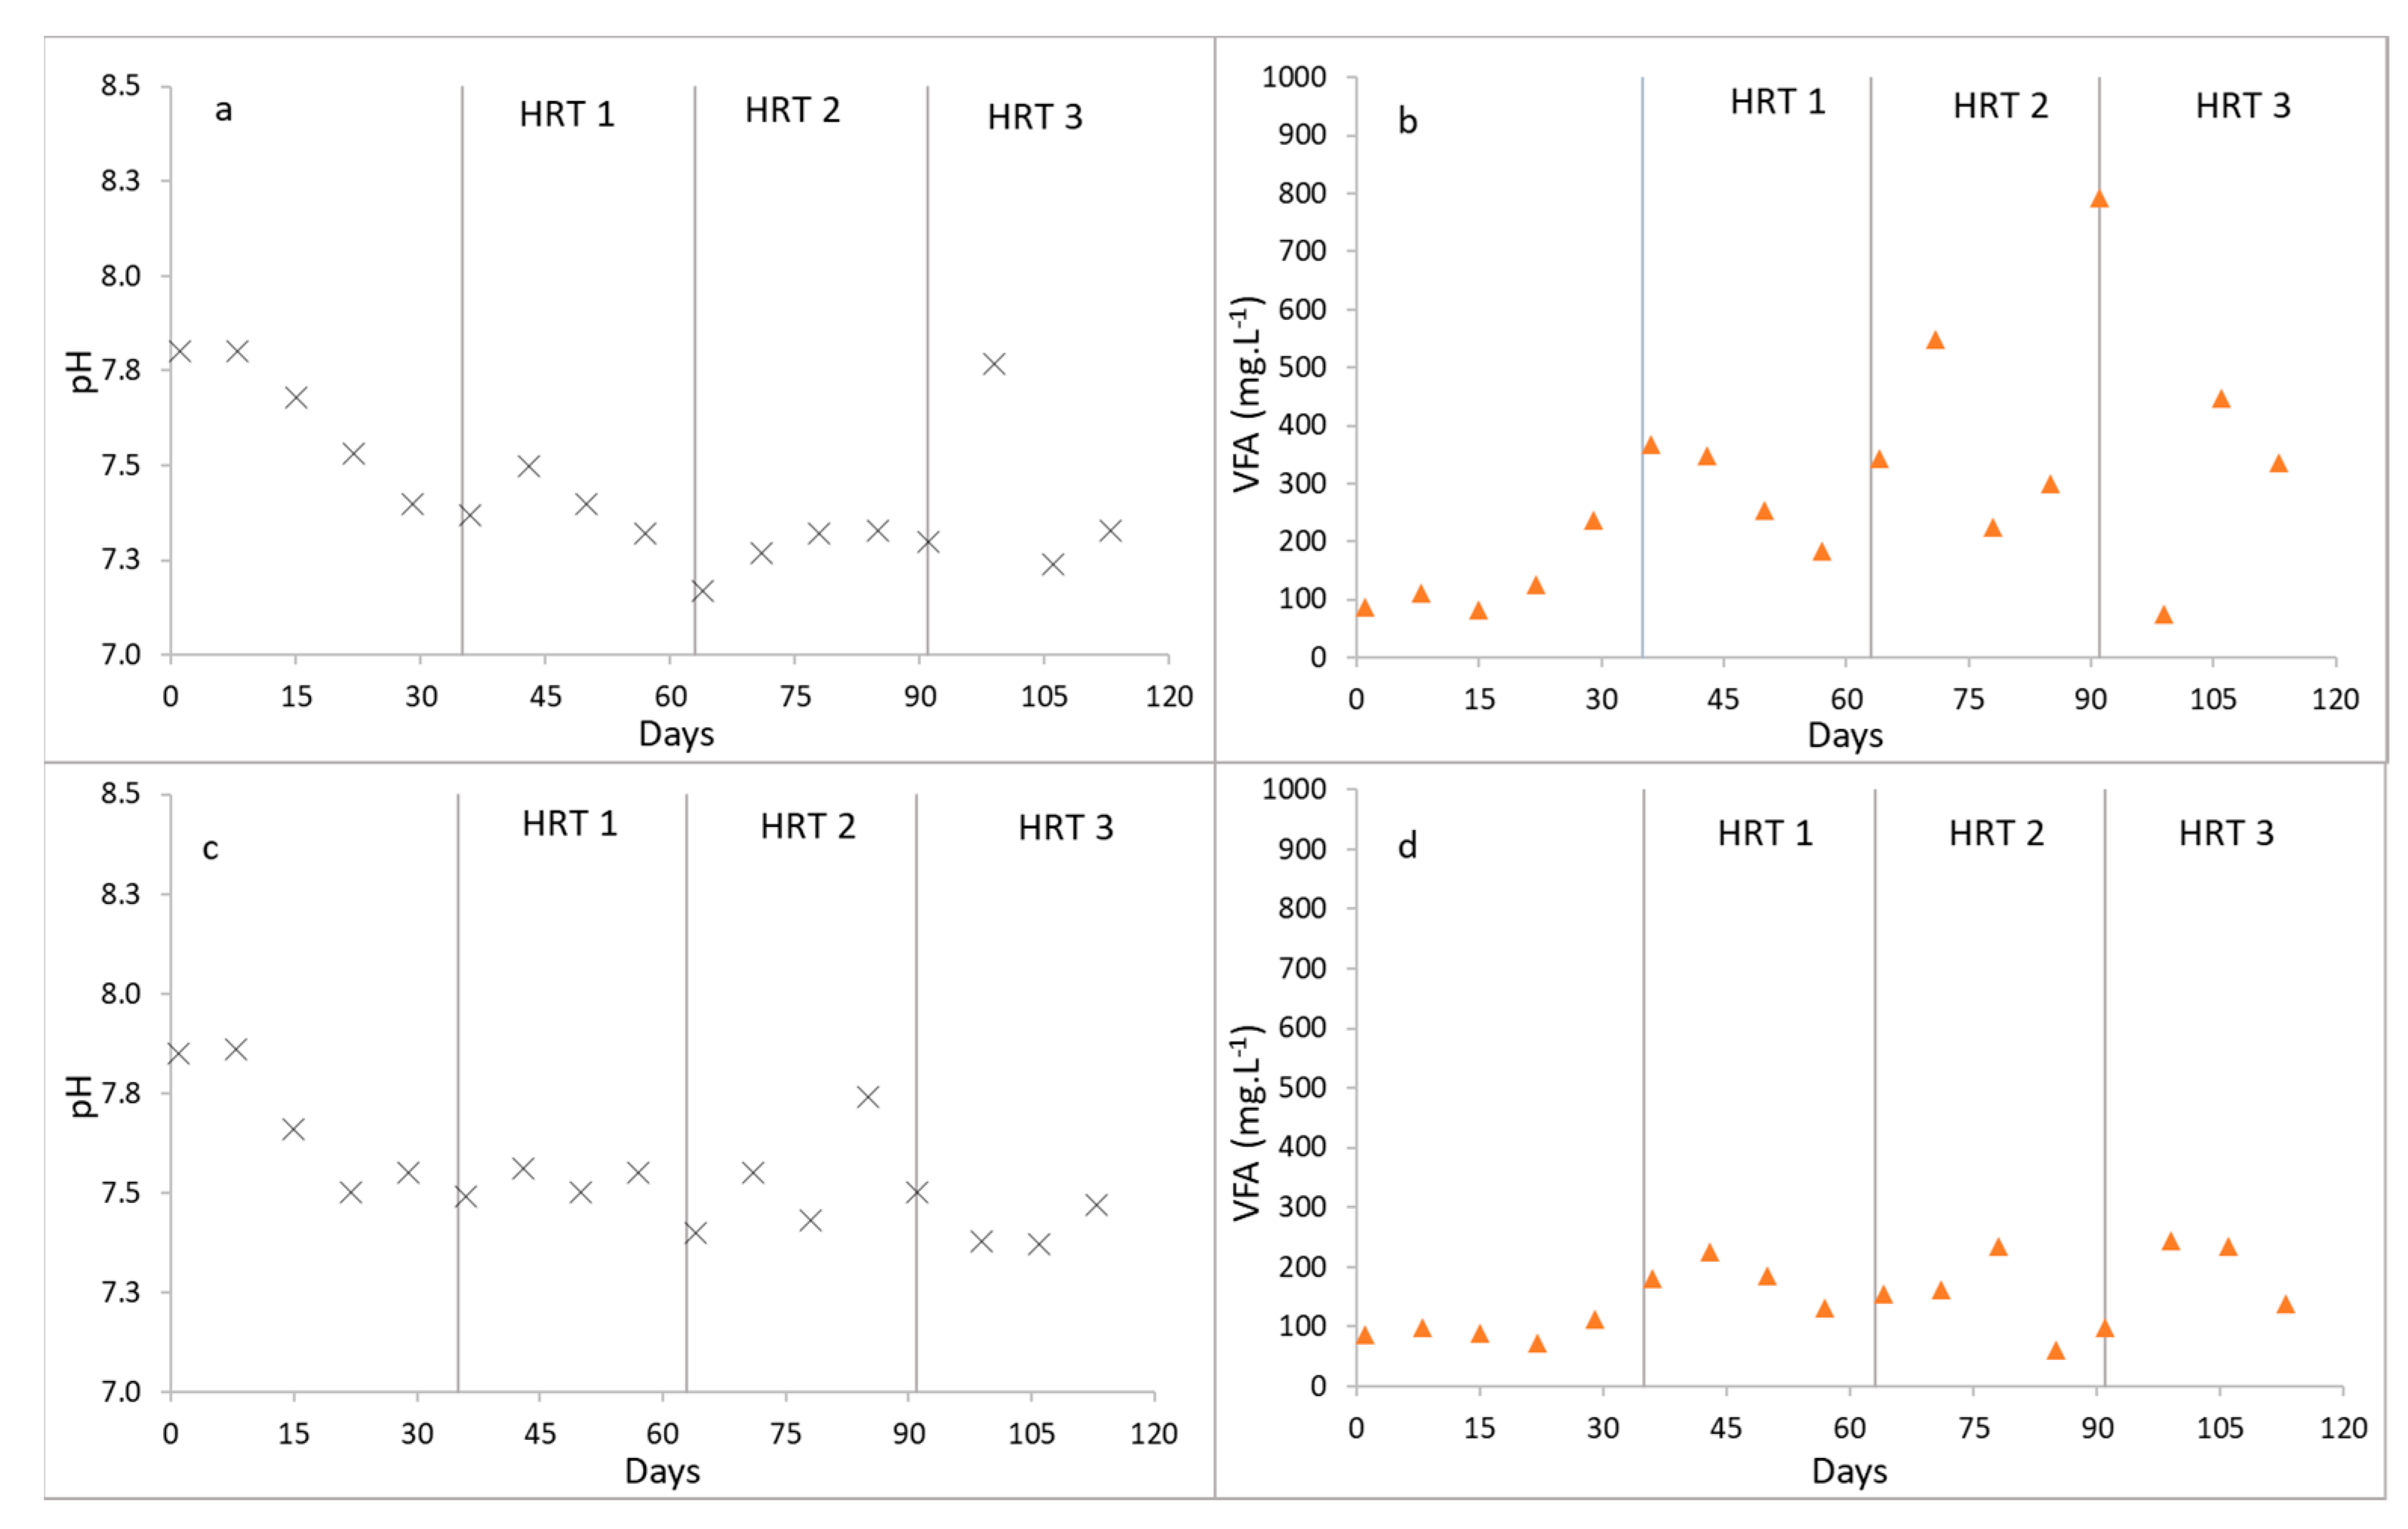
3.3. Validation of the Optimal Mixture of Substrates at the Small Pilot Scale
Evaluation of the Performance of the Small-Scale Pilot
4. Conclusions
Author Contributions
Funding
Data Availability Statement
Acknowledgments
Conflicts of Interest
References
- Muhammad, G.; Alam, M.A.; Mofijur, M.; Jahirul, M.I.; Lv, Y.; Xiong, W.; Ong, H.C.; Xu, J. Modern Developmental Aspects in the Field of Economical Harvesting and Biodiesel Production from Microalgae Biomass. Renew. Sustain. Energy Rev. 2021, 135, 110209. [Google Scholar] [CrossRef]
- Shahir, S.A.; Masjuki, H.H.; Kalam, M.A.; Imran, A.; Fattah, I.M.R.; Sanjid, A. Feasibility of Diesel–Biodiesel–Ethanol/Bioethanol Blend as Existing CI Engine Fuel: An Assessment of Properties, Material Compatibility, Safety and Combustion. Renew. Sustain. Energy Rev. 2014, 32, 379–395. [Google Scholar] [CrossRef]
- Kunatsa, T.; Xia, X. A Review on Anaerobic Digestion with Focus on the Role of Biomass Co-Digestion, Modelling and Optimisation on Biogas Production and Enhancement. Bioresour. Technol. 2022, 344, 126311. [Google Scholar] [CrossRef] [PubMed]
- Van, D.P.; Fujiwara, T.; Leu Tho, B.; Song Toan, P.P.; Hoang Minh, G. A Review of Anaerobic Digestion Systems for Biodegradable Waste: Configurations, Operating Parameters, and Current Trends. Environ. Eng. Res. 2019, 25, 1–17. [Google Scholar] [CrossRef]
- Wu, D.; Li, L.; Zhao, X.; Peng, Y.; Yang, P.; Peng, X. Anaerobic Digestion: A Review on Process Monitoring. Renew. Sustain. Energy Rev. 2019, 103, 1–12. [Google Scholar] [CrossRef]
- Pellera, F.-M.; Gidarakos, E. Anaerobic Digestion of Solid Agroindustrial Waste in Semi-Continuous Mode: Evaluation of Mono-Digestion and Co-Digestion Systems. Waste Manag. 2017, 68, 103–119. [Google Scholar] [CrossRef]
- Sun, C.; Cao, W.; Banks, C.J.; Heaven, S.; Liu, R. Biogas Production from Undiluted Chicken Manure and Maize Silage: A Study of Ammonia Inhibition in High Solids Anaerobic Digestion. Bioresour. Technol. 2016, 218, 1215–1223. [Google Scholar] [CrossRef] [PubMed]
- Chen, X.; Yan, W.; Sheng, K.; Sanati, M. Comparison of High-Solids to Liquid Anaerobic Co-Digestion of Food Waste and Green Waste. Bioresour. Technol. 2014, 154, 215–221. [Google Scholar] [CrossRef]
- Shi, J.; Wang, Z.; Stiverson, J.A.; Yu, Z.; Li, Y. Reactor Performance and Microbial Community Dynamics during Solid-State Anaerobic Digestion of Corn Stover at Mesophilic and Thermophilic Conditions. Bioresour. Technol. 2013, 136, 574–581. [Google Scholar] [CrossRef]
- Di Maria, F.; Barratta, M.; Bianconi, F.; Placidi, P.; Passeri, D. Solid Anaerobic Digestion Batch with Liquid Digestate Recirculation and Wet Anaerobic Digestion of Organic Waste: Comparison of System Performances and Identification of Microbial Guilds. Waste Manag. 2017, 59, 172–180. [Google Scholar] [CrossRef]
- Shinners, K.; Binversie, B.; Muck, R.; Weimer, P. Comparison of Wet and Dry Corn Stover Harvest and Storage. Biomass Bioenergy 2007, 31, 211–221. [Google Scholar] [CrossRef]
- Abbassi-Guendouz, A.; Brockmann, D.; Trably, E.; Dumas, C.; Delgenès, J.-P.; Steyer, J.-P.; Escudié, R. Total Solids Content Drives High Solid Anaerobic Digestion via Mass Transfer Limitation. Bioresour. Technol. 2012, 111, 55–61. [Google Scholar] [CrossRef] [PubMed]
- Rocamora, I.; Wagland, S.T.; Villa, R.; Simpson, E.W.; Fernández, O.; Bajón-Fernández, Y. Dry Anaerobic Digestion of Organic Waste: A Review of Operational Parameters and Their Impact on Process Performance. Bioresour. Technol. 2020, 299, 122681. [Google Scholar] [CrossRef] [PubMed]
- Kothari, R.; Pandey, A.K.; Kumar, S.; Tyagi, V.V.; Tyagi, S.K. Different Aspects of Dry Anaerobic Digestion for Bio-Energy: An Overview. Renew. Sustain. Energy Rev. 2014, 39, 174–195. [Google Scholar] [CrossRef]
- Lee, J.; Hong, J.; Jeong, S.; Chandran, K.; Park, K.Y. Interactions between Substrate Characteristics and Microbial Communities on Biogas Production Yield and Rate. Bioresour. Technol. 2020, 303, 122934. [Google Scholar] [CrossRef] [PubMed]
- Maragkaki, A.E.; Vasileiadis, I.; Fountoulakis, M.; Kyriakou, A.; Lasaridi, K.; Manios, T. Improving Biogas Production from Anaerobic Co-Digestion of Sewage Sludge with a Thermal Dried Mixture of Food Waste, Cheese Whey and Olive Mill Wastewater. Waste Manag. 2018, 71, 644–651. [Google Scholar] [CrossRef] [PubMed]
- Vivekanand, V.; Mulat, D.G.; Eijsink, V.G.H.; Horn, S.J. Synergistic Effects of Anaerobic Co-Digestion of Whey, Manure and Fish Ensilage. Bioresour. Technol. 2018, 249, 35–41. [Google Scholar] [CrossRef] [PubMed]
- Yasar, A.; Nazir, S.; Tabinda, A.B.; Nazar, M.; Rasheed, R.; Afzaal, M. Socio-Economic, Health and Agriculture Benefits of Rural Household Biogas Plants in Energy Scarce Developing Countries: A Case Study from Pakistan. Renew. Energy 2017, 108, 19–25. [Google Scholar] [CrossRef]
- Buruk Sahin, Y.; Aktar Demirtaş, E.; Burnak, N. Mixture Design: A Review of Recent Applications in the Food Industry. Pamukkale Univ. J. Eng. Sci. 2016, 22, 297–304. [Google Scholar] [CrossRef]
- Rao, P.V.; Baral, S.S. Experimental Design of Mixture for the Anaerobic Co-Digestion of Sewage Sludge. Chem. Eng. J. 2011, 172, 977–986. [Google Scholar] [CrossRef]
- Comino, E.; Riggio, V.A.; Rosso, M. Biogas Production by Anaerobic Co-Digestion of Cattle Slurry and Cheese Whey. Bioresour. Technol. 2012, 114, 46–53. [Google Scholar] [CrossRef] [PubMed]
- Pagés-Díaz, J.; Pereda-Reyes, I.; Taherzadeh, M.J.; Sárvári-Horváth, I.; Lundin, M. Anaerobic Co-Digestion of Solid Slaughterhouse Wastes with Agro-Residues: Synergistic and Antagonistic Interactions Determined in Batch Digestion Assays. Chem. Eng. J. 2014, 245, 89–98. [Google Scholar] [CrossRef]
- Kashi, S.; Satari, B.; Lundin, M.; Horváth, I.S.; Othman, M. Application of a Mixture Design to Identify the Effects of Substrates Ratios and Interactions on Anaerobic Co-Digestion of Municipal Sludge, Grease Trap Waste, and Meat Processing Waste. J. Environ. Chem. Eng. 2017, 5, 6156–6164. [Google Scholar] [CrossRef]
- Rahman, M.A.; Saha, C.K.; Ward, A.J.; Møller, H.B.; Alam, M.M. Anaerobic Co-Digestions of Agro-Industrial Waste Blends Using Mixture Design. Biomass Bioenergy 2019, 122, 156–164. [Google Scholar] [CrossRef]
- Regalado, R.E.H.; Weide, T.; Baumkötter, D.; Wettwer, L.; Häner, J.; Brügging, E.; Tränckner, J. Optimization and Analysis of Liquid Anaerobic Co-Digestion of Agro-Industrial Wastes via Mixture Design. Processes 2021, 9, 877. [Google Scholar] [CrossRef]
- Aydram, R.; Haji Agha Alizade, H.; Rasouli, M.; Shadidi, B. Simplex Centroid Mixture Design for Optimizing and Promoting the Anaerobic Co-Digestion Performance of Sheep Blood and Cheese Whey. J. Renew. Energy Environ. 2021, 8, 8–15. [Google Scholar] [CrossRef]
- Sánchez, Z.; Poggio, D.; Castro, L.; Escalante, H. Simultaneous Synergy in CH4 Yield and Kinetics: Criteria for Selecting the Best Mixtures during Co-Digestion of Wastewater and Manure from a Bovine Slaughterhouse. Energies 2021, 14, 384. [Google Scholar] [CrossRef]
- Coutu, A.; Mottelet, S.; Guérin, S.; Rocher, V.; Pauss, A.; Ribeiro, T. Methane Yield Optimization Using Mix Response Design and Bootstrapping: Application to Solid-State Anaerobic Co-Digestion Process of Cattle Manure and Damp Grass. Bioresour. Technol. Rep. 2022, 17, 100883. [Google Scholar] [CrossRef]
- Munhoz, V.M.; Longhini, R.; Souza, J.R.P.; Zequi, J.A.C.; Mello, E.V.S.L.; Lopes, G.C.; Mello, J.C.P. Extraction of Flavonoids from Tagetes Patula: Process Optimization and Screening for Biological Activity. Rev. Bras. Farmacogn. 2014, 24, 576–583. [Google Scholar] [CrossRef]
- Hadin, Å.; Eriksson, O. Horse Manure as Feedstock for Anaerobic Digestion. Waste Manag. 2016, 56, 506–518. [Google Scholar] [CrossRef]
- Romano, P.V.; Krogmann, U.; Westendorf, M.L.; Strom, P.F. Small-Scale Composting of Horse Manure Mixed with Wood Shavings. Compos. Sci. Util. 2006, 14, 132–141. [Google Scholar] [CrossRef]
- ADEME. Déchets Chiffres-Clés, 2023rd ed.; ADEME: Montrouge, France, 2023; 84p. [Google Scholar]
- NF ISO 11465; Soil Quality—Determination of Dry Matter and Water Content on a Mass Basis—Gravimetric Method. ISO: Geneva, Switzerland, 1993.
- NF U44-160; Organic Soil Conditioners and Organic Material for Soil Improvement—Determination of Total Organic Matter— Calcination Method. AFNOR: Paris, France, 1985.
- NF EN ISO 9963-1; Water Quality—Determination of Alkalinity—Part 1: Determination of Total and Composite Alkalinity. ISO: Geneva, Switzerland, 1994.
- Shelor, C.P.; Dasgupta, P.K.; Liao, H. Conductometric Gradient Ion Exclusion Chromatography for Volatile Fatty Acids. Anal. Chem. 2016, 88, 12323–12329. [Google Scholar] [CrossRef] [PubMed]
- Fadil, M.; Fikri-Benbrahim, K.; Rachiq, S.; Ihssane, B.; Lebrazi, S.; Chraibi, M.; Haloui, T.; Farah, A. Combined Treatment of Thymus vulgaris L., Rosmarinus officinalis L. and Myrtus communis L. Essential Oils against Salmonella typhimurium: Optimization of Antibacterial Activity by Mixture Design Methodology. Eur. J. Pharm. Biopharm. 2018, 126, 211–220. [Google Scholar] [CrossRef]
- Handa, C.L.; De Lima, F.S.; Guelfi, M.F.G.; Georgetti, S.R.; Ida, E.I. Multi-Response Optimisation of the Extraction Solvent System for Phenolics and Antioxidant Activities from Fermented Soy Flour Using a Simplex-Centroid Design. Food Chem. 2016, 197, 175–184. [Google Scholar] [CrossRef]
- Orives, J.R.; Galvan, D.; Coppo, R.L.; Rodrigues, C.H.F.; Angilelli, K.G.; Borsato, D. Multiresponse Optimisation on Biodiesel Obtained through a Ternary Mixture of Vegetable Oil and Animal Fat: Simplex-Centroid Mixture Design Application. Energy Convers. Manag. 2014, 79, 398–404. [Google Scholar] [CrossRef]
- Goupy, J.; Creighton, L. Introduction to Design of Experiments with JMP Examples; SAS Publishing: Cary, NC, USA, 2007. [Google Scholar]
- Hafner, S.D.; Fruteau De Laclos, H.; Koch, K.; Holliger, C. Improving Inter-Laboratory Reproducibility in Measurement of Biochemical Methane Potential (BMP). Water 2020, 12, 1752. [Google Scholar] [CrossRef]
- Naji, A.; Rechdaoui, S.G.; Jabagi, E.; Lacroix, C.; Azimi, S.; Rocher, V. Pilot-Scale Anaerobic Co-Digestion of Wastewater Sludge with Lignocellulosic Waste: A Study of Performance and Limits. Energies 2023, 16, 6595. [Google Scholar] [CrossRef]
- Holliger, C.; Alves, M.; Andrade, D.; Angelidaki, I.; Astals, S.; Baier, U.; Bougrier, C.; Buffière, P.; Carballa, M.; De Wilde, V.; et al. Towards a Standardization of Biomethane Potential Tests. Water Sci. Technol. 2016, 74, 2515–2522. [Google Scholar] [CrossRef]
- Ammar, A.H.; Zagrouba, F.; Romdhane, M. Optimization of Operating Conditions of Tunisian Myrtle (Myrtus communis L.) Essential Oil Extraction by a Hydrodistillation Process Using a 24 Complete Factorial Design. Flavour Fragr. J. 2010, 25, 503–507. [Google Scholar] [CrossRef]
- Jiang, Y.; Heaven, S.; Banks, C.J. Strategies for Stable Anaerobic Digestion of Vegetable Waste. Renew. Energy 2012, 44, 206–214. [Google Scholar] [CrossRef]
- Silvestre, G.; Fernández, B.; Bonmatí, A. Addition of Crude Glycerine as Strategy to Balance the C/N Ratio on Sewage Sludge Thermophilic and Mesophilic Anaerobic Co-Digestion. Bioresour. Technol. 2015, 193, 377–385. [Google Scholar] [CrossRef] [PubMed]
- Xie, S.; Wickham, R.; Nghiem, L.D. Synergistic Effect from Anaerobic Co-Digestion of Sewage Sludge and Organic Wastes. Int. Biodeterior. Biodegrad. 2017, 116, 191–197. [Google Scholar] [CrossRef]
- Silvestre, G.; Illa, J.; Fernández, B.; Bonmatí, A. Thermophilic Anaerobic Co-Digestion of Sewage Sludge with Grease Waste: Effect of Long Chain Fatty Acids in the Methane Yield and Its Dewatering Properties. Appl. Energy 2014, 117, 87–94. [Google Scholar] [CrossRef]
- Mata-Alvarez, J.; Dosta, J.; Romero-Güiza, M.S.; Fonoll, X.; Peces, M.; Astals, S. A Critical Review on Anaerobic Co-Digestion Achievements between 2010 and 2013. Renew. Sustain. Energy Rev. 2014, 36, 412–427. [Google Scholar] [CrossRef]
- Macintosh, C.; Astals, S.; Sembera, C.; Ertl, A.; Drewes, J.E.; Jensen, P.D.; Koch, K. Successful Strategies for Increasing Energy Self-Sufficiency at Grüneck Wastewater Treatment Plant in Germany by Food Waste Co-Digestion and Improved Aeration. Appl. Energy 2019, 242, 797–808. [Google Scholar] [CrossRef]
- Capson-Tojo, G.; Rouez, M.; Crest, M.; Steyer, J.-P.; Delgenès, J.-P.; Escudié, R. Food Waste Valorization via Anaerobic Processes: A Review. Rev. Environ. Sci. Bio/Technol. 2016, 15, 499–547. [Google Scholar] [CrossRef]
- Nghiem, L.D.; Koch, K.; Bolzonella, D.; Drewes, J.E. Full Scale Co-Digestion of Wastewater Sludge and Food Waste: Bottlenecks and Possibilities. Renew. Sustain. Energy Rev. 2017, 72, 354–362. [Google Scholar] [CrossRef]
- Borowski, S.; Boniecki, P.; Kubacki, P.; Czyżowska, A. Food Waste Co-Digestion with Slaughterhouse Waste and Sewage Sludge: Digestate Conditioning and Supernatant Quality. Waste Manag. 2018, 74, 158–167. [Google Scholar] [CrossRef] [PubMed]
- Jain, S.; Jain, S.; Wolf, I.T.; Lee, J.; Tong, Y.W. A Comprehensive Review on Operating Parameters and Different Pretreatment Methodologies for Anaerobic Digestion of Municipal Solid Waste. Renew. Sustain. Energy Rev. 2015, 52, 142–154. [Google Scholar] [CrossRef]
- Abouelenien, F.; Namba, Y.; Kosseva, M.R.; Nishio, N.; Nakashimada, Y. Enhancement of Methane Production from Co-Digestion of Chicken Manure with Agricultural Wastes. Bioresour. Technol. 2014, 159, 80–87. [Google Scholar] [CrossRef]
- Castro-Molano, L.D.P.; Escalante-Hernández, H.; Lambis-Benítez, L.E.; Marín-Batista, J.D. Synergistic Effects in Anaerobic Codigestion of Chicken Manure with Industrial Wastes. DYNA 2018, 85, 135–141. [Google Scholar] [CrossRef]
- Ara, E.; Sartaj, M.; Kennedy, K. Enhanced Biogas Production by Anaerobic Co-Digestion from a Trinary Mix Substrate over a Binary Mix Substrate. Waste Manag. Res. 2015, 33, 578–587. [Google Scholar] [CrossRef] [PubMed]
- Calbry-Muzyka, A.; Madi, H.; Rüsch-Pfund, F.; Gandiglio, M.; Biollaz, S. Biogas Composition from Agricultural Sources and Organic Fraction of Municipal Solid Waste. Renew. Energy 2022, 181, 1000–1007. [Google Scholar] [CrossRef]
- Battista, F.; Ruggeri, B.; Fino, D.; Erriquens, F.; Rutigliano, L.; Mescia, D. Toward the Scale-up of Agro-Food Feed Mixture for Biogas Production. J. Environ. Chem. Eng. 2013, 1, 1223–1230. [Google Scholar] [CrossRef]
- Cuetos, M.J.; Gómez, X.; Otero, M.; Morán, A. Anaerobic Digestion and Co-Digestion of Slaughterhouse Waste (SHW): Influence of Heat and Pressure Pre-Treatment in Biogas Yield. Waste Manag. 2010, 30, 1780–1789. [Google Scholar] [CrossRef] [PubMed]
- Aworanti, O.A.; Agbede, O.O.; Agarry, S.E.; Ajani, A.O.; Ogunkunle, O.; Laseinde, O.T.; Rahman, S.M.A.; Fattah, I.M.R. Decoding Anaerobic Digestion: A Holistic Analysis of Biomass Waste Technology, Process Kinetics, and Operational Variables. Energies 2023, 16, 3378. [Google Scholar] [CrossRef]
- Zhang, L.; Loh, K.-C.; Zhang, J. Enhanced Biogas Production from Anaerobic Digestion of Solid Organic Wastes: Current Status and Prospects. Bioresour. Technol. Rep. 2019, 5, 280–296. [Google Scholar] [CrossRef]
- Weiland, P. Biogas Production: Current State and Perspectives. Appl. Microbiol. Biotechnol. 2010, 85, 849–860. [Google Scholar] [CrossRef] [PubMed]
- Naji, A.; Rechdaoui, S.G.; Jabagi, E.; Lacroix, C.; Azimi, S.; Rocher, V. Horse Manure and Lignocellulosic Biomass Characterization as Methane Production Substrates. Fermentation 2023, 9, 580. [Google Scholar] [CrossRef]
- Guendouz, J.; Buffière, P.; Cacho, J.; Carrère, M.; Delgenes, J.-P. Dry Anaerobic Digestion in Batch Mode: Design and Operation of a Laboratory-Scale, Completely Mixed Reactor. Waste Manag. 2010, 30, 1768–1771. [Google Scholar] [CrossRef]
- Karthikeyan, O.P.; Visvanathan, C. Bio-Energy Recovery from High-Solid Organic Substrates by Dry Anaerobic Bio-Conversion Processes: A Review. Rev. Environ. Sci. Bio/Technol. 2013, 12, 257–284. [Google Scholar] [CrossRef]


| TS (%RM *) | VS (%TS) | VFA (g·kg−1) | TA (g·kg−1) | BMP ** (NmL·gMV−1) | |
|---|---|---|---|---|---|
| Wheat Straw (99% of the Horse Waste) | 50 ± 18 | 80.7 | 0.122 ± 0.007 | - | 266 ± 4 |
| Horse Manure (1% of the Horse Waste) | 21.1 | 68.7 | 3.6 ± 0.2 | - | |
| OFMSW | 45.7 | 64 | 41.8 ± 0.4 | - | 250 ± 11 |
| Sewage Sludge | 3.4 ± 0.3 | 79.1 ± 8 | 1.5 | 1.6 ± 0.2 | 242 ± 12 |
| Composition of Substrates (Based on the Volatile Solids Content) | |||
|---|---|---|---|
| Experimental Point | Horse Waste (HW) | Sewage Sludge (SS) | Organic Fraction of Municipal Solid Waste (OFMSW) |
| 1 | 1.00 | 0.00 | 0.00 |
| 2 | 0.00 | 1.00 | 0.00 |
| 3 | 0.00 | 0.00 | 1.00 |
| 4 | 0.50 | 0.50 | 0.00 |
| 5 | 0.50 | 0.00 | 0.50 |
| 6 | 0.00 | 0.50 | 0.50 |
| 7 | 0.33 | 0.33 | 0.34 |
| 8 | 0.66 | 0.17 | 0.17 |
| 9 | 0.17 | 0.66 | 0.17 |
| 10 | 0.17 | 0.17 | 0.66 |
| Experiments | Horse Waste | Sewage Sludge | OFMSW | Repetitions | Methane Yield (NmL·gVS−1) |
|---|---|---|---|---|---|
| 1 | 1 | 0 | 0 | 3 | 266 ± 4 |
| 2 | 0 | 1 | 0 | 3 | 242 ± 12 |
| 3 | 0 | 0 | 1 | 3 | 250 ± 11 |
| 4 | 0.5 | 0.5 | 0 | 3 | 243 ± 6 |
| 5 | 0.5 | 0 | 0.5 | 3 | 255 ± 4 |
| 6 | 0 | 0.5 | 0.5 | 3 | 250 ± 13 |
| 7 | 0.33 | 0.33 | 0.33 | 5 | 266 ± 13 |
| 8 | 0.66 | 0.17 | 0.17 | 3 | 262 ± 22 |
| 9 | 0.17 | 0.66 | 0.17 | 3 | 269 ± 14 |
| 10 | 0.17 | 0.17 | 0.66 | 3 | 268 ± 12 |
| df | SS | MS | F | Significance F | |
|---|---|---|---|---|---|
| Regression | 7 | 1,545,588 | 220,798 | 2153 | <0.0001 |
| Residual | 17 | 1743 | 102 | ||
| Total | 24 | 1,547,331 | |||
| R2 | 99.89% | ||||
| Adjusted R2 | 93.97% | ||||
| Standard Error | 10.13 |
| Coefficients | Standard Error | t Stat | p-Value | |
|---|---|---|---|---|
| HW (x1) | 266 | 6 | 45 | <0.0001 |
| SS (x2) | 242 | 6 | 41 | <0.0001 |
| OFMSW (x3) | 249 | 6 | 43 | <0.0001 |
| x1x2 | −41 | 29 | −1 | 0.2 |
| x2x3 | 17 | 29 | 0.6 | 0.6 |
| x1x3 | −9 | 26 | −0.3 | 0.7 |
| x1x2x3 | 403 | 171 | 2 | 0.03 |
| Df | SS | MS | F | Significance F | |
|---|---|---|---|---|---|
| Regression | 6 | 1,545,576 | 257,596 | 2641 | <0.0001 |
| Residual | 18 | 1755 | 98 | ||
| Total | 24 | 1,547,331 | |||
| R2 | 99.89% | ||||
| Adjusted R2 | 94.29% | ||||
| Standard Error | 9.88 |
| Coefficients | Standard Error | t Stat | p-Value | |
|---|---|---|---|---|
| HW (x1) | 265 | 5 | 52 | <0.0001 |
| SS (x2) | 242 | 6 | 42 | <0.0001 |
| OFMSW (x3) | 248 | 5 | 49 | <0.0001 |
| x1x2 | −40 | 28 | −1 | 0.2 |
| x2x3 | 19 | 28 | 0.7 | 0.5 |
| x1x2x3 | 381 | 156 | 3 | 0.03 |
| Df | SS | MS | F | Significance F | |
|---|---|---|---|---|---|
| Regression | 5 | 1,545,532 | 309,106 | 3264 | <0.0001 |
| Residual | 19 | 1800 | 95 | ||
| Total | 24 | 1,547,331 | |||
| R2 | 99.88% | ||||
| Adjusted R2 | 94.59% | ||||
| Standard Error | 9.73 |
| Coefficients | Standard Error | t Stat | p-Value | |
|---|---|---|---|---|
| HM (x1) | 265 | 5 | 53 | <0.0001 |
| SS (x2) | 243 | 5 | 48 | <0.0001 |
| OFMSW (x3) | 250 | 5 | 54 | <0.0001 |
| x1x2 | −42 | 27 | −2 | 0.13 |
| x1x2x3 | 421 | 142 | 3 | 0.01 |
| Df | SS | MS | F | Significance F | |
|---|---|---|---|---|---|
| Regression | 4 | 1,545,298 | 386,324 | 3801 | <0.0001 |
| Residual | 20 | 2033 | 102 | ||
| Total | 24 | 1,547,331 | |||
| R2 | 99.87% | ||||
| Adjusted R2 | 94.85% | ||||
| Standard Error | 10.08 |
| Coefficients | Standard Error | t Stat | p-Value | |
|---|---|---|---|---|
| HW (x1) | 261 | 5 | 55 | < 0.0001 |
| SS (x2) | 240 | 5 | 49 | < 0.0001 |
| OFMSW (x3) | 251 | 5 | 52 | < 0.0001 |
| x1x2x3 | 341 | 137 | 2 | 0.02 |
| Experiments | Horse Waste | Sewage Sludge | OFMSW | Experimental Methane Yield (NmL·gVS−1) | Calculated Methane Yield (NmL·gVS−1) |
|---|---|---|---|---|---|
| 1 | 1 | 0 | 0 | 266 ± 4 | 261 ± 10 * |
| 2 | 0 | 1 | 0 | 242 ± 12 | 240 ± 10 |
| 3 | 0 | 0 | 1 | 250 ± 11 | 251 ± 10 |
| 4 | 0.5 | 0.5 | 0 | 243 ± 6 | 251 ± 10 |
| 5 | 0.5 | 0 | 0.5 | 255 ± 4 | 256 ± 10 |
| 6 | 0 | 0.5 | 0.5 | 250 ± 13 | 246 ± 10 |
| 7 | 0.33 | 0.33 | 0.33 | 266 ± 13 | 263 ± 10 |
| 8 | 0.66 | 0.17 | 0.17 | 262 ± 22 | 262 ± 10 |
| 9 | 0.17 | 0.66 | 0.17 | 269 ± 14 | 252 ± 10 |
| 10 | 0.17 | 0.17 | 0.66 | 268 ± 12 | 257 ± 10 |
Disclaimer/Publisher’s Note: The statements, opinions and data contained in all publications are solely those of the individual author(s) and contributor(s) and not of MDPI and/or the editor(s). MDPI and/or the editor(s) disclaim responsibility for any injury to people or property resulting from any ideas, methods, instructions or products referred to in the content. |
© 2024 by the authors. Licensee MDPI, Basel, Switzerland. This article is an open access article distributed under the terms and conditions of the Creative Commons Attribution (CC BY) license (https://creativecommons.org/licenses/by/4.0/).
Share and Cite
Naji, A.; Dujany, A.; Guerin Rechdaoui, S.; Rocher, V.; Pauss, A.; Ribeiro, T. Optimization of Liquid-State Anaerobic Digestion by Defining the Optimal Composition of a Complex Mixture of Substrates Using a Simplex Centroid Design. Water 2024, 16, 1953. https://doi.org/10.3390/w16141953
Naji A, Dujany A, Guerin Rechdaoui S, Rocher V, Pauss A, Ribeiro T. Optimization of Liquid-State Anaerobic Digestion by Defining the Optimal Composition of a Complex Mixture of Substrates Using a Simplex Centroid Design. Water. 2024; 16(14):1953. https://doi.org/10.3390/w16141953
Chicago/Turabian StyleNaji, Amar, Arnaud Dujany, Sabrina Guerin Rechdaoui, Vincent Rocher, André Pauss, and Thierry Ribeiro. 2024. "Optimization of Liquid-State Anaerobic Digestion by Defining the Optimal Composition of a Complex Mixture of Substrates Using a Simplex Centroid Design" Water 16, no. 14: 1953. https://doi.org/10.3390/w16141953
APA StyleNaji, A., Dujany, A., Guerin Rechdaoui, S., Rocher, V., Pauss, A., & Ribeiro, T. (2024). Optimization of Liquid-State Anaerobic Digestion by Defining the Optimal Composition of a Complex Mixture of Substrates Using a Simplex Centroid Design. Water, 16(14), 1953. https://doi.org/10.3390/w16141953