Article

Numerical Analysis of Seepage Field Response Characteristics of Weathered Granite Landslides under Fluctuating Rainfall Conditions

1
Key Laboratory of Geological Safety of Coastal Urban Underground Space, Ministry of Natural Resources, Qingdao Geo-Engineering Surveying Institute, Qingdao 266101, China
2
Key Laboratory of Coupling Process and Effect of Natural Resources Elements, Beijing 100055, China
3
Key Laboratory of Geological Disaster Risk Prevention and Control of Shandong Provincial Emergency Management Department (Under Preparation), Jinan 250014, China
4
Department of Environmental Science and Engineering, Ocean University of China, Qingdao 266100, China
5
Qingdao Geotechnical Investigation and Surveying Research Institue, Qingdao 266035, China
*
Authors to whom correspondence should be addressed.
Water 2024, 16(14), 1996; https://doi.org/10.3390/w16141996
Submission received: 20 May 2024 / Revised: 24 June 2024 / Accepted: 12 July 2024 / Published: 14 July 2024

Abstract

:
The threat and destructiveness of landslide disasters caused by extreme rainfall are increasing. Rainfall intensity is a key factor in the mechanism of rainfall-induced landslides. However, under natural conditions, rainfall intensity is highly variable. This study focuses on the Fanling landslide and investigates the effects of varying rainfall intensity amplitudes, rainfall durations, and total rainfall amounts on landslide behavior. Three experimental groups were established, and ten rainfall conditions were simulated numerically to analyze the seepage field response of the landslide under fluctuating rainfall conditions. The results indicate that (1) there are positive correlations between the final pore pressure and both the amplitude and duration of rainfall intensity; (2) the pore water pressure response in the upper slope changes significantly, initiating deformation; and (3) the total rainfall amount is the most direct factor affecting the pore pressure response and landslide deformation. Compared to long-term stable rainfall, short-term fluctuating rainstorms are more likely to trigger landslides. These findings enhance our understanding of landslide mechanisms under fluctuating rainfall, providing valuable insights for disaster prevention and mitigation.

1. Introduction

With the frequent human activities and the increasing scale of construction projects, urbanization has accelerated globally, especially in China [1]. This rapid urbanization has led to an increase in extreme weather events and has posed greater challenges and costs in managing these events due to the higher population density in cities [2,3,4]. Among these extreme weather events, irregular heavy rainfall has become increasingly threatening and destructive [5,6]. In 2023, China experienced a total of 37 heavy rainfall processes, with a cumulative surface rainfall of 240 mm. According to the statistical yearbook of the Ministry of Emergency Management [7], there were 3666 geological disasters in China in 2023, with landslides being the most prevalent (Figure 1). For instance, in July 2023, a rainstorm in Chongqing led to a series of geological disasters resulting in 25 deaths and disappearances. In August, a sudden landslide in Liangshan Prefecture, Sichuan Province, caused by short-term heavy rainfall resulted in 52 casualties.
Many engineering studies have shown that slope soil under rainfall infiltration is prone to instability and failure due to water seepage [8]. Rainwater infiltration during rainfall increases the saturation of slope soil and pore water pressure, reducing the shear resistance of the soil due to increased pore pressure and decreased matric suction in unsaturated soil areas. Key indicators for measuring rainfall include rainfall intensity [9], rainfall duration [10], and rainfall type [11]. Researchers have studied how these rainfall factors affect landslide occurrences. Concepts such as the cumulative rainfall duration [12] and intensity [13], critical cumulative rainfall [14], continuous probability rainfall threshold [15], and rainfall attenuation coefficient [16] have been proposed to explore the relationship between rainfall and landslides and to develop warning curves. Liu et al. [17] proposed a regional LEW slope units model combining rainfall threshold modeling and a susceptibility evaluation to predict the probability of landslides caused by rainfall in Chongqing. Soumik and Biswajit [18] determined the relationship between rainfall and landslide occurrence based on previous methods and the intensity duration (I-D). They determined the optimal fitting distribution of rainfall data in the Gawar Himalayas. Sun et al. [19] proposed a probability threshold statistical method based on support vector machines using machine learning, which can consider whether to trigger complex boundaries of mountain landslides. Rashad et al. [20] proposed a suitable hydraulic model for uncertainty propagation analysis to address the nonlinear and high-dimensional rainfall-induced landslide RILS problem. Hugh et al. [21] studied the impact of spatial rainfall patterns on shallow landslides. Ma et al. [22] set different rainfall patterns and improved the accuracy of predicting the landslide failure probability from the perspective of the spatial variability of soil.
Although rainfall intensity is a crucial factor in landslide research, it is highly volatile under natural conditions. There is no systematic consensus on how changes in rainfall intensity, amplitude, and rate affect the evolution and stability of landslides. Previous studies by the author’s team on fully weathered granite landslides have examined the impact of rainfall intensity on slope stability and proposed a landslide warning curve [23]. This article extends that research by focusing on the impact of rainfall intensity fluctuations on the seepage field, an area not comprehensively covered in prior research. The findings will deepen our understanding of the mechanisms behind landslides induced by fluctuating rainfall and guide disaster prevention and mitigation efforts.

2. Summary of the Research Area

2.1. Landslide Characteristics

The Fanling landslide is in Laoshan District, Qingdao, Shandong Province, China (Figure 2). As of 2023, the permanent population is 513,700 and the gross domestic product is 115.089 billion yuan. The Fanling landslide is an ancient landslide, formed from loose accumulated layers during the Quaternary and modern periods. The front edge of the landslide is about 3–4 m away from the sea surface of the Yellow Sea. The sliding surface is located in fully weathered granite and is in a pushover-type broken line sliding failure mode. There have been two recorded landslide events in this area, occurring on 11 August 2007, and 23 July 2020, both of which were triggered by extreme rainfall.

2.2. Analysis of Fluctuating Rainfall Characteristics

The research area has a temperate continental monsoon climate with marine influences. The interaction between subtropical airflow moving westward and northward and cold air moving eastward and southward frequently results in rainfall. When these airflows intersect strongly, they often induce extreme rainfall. According to years of monitoring data, heavy rainfall in the study area mainly occurs from early July to late August (Figure 3). The area experiences three primary heavy precipitation patterns, shear lines, cold eddies, and typhoon precipitation, which are relatively evenly distributed [24].
On 11 August 2007, Laoshan District experienced a heavy rainstorm once in 50 years, leading to the Fanling landslide (Figure 4a,c), and according to rainfall data, 6 consecutive days of rainfall in the week led up to the landslide disaster in 2007. Starting from August 8th, the precipitation gradually increased daily until the landslide occurred on the evening of the 11th. The average rainfall intensity from 6th to 11th was 0.69 mm/h, 2.25 mm/h, 0.39 mm/h, 0.81 mm/h, 2.14 mm/h, and 2.53 mm/h, respectively. The accumulated precipitation during these 6 days reached 209 mm. Heavy rainfall began at noon on 10 August 2007, when the landslide occurred. The rainfall intensity was not constant but had strong fluctuations, and the hourly rainfall intensity also varied. There were four high peaks in rainfall intensity, with peak rainfall intensities of 4.15 mm/h, 4.48 mm/h, 4.75 mm/h, and 4.53 mm/h, respectively, indicating a multi-peak fluctuating heavy rainfall. The maximum amplitude ratio of rainfall intensity per hour was 983%, and the cumulative precipitation induced by disasters reached 107.5 mm, a typical extreme rainfall-induced landslide (Figure 4b).
On 23 July 2020, also affected by heavy rainfall, the Fanling landslide experienced another slide (Figure 4d,f). Before the landslide disaster on 22 July, the daily rain reached 175.96 mm, with a cumulative precipitation of nearly 350 mm and an average rainfall intensity of 7.33 mm/h. At 0:00 on the 23rd, the peak rainfall intensity of the landslide reached 25.21 mm/h, which was an unimodal heavy rainfall with one rainfall peak. The maximum amplitude of rainfall intensity per hour was 186%, and the cumulative precipitation induced by the disaster reached 170.3 mm, ultimately leading to the landslide (Figure 4e).

3. Numerical Modeling

3.1. Theoretical Model

3.1.1. Soil Constitutive Model

The traditional Mohr–Coulomb criterion often exhibits sharp corners on its yield surface, leading to challenges such as slow convergence in numerical calculations. To address this, the classical Mohr–Coulomb model is extended in this study using a continuous smooth flow potential function to describe the failure and deformation of slope soil (Figure 5) [25].
The equation for the hyperbolic flow potential function is as follows:
G = ε c 0 t a n φ 2 + ( R m c q ) 2 p t a n φ
In the formula, φ indicates the shear dilation angle on the meridian plane under high confining pressure; c 0 represents the initial cohesive force; ε represents the shape parameter on the meridian plane, used to define the flow potential function, with a default value of 0.1; e represents the rate of deviation on the π plane; q represents generalized shear stress; and p represents the ball stress.
The calculation process of Rmc is as follows:
R m c ( θ , e ) = 4 ( 1 e 2 ) cos 2 θ + ( 2 e 1 ) 2 2 ( 1 e 2 ) c o s θ + ( 2 e 1 ) 4 1 e 2 c o s 2 θ + 5 e 2 4 e × R m c π 3 , φ
R m c π 3 , φ = 3 s i n φ 6 c o s φ
In the formula, e = (3 − sinφ)/6cosφ, and the required range of e is (0.5, 1.0).

3.1.2. Rainfall Seepage Theory of Unsaturated Soil
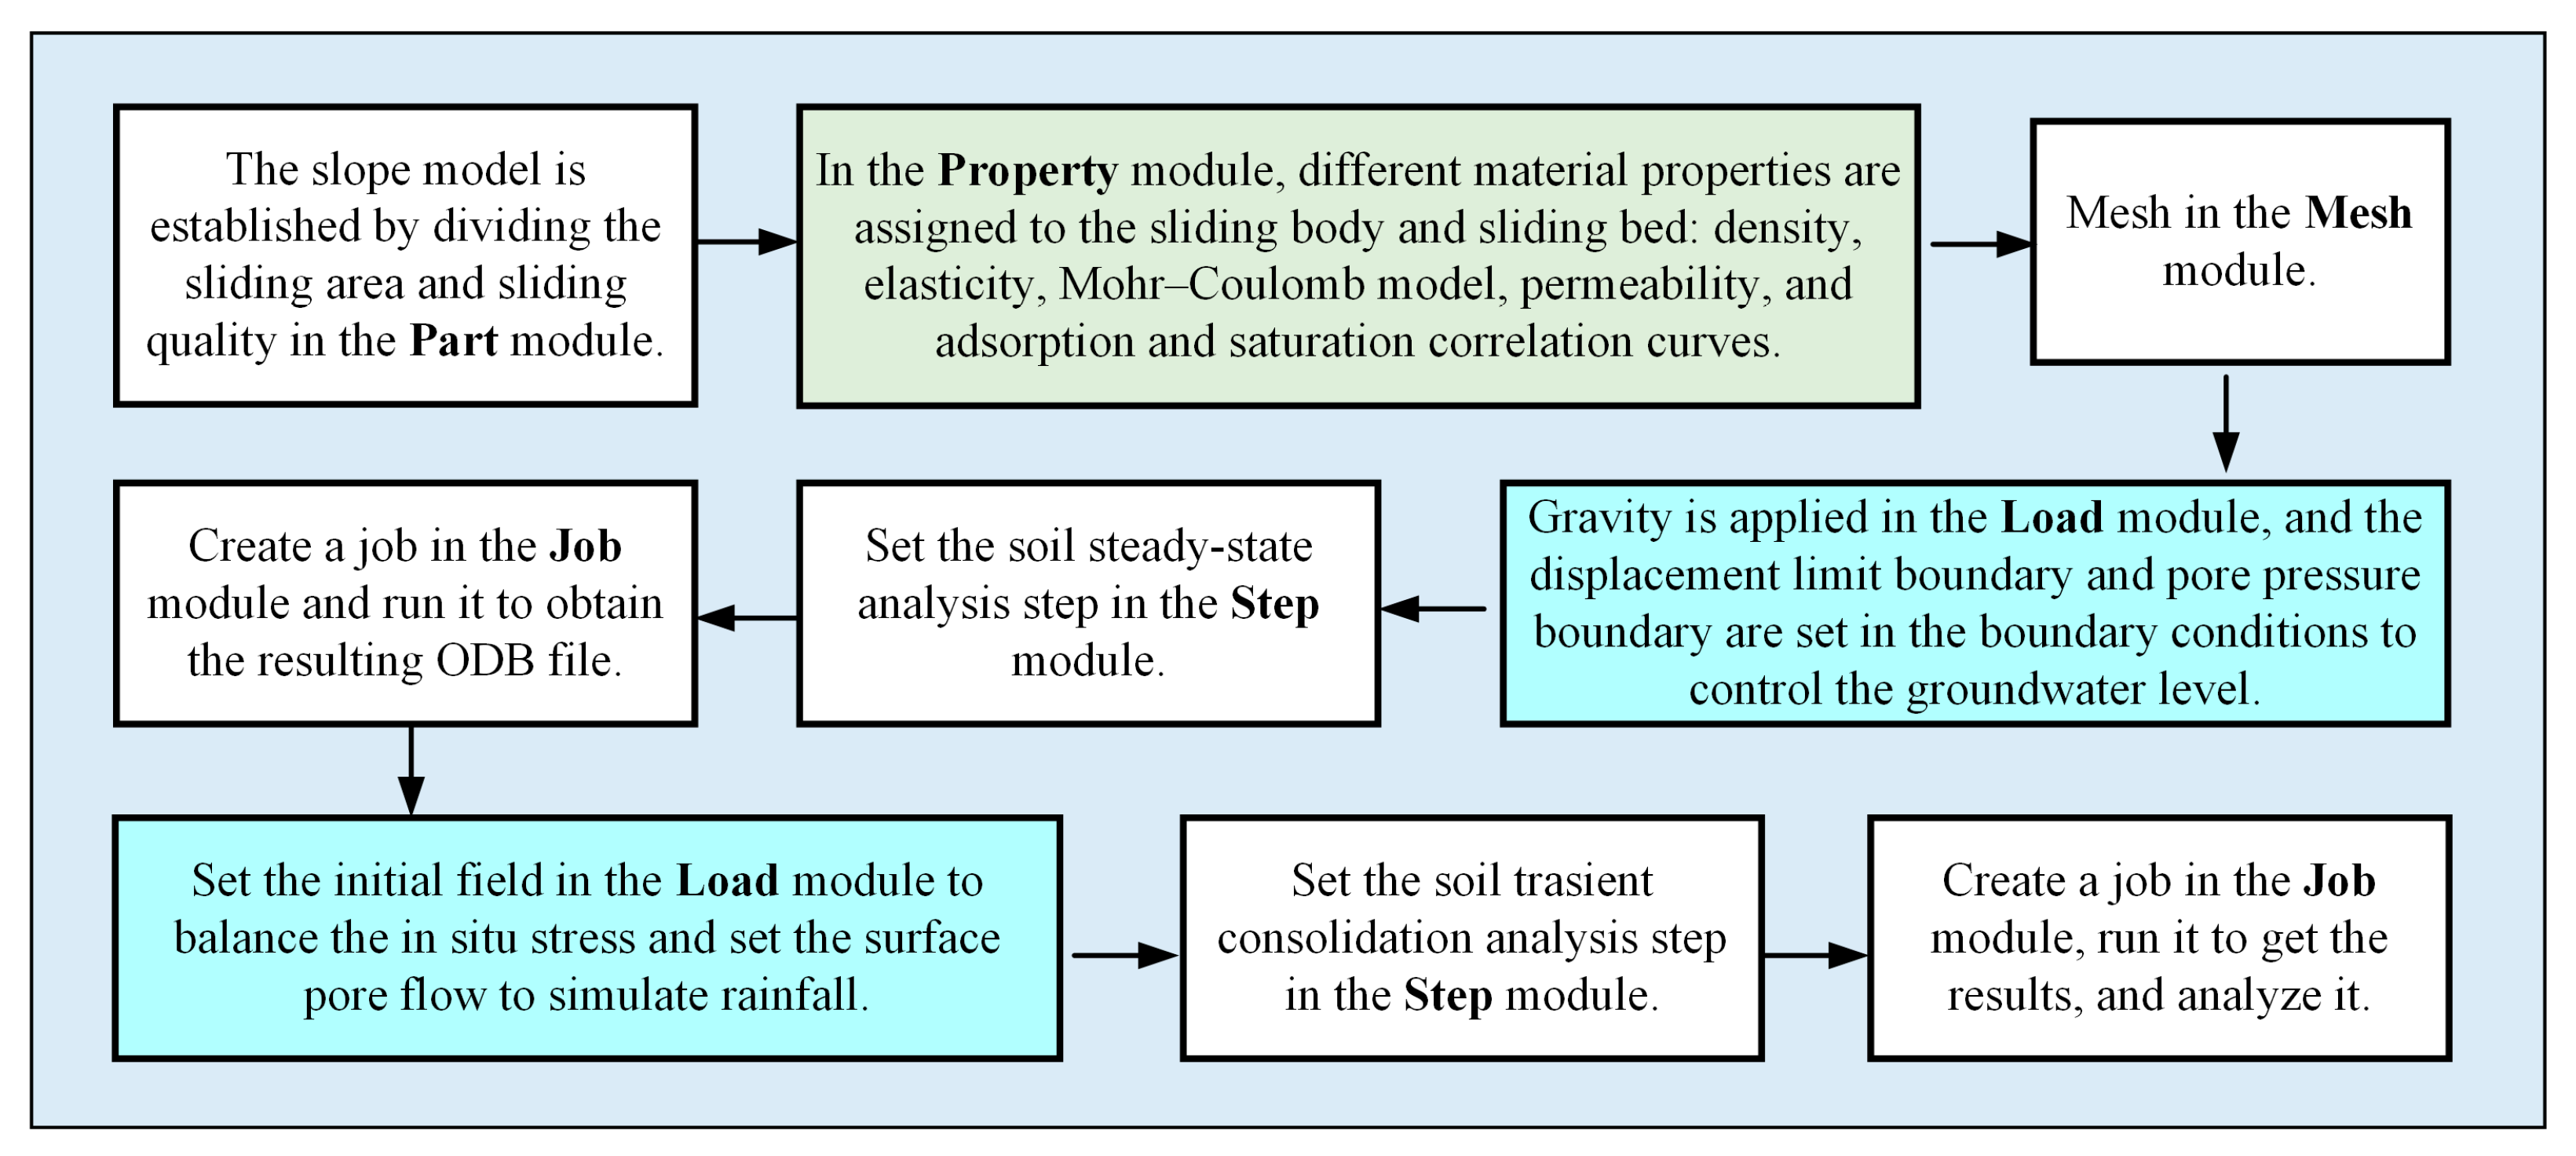
During rainfall-induced landslides, the sliding interface typically transitions from saturated to unsaturated conditions as groundwater flow accompanies the saturation process. Water flows through soil pores under the influence of gravity and hydraulic head. The sliding body in the study area consists of weathered rock with high permeability; thus, the study focuses on unsaturated soil rainfall seepage.
The fluid–structure coupling equation needs to follow the following basic assumptions: ① Only the influences of soil and water are considered, neglecting gas impacts. ② Soil particles and water are treated as incompressible and do not undergo compression deformation. ③ Temperature changes are disregarded during the analysis. ④ Solids undergo linear, nonlinear, elastic, and small plastic deformations. The governing equation for its seepage field is as follows:
δ u w 1 J d d t ( J ρ w n w ) d V + δ u w x [ ρ w n w n ν w ] d V = 0 I N P N = 0
In the formula, V represents the volume of the model; J is the hydraulic gradient; u w is the pore water pressure; ν w is the fluid velocity; n is the porosity of the soil; n w is the soil water storage rate; ρ w is the fluid density; and IN and PN are, respectively, represented as internal and external force matrices, which form a simplified discrete stress equilibrium equation.

3.2. Model Settings

Based on field data and previous research by Yu [23], the landslide model is simplified into two parts: a sliding body and sliding bed. The numerical model includes 12,494 grid units and 5 monitoring points, as depicted in Figure 6, with the modeling process outlined in Figure 7.
Based on local rainfall data, three experimental groups were set up, E1 (rainfall duration unchanged, changing rainfall intensity amplitude), E2 (rainfall intensity amplitude unchanged, changing rainfall duration), and E3 (total rainfall unchanged, changing rainfall intensity amplitude), to simulate 10 different rainfall fluctuation conditions, as detailed in Table 1. The parameter settings refer to the data of landslides in 2007 and 2020, with the rainfall time controlled within 24 h and rainfall intensity controlled between 10 mm/h and 60 mm/h. It should be noted that N2, N6, and N12 are operating conditions under the same conditions. To facilitate comparison between the experimental groups, they are represented separately. To balance the model and make it more realistic, a lead time of 1 h was set to achieve the expected initial rainfall intensity.

4. Results

4.1. Analysis of the Seepage Field

Numerical simulations were conducted to analyze changes in saturation (SAT) and pore water pressure (POR). Figure 8 depicts the initial state without rainfall, showing the aeration zone (black area) and the infiltration surface at the bottom boundary where the pore water pressure equals zero.

4.1.1. Different Rainfall Intensity Amplitudes

Figure 9 and Figure 10 present the results of numerical simulations varying the rainfall intensity amplitude while keeping the rainfall duration constant. Increasing the amplitude of rainfall intensity causes significant shifts in the slope’s saturated area and alters the position of the infiltration surface. The pore water pressure gradually decreases towards the surface and peaks at the bottom foundation section as rainfall infiltrates the soil. In the N1 scenario with a 200% amplitude, groundwater infiltration nears the surface in the upper section, leaving substantial unsaturated areas in the middle and lower parts. In N2 (300% amplitude), the infiltration surface rises higher, reducing the unsaturated zone. This trend continues in N3 (400% amplitude) and N4 (500% amplitude), where the infiltration surface elevation increases and the unsaturated area diminishes further. Upon conversion, increasing the amplitude from 200% to 500% raises the extreme pore water pressure to 18.72 kPa, 22.07 kPa, 25.51 kPa, and 29.48 kPa, respectively.
As the amplitude of rainfall intensity increases, total rainfall and soil infiltration rise continuously, leading to higher pore water pressures and increased soil saturation across various locations, even at the same amplitude. The changes in the values at points 4 and 5 have significant responses, while monitoring point 3 has a significant response when the rainfall intensity amplitude is strong. The rate of increase in pore water pressure at the exact point location varies significantly under varying rainfall conditions and is positively correlated with changes in the rainfall intensity amplitude. After 18 h of rainfall under N1 working conditions, the values at points 4 and 5 began to show a slight increase. It means that the infiltration surface has already risen above this point. Under N2 conditions, a similar phenomenon occurs around 16 h of rainfall. Under N3 working conditions, this phenomenon occurs at points 3, 4, and 5 after about 14 h of rainfall. This phenomenon happens at points 3, 4, and 5 at around 12 h of rainfall under the N4 working condition, indicating that as the amplitude increases, the rate of infiltration surface elevation also increases. Its saturation time is linearly related to the degree of the rainfall intensity amplitude. These findings underscore the critical influence of rainfall intensity variations on pore water pressure dynamics and slope stability, emphasizing the need for precise meteorological data in landslide risk assessment and early warning systems.

4.1.2. Different Rainfall Durations

Numerical simulations were conducted with a fixed rainfall intensity amplitude and varying rainfall durations, as depicted in Figure 11 and Figure 12. Under a consistent amplitude of rainfall intensity, an increasing rainfall duration leads to notable shifts in the slope’s saturated area and the position of the infiltration surface. In the N5 scenario with a duration of 32 h, the groundwater infiltration surface reaches near the slope’s surface, resulting in a minimal unsaturated area in the middle and bottom sections. Conversely, N6 (24 h duration) shows a lower infiltration surface compared to N5, accompanied by an increase in unsaturated areas. In N7 (16 h duration), the infiltration surface further recedes compared to N5 and N6, reducing the unsaturated area. By N8 (8 h duration), the infiltration surface significantly diminishes compared to previous conditions, expanding the unsaturated zone towards the upper slope and forming a complete aeration zone. Upon conversion, reducing the duration from 32 h to 8 h decreases the extreme pore water pressure to 24.82 kPa, 22.07 kPa, 19.77 kPa, and 16.72 kPa, respectively.
As the rainfall duration increases, the infiltration line within the slope rises, indicating increasing soil saturation over time. Pore water pressure values vary across different points, showing rapid increases in the upper part where the weathered layer is thin, causing the infiltration surface to rise swiftly. Significant variations in the pore water pressure amplitude and velocity at specific points correlate positively with the rainfall duration. Under N5 conditions, significant increases at points 4 and 5 occur after 16 h of rainfall, while N6 shows this phenomenon around 14 h. In N7, point 5 experiences significant changes after approximately 13 h of rainfall, while N8 shows no significant changes. Points 1, 2, and 3 exhibit a steady increase in pore pressure, indicating that the infiltration surface surpasses these points. These observations suggest that shorter rainfall durations accelerate changes in the rainfall intensity amplitude, resulting in earlier significant pore pressure changes at the monitoring points. However, the final pore pressure response correlates positively with the rainfall duration, despite the unchanged rainfall intensity amplitude.

4.1.3. Different Rainfall Intensity Amplitudes (Constant Rainfall)

Numerical simulations were conducted under conditions of fixed total rainfall to analyze the effects of varying rainfall intensity amplitudes, as illustrated in Figure 13 and Figure 14. With total rainfall held constant, changes in the rainfall intensity amplitude did not significantly alter the position of the groundwater infiltration surface or the saturation area. However, higher amplitudes did result in slight increases in soil pore pressure. In the N9 scenario, where the rainfall intensity amplitude was 0%, the infiltration surface approached the surface near the thinner upper sliding mass, with noticeable unsaturated areas in the middle and bottom sections. Similarly, in N10 (50% amplitude), there was minimal change in the infiltration surface position compared to N9, but the maximum pore pressure increased. Under N11 (133% amplitude), the infiltration surface rose compared to N9 and N10, further reducing the unsaturated area. N12 (300% amplitude) showed the highest infiltration surface elevation with the smallest unsaturated area. Upon conversion, increasing the amplitude from 0% to 300% raised the extreme pore water pressure increases to 18.93 kPa, 20.14 kPa, 21.04 kPa, and 22.07 kPa, respectively.
The pore water pressure amplitude and velocity varied slightly across different rainfall conditions at specific monitoring points, correlating positively with changes in the rainfall intensity amplitude. Under N9 conditions, significant pore pressure increases occurred at points 5 and 4 after 12 h of rainfall. Similar trends were observed in N10 after approximately 13 h, N11 around 14 h, and N12 at about 15 h, indicating that a higher rainfall intensity amplitude delayed the pore pressure response but ultimately increased the final pore pressure amount. These findings underscore how variations in the rainfall intensity amplitude, under constant total rainfall, affect pore water pressure dynamics and highlight implications for slope stability assessments under varying meteorological conditions.

4.2. Comprehensive Analysis and Comparison of Working Conditions

To elucidate the relationship between the seepage field response and landslide development, final pore water pressure values (Figure 15) and displacement response values (Figure 16) were extracted for a comprehensive analysis across each monitoring point.
In the experimental groups of E1 and E2, where the total rainfall amount varied, the pore water pressure response rate remained consistent with increasing rainfall intensity amplitude and duration. The final pore water pressure positively correlated with both factors. However, point 5 in the upper part showed a reversed pore pressure trend, potentially due to surface runoff formation from the excessive rainfall intensity and accumulated precipitation. This excessive rainfall also induced substantial displacement at the slope’s top, leading to slope instability and increased displacement rates. Larger amplitudes and durations of rainfall intensified these effects. In the E3 experimental group with constant total rainfall, increasing the rainfall intensity amplitude slightly reduced the rate of pore pressure change while slightly increasing the final amount. Similarly, the rate of displacement change decreased with increasing amplitude, but the final displacement quantities rose.
For weathered granite landslides triggered by natural rainfall, rainwater infiltrates the rock–soil body, saturating it and accelerating shear creep. As the plastic zone develops, a failure surface forms, transitioning the slope from creep to slide stages. The initial pore water pressure increases in the upper part due to infiltration, leaving significant unsaturated areas in the middle and bottom sections. Thinner completely weathered rock layers in the upper part expedite the groundwater level rise, explaining why upper sections deform first.
The total rainfall amount is the primary factor influencing the pore pressure response and landslide deformation. In E1 and E2, the increased rainfall amplitude and duration amplified the total rainfall, thereby escalating the pore pressure response and deformation. Rainfall intensity also significantly impacted the pore pressure and slope deformation, intensifying infiltration and slope scour. These changes reduced the rock–soil body shear strength, rendering the slope more susceptible to unstable deformation. Short-term fluctuating rainstorms posed higher landslide risks compared to long-term stable rainfall.

4.3. Model Reliability Verification

Physical model testing serves as a critical validation method for numerical simulations, particularly with large-scale models that closely mirror natural landslide conditions. In this study, the reliability of the numerical model was verified using pore water pressure and deformation data from the Fanling landslide physical model established by Liu [26] (Figure 17). To ensure consistency with physical model conditions, parameters for the N9 condition in the E3 experimental group were adjusted accordingly (see Table 2 for comparison).
Pore water pressure and displacement data from the physical model and numerical simulation were extracted and compared (Figure 18). Although differences were observed, the overall response trends were consistent between the physical and numerical models, confirming the numerical model’s accuracy and reliability.

5. Conclusions

This article presents a numerical model of a weathered granite landslide under fluctuating rainfall conditions, conducting 10 sets of simulations across varying rainfall intensities and durations to investigate the response characteristics of landslide seepage fields. The findings are summarized below.
(1) Pore Water Pressure Distribution: During rainfall, the pore water pressure decreases gradually towards the slope’s surface, peaking at the bottom foundation section. Variations in rainfall intensity and duration notably influence the infiltration surface position, with the upper part responding first.
(2) Impact of Rainfall Characteristics: Increased rainfall intensity and duration amplify final pore pressures. Higher intensity accelerates pore pressure changes and groundwater infiltration rates, shortening the time to reach peak values. Variations in rainfall intensity, under constant total rainfall, do not significantly alter the position of the groundwater infiltration surface or saturation area of the slope. However, a higher intensity delays the pore pressure response while increasing the final amount.
(3) Rainfall Effects on Landslide Dynamics: The total rainfall amount directly affects pore pressure responses and landslide deformation. Rainfall intensity also significantly influences pore pressure and slope deformation. Short-term, intense rainstorms pose a higher landslide risk compared to long-term stable rainfall. A comprehensive analysis of meteorological data is crucial for landslide early warning systems, enabling proactive emergency measures ahead of extreme rainstorms, rather than relying solely on monitoring anomalies.

Author Contributions

Conceptualization, P.L. and Q.W.; formal analysis, W.S. and Z.C.; data curation, X.C. and R.W.; writing—original draft preparation, P.Y. and P.L.; writing—review and editing, P.Y. and Q.W.; visualization, W.W.; project administration, P.L. and Q.W.; funding acquisition, P.Y. and R.W. All the authors have approved the final manuscript. All authors have read and agreed to the published version of the manuscript.

Funding

This research was funded by the Open Foundation of the Key Laboratory of Coupling Process and Effect of Natural Resources Elements (Grant No. 2024KFKT017) and the Open Foundation of Key Laboratory of Geological Disaster Risk Prevention and Control of Shandong Provincial Emergency Management Department (under preparation) (Grant No. 202403).

Data Availability Statement

The data presented in this study are available on request from the corresponding author.

Conflicts of Interest

The authors declare no conflicts of interest.

References

  1. Balsa-Barreiro, J.; Li, Y.; Morales, A.; Pentland, A.S. Globalization and the shifting centers of gravity of world’s human dynamics: Implications for sustainability. J. Clean. Prod. 2019, 239, 117923.1–117923.17. [Google Scholar] [CrossRef]
  2. Cai, W.; Lan, F.; Huang, X.; Hao, J.; Xia, W.; Tang, R.; Feng, P.; Li, H. Generative probabilistic prediction of precipitation induced landslide deformation with variational autoencoder and gated recurrent unit. Front. Earth Sci. 2024, 12, 1394129. [Google Scholar] [CrossRef]
  3. Feng, Y.; Yang, W.; Wan, J.; Li, H. Granular risk assessment of earthquake induced landslide via latent representations of stacked autoencoder. Front. Environ. Sci. 2023, 11, 1308808. [Google Scholar] [CrossRef]
  4. Xiang, G.; Jiang, T.; Yang, Q.; Cui, S.; Zhu, L.; He, Y.; Li, H. The Influence of Vertical Seismic Acceleration on the Triggering of Landslides Constrained by Bedding Faults under an Inertial Frame Reference: The Case of the Daguangbao (DGB) Landslide. Appl. Sci. 2023, 13, 12911. [Google Scholar] [CrossRef]
  5. Marín-Rodríguez, N.J.; Vega, J.; Zanabria, O.B.; González-Ruiz, J.D.; Botero, S. Towards an understanding of landslide risk assessment and its economic losses: A scientometric analysis. Landslides 2024. [Google Scholar] [CrossRef]
  6. Niyokwiringirwa, P.; Lombardo, L.; Dewitte, O.; Deijns, A.A.J.; Wang, N.; Van Westen, C.J.; Tanyas, H. Event-based rainfall-induced landslide inventories and rainfall thresholds for Malawi. Landslides 2024, 21, 1403–1424. [Google Scholar] [CrossRef]
  7. Ministry of Emergency Management of the People’s Republic of China. Available online: https://www.gov.cn/lianbo/bumen/202401/content_6927328.htm (accessed on 21 January 2024).
  8. Fedato, E.; Fubelli, G.; Kurilla, L.; Tiranti, D. Predisposing Factors for Shallow Landslides in Alpine and Hilly/Apennines Environments: A Case Study from Piemonte, Italy. Geosciences 2023, 13, 252. [Google Scholar] [CrossRef]
  9. Borga, M.; Dalla Fontana, G.; Cazorzi, F. Analysis of topographic and climatic control on rainfall-triggered shallow landsliding using a quasi-dynamic wetness index. J. Hydrol. 2002, 268, 56–71. [Google Scholar] [CrossRef]
  10. Urmi, Z.A.; Saeidi, A.; Chavali, R.V.P.; Yerro, A. Failure mechanism, existing constitutive models and numerical modeling of landslides in sensitive clay: A review. Geoenvironmental Disasters 2023, 10, 14. [Google Scholar] [CrossRef]
  11. Dikshit, A.; Satyam, D.N. Estimation of rainfall thresholds for landslide occurrences in Kalimpong, India. Innov. Infrastruct. Solut. 2018, 3, 1–10. [Google Scholar] [CrossRef]
  12. Jéssica, C.M.; Guilherme JC, G.; Raquel, Q.V.; Eurípedes AV, J.; Rafael, S.N.; Nelson, F.F. Exploring extreme rainfall-triggered landslides using 3D unsaturated flow, antecedent moisture and spatially distributed soil depth. CATENA 2023, 229, 107241. [Google Scholar] [CrossRef]
  13. Kim, S.W.; Chun, K.W.; Kim, M.; Catani, F.; Choi, B.; Seo, J.I. Effect of antecedent rainfall conditions and their variations on shallow landslide-triggering rainfall thresholds in South Korea. Landslides 2020, 182, 569–582. [Google Scholar] [CrossRef]
  14. Lee, J.J.; Song, M.S.; Yun, H.S.; Yum, S.G. Dynamic landslide susceptibility analysis that combines rainfall period, accumulated rainfall, and geospatial information. Sci. Rep. 2022, 12, 18429. [Google Scholar] [CrossRef]
  15. La Porta, G.; Leonardi, A.; Pirulli, M.; Cafaro, F.; Castelli, F. Time-resolved triggering and runout analysis of rainfall-induced shallow landslides. Acta Geotech. 2024, 19, 1873–1889. [Google Scholar] [CrossRef]
  16. Islam, M.A.; Chattoraj, S.L. Modelling landslides in the Lesser Himalaya region using geospatial and numerical simulation techniques. Arab. J. Geosci. 2023, 16, 480. [Google Scholar] [CrossRef]
  17. Liu, S.H.; Du, J.; Yin, K.L.; Zhou, C.; Huang, C.C.; Jiang, J.; Yu, J. Regional early warning model for rainfall induced landslide based on slope unit in Chongqing, China. Eng. Geol. 2024, 333, 107464. [Google Scholar] [CrossRef]
  18. Soumik, S.; Biswajit, B. Rainfall threshold for prediction of shallow landslides in the Garhwal Himalaya, India. Geosystems Geoenvironment 2024, 11, 100285. [Google Scholar] [CrossRef]
  19. Sun, Y.; Zhang, J.; Wang, H.; Lu, D.G. Probabilistic thresholds for regional rainfall induced landslides. Comput. Geotech. 2024, 166, 106040. [Google Scholar] [CrossRef]
  20. Rashad, A.; Marwan, F.; Anis, Y.; Hossein, N.; Knut, J.M.; Renaud, T. Modeling rainfall-induced landslide using the concept of local factor of safety: Uncertainty propagation and sensitivity analysis. Comput. Geotech. 2024, 167, 106102. [Google Scholar] [CrossRef]
  21. Hugh, G.S.; Andrew, J.N.; Harley, B.; Raphael, S. The influence of spatial patterns in rainfall on shallow landslides. Geomorphology 2023, 437, 108795. [Google Scholar] [CrossRef]
  22. Ma, J.H.; Yao, Y.Q.; Wei, Z.R.; Meng, X.M.; Zhang, Z.L.; Yin, H.L.; Zeng, R.Q. Stability analysis of a loess landslide considering rainfall patterns and spatial variability of soil. Comput. Geotech. 2024, 167, 106059. [Google Scholar] [CrossRef]
  23. Yu, P.; Liu, H.H.; Yu, H.B.; Xie, Y.J.; Yu, Y.; Zhu, C.H.; Dong, J.; Guan, Y. Study on Fluid–Solid Coupling Numerical Simulation and Early Warning of Weathered Granite Landslides Induced by Extreme Rainfall. Sustainability 2023, 15, 11738. [Google Scholar] [CrossRef]
  24. Yu, P.; Dong, J.; Hao, H.; Xie, Y.; Zhang, H.; Wang, J.; Zhu, C.; Guan, Y.; Yu, H. Risk Assessment and Prevention Planning for Collapse Geological Hazards Considering Extreme Rainfall—A Case Study of Laoshan District in Eastern China. Land 2023, 12, 1558. [Google Scholar] [CrossRef]
  25. Yu, P.; Zhang, J.K.; Jia, S.X.; Cao, L.; Zhao, L. Numerical simulation study on the embedding depth of anti slip piles in fully weathered granite landslides. J. Phys. Conf. Ser. 2024, 2732, 012008. [Google Scholar] [CrossRef]
  26. Liu, H.H.; Yu, P.; Lu Xie, Y.J.; Wang, Z.S.; Hao, S.Y.; Liu, H.J.; Fu, Y.X. Experimental study on disaster mechanism of completely weathered granite landslide induced by extreme rainfall. Geoenvironmental Disasters 2023, 10, 5. [Google Scholar] [CrossRef]
Figure 1. Number of geological hazards in China (2020–2023) [7].
Water 16 01996 g001
Figure 2. Overview of the Fanling landslide.
Water 16 01996 g002
Figure 3. Monthly average rainfall in the research area (2020~2023).
Water 16 01996 g003
Figure 4. Comparison of two landslides in 2007 and 2020. (a,c,d,f) Remote sensing images of Fanling in October 2006, March 2008, April 2020, and September 2021. (b) Average rainfall during the first landslide. (e) Average rainfall during the second landslide.
Water 16 01996 g004
Figure 5. The shape of the Mohr–Coulomb yield surface on the meridian and π planes.
Water 16 01996 g005
Figure 6. Numerical model diagram and parameters.
Water 16 01996 g006
Figure 7. Process of numerical model establishment.
Water 16 01996 g007
Figure 8. Cloud map of the initial slope state without rainfall. (a) Saturation; (b) pore water pressure.
Water 16 01996 g008
Figure 9. SAT cloud maps of the E1 group. (a) Amplitude = 200%; (b) amplitude = 300%; (c) amplitude = 400%; (d) amplitude = 500%.
Water 16 01996 g009
Figure 10. POR cloud maps and response maps of the E1 group. (a) Amplitude = 200%; (b) amplitude = 300%; (c) amplitude = 400%; (d) amplitude = 500%.
Water 16 01996 g010
Figure 11. SAT cloud maps of the E2 group. (a) Duration = 32 h; (b) duration = 24 h; (c) duration = 16 h; (d) duration = 8 h.
Water 16 01996 g011
Figure 12. POR cloud and response maps of the E2 group. (a) Duration = 32 h; (b) duration = 24 h; (c) duration = 16 h; (d) duration = 8 h.
Water 16 01996 g012
Figure 13. SAT cloud maps of the E3 group. (a) Amplitude = 0%; (b) amplitude = 50%; (c) amplitude = 133%; (d) amplitude = 300%.
Water 16 01996 g013
Figure 14. POR cloud and response maps of the E3 group. (a) Amplitude = 0%; (b) amplitude = 50%; (c) amplitude = 133%; (d) amplitude = 300%.
Water 16 01996 g014
Figure 15. The final response of pore pressure under different working conditions: (a) E1; (b) E2; and (c) E3.
Water 16 01996 g015
Figure 16. The final response of displacement under different working conditions: (a) E1; (b) E2; and (c) E3.
Water 16 01996 g016
Figure 17. Physical model testing.
Water 16 01996 g017
Figure 18. Physical model experiment–numerical simulation comparison. (a) Pore water pressure; (b) displacement.
Water 16 01996 g018
Table 1. Rainfall fluctuation conditions.
GroupConditionRainfall Intensity (mm/h)Rainfall Duration (h) (+1)
InitialEndAmplitude
E1N11030200%24
N21040300%24
N31050400%24
N41060500%24
E2N51040300%32
N61040300%24
N71040300%16
N81040300%8
E3N925250%24
N10203050%24
N111535133%24
N121040300%24
Table 2. Model parameters.
MethodRainfall Intensity (mm/h)Rainfall Duration (h)Rainfall (mm)
RSRSRS
Physical model test203.6242.24807.92
Numerical simulation20202424480480
Disclaimer/Publisher’s Note: The statements, opinions and data contained in all publications are solely those of the individual author(s) and contributor(s) and not of MDPI and/or the editor(s). MDPI and/or the editor(s) disclaim responsibility for any injury to people or property resulting from any ideas, methods, instructions or products referred to in the content.

