
Estimation of the Soil–Water Characteristic Curve from Index Properties for Sandy Soil in China


Abstract
:1. Introduction
2. Methodology
2.1. Soil Index Properties Selection
2.2. Data Collection
2.3. Data Processing
2.4. Statistical Analysis
- Construct an x-element regression equation using all x variables.
- Calculate the significance test p-value of these x independent variables, respectively, and record the maximum value as .
- For a given significance level (0.05), it is considered that this variable can be removed from the regression equation if .
- Reconstruct the regression equation using the remaining x − 1 variables.
- Conduct false significance tests for the remaining x − 1 variables, respectively, and mark the maximum value as .
- If , it is considered that the variable can be removed from the regression equation.
- This cycle ends when the significance p-value of all independent variables in the regression equation is less than 0.05.
3. Results and Discussion
4. Conclusions and Recommendations
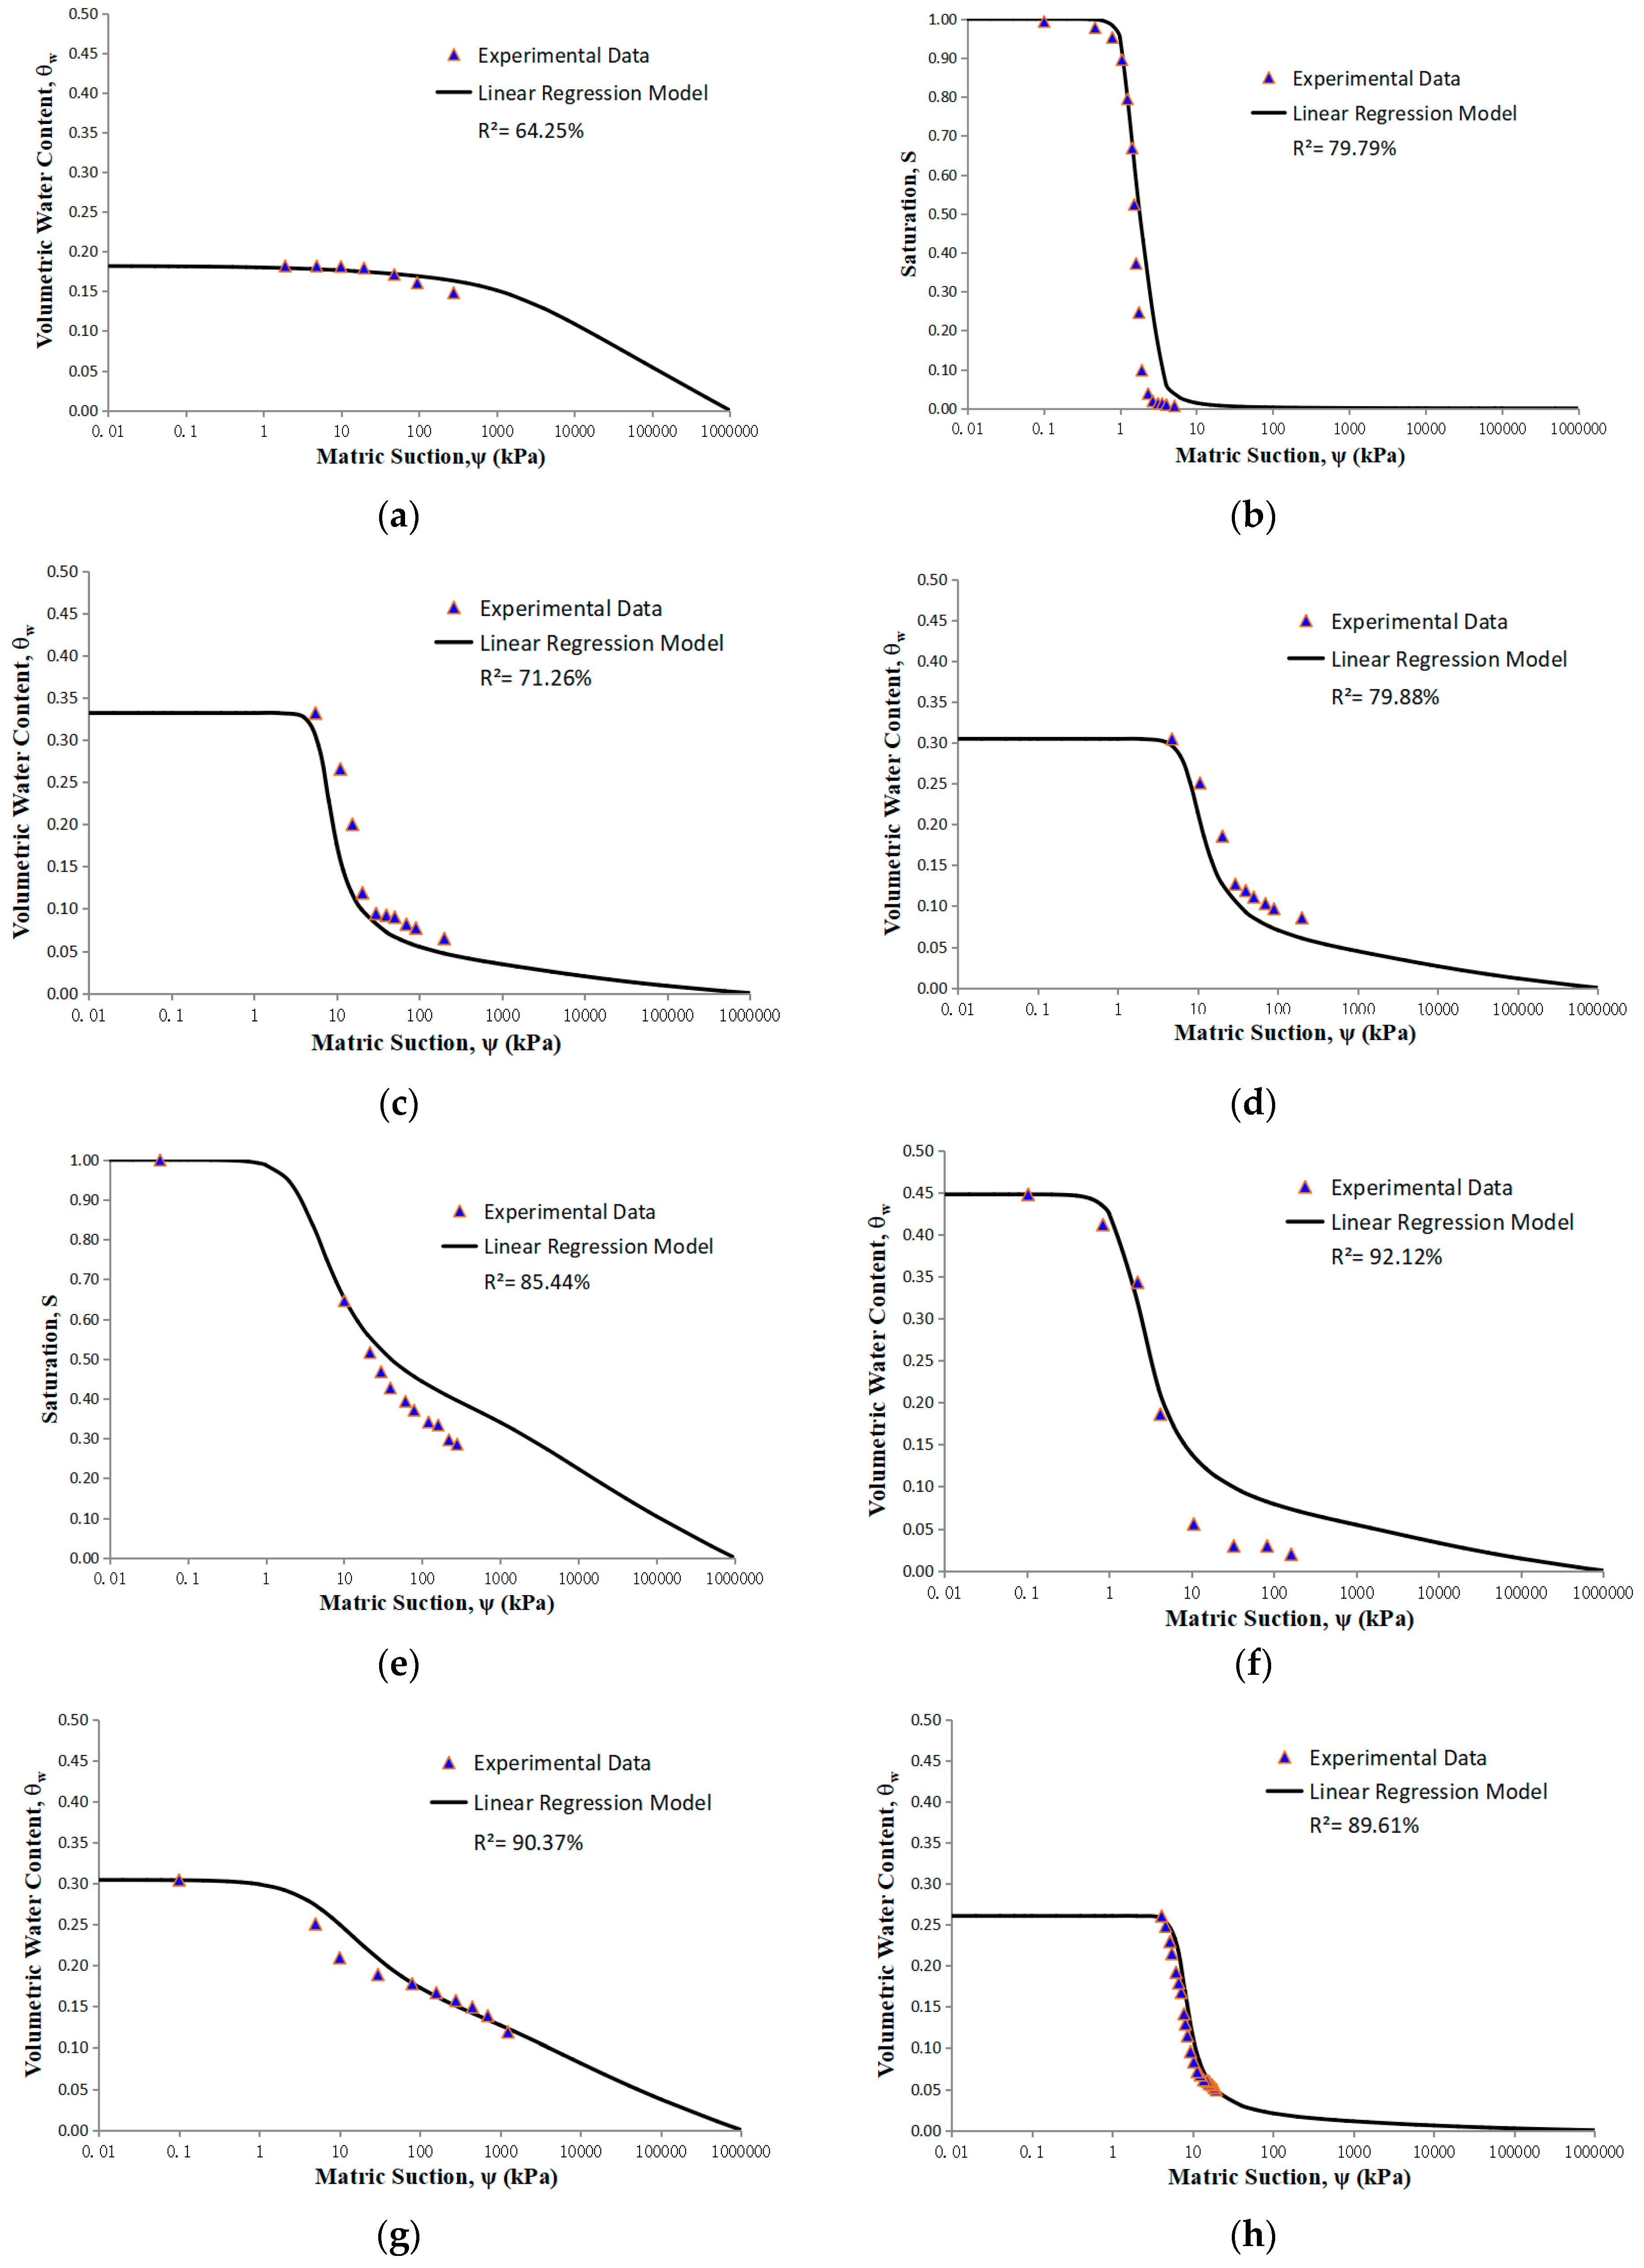
- The linear regression analyses were conducted to investigate the correlations between the fitting parameters in the FX model and the index properties of sandy soil in China. A total of 52 sets of experimental data were collected in this paper, 42 sets of data were used to train the correlation equations, while the other 8 sets of data were used for the verification of the proposed equation. It was observed that the proposed equation could predict the SWCC of sandy soil in China well.
- As only limited data for both the drying and the wetting SWCCs can be collected from the literature, only the dry SWCC data are used for the regression analyses. The hysteresis of the SWCC was not considered in this paper. More research is required on the estimation of the wetting SWCC.
- It is known that the SWCC of the coarse-grained soil is mainly affected by the grain size distribution data (GSD) and packing density. In the proposed model, only GSD, dry density and specific gravity were used as variables to train the prediction model, and the effects of the fine contents and the plastic index on the SWCC were not considered. Therefore, it was observed that the proposed equation can perform well for soil with low fine contents, and perform less accurately for soil with high fine contents.
Author Contributions
Funding
Data Availability Statement
Conflicts of Interest
References
- Zhai, Q.; Rahardjo, H. Estimation of permeability function from the soil–water characteristic curve. Eng. Geol. 2015, 199, 148–156. [Google Scholar] [CrossRef]
- Zhai, Q.; Rahardjo, H.; Satyanaga, A. Estimation of unsaturated shear strength from soil–water characteristic curve. Acta Geotech. 2019, 14, 1977–1990. [Google Scholar] [CrossRef]
- Rahimi, A.; Rahardjo, H.; Leong, E.C. Effect of range of soil–water characteristic curve measurements on estimation of permeability function. Eng. Geol. 2015, 185, 96–104. [Google Scholar] [CrossRef]
- Rahimi, A.; Rahardjo, H.; Leong, E.C. Effects of soil–water characteristic curve and relative permeability equations on estimation of unsaturated permeability function. Soils Found. 2015, 55, 1400–1411. [Google Scholar] [CrossRef]
- Sarker, D.; Wang, J.X. Experimental study on soil–water retention properties of compacted expansive clay. In Advances in Transportation Geotechnics IV: Proceedings of the 4th International Conference on Transportation Geotechnics; Tutumluer, E., Nazarian, S., Al-Qadi, I., Qamhia, I.I., Eds.; Springer International Publishing: Cham, Switzerland, 2022; Volume 3, pp. 433–445. [Google Scholar]
- Zhai, Q.; Rahardjo, H.; Satyanaga, A.; Dai, G.L. Estimation of tensile strength of sandy soil from soil–water characteristic curve. Acta Geotech. 2020, 15, 3371–3381. [Google Scholar] [CrossRef]
- Zhai, Q.; Zhang, R.Z.; Rahardjo, H.; Satyanaga, A.; Dai, G.L.; Gong, W.M.; Zhao, X.L.; Chua, Y.S. A new mathematical model for the estimation of shear modulus for unsaturated compacted soils. Can. Geotech. J. 2024, in press. [Google Scholar] [CrossRef]
- Qin, W.J.; Fan, G.S.; Li, H.X. Estimation and predicting of soil water characteristic curve using the support vector machine method. Earth Sci. Inform. 2023, 16, 1061–1072. [Google Scholar] [CrossRef]
- Peranić, J.; Prodan, M.V.; Škuflić, R.; Arbanas, Z. Preliminary Experiences in Determining the Soil–Water Characteristic Curve of a Sandy Soil Using Physical Slope Modeling. Water 2024, 16, 1859. [Google Scholar] [CrossRef]
- Wen, T.D.; Wang, P.P.; Shao, L.T.; Guo, X.X. Experimental investigations of soil shrinkage characteristics and their effects on the soil water characteristic curve. Eng. Geol. 2021, 284, 106035. [Google Scholar] [CrossRef]
- Wen, T.D.; Shao, L.T.; Guo, X.X.; Zhao, Y.R. Experimental investigations of the soil water retention curve under multiple drying–wetting cycles. Acta Geotech. 2020, 15, 3321–3326. [Google Scholar] [CrossRef]
- Wen, T.D.; Chen, X.S.; Luo, Y.W.; Shao, L.T.; Niu, G. Three-dimensional pore structure characteristics of granite residual soil and their relationship with hydraulic properties under different particle gradation by X-ray computed tomography. J. Hydrol. 2023, 618, 129230. [Google Scholar] [CrossRef]
- Wen, T.D.; Chen, X.S.; Shao, L.T. Effect of multiple wetting and drying cycles on the macropore structure of granite residual soil. J. Hydrol. 2022, 614, 128583. [Google Scholar] [CrossRef]
- Jiang, T.; Zhao, J.D.; Zhang, J.R.; Wang, L.J.; Song, C.Y.; Zhai, T.Y. Hydromechanical behavior and prediction of unsaturated loess over a wide suction range. Geomech. Eng. 2021, 26, 275–288. [Google Scholar]
- Meskini-Wishkaee, F.; Mohammadi, M.H.; Vanclooster, M. Predicting the soil moisture retention curve from soil particle size distribution and bulk density data using a packing density scaling factor. Hydrol. Earth Syst. Sci. 2014, 18, 4053–4063. [Google Scholar] [CrossRef]
- Torabi, M.; Sarkardeh, H.; Mirhosseini, S.M.; Samadi, M. Effect of water temperature and soil type on infiltration. Geomech. Eng. 2023, 32, 445–452. [Google Scholar]
- Zhai, Q.; Tian, G.; Ye, W.M.; Rahardjo, H.; Dai, G.L.; Wang, S.J. Evaluation of unsaturated soil slope stability by incorporating soil water characteristic curve. Geomech. Eng. 2022, 28, 637–644. [Google Scholar]
- Leong, E.C.; Rahardjo, H. Review of soil-water characteristic curve equations. J. Geotech. Geoenviron. Eng. 1997, 12, 1106–1117. [Google Scholar] [CrossRef]
- Fredlund, D.G.; Xing, A. Equations for the soil-water characteristic curve. Can. Geotech. J. 1994, 31, 521–532. [Google Scholar] [CrossRef]
- Fredlund, D.G.; Fredlund, M.D. Application of ‘Estimation Procedures’ in Unsaturated Soil Mechanics. Geosciences 2020, 10, 364. [Google Scholar] [CrossRef]
- Fredlund, M.D.; Wilson, G.; Fredlund, D.G. Use of the grain-size distribution for estimation of the soil-water characteristic curve. Can. Geotech. J. 2002, 39, 1103–1117. [Google Scholar] [CrossRef]
- Li, Y.; Vanapalli, S.K. Prediction of soil-water characteristic curves using two artificial intelligence (AI) models and AI aid design method for sands. Can. Geotech. J. 2022, 59, 129–143. [Google Scholar] [CrossRef]
- Liu, Y.; Wei, C.F.; Fang, Q. Implicit integration algorithm of a hydro-mechanical coupling constitutive model for unsaturated soils. Rock Soil Mech. 2014, 35, 365–370. [Google Scholar]
- Luo, Q.X.; Huang, J.; Chen, Q. Influence of vertical stress and dry density on soil-water characteristic curve of gravelly soil. Rock Soil Mech. 2014, 35, 729–734+743. [Google Scholar]
- Chai, J.; Khaimook, P. Prediction of soil-water characteristic curves using basic soil properties. Transp. Geotech. 2020, 22, 100295. [Google Scholar] [CrossRef]
- Zapata, C.E.; Houston, W.N.; Houston, S.L.; Walsh, K.D. Soil-water characteristic curve variability. In Advances in Unsaturated Geotechnics; American Society of Civil Engineers: Reston, VA, USA, 2000; pp. 84–124. [Google Scholar]
- Mir Mohammad Hosseini, S.M.; Ganjian, N.; Pashang Pisheh, Y. Estimation of the water retention curve for unsaturated clay. Can. J. Soil. Sci. 2011, 91, 543–549. [Google Scholar] [CrossRef]
- Wang, Y.; Li, T.L.; Li, P.; Lei, Y.L.; David, D. Lawrence.Measurement and Uniform Formulation of Soil-Water Characteristic Curve for Compacted Loess Soil with Different Dry Densities. J. Adv. Civ. Eng. 2021, 2021, 6689680. [Google Scholar]
- Vanapalli, S.K.; Fredlund, D.G.; Pufahl, D.E. The influence of soil structure and stress history on the soil-water characteristics of a compacted till. Geotechnique 1999, 49, 143–159. [Google Scholar] [CrossRef]
- Luo, X.Y.; Liu, W.P.; Fu, M.F. Effects of gradation and vertical stress on soil-water characteristic curve in collapsing erosion area. J. Southeast Univ. (Nat. Sci. Ed.) 2016, 46 (Suppl. S1), 235–240. [Google Scholar]
- Aubertin, M.; Mbonimpa, M.; Bussiere, B.; Chapuis, R.P. A model to predict the water retention curve from basic geotechnical properties. Can. Geotech. J. 2003, 40, 1104–1122. [Google Scholar] [CrossRef]
- Liu, J.J.; Wen, S.J. Effect of Dry Density and Particle Size on Soil-water Characteristic Curve of Unsaturated Tailing Sand. Chin. J. Undergr. Space Eng. 2021, 17, 1437–1443. [Google Scholar]
- Song, L.L. A Study of the Red Sandstone Soil Slope Stability under Rainfall Condition; Jiangxi University of Science and Technology: Ganzhou, China, 2018. [Google Scholar]
- Zhang, S.; Cheng, J.X.; Liu, F.Y. Pedotransfer functions to describe water retention and unsaturated strength behaviors of sandy soils based on particle size parameters. J. Hydraul. Eng. 2020, 51, 479–491. [Google Scholar]
- He, J.T. The Factors Affecting the Soil-Water Characteristic Curve and Its Prediction; Guilin University of Technology: Guilin, China, 2017. [Google Scholar]
- Yang, M.H.; Wang, W.Y.; Deng, B. The shearing capacity of the interface between unsaturated sandy soil and the concrete surface. J. Railw. Sci. Eng. 2022, 19, 409–418. [Google Scholar]
- Tian, H.N.; Kong, L.W. Experimental study of the effect of the fine contents on the soil water characteristic curve of the sandy soil. Rock Soil Mech. 2010, 31, 56–60. [Google Scholar]
- Zhu, X.L. A Study of the Pattern of the Particles and Its Effect on the Soil Water Retention Characteristic; Hubei University of Technology: Wuhan, China, 2019. [Google Scholar]
- Zhang, L.Q. The effect of the Fine Contents and the Degree of Saturation on the Shear Characteristic of Unsaturated Soil; Beijing Jiaotong University: Beijing, China, 2020. [Google Scholar]
- Tang, X.Y. The Macro-Micro Study of the Soil-Water Characteristic Curve of Sandy Soil in Nanjing; Nanjing University: Nanjing, China, 2017. [Google Scholar]
- Hou, S.Y. The Seepage Experimental Study of Unsaturated Silty and Sandy Soil and Its Application in the Dual Capillary Barrier System; China University of Geosciences (Wuhan): Wuhan, China, 2018. [Google Scholar]
- Lou, A.Y. A Study of the Soil Water Retention Curve of Sandy Soil under Frozen and Thaw Condition and Its Sensitivity; Heilongjiang University: Harbin, China, 2021. [Google Scholar]

| SN | Soil | Dry Density/ Mg·m−3 | Specific Gravity/ Gs | d60/ mm | d30/ mm | d50/ mm | d10/ mm | References |
|---|---|---|---|---|---|---|---|---|
| 1 | Clay gravel | 1.897 | 2.71 | 3.547 | 0.058 | 2 | 0.045 | Luo et al. [24] |
| 2 | Clay gravel | 2.065 | 2.71 | 3.547 | 0.058 | 2 | 0.045 | |
| 3 | Clay gravel | 2.187 | 2.71 | 3.547 | 0.058 | 2 | 0.045 | |
| 4 | Clay gravel | 2.216 | 2.71 | 3.547 | 0.058 | 2 | 0.045 | |
| 5 | Red sandstone soil | 1.7 | 2.7 | 0.7 | 0.1 | 0.5 | 0.05 | Song [33] |
| 6 | Red sandstone soil | 1.77 | 2.7 | 0.7 | 0.1 | 0.5 | 0.05 | |
| 7 | Red sandstone soil | 1.83 | 2.7 | 0.7 | 0.1 | 0.5 | 0.05 | |
| 8 | Red sandstone soil | 1.78 | 2.7 | 0.7 | 0.1 | 0.5 | 0.05 | |
| 9 | Red sandstone soil | 1.78 | 2.7 | 0.7 | 0.1 | 0.5 | 0.05 | |
| 10 | Red sandstone soil | 1.78 | 2.7 | 0.7 | 0.1 | 0.5 | 0.05 | |
| 11 | Mu Wu sand | 1.4 | 2.7 | 0.28 | 0.231 | 0.262 | 0.188 | Zhang [34] |
| 12 | Chanhe sand | 1.4 | 2.7 | 0.513 | 0.325 | 0.435 | 0.238 | |
| 13 | Riddled sand sand I | 1.4 | 2.7 | 0.308 | 0.25 | 0.289 | 0.22 | |
| 14 | Riddled sand sand II | 1.4 | 2.7 | 0.619 | 0.502 | 0.575 | 0.443 | |
| 15 | Medium sand | 1.75 | 2.66 | 0.447 | 0.3 | 0.397 | 0.075 | Liu and Wen [32] |
| 16 | Medium sand | 1.75 | 2.66 | 0.447 | 0.3 | 0.397 | 0.075 | |
| 17 | Medium sand | 1.8 | 2.66 | 0.447 | 0.3 | 0.397 | 0.075 | |
| 18 | Fine sand | 1.7 | 2.67 | 0.349 | 0.228 | 0.32 | 0.061 | |
| 19 | Fine sand | 1.75 | 2.67 | 0.349 | 0.228 | 0.32 | 0.061 | |
| 20 | Fine sand | 1.8 | 2.67 | 0.349 | 0.228 | 0.32 | 0.061 | |
| 21 | Silt | 1.7 | 2.68 | 0.112 | 0.05 | 0.093 | 0.03 | |
| 22 | Silt | 1.75 | 2.68 | 0.112 | 0.05 | 0.093 | 0.03 | |
| 23 | Silt | 1.8 | 2.68 | 0.112 | 0.05 | 0.093 | 0.03 | |
| 24 | Sandy soil | 1.4 | 2.7 | 0.109 | 0.046 | 0.087 | 0.003 | He [35] |
| 25 | Sandy soil | 1.5 | 2.69 | 0.109 | 0.046 | 0.087 | 0.003 | |
| 26 | Sandy soil | 1.579 | 2.7 | 1.388 | 0.532 | 0.895 | 0.086 | Yang et al. [36] |
| 27 | Sandy soil | 1.38 | 2.685 | 0.14 | 0.096 | 0.155 | 0.076 | Tian and Kong [37] |
| 28 | Sandy soil | 1.38 | 2.69 | 0.136 | 0.091 | 0.149 | 0.038 | |
| 29 | Sandy soil | 1.38 | 2.694 | 0.131 | 0.086 | 0.142 | 0.030 | |
| 30 | Sandy soil | 1.38 | 2.695 | 0.127 | 0.08 | 0.135 | 0.026 | |
| 31 | Sandy soil | 1.38 | 2.683 | 0.148 | 0.102 | 0.16 | 0.082 | |
| 32 | Sandy soil | 1.38 | 2.703 | 0.106 | 0.038 | 0.105 | 0.013 | |
| 33 | Hunan sandy soil | 1.3 | 2.7 | 0.054 | 0.031 | 0.047 | 0.012 | Zhu [38] |
| 34 | Hunan sandy soil | 1.35 | 2.7 | 0.054 | 0.031 | 0.047 | 0.012 | |
| 35 | Hunan sandy soil | 1.4 | 2.7 | 0.054 | 0.031 | 0.047 | 0.012 | |
| 36 | Hunan sandy soil | 1.45 | 2.7 | 0.054 | 0.031 | 0.047 | 0.012 | |
| 37 | Hunan sandy soil | 1.5 | 2.7 | 0.054 | 0.031 | 0.047 | 0.012 | |
| 38 | Hunan sandy soil | 1.6 | 2.7 | 0.054 | 0.031 | 0.047 | 0.012 | |
| 39 | Hunan sandy soil | 1.6 | 2.7 | 0.054 | 0.031 | 0.047 | 0.012 | |
| 40 | Sandy soil | 1.754 | 2.55 | 0.375 | 0.288 | 0.325 | 0.238 | Zhang [39] |
| 41 | Sandy soil | 1.888 | 2.55 | 0.365 | 0.273 | 0.315 | 0.223 | |
| 42 | Sandy soil | 1.942 | 2.55 | 0.35 | 0.254 | 0.300 | 0.204 | |
| 43 | Sandy soil | 2.039 | 2.55 | 0.322 | 0.23 | 0.272 | 0.180 | |
| 44 | Sandy soil | 1.996 | 2.56 | 0.28 | 0.235 | 0.240 | 0.185 | |
| 45 | Sandy soil | 1.935 | 2.58 | 0.32 | 0.26 | 0.270 | 0.210 | |
| 46 | Sandy soil | 1.81 | 2.59 | 0.34 | 0.28 | 0.290 | 0.230 | |
| 47 | Sandy soil | 1.683 | 2.55 | 0.386 | 0.304 | 0.336 | 0.254 | |
| 48 | Sandy soil | 1.26 | 2.69 | 0.136 | 0.098 | 0.1 | 0.079 | Tang [40] |
| 49 | Sandy soil | 1.4 | 2.53 | 0.204 | 0.167 | 0.193 | 0.134 | Hou [41] |
| 50 | Fine sand | 1.4 | 2.55 | 0.296 | 0.148 | 0.237 | 0.075 | Lou [42] |
| 51 | Coarse sand | 1.4 | 2.55 | 0.669 | 0.34 | 0.561 | 0.141 | |
| 52 | Medium sand | 1.4 | 2.55 | 0.383 | 0.196 | 0.319 | 0.104 |
| No. | Soil | FX Model Parameter | R2 | ||
|---|---|---|---|---|---|
| A (kPa) | m | n | |||
| 1 | Clay gravel | 8.835 | 0.369 | 1.368 | 99.88 |
| 2 | Clay gravel | 27.34 | 0.282 | 1.663 | 99.97 |
| 3 | Clay gravel | 27.4 | 0.11 | 2.897 | 99.7 |
| 5 | Red sandstone soil | 39.88 | 0.515 | 1.781 | 99.8 |
| 6 | Red sandstone soil | 64.23 | 0.7 | 1.334 | 99.89 |
| 7 | Red sandstone soil | 72.88 | 0.67 | 1.614 | 99.8 |
| 8 | Red sandstone soil | 61.51 | 0.48 | 2.319 | 99.53 |
| 9 | Red sandstone soil | 47.88 | 0.768 | 1.267 | 98.17 |
| 10 | Red sandstone soil | 155.8 | 0.53 | 1.49 | 99.59 |
| 11 | Mu Wu sand | 2 | 0.8 | 5 | 81.71 |
| 12 | Chanhe sand | 2 | 0.8 | 10 | 87.32 |
| 13 | Riddled sand sand I | 2.288 | 1.75 | 13.662 | 99.39 |
| 16 | Medium sand | 8.579 | 0.48 | 8.641 | 99.78 |
| 17 | Medium sand | 9.852 | 0.433 | 7.368 | 98.73 |
| 18 | Fine sand | 9.538 | 0.708 | 4.281 | 99.63 |
| 19 | Fine sand | 10.062 | 0.535 | 6.405 | 99.92 |
| 21 | Silt | 17.997 | 0.771 | 5.189 | 99.85 |
| 22 | Silt | 20.138 | 0.665 | 4.754 | 99.73 |
| 23 | Silt | 20.165 | 0.595 | 4.382 | 99.67 |
| 24 | Sandy soil | 3.792 | 0.645 | 1.511 | 99.35 |
| 26 | Sandy soil | 2.600 | 0.866 | 4.275 | 99.86 |
| 27 | Sandy soil | 2.425 | 0.865 | 4.332 | 99.55 |
| 28 | Sandy soil | 3.045 | 0.726 | 5.169 | 99.35 |
| 29 | Sandy soil | 2.305 | 0.868 | 2.508 | 99.84 |
| 30 | Sandy soil | 2.405 | 0.667 | 2.716 | 99.86 |
| 32 | Sandy soil | 2.622 | 1.483 | 2.555 | 99.59 |
| 33 | Hunan sandy soil | 0.734 | 0.427 | 1.530 | 99.87 |
| 34 | Hunan sandy soil | 0.684 | 0.390 | 1.415 | 99.67 |
| 35 | Hunan sandy soil | 0.813 | 0.399 | 1.190 | 99.51 |
| 36 | Hunan sandy soil | 0.971 | 0.359 | 1.397 | 99.64 |
| 37 | Hunan sandy soil | 2.167 | 0.294 | 1.920 | 99.49 |
| 39 | Hunan sandy soil | 3.620 | 0.258 | 1.834 | 99.76 |
| 40 | Sandy soil | 2.119 | 0.698 | 15.420 | 99.56 |
| 41 | Sandy soil | 2.763 | 0.699 | 6.164 | 99.38 |
| 42 | Sandy soil | 13.519 | 1.195 | 1.494 | 99.51 |
| 43 | Sandy soil | 13.519 | 1.195 | 1.494 | 99.59 |
| 44 | Sandy soil | 287.483 | 3.155 | 1.029 | 99.52 |
| 45 | Sandy soil | 75.985 | 1.514 | 1.216 | 99.67 |
| 46 | Sandy soil | 46.452 | 1.005 | 1.412 | 99.94 |
| 47 | Sandy soil | 7.852 | 0.724 | 5.576 | 99.12 |
| 48 | Sandy soil | 0.5 | 1 | 2 | 96.53 |
| 49 | Sandy soil | 10 | 2 | 1 | 94.66 |
| 50 | Fine sand | 8.686 | 0.759 | 6.697 | 99.58 |
| 52 | Medium sand | 7.246 | 0.882 | 5.888 | 99.66 |
| Model | Variables | Coefficient | Significance Test p-Value | R | R2 | Adjusted R2 |
|---|---|---|---|---|---|---|
| 1 | (constant) | −26.252 | 0.97 | 0.613 | 0.376 | 0.226 |
| dry density | 94.407 | 0.081 | ||||
| specific gravity | −37.974 | 0.382 | ||||
| d60 | 214.464 | 0.306 | ||||
| d30 | −253.146 | 0.103 | ||||
| d50 | −224.252 | 0.469 | ||||
| d10 | 394.034 | 0.14 | ||||
| 2 | (constant) | −89.283 | 0.898 | 0.602 | 0.362 | 0.239 |
| dry density | 97.438 | 0.068 | ||||
| specific gravity | −18.773 | 0.194 | ||||
| d50 | 67.741 | 0.173 | ||||
| d30 | −236.217 | 0.219 | ||||
| d10 | 311.439 | 0.189 | ||||
| 3 | (constant) | 98.38 | 0.728 | 0.6 | 0.355 | 0.271 |
| dry density | 14.049 | 0.043 | ||||
| specific gravity | −43.285 | 0.202 | ||||
| d50 | −2.285 | 0.039 | ||||
| d10 | 4.287 | 0.027 | ||||
| 4 | (constant) | −136.225 | 0.027 | 0.49 | 0.24 | 0.18 |
| dry density | 95.618 | 0.02 | ||||
| d50 | 179.221 | 0.114 | ||||
| d10 | −20.478 | 0.258 |
| Model | Variables | Coefficient | Significance Test p-Value | R | R2 | Adjusted R2 |
|---|---|---|---|---|---|---|
| 1 | (constant) | 5.345 | 0.345 | 0.771 | 0.594 | 0.497 |
| d10 | 5.209 | 0.018 | ||||
| dry density | −0.238 | 0.568 | ||||
| specific gravity | −1.705 | 0.403 | ||||
| d60 | 0.022 | 0.989 | ||||
| d30 | −0.444 | 0.712 | ||||
| d50 | 0.158 | 0.949 | ||||
| 2 | (constant) | 5.33 | 0.328 | 0.771 | 0.594 | 0.516 |
| d10 | 5.196 | 0.007 | ||||
| dry density | −0.237 | 0.555 | ||||
| Specific Gravity | −1.701 | 0.388 | ||||
| d30 | −0.439 | 0.696 | ||||
| d50 | 0.19 | 0.738 | ||||
| 3 | (constant) | 4.836 | 0.347 | 0.77 | 0.592 | 0.532 |
| d10 | 5.141 | 0.006 | ||||
| dry density | −0.18 | 0.614 | ||||
| specific gravity | −1.541 | 0.412 | ||||
| d30 | −0.208 | 0.811 | ||||
| 4 | (constant) | 4.979 | 0.321 | 0.769 | 0.592 | 0.548 |
| d10 | 4.951 | 0.003 | ||||
| dry density | −0.202 | 0.551 | ||||
| specific gravity | −1.587 | 0.387 | ||||
| 5 | (constant) | 4.652 | 0.345 | 0.766 | 0.586 | 0.558 |
| d10 | 4.715 | 0.003 | ||||
| specific gravity | −1.578 | 0.385 | ||||
| 6 | (constant) | 0.373 | 0.001 | 0.758 | 0.575 | 0.561 |
| d10 | 3.728 | 0 |
| Model | Variables | Coefficient | Significance Test p-Value | R | R2 | Adjusted R2 |
|---|---|---|---|---|---|---|
| 1 | (constant) | 12.504 | 0.403 | 0.727 | 0.528 | 0.419 |
| dry density | −3.285 | 0.02 | ||||
| specific gravity | −2.288 | 0.659 | ||||
| d60 | −12.842 | 0.025 | ||||
| d30 | 14.91 | 0.001 | ||||
| d50 | 18.396 | 0.03 | ||||
| d10 | −16.552 | 0.004 | ||||
| 2 | (constant) | 6.001 | 0.002 | 0.724 | 0.525 | 0.437 |
| dry density | −3.038 | 0.016 | ||||
| d60 | −13.27 | 0.017 | ||||
| d30 | 15.109 | 0.001 | ||||
| d50 | 18.748 | 0.024 | ||||
| d10 | −16.111 | 0.004 | ||||
| 3 | (constant) | 3.365 | 0.142 | 0.578 | 0.335 | 0.263 |
| dry density | −0.515 | 0.732 | ||||
| d60 | −0.168 | 0.653 | ||||
| d30 | 12.737 | 0 | ||||
| d10 | −15.28 | 0.005 |
| No. | Soil | Linear Regression Model | ||
|---|---|---|---|---|
| a (kPa) | m | n | ||
| 4 | Clay gravel | 7.833 | 0.541 | 0.1 |
| 14 | Riddled sand sand II | 1.764 | 2.025 | 4.761 |
| 15 | Medium sand | 6.540 | 0.653 | 5.672 |
| 20 | Fine sand | 7.628 | 0.600 | 4.363 |
| 25 | Sandy soil | 2.831 | 0.384 | 2.277 |
| 31 | Sandy soil | 1.620 | 0.679 | 3.064 |
| 38 | Hunan sandy soil | 5.339 | 0.418 | 1.268 |
| 51 | Coarse sand | 6.994 | 0.899 | 6.253 |
Disclaimer/Publisher’s Note: The statements, opinions and data contained in all publications are solely those of the individual author(s) and contributor(s) and not of MDPI and/or the editor(s). MDPI and/or the editor(s) disclaim responsibility for any injury to people or property resulting from any ideas, methods, instructions or products referred to in the content. |
© 2024 by the authors. Licensee MDPI, Basel, Switzerland. This article is an open access article distributed under the terms and conditions of the Creative Commons Attribution (CC BY) license (https://creativecommons.org/licenses/by/4.0/).
Share and Cite
Wang, S.; Guo, X.; You, F.; Zhang, Z.; Shen, T.; Chen, Y.; Zhai, Q. Estimation of the Soil–Water Characteristic Curve from Index Properties for Sandy Soil in China. Water 2024, 16, 2044. https://doi.org/10.3390/w16142044
Wang S, Guo X, You F, Zhang Z, Shen T, Chen Y, Zhai Q. Estimation of the Soil–Water Characteristic Curve from Index Properties for Sandy Soil in China. Water. 2024; 16(14):2044. https://doi.org/10.3390/w16142044
Chicago/Turabian StyleWang, Shijun, Xing Guo, Feng You, Zhong Zhang, Tianlun Shen, Yuhui Chen, and Qian Zhai. 2024. "Estimation of the Soil–Water Characteristic Curve from Index Properties for Sandy Soil in China" Water 16, no. 14: 2044. https://doi.org/10.3390/w16142044