Abstract
This study investigates the Batha endorheic basin in Chad, situated east of the Lake Chad basin in the arid to semi-arid Sahelian zone. This region has not yet undergone comprehensive geological and hydrogeological studies. More broadly, the transition zone between semi-arid and arid climates has been minimally explored. This research aims to evaluate the resources and dynamics of this multi-layered system using a combined geology-hydrogeology-hydrochemistry-isotopes approach. The multilayer system includes sedimentary layers (Quaternary, Pliocene, and Eocene) over a crystalline basement. A piezometric investigation of the system shows a general SE–NW groundwater, indicating an interconnection between all layers. Hydrochemical analyses identifies four main facies (calcium-bicarbonate, sodium-bicarbonate, sulphate-sodium, and mixed), primarily controlled by water–rock interaction with secondary influences from base-exchange and evaporation. Saturation indices indicate that these waters are close to equilibrium with the calcite-Mg phases, gaylussite and gypsum. Stable isotopes (oxygen-18 and deuterium) categorize groundwater into three groups: ancient water, recent and older meteoric water mixtures affected by evaporation, and mixtures more heavily impacted by evaporation. Tritium contents reveal three groups: current rainwater, modern water, and sub-modern water. These results indicate that ionic and isotopic differentiations cannot be strictly linked to specific layers, confirming the interconnected nature of the Batha system. The observed heterogeneity is mainly influenced by lithological and climatic variations. This study, though still limited, enhances significantly the understanding of the basin’s functioning and supports the rational exploitation of its vital resources for the Batha area’s development. Future investigations to complete the present study are highlighted.
1. Introduction
The Chad Basin is a large downwarps developed on the continental crust. Since the beginning of the Tertiary period, this active intracontinental basin [1] has remained a purely endorheic system draining fresh waters from the surrounding mountains. The basin extends across three climatic zones, namely hyper-arid to arid (Saharan), semi-arid (Sahelian), and subtropical (Sahelo-Sudanese). This makes it the largest endorheic basin in the world, covering an area of 2.38 million square kilometers. In such a context, the water storage capacity of the basin is highly sensitive to climate fluctuations. At the regional scale of the Sahara, long-term variations in relative humidity and aridity have left geomorphological and sedimentary evidence [2]. During wet periods, large masses of water developed in depressions to form mega-lakes (>25,000 km2 in area) [3]. Therefore, in this relatively flat landscape like the Chad Basin [4], lake water levels have fluctuated significantly over time in response to climate change. For instance, Lake Chad has fluctuated between 25 and 10,000 km2 over the present century and has expanded over at least 300,000 km2 during the last 10,000 years.
Currently, annual rainfall in Chad varies from 1000 mm in the south to 300 mm in the north, which is the limit for agricultural activities. During the wet season (June to September), provinces located south of the 12th parallel receive more than 500 mm of rainfall, which is sufficient for agricultural practices such as the cultivation of sorghum, millet, and groundnuts, as well as livestock breeding [5]. The 250 mm isohyet is generally considered to be the boundary between arid and semi-arid climates around the 15th parallel. However, between 1950 and 2020, there has been a significant decrease in rainfall ranging from −150 to −50 mm, accompanied by an increase in temperature (+0.15 °C/decade) [6]. With the southward movement of the 300–500 mm isohyets, drought and associated desertification have spread [7], directly impacting the water resources available to populations settled in the Sahelian zone, particularly in eastern Chad. The Köppen climate classification categorizes the northern part of the study area as a BWh zone, which corresponds to Arid Desert and Hot, and the southern part as a BSh zone corresponding to Arid Steppe and Hot [8].
Most hydrogeological studies in Chad have focused on the sub-tropical regions, where the population and economic activities are concentrated. These studies primarily examined the relationship between the discharge of the Chari River and the recharge of Lake Chad [9,10,11,12,13], as well as the water resources of the Chari basin [14,15,16]. In contrast, the area of Chad located east of Lake Chad has not yet undergone comprehensive geological and hydrogeological studies. The research presented in this article, including the findings on the structural identification and dynamics of this complex system, is thus original.
Additionally, located under the Sahelo-Sudanese climate where the effects of aridification are already present, the region of Batha represents a typical case study for understanding the evolution of water resources in a sensitive environment at the transition between arid and semi-arid conditions. Hydrogeological studies in this transition zone remain scarce, which makes the work presented in this article innovative in a very little-studied climatic zone of Africa.
In this region, the Batha river basin channels runoff to Lake Fitri, which constitutes the largest surface water body. To the north of this basin, the climate is Saharan-Sahelian, leading to sporadic and low runoff. Under these conditions, groundwater becomes the primary source of water for human activities. Therefore, it is crucial to fully understand the complex geometry of the regional aquifer system, its dynamics, the recharge mechanisms and geochemistry of groundwaters. To achieve this objective, the current study integrates structural, lithological, piezometric, geochemical (major ions), and isotopic (3H, 2H, and 18O) data. The primary objective of this study is to improve the understanding of the Batha aquifer system, with the aim of facilitating the future sustainable management of this crucial resource in an arid to semi-arid climatic context.
In this region of Chad, as in semi-arid to arid environments throughout the world, desertification is a significant environmental issue. Its expansion also remains a growing concern worldwide. Among several important contributing factors such as climate change, limited knowledge about water resources and their subsequent mismanagement is a major aggravating factor. The implementation of integrated approaches combining geology, hydrogeology, hydrochemistry, and water isotopes, such as those developed in the present study, efficiently documented the hydrochemical components of complex multilayered hydrogeological systems, groundwater recharge characteristics, groundwater quality, and more.
Several multidisciplinary studies carried out in China in arid to semi-arid environments, using conventional hydrochemical and isotopic techniques, have contributed to a much better understanding of the Ejina complex hydrogeological system in the Badain Jaran Desert region [17,18], and of the Qaidam Basin in the arid inland basins of northwest China [19]. In other various arid to semi-arid environments around the world, investigations to understand the hydraulics and hydrogeochemical processes controlling groundwater compositions and their evolution, to evaluate water quality, and to assess groundwater recharge mechanisms have been successfully conducted using such multidisciplinary approaches.
In North Africa, Edmunds et al. [20] examined the geochemical processes along an 800 km flow line from the Atlas Mountains in Algeria to the Chotts of Tunisia within the Continental Intercalaire (CI) aquifer using geochemical and isotopic indicators. Farid et al. [21] conducted a comprehensive study of groundwater in the detrital and carbonate aquifers of the Chougafiya basin in central Tunisia. They combined hydrochemical and isotopic tools to understand the mineralization processes, recharge conditions, groundwater flow patterns, and overall chemistry of the hydrological system. In eastern Morocco, near Errachidia and surrounded by the High Atlas chain, the Eastern Upper Guir Basin is a critical area in a semi-arid environment. Abdelfadel et al. [22] investigated this complex folded system using structural, meteorological, hydrogeological, hydrochemical, and isotopic data. Their research revealed that the system is compartmentalized into hydrogeological sub-units that are interdependent, providing insights for quantitative water resource management.
In East Africa, which is prone to aridity, several studies have investigated complex aquifers in volcanic formations using similar methodologies. In Ethiopia’s Middle Awash basin, an arid region reliant on groundwater, Wakgari et al. [23] analyzed the hydrogeological system using hydrochemical variables and water isotopes to study rock-water interactions, geochemical processes, and hydrological links between aquifers. In Djibouti, where groundwater from volcanic systems is the sole water source, Aboubaker et al. [24] and Ahmed et al. [25] studied the Dalha basalts and the Goda Mountains Range systems, respectively, leading to effective conceptualizations for sustainable resource exploitation. In Tanzania, Chacha et al. [26] used hydrochemical and isotopic techniques to elucidate the recharge mechanisms and functioning of the Arusha volcanic aquifer.
Beyond Africa, various studies have applied these methodologies to other regions. In northwest Australia’s semi-arid Pilbara region, Dogramaci et al. [27] analyzed the Hamersley Basin to determine surface water pool control processes and groundwater recharge sources using stable isotopes and hydrochemistry. Al-Ahmadi et al. [28] studied the groundwater system in Wadi Sayyah, near Jeddah in western Saudi Arabia, using hydrochemical methods to understand the geochemical evolution and suitability of the groundwater for drinking and irrigation. In southern Iran, Maskooni et al. [29] assessed the groundwater quality of the Sarkhun Aquifer in Hormozgan Province using conventional geochemical methods, providing vital information for sustainable groundwater management. In India, Keesari et al. [30] investigated the Indo-Gangetic multi-aquifer system using environmental isotopes and hydrochemical modeling to understand recharge sources, aquifer dynamics, and inter-connectivity, offering crucial inputs for sustainable development of deep aquifers in the Middle Gangetic Plains and other Indo-Gangetic regions.
All these studies adhere to a similar organizational framework and utilize an integrated approach that incorporates various conventional methods, including geological and hydrogeological techniques, Piper and Gibbs methods, ionic ratio analysis, statistical methods, and geochemical modeling. These integrated approaches have yielded deeper insights into the structure and functioning of the studied systems, providing a valuable reference for groundwater management strategies.
2. Materials and Methods
2.1. Study Area
2.1.1. Geography, Orography, Climate, and Soils
The study area is located in the eastern part of the Lake Chad basin. This basin is a large topographical depression divided between seven countries. Its limits are defined by a series of mountains arranged in a vast, more or less continuous arc (Hoggar, Adrar, Tibesti, Ennedi, Ouidai and Adamawa) and isolated plateaus (Jos and Aïr). The study area (Figure 1) covers a geographical area between 12°N and 16°N latitude and 16°E and 22°E longitude. Its hydrological limits are represented by the Bahr El Gazal and Ouaddi Achim wadis to the west and the north and by the Ouaddai and Guera massifs to the east and south-east. The western part of the area has relatively low topography, ranging from 230 m to 420 m above sea level. On the other hand, the topography on the southeastern border (Guera Massif) and the eastern border (Ouaddai Massif) varies from 900 m to 1600 m respectively.
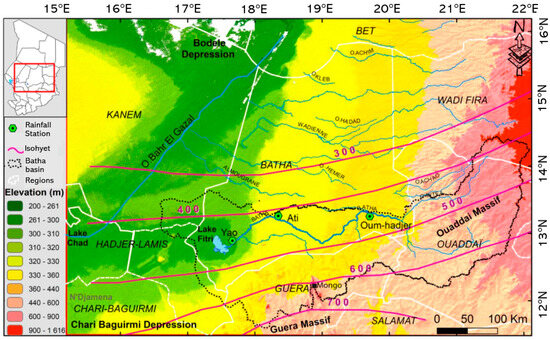
Figure 1.
Location of the study area.
In the regional context, all rivers have their source in the foothills of the Ouaddaï massif and flow from east to west. The main wadi in the studied area, the Batha, is formed by the confluence of the Betea and Achaw wadis, and its watershed covers approximately 63,000 km2 (Figure 1). In its lower course, the Batha captures the tributaries of the Guera Massif and joins the Lake during the rainy season when its average flow exceeds 2100 m3/yr. On the other hand, in the northern part of the Batha basin, the watercourses either join the Bahr el Gazal to the west or are lost in the dune formations to the north. Along the western boundary of the study area, the Bahr El Gazal follows an almost straight route with a north–south orientation. Historically, this paleo-valley was active during regional humid periods, allowing the transfer of water from Lake Chad to the Bodele depression. However, in recent decades, this river only flowed over a few tens of kilometers in relation to the strong floods of the Chari and the maximum level of the southern part of Lake Chad.
In West Africa, the climate strongly depends on the displacement of the inter-tropical convergence zone (ITCZ) [31]. During the monsoon period, the latitudinal position of the ITCZ determines the annual average precipitation [32]. Long term studies [33,34] on the Sahelian rainfall regime have successively recorded wet (1950–1969) and dry (1970–1989) periods causing droughts with disastrous consequences on human activities [35]. More recently (1990–2007), the central Sahel experienced a wetter period with an increase in precipitation of 10% compared to the previous dry period, which remains much lower than the wet period of 1950–1969 [36].
From north to south, the eastern basin of Chad (Figure 1) extends over two distinct climatic zones: Saharo-Sahelian (hyper-arid to arid) and Sahelo-Sudanian (semi-arid), both directly influenced by the Intertropical Convergence Zone (ITCZ). In the study area, average precipitation levels vary from 200 to 400 mm/year in Ati and Oum-hadjer to 600 mm/year in Yao (Figure 2). As a result, the region is subject to two distinct periods: a wet season from June to October and a dry season throughout the rest of the year. Temperature variations in the area oscillate between 15 °C and 44 °C, with an annual average of 28 °C.

Figure 2.
Monthly average precipitation (P) and temperature (T). Recording periods: 1990–2020 for the Yao, Ati, Oumhadjer stations and 1964–2020 for the N’Djamena station.
The study area is characterized by different types of soil [37]. Vertisol and hydromorphic soils are widespread around Lake Fitri and along the Batha river. To the north of this domain, halomorphic soils become dominant and occupy the inter-dune depressions. To the east of this area, mineral soils dominate the landscape. The southern edge of the basin is the domain of isohumic and ferriginous soils with a high content of sesquioxides, a sign of a minimal iron leaching. This feature adds a notable element to the soil composition, contributing to the overall diversity and complexity of the region’s soil profile.
2.1.2. Geological Settings
The geology of the study area (Figure 3) is part of the geological history of the Chad Basin since the Precambrian period. The Precambrian basement crops out particularly to the east and south of the area but also emerges in the form of inselbergs towards Oum Hadjar and around Lake Fitri [38]. Most inselbergs are mainly composed of granite, quartzite, and paragneiss enclaves, which are associated with basic or rhyolite rocks. At outcrops, these basement rocks can be coherent or broken up into arenas. On the southern limit of the Batha basin, the basement configuration defines a graben structure that has been delineated [39,40] using data from borehole BS11 as a reference (Figure 4).

Figure 3.
Geological map of the Batha basin. AB, CD: cross-sections.
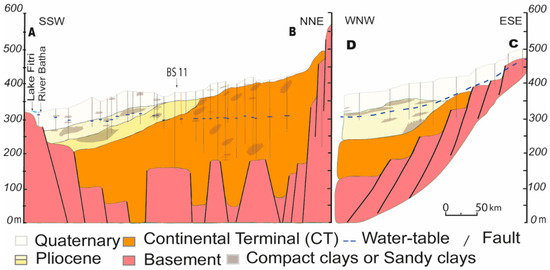
Figure 4.
Cross-sections oriented SSW–NNE (A,B) and ESE–WNW (C,D).
The sedimentary cover is composed of deposits from the Tertiary to the Quaternary [41,42,43,44], which all outcrop in the study area. From east to west, the lithology and thickness of these formations are variable [45,46]. In the studied area, the oldest sediments overlying the Precambrian rocks are Eocene in age, regionally called the Continental Terminal (CT) [39]. They correspond to fluvial and lacustrine deposits intercalated with sandy clays with ferruginous horizons and occasional oolitic beds [47]. In the southeastern part of the region, the top of the CT constitutes the substratum of the Quaternary deposits; the transition between the two is generally marked by the presence of lateritic clays or ferruginous sands. This west-east beveling of the CT is accompanied by a significant thickness variation, ranging from 100 to 350 m in the central zone (Figure 4) and from 10 to 50 m to the east of the area.
The Pliocene formation (Figure 4) occupies almost the entire eastern part of the Chad Basin. It corresponds to lacustrine to limnic deposits composed of clayey sand, as well as gray and green clays associated with thin layers of gypsum at the top and base of the formation [38]. The boundary between the Upper and Middle Pliocene, the Pliocene-CT, and the Pliocene-Quaternary is marked by iron-rich lateritic deposits, fine silty sand, or consolidated sandstone observed at different depths.
The top of the sequence ends with Quaternary formations showing Pleistocene deposits and recent Holocene alluvium, dune sand, and clayey sand. These deposits include an alternation of sandy layers of fluvial origin and clayey deposits of lacustrine origin. The thickness of the Quaternary formation varies, reaching 40 m towards the southeast and less than 3 m towards the north.
All these lithological variations reveal the geological processes that have shaped this part of the Chad Basin, in relation to the evolution of the size of Lake Chad, over time. Today, the Lake Chad basin has a denser hydrographic network in the south, the most important of which is the Chari-Logone sub-basin, which contributes 90% to the water supply of the lake, and the rest corresponds to the contribution of Batha, which drains the waters of the Guera and Ouaddai massifs [48]. The Batha watershed, located in the center of the Chad Basin, feeds Lake Fitri. This was an integral part of the “Mega Lake Chad” period 6 million years ago. At that time, it was assimilated to the mega-lake area until its maximum extension around 5700 years BP [34,49]. From this date, Lake Chad regressed continuously to reach its current state at around 4000 years BP, although 2500 years ago, the lake still overflowed into the Bahr El Gazal. It was during this period that the Batha sub-basin became individualized.
2.2. Available Data
Climatic data, including temperature (°C), precipitation (mm), and evaporation (mm), were collected from the Yao, Ati, and Oumhadjer rainfall stations. The various lithological data collected during this study come from the Ministry of Urban and Rural Hydraulics through the CDIG Documentation Centre (Chad) [50]. These datasets also include detailed lithology information obtained from technical drilling sections, as well as data from pumping tests.
To supplement the existing data, we carried out a sampling campaign during the high-water period (November 2021) in water wells, rivers, and Lake Fitri (Figure 5). The collected data gives an overview of the piezometric parameters (altitude of water points and piezometric level) and physico-chemical properties (T°C, pH, conductivity, total dissolved solids (TDS), and major ions). The samples are distributed between the main aquifers: basement (15 samples), Eocene (CT) (28 samples), Pliocene (3 samples), Quaternary (15 samples), and surface waters (4 samples).

Figure 5.
Piezometric map of the Batha groundwater system during the dry season (November 2021). Colored dots: head measurements in each layer.
Piezometric levels were measured in 61 groundwater wells using a piezometer probe. Physico-chemical parameters such as temperature (T and °C), pH, and electrical conductivity (EC, µS/cm) were measured in situ at all sampling points using a pH-meter and a conductivity meter (Portable Multiparameter HACH (Hq40d) with LDO101, pHC301, and CDC40101 probes). Water sampling was specifically carried out on operational water boreholes. For chemical analyses, the collected samples were filtered using 0.45 µm pore size membranes to avoid the suspended particles and stored in ready-to-use dry polyethylene bottles, pre-washed with 10% HNO3 and rinsed thoroughly with distilled water. Sampling materials and packaging were provided by the National Laboratory of Water Analysis of N’Djamena, Chad. For isotope analyses, samples were collected in ready-to-use glass bottles supplied by the International Atomic Energy Agency (IAEA). All bottles, polyethylene and glass, were filled to the top and capped tightly to avoid evaporation and exchange of sample water with atmospheric materials.
For major ions, 65 samples were analyzed. For isotope geochemistry, 18O and 2H (65 samples) and 3H (44 samples) were analyzed. Recent data of 2H and 18O were collected from the Global Network for Isotopes in Precipitation (GNIP) [51] for stations 6,475,800 (Mongo) and 6,470,000 (N’Djamena) to determine the local meteoric line for the study area. This meteoric line refers to stable isotope concentrations in precipitation.
The major ions were analyzed at the Maâmora Nuclear Studies Centre (CENM) of Rabat (Morocco). The determination of Cl−, NO2−, NO3−, and SO42− anions was carried out by ion chromatography (test method reference PSR/LASI/07). The determination of Na+, K+, Ca2+, and Mg2+ cations was carried out by ion chromatography (test method reference PSR/LASI/08). The Laboratory of Radio-Analysis and Environment (Sfax, Tunisia) carried out the analysis of the isotopes 18O, 2H, and 3H.
2.3. Analytical Procedures
Data quality was considered good when the calculated ionic balance was less than ±1%. Water facies were determined by projecting the chemical analyses onto the Piper diagram [52], facilitated by the use of XLSTAT [53]. Then, each facies was precisely described using classic statistical parameters and their representation (box plots).
To understand the chemical processes governing water mineralization in the different facies of the Batha hydrogeological system, hydrochemical data were analyzed using conventional methods. To differentiate the contribution of rainfall, water-rock interaction, and evaporation, the Gibbs plot was employed, which is a method widely used in semi-arid environments [54,55]. The contribution of other processes such as base-exchange and ionic equilibrium was investigated using binary diagrams. Additionally, the possibility of dissolution-precipitation processes between waters and specific minerals was investigated using the indices of saturation (IS):
where IAP is the ion activity product, which is the product of the activities of the ions in solution that form the mineral; Ks is the solubility product constant of the mineral. The activities have been calculated using the generalized Debye–Hückel equation [56], and values of Ks correspond to those of the main salts found in evaporitic environments [57].
IS = log (IAP/Ks)
Additionally, the groundwater quality intended for consumption and various human activities was assessed using several criteria. Particular attention was paid to the suitability for irrigation given the importance of agriculture in this basin. This holistic approach, integrating various analytical methods and indices, contributes to a comprehensive understanding of the hydrogeochemical characteristics of the studied area and its suitability for different uses, including agriculture and human consumption.
3. Results
3.1. Hydrogeological System
As described in the geological section, the study area is a multi-layered hydrogeological system. Furthermore, it is essential to distinguish between the basement zone, where groundwater flows in a fractured environment with variable porosity between weathering profiles and consolidated parent rock, and the sedimentary cover, where circulation is influenced by lithological heterogeneities (alternation of clastic and clayey deposits or lateral variations), the sometimes highly variable thickness of the formations, and their transitions (angular unconformities and consolidated ferruginous horizons).
The Batha hydrogeological system constitutes the main water supply for the population. However, the productivity of pumping wells is generally low due to the low permeability of clays and clayey sands constituting the sedimentary reservoirs [38]. The measured groundwater levels show that the sedimentary and the basement aquifers inter-communicate with each other, taking into account the lack of continuity of the clay layers. Moreover, these measurements reveal that, overall, this multilayer system behaves as an unconfined system.
To analyze the groundwater flow direction, a piezometric map was generated using the measured groundwater levels (Figure 5). This map illustrates the dynamics of the groundwater and the various relationships that exist. The general flow is oriented southeast to northwest, moving from the basement to the Quaternary. At the southwestern limit, the lack of data makes it difficult to strictly define the watershed between the Batha basin and the Chari-Baguirmi depression further south. However, the map shows the existence of a depression near Ambassatna (wells 16 and 17), northeast of Lake Fitri. This piezometric depression appears to be the southernmost extension of the vast Bodele depression, which includes the upper reaches of the Bahr El Gazal. Hydraulic gradients are very variable throughout the system. In the basement, the gradients are relatively high, which is probably linked to poorly developed fracturing. In the sedimentary part, high gradients as well as lower gradients are present. This variability is linked to the presence (or absence) of clays in these formations.
On the south-eastern edge of the basin, groundwater flows from the basement towards the Batha. A comparison between the altitude of the river and the water table shows that there is no direct relationship between the two entities, except downstream, particularly in the town of Ati, where the two levels practically coincide during the high-water period (October–November). It also appears that the hydraulic gradient (i) varies considerably from the bedrock (17/1000) to the Batha (1/1000) and beyond to the Bodelé depression (0.7 to 0.4/1000). The hydraulic gradient is therefore low in sedimentary formations. Overall, the piezometric contours show similar shapes, indicating that there is no continuous aquitard between aquifers but rather relative aquitards in certain areas. This suggests that the geological structure favors the interconnection of aquifer levels.
3.2. Geochemistry of Major Ions
The descriptive statistics of hydrochemical data for the entire dataset, along with the World Health Organization standards [58], are presented in Table 1. The range for total dissolved solids (TDS) values varies from a minimum of 42 to a maximum of 13,734 mg/L. The lowest TDS is observed in the Eocene (CT) geological formation, while the highest is found in the recent Quaternary.

Table 1.
Descriptive statistics of hydrochemical parameters by geological units. EC: electrical conductivity (µS/cm) at 25 °C; TDS: total dissolved solids; SD: standard deviation; CT: Continental Terminal. Concentration in mg/L.
For the basement aquifer, the TDS ranges from 184 to 4133 mg/L, electrical conductivity (EC) from 187 to 4240 µS/cm, and pH from 6.6 to 9.0. In the CT aquifer, the maximum and minimum values of TDS, EC, and pH range vary from 42 to 552 mg/L, 53 to 646 µS/cm, and 6.3 to 8, respectively. The Pliocene aquifer has limited data but exhibits a TDS of 133 to 202 mg/L, a conductivity of 151 to 246 µS/cm, and a pH between 7 and 7.3. For the Quaternary aquifer, the ancient Quaternary has TDS values of 87 to 108 mg/L, a conductivity range of 102 to 131 µS/cm, and a pH varying between 6.7 and 8. In contrast, the recent Quaternary displays a wider range, with TDS varying from 393 to 13,734 mg/L, conductivity from 507 to 12,480 µS/cm, and pH from 6.9 to 9.4.
3.2.1. Piper Diagram
The projection of the chemical compositions of the waters of the Batha basin on the Piper diagram (Figure 6) makes it possible to identify three main types of facies, classified according to their dominant cations and anions. The primary facies (66%), in terms of composition, corresponds to a calcium bicarbonate facies (Ca-HCO3), observed in all layers. The second most common facies (22%) is the sodium bicarbonate facies (Na-HCO3), which is found in the Quaternary, Eocene (CT), and basement. The third facies (11%), the sodium sulfate facies (Na-SO4), is specific to the Quaternary aquifer. Finally, mixed facies are observed very sporadically, such as the Na-Mg-HCO3-SO4 facies (Quaternary and basement) and the Ca-Na-Mg-Cl-HCO3 facies (basement only).
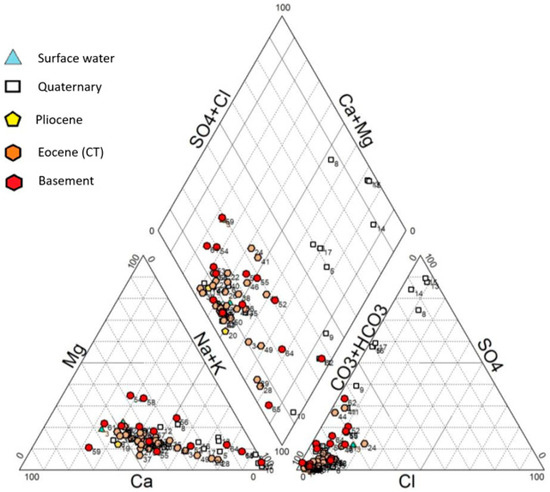
Figure 6.
Plot of hydrochemical data on a Piper diagram.
3.2.2. Ca-HCO3 or Ca-Na-Mg-HCO3 Facies
Using quartiles (Q1 and Q3) as cutoff values for major ions concentrations, it is noted that the Ca-HCO3 facies determined using the Piper diagram can be better defined as Ca-Na-Mg-HCO3. It is associated with waters characterized (Figure 7) by a pH close to neutral to slightly alkaline (6.49–7.84) in all aquifers except surface waters, which have a higher alkalinity (8.95–9.23). However, the basement waters have the highest TDS values (331–677 µS/cm), while in other aquifers, the values vary between 88 and 182 µS/cm. Furthermore, compared to the median values, the average amplitude of TDS values is low in surface waters (13.2%), Quaternary waters (8.4%), and Pliocene waters (10.6%) but higher in Eocene waters (26.0%) and basement waters (21.9%), indicating the degree of heterogeneity of the different aquifers.

Figure 7.
Variations of the main chemical parameters within the Ca-Na-Mg-HCO3 facies in each aquifer and in surface water. Limits of the boxplots are the quartiles Q1 and Q3.
In this facies, Ca2+ concentrations vary from 0.47 to 1.02 meq/L in surface waters and the different sedimentary reservoirs but vary from 1.49 to 3.17 meq/L in the basement. The same observation applies to Mg2+ (0.13–0.37 meq/L vs. 0.60–1.80 meq/L) and Na+ (0.28–10.86 meq/L vs. 1.17–1.62 meq/L), while for K+ concentrations, the variability in surface and sedimentary waters (0.08–0.22 meq/L) is equivalent to that of the basement (0.09–0.17 meq/L). Regarding the anions, their maximum concentrations are all observed in the basement (3.11 < HCO3− < 4.04 meq/L; 0.30 < SO42− < 0.58 meq/L; 0.16 < Cl− < 0.42 meq/L). In the sedimentary reservoirs, bicarbonate concentrations do not exceed 2.0 meq/L. Chlorides are present in small quantities ranging from 0.05–0.20 meq/L in the sedimentary reservoirs. Their highest concentrations are found in surface and Pliocene waters. Finally, sulfate concentrations are very low (0.01–0.04 meq/L) and reach their maximum in the surface waters.
3.2.3. Na-HCO3 or Na-Ca-HCO3 Facies
As before, quartiles Q1 and Q3 show that these facies are more accurately defined as a Na-Ca-HCO3 facies, which is only present in the Quaternary, Eocene, and basement reservoirs. These waters are characterized (Figure 8) by slightly alkaline pH values in the Eocene (7.19–7.63) and basement (7.47–7.91) and alkaline pH values in the Quaternary (8.41–9.15). In terms of mineralization, the TDS values are low in the Eocene (167–314 µS/cm), moderate in the basement (403–479 µS/cm), and quite high in the Quaternary (675–1653 µS/cm).

Figure 8.
Variations of the main chemical parameters within the Na-Ca HCO3 facies in Quaternary, Eocene, and basement aquifers.
Na+ concentrations are highest and show the greatest degree of variability in the Quaternary (5.77–20.19 meq/L), while in the Eocene (1.38–2.20 meq/L) and basement (2.62–3.49 meq/L), they are lower and vary little. This distinction does not exist with Ca2+, which has concentration ranges that overlap and are generally between 0.37 and 2.92 meq/L. However, Mg2+ concentrations in this facies seem to be specific to each reservoir: Quaternary (0.65–1.46 meq/L), basement (0.59–0.79 meq/L), and Eocene (0.14–0.38 meq/L). Finally, K+ concentrations are low in the Quaternary (0.40–0.53 meq/L) and very low (0.09–0.16 meq/L) in the Eocene and basement.
Similar to Na+, HCO3— concentrations are the highest and most variable in the Quaternary (7.41–12.83 meq/L) and the lowest in the basement (3.27–4.04 meq/L) and especially in the Eocene (1.90–3.09 meq/L). The same behavior exists for sulfates and chlorides: Quaternary (0.46 > SO42− > 4.36 meq/L; 0.22 > Cl− > 0.98 meq/L), basement (0.28 > SO42− > 0.73 meq/L; 0.22 > Cl− > 0.54 meq/L), and Eocene (0.06 > SO42− > 0.77 meq/L: 0.08 > Cl− > 0.18 meq/L).
3.2.4. Na-SO4 or Na-Ca-Mg-SO4 Facies
This facies is specific to Quaternary waters (Table 1) and is characterized by slightly alkaline pH values (7.43–8.09). However, these are highly mineralized waters, as indicated by their high TDS values (1077–8024 µS/cm). Although the major cation is Na+ (9.4–82.2 meq/L), it is associated with significant amounts of Ca2+ (3.0–16.4 meq/L) and Mg2+ (1.6–16.0 meq/L). It is also associated with potassium, which is the minor cation (0.4–1.6 meq/L). Likewise, if SO42− concentrations are dominant (8.4–104.0 meq/L), bicarbonates are also abundant (5.4–6.9 meq/L) compared to the highest concentrations observed in strictly bicarbonate facies. Finally, Cl− concentrations vary considerably (0.3–8.6 meq/L).
3.2.5. Mixed Facies
These atypical facies, sulfate-bicarbonate (Na-Mg-HCO3-SO4) or chloride-bicarbonate (Ca-Na-Mg-Cl-HCO3), were only observed sporadically (Table 1). They correspond to highly or very highly mineralized waters with electrical conductivity values of up to 5375 µS/cm, and they are practically neutral (6.80 > pH > 7.49). These compositions are probably explained by localized evaporation phenomena and/or the mixing of waters from different facies.
3.2.6. Spatial Distribution
The projection of the chemical compositions of the Batha basin waters on Piper diagrams allowed the identification of different facies types. Their spatial distribution is shown on Figure 9. The calcium bicarbonate facies (Ca-HCO3) is found throughout the Batha river and further north in the CT formation at the foot of the Ouaddai massif. The sodium bicarbonate facies (Na-HCO3) is also present, but in a dispersed manner, in the Quaternary, Eocene (CT), and basement. However, it is absent in surface and Pliocene waters. The sodium sulfate facies (Na-SO4) is specific to the Quaternary reservoirs in areas with high electrical conductivity. These observations highlight the variations in concentrations and facies in the Batha basin waters, indicating the heterogeneity of the chemical composition of the different reservoirs. It is also important to note the transition from the calcium bicarbonate facies to the sodium bicarbonate facies, particularly in the CT formation.
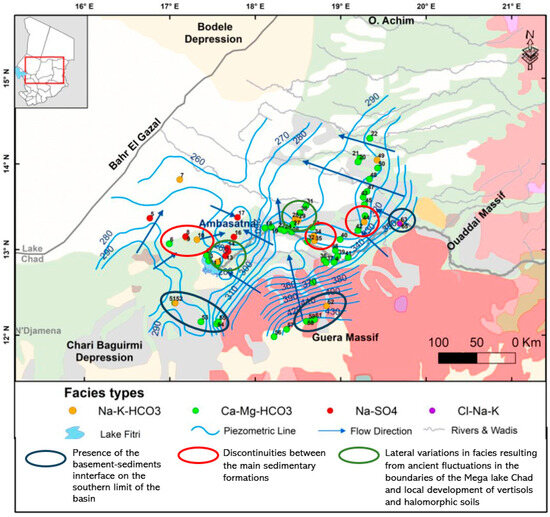
Figure 9.
Spatial distribution of hydrochemical facies coupled with the piezometric map.
3.3. Water Quality
In the Batha basin, human activities mainly depend on groundwater due to the low and irregular nature of precipitation, which does not allow permanent surface runoff. Therefore, qualitative and quantitative assessment of groundwater is essential for water resource management in this region. Several criteria [59,60,61,62,63,64,65,66,67] have been used to assess water quality.
The quality of water intended for human consumption and domestic use was assessed based on standards set by the World Health Organization [58]. The results (Table 1) show that recent Quaternary waters (excluding K+) and basement waters (excluding Mg2+, K+, and Cl−) have values exceeding the recommended limits. The CT formation has a bicarbonate value that exceeds the WHO’s recommended standard. The pH of surface waters, ranging from 8.1 to 9.2, is higher than the recommended limit.
For the use of groundwater for irrigation, there is currently a common understanding that associated problems can be classified into three mains groups: salinity hazards, infiltration and soil permeability problems, and toxicity and various hazards [68,69]. The salinity risk hazard consists of soil salinization when irrigation water has a high salt content. Soil salinization is an irreversible process that renders agricultural lands unusable. The amount of salts dissolved in waters can be measured using electrical conductivity (EC, μS/cm). Waters with an EC < 700 μS/cm are ideal for irrigation. EC values in the range of 700–3000 μS/cm characterize waters acceptable for irrigation. Waters with high EC values (>3000 μS/cm) are unsuitable and pose a serious hazard to the environment. Within the Batha system, 90% of the samples coming from all water bodies (river and aquifers) are well suited and acceptable for irrigation. Only seven samples (six from the Quaternary aquifer and one from the basement) are unsuitable for irrigation (Table 2).
Table 2.
Results of the characterization of the water quality for irrigation in the Batha basin. EC: electrical conductivity; SAR: sodium absorption ratio.
Problems related to infiltration and soil permeability, caused by irrigation water, may be analyzed using the sodium absorption ratio (SAR), computed as follows:
where [Na+], [Ca++], and [Mg++] are the concentrations of sodium, calcium, and magnesium in milliequivalents per liter. The SAR is an indicator to assess the potential infiltration hazards associated with irrigation water. High SAR values are indicators of a significant risk of sodium-induced dispersion and soil structure problems, which ultimately may prevent water infiltration into the soil profile [70,71,72]. The following SAR value thresholds are commonly used to classify water suitable for irrigation: SAR < 10—Good Quality, no restriction on use; 10 ≤ SAR < 18—Acceptable Quality; SAR ≥ 18—Non-Acceptable Quality [73,74,75]. In the present study, a large part of the samples (89%), from the river and from all aquifers, is considered as of good to acceptable quality for irrigation (Table 2). The remaining samples, deemed unacceptable, come from the Quaternary (six samples) and the basement (one sample). It should be noted that both criteria (EC and SAR) discriminate the same groundwater samples as being incompatible with the practice of rational irrigation. The SAR and EC data were plotted on a SAR vs. EC diagram (Figure 10).
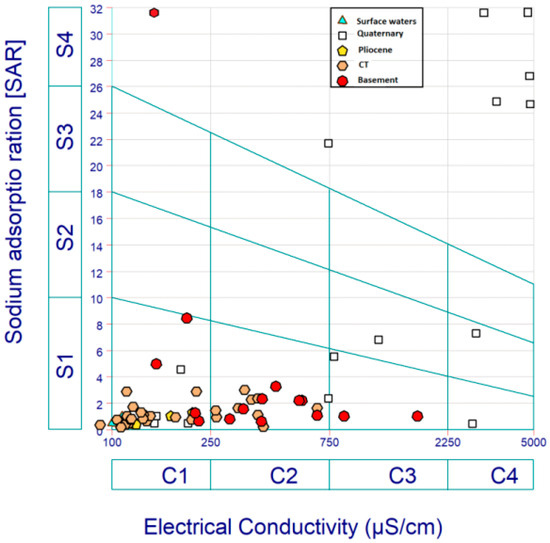
Figure 10.
Riverside diagram: EC vs. SAR diagram discriminating water quality in the Batha basin.
This diagram [73], sometimes referred to as the Riverside diagram [76,77], is very helpful to enhance the analysis of SAR and EC. It should be noted that the SAR classes are equivalent to those used above, but the EC classes are slightly different. Nonetheless, this diagram allows the definition of a combined EC-SAR criterion. Different zones are specified on the diagram to guide interpretation:
- –
- Safe Zones: Low SAR and low EC values, indicating water with low sodium content and low salinity, which is generally well suited for irrigation (S1C1, S1C2).
- –
- Sodicity Hazard Zone: High SAR values but low EC, suggesting a risk of sodium-related issues in the soil despite low salinity (S3C1, S3C2).
- –
- Salinity Hazard Zone: High EC values regardless of SAR, indicating a risk of soil salinity issues (all C3 and C4 zones).
- –
- Combined Sodicity and Salinity Hazard Zone: High SAR and high EC values, signaling a risk of both sodium-related and salinity issues in the soil (all combinations of S3–S4 with C3–C4 zones).
Most of the samples fall into the C1S1 (54% of samples) and C1S2 (26%) domains, corresponding to good quality irrigation water. The first domain includes all waters of the entire Batha system, while the second is specific to the waters from the basement and the Continental Terminal. Two other domains stand out with high conductivity values, C3-C4-S1-S2 (7%) and C4S4 (13%), corresponding to poor to very poor quality water previously discriminated by the EC and SAR criteria. These types of water are specifically associated with the basement near the city of Mongo and the recent Quaternary located in a very localized area corresponding to the Ambasatna piezometric depression.
Among other risks, chloride is commonly present in irrigation water. The threshold value generally used for chloride concentrations in irrigation water is 140 mg/L. Only three wells, part of the points eliminated by the above criteria, have a chloride concentration exceeding 140 mg/L. In the remaining wells, the chloride concentration statistics are maximum = 111.8 mg/L, minimum = 1.3 mg/L, and average = 12.3 mg/L, showing that the chloride hazard is very reduced in the Batha system.
Toxicity due to the presence of trace elements, specifically heavy metals, in irrigation waters can pose a serious risk [78,79]. Heavy metals originate generally from industrial activities, which are absent in the Batha region. This type of risk can reasonably be eliminated in the study area.
In the eastern and southern regions, predominantly good quality waters are found. In the northern and eastern regions of Lake Fitri, poor water quality is observed. Water of moderately acceptable quality is found in the Ati region. These observations show that water quality changes from the periphery to the center of the study area. Water quality deteriorates as one moves towards the center, particularly in the southern and western parts of the area.
Despite the general trends, the observations demonstrate that across the entire study area, variations in water quality can change rapidly between two nearby points. These rapid changes can be explained by lithological heterogeneity due to (i) the presence of the basement-sediment interface on the southern edge of the basin, (ii) the discontinuities between the main sedimentary formations, and (iii) the lateral variations of the facies (fluvial-lacustrine vs. detrital) within a specific formation, resulting from ancient fluctuations in the boundaries of the mega Lake Chad and the local development of vertisols and halomorphic soils (Figure 9).
4. Discussion
4.1. Origin of the Mineralization
To understand the mechanisms that can control water mineralization, the Gibbs diagram, displaying TDS vs. (Na+K)/(Na+K+Ca), was applied [80]. This diagram has been successfully used to understand and differentiate the influences of rock–water interactions, evaporation, and precipitation in different semi-arid contexts [61,81,82,83]. The Gibbs diagram (Figure 11) indicates that the ionic compositions of the waters of the Batha zone are mainly influenced by rock and mineral weathering (74%), while the contribution of meteoric inputs is minor (17%), and the evaporation process (9%) is essentially correlated with the Quaternary reservoir. In more detail, the importance of these global processes explains the inter-ionic relationships observed in the different facies, reflecting the phenomena of base-exchange and dissolution/precipitation of minerals, i.e., the saturation state of the solutions with respect to minerals.

Figure 11.
Plot on Gibbs diagram of surface waters and groundwaters from the aquifers of the Batha system.
4.2. Ionic Equilibrium
These processes can be determined by studying the relationships between the major ions in solution for each bicarbonate and sulfate facies. In the Ca-Na-Mg-HCO3 facies, the relationships between the dominant cations (Ca and Na) correspond to Na/Ca ratios mostly ranging from 1:1 to 2.5:1 (Figure 12A). As a secondary cation, Mg shows a strong association with Ca in a Mg/Ca ratio close to 2.5:1 (Figure 12B), except for the basement waters where there is no correlation between these two elements. The relationships between these cations and bicarbonate display mainly ratios of 1:2, 2:3, and 1:1 in the relationships with Ca (Figure 12C), Ca + Mg (Figure 12D), and Ca + Na (Figure 12E), respectively. Finally, the compositions projected on the (Ca+Na+Mg) vs. HCO3 diagram (Figure 12F) align almost all along the 1:1 line, with the exception of the Quaternary waters, which are undersaturated in HCO3.
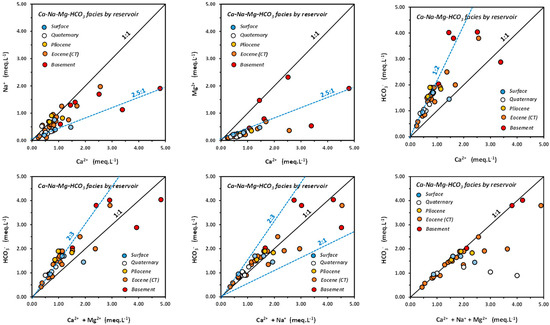
Figure 12.
Ionic relationships within the Ca-Na-Mg-HCO3 facies waters from different aquifers.
For the Na-Ca-HCO3 facies, it is noted that, when considering only sodium, all the points (Figure 13A) are close to the 1:1 line, with the exception of the Quaternary waters, which are oversaturated in bicarbonates. However, these same waters align along this line when considering the sum of Na and Ca (Figure 13B). In reservoirs with this facies, the water chemistry is primarily controlled by sodium bicarbonates, except in the Quaternary, where sodium-calcium bicarbonates also influence the equilibrium.
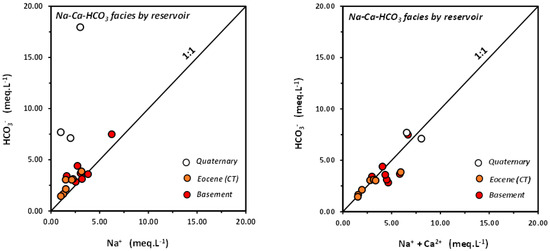
Figure 13.
Ionic relationships within the Na-Ca-HCO3 facies waters from different aquifers in the Batha basin.
Based on the observed ionic ratios, these results suggest that the chemistry of the bicarbonate facies waters is possibly controlled by an equilibria with phases that have compositions ranging from a magnesium-rich calcite-type calcium carbonate (Ca0.8–0.7Mg0.2–0.3)CO3, sodium carbonates such as natron (Na2CO3,10H2O), thermonatrite (NaCO3,H2O), and nahcolite (NaHCO3), and sodium-calcium carbonates such as pirssonite (NaCa(CO3)2,2H2O) and gaylussite (Na2Ca(CO3)2,5H2O).
The Na-SO4 facies specific to the Quaternary shows a balance between Na and SO4 for the lowest Na concentrations (Figure 14A) but a slight oversaturation in bicarbonates for higher Na concentrations. When Ca is considered, a very strong sulfate oversaturation is observed (Figure 14B), indicating that these waters are not in equilibrium with a calcium sulfate such as gypsum (CaSO4,2H2O). However, in the (Na+Ca) vs. SO4 diagram (Figure 14C), all the points are practically on the 1:1 equilibrium line, and this observation is only slightly modified when adding Mg (Figure 14D). Therefore, it appears that the chemistry of the sulfate facies in the Quaternary waters is mainly controlled by sodium sulfates and to a lesser extent by sodium-calcium sulfates.
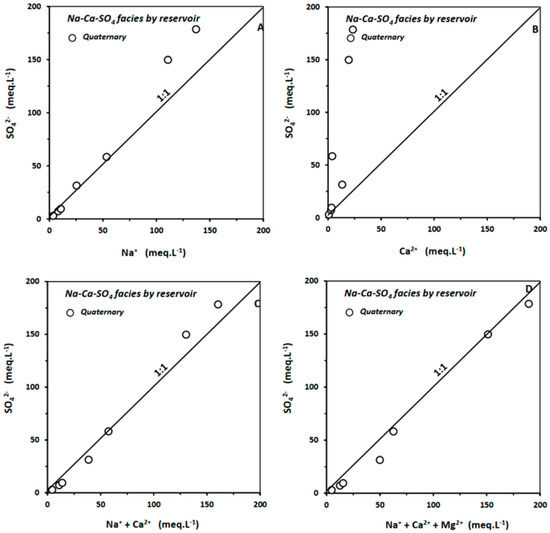
Figure 14.
Ionic relationships in the Na-Ca-SO4 facies waters from different aquifers in the Batha basin.
4.3. Contribution of Base Exchanges to Ionic Equilibria
The base-exchange phenomena can be highlighted by the relationship [(Ca2+ + Mg2+) − (HCO3- + SO42−)] as a function of [Na+ + K+ − Cl−] [84]. The existence of exchange is reflected in the relationship of slope −1. For both coordinates, the substraction of anions allows the elimination of ions derived from dissolution reactions of carbonate and evaporitic minerals. In the absence of such base-exchange reactions, all representative sample points should be found near the origin point [85].
For Batha waters, all compositions fall within the domain of Ca2+ fixation and Na+ release (Figure 15). However, base-exchange is almost negligible for the calcium bicarbonate facies and very weak for the sodium bicarbonate facies. It only becomes significant for the sulfate-sodium facies. In the case of mixed facies containing both bicarbonates and sulfates, their compositions may indicate significant exchanges (basement and Quaternary) or almost zero (basement).
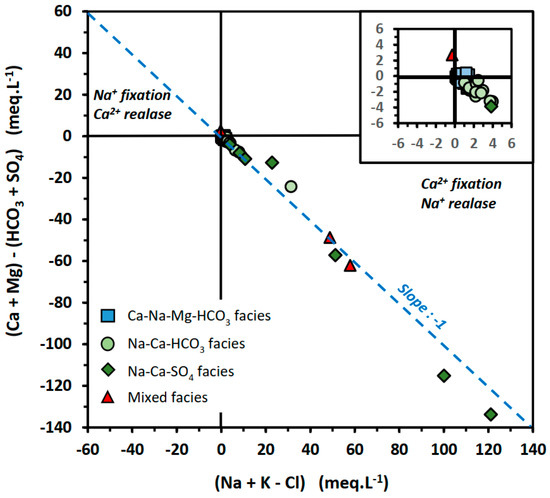
Figure 15.
Chemical compositions of the different water facies in the Batha basin.
4.4. Indices of Saturation
The indices of saturation (IS) of the studied waters were calculated for carbonate and sulfate minerals, whose chemical composition is suggested by equilibrium diagrams and in agreement with studies carried out in the Lake Chad system [60]. The IS values obtained for the Ca-Na-Mg-HCO3 facies (Figure 16A) show that these waters are supersaturated in dolomite, particularly in the Eocene and basement where the IS can exceed +6, but are practically in equilibrium with a Mg-calcite with a composition close to (Ca0.8Mg0.2)CO3. On the other hand, they are undersaturated in sodium carbonates (natron and nahcolite) and sodium-calcium carbonates (gaylussite), with IS values > −5, except for gaylussite in the case of Eocene and basement waters (−3 < ISmax < −2). Concerning sulfates, these waters are slightly undersaturated with calcium sulfate (−4 < ISgypsum < −1) but very unsaturated (−8 < IS) in sodium sulfate (mirabilite) and in sodium-calcium sulfate (glauberite).
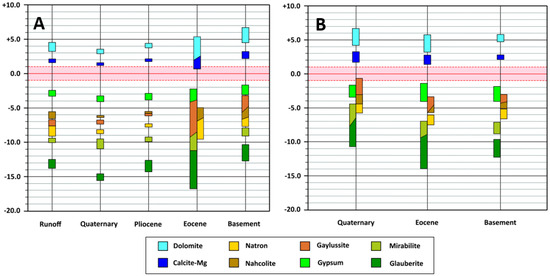
Figure 16.
Saturation indices of the major salts in the Ca-Na-Mg-HCO3 (A) and Na-Ca-HCO3 (B) bicarbonate facies.
In the Na-Ca-HCO3 facies (Figure 16B), the degree of over-saturation in carbonate (dolomite and Mg-calcite) is even higher than in the previous facies. In addition, the degree of sodium carbonate undersaturation decreases clearly (IS > −5), except for natron, which remains below this value, while for the most mineralized Quaternary waters, gaylussite is in equilibrium. Compared to waters of the Ca-Na-Mg-HCO3 facies, the degree of sulfate undersaturation is of the same order of magnitude in the Eocene and in the basement but decreases in the Quaternary.
The waters of the Na-Ca-Mg-SO4 facies (Figure 17) are highly oversaturated with dolomite but moderately oversaturated in Mg-calcite. On the other hand, for the most mineralized waters, the degree of sulfate undersaturation can be very close (mirabilite and glauberite) or almost at equilibrium (gypsum). It is the same for the Na carbonates and bicarbonates (natron and nahcolite), and, in particular, gaylussite, which can be in equilibrium.
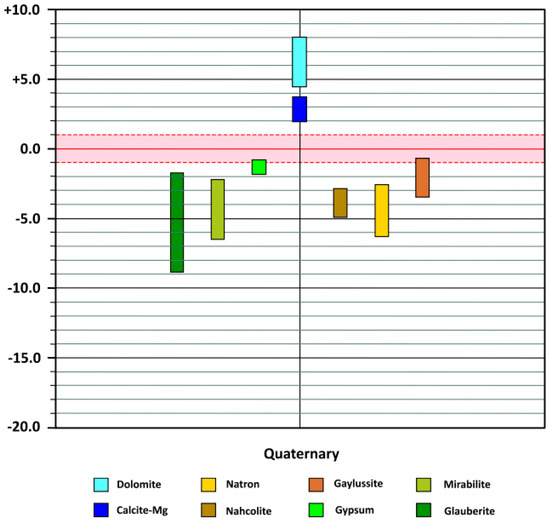
Figure 17.
Saturation indices of the major salts in the Na-Ca-Mg-SO4 sulfate facies in the Quaternary aquifer of the Batha basin.
According to the classic model of Chebotarev [86], which describes the general chemical evolution of groundwater in space and time as a succession of bicarbonate-sulfate-chloride replacements and the acquisition of a composition closer to seawater, it appears that the specific state of groundwater in the Batha basin corresponds to that of a moderately evolved system where bicarbonate facies largely dominate, while the presence of sulfate facies is practically restricted to the Quaternary reservoir and the chloride facies are very rare and localized.
4.5. Assessment of Aquifer Recharge
4.5.1. Regional Rainfall Signature
Isotopic analysis of precipitation provides information on the groundwater input signal. The recently installed Mongo station (2019–2021) is closest to the study area and provides isotopic data, while the other stations (Yao, Ati, and Oum) only provide precipitation and temperature data. Firstly, isotopic rainfall data from Mongo were compared to those from N’Djamena, which is the interregional station providing data over the longest period (1964–2021). The isotopic compositions of precipitation vary as follows: −42.20‰ < δ2H < +24.70‰ and −6.55‰ < δ18O < +2.42‰ in Mongo; and −56.40‰ < δ2H < +56.40‰ and −9.40‰ < δ18O < +9.20‰ in N’Djamena. In both cases, these strong variabilities of the isotopic compositions are linked to the seasonality of temperatures and precipitations, i.e., pre-season, peak season, and post-season (Figure 2). Temperatures are high (33.0 to 34.0 °C), low (26.9 to 29.4 °C), and moderate (28.6 to 31.0 °C), respectively, in pre-season, in peak season, and in post-season. This rainfall-temperature coupling explains why the highest δ18O values are recorded during the pre- and post-seasons and the lowest during the peak season, which directly reflects the impact of evaporation during the hottest months in relation to the lowest relative humidity of the air mass [87].
Although the series recorded at the Mongo station are shorter, the ranges of variation of isotopic contents for each phase are included in the ranges recorded at the N’Djamena station during the same phases. Thus, the isotopic rainfall data from N’Djamena, recorded over a longer period, were taken into account to calculate δ2H and δ18O averages, weighted by precipitation heights. The weighted characteristic averages obtained are −3.72‰ for 18O and −18.91‰ for 2H at the N’Djamena station. The relationships between the stable isotopes δ2H and δ18O in precipitation at the N’Djamena and Mongo stations are shown in Figure 18. The local meteoric water lines (LMWL) at the two stations are close (N’Djamena: δ2H = 6.53 δ18O + 4.2; Mongo: δ2H = 6.89 δ18O + 5.15).
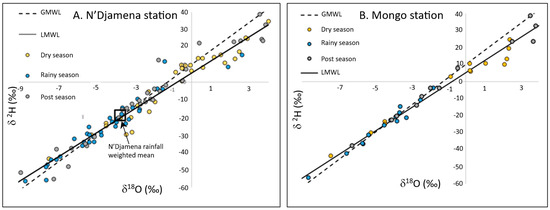
Figure 18.
Stable isotopes δ2H and δ18O relations in precipitation at N’Djamena (A) and Mongo (B) stations. GMWL: global meteoric water line; LMWL: local meteoric water line.
The isotopic compositions of surface water collected at the end of the wet season (November) are very close to those of the precipitation (Lake Fitri: δ2H = +14.10‰ and δ18O = +2.50‰; Batha river: δ2H = +15.80‰ and δ18O = +3.60‰).
4.5.2. Groundwater Recharge Process
The results obtained for all the aquifers of the Batha basin (Table 3) show variations from −45.2 to −14‰ for δ2H, with an average of −29.31‰, and from −6.44 to −1.53‰ for δ18O, with an average of −4.05‰. However, as the system is multilayered and lithologically heterogeneous, it is necessary to compare the isotopic compositions of the layers in order to understand the interconnectivity between different parts of the system.
Table 3.
Descriptive statistics of isotopic data. Statistics of 2H and 18O are in permil, of 3H in TU (tritium unit). SD: standard deviation.
Samples from the basement aquifer show δ2H values ranging from −32.3 to −14‰ (average = −26.08‰) and δ18O values ranging from −5.31 to −2.44‰ (average = −3.87‰). Waters from the CT and Pliocene aquifers have δ2H values ranging from −45.2 to −16.2‰ (average = −31.11‰) and δ18O values from −6.44 to −2.66‰ (average = −4.4‰). Quaternary aquifer waters have δ2H values ranging from −37.3 to −15.2‰ (average = −27.08‰) and δ18O values from −4.99 to −1.53‰ (average = −3.62‰). These observations indicate that it is difficult to differentiate isotopic composition specifically associated with these geological formations. This confirms the existence of a significant hydraulic interconnection between the different aquifers of the system.
All isotopic data (δ2H vs. δ18O) are plotted with the global meteoric water line (GMWL) [88] and the local meteoric water line (LMWL) (Figure 19). Data is plotted on or below both lines (GMWL and LMWL). The range of isotope variability can be clustered into three groups—A, B, and C.
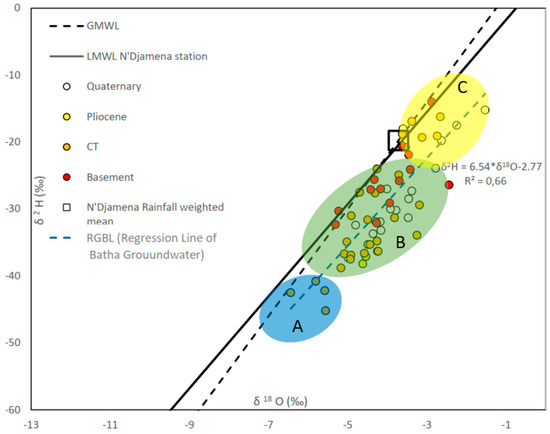
Figure 19.
Diagram δ2H vs. δ18O of the stable isotope composition of the groundwaters of the Batha basin. GMWL: global meteoric water line, LMWL: local meteoric water line.
The three clusters align with a straight line whose equation is δ2H = 6.54*δ18O − 2.77 with the determination coefficient R2 = 0.66, indicating a significant correlation between the stable isotopes for all groundwater in the system. The existence of such a line (Regression Line of Batha Groundwater, RLBG) can be interpreted as the result of a groundwater mixing process. On the other hand, the average value of deuterium excess (d = δ2H − 8* δ18O) of +3.16% is well below 10 and expresses a significant impact of evaporation during groundwater infiltration [89]. Similar values were observed in Chad [90] and in other parts of the Sahel [87,91,92]. Finally, the position of these groups relative to the LMWL reflects varied recharge conditions due to the effects of altitude, seasonality, and/or evaporation.
The samples in cluster A have a very depleted heavy isotope composition, which is classically interpreted as typical ancient groundwaters, without the contribution of modern meteoric waters. This cluster is specific to part of the CT waters.
Cluster B waters, on the other hand, show isotopic compositions widely dispersed from the RLBG to the values belonging to the LMWL. This strong dispersion can be interpreted as the result of more or less significant mixing between rapidly infiltrated rainwater and water evaporated during infiltration. This suggests slow infiltration, allowing evaporation. The last cluster C shows the same trends as those identified in group B but in an exacerbated way, i.e., with a significant contribution from evaporation during the infiltration phase.
With the exception of cluster A groundwater, which can be strictly associated with the CT formation, variations in the isotopic compositions of clusters B and C cannot be associated with any specific aquifer. This result confirms the existence of aquifer connectivity. Furthermore, the dispersion of composition relative to the RLBG indicates a variable degree of evaporation during infiltration, likely due to the impact of lithological heterogeneity.
These isotopic results are consistent with interpretations made for groundwater in the neighboring Lake Chad basin [14,93], characterizing recharge conditions related to the region’s geological structure and topography.
4.5.3. Residence Time
The origin of tritium (3H) in the hydrosphere is exclusively linked to meteoric inputs [94]. On a global scale, the tritium content in precipitation is only a few tritium units (2 to 25 TU) [95,96]. However, atmospheric nuclear tests from 1952 to 1963 significantly increased its level in precipitation, temporarily altering its geochemical fingerprint. As this radioactive isotope does not undergo any reactions in water (chemical reactions, absorption, dissolution, or precipitation), it retains its original geochemical fingerprint, which makes it a relative indicator of groundwater residence time [97,98,99,100,101]. Thus, its half-life (12.43 years) allows the estimation of the modernity of aquifer recharge. Aquifers recharged before nuclear tests (pre-1952) currently have tritium concentrations below 0.65 TU in 1990 and/or below the detection limit [94].
At the regional level, the analysis of the tritium content (Figure 20) of precipitation from the N’Djamena and Mongo stations illustrates significant variations. The results (Table 3) show that surface waters (7.24 TU from Lake Fitri and 6.81 TU from the Batha river) have slightly higher tritium values than current tritium levels in precipitation (4.15–7.3 TU). For groundwaters, all samples analyzed contain detectable tritium, with a strongly variable content in the Quaternary (0.1 to 3.31 TU) and CT (0.02 to 7.1 UT) but low (0.10 to 0.15 TU) in the Pliocene. In the basement, the variability of the tritium content (0.04 to 3.98 TU) is high and of the same order of magnitude as that observed in the Quaternary.
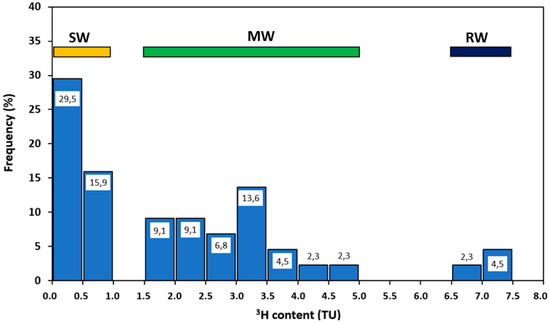
Figure 20.
Distribution of tritium in the Batha basin. RW: rainwater, MW: mixed or modern waters, SW: sub-modern waters.
The histogram of distribution of the tritium content (Figure 20) shows that in the Batha basin, three clearly differentiated types of water coexist such as rainwater (RW), modern and/or mixed waters (MW), and sub-modern waters (SW). These results are consistent with those obtained from stable isotopic compositions (δ2H vs. δ18O), which showed the existence of mixing between present-day water and older water evaporated during infiltration.
The distribution of the 3H data clearly demonstrates the complexity of the hydraulic functioning of this multilayer system, in relation to the aquifers and their structural heterogeneities. In sedimentary zones, lithology and seasonality can play an important role in the distribution of tritium. It is also important to highlight the heterogeneous and discontinuous nature of the lithology within each aquifer, which could have a significant impact on the distribution of tritium content in groundwater.
4.6. Conceptual Model of the Batha Hydrogeological System
These research findings were merged into a general diagram of the functioning of the Batha basin (Figure 21). According to the geographical distribution of isohyets and the regional topography, the highest recharge zones (precipitation: 600–700 mm/yr) correspond to the Guera massif to the south of the studied area. As indicated by the tritium (3H) values, the percolation rate of current meteoric waters (4.15 TU < 3H < 7.3 TU) is strongly dependent on the fracturing of the basement aquifer. In the latter, water can be very recent (3.18 to 3.98 TU) or sub-modern (<0.2 TU). This leads to very different water–rock interaction times, which probably explains their very variable conductivity (196 to 756 µS/cm) while only one carbonate facies (Ca-Na-Mg-HCO3) is observed.
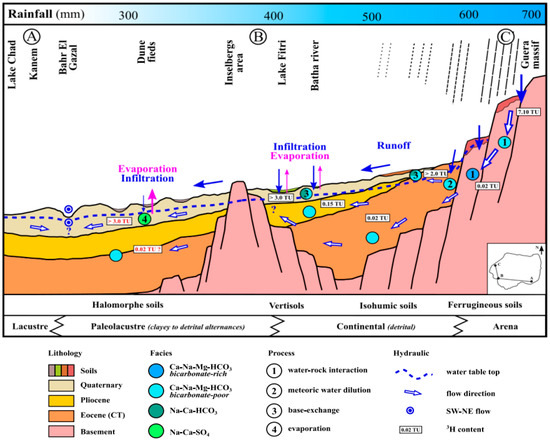
Figure 21.
Conceptual model of the Batha hydrogeological system.
At the contact between the basement and the sedimentary cover, these waters first reach the Eocene deposits or Continental Terminal (CT) formation, which outcrop at the basin’s edge and lie directly on the bedrock. In this area, the average rainfall (600–500 mm/yr) is sufficient so that, over time (0.02 < 3H < 7.10 TU), the direct infiltration rates of runoff water cause an effect of dilution of the basement water. This is suggested by the presence of water with the Ca-Na-Mg-HCO3 facies, with a low or moderate bicarbonate content (25.6 mg/L) and whose conductivity only very occasionally exceeds 270 µS/cm. Under these conditions, the Eocene waters located at depth or under Plio-Quaternary cover have a sub-modern character. The same is true for the Pliocene aquifer, whose moderately bicarbonate waters with the Ca-Na-Mg-HCO3 facies (95–116 mg/L) are not affected by recent recharge (3H < 0.15 TU). The mineralization of the bicarbonate water facies is mainly controlled by a two-phase equilibrium between a calcite-type magnesium carbonate ([Ca0.8Mg0.2]CO3) and gypsum (CaSO4,2H2O).
In the Quaternary reservoir, the recharge is of variable age (0.1 to 3.31 TU), probably due to lithological heterogeneity, with alternations of clayey and sandy deposits, to the nature of the soils (isohumic on the slopes and vertisols in the wadis and local depressions), and to the infiltration-evaporation processes. Taking into account the precipitation (400 mm) in the Lake Fitri area and near the Batha river, it seems that recharge by infiltration is significant (3H up to 3.31 TU) but that evaporation is also an important parameter (TDS > 1000 mg/L). Under these conditions, the seasonality of wet and dry periods can lead to base-exchange (Ca ↔ Na), which would explain the development of an increasingly sodic Na-Ca-HCO3 facies from the foothills of the Guera Massif to the Lake Fitri area. The water chemistry of this latter facies seems to be controlled by an equilibrium between three phases: a double carbonate of the gaylussite type (Na2Ca(CO3),2.5H2O), a Mg-calcite, and gypsum. To the west of the lake, the presence of inselbergs testifies to the rise of the basement. At its contact, certain boreholes showed that the Pliocene and probably Eocene aquifers are locally artesian, which could lead to mixing between their fresh waters and the more saline Quaternary waters. However, when the boreholes are put into operation, this artesianism disappears quite rapidly. This phenomenon is therefore not significant and does not have much impact on the salinity of the waters of the Quaternary aquifer.
To the north, Quaternary deposits are covered by current dune fields, between which halomorphic soils have developed. Their presence indicates that evaporation is the dominant process in the mineralization of water from superficial horizons, and that infiltration becomes minor in this area where rainfall does not exceed 50 mm/yr. In this zone, the interaction between the shallow Quaternary water table and halomorphic soils probably explains the specific development of the Na-Ca-SO4 water facies. This salinization of waters is linked to an increase in sulfate levels, often associated with high bicarbonate levels but very rarely with chloride levels. This agrees with the fact that the waters are in equilibrium with gypsum and are slightly undersaturated with glauberite (Na2Ca[SO4]2) and mirabilite (Na2SO4,10H2O). Taking into account the carbonate, the waters are in equilibrium with gaylussite and slightly oversaturated with magnesian calcite.
Finally, on the SW edge of the study area, the unconfined water table reaches the Bahr El Gazal valley, which drains the waters of the Batha basin along a SW–NE axis towards the Lowlands region, i.e., the Bodele depression.
Although the piezometric analysis of the Batha basin does not confirm that the Bahr El Gazal is strictly the western hydrogeological boundary, several investigations carried out on the adjacent Lake Chad basin [39,90,93] show that groundwater flows are parallel to the axis of the Bahr El Gazal towards the Bodele depression.
5. Conclusions
The Batha region represents the eastern part of the endorheic basin of Lake Chad. The knowledge of the behavior of groundwater is crucial to understand the processes controlling the potential and quality of this resource in a transitional domain between arid and semi-arid conditions, where water inputs are limited and strongly impacted by global warming. The result of such a study offers crucial insights for the sustainable management of water resources in a region facing the challenges of climate change and aridification.
The results highlight a complex geological structure characterized by a graben shape in the basement, influencing the distribution of sedimentary formations from the Continental Terminal (CT) to the Quaternary. This multilayered and heterogeneous aquifer, with the presence of clays and clayey sands, limits the productivity of wells tapping the groundwater. The piezometric map indicates a general flow from the southeast to the northwest, with the depression of Ambasatna north of Lake Fitri. Hydrochemical analysis reveals significant variations in the concentrations of components such as bicarbonate, sodium, calcium, and sulfate, especially in the Quaternary and basement formations. Different hydrochemical facies identified, such as calcium-bicarbonate, sodium-bicarbonate, and sodium-sulfate facies, indicate complex geochemical processes with minimal water evolution in the region. The water–rock interaction process is the main factor influencing the ionic composition of the waters. Base-exchange and solid/solution balance also contribute to the chemical composition of waters, with notable differences between the identified facies.
From an isotopic perspective, the analysis of precipitation isotopic composition provides valuable information on the water’s input signal. It varies significantly between low and high water periods, falling into three distinct groups: pre-season (April–June), high season (July–August), and post-season (September–November). The depletion of isotopic composition during heavy precipitation is associated with the amount effect, suggesting the direct recharge of meteoric waters. This is consistent with the observations of aquifer recharge in July–August in the Quaternary aquifer of the central basin of Lake Chad.
The isotopic composition of Lake Fitri and the Batha river waters is similar to that observed during the post-recharge period, exhibiting distinct isotopic compositions and providing additional insights on regional hydrology. Stable isotopes data (18O and 2H) in groundwater reveal variations based on geological units. The projection of these data, along with the global meteoric water line (GMWL) indicates direct recharge at some locations and relative enrichment in heavy isotopes before infiltration for others. The contents of the radioactive isotope tritium (3H) in groundwater show variations, reflecting different sources and ages of groundwater.
The usual water quality indexes (EC, SAR, and Cl−) provided a comprehensive evaluation of water quality for irrigation. The results allowed the discrimination of areas in the Batha basin where groundwater can be used safely for irrigation and areas where water is unsuitable. However, a major part of the basin contains groundwater suitable for irrigation. This is an encouraging result, since the economy of the basin is essentially agricultural.
All the results acquired as part of this study were synthesized in a conceptual model of the functioning of the Batha hydrogeological system. We thus have a better understanding of the dynamics of this complex multi-aquifer system. Groundwater represents the only water resource in the Batha basin. The progress derived from this work opens perspectives towards sustainable management plans for this resource, in particular with the implementation of rational irrigation. However, knowledge still needs to be improved and increased to achieve a better understanding of this system. Future efforts should focus on (i) the collection of hydraulic property data of the system through controlled pumping tests and of a time series of piezometric levels in the different layers; (ii) the assessment of the system water balance, including an accurate estimate of its current exploitation, in particular for irrigation; and (iii) the development of a numerical model to investigate climate change impact and to analyze scenarios and mitigation strategies to ensure the sustainability of the resource.
Author Contributions
Conceptualization: A.B.A., A.H., C.F., F.A., M.D. and M.R.; methodology: A.B.A., A.H., C.F., F.A., M.D. and M.R.; validation: A.B.A., A.H., C.F. and M.R.; formal analysis: A.B.A., A.H., C.F. and M.R.; investigation: A.B.A., A.H., C.F., F.A., M.D. and M.R.; resources: A.B.A., A.H. and C.F.; data curation: A.B.A. and C.F.; writing—original draft preparation: A.B.A., A.H., C.F., F.A., M.D. and M.R.; writing—review and editing: A.B.A., A.H., C.F. and M.R.; supervision: A.H., C.F. and M.R.; project administration: A.H. and M.R.; funding acquisition: A.H. and M.R. All authors have read and agreed to the published version of the manuscript.
Funding
This research was achieved within the framework of the project RAF7021 financed by the IAEA (International Atomic Energy Agency, Vienna, Austria). The first author benefited from a semester scholarship for three years at the University of Poitiers from the IAEA. The chemical and isotopic analyses were also funded by the IAEA.
Data Availability Statement
The data used in this study (piezometry, hydrochemistry, and isotopes) can be made available on request from the corresponding author.
Acknowledgments
The authors gratefully acknowledge the technical help provided by the National Laboratory of Water Analysis in N’Djamena, Chad (sampling materials and conditioning).
Conflicts of Interest
The authors declare no conflicts of interest. The funder had no role in the design of the study; in the collection or interpretation of data; in the writing of the manuscript; or in the decision to publish the results. The analyses (isotopes and major ions) were funded by the AIEA.
References
- Burke, K. The Chad Basin: An Active Intra-Continental Basin. In Developments in Geotectonics, Sedimentary Basins of Continental Margins and Cratons; Bott, M.H.P., Ed.; Elsevier: Amsterdam, The Netherlands, 1976; pp. 197–206. [Google Scholar] [CrossRef]
- Bristow, C.; Armitage, S. Dune ages in the sand deserts of the southern Sahara and Sahel. Quat. Int. 2016, 410, 46–57. [Google Scholar] [CrossRef]
- Drake, N.; Candy, I.; Breeze, P.; Armitage, S.; Gasmi, N.; Schwenninger, J.; Peat, D.; Manning, K. Sedimentary and geomorphic evidence of Saharan megalakes: A synthesis. Quat. Sci. Rev. 2022, 276, 107318. [Google Scholar] [CrossRef]
- Servant, M.; Servant, S. Les formations lacustres et les diatomées du Quaternaire recent du fond de la cuvette tchadienne. Rev. Geogr. Phys. Geol. Dyn. 1970, 13, 6–76. [Google Scholar]
- Magrin, G. Crise climatique et mutations de l’agriculture: L’émergence d’un grenier céréalier entre Tchad et Chari. In Annales de Géographie; Armand Colin: Paris, France, 1996; pp. 620–644. [Google Scholar]
- Maharana, P.; Abdel-Lathif, A.Y.; Pattnayak, K.C. Observed climate variability over Chad using multiple observational and reanalysis datasets. Glob. Planet. Change 2018, 162, 252–265. [Google Scholar] [CrossRef]
- Thomas, N.; Nigam, S. Twentieth-Century Climate Change over Africa: Seasonal Hydroclimate Trends and Sahara Desert Expansion. J. Clim. 2018, 31, 3349–3370. [Google Scholar] [CrossRef]
- Peel, M.C.; Finlayson, B.L.; McMahon, T.A. Updated world map of the Köppen-Geiger climate classification. Hydrol. Earth Syst. Sci. 2007, 11, 1633–1644. [Google Scholar] [CrossRef]
- Carmouze, J. Originalité de la régulation saline du Lac Tchad. C. R. Acad. Sci. Sér. D Sci. Nat. 1972, 275, 1871–1874. [Google Scholar]
- Chantraine, J.-M. Evolution hydrochimique du lac Tchad de septembre 1973 à septembre 1975 au cours d’une phase de décrue. Cah. Orstom. Hydrobiol. 1978, 12, 3–17. [Google Scholar]
- Isiorho, S.A.; Matisof, G. Groundwater recharge from Lake Chad. Limnol. Oceanogr. 1990, 35, 931–938. [Google Scholar] [CrossRef]
- Olivry, J.-C.; Chouret, A.; Vuillaume, G.; Lemoalle, J.; Bricquet, J.-P. Hydrologie du lac Tchad; Orstom: Paris, France, 1996; Volume N°12, p. 302. [Google Scholar]
- Bader, J.-C.; Lemoalle, J.; Leblanc, M. Modèle hydrologique du Lac Tchad. Hydrol. Sci. J. 2011, 56, 411–425. [Google Scholar] [CrossRef]
- Abderamane, H.; Razack, M.; Vassolo, S. Hydrogeochemical and isotopic characterization of the groundwater in the Chari-Baguirmi depression, Republic of Chad. Environ. Earth Sci. 2013, 69, 2337–2350. [Google Scholar] [CrossRef]
- Fontes, J.C.; Maglione, G.; Roche, M.A. Données isotopiques préliminaires sur les rapports du lac Tchad avec les nappes de la bordure nord-est. Cah. Orstom. Hydrobiol. 1969, 6, 17–34. [Google Scholar]
- Leduc, C.; Sabljak, S.; Taupin, J.-D.; Marlin, C.; Favreau, G. Estimation de la recharge de la nappe quaternaire dans le Nord-Ouest du bassin du lac Tchad (Niger oriental) à partir de mesures isotopiques. C. R. Acad. Sci.-Ser. IIA Earth Planet. Sci. 2000, 330, 355–361. [Google Scholar] [CrossRef]
- Wang, P.; Yu, J.; Zhang, Y.; Liu, C. Groundwater recharge and hydrogeochemical evolution in the Ejina Basin, northwest China. J. Hydrol. 2013, 476, 72–86. [Google Scholar] [CrossRef]
- Si, J.; Feng, Q.; Wen, X.; Su, Y.; Xi, H.; Chang, Z. Major ion chemistry of groundwater in the extreme arid region northwest China. Environ. Geol. 2009, 57, 1079–1087. [Google Scholar]
- Yang, H.; Wei, J.; Shi, K. Hydrochemical and Isotopic Characteristics and the Spatiotemporal Differences of Surface Water and Groundwater in the Qaidam Basin, China. Water 2024, 16, 169. [Google Scholar] [CrossRef]
- Edmunds, W.M.; Guendouz, A.H.; Mamou, A.; Moulla, A.; Shand, P.; Zouari, K. Groundwater evolution in the Continental Intercalaire aquifer of southern Algeria and Tunisia: Trace element and isotopic indicators. Appl. Geochem. 2003, 18, 805–822. [Google Scholar] [CrossRef]
- Farid, I.; Zouari, K.; Rigane, A.; Beji, R. Origin of the groundwater salinity and geochemical processes in detrital and carbonate aquifers: Case of Chougafiya basin (Central Tunisia). J. Hydrol. 2015, 530, 508–532. [Google Scholar] [CrossRef]
- Abdelfadel, F.; Hilali, M.; Fontaine, C.; El Albani, A.; Mahboub, A.; Eloy, L.; Labanowski, J.; Benaissi, L.; Razack, M. Hydrogeology of a Complex Aquifer System in Semi-Arid Mountainous Region: The Eastern Upper Guir Basin in the High Atlas (Morocco). Water 2020, 12, 2849. [Google Scholar] [CrossRef]
- Furi, W.; Razack, M.; Abiye, T.A.; Kebede, S.; Legesse, D. Hydrochemical characterization of complex volcanic aquifers in a continental rifted zone: The Middle Awash basin, Ethiopia. Hydrogeol. J. 2021, 20, 385–400. [Google Scholar] [CrossRef]
- Aboubaker, M.; Jalludin, M.; Razack, M. Hydrochemistry of a complex volcano-sedimentary aquifer using major ions and environmental isotopes data: Dalha basalts aquifer, southwest of Republic of Djibouti. Environ. Earth Sci. 2013, 70, 3335–3349. [Google Scholar] [CrossRef]
- Ahmed, I.M.; Jalludin, M.; Razack, M. Hydrochemical and Isotopic Assessment of Groundwater in the Goda Mountains Range System. Republic of Djibouti (Horn of Africa). Water 2020, 12, 2004. [Google Scholar] [CrossRef]
- Chacha, N.; Njau, K.N.; Lugomela, G.V.; Muzuka, A.N.N. Groundwater age dating and recharge mechanism of Arusha aquifer, northern Tanzania: Application of radioisotope and stable isotope techniques. Hydrogeol. J. 2018, 26, 2693–2706. [Google Scholar] [CrossRef]
- Dogramaci, S.; Skrzypek, G.; Dodson, W.; Grierson, P.F. Stable isotope and hydrochemical evolution of groundwater in the semi-arid Hamersley Basin of subtropical northwest Australia. J. Hydrol. 2012, 475, 281–293. [Google Scholar] [CrossRef]
- Al-Ahmadi, M.E. Hydrochemical characterization of groundwater in wadi Sayyah, Western Saudi Arabia. Appl. Water Sci. 2013, 3, 721–732. [Google Scholar] [CrossRef]
- Maskooni, E.K.; Hashemi, H.; Kompanizare, M.; Arasteh, P.D.; Vagharfard, H.; Berndtsson, R. Assessment of hydro-geochemical properties of groundwater under the effect of desalination wastewater discharge in an arid area. Environ. Sci. Pollut. Res. 2021, 28, 6176–6194. [Google Scholar] [CrossRef] [PubMed]
- Keesari, T.; Sinha, U.K.; Saha, D.; Dwivedi, S.; Shukla, R.R.; Mohokar, H.; Roy, A. Isotope and hydrochemical systematics of groundwater from a multi-tiered aquifer in the central parts of Indo-Gangetic Plains, India—Implications for groundwater sustainability and security. Sci. Total. Environ. 2021, 789, 147860. [Google Scholar] [CrossRef] [PubMed]
- Janicot, S.; Sultan, B. Intra-seasonal modulation of convection in the West African Monsoon. Geophys. Res. Lett. 2001, 28, 523–526. [Google Scholar] [CrossRef]
- Barbé, L.L.; Lebel, T.; Tapsoba, D. Rainfall Variability in West Africa during the Years 1950–1990. J. Clim. 2002, 15, 187–202. [Google Scholar] [CrossRef]
- Davidson, O.; Halsnæs, K.; Huq, S.; Kok, M.; Metz, B.; Sokona, Y.; Verhagen, J. The development and climate nexus: The case of sub-Saharan Africa. Clim. Policy 2003, 3, S97–S113. [Google Scholar] [CrossRef]
- Bell, M.A.; Lamb, P.J. Integration of Weather System Variability to Multidecadal Regional Climate Change: The West African Sudan–Sahel Zone, 1951–1998. J. Clim. 2006, 19, 5343–5365. [Google Scholar] [CrossRef]
- Stige, L.C.; Stave, J.; Chan, K.-S.; Ciannelli, L.; Pettorelli, N.; Glantz, M.; Herren, H.R.; Stenseth, N.C. The effect of climate variation on agro-pastoral production in Africa. Proc. Natl. Acad. Sci. USA 2006, 103, 3049–3053. [Google Scholar] [CrossRef] [PubMed]
- Lebel, T.; Ali, A. Recent trends in the Central and Western Sahel rainfall regime (1990–2007). J. Hydrol. 2009, 375, 52–64. [Google Scholar] [CrossRef]
- Pias, J. Les Formations Sédimentaires Tertiaires et Quaternaires de la Cuvette Tchadienne et Les Sols Qui en Dérivent; Orstom: Paris, France, 1970; Volume 43, p. 425. [Google Scholar]
- Schneider, J.-L. Géologie et Hydrogéologie de la République du Tchad. Ph.D. Thesis, University of Avignon, Avignon, France, 1989; p. 549. [Google Scholar]
- Schneider, J.L.; Wolff, J.-P. Carte Géologique et Cartes Hydrogéologiques à 1/1,500,000 de la République du Tchad: Mémoire Explicatif (Vol.1, N° 209); BRGM Publisher: Orléans, France, 1992. [Google Scholar]
- Lajaunie, M.L.; Serrat Capdevila, A.; Mumssen, Y.; Candela Lledó, L.; Salehi Siavashan, N. A groundwater model for the Lake Chad basin: Integrating data and understanding of water resources at the basin scale. Cooperation for International Waters in Africa (CIWA), World Bank. Tech. Rep. 2020, 184, 153–168. [Google Scholar]
- Bellion, Y. Histoire Géodynamique Post-Paléozoique de l’Afrique de l’Ouest d’après l’étude de Quelques Bassins Sédimentaires (Sénégal, Taoudenni, Iullemmeden, Tchad). Ph.D. Thesis, University Avignon, Avignon, France, 1987; 295p. [Google Scholar]
- Guiraud, R.; Maurin, J.-C. Early Cretaceous rifts of Western and Central Africa: An overview. Tectonophysics, Geodynamics of Rifting, Volume II Case History Studies on Rifts: North and South America and Africa. Tectonophysics 1992, 213, 153–168. [Google Scholar] [CrossRef]
- Black, R.; Liegeois, J.-P. Cratons, mobile belts, alkaline rocks and continental lithospheric mantle: The Pan-African testimony. J. Geol. Soc. 1993, 150, 89–98. [Google Scholar] [CrossRef]
- Kusnir, I.; Moutaye, H.A. Ressources minérales du Tchad: Une revue. J. Afr. Earth Sci. 1997, 24, 549–562. [Google Scholar] [CrossRef]
- Moupeng, B. Le lac Fitri: Dynamique du Système Hydrographique Quaternaire et Actuel (Sahel Tchadien). Ph.D. Thesis, University of Aix-Marseille, Marseille, France, 2006; p. 150. [Google Scholar]
- Schuster, M.; Roquin, C.; Moussa, A.; Ghienne, J.-F.; Duringer, P.; Bouchette, F.; Durand, A.; Allenbach, B. Shorelines of the Holocene Megalake Chad (Africa, Sahara) investigated with very high resolution satellite imagery (Pléiades): Example of the Goz Kerki paleo-spit. Rev. Fr. Photogramm. Télédétect. 2014, 208, 63–68. [Google Scholar] [CrossRef]
- Moussa, A. Les Séries Sédimentaires Fluviatiles, Lacustres et Éoliennes du Bassin du Tchad Depuis le Miocène Terminal. Ph.D. Thesis, University of Strasbourg, Strasbourg, France, 2010; p. 250. [Google Scholar]
- Schuster, M.; Duringer, P.; Ghienne, J.-F.; Roquin, C.; Sepulchre, P.; Moussa, A.; Lebatard, A.-E.; Mackaye, H.T.; Likius, A.; Vignaud, P.; et al. Chad Basin: Paleoenvironments of the Sahara since the Late Miocene. C. R. Geosci. 2009, 341, 603–611. [Google Scholar] [CrossRef]
- Amaral, P.G.C.; Vincens, A.; Guiot, J.; Buchet, G.; Deschamps, P.; Doumnang, J.; Sylvestre, F. Palynological evidence for gradual vegetation and climate changes during the “African Humid Period” termination at 13°N from a Mega-Lake Chad sedimentary sequence. Clim. Past 2013, 9, 223–241. [Google Scholar] [CrossRef]
- Centre de Documentation et d’Informations Géographiques CDIG. Available online: http://reseau-tchad.org/siteau/ (accessed on 18 December 2023).
- AIEA/WMO. Global Network of Isotopes in Precipitation. The GNIP Database. 2018. Available online: https://nucleus.iaea.org/ (accessed on 18 December 2023).
- Piper, A.M. A graphic procedure in the geochemical interpretation of water-analyses. Eos Trans. Am. Geophys. Union 1944, 25, 914–928. [Google Scholar]
- Vidal, N.P.; Manful, C.F.; Pham, T.H.; Stewart, P.; Keough, D.; Thomas, R. The use of XLSTAT in conducting principal component analysis (PCA) when evaluating the relationships between sensory and quality attributes in grilled foods. MethodsX 2020, 7, 100835. [Google Scholar] [CrossRef]
- Xanke, J.; Ender, A.; Grimmeisen, F.; Goeppert, N.; Goldscheider, N. Hydrochemical evaluation of water resources and human impacts on an urban karst system, Jordan. Hydrogeol. J. 2020, 28, 2173–2186. [Google Scholar] [CrossRef]
- Che, Q.; Su, X.; Wang, S.; Zheng, S.; Li, Y. Hydrochemical Characteristics and Evolution of Groundwater in the Alluvial Plain (Anqing Section) of the Lower Yangtze River Basin: Multivariate Statistical and Inversion Model Analyses. Water 2021, 13, 2403. [Google Scholar] [CrossRef]
- Manov, G.G.; Bates, R.G.; Hamer, W.J.; Acree, S. Values of the constants in the Debye—Hückel equation for activity coefficients1. J. Am. Chem. Soc. 1943, 65, 1765–1767. [Google Scholar] [CrossRef]
- Risacher, F.; Fritz, B. Estimation des variations en fonction de la température des produits de solubilité des principaux sels des milieux évaporitiques. Sci. Géol. Bull. 1984, 37, 229–237. [Google Scholar]
- WHO. Guidelines for Drinking-Water Quality: Fourth Edition Incorporating the First and Second Addenda; World Health Organization: Geneve, Switzerland, 2022. [Google Scholar]
- Kumar, M.; Kumari, K.; Ramanathan, A.; Saxena, R. A comparative evaluation of groundwater suitability for irrigation and drinking purposes in two intensively cultivated districts of Punjab, India. Environ. Geol. 2007, 53, 553–574. [Google Scholar] [CrossRef]
- Abderamane, H.; Ketchemen-Tandia, B.; Nlend, B.Y.; Arrakhais, A.B. Hydrogeochemical and isotopic characterization of the groundwater in the Dababa area (Chad). Afr. J. Environ. Sci. Technol. 2016, 10, 451–466. [Google Scholar] [CrossRef]
- Ndoye, S.; Fontaine, C.; Gaye, C.B.; Razack, M. Groundwater Quality and Suitability for Different Uses in the Saloum Area of Senegal. Water 2018, 10, 1837. [Google Scholar] [CrossRef]
- Bon, A.F.; Abderamane, H.; Mboudou, G.E.; Doua, S.A.; Banakeng, L.A.; Boyomo, S.B.B.; Piih, S.L.; Damo, B.W. Parametrization of groundwater quality of the Quaternary aquifer in N’Djamena (Chad), Lake Chad Basin: Application of numerical and multivariate analyses. Environ. Sci. Pollut. Res. 2021, 28, 12300–12320. [Google Scholar] [CrossRef] [PubMed]
- Kadjangaba, E.; Bongo, D.; Le Bandoumel, M. Adequacy of Water Use Resources for Drinking and Irrigation, Study Case of Sarh City, Capital of Moyen-Chari Province, CHAD. Open J. Mod. Hydrol. 2022, 13, 1–21. [Google Scholar] [CrossRef]
- Alogayell, H.M.; El-Bana, E.M.M.; Abdelfattah, M. Groundwater Quality and Suitability Assessment for Irrigation Using Hydrogeochemical Characteristics and Pollution Indices: A Case Study of North Al-Quwayiyah Governorate, Central Saudi Arabia. Water 2023, 15, 3321. [Google Scholar] [CrossRef]
- Hasan, M.S.U.; Rai, A.K. Suitability of the Lower Ganga basin groundwater for irrigation, using hydrogeochemical parameters and land-use dynamics. Environ. Sci. Pollut. Res. 2023, 30, 116831–116847. [Google Scholar] [CrossRef]
- Jarray, H.; Hamzaoui-Azaza, F.; Zammouri, M.; Ouessar, M.; Barbieri, M.; Carrey, R.; Soler, A.; Guastaldi, E.; Sahal, S. Geochemical evaluation of groundwater quality and its suitability for drinking and irrigation purposes in arid and semiarid regions: The case of Zeuss-Koutine and a part of Mio-Plio-Quaternary aquifers (SE Tunisia). Phys. Chem. Earth Parts A/B/C 2023, 132, 103483. [Google Scholar] [CrossRef]
- Patel, P.S.; Pandya, D.M.; Shah, M. A systematic and comparative study of Water Quality Index (WQI) for groundwater quality analysis and assessment. Environ. Sci. Pollut. Res. 2023, 30, 54303–54323. [Google Scholar] [CrossRef] [PubMed]
- Ayers, R.; Westcot, D. FAO irrigation and drainage paper. Water Qual. Agric. 1985, 29, 8–96. [Google Scholar]
- Simsek, C.; Gunduz, O. IWQ Index: A GIS-Integrated Technique to Assess Irrigation Water Quality. Environ. Monit. Assess. 2007, 128, 277–300. [Google Scholar] [CrossRef] [PubMed]
- Park, C.S.; O’connor, G.A. Salinity effects on hydraulic properties of soils. Soil Sci. 1980, 130, 167–174. [Google Scholar] [CrossRef]
- Abu-Sharar, T.M.; Bingham, F.T.; Rhoades, J.D. Stability of soil aggregates as affected by electrolyte concentration and composition. Soil Sci. Soc. Am. J. 1987, 51, 309–314. [Google Scholar] [CrossRef]
- Kumar, S.; Prasad, K.S.H.; Bundela, D.S. Effect of Sodicity on Soil–Water Retention and Hydraulic Properties. J. Irrig. Drain. Eng. 2020, 146, 04020004. [Google Scholar] [CrossRef]
- Richards, L.A. Diagnosis and Improvement of Saline Alkali Soils, Agriculture, Handbook 60; U.S. Department of Agriculture: Washington, DC, USA, 1954; Volume 160. [Google Scholar] [CrossRef]
- FAO. Water quality for agriculture. In Water Quality Guidelines; Food and Agricultural Organization: Rome, Italy, 1994. [Google Scholar]
- Mandal, S.K.; Dutta, S.K.; Pramanik, S.; Kole, R.K. Assessment of river water quality for agricultural irrigation. Int. J. Environ. Sci. Technol. 2018, 16, 451–462. [Google Scholar] [CrossRef]
- Alsubih, M.; Mallick, J.; Islam, A.R.M.T.; Almesfer, M.K.; Ben Kahla, N.; Talukdar, S.; Ahmed, M. Assessing Surface Water Quality for Irrigation Purposes in Some Dams of Asir Region, Saudi Arabia Using Multi-Statistical Modeling Approaches. Water 2022, 14, 1439. [Google Scholar] [CrossRef]
- Amrani, S.; Hinaje, S.; El Fartati, M.; Gharmane, Y.; Yaagoub, D. Assessment of groundwater quality for drinking and irrigation in the Timahdite–Almis Guigou area (Middle Atlas, Morocco). Appl. Water Sci. 2022, 12, 82. [Google Scholar] [CrossRef]
- Evangelou, V.P. Environmental Soil and Water Chemistry: Principles and Applications; Wiley: Hoboken, NJ, USA, 1998; 592p. [Google Scholar]
- Kalavrouziotis, I.; Drakatos, P. Irrigation of certain Mediterranean plants with heavy metals. Int. J. Environ. Pollut. 2002, 18, 294. [Google Scholar] [CrossRef]
- Gibbs, R.J. Mechanisms Controlling World Water Chemistry. Science 1970, 170, 1088–1090. [Google Scholar] [CrossRef]
- Xiao, J.; Jin, Z.; Zhang, F.; Wang, J. Major ion geochemistry of shallow groundwater in the Qinghai Lake catchment, NE Qinghai-Tibet Plateau. Environ. Earth Sci. 2012, 67, 1331–1344. [Google Scholar] [CrossRef]
- Khan, N.; Malik, A.; Nehra, K. Groundwater hydro-geochemistry, quality, microbiology and human health risk assessment in semi-arid area of Rajasthan, India: A chemometric approach. Environ. Monit. Assess. 2021, 193, 234. [Google Scholar] [CrossRef] [PubMed]
- Shirke, K.D.; Kadam, A.K.; Pawar, N.J. Temporal variations in hydro-geochemistry and potential health risk assessment of groundwater from lithological diversity of semi-arid region, Western Gujarat, India. Appl. Water Sci. 2020, 10, 156. [Google Scholar] [CrossRef]
- García, G.M.; Hidalgo, M.d.V.; Blesa, M.A. Geochemistry of groundwater in the alluvial plain of Tucum n province, Argentina. Hydrogeol. J. 2001, 9, 597–610. [Google Scholar] [CrossRef]
- McLean, W.; Jankowski, J.; Lavitt, N. Groundwater quality and sustainability in an alluvial aquifer, Australia. In Groundwater: Past Achievements and Future Challenges; Balkema: Dordrecht, The Netherlands, 2000; pp. 567–573. [Google Scholar]
- Chebotarev, I.I. Metamorphism of natural waters in the crust of weathering. Geochim. Cosmochim. Acta 1995, 8, 22–48. [Google Scholar] [CrossRef]
- Goni, I.; Fellman, E.; Edmunds, W. Rainfall geochemistry in the Sahel region of northern Nigeria. Atmos. Environ. 2001, 35, 4331–4339. [Google Scholar] [CrossRef]
- Craig, H. Isotopic Variations in Meteoric Waters. Science 1961, 133, 1702–1703. [Google Scholar] [CrossRef] [PubMed]
- Song, F.; Nlend, B.; Boum-Nkot, S.N.; Huneau, F.; Ndondo, G.N.; Garel, E.; Leydier, T.; Celle, H.; Djieugoue, B.; Ntamak-Nida, M.-J.; et al. Groundwater Resources of the Transboundary Quaternary Aquifer of the Lake Chad Basin: Towards a Better Management via Isotope Hydrology. Resources 2023, 12, 138. [Google Scholar] [CrossRef]
- Nour, A.M.; Huneau, F.; Ali, A.M.; Saleh, H.M.; Boum-Nkot, S.N.; Nlend, B.; Djebebe-Ndjiguim, C.; Foto, E.; Sanoussi, R.; Araguas-Araguas, L.; et al. Shallow Quaternary groundwater in the Lake Chad basin is resilient to climate change but requires sustainable management strategy: Results of isotopic investigation. Sci. Total. Environ. 2022, 851, 158152. [Google Scholar] [CrossRef] [PubMed]
- Yahouza, L.; Issoufou, S.; Babaye, M.S.A.; Métral, B.; Ousmane, B. Contribution of stable isotopes of water (18O and 2H) to the characterization of goulbi N’kaba valley aquifer, region of Maradi in the republic of Niger. Int. J. Hydrol. 2018, 2, 560–565. [Google Scholar] [CrossRef]
- Allies, A.; Demarty, J.; Olioso, A.; Moussa, I.B.; Issoufou, H.B.-A.; Velluet, C.; Bahir, M.; Maïnassara, I.; Oï, M.; Chazarin, J.-P.; et al. Evapotranspiration Estimation in the Sahel Using a New Ensemble-Contextual Method. Remote Sens. 2020, 12, 380. [Google Scholar] [CrossRef]
- Vassolo, S.; Gröschke, M.; Koeniger, P.; Neukum, C.; Seehausen, L.; Witt, L.; Ronnelngar, M.; Daïra, D. Groundwater recharge processes in the Lake Chad Basin based on isotopic and chemical data. Hydrogeol. J. 2023, 32, 149–165. [Google Scholar] [CrossRef]
- Mook, W.G. Isotopes de L’environnement Dans le Cycle Hydrologique; AIEA: Vienna, Austria, 2001; Volume I, Chapter 8. [Google Scholar]
- Allison, G.; Hughes, M. The use of environmental chloride and tritium to estimate total recharge to an unconfined aquifer. Soil Res. 1978, 16, 181–195. [Google Scholar] [CrossRef]
- Hubert, P.; Olive, P.; Ravailleau, S. Estimation pratique de l’âge des eaux souterraines par le tritium. Reseau 1996, 9, 523–533. [Google Scholar] [CrossRef]
- IAEA (International Atomic Energy Agency). Tritium and other Environmental Isotopes in the Hydrological Cycle; Technical Reports Series No. 73; IAEA Publisher: Vienna, Austria, 1967. [Google Scholar]
- Salem, O.; Visser, J.H.; Dray, M.; Gonfiantini, R. Arid-Zone Hydrology: Investigations with Isotope Techniques; IAEA: Vienna, Austria, 1980; pp. 165–179. [Google Scholar]
- Cook, P.G.; Jolly, I.D.; Leaney, F.W.; Walker, G.R.; Allan, G.L.; Fifield, L.K.; Allison, G.B. Unsaturated zone tritium and chlorine 36 profiles from southern Australia: Their use as tracers of soil water movement. Water Resour. Res. 1994, 30, 1709–1719. [Google Scholar] [CrossRef]
- Liu, T.-K. Estimating Flow and Recharge Rates of Groundwater in Western Taiwan Using Radiocarbon and Tritium. Radiocarbon 1995, 37, 531–542. [Google Scholar] [CrossRef]
- Scanlon, B.R.; Healy, R.W.; Cook, P.G. Choosing appropriate techniques for quantifying groundwater recharge. Hydrogeol. J. 2002, 10, 18–39. [Google Scholar] [CrossRef]
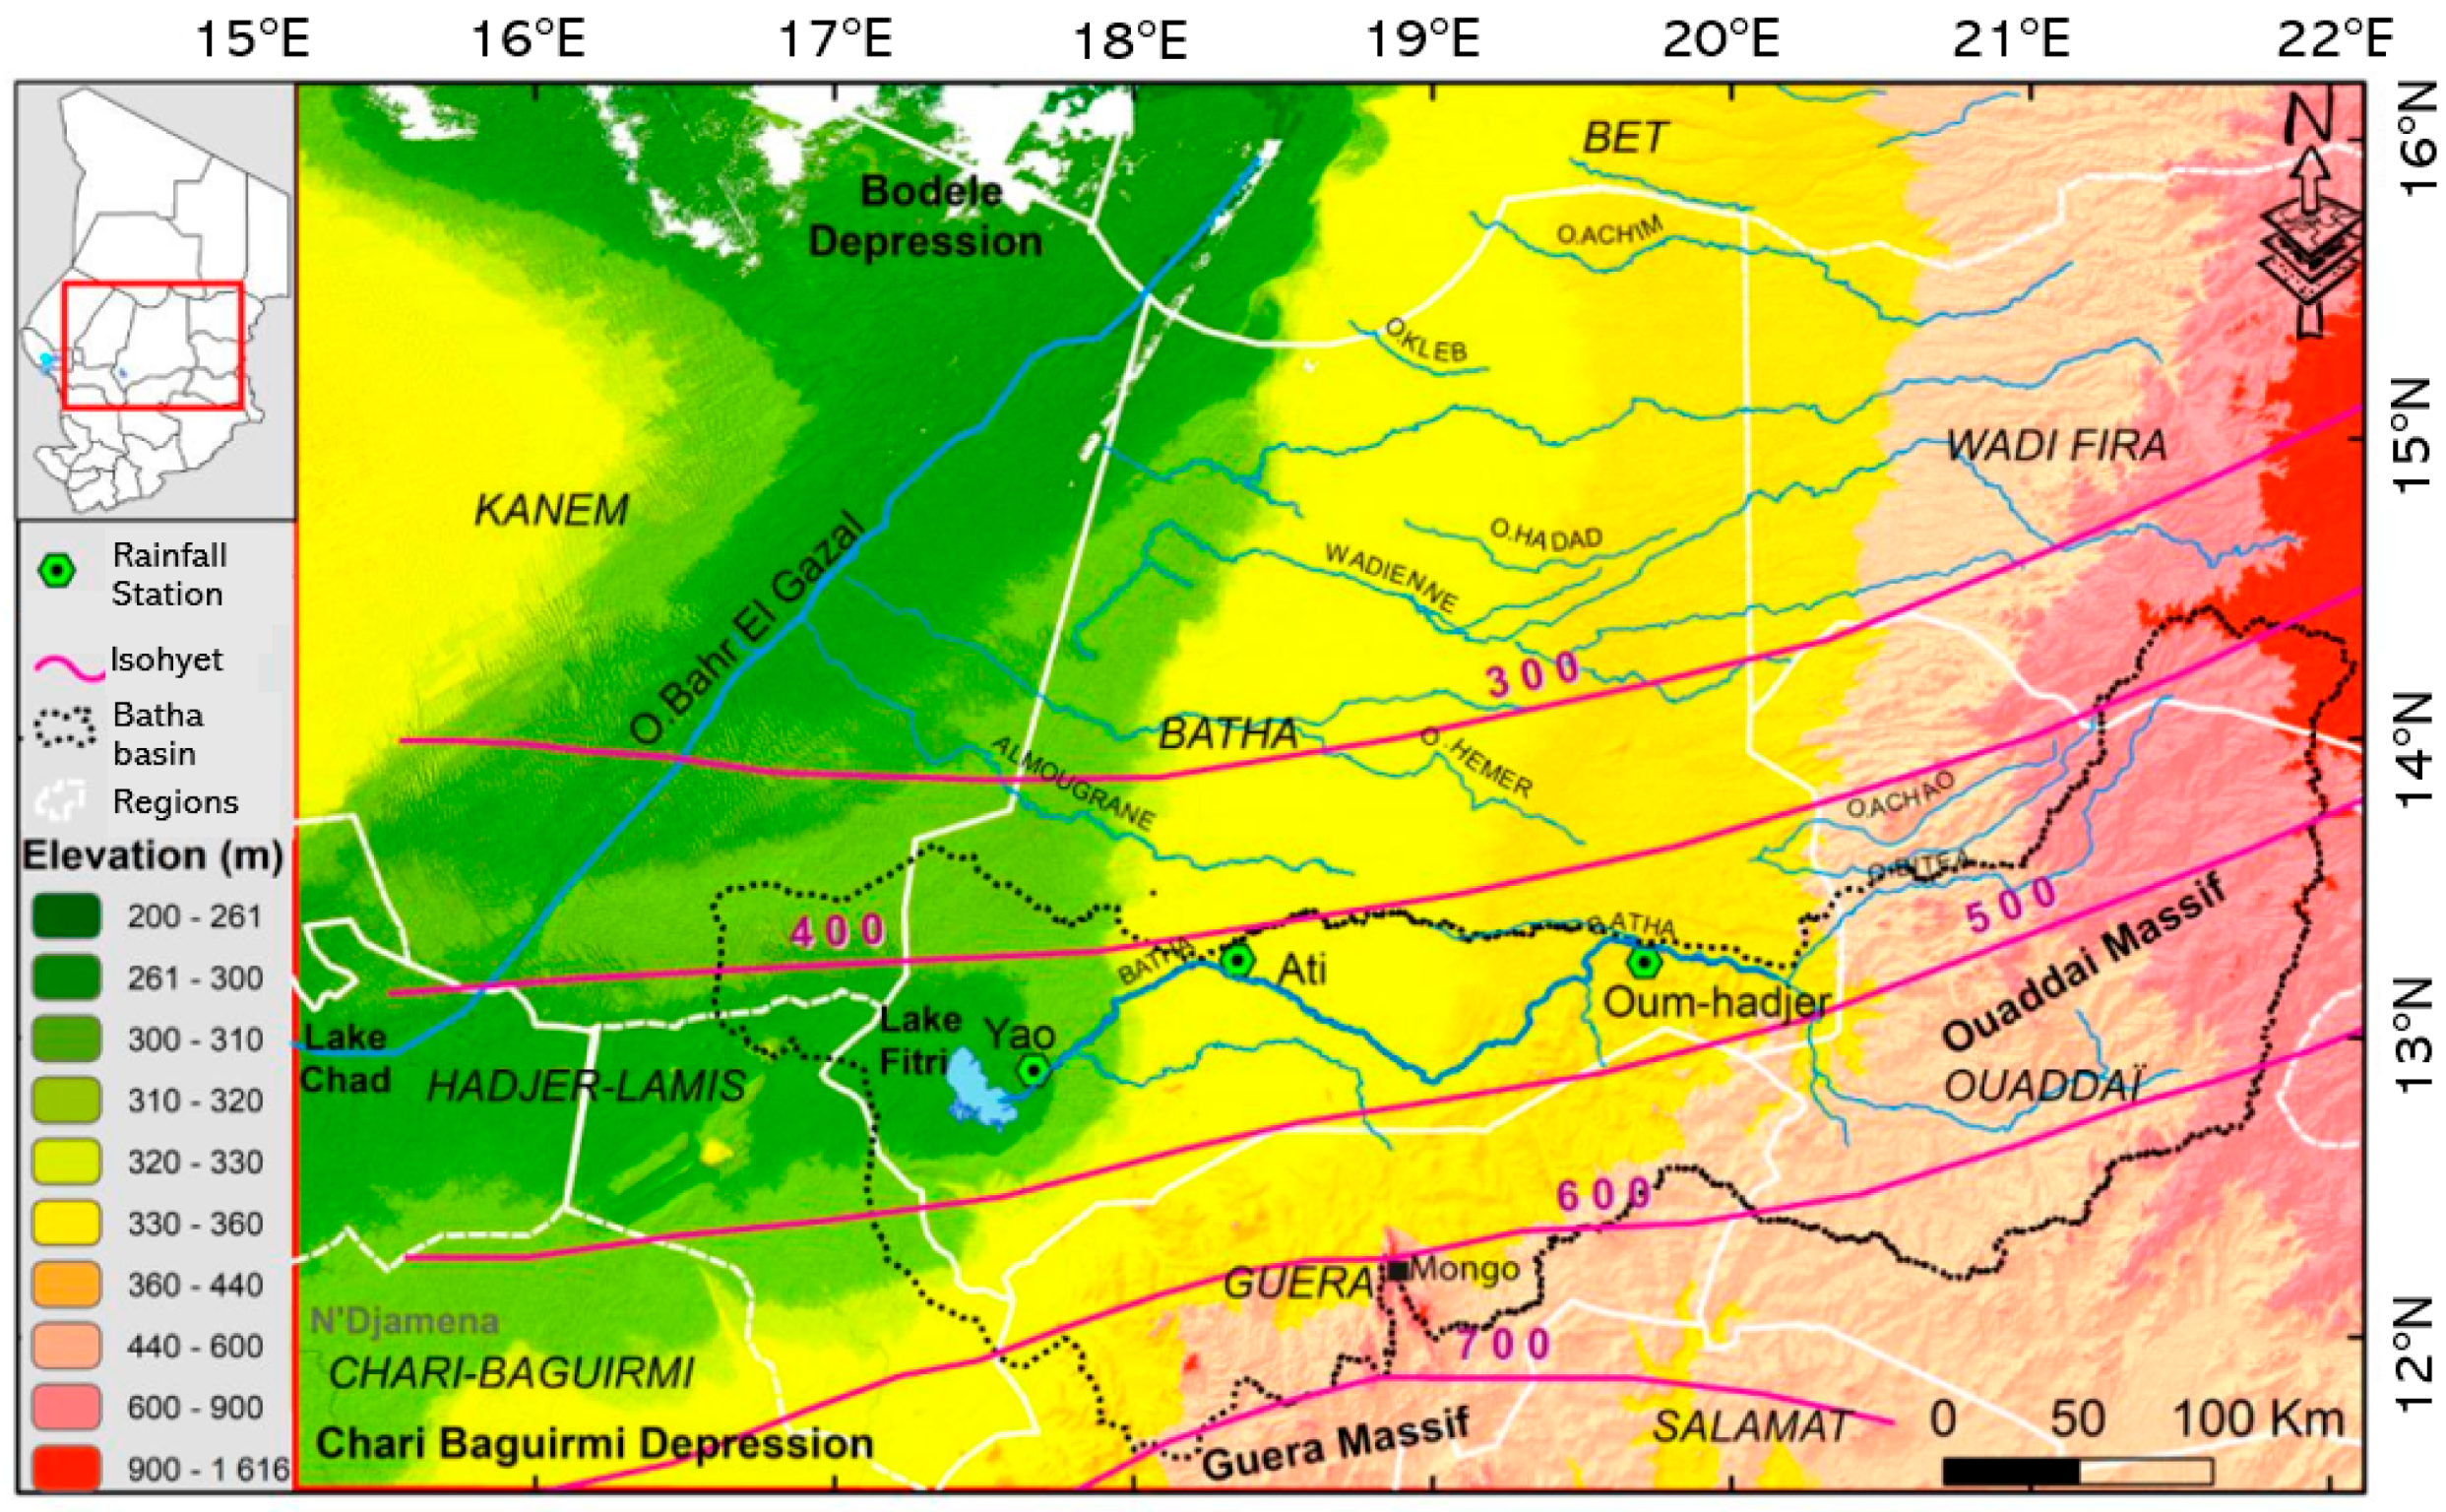
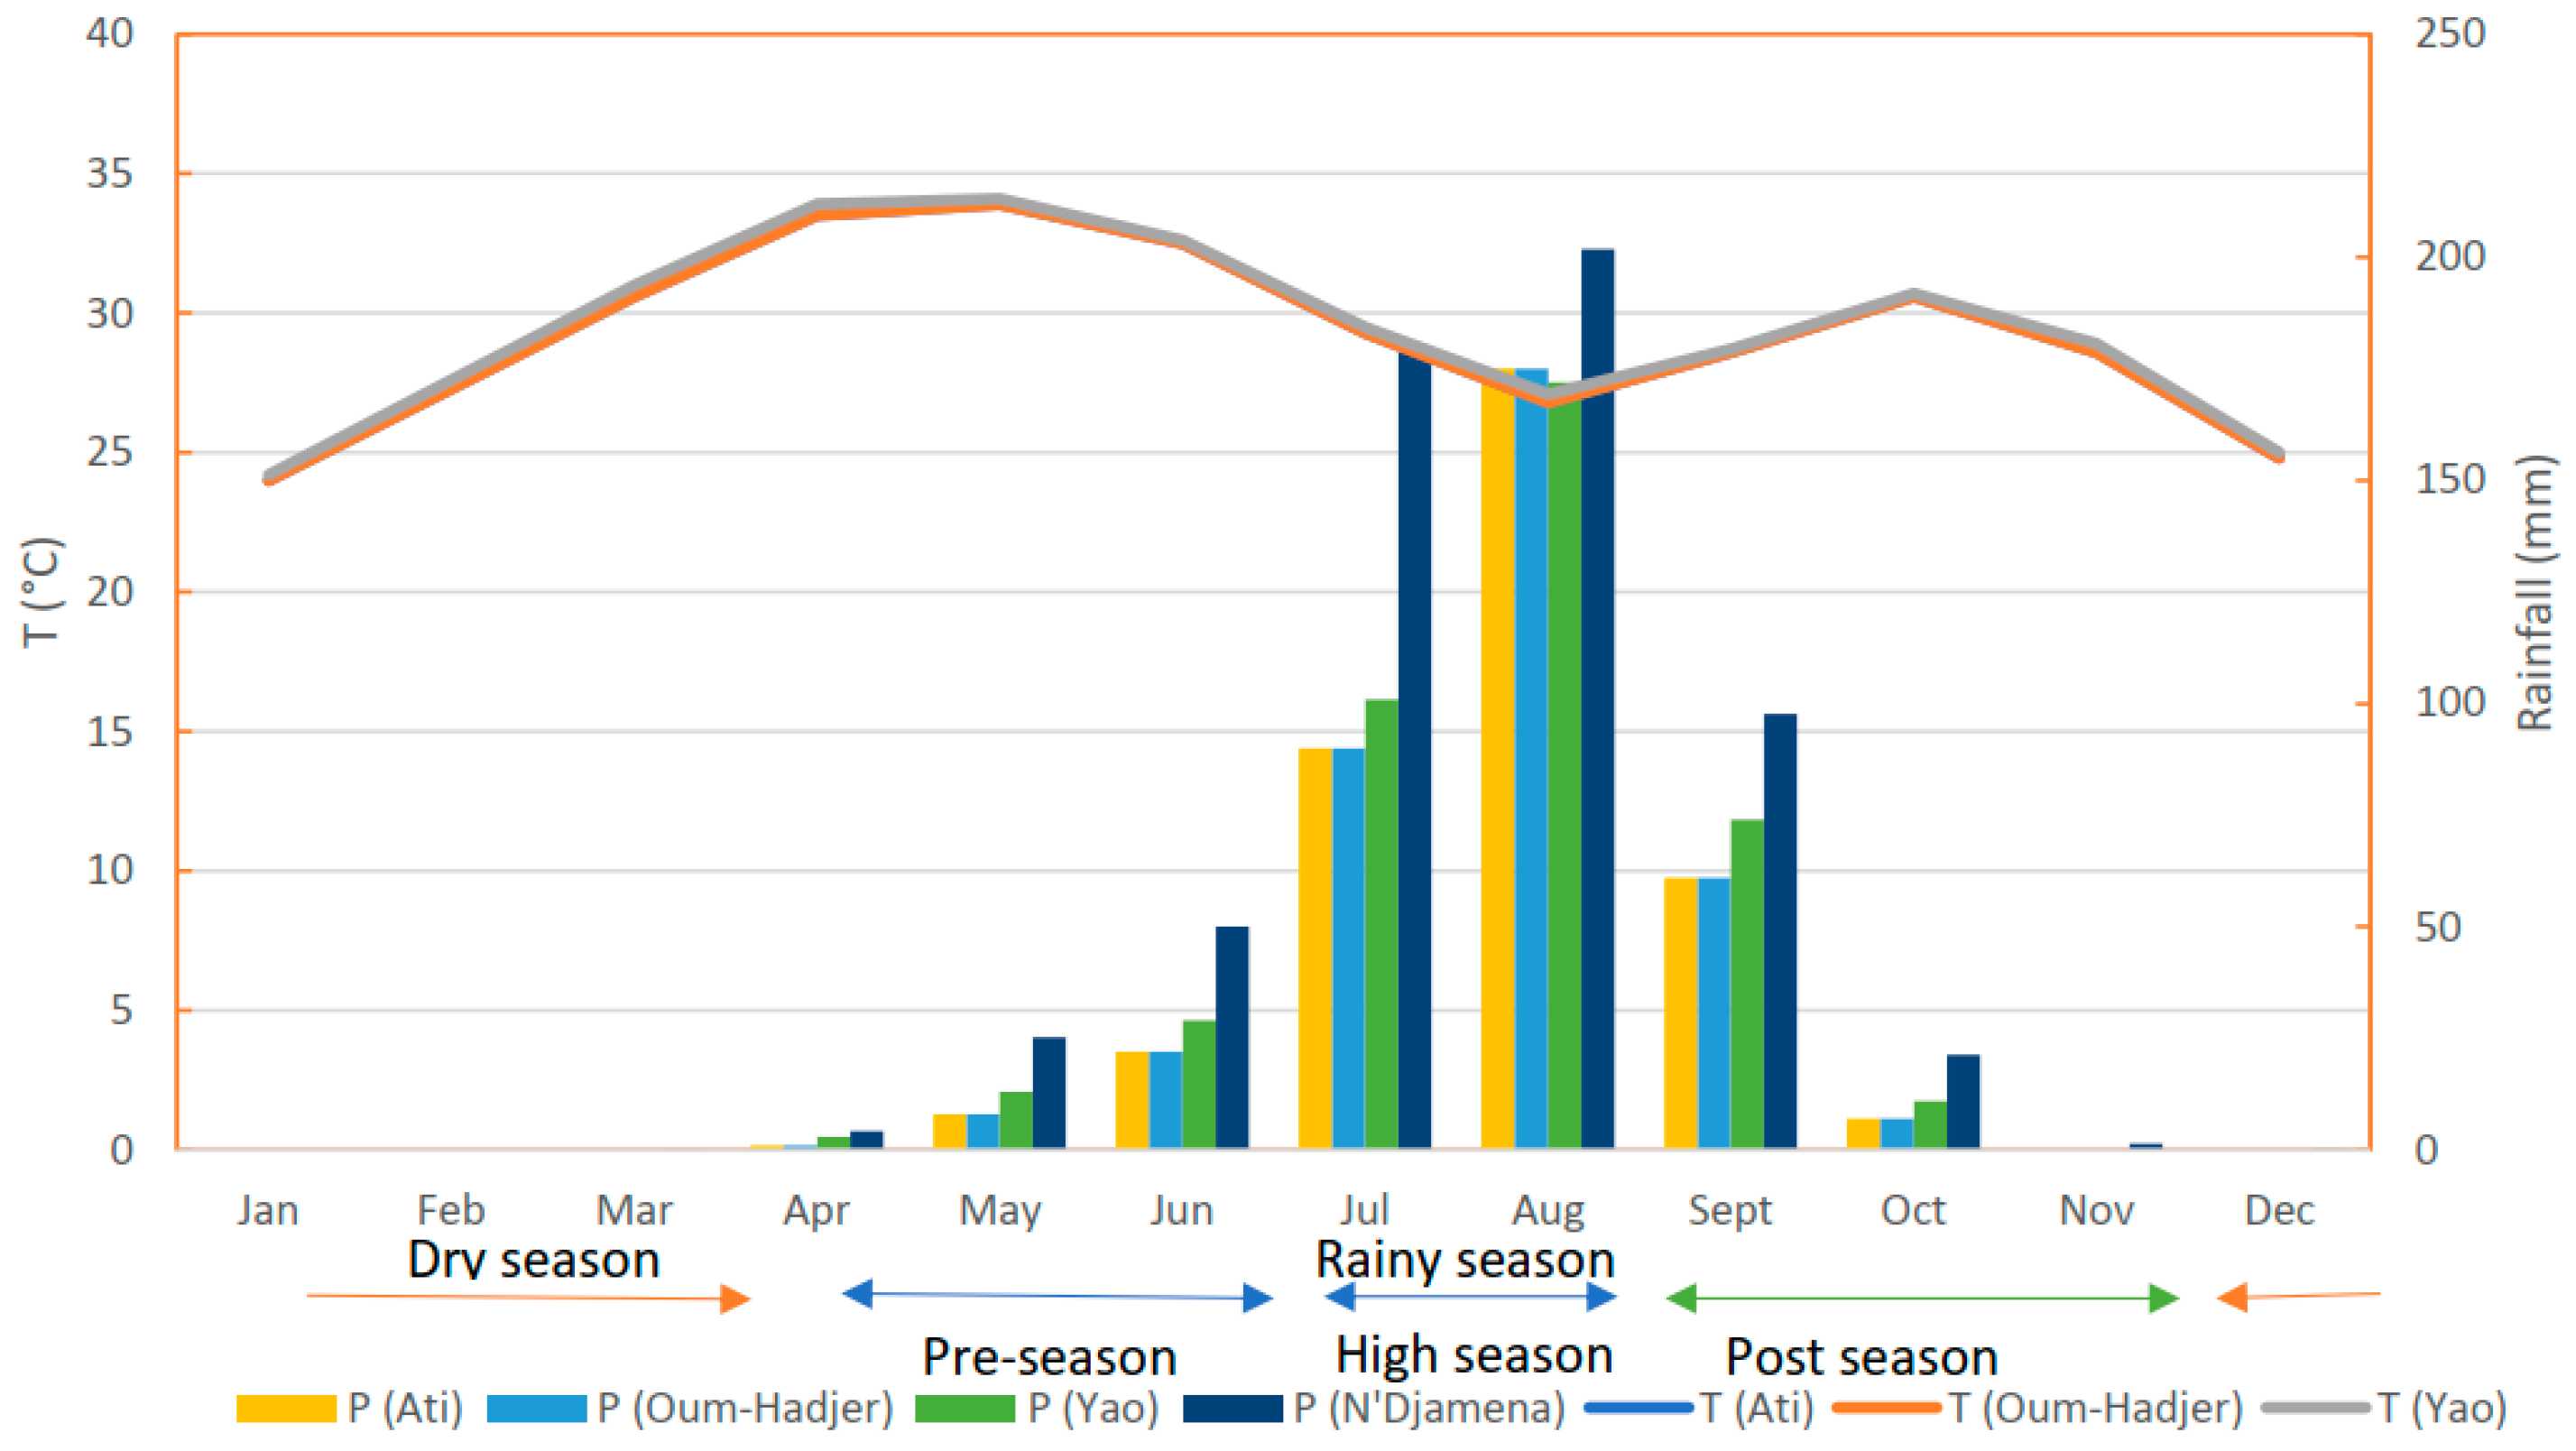
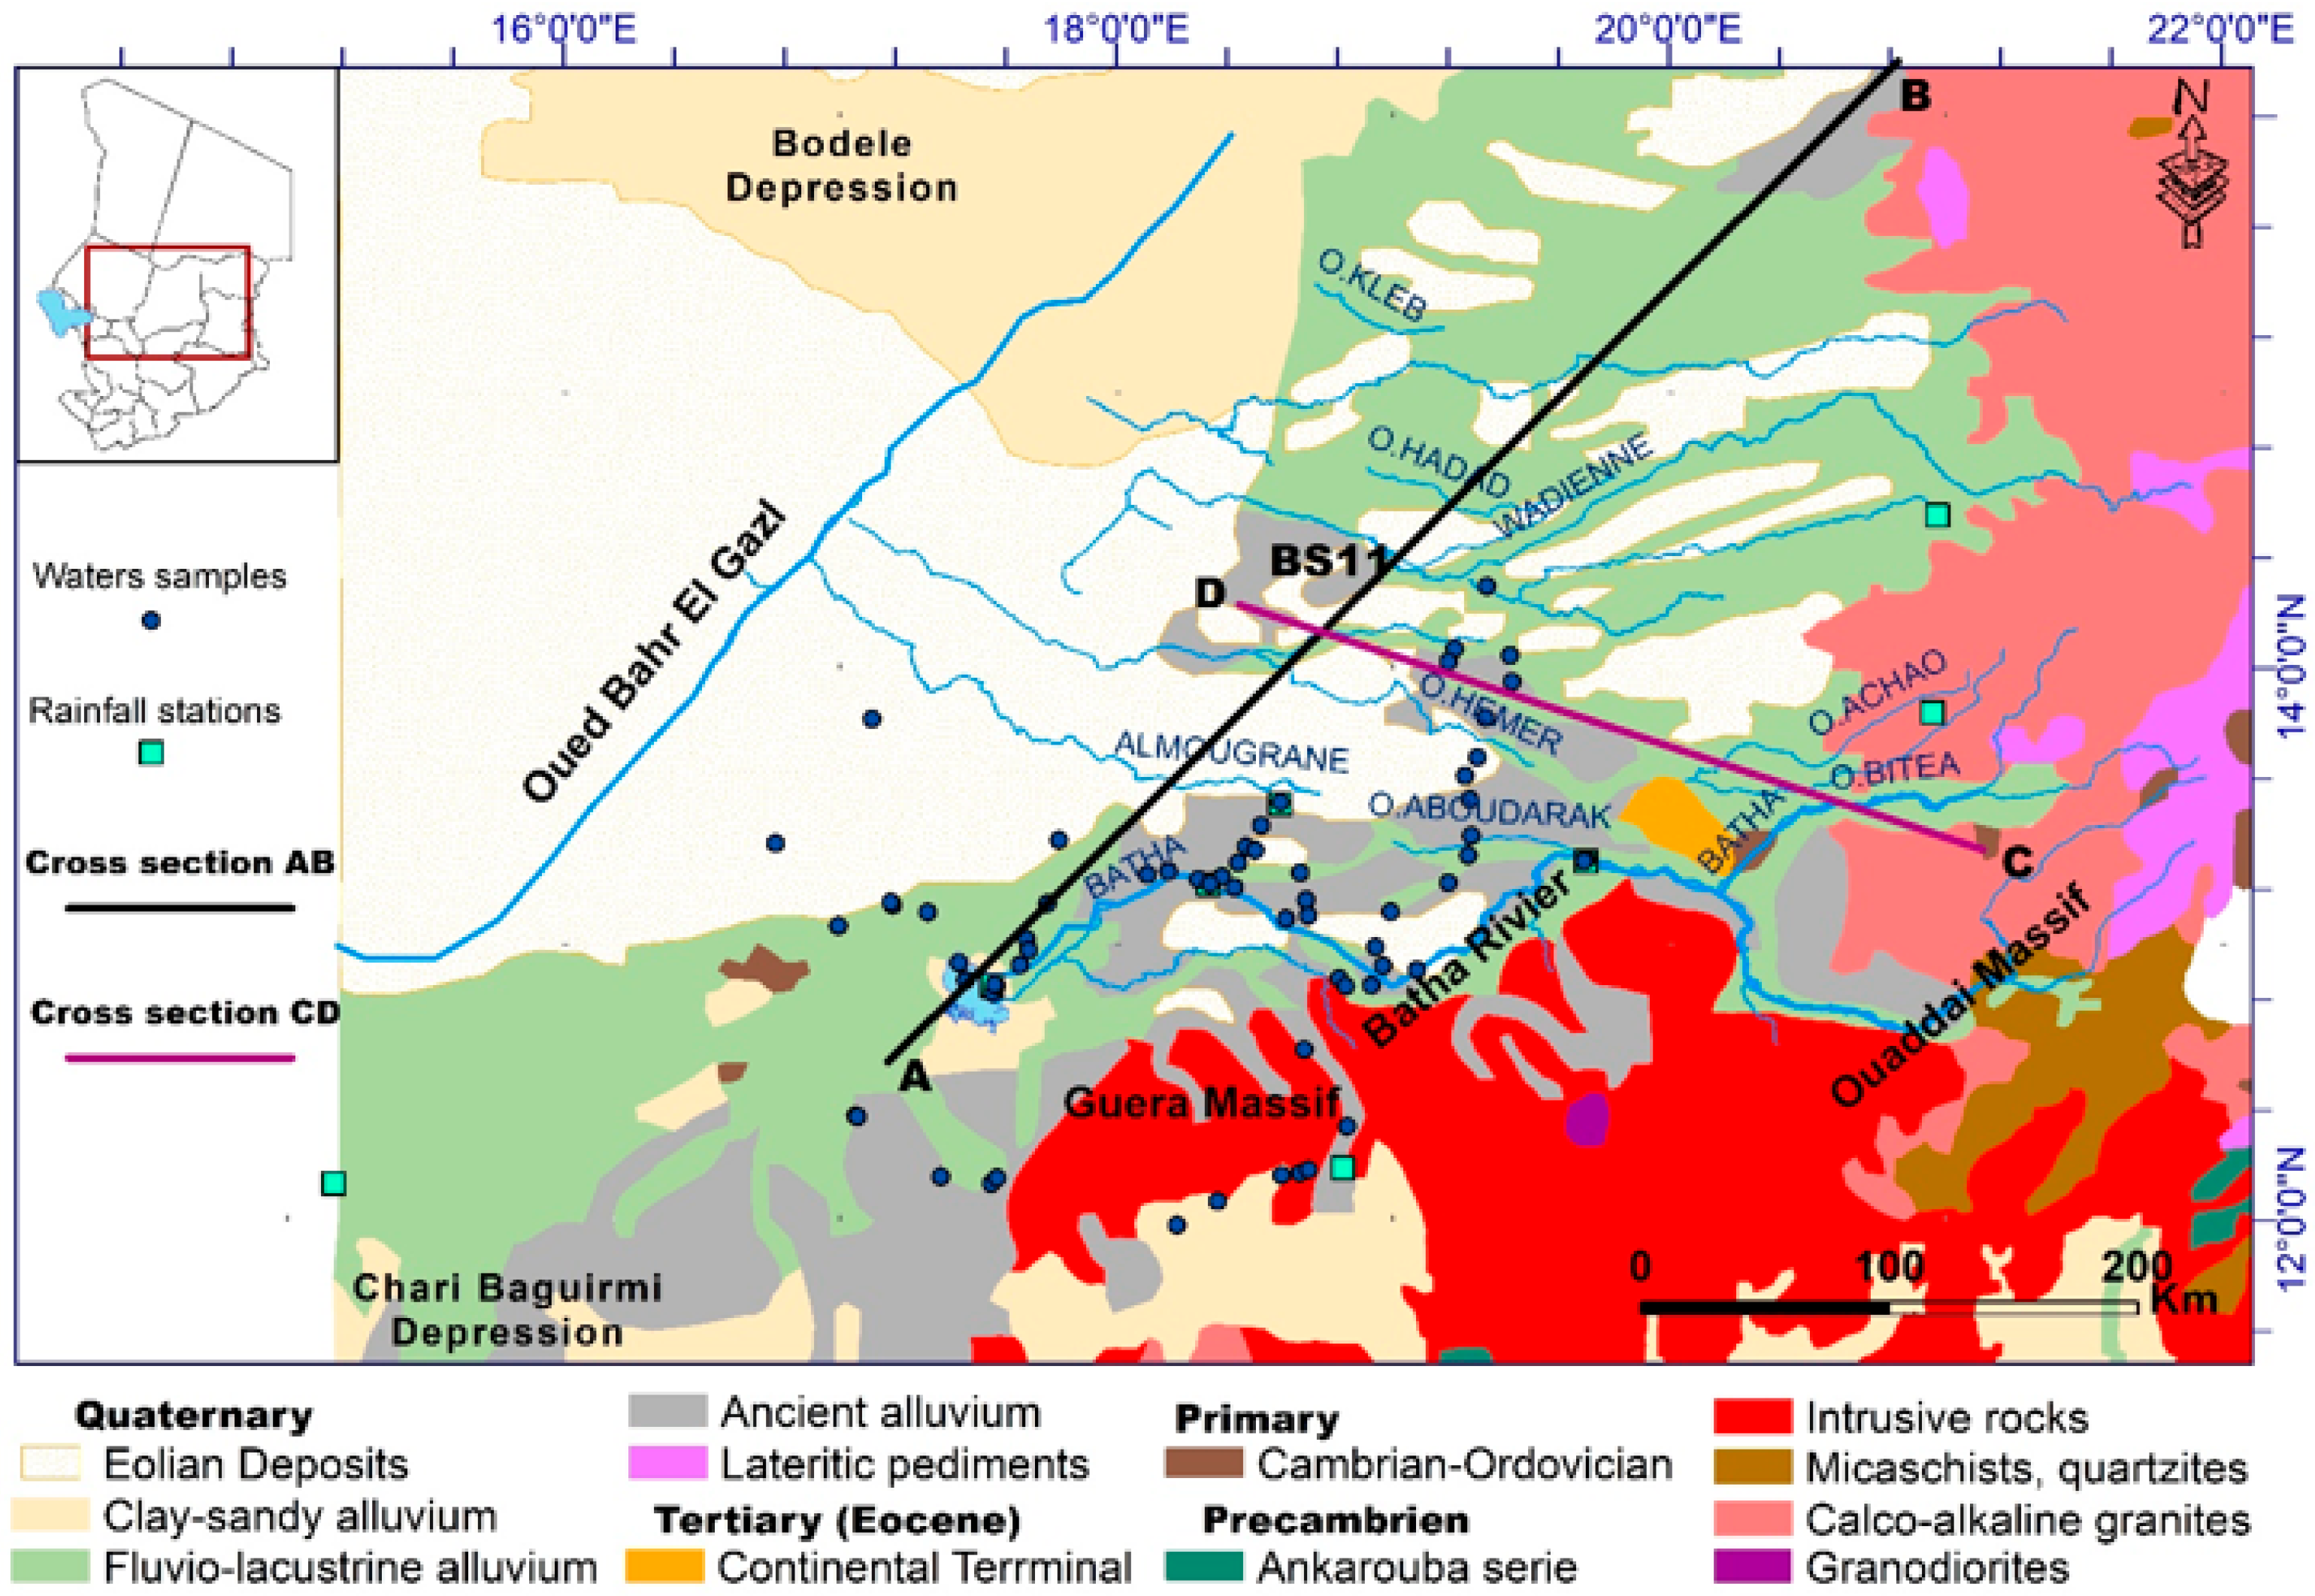

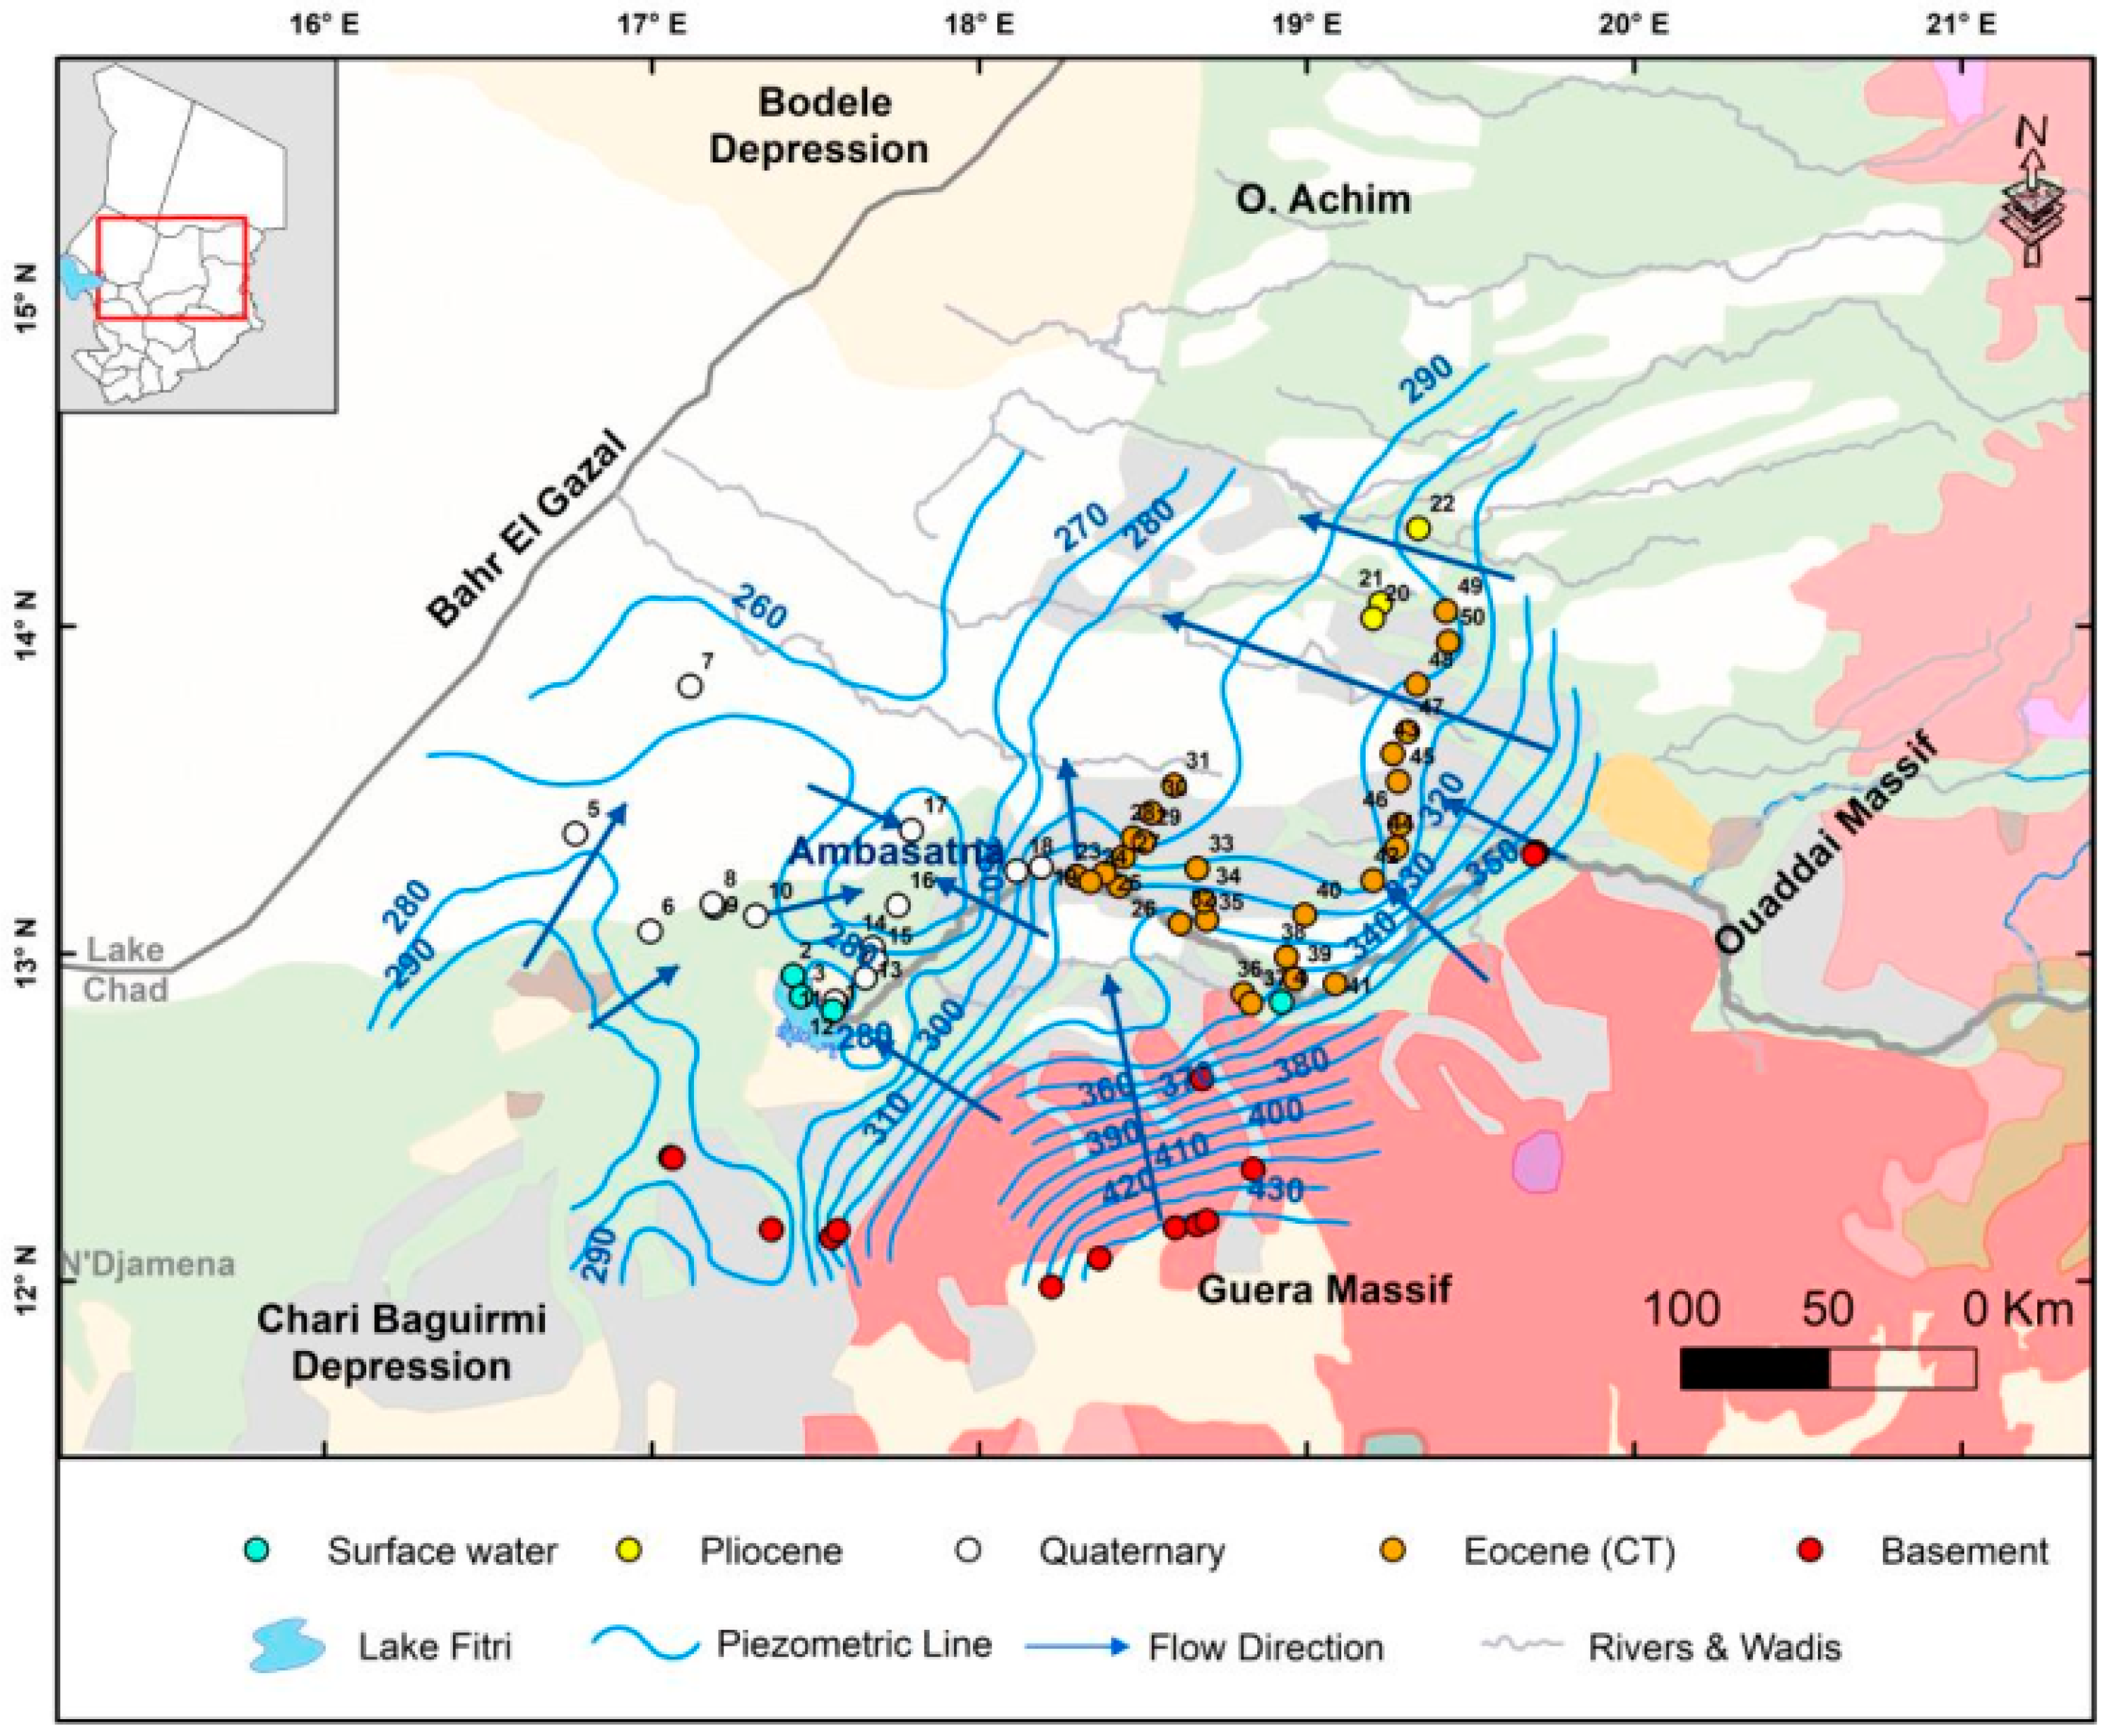

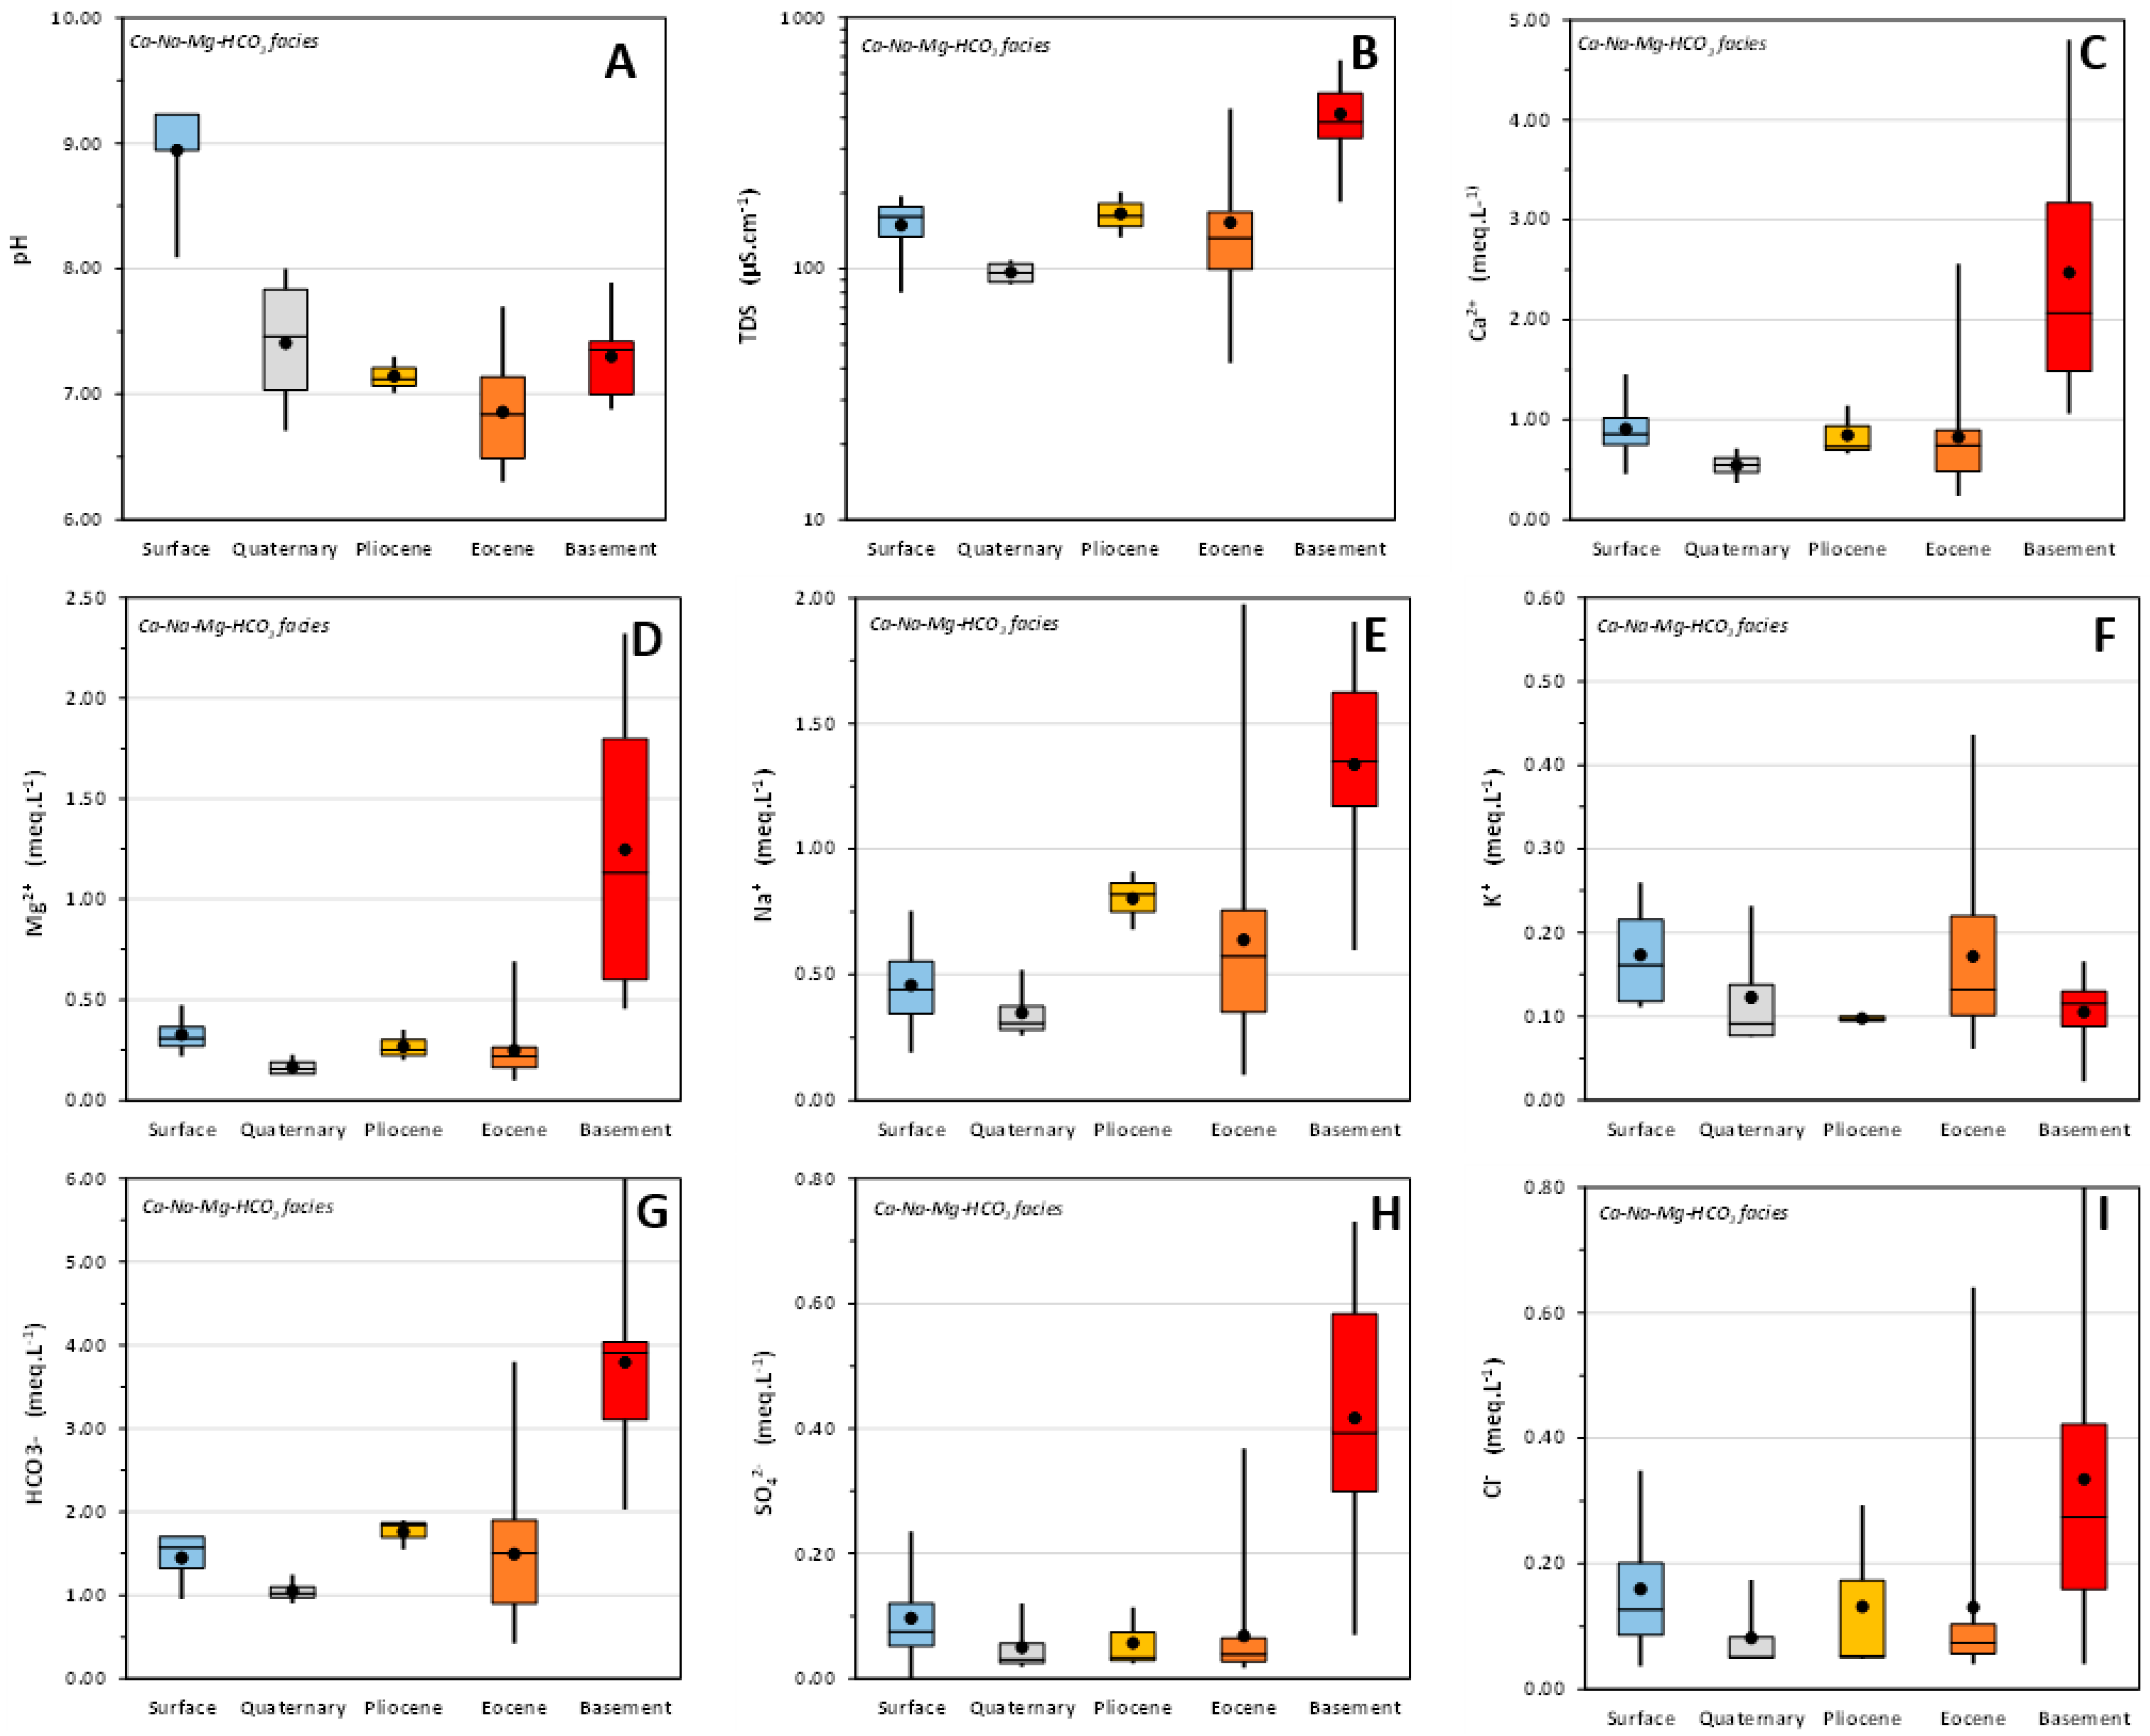
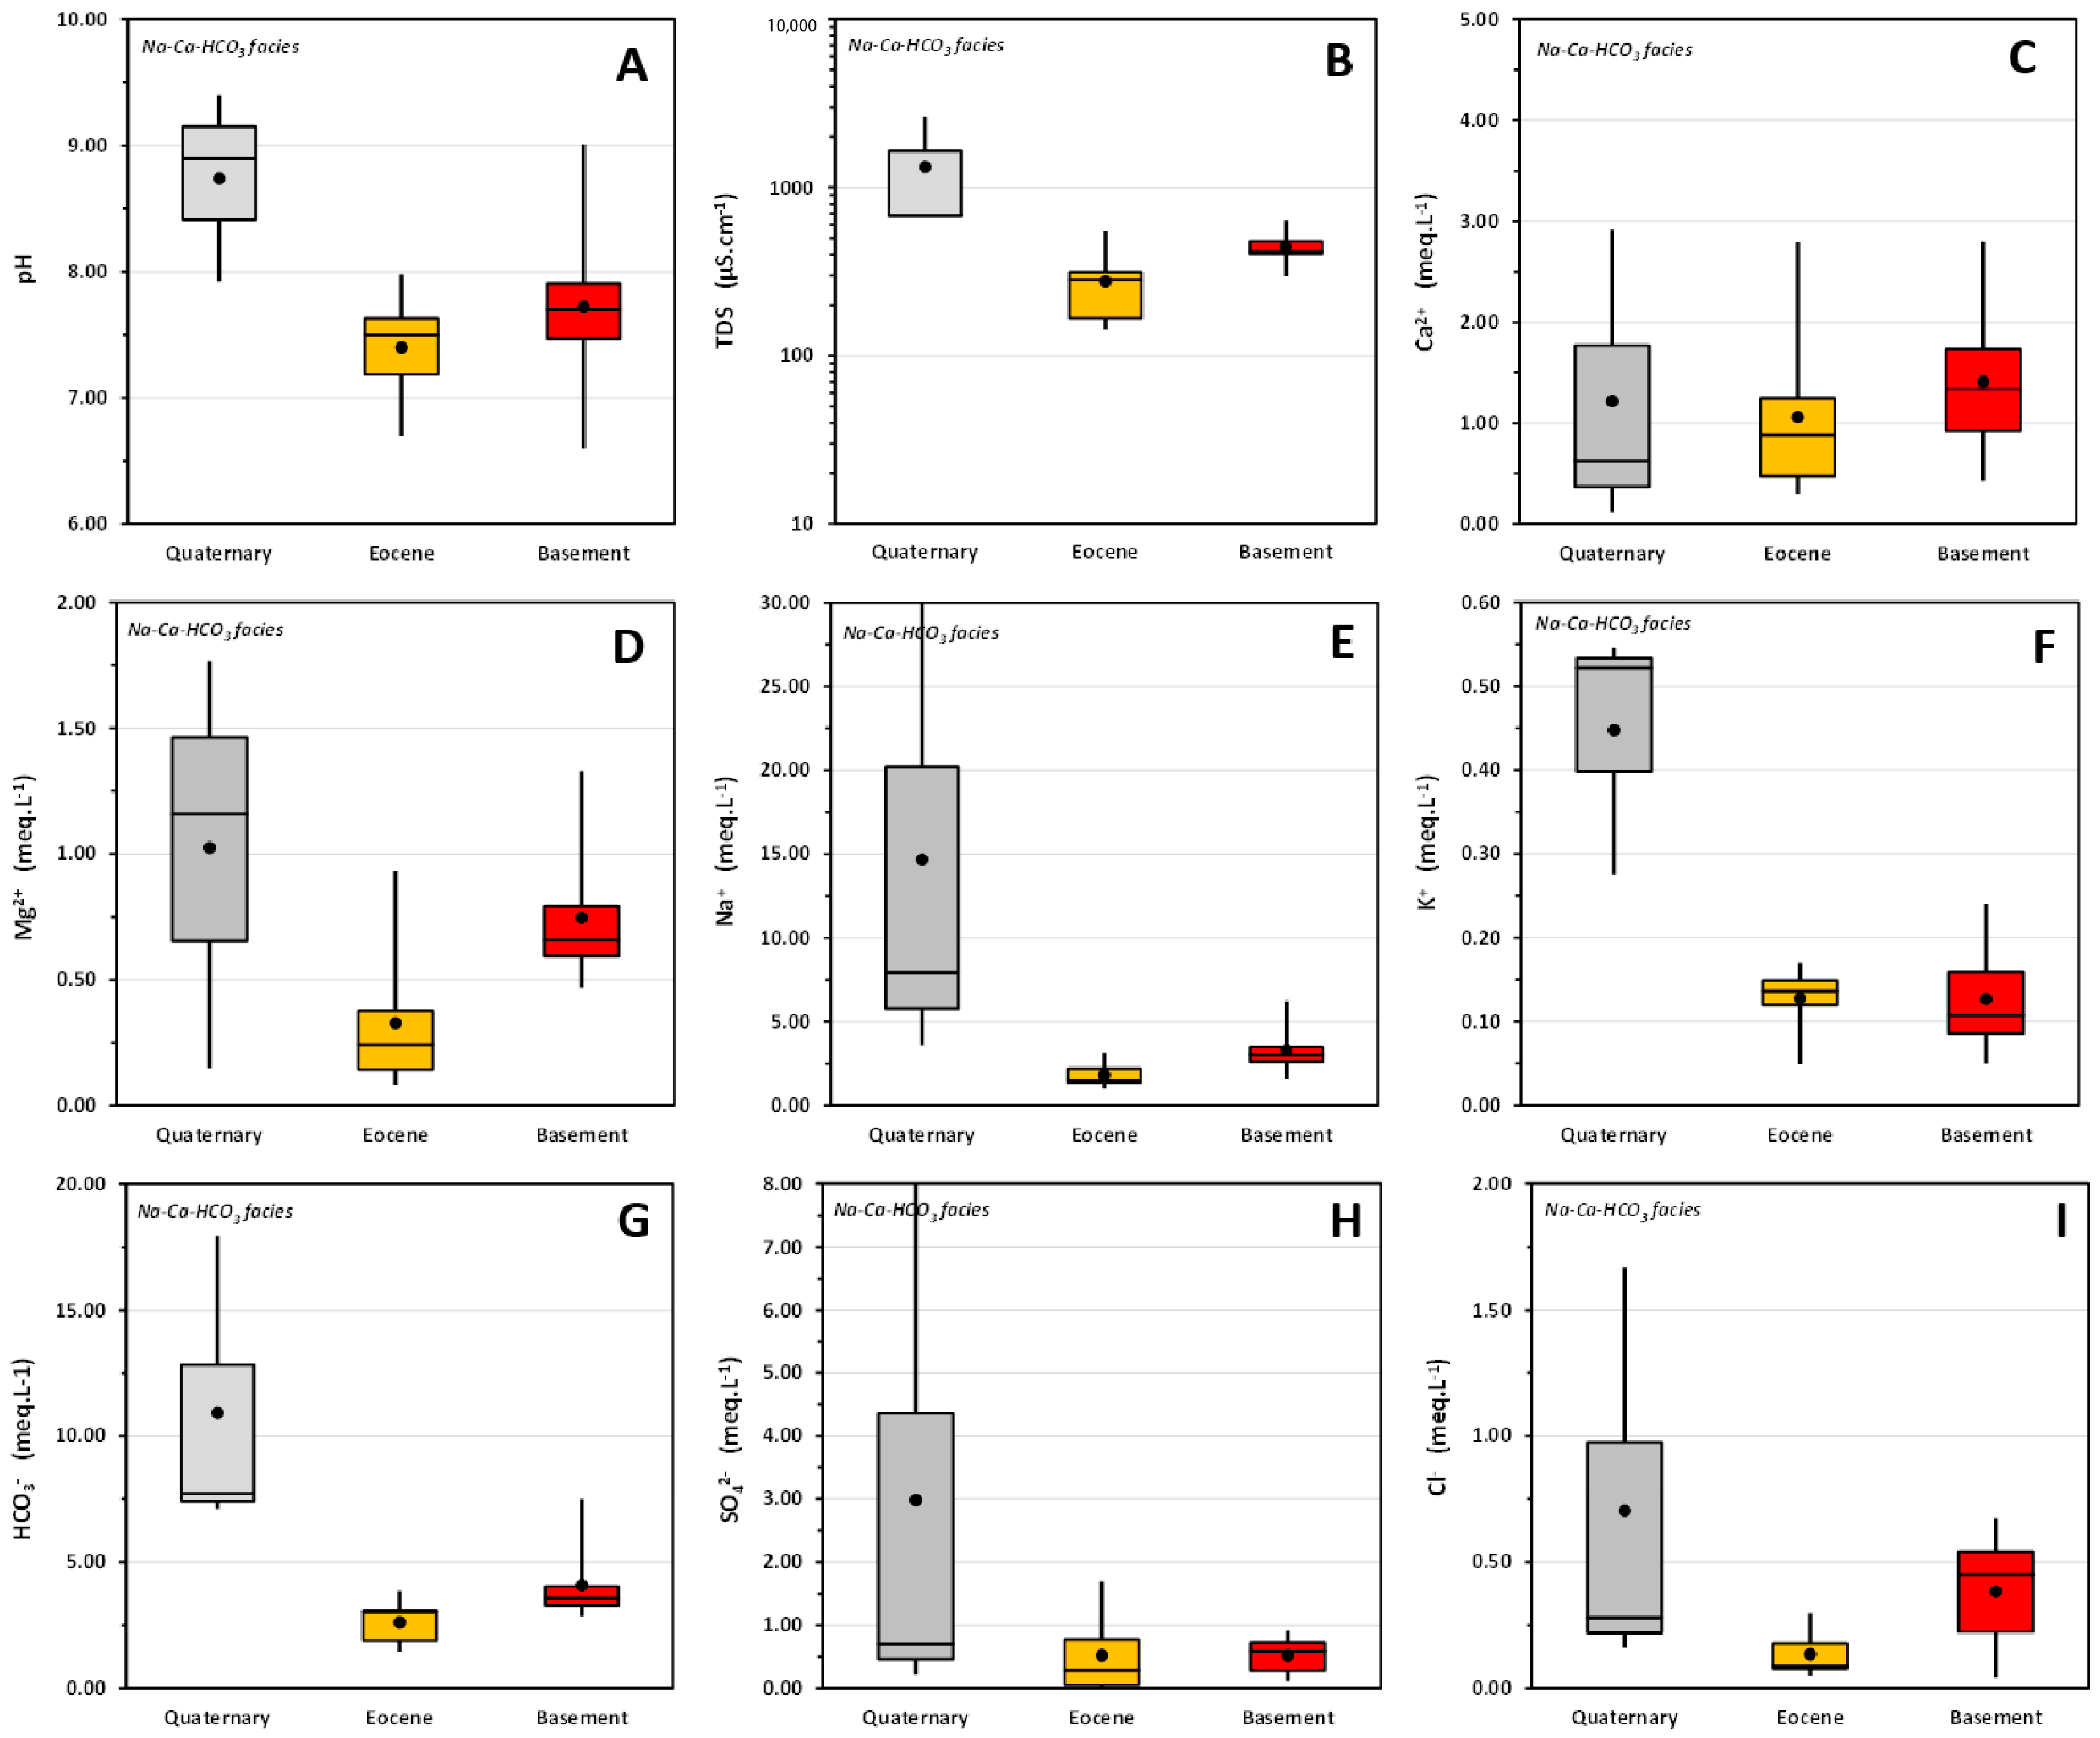
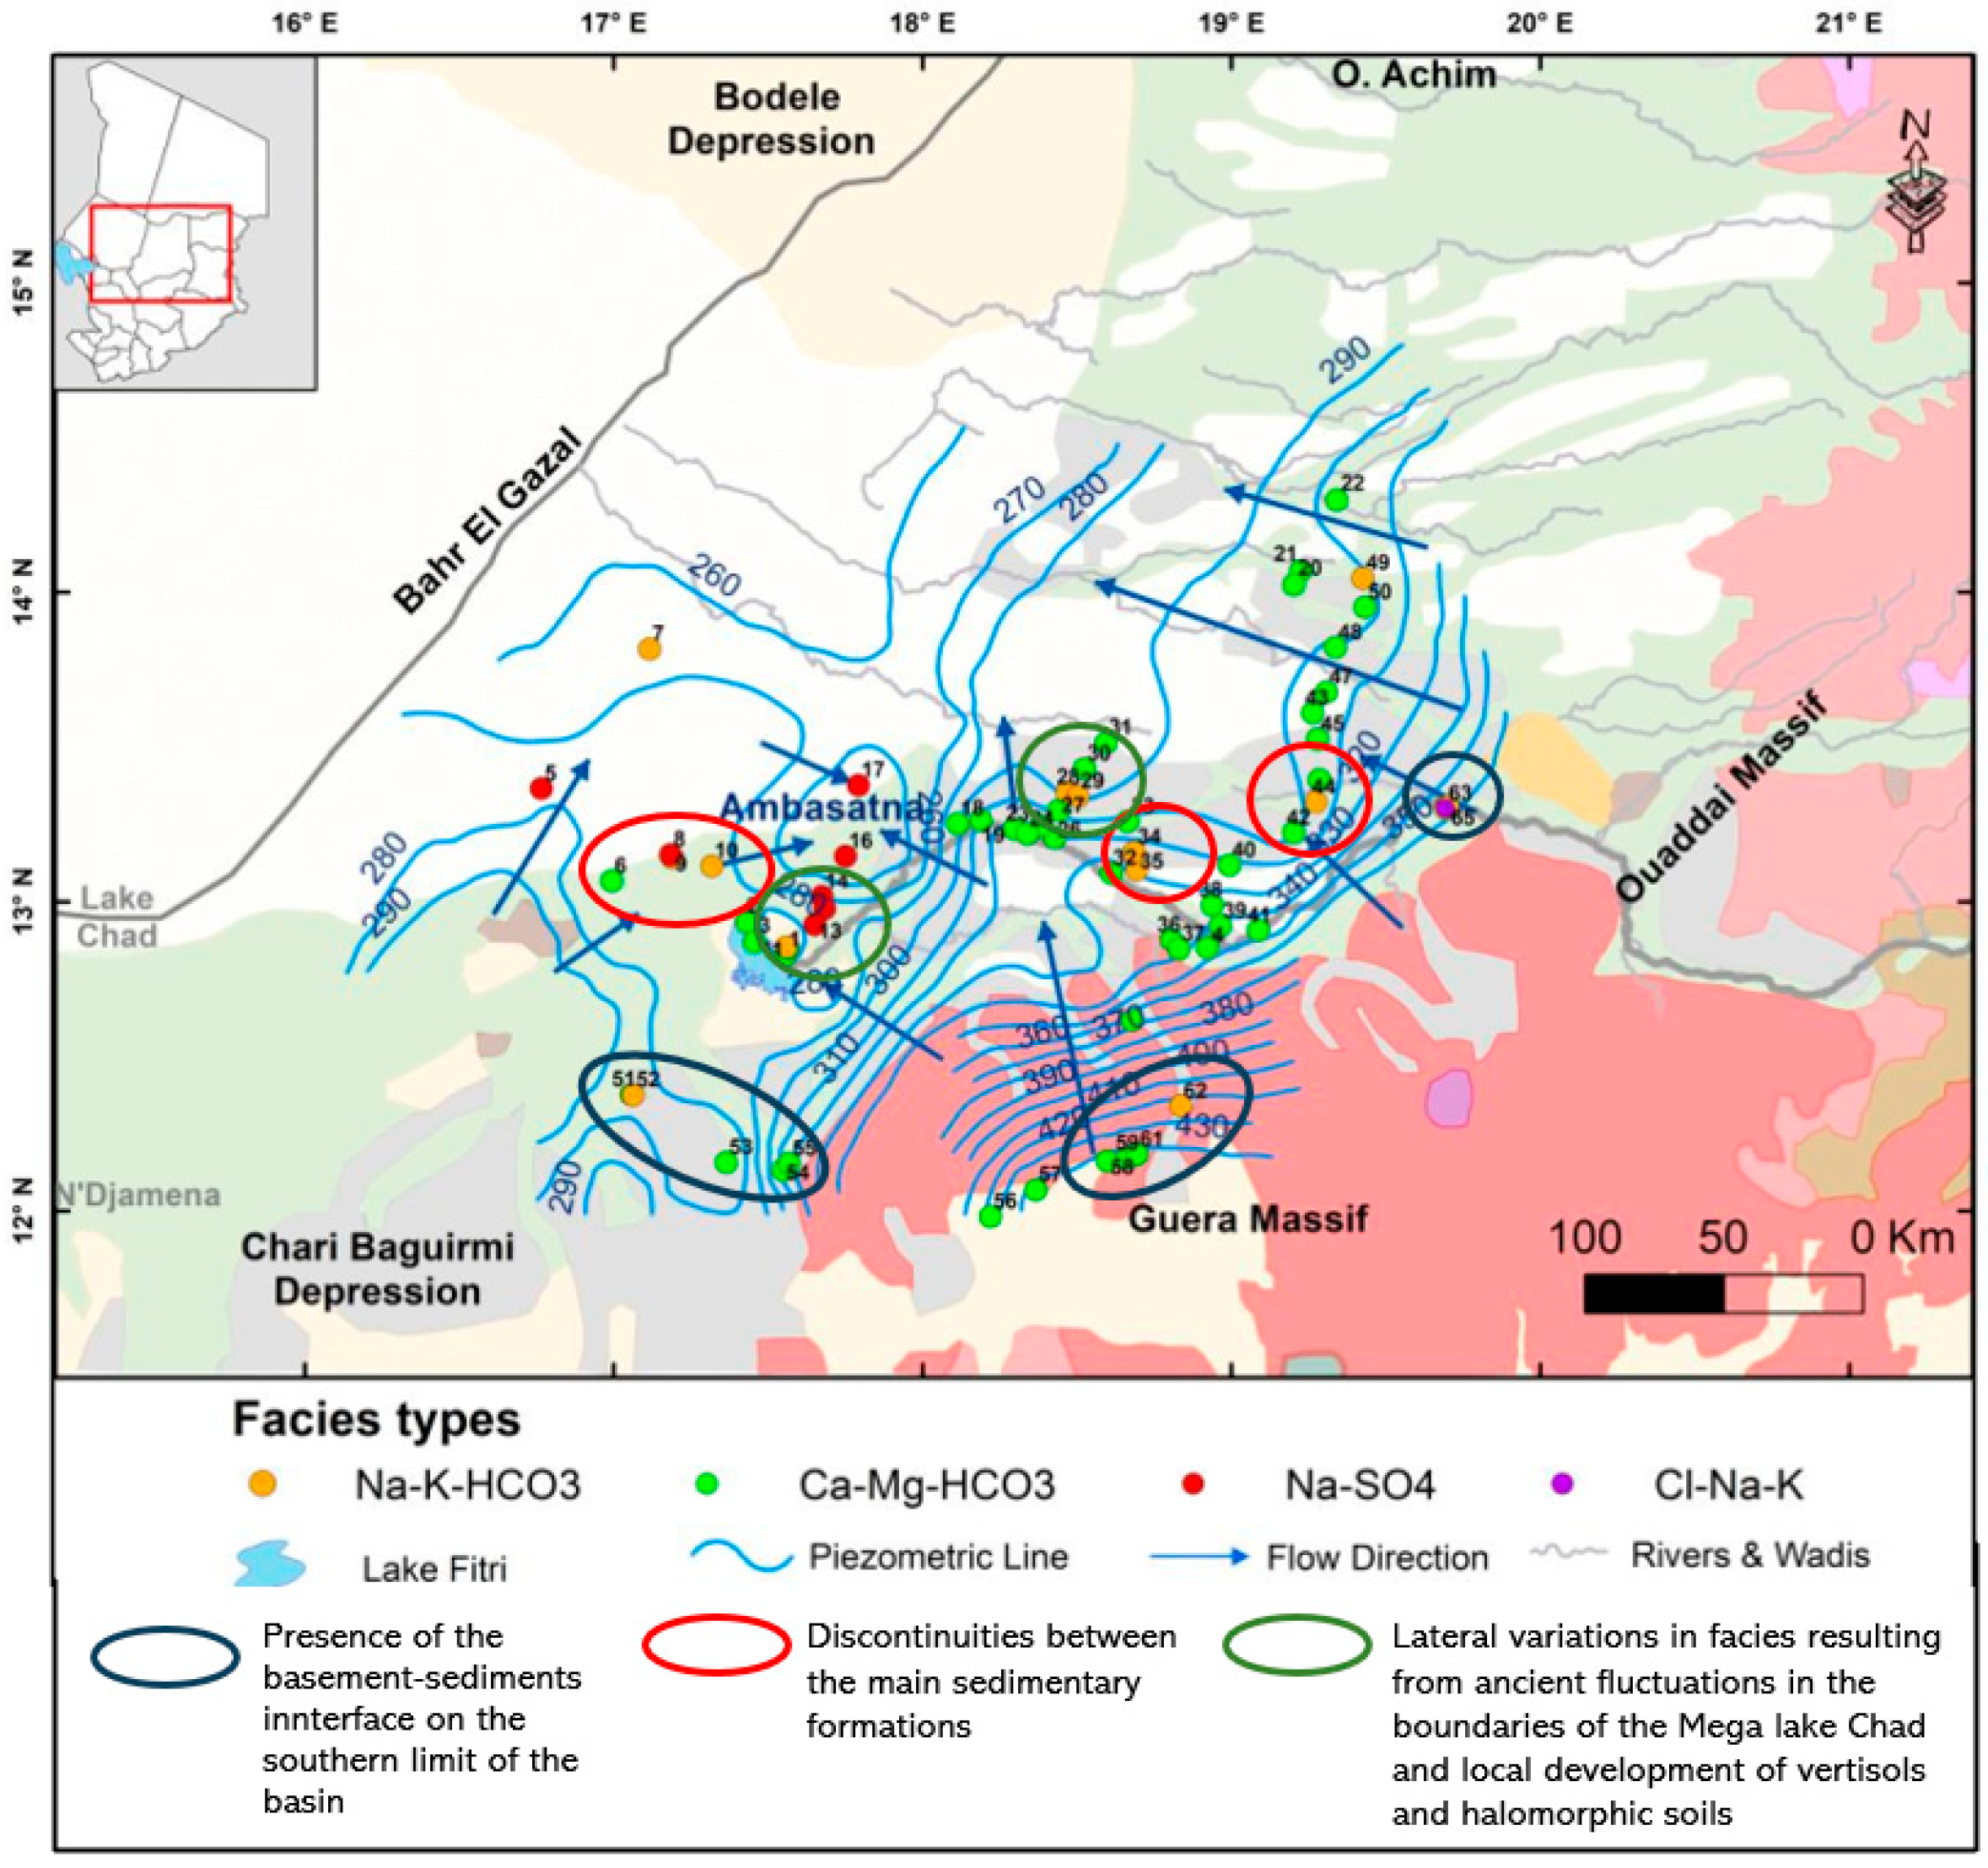
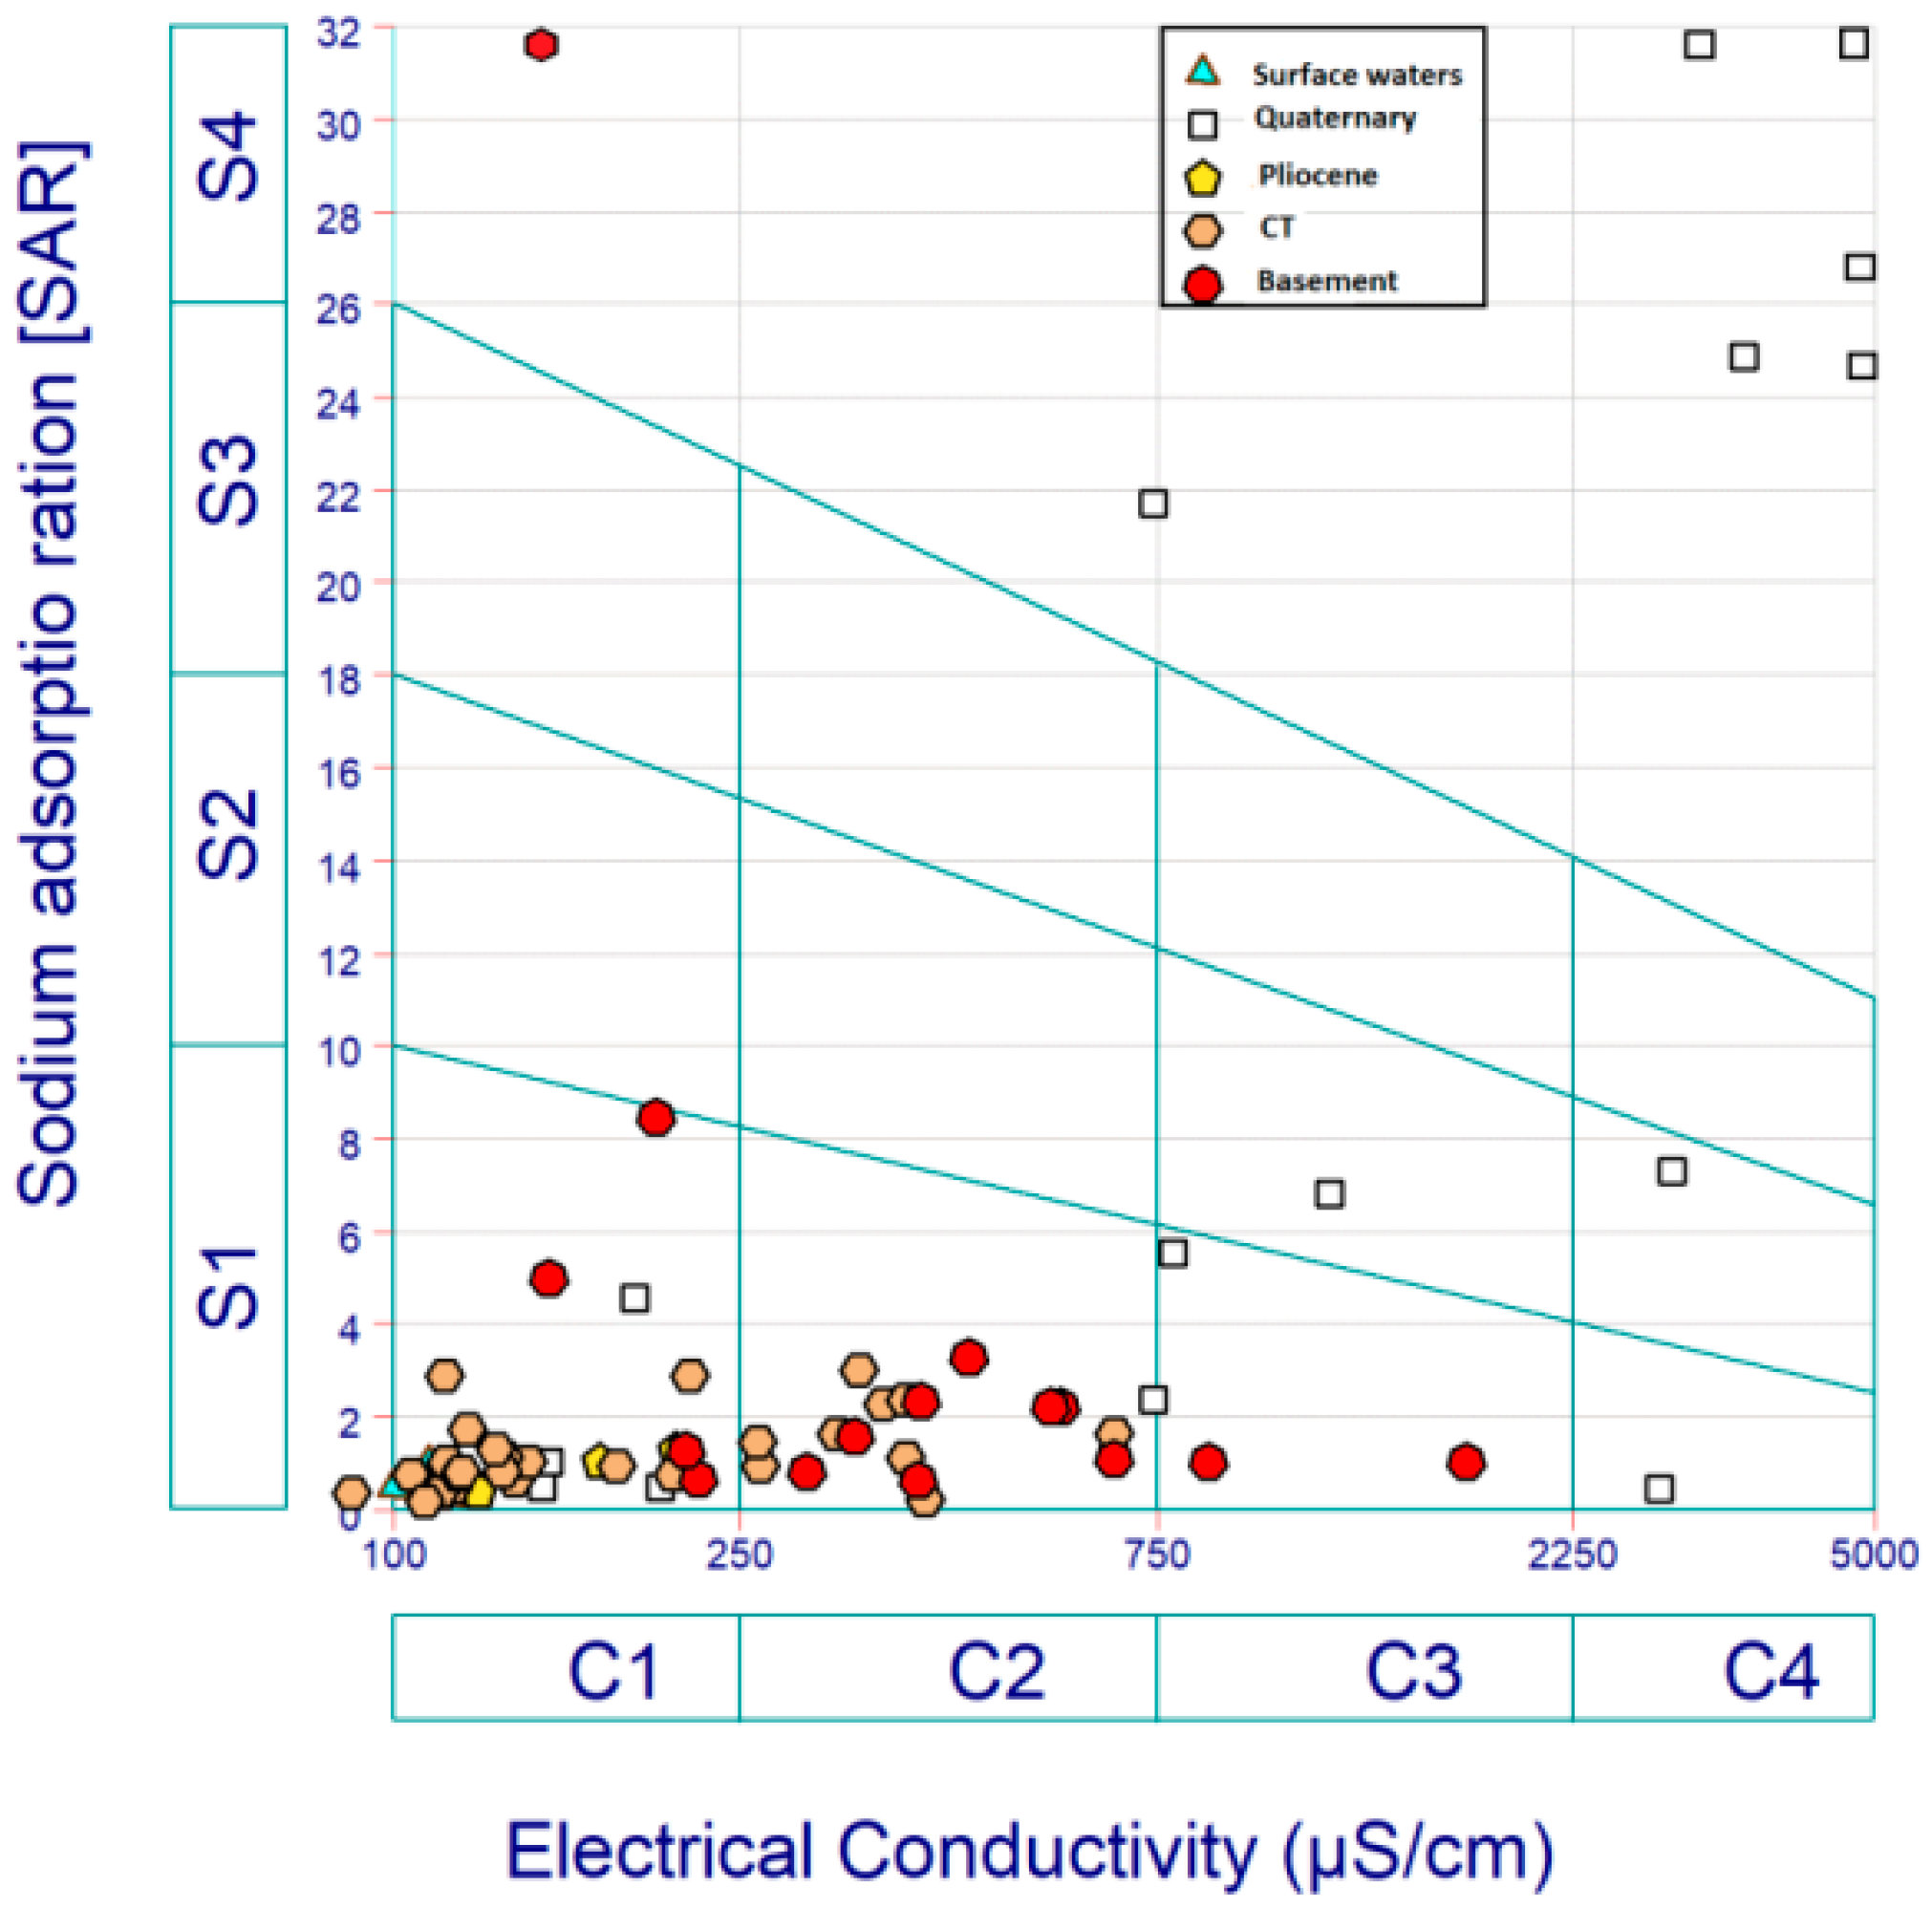
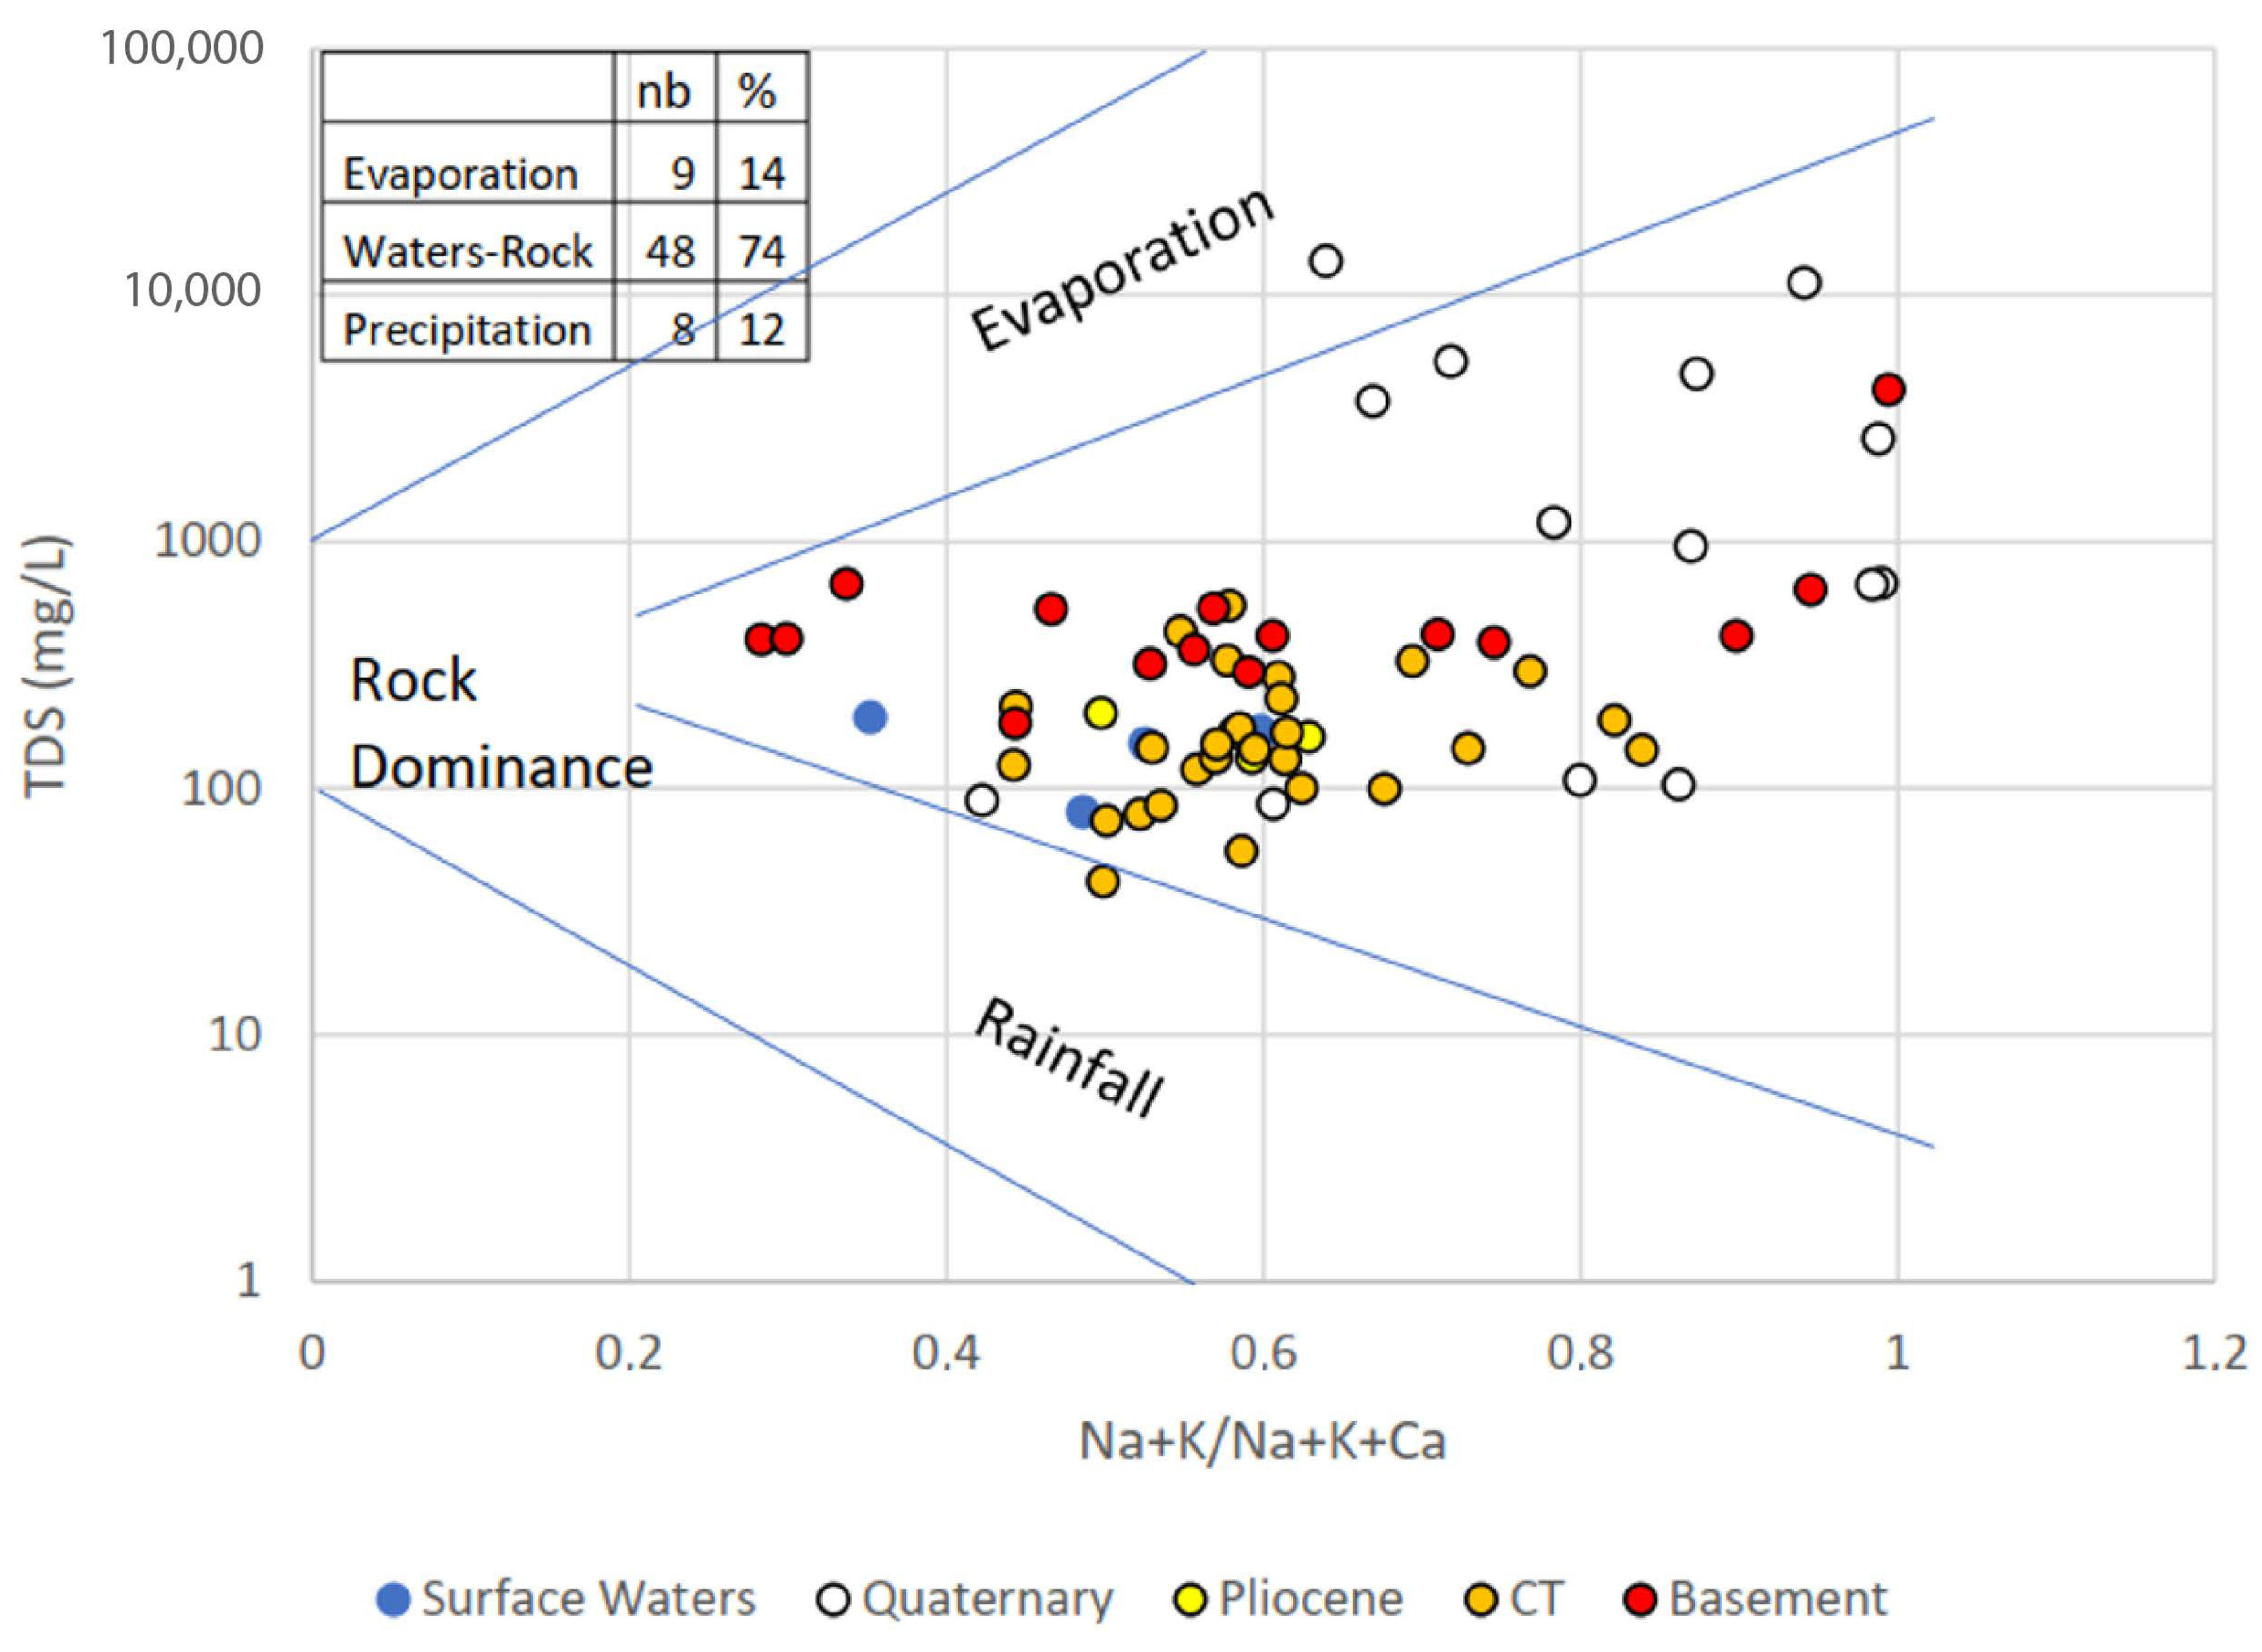
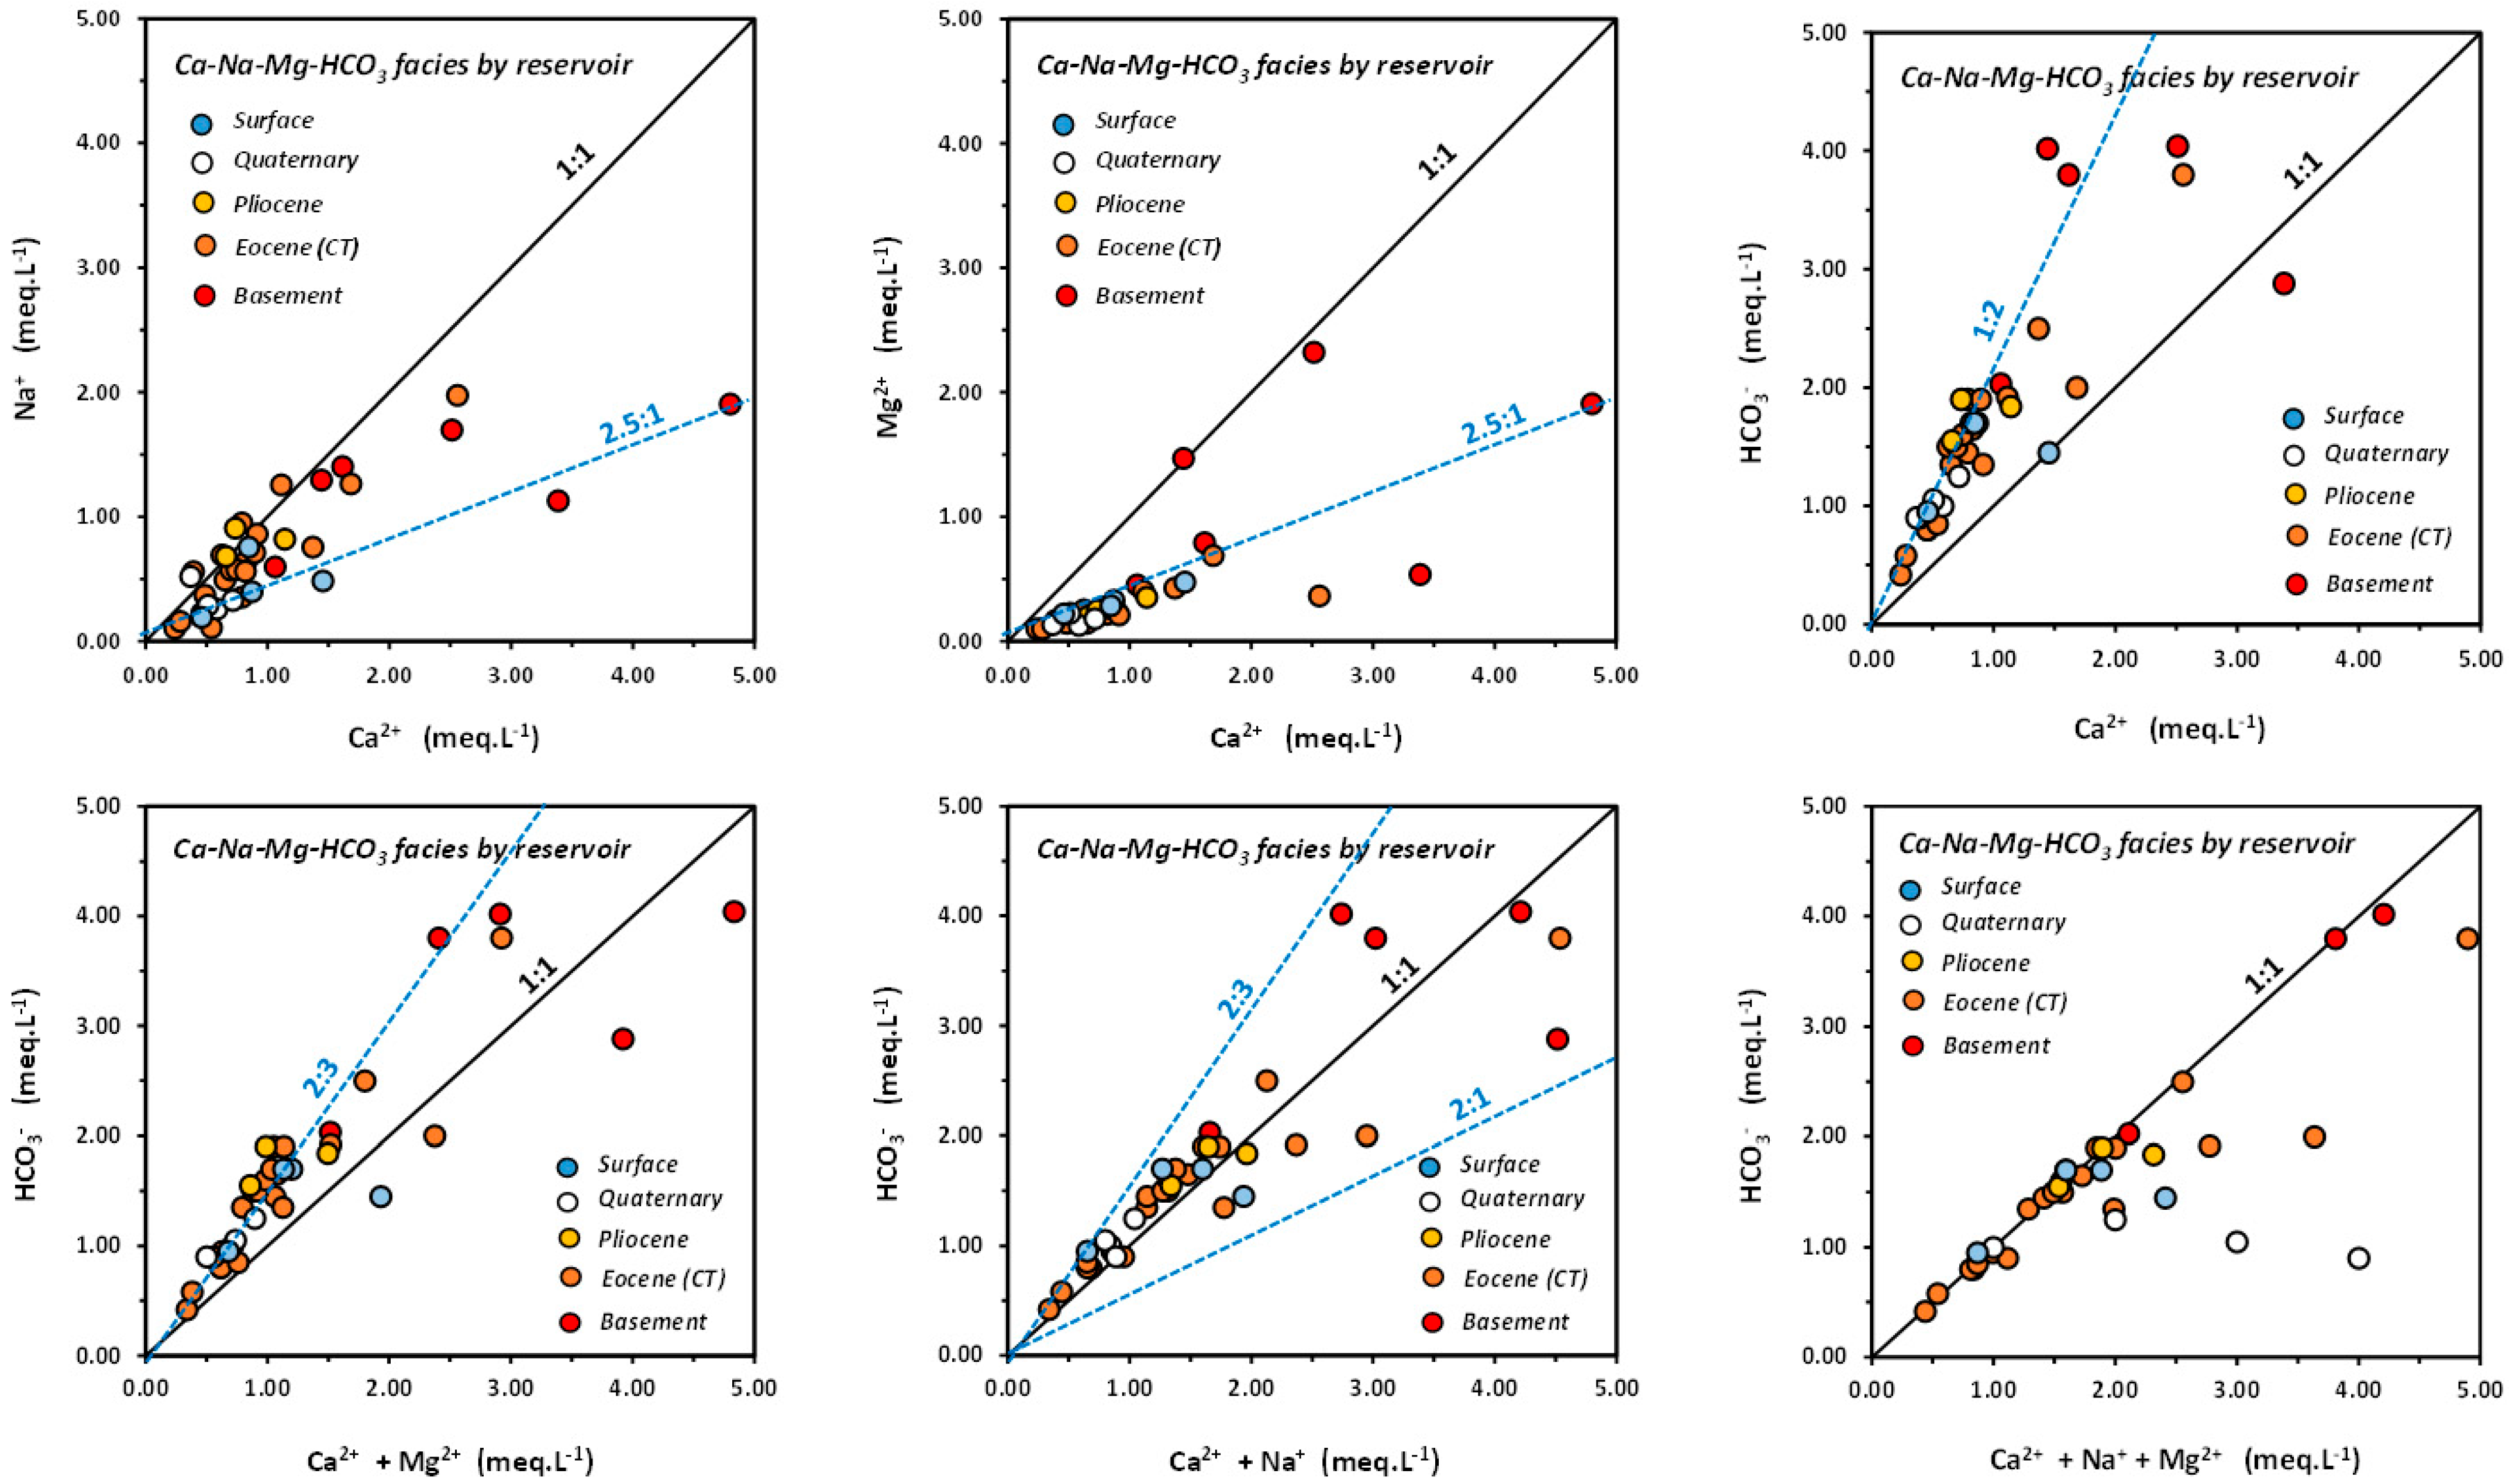

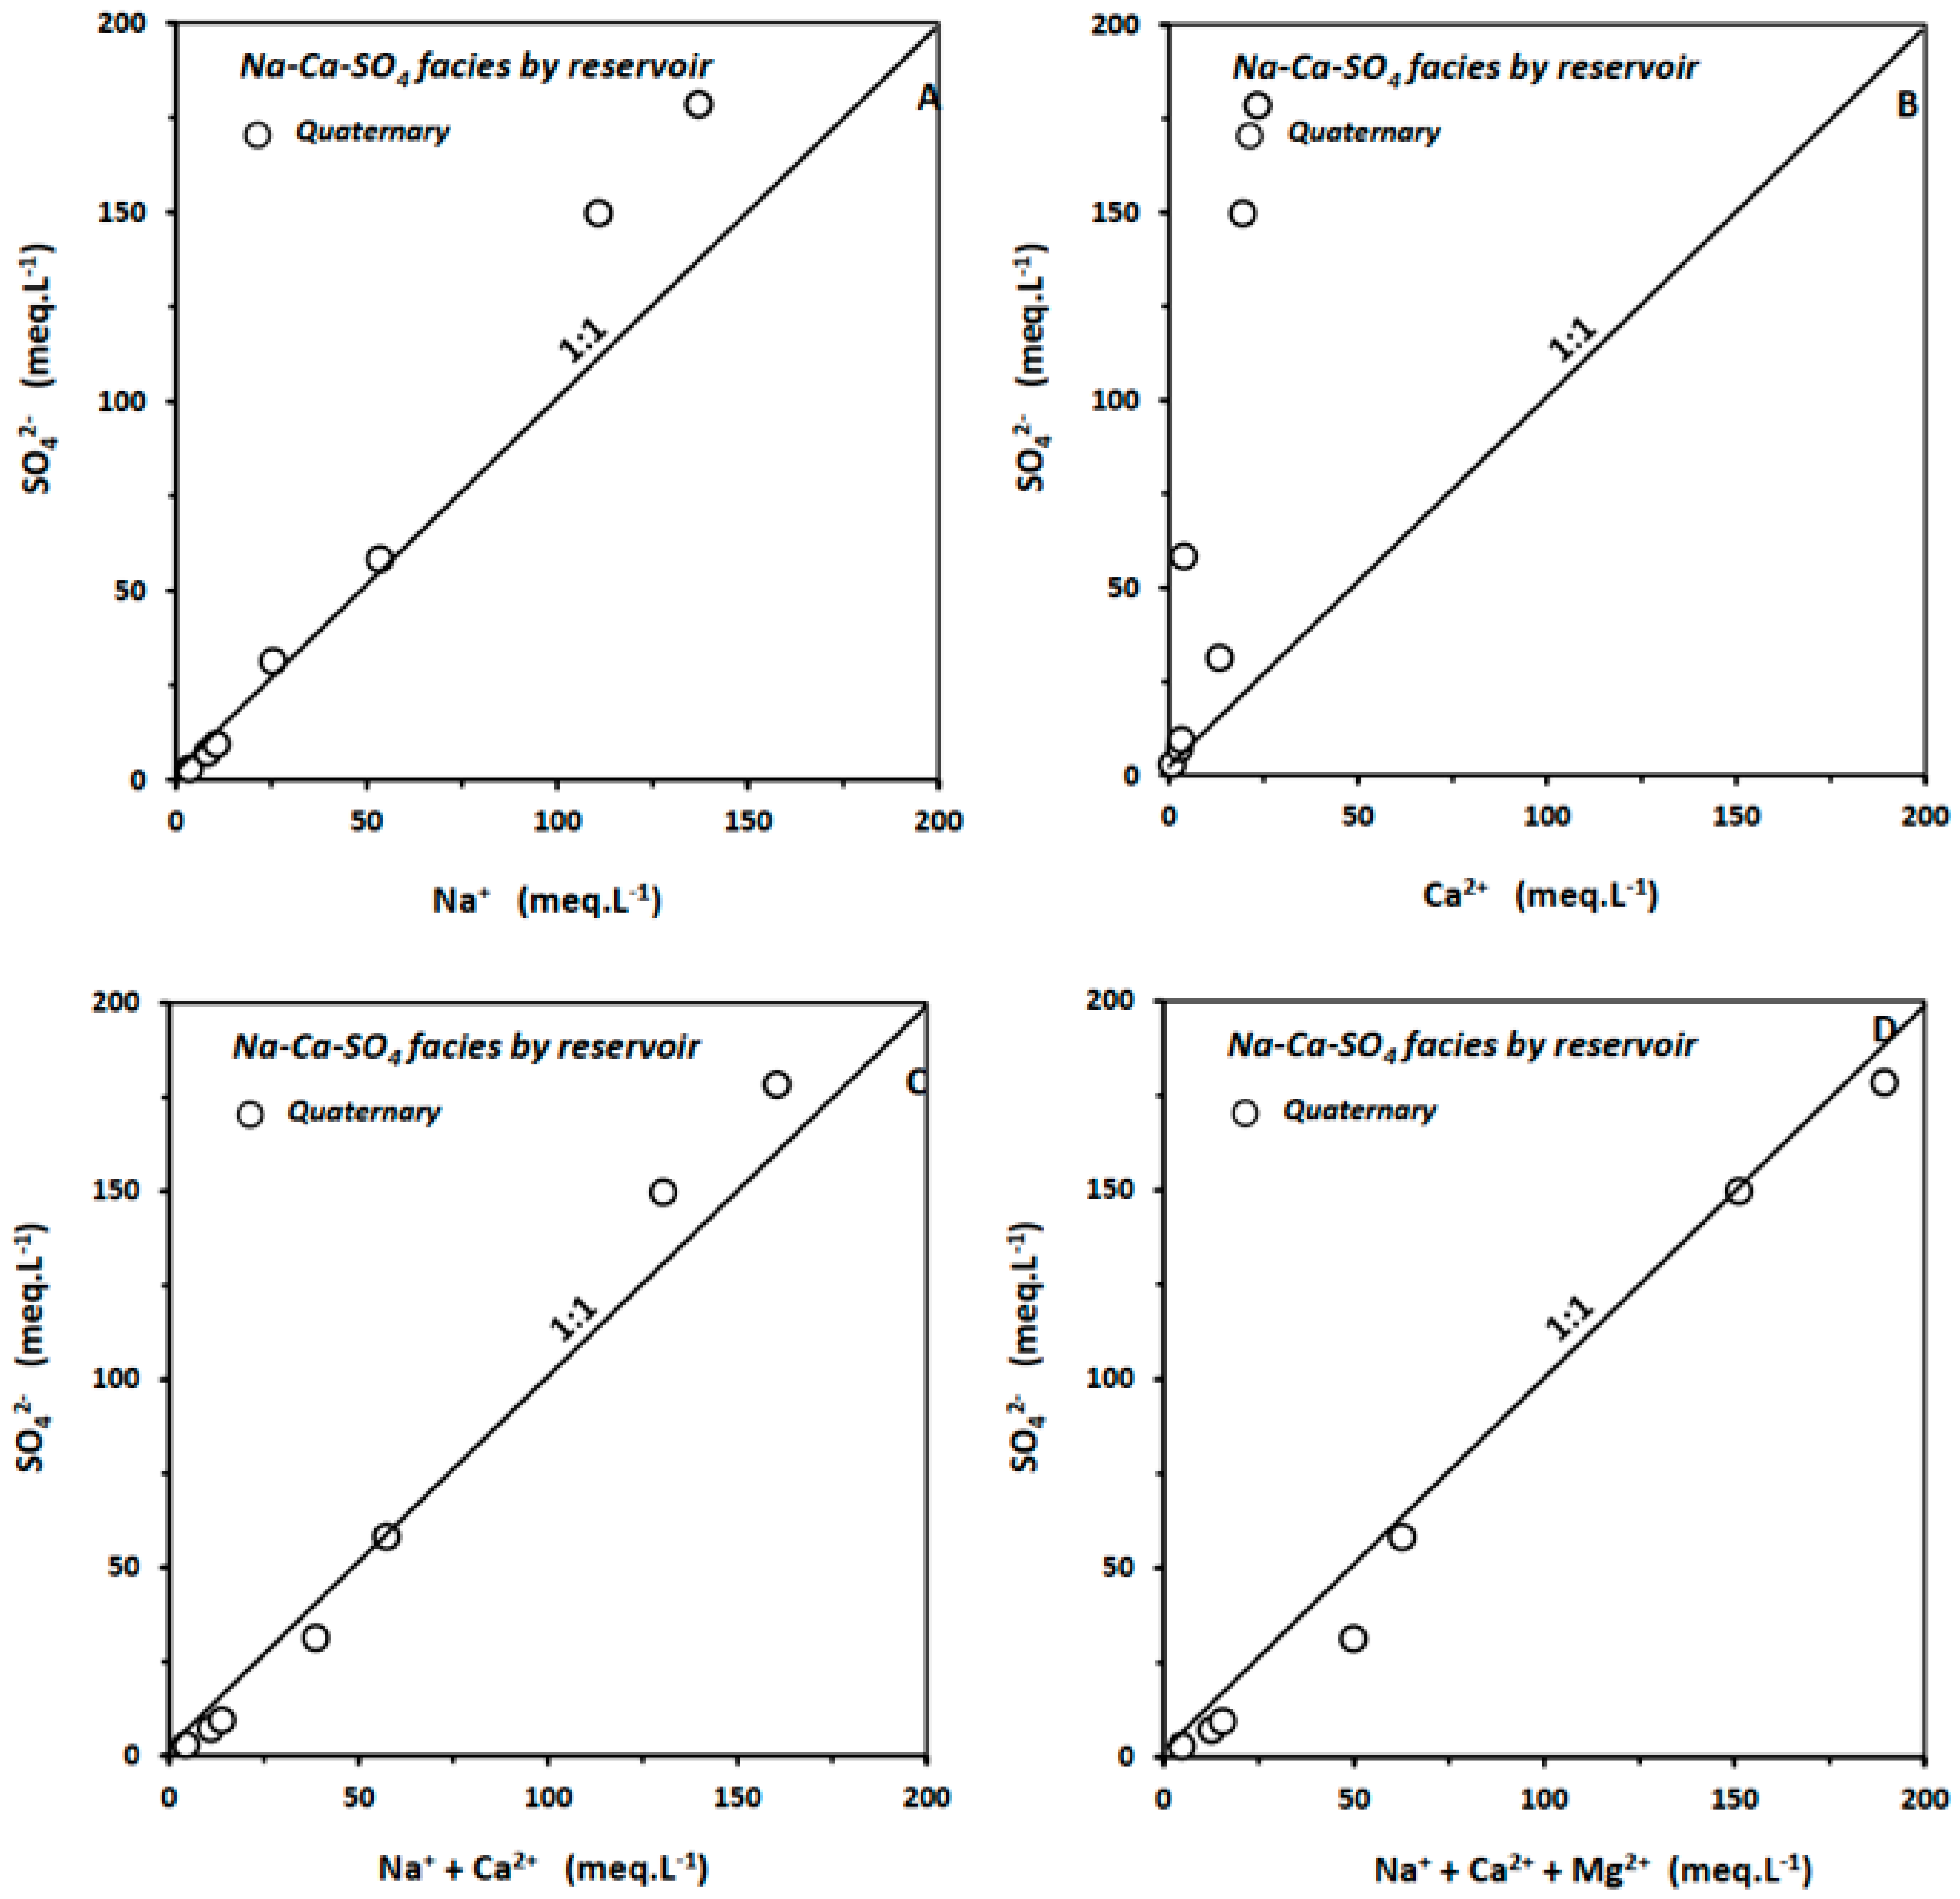
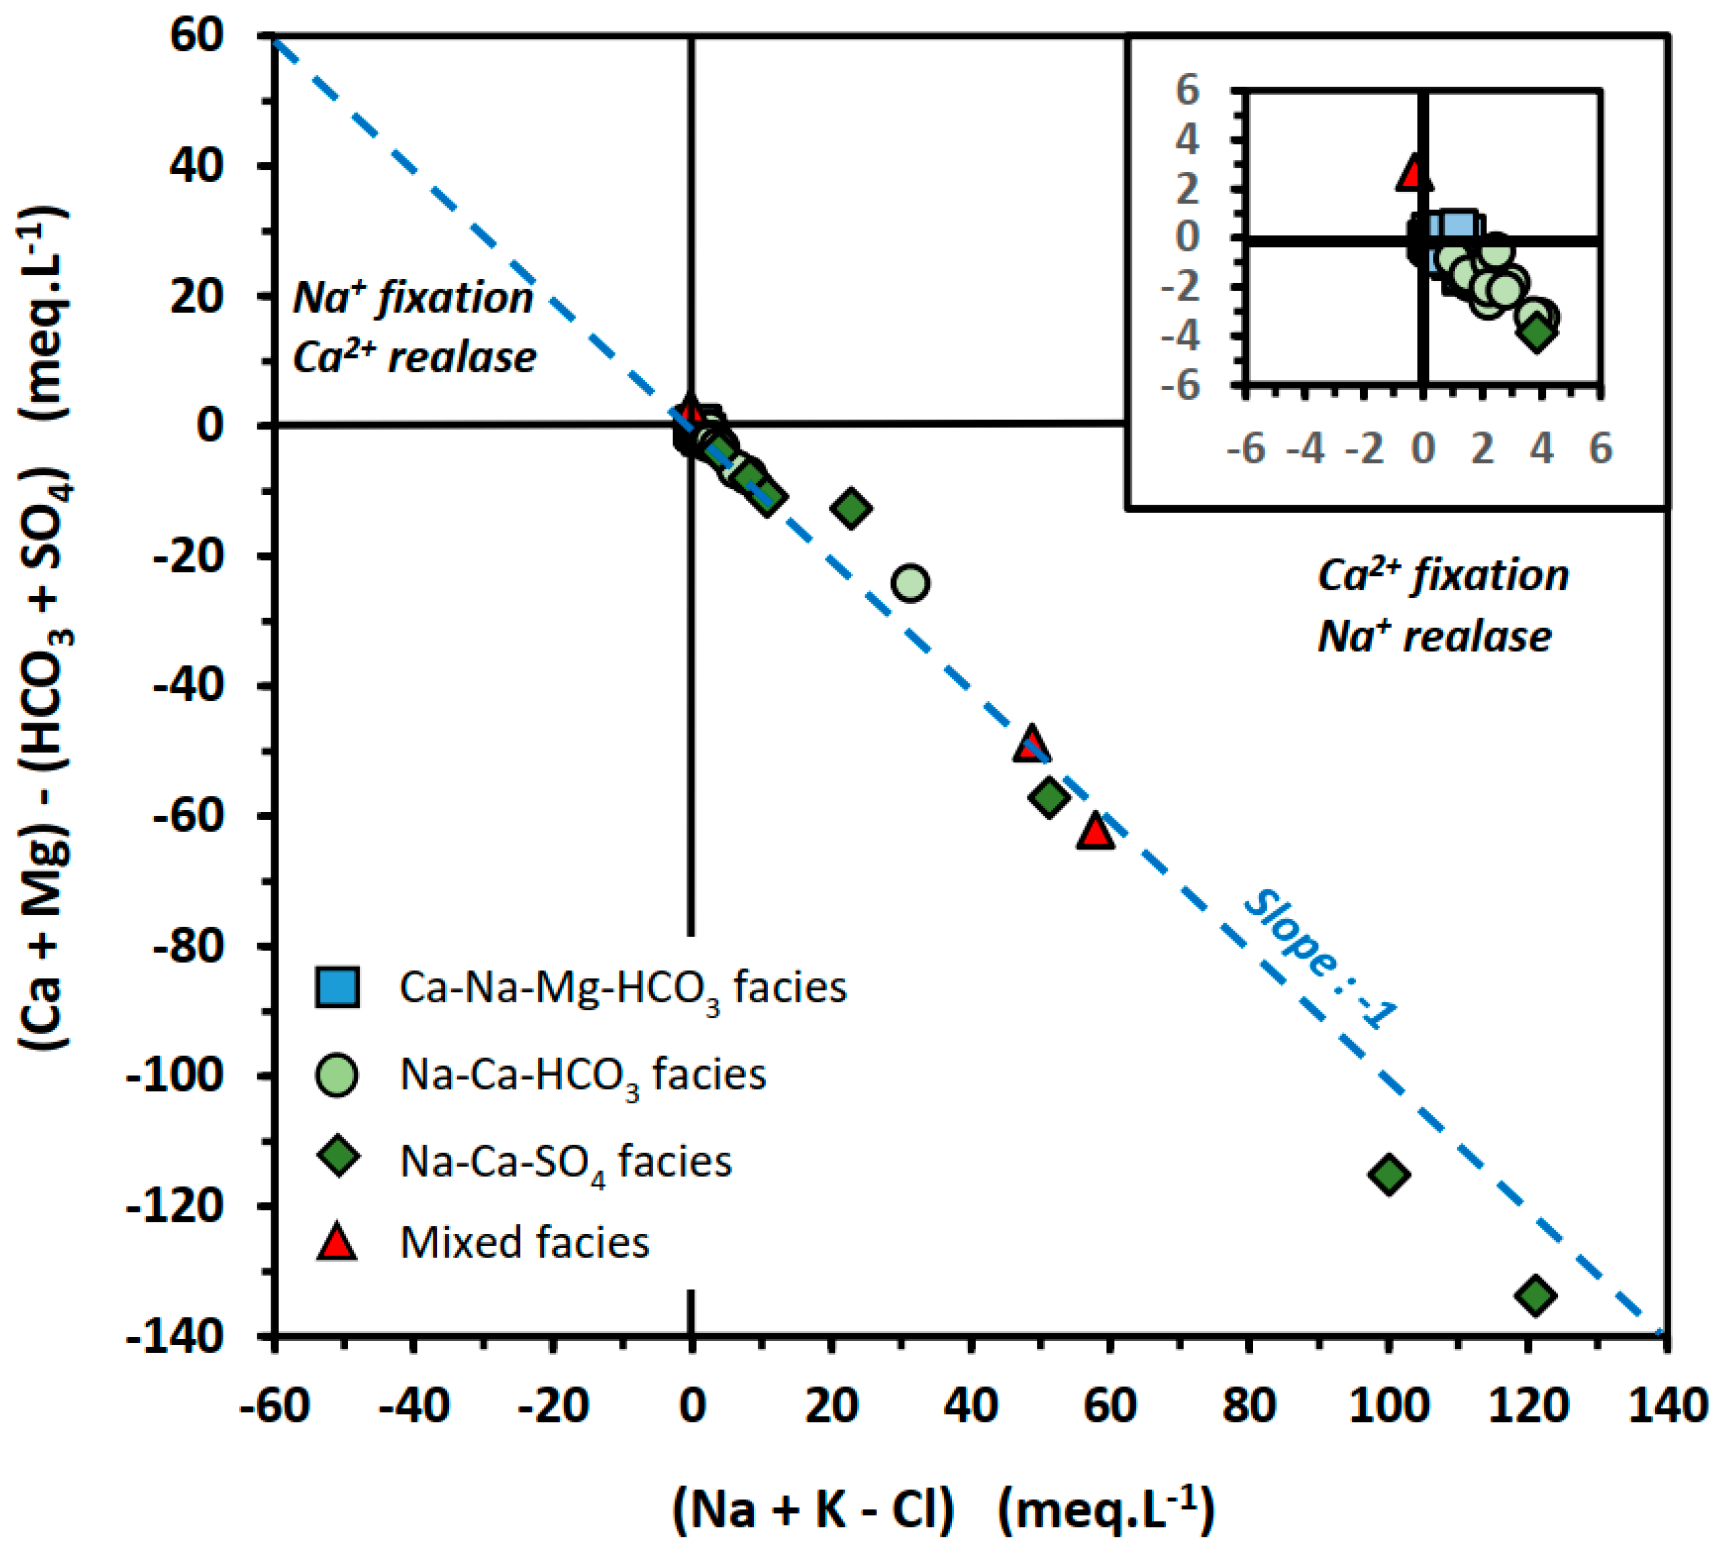
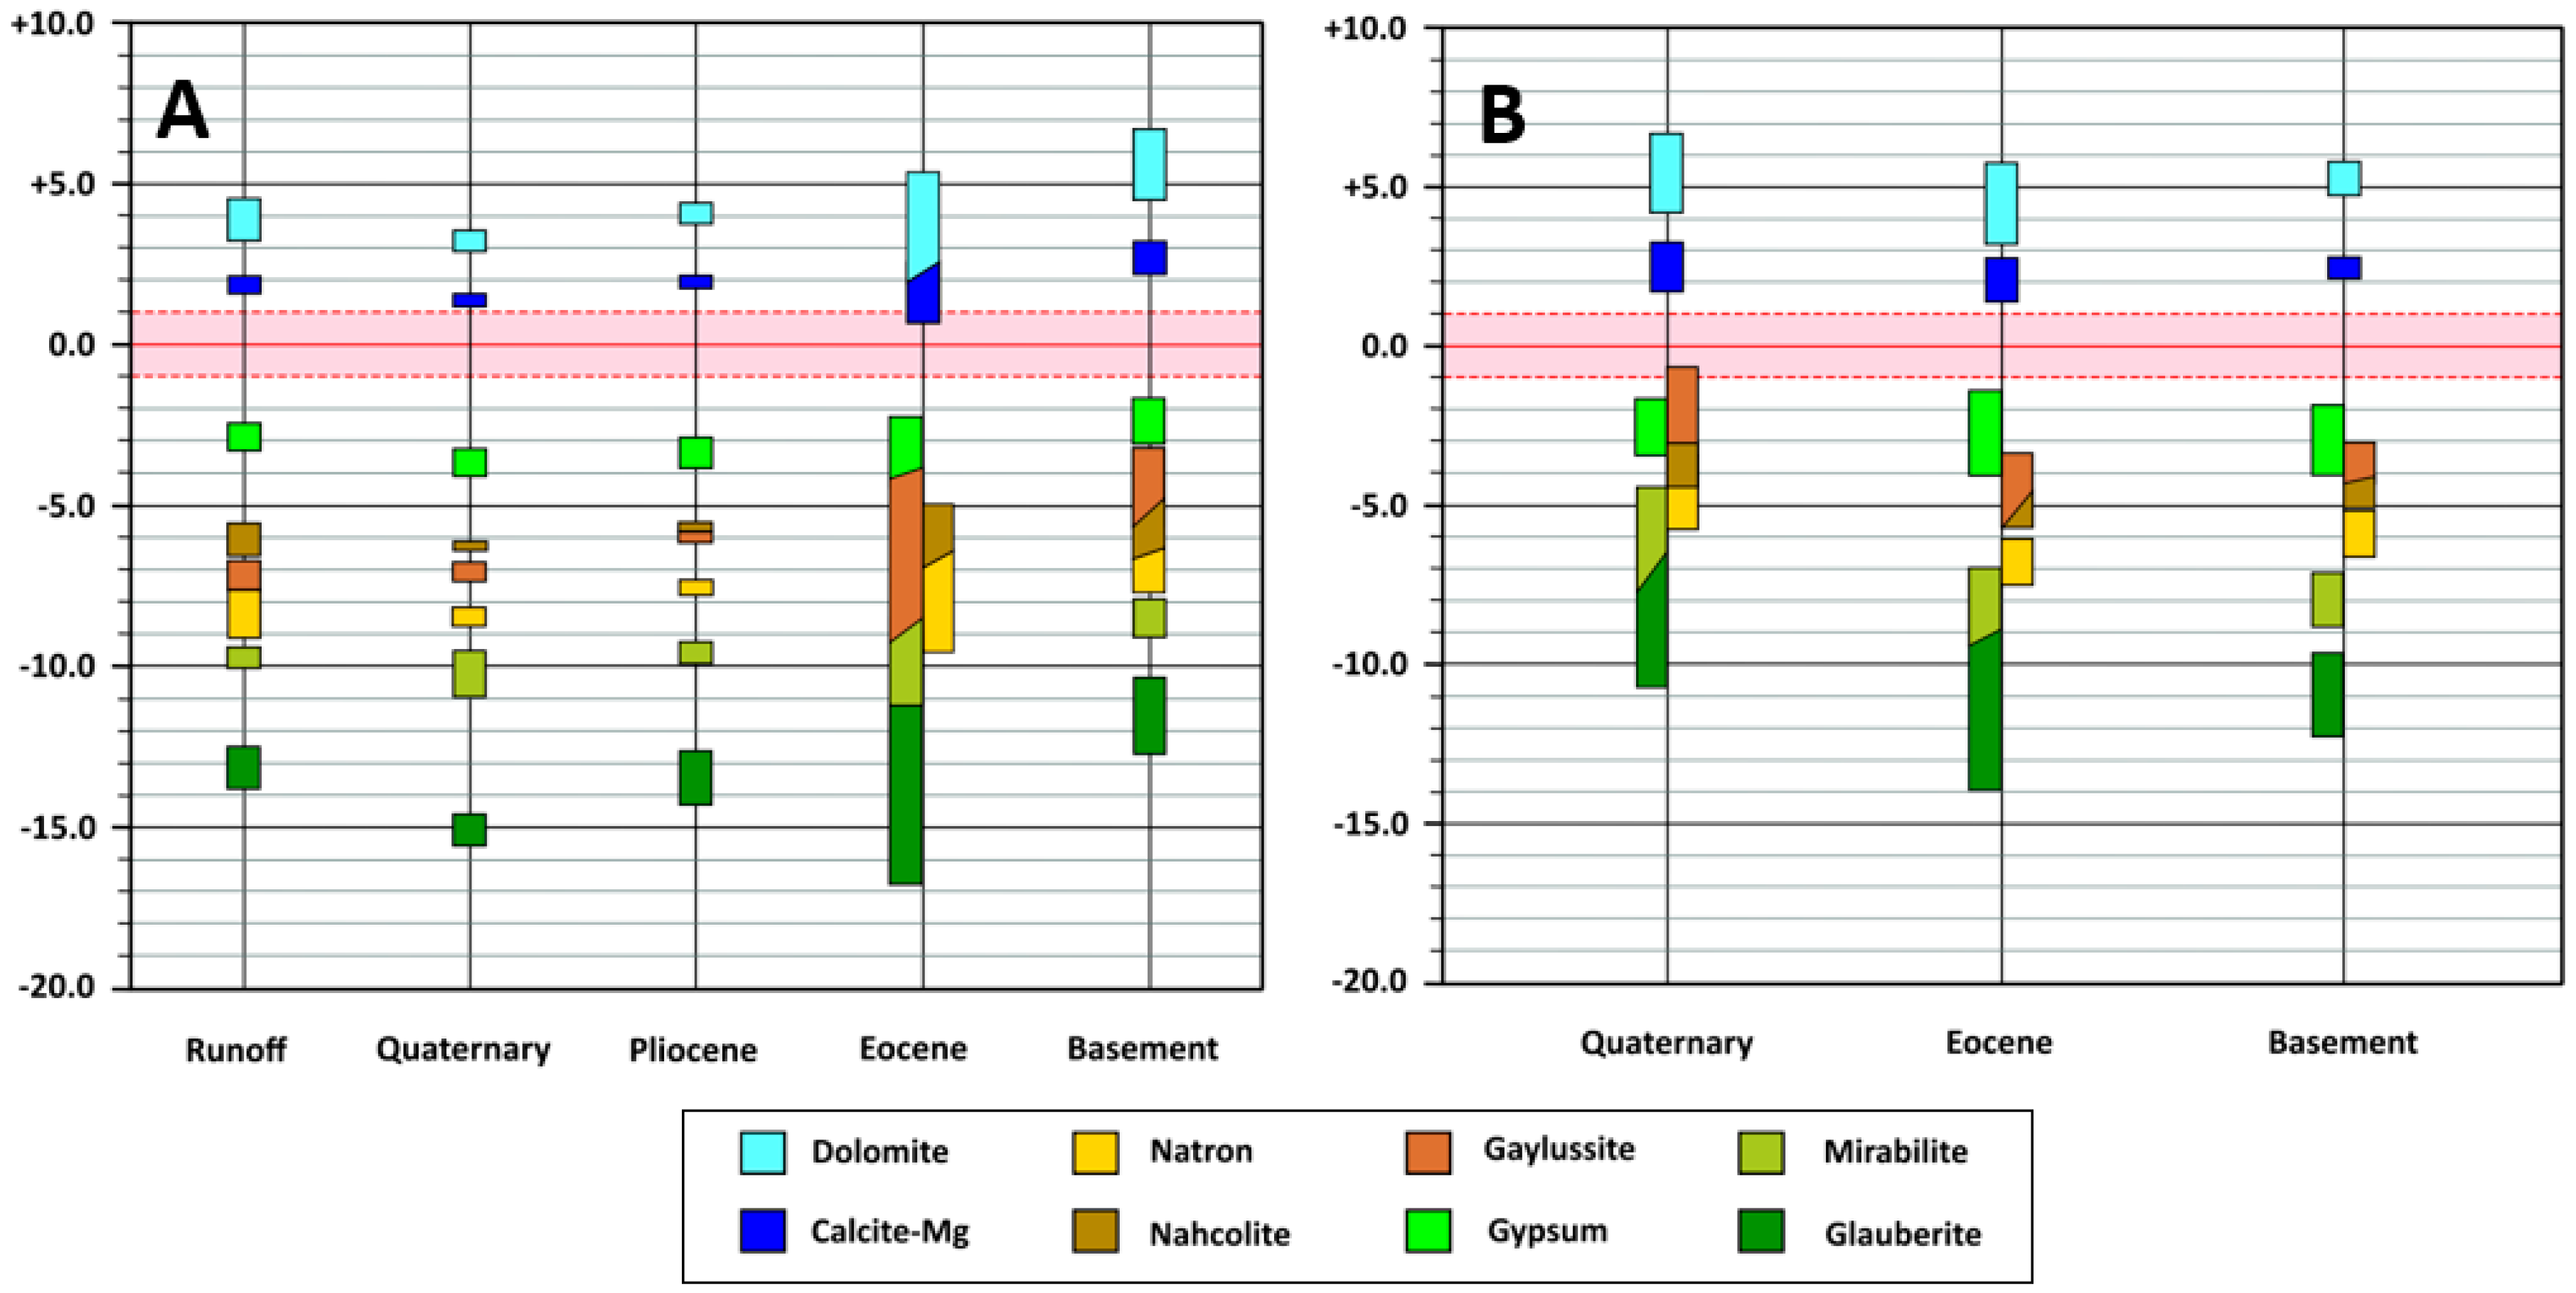
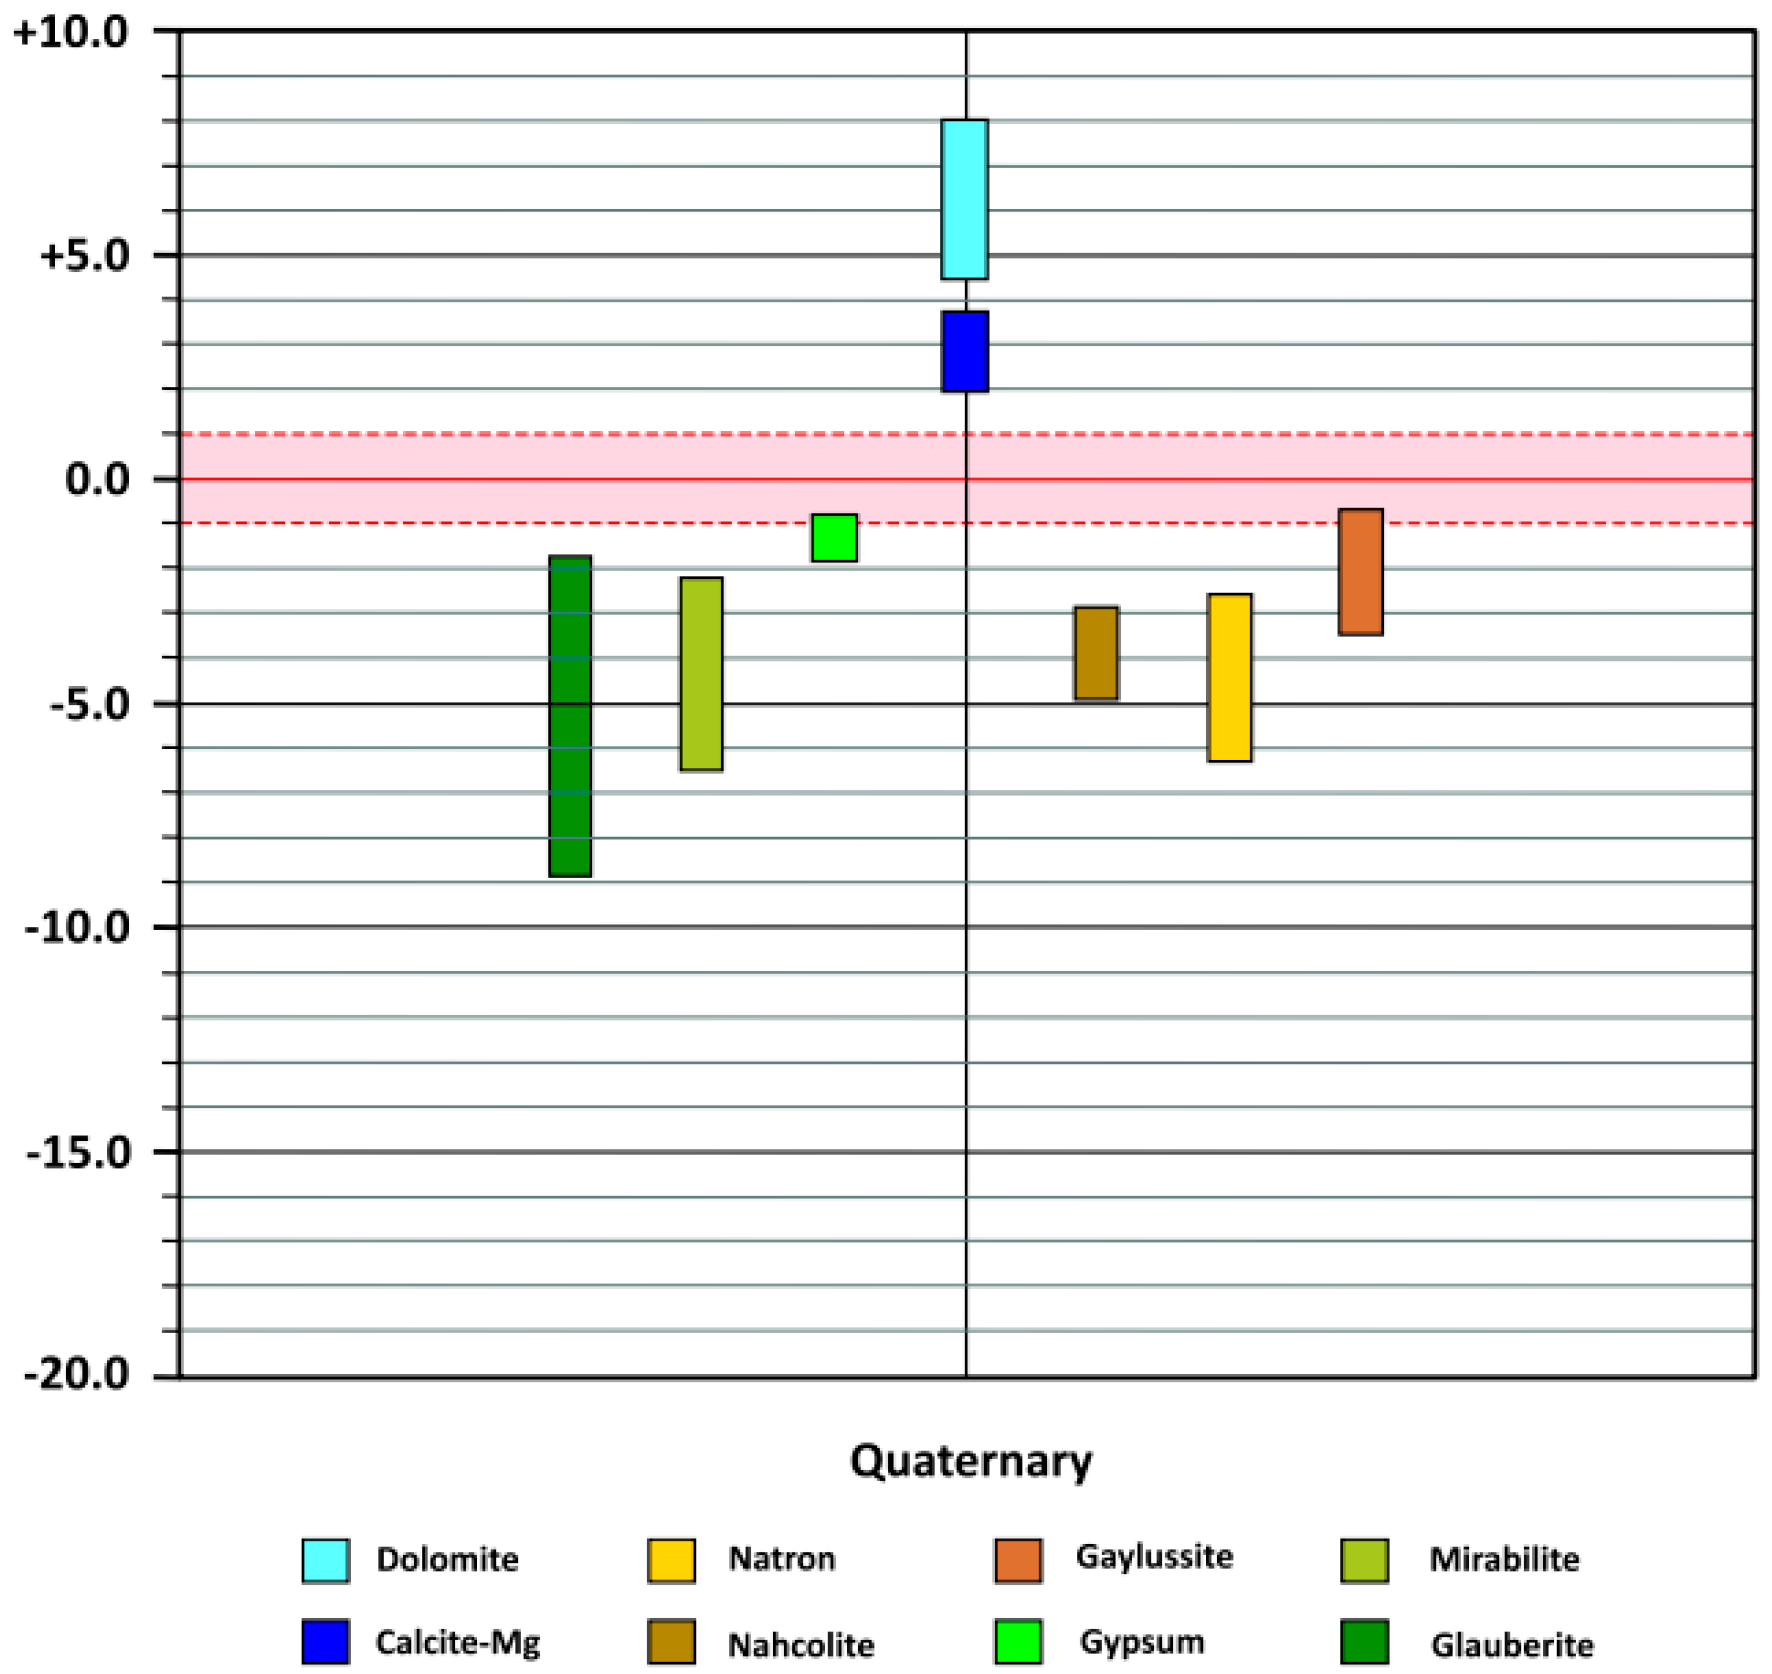
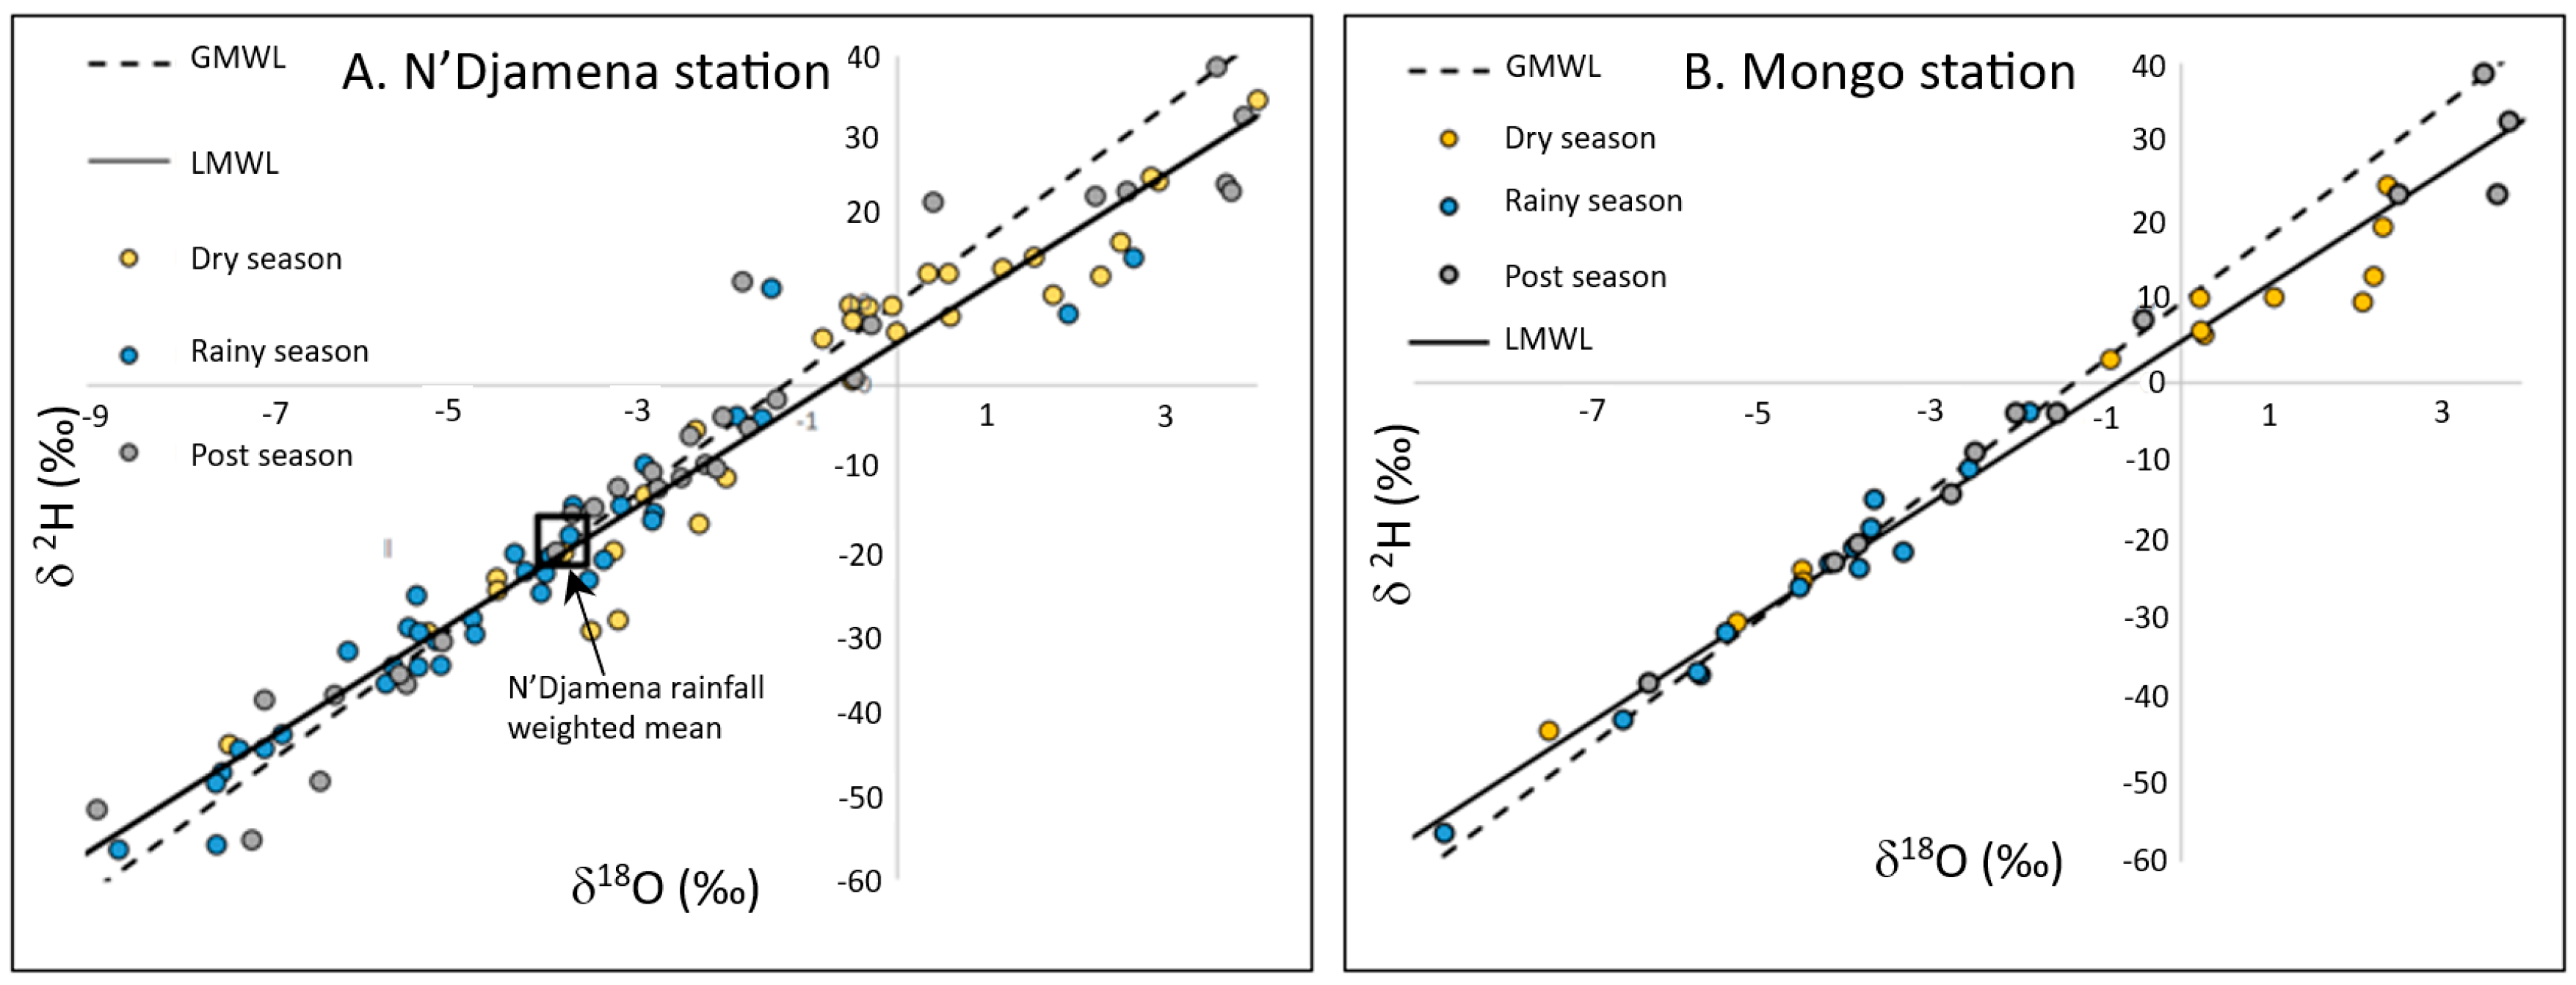

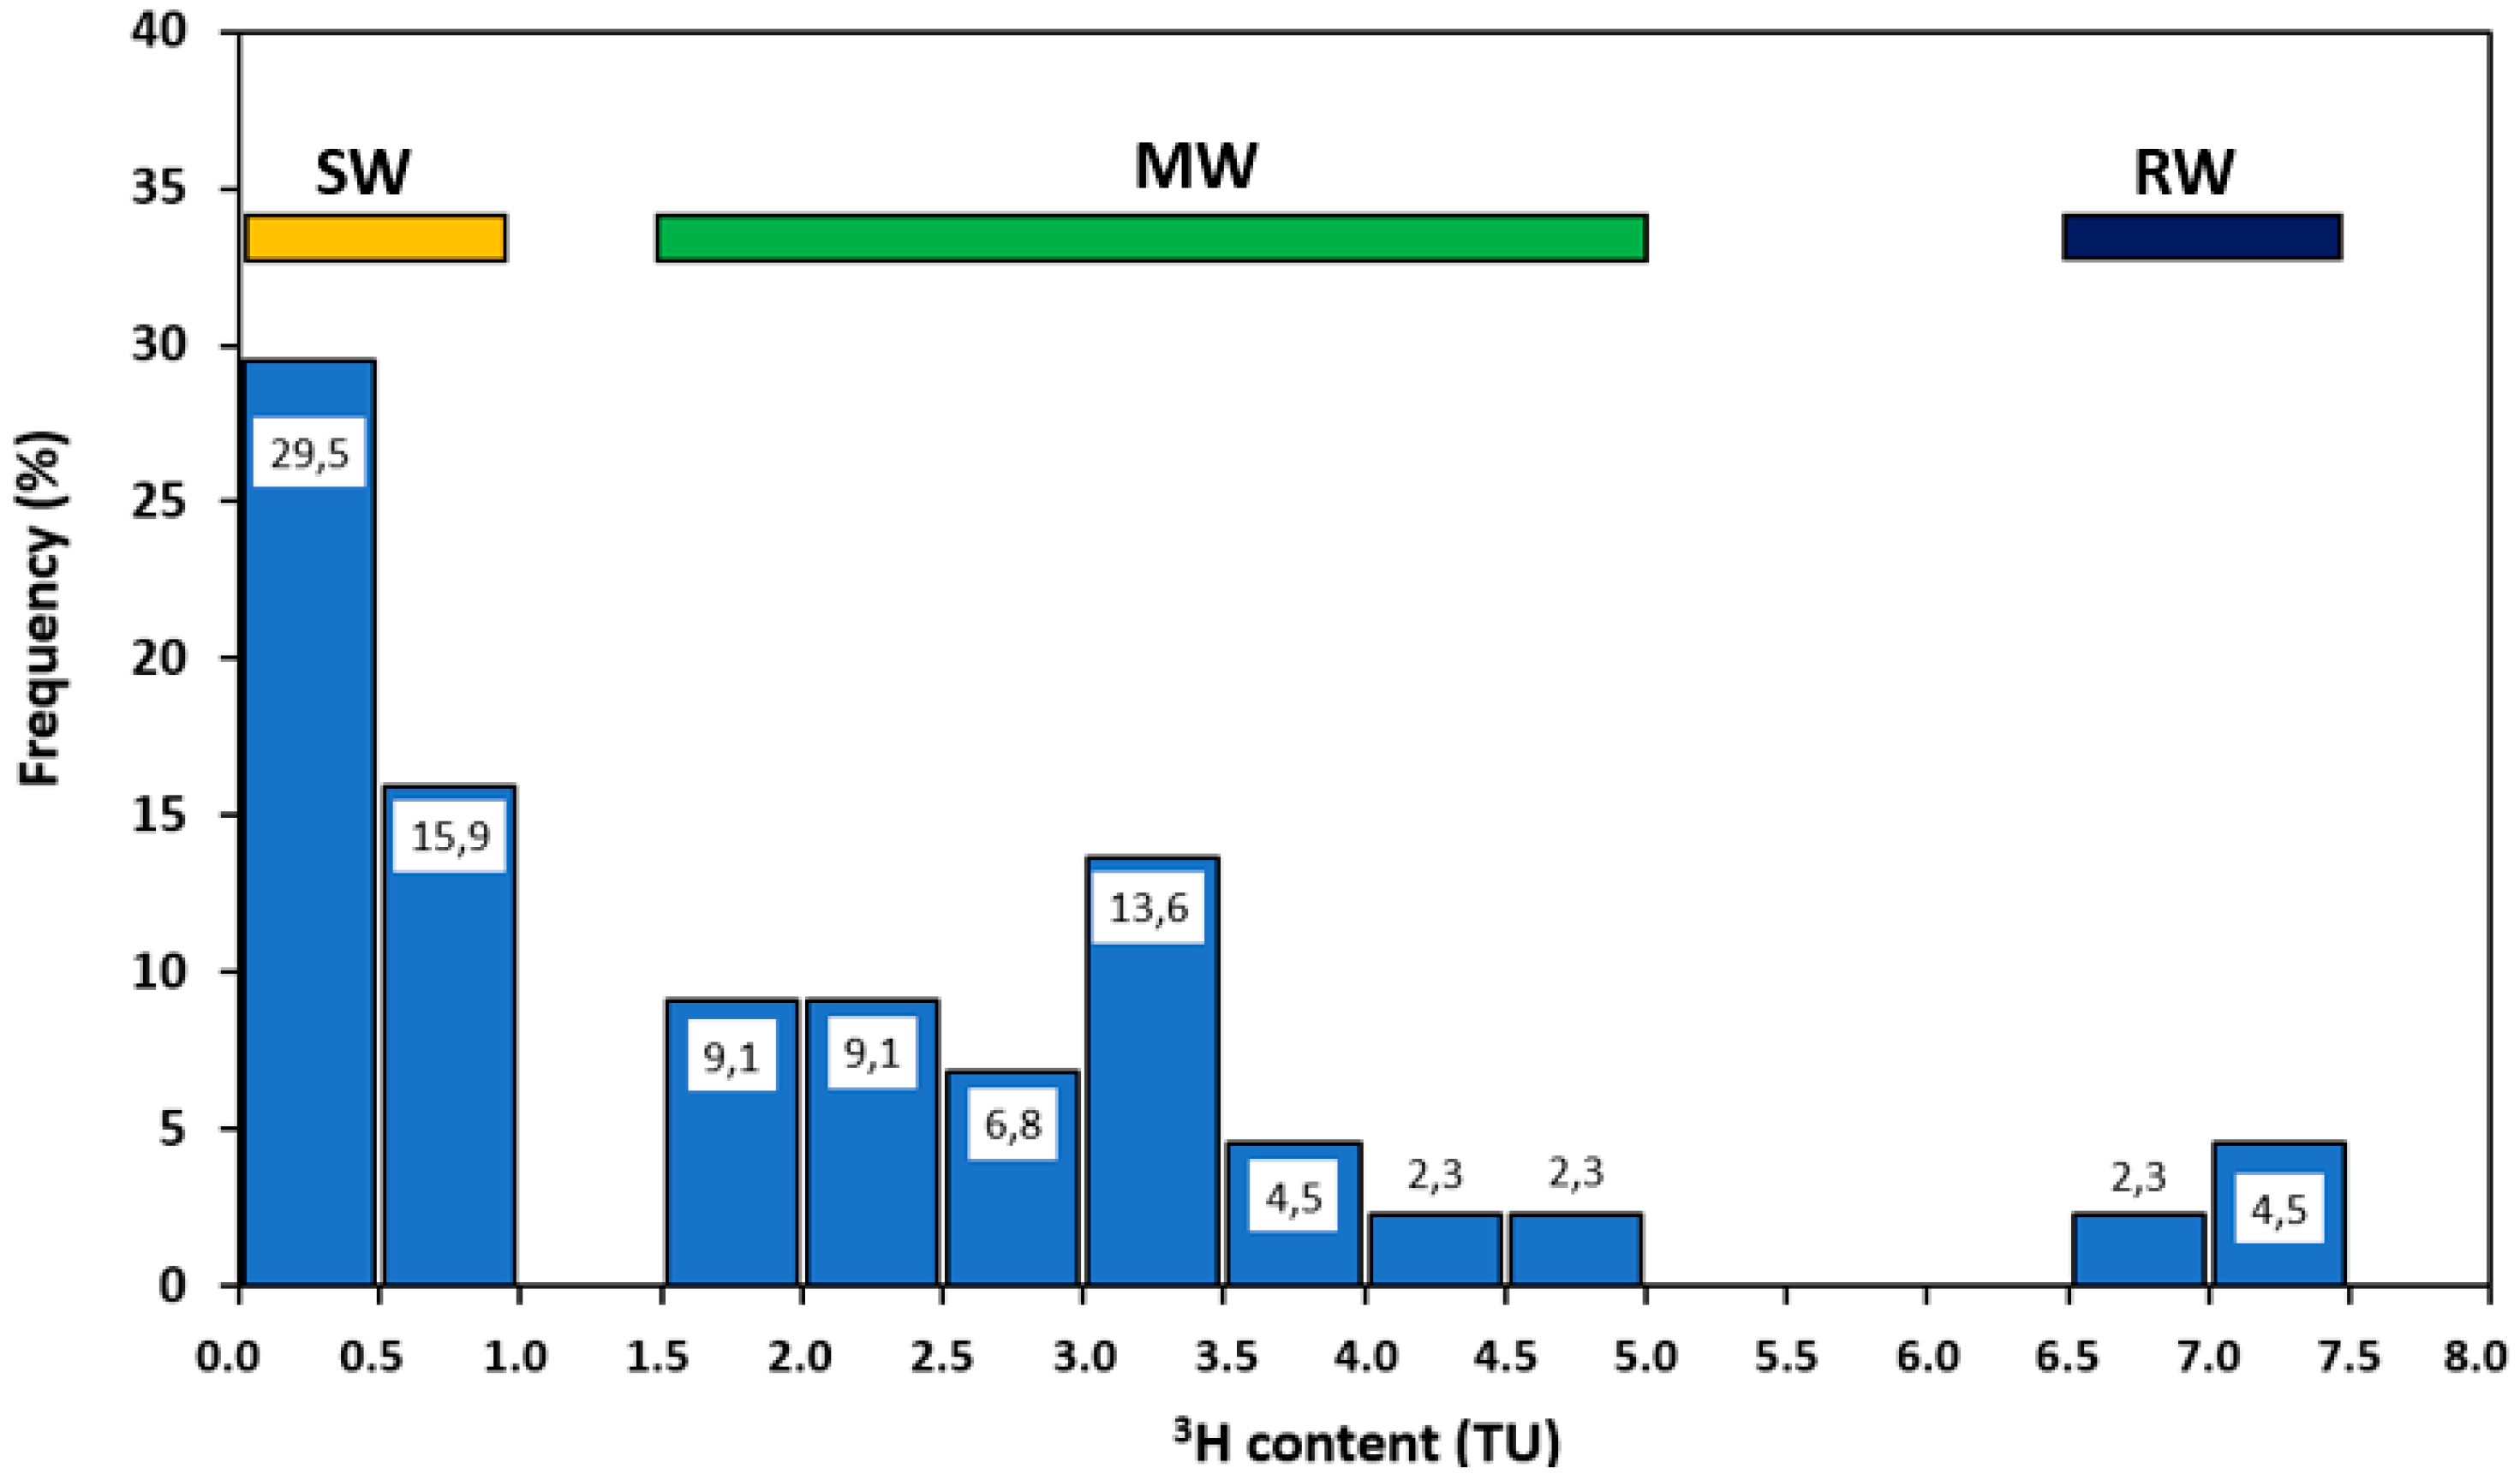
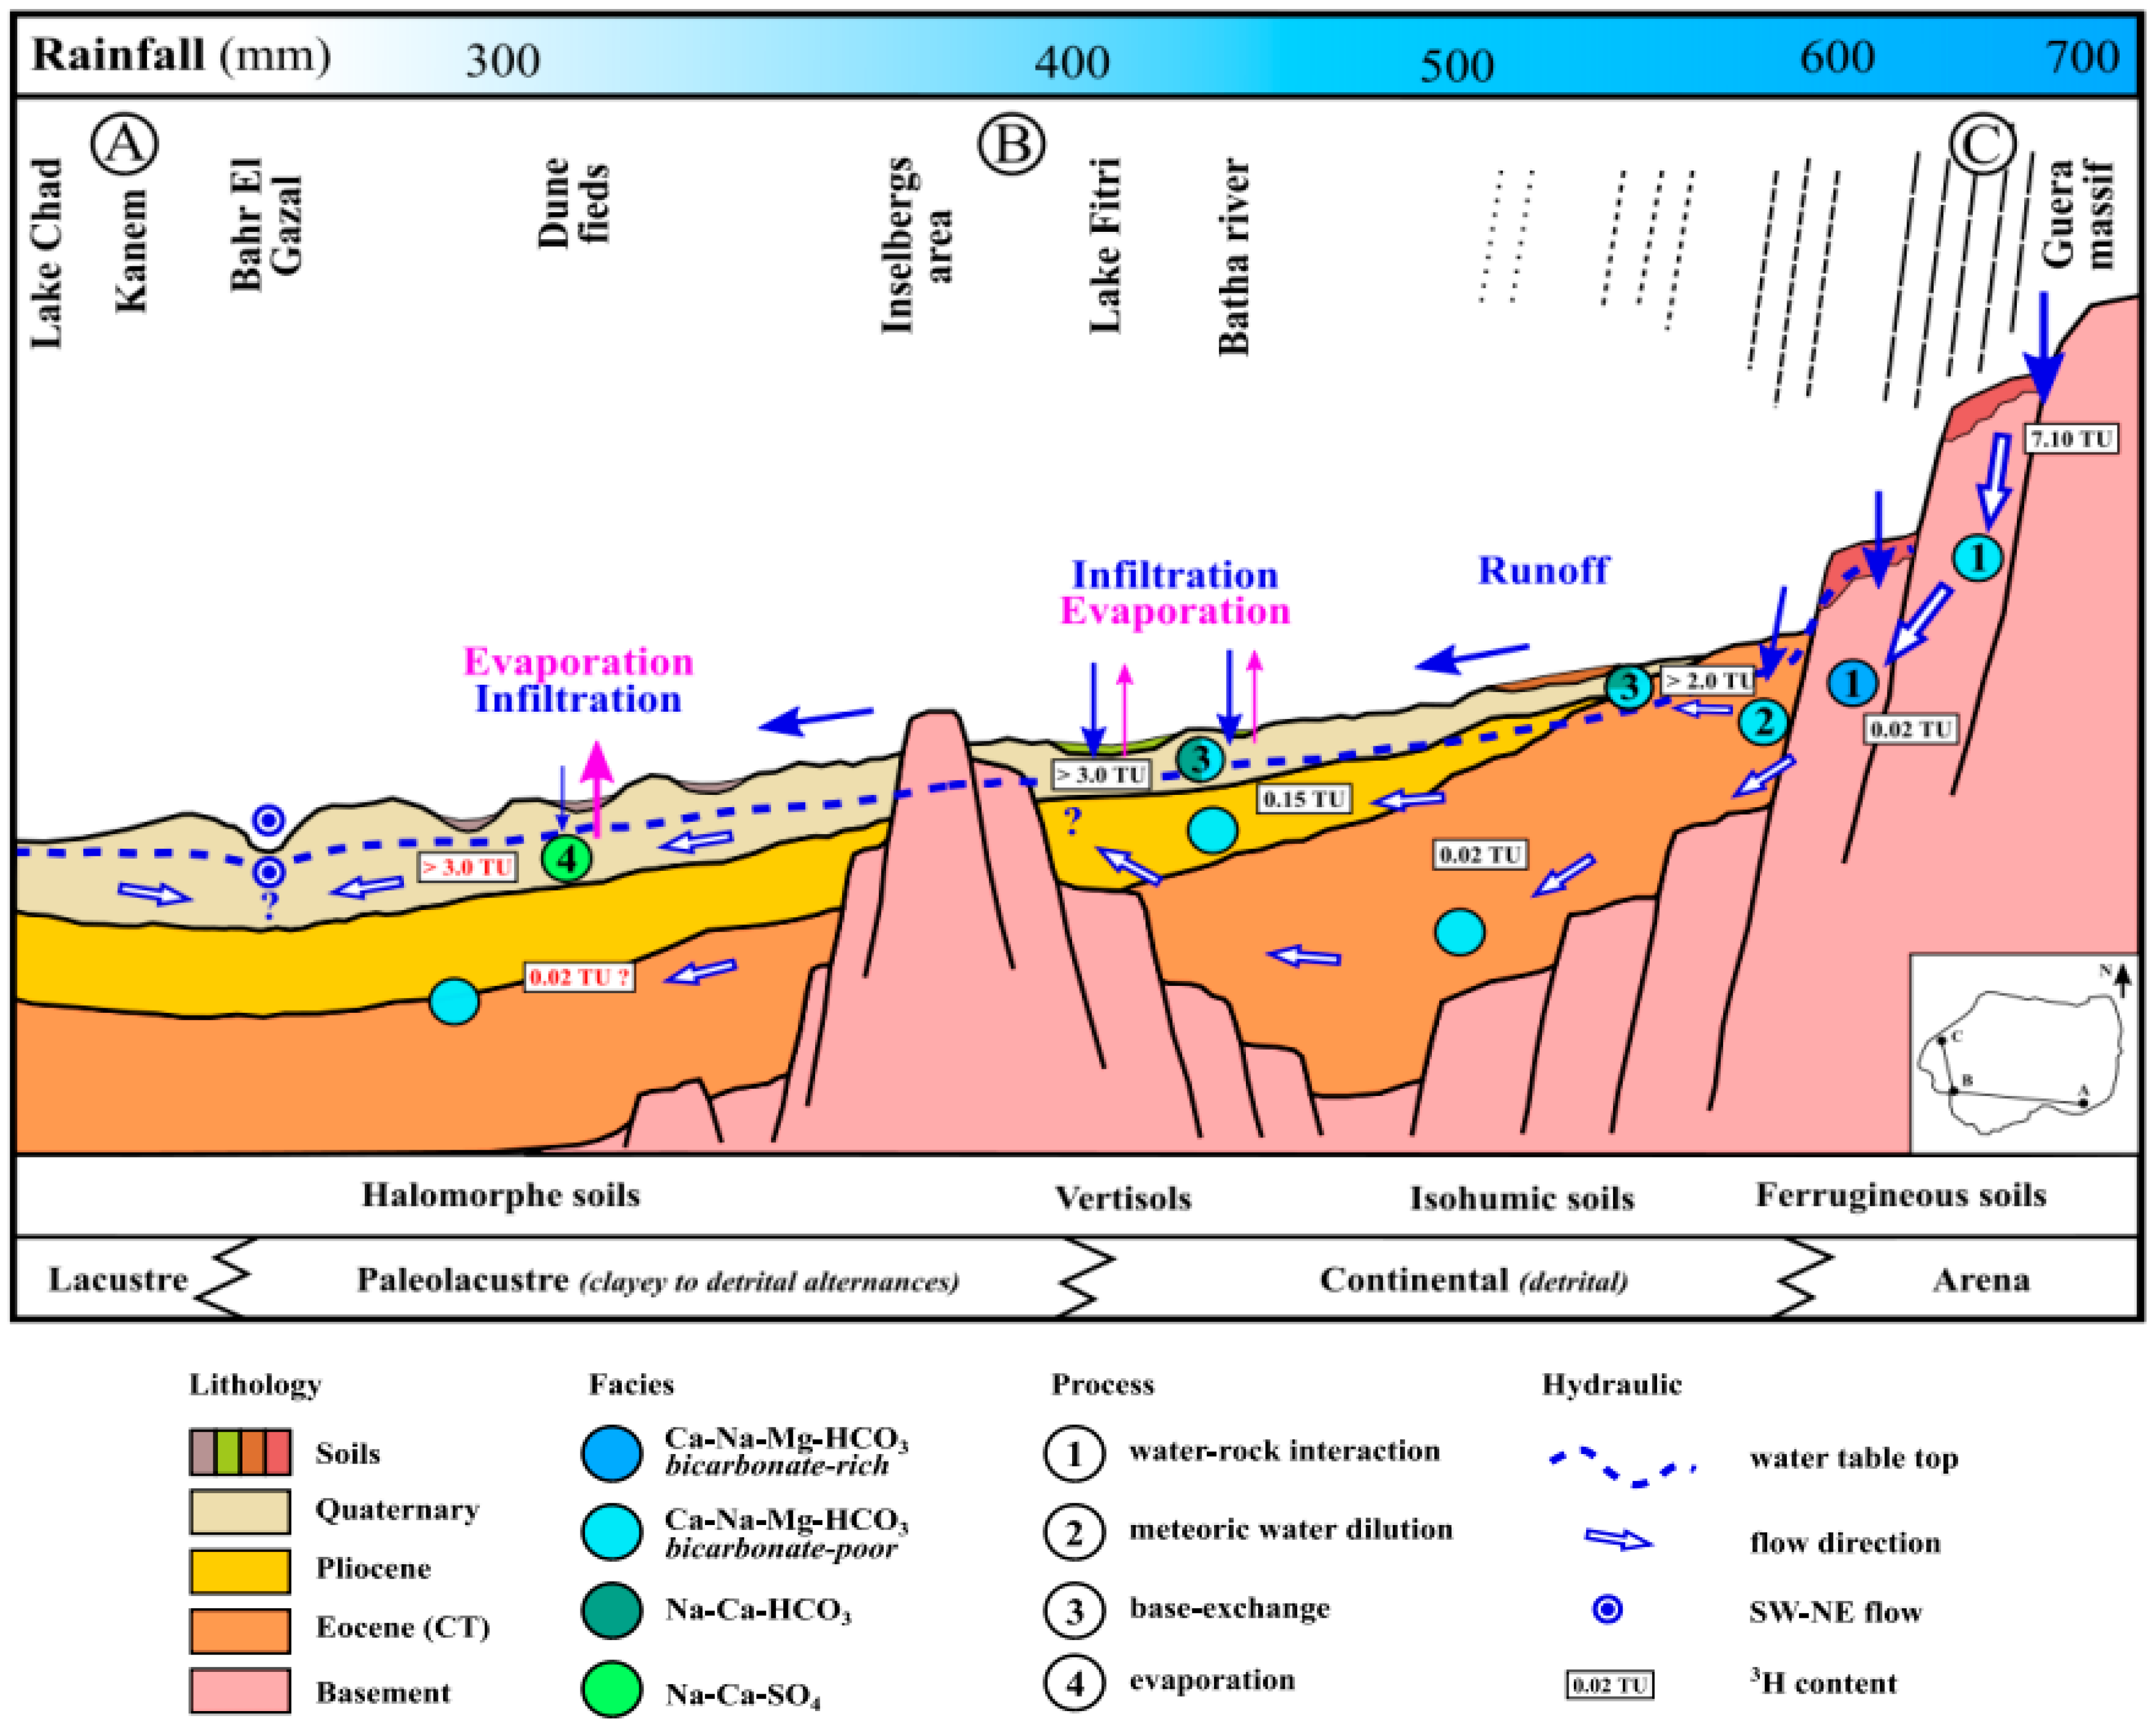
Disclaimer/Publisher’s Note: The statements, opinions and data contained in all publications are solely those of the individual author(s) and contributor(s) and not of MDPI and/or the editor(s). MDPI and/or the editor(s) disclaim responsibility for any injury to people or property resulting from any ideas, methods, instructions or products referred to in the content. |
© 2024 by the authors. Licensee MDPI, Basel, Switzerland. This article is an open access article distributed under the terms and conditions of the Creative Commons Attribution (CC BY) license (https://creativecommons.org/licenses/by/4.0/).