Article

Water and Energy Conservation across Provinces and Sectors in China: Based on a Complex Network Perspective

1
Institute of Agricultural Economics and Information, Guangdong Academy of Agricultural Sciences, 31 Jinying Road, Guangzhou 510640, China
2
College of Space Science and Physics, Shandong University, 180 Wenhua West Road, Weihai 250100, China
3
Beijing Key Laboratory of Urban Hydrological Cycle and Sponge City Technology, College of Water Science, Beijing Normal University, Xinjiekou Road, Beijing 100875, China
*
Author to whom correspondence should be addressed.
Water 2024, 16(15), 2132; https://doi.org/10.3390/w16152132
Submission received: 27 June 2024 / Revised: 18 July 2024 / Accepted: 24 July 2024 / Published: 27 July 2024
(This article belongs to the Section Urban Water Management)

Abstract

:
Previous studies on the water–energy nexus mainly focused on the calculation and comparison of resource consumption at the national or regional level, lacking interprovincial sector-sector transfer analysis. In this study, the intensity of water and energy consumption of various sectors in China was calculated, the key nodes and paths of resource networks were identified, and countermeasures for resource conservation were proposed from the new perspective of the “dual saving” and “bidirectional saving” of water and energy. The results showed that the metallurgical industry (Me) in Jiangsu and the chemical industry (Ch) in Hebei and Jiangsu had high node strength in the water and energy network and were key sectors in China with “dual saving” effects of water and energy. The construction industry, Ch, Me in Jiangsu, electricity and hot water production and supply industry in Beijing, and Me in Hebei had high node strength in the water-related energy network and energy-related water network, significantly supporting the “bidirectional saving” effect of water and energy in China. The electrical equipment industry (El) in Jiangsu → El in Zhejiang, El in Zhejiang → El in Shanghai frequently appeared in key paths, which could effectively reduce the resource consumption of the entire network.

1. Introduction

Rapid economic development, intensified human activities, and regional geopolitical conflicts have contributed to escalating risks in global resource management. The risk of water and energy shortages has become increasingly severe in recent years, and their synergistic relationship has been identified as an important topic of sustainable development of the United Nations [1]. At present, the international situation is complicated, and China’s economic development faces many new challenges. Ensuring a stable supply of water and energy is of great significance to regional economic development and national stability. China proposes a new development pattern with the domestic cycle as the core and the domestic and international cycles promoting each other, giving full play to the potential of domestic demand and the advantages of the large-scale market. From the perspective of resources, changes in the trade pattern will promote the spatial redistribution of resources and lead to the escalation of resource supply and demand risks [2]. Therefore, the formulation and promotion of the new development pattern policy need to continue to pay attention to the integrated management of water and energy.
China is abundant in total water resources but low in per capita water. There is a serious geographical mismatch between the available freshwater resources and the water demand [3], which is mainly manifested in the contradiction between the high degree of energy development and the poor condition of water resource endowment in the northern provinces. China’s energy consumption ranks first in the world, the energy consumption per unit of output value reaches twice the world average level, and the annual emission of carbon dioxide into the atmosphere exceeds 6 billion tons, also ranking first in the world [4]. Per capita carbon emissions are higher than 40% of the world average. China thus faces enormous international pressure in energy conservation and emission reduction. To control resource consumption and protect the ecological environment, China has established a strict water resources management system and national energy standardization management measure. However, relevant policies usually focus on industrial sectors or enterprise entities, such as limiting the development of high-water and high-energy-consuming industries and encouraging the development of new energy industries [5]. There is a lack of understanding of the industrial linkages that influence water and energy consumption. The national economic system is complex, and there are complex interweaving relationships among various sectors, leading to the complexity of the potential water and energy consumption of various sectors [6,7]. In resource management, if policy makers only focus on a single province or a single sector but ignore the internal relationship, it may weaken the effectiveness of regional policies and inhibit resource conservation and resource utilization efficiency improvement [8]. Therefore, it is necessary to explore the characteristics and internal relationships of water–energy transfer across provinces and sectors in China and propose targeted resource management measures accordingly.
The organizational structure of this paper is as follows: The first part is the introduction. The second part is a literature review. The third part introduces the methods and data. The fourth part presents the research results and discusses them. The fifth part is the conclusion and policy implications.

2. Literature Review

Exploring the water–energy sectoral linkage and circulation regularity is of great practical significance to achieve sustainable resource utilization and interregional resource cooperative management. When analyzing the contradiction between resource supply and demand in a region, it is necessary to consider the contradiction between the production end and the consumption end. The production end mainly considers the direct exploitation or production of resources, while the consumption end involves the direct and indirect consumption of resources. The input–output method provides a good basis for accounting for indirect resource consumption, and its core idea is to use a matrix to reflect the balance and circulation relationship between different sectors in the economic system. This method can achieve a complete simulation of the circulation of resources in the economic system [9,10]. Input–output research can be summarized into three types: single-regional input–output (SRIO), multiregional input–output (MRIO), and multiscale input–output (MSIO). Among them, the SRIO method is simple to calculate and has low data demand, but the disadvantage is that it ignores the external inflow of resources or assumes that the intensity of resources outside the area is the same as that within the local area [11], and its calculation results have certain errors. Based on the SRIO method, the MRIO method accounts for the flow of resources in different regions. Since the input–output table in multiple regions can cover the entire production process of products, the flow of resources in different regions and sectors can be tracked, and the calculation results are more accurate [12,13,14], but this method cannot accurately calculate the resource intensity of foreign imports. Based on the SRIO and MRIO methods, the MSIO method distinguishes resource intensity from economies at different levels [15] and more accurately characterizes resource utilization efficiency. For example, for subcountries, this method can distinguish resource intensity from foreign countries and other regions of the country. In addition, the calculation results can be used not only to calculate the resources reflected in the final consumption but also to quantify the resources reflected in the intermediate input, thus expanding the scope of application of input–output analysis and providing a more reliable theoretical method for resource accounting at different scales. At present, the method has been applied to water resources [16,17], energy [18,19], carbon emissions [20,21] and other fields. For example, Shao et al. [22] proposed the MSIO method, calculated the water intensity at three scales for 42 industrial sectors in Beijing, and identified and analyzed the virtual water flow between Beijing and other provinces and countries. Meng et al. [23] used the MSIO method to track and quantify the direct and indirect flows of energy, water, and land factors among China’s four megacities. Chen et al. [24] used the MSIO method to describe the transnational urban carbon footprint network between China’s five megacities and Australia’s five largest capital cities. The accounting results of related research comprehensively reflect the direct and indirect consumption of resources, which can provide a reasonable basis for the macromanagement of resources.
The flow of water and energy between regions and sectors has formed a complex interwoven resource network. By exploring the attributes of the resource network, we can better understand the circulation characteristics of resources in the economic system. A complex network is a powerful tool for system structure analysis. The dominant idea is to abstractly regard specific research objects as nodes, the correlation between research objects as connected edges, so as to better understand network properties by exploring the characteristics of nodes and connected edges [25]. The concept of a complex network originated from a paper published in Nature by Watts and Strogatz [26], which proposed the small-world network model, describing the development from a completely regular network to a completely random network. The study found that a few random paths can significantly change the topological properties of the whole network. Subsequently, complex networks have become an important emerging research direction in economics, sociology, statistics, management, and other sciences [27,28,29]. At present, complex network research is mainly focused on the global [30,31,32] and country [33,34,35] scales, and the nodes include two categories: country (region) and sector. The research perspective includes two categories: geographical spatial perspective and sectoral spatial perspective. Energy trade is the most common research object. For example, Zhang et al. [36] analyzed the global energy trade pattern based on the complex network method and discussed the impact of political and economic risks on the trade pattern. Based on the complex network approach, Chen et al. [37] investigated the impact of renewable energy consumption on the global lithium trade pattern from the perspective of the industrial chain. Chen et al. [38] constructed a complex network model of global energy trade and found its small-world characteristics and significant community clustering features. Zhang et al. [39] explored the topology of China’s energy cycle through complex network methods and provided countermeasures and suggestions for energy macromanagement. Shi et al. [40] used the input–output table from 1995 to 2009 to build a global energy circulation network and found that the sum of the circulation corresponding to 0.02% of the network accounted for more than 80% of the total circulation. The industries in EU countries cluster into the largest community and continue to attract other sectors to join. Research on complex networks in the field of energy has mainly focused on the development and evolution of fossil energy trade and the analysis of global energy trade communities [41]. Research in the field of water resources focuses on the analysis of water resource network characteristics and evolution laws and the network architecture of the virtual water trade and energy trade [42]. Hong et al. [43] constructed embodied water and energy embodied water networks of various sectors in Beijing, analyzed their evolution rules by using complex network indicators, and found that the water-saving effect of key sectors in the water resources network can quickly spread to other sectors. On the whole, complex network methods can support global and local analyses of resource systems and reveal many new features in resource trade networks from the perspective of topology [29]. Currently, in the field of resources, they mainly focus on exploring the network topological attributes of a single resource element. Water and energy are each other’s raw materials, and the mutual consumption pressure of the two resources can gradually spread and diffuse in the resource network by trade. Studies of the topological properties of the network of mutual consumption relationships between water and energy are still rare.
Therefore, we attempt to overcome the limitations of the above research and provide some policy recommendations for the conservation and efficient use of water and energy. The main innovations and contributions of this study are as follows: (1) In previous studies, the MSIO method was used to calculate the water–energy resource intensity at the sector level, which was usually concentrated in a single region or province. However, no research has carried out multiscale water–energy resource intensity calculations for various provinces in China, and there is a lack of horizontal comparative analyses of resource intensity at the provincial level. In this study, the three-scale water–energy intensity accounting was extended to each province, and the national water–energy resource intensity database was constructed, with the purpose of realizing the accurate accounting of water–energy supply and demand and the in-depth analysis of the contradiction between supply and demand. (2) Previous studies on the link between water and energy lacked interprovincial sector–sector transfer analysis, and most of them focused on comparative analysis at the national or regional level. This study builds an interprovincial, intersectoral resource network model in China, providing a new perspective for cross-provincial and cross-sector resource management and macrocontrol. (3) Most existing studies focus on water–energy resources themselves and analyze the topological attributes of resource networks. However, they neglect the energy-saving effect brought by water saving and the water-saving effect brought by energy saving. Based on the construction of water and energy networks, this study further constructed energy-related water and water-related energy networks to explore the interprovincial sector–sector resource transfer characteristics caused by the mutual consumption of the two types of resources. The new ideas of “dual saving” of water and energy and “bidirectional saving” of energy-related water and water-related energy are put forward. Among them, “dual saving” refers to simultaneously saving water and energy, and “bidirectional saving” refers to realizing energy saving while saving water and realizing water saving while saving energy. Based on the resource network, this paper proposes countermeasures and suggestions for resource saving from the perspectives of “dual saving” and “bidirectional saving”.

3. Methodology and Data

In this section, we first describe how to use the MSIO method to calculate the multiscale resource intensity of various provinces and sectors in China. Based on the calculated resource intensity values, the construction of water and energy resource networks and the quantitative method of topological attributes were further introduced. Finally, the data source was explained.

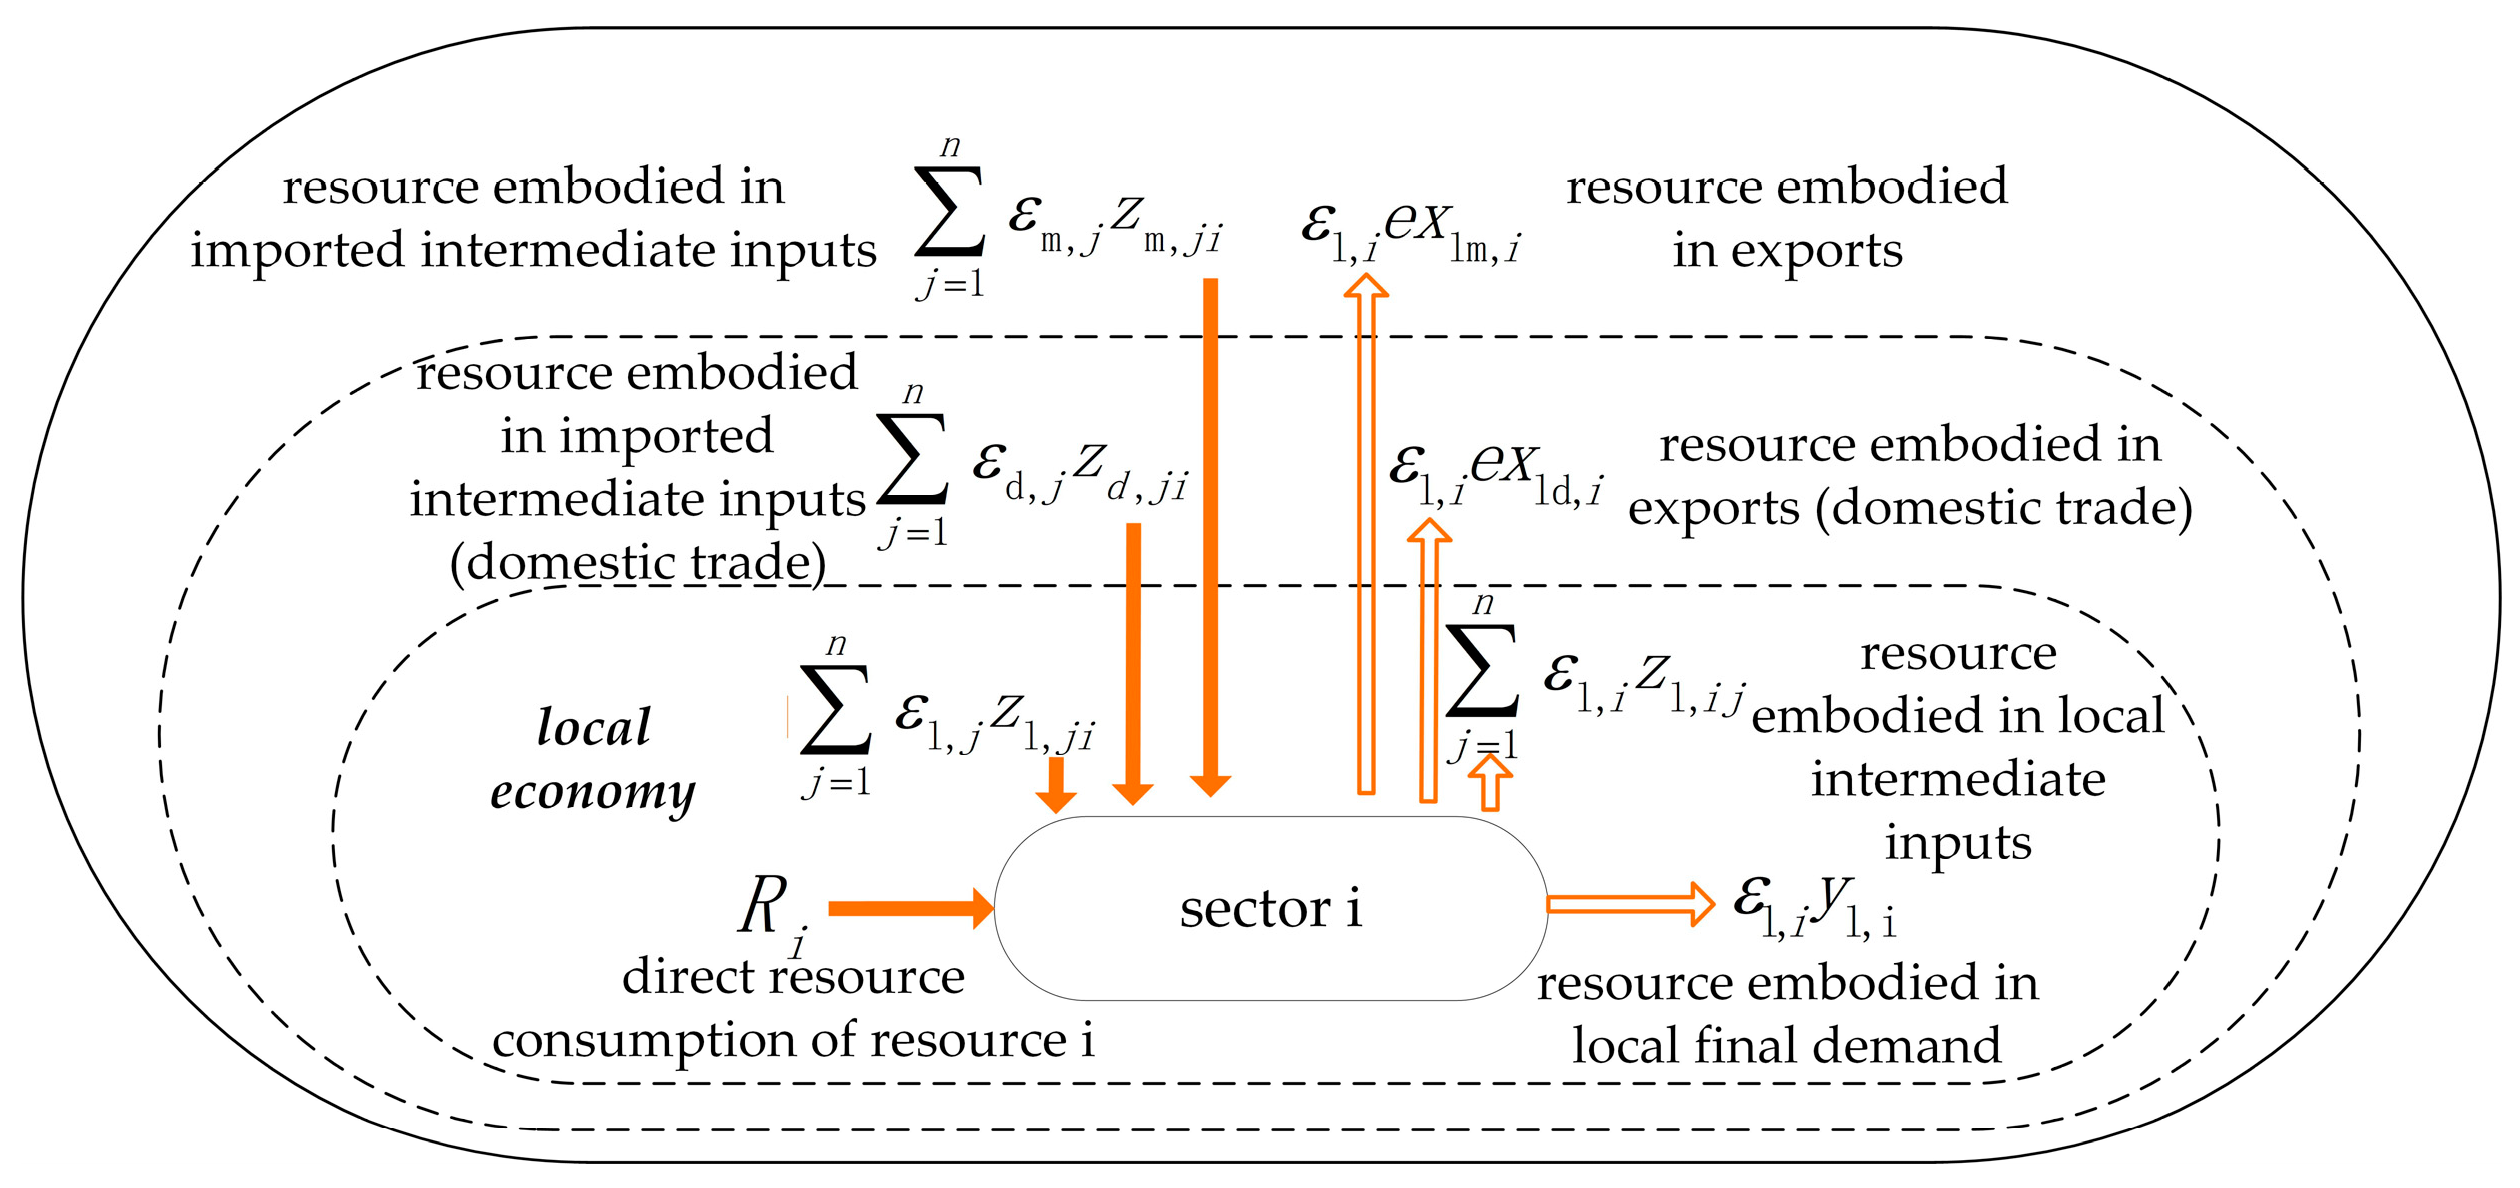
3.1. Multiscale Input–Output Method

The regional economic system is an open system, and there may be trade flows between local sectors, between sectors across different areas in the country, and between sectors in different countries. Embodied resource intensity varies in different areas, and MSIO accounts for the embodied resource intensity based on input–output tables for economies on different scales. The multiscale input–output method builds on the traditional input–output method by distinguishing resource intensities originating from economies at different scales [44], and for the subnational level, the method distinguishes between resource intensities originating from abroad and from other regions of the country. In addition, the results obtained by this method can not only be used to account for the resources embodied in final consumption, but also quantify the resources embodied in intermediate inputs, thus expanding the application of input–output analysis and providing a more complete and reliable theoretical method for the accounting of resources at different scales. Figure 1 shows the circulation characteristics of resources across different economic scales. According to the material balance theorem, the circulation relationship of sector i can be expressed as follows:
R i + j = 1 n ε l , j z l , j i + j = 1 n ε d , j z d , j i + j = 1 n ε m , j z m , j i = ε l , i ( j = 1 n z l , i j + y l , i + e x ld . i + e x lm , i )
where R i is the direct resource consumption of sector i ; ε l , j , ε d , j , and ε m , j represent the embodied resource intensity in sector j in the local economy, national economy, and world economy, respectively; ε l , i is the multiscale embodied resource intensity of sector j , which distinguishes the resource intensity of local consumption and imported products from other provinces and other countries; z l , j i , z d , j i , and z m , j i represent the intermediate input from sector j in the local economy, national economy, and world economy to local sector i , respectively; z l , i j represents the intermediate input from sector i to sector j in the local area; y l , i represents the final demand of sector i ; and e x ld , i and e x lm , i represent the economic outflow from sector i to other provinces and countries, respectively. By processing and changing Formula (1), the multiscale resource intensity can be obtained:
ε l = ( R + ε d Z d + ε m Z m ) ( X l ) 1 ( I A l ) 1 R = ( R i , j ) m × n ε l = ( ε l , j ) m × n ε d = ( ε d , j ) m × n ε m = ( ε m , j ) m × n Z d = ( z d , j i ) n × n Z m = ( z m , j i ) n × n X l = ( x l , i j ) n × n A l = Z l ( X l ) 1 Z l = ( z l , j i ) n × n
where X l is the total output matrix and ( I A l ) 1 is the Leontief inverse matrix. The resource circulation of different sectors can be obtained by multiplying the multiscale embodied resource intensity calculated by Formula (2) by the economic circulation of the corresponding sectors. On this basis, the resource circulation of different regions can be obtained by summarizing the amount of resource circulation of various sectors in the region.

3.2. Resource Network Construction and Related Indicators of Complex Networks

3.2.1. Resource Network Construction

In this study, water, energy, energy-related water, and water-related energy that flow between different nodes through product trade are taken as the edge, and the amount of resource circulation is taken as the weight. The direction of resource circulation is the same as that of economic circulation. Energy-related water refers to the amount of water resources consumed in the production and processing of six types of primary energy, namely, raw coal, crude oil, natural gas, hydropower, nuclear power, and wind power [45], and water-related energy refers to the amount of energy consumed by water resources in the social cycle [46]. Notably, for different regions and sectors, there are significant differences in the water-saving effect brought by energy saving and the energy-saving effect brought by water saving, and this effect may further change with the resource trade circulation. The purpose of this study is to explore the regions and sectors with strong bidirectional saving effects of water and energy to propose targeted resource management policies. The construction of a resource network requires two types of data. One is resource intensity data, which come from the multiscale resource intensity database constructed by the researchers. The second is the economic circulation between nodes, which comes from the multiregional input–output table of China, including 30 industrial sectors in 30 provinces except Tibet. The resource flows between any two nodes in the resource network can be obtained by multiplying the resource intensity of the output nodes by the economic circulation between nodes.

3.2.2. Related Indicators of Complex Networks

(1)
Small-world characteristics
Small-world characteristics mean that in the network, most nodes are not neighbors, nodes are closely related to the nodes around them, and there are usually only a few nodes between any two nodes [47]. These attributes can be reflected by the small-world index C [48]; the calculation formula is as follows:
C = [ C a c t u a l / L a c t u a l ] × [ L r a n d o m / C r a n d o m ]
where C a c t u a l is the average clustering coefficient of the actual network, which represents the probability that two sectors effectively associated with the same sector are also effectively associated with each other; L a c t u a l is the average shortest path of the actual network and represents the average shortest path between any two sectors. More details on the methods for calculating these two indicators can be found in the research of Chen [38]. C r a n d o m and L r a n d o m are the average clustering coefficient and the average shortest path in the same size random network, respectively, and they are calculated by d / n and l n ( n ) / l n ( d ) , where n is the number of nodes, and d is the average degree of all nodes.
(2)
Node strength
Node strength is an indicator for measuring the importance of nodes and represents the sum of weights of all edges connected to the node. Generally, sectors with high node strength are key nodes with influence and importance in the network. The calculation formula is as follows:
s i = j N i ω i j
where ω i j represents the weight of the edge between node i and node j . In a directed network, node strength can be further divided into in-strength and out-strength, which represent the inflow and outflow of the node, respectively. In the resource network, in-strength and out-strength represent the amount of resources flowing in and out of a node, respectively. Generally, the greater the node strength of a sector is, the greater the amount of resource trade between the sector and other sectors, and the more important its position in resource regulation.
(3)
Eigenvector centrality
In the network, an important node is associated not only with many other nodes but also with other important nodes. This property can be characterized by eigenvector centrality [49], which is evaluated according to the importance of nodes connected with the node itself. The calculation formula is as follows [50]:
Suppose x v is the eigenvector centrality of node v and A = ( a v , t ) is the adjacency matrix. If there is an edge between node v and node t, then a v , t = 1 ; otherwise, a v , t = 0 :
x v = 1 λ t N ( v ) x t = 1 λ t G a v , t x t
where N ( v ) is the collection of nodes connected to node v , and λ is a constant. G is the collection of all nodes in the network and can be expressed in the form of a matrix:
A x = λ x
Then, the eigenvector centrality x can be determined by solving the system of equations.
(4)
Key path
In the network, an edge with a large weight is called a key edge, and the path connected by the key edge is called the key path. The weight of each edge in the key path occupies a large proportion in the whole network; therefore, the key path plays a pivotal role in the network. In the resource network, the key path integrates the key edges of resource consumption and represents the important path of resource consumption. The method of identifying the key path in a complex network is as follows [51]: First, assume that all nodes in the network are initial nodes in the key path. Second, search for the edge with the highest weight among all connected edges of each initial node, and the target node of this edge is regarded as the second node of this key path. Third, repeat the second step until the searched node returns to the penultimate node in the path, and the search process is completed. The critical path in the resource network is an important trade path for resource circulation, which is of great significance to overall resource regulation.

3.2.3. Data Sources

The data involved in this study mainly include the following four types, all for the year 2017.
The first type is the input–output data. World-scale input–output data are derived from the Eora database [52], which contains 188 countries and 26 sectors in each country. National and provincial input–output tables are derived from the National Bureau of Statistics [53] and the Regional Bureau of Statistics, and these all contain 42 sectors. When considering foreign imports, it is necessary to connect 42 sectors at the national scale with 26 sectors at the world scale [22]. In addition, a multiregional input–output table in 2017 [23] is needed.
The second type is water withdrawal data and includes agricultural, industrial, domestic, and ecological water withdrawal. Among them, water withdrawal data of 188 countries on the world scale are available from World Bank statistics [54]. National and provincial water withdrawal data are derived from the Water Resources Bulletin in the corresponding region. When water enters the economic system, agricultural, domestic, and ecological water withdrawal belong to agriculture, production and distribution of tap water, and administration of water, environment, and public facilities, respectively. For industrial water withdrawal, there are no detailed data by sector. Considering the output value data in the China Economic Census Yearbook and the China Statistical Yearbook 2018 [55] and the water use efficiency of each sector in the authors’ previous research results [56], the water withdrawal of each sector was extrapolated.
The third type is energy exploitation data. The world-scale primary energy extraction data are from the BP World Energy Statistics Yearbook [57]. At the national and provincial scales, the extraction amounts of raw coal, crude oil, natural gas, hydropower, nuclear power, and wind power are derived from the national and provincial Energy Statistics Yearbook. When energy enters the economic system, raw coal belongs to the mining and washing of coal, crude oil and natural gas belong to the extraction of petroleum and natural gas, hydropower and wind power belong to the production and distribution of electric power and heat power, and nuclear power belongs to the mining and processing of metal ores.
The fourth type is the mutual consumption of water and energy. For all types of energy, the water footprints of raw coal, crude oil, and natural gas are mainly reflected in the exploitation stage; the water footprint of hydropower is mainly reflected in the evaporation of water resources; and the water footprints of nuclear power and wind power are mainly reflected in the upstream production stage. In terms of the energy consumption of water, in the life cycle of water resources for different types of water, surface water transport, water withdrawal, groundwater abstraction, water supply, water consumption, water drainage, sewage reuse, and seawater desalination all consume energy [46].
It is worth noting that the 2017 multiregional input–output table and provincial input–output tables are the most recent versions of data currently available. To maintain the consistency of the data time period, 2017 data were selected for both water resources and energy data.

4. Results

4.1. Embodied Resource Intensity in Each Province and Sector

Figure 2 shows the spatial and sectoral distribution characteristics of embodied water intensity in China. Except for a few provinces, such as Xinjiang (the resource intensity of all sectors weighted by output value is 325.79 m3/10,000 yuan), Ningxia (132.31 m3/10,000 yuan), and Heilongjiang (143.37 m3/10,000 yuan), the embodied water intensity of southern provinces was generally higher than that of northern provinces. The average embodied water intensity of China is 79.47 m3/10,000 yuan, weighted by the output value of each sector. In 2017, the amount of water resources in southern provinces accounted for 78.06% of the national total amount. These abundant water resources provided sufficient material guarantees for local production, and water management regulations were looser than those in northern water-scarce areas. In contrast, the embodied water intensity of northern provinces was generally low; among them, the Beijing (43.13 m3/10,000 yuan)–Tianjin (42.38 m3/10,000 yuan)–Hebei (60.56 m3/10,000 yuan) economic circle had high water efficiency. These water-deficient areas had improved water utilization efficiency by continuously improving production technology, and their embodied water intensity was significantly lower than that of other provinces. There were great differences in the embodied water intensity among sectors.
Figure 3 shows the spatial and sectoral distribution characteristics of embodied energy intensity. Contrary to the case for water resources, the embodied energy intensity of southern provinces was generally lower than that of northern provinces. The amount of fossil energy extraction in the northern provinces, especially Inner Mongolia, Shaanxi, and Shanxi, accounted for more than 80% of the national total, which ensured the development of energy-intensive industries. Therefore, these regions had higher embodied energy intensity values, which were 91.85 GJ/10,000 yuan, 59.52 GJ/10,000 yuan, and 74.55 GJ/10,000 yuan, respectively. In addition, Ningxia (65.35 GJ/10,000 yuan), Xinjiang (54.42 GJ/10,000 yuan), Qinghai (51.21 GJ/10,000 yuan), and Guizhou (46.12 GJ/10,000 yuan) had high intensity value. These factors led to high embodied energy intensity. Sectors with high embodied energy intensity and embodied water intensity showed a “dislocation” distribution. The mining and washing of coal, extraction of petroleum and natural gas, processing of petroleum, coking, processing of nuclear fuel, production and distribution of electric power and heat power, and production and distribution of gas had high embodied energy intensities. Among them, the energy intensity of the first two sectors was reflected in the direct exploitation of traditional fossil energy, such as raw coal, crude oil, and natural gas. The last three sectors belonged to the downstream processing sectors of energy, and their energy consumption pressure was mainly reflected in indirect use.
Based on the contents of Figure 2 and Figure 3, there is a positive correlation between regional resource intensity and resource endowment conditions, mainly for the following two reasons. First, regions with good natural resource endowments had a high degree of resource development, and the proportion of resource intensity reflected in the local direct part was larger. Second, resource-rich regions had low restrictions on resource-intensive industries, relatively loose resource management standards, and complete industrial chains closely related to resource production and processing, which guaranteed products and services for resource-poor regions. From the perspective of the spatial distribution of resources, China’s water and energy showed the distribution characteristics of “rich in the south and poor in the north” and “rich in the north and poor in the south”, respectively. The resource endowment conditions of most regions did not match the degree of economic development. These resource distribution and utilization characteristics determined the existence of large-scale resource circulation in China. This circulation included physical resource trade (interbasin water transfer, interprovincial energy trade) and virtual resource trade (interprovincial trade of water and energy-intensive products). Therefore, in the macrocontrol and efficient utilization management of resources, full consideration should be given to regional resource endowment conditions and utilization efficiency, as well as the trade relationship between regions, to avoid “putting the cart before the horse”.

4.2. Complex Network Feature Recognition

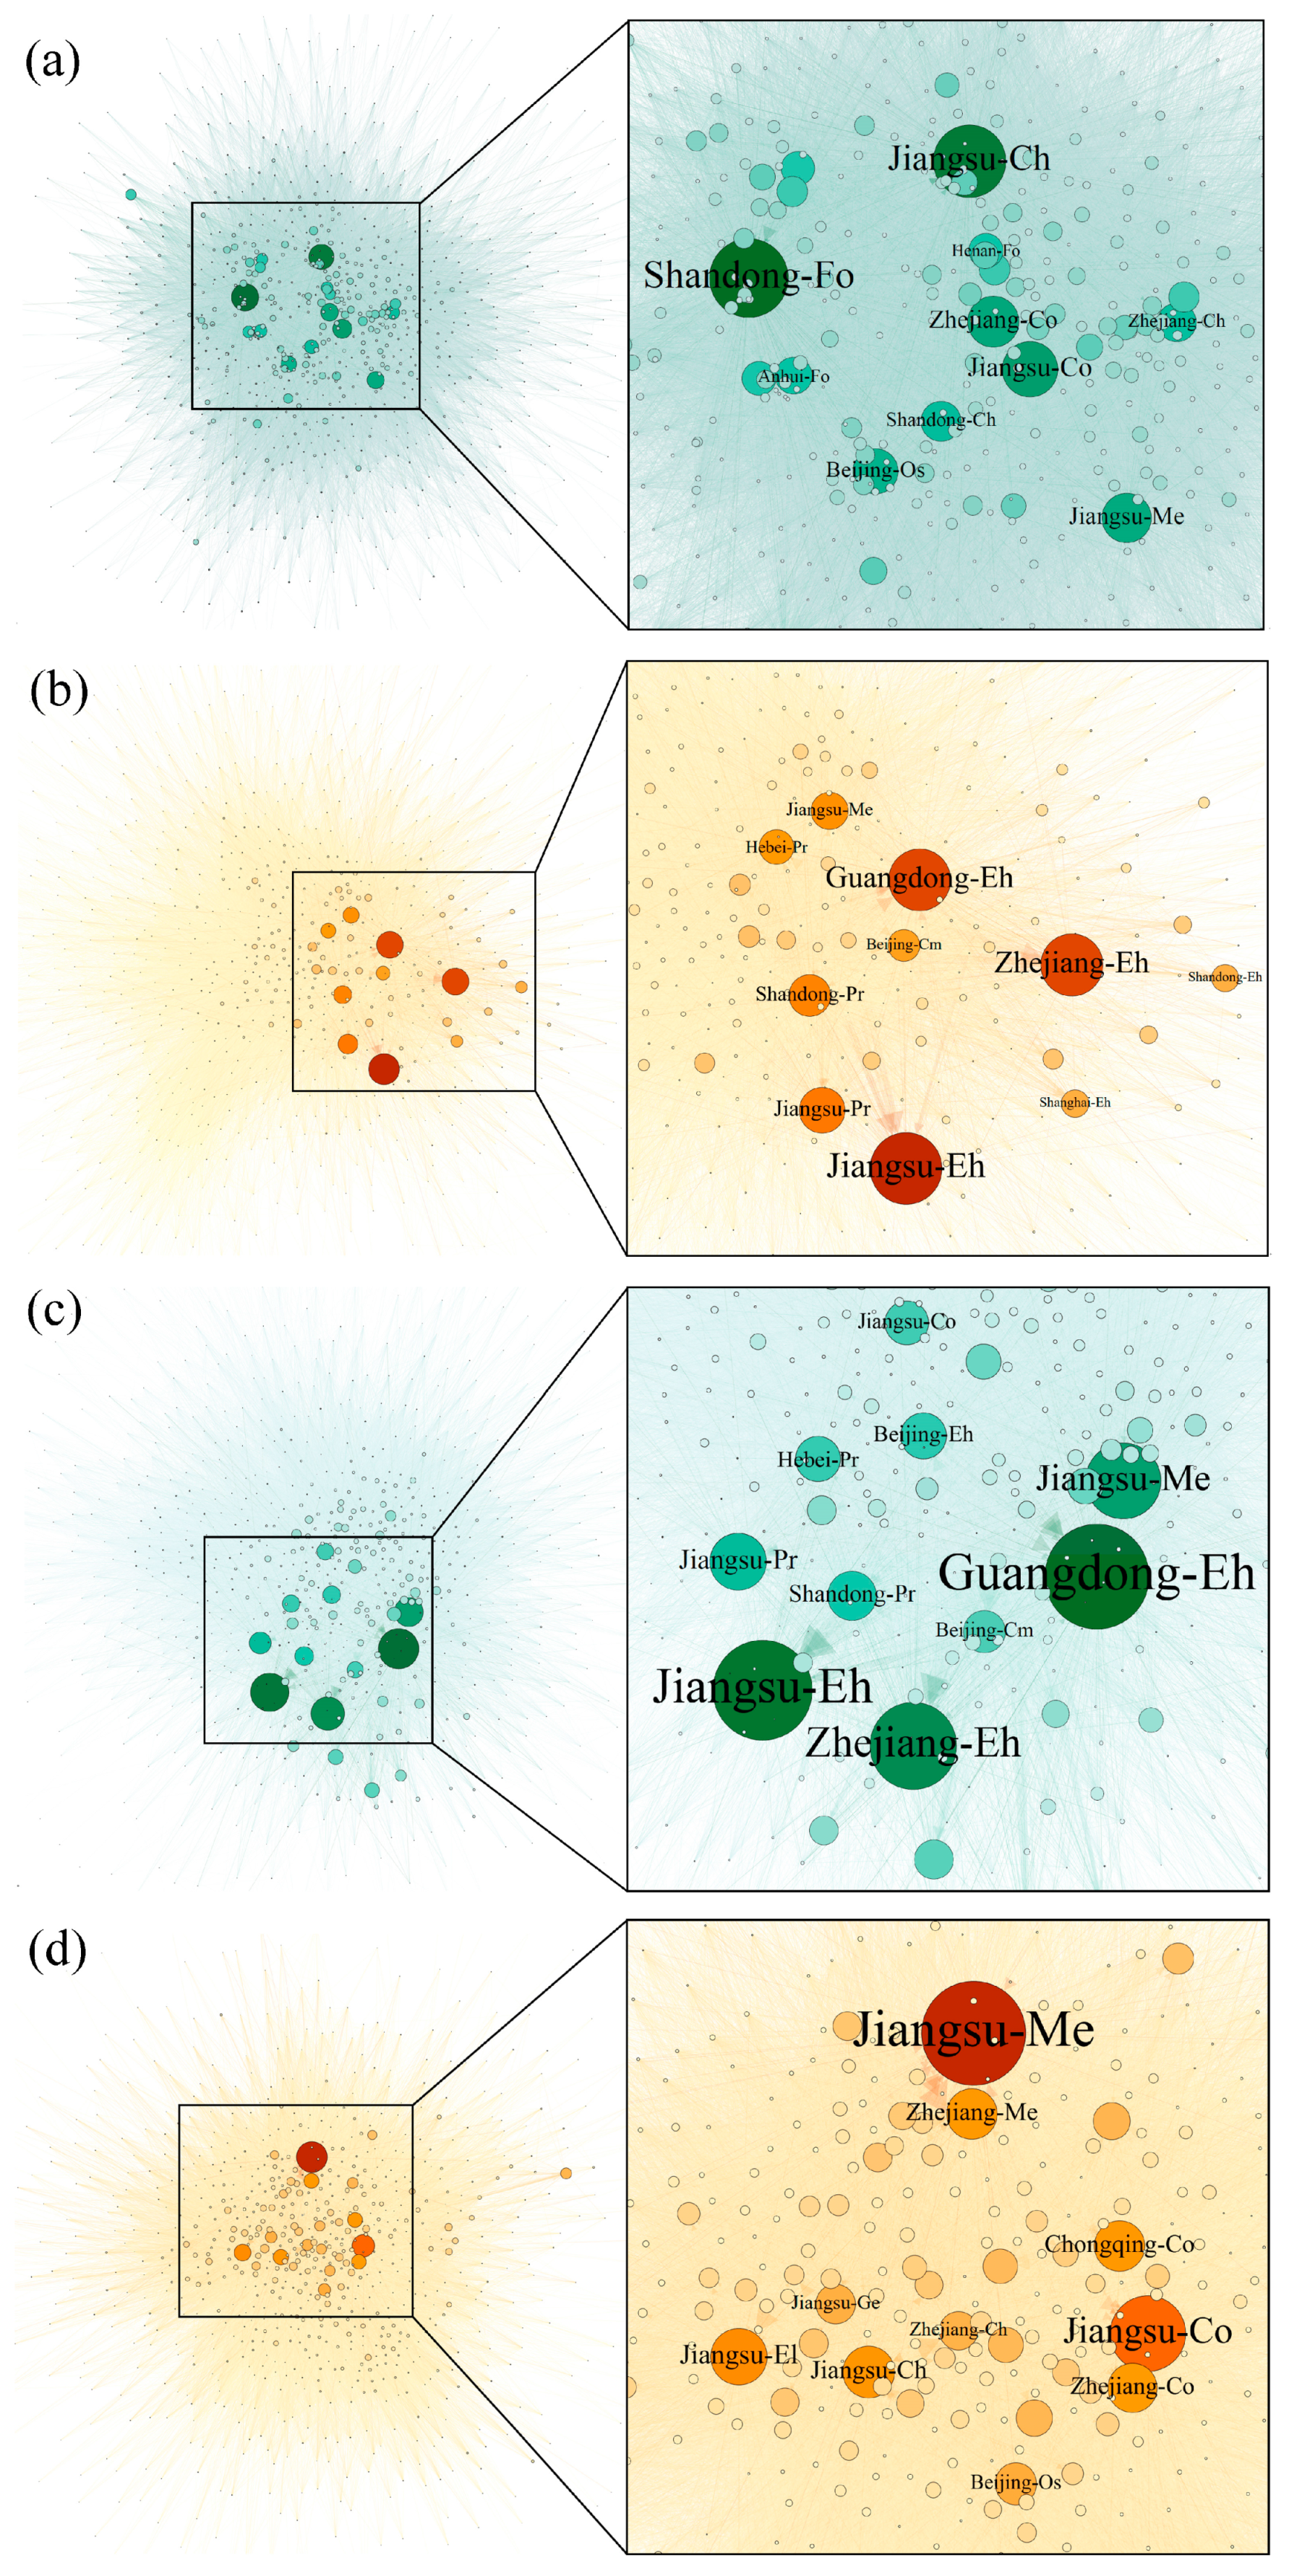
4.2.1. Resource Network Construction

Water and energy flow among regions and sectors through products and services and form intricate resource networks. Resource circulation between nodes can be obtained by multiplying embodied resource intensity by the corresponding economic flow, and economic flow is obtained from the multiregional input–output table.
Notably, in the construction of interprovincial sector–sector resource networks in China, 42 sectors of each province were merged into 30 sectors based on the weight of the output value because many tertiary sectors have relatively low water and energy consumption. To facilitate the presentation of the results, nine industry sectors, including leasing and business services, scientific research and technology services, education, health, and social work, were merged into other services (Os). Moreover, according to industry attributes, the general equipment manufacturing industry and special equipment manufacturing industry were merged; other manufacturing industries, comprehensive utilization of waste materials, metal products, machinery, and equipment maintenance services were merged; and the gas production and supply industry and water production and supply industry were merged. The correspondence relationship is described in Table 1 below. The cumulative probability distributions of edges in water, energy, energy-related water, and water-related energy networks are shown in Figure 4. When the cumulative probability was less than 95%, the cumulative probability grew rapidly as the number of edges increased. Subsequently, the growth rate slowed, which meant that most of the resource circulation was concentrated on a few edges. The purpose of this article is to explore the resource circulation characteristics rather than the economic links between all sectors. Therefore, a weight of 95% for the edge was taken as the threshold of circulation, and edges whose weight was less than this value were deleted. In addition, to better reflect the circulation characteristics of resources between nodes, the weight of the edge that flows back to the node itself was set to zero. The constructed resource networks are shown in Figure 5. For brevity, water, energy, energy-related water, and water-related energy networks are abbreviated as WN, EN, EWN, and WEN, respectively, as detailed in Table 2.

4.2.2. Small-World Characteristics

Generally, a network with a relatively high average clustering coefficient and a relatively low average shortest path has the small-world attribute. In WN, EN, EWN, and WEN, the calculation results of network indicators are shown in Table 3. The clustering coefficient of the four networks was between 0.34 and 0.36, which was significantly higher than the clustering coefficients of random networks of the same size (0.05 to 0.07), indicating that these networks had strong clustering and that network nodes were closely connected. The average shortest path was between 2.29 and 2.51, indicating that the resource circulation between sectors of any province in the resource network needs to pass through only 2–3 sectors, on average, reflecting the frequency and convenience of resource trade in the network. Among the four networks, the small-world indexes were 3.63, 5.84, 4.59, and 3.42, indicating that the small-world attribute was significant, changes in embodied resources in one sector could be quickly transmitted to other sectors, the embodied resources in a few sectors were relatively close, and the network had high connectivity and operating efficiency. Key nodes in the network were likely to have a significant impact on the structure and stability of the whole resource network. The small-world attribute was more significant for the energy network than for water resources; that is, the flow efficiency of embodied energy among provinces and sectors in China was higher, and the resource regulation effect of key sectors in the energy network was more efficient than that of the water network. The small-world characteristics of the resource network were consistent with the actual situation of resource flow because there are differences in the attributes of water and energy trade, except for a small amount of interbasin water transfer; large-scale long-distance or inter-regional physical water trade was very rare, while physical energy trade may occur between different regions, so energy trade was more active and nodes in the network were more closely connected. In terms of mutual consumption of the two resources, taking the EWN as an example, the edge in the network was water consumption of energy; therefore, the resource regulation of key sectors in the network would affect the overall energy and water consumption of the network. Similarly, if a node was a key node in both the EWN and WEN, the resource-saving effect of energy-related water and water-related energy would be significantly better than that of other nodes; that is, the bidirectional saving effect of the two resources was stronger. The small-world characteristics provide a breakthrough for efficient mutual savings of water and energy, and exploring the key nodes and paths of the network will be an important entry point to solve the resource dilemma.
It is worth noting that in the authors’ previous study, the small-world indexes of the water and energy networks constructed with 30 provinces as nodes in China were 1.15 and 1.15, and the small-world indexes of the water and energy networks constructed with 42 sectors as nodes were 2.11 and 3.07 (Hong et al., 2023 [5]), which are significantly lower than the small-world indexes of the water and energy networks in the present study. It shows that among the three options of (1) resource regulation for key provinces, (2) resource regulation for key sectors, and (3) resource regulation for key sectors in key provinces, the third option is the optimal choice for the macro-control of resources and the enhancement of resource utilization efficiency. By refining the regions and sectors in the resource network, the best resource regulation effect can be obtained.

4.2.3. Key Node Identification Based on Node Strength

Node strength is a crucial indicator measuring the importance of nodes, and the change in key nodes significantly affects the function of the entire network (Sun et al., 2016 [51]). The top ten sectors with high node strengths in the WN, EN, EWN, and WEN are listed in Figure 6. It was found that Jiangsu-Metallurgy (Me) had relatively high in-strength in both the WN and EN, and the in-strength was significantly higher than the out-strength, indicating that the sector was at the end of the industrial chain and played a consumer role. The Jiangsu-Chemical industry (Ch) and Hebei-Me had a high out-strength in both the EWN and WEN, and their out-strength was significantly higher than their in-strength, indicating that both sectors were in the middle of the industrial chain and played a processing role. The difference between the in-strength and out-strength of nodes reflected the difference in resource utilization among provinces and sectors. Generally, the economically developed and densely populated areas (Beijing, Shanghai, Jiangsu, Zhejiang, and Shandong) had relatively high in-strength; the economy and population had a strong siphon effect on resource-intensive products, and a large amount of resources was consumed in the form of “final consumption” and no longer entered into other production processes. Compared with the economic development level, the out-strength was more affected by the regional resource endowment conditions and resource utilization efficiency. In the EN, the primary energy production and processing sector in provinces with rich mineral resources (Shanxi, Inner Mongolia, and Shanxi) had high out-strength. In the WN, regions with high resource intensity and active interprovincial trade of resource-intensive products (Heilongjiang, Anhui, and Xinjiang) had higher out-strength. The greater the node strength of the sector was, the stronger its regulation function in the whole resource network was, and the more important the node was in the resource network. On the whole, Jiangsu-Me, Jiangsu-Ch, and Hebei-Me played important roles in water and energy networks and had the “top priority” of the whole resource network regulation. Reasonable resource regulation of these sectors had a significant effect on the “dual saving” of the two resources.
In the mutual consumption of water and energy, energy-related water and water-related energy circulate between different regions and sectors by products or services and form complex resource networks. There were significant differences in the effect of water and energy mutual saving in different regions and sectors, and the mutual saving effect may change through the industrial chain, further aggravating the complexity of the bidirectional resource regulation of water and energy. Exploring the node attributes of the EWN and WEN can provide a new perspective for the bidirectional regulation of water and energy. In Figure 6, Jiangsu-Me and Jiangsu-Co both had high in-strength in the WEN and EWN, and Beijing-Electricity and hot water production and supply (Eh), Hebei-Metallurgy (Me), and Jiangsu-Ch had high out-strength in the two networks. The amount of resources flowing in (out) of these nodes was large, indicating that heavy industry was the main absorber of water and energy, and the direct and indirect consumption of both resources were large, which contained water consumption of fossil energy and energy consumption of water supply, discharge, and reuse. As an economically developed province along the eastern coast of China, Jiangsu had the second largest GDP in China, and its Me had close economic and technological ties with general and specialist machinery (Ge), construction (Co), and electrical equipment (El) in Zhejiang, Anhui, and even Guangdong. Its active economy and developed trade in the region brought frequent resource circulation. For the above four sectors, the energy-saving effect brought by water saving and the water-saving effect brought by energy saving can be quickly spread to other sectors in the network, which are key objects in water and energy collaborative management.

4.2.4. Key Node Identification Based on Eigenvector Centrality

Node strength is an effective indicator for measuring the importance of nodes in a network. However, some nodes with small node strength are also important because they are connected to important nodes in the network, and this can be measured by eigenvector centrality. Table 4 lists the top ten sectors in the four networks in terms of eigenvector centrality. By comparison, Shaanxi-Construction (Co), Yunnan-Co, Beijing-Co, Liaoning-Co, and Jiangsu-General and specialist machinery (Ge) all had relatively high eigenvector centrality in each network. Compared with other sectors, nodes connected to the construction industry were all important sectors in resource networks, including the upstream node nonmetal products (Np), metallurgy (Me), and chemical industry (Ch) and downstream node transport and storage (Ts); they were all nodes with high node strength. Co absorbed a large amount of embodied resources, including water and energy, and a large amount of water-intensive and energy-intensive products and services, promoted the formation of fixed capital, and provided basic guarantees for hotels and restaurants (Ho). In addition, Shaanxi, Yunnan, Beijing, Liaoning, and Jiangsu were the key provinces of northwest, southwest, north, northeast, and east China, respectively, which connected regional and even national resource trade. Improving the resource consumption efficiency of the above five sectors will significantly affect the total embodied water and energy of the network, and the water-saving (energy-saving) effect brought by energy saving (water saving) can more easily spread throughout the network.
Notably, the nodes with high eigenvector centrality in the above four resource networks did not appear in the top ten nodes of node strength. Node strength determines the importance of the node by the inflow and outflow of resources, while eigenvector centrality determines the importance of the node by the importance of adjacent nodes. There is an essential difference between the two indexes. It reflects that nodes with higher node strength in the network were not closely connected and often needed to be connected through “other” nodes, which were nodes with higher eigenvector centrality. Nodes with high node strength often need to be connected to many nodes with smaller node strength to achieve higher resource input (output) volume. This is consistent with the actual resource flow and economic law. For example, resource-rich areas can achieve resource self-sufficiency, so the direct flow of resources between them is small. Similarly, for sectors with large node strength, there was little correlation between sectors of the same category in different regions, but cross-regional resource replenishment of upstream sectors and resource supply of downstream sectors occurred frequently.

4.2.5. Key Path

In the four resource networks, the top ten weighted edges are listed in Table 5. By comparison, it was found that in the WN and EN, there was no same key edge in the top ten. In the EN, coal mining (Cm) in Inner Mongolia and Shanxi were taken as source nodes, and economically developed provinces with poor energy endowments, such as Beijing, Jiangsu, Zhejiang, Shandong, and Guangdong, were taken as the target nodes. The electricity and hot water production and supply industry (Eh) was the main target node. Among them, in Shanxi-Cm → Jiangsu-Eh, Inner Mongolia-Cm → Jiangsu-Eh, and Inner Mongolia-Cm → Zhejiang-Eh, the embodied energies of these three edges were 1.44 × 10⁶ TJ, 1.36 × 10⁶ TJ, and 1.34 × 10⁶ TJ, respectively, which were the three most important edges in the network. Therefore, the key edges that ranked at the top in interprovincial energy circulation were all caused by the industrial division of raw materials. In the WN, the top-ranking key edges all occurred between agriculture (Ag), food processing and tobacco (Fo), and the chemical industry (Ch). There were many nodes with agriculture in Heilongjiang and Xinjiang as source nodes and many nodes with agriculture and its downstream sectors in Shandong, Jiangsu, Zhejiang, and other ×economically developed provinces as target nodes. Among them, the weights of Heilongjiang-Ag → Shandong-Fo, Shandong-Fo → Jiangsu-Ch, and Xinjiang-Ag → Shandong-Ag were ranked in the top three, with values of 1.516 billion m3, 790 million m3, and 677 million m3, respectively. Water-intensive products, such as agricultural products and their processed products, were widely circulated among different provinces. The rankings of the key edges in the EWN and WEN were different from those in the EN and WN because the unit water consumption (energy consumption) of different types of energy (water) was different.
Key paths were connected by key edges. According to the identified key edges, 631, 585, 624, and 661 key paths were identified in the WN, EN, EWN, and WEN, respectively. Figure 7a shows the top three key paths in the WN and EN, and Figure 7b shows the top three key paths in the EWN and WEN. The main key path ran through China’s main economic development sectors, and the key paths in the WN repeatedly passed through Shandong–Jiangsu–Zhejiang Provinces. The manufacturing industry in these three provinces was developed and needed a large amount of basic resources. In addition, the transportation and service industry in the Yangtze River Delta region had significant advantages in the whole country, which promoted industrial development and accelerated the industrial water flow between regions. Key paths in the embodied energy network repeatedly passed through Henan–Shanxi–Jiangsu Provinces; among them, Henan was closely related to Shanxi, Shaanxi, and other major energy-producing provinces, as well as Shandong, Jiangsu, Zhejiang, and other major economic provinces with developed manufacturing and service industries. As the second largest energy-producing province in China, Shanxi continuously and stably supplied energy to many provinces. As a large terminal energy consumption province, Jiangsu absorbed a large amount of direct and indirect energy consumption. The triangular region formed by the three provinces of Henan-Shanxi-Jiangsu connected North China, Central China, and East China, which was an important way to communicate the energy trade between South China and North China; therefore, it frequently appeared in a critical path. The EWN and WEN presented similar characteristics to the EN and WN. Some key edges in the resource network frequently appear in the key path. For example, as mentioned earlier, 631, 585, 624, and 661 key paths were identified in the WN, EN, EWN, and WEN, respectively. Key paths were connected by different key edges, among the key paths of the above four networks, the edge Jiangsu-El → Zhejiang-El occurred 136, 232, 131, and 131 times, respectively, which was the edge with the highest frequency. In addition, Anhui-Ge → Jiangsu-El, Jiangsu-Ge → Anhui-Ge, and Zhejiang-Ge → Jiangsu-Ge had high occurrence frequencies. The higher the frequency of the key edge in the key path is, the more easily the resource-saving effect generated by its resource regulation can spread throughout the whole network. Improving the resource utilization efficiency of the source node will significantly change the circulation of the entire key path and even the entire network, which is an important entry point for China’s water–energy regulation.

5. Discussion

The three-scale resource intensity calculated by the MSIO method provides a more accurate data basis for the construction of resource networks, and a complex network provides an effective means for resource management. The construction of the WN, EN, EWN, and WEN provides a new perspective for the coordinated management of water and energy. The study found that the WN, EN, EWN, and WEN in China had significant small-world characteristics, which indicated that changes within the key sectors in the network would have significant impacts on the whole network. The impacts include the rapid spread of the resource-saving effect caused by the resource-saving policies of key nodes, as well as a resource supply crisis within other nodes caused by resource shortages in key nodes. Due to the close trade flow between regions and sectors in China, it is necessary to identify the key nodes and edges in the resource network and provide countermeasures and suggestions for the overall regulation of resources from a macro perspective.

5.1. Policy Implications

Exploring the node strength in the resource network is helpful to better understand the internal relationship between resources and sectors. For example, when considering the overall resource regulation in China and reducing the total resource consumption, nodes with higher node strength should be the focus because, compared to nodes with lower node strength, nodes with higher node strength are more easily affected by resource control and more sensitive, and their changes have a stronger impact on other nodes. However, on the other hand, the overall resource utilization efficiency of the resource network can still be improved through the nodes with greater node strength. This is because high amounts of resources flow through these nodes, they are closely related to other nodes, the resource-saving effect can easily spread to other sectors, and the resource-saving potential is greater. For example, Jiangsu-Metallurgy, Jiangsu-Chemical industry, and Hebei-Metallurgy were nodes with high node strengths in the WN and EN, and their resource regulation could have a significant effect on both water and energy savings; that is, they had a “dual-saving” effect. The Jiangsu-Metallurgy, Jiangsu-Construction, Beijing-Electricity and hot water production and supply, Hebei-Metallurgy, and Jiangsu-Chemical industries were all nodes with great node strength in the EWN and WEN, and the edges of the networks were constructed by the amount of energy-related water and water-related energy. Energy-saving regulation of these key nodes will produce a significant water-saving effect, and water-saving regulation of these key nodes will produce a significant energy-saving effect; that is, the bidirectional saving effect of the two resources is significant. Nodes with high eigenvector centrality were connected with nodes in critical positions and belonged to key nodes in the network. Construction in Shaanxi, Yunnan, Beijing, and Liaoning had high eigenvector centrality. Nodes with high eigenvector centrality should pay more attention to improving resource consumption efficiency than to regulating total resource use and should avoid drastic changes in adjacent nodes with large strength caused by excessive resource restrictions.
The key paths connected by several key edges provide an entry point for resource regulation from the perspective of trade. Specific resource regulation can be considered from the following three aspects. First, regulators should focus on improving the resource utilization efficiency of the source nodes of key edges with high frequency in the key paths (Jiangsu-Electrical equipment, Zhejiang-Electrical equipment, Anhui-General and specialist machinery, Jiangsu-General and specialist machinery, Zhejiang-General and specialist machinery) and reducing resource intensity to effectively reduce the resource circulation of the whole key path. Second, the edges that frequently appear in the key path of the EWN and WEN are of great significance to the bidirectional regulation effect of water and energy. It is necessary to focus on improving the water utilization efficiency in energy-intensive industries; raising industry water utilization standards; appropriately limiting the development of downstream energy processing industries, such as coal-to-liquid and coal-to-gas; transferring part of the water pressure in energy processing to areas with relatively abundant water resources; reducing local water consumption; easing the tension between water resources and energy; and finally alleviating the contradiction between water and energy throughout the whole resource network. Third, when the target node chooses upstream partners, sectors with higher resource utilization efficiency should be given priority. For example, Jiangsu-Electrical equipment → Zhejiang-Electrical equipment was the edge with the highest frequency. When an industry of Jiangsu-Electrical equipment chooses upstream partners, it can strengthen cooperation with the electrical machinery and equipment industries in Guangdong and Fujian as well as in Jiangsu. The reason is that the first two provinces originally had close cooperation with the electrical industry in Zhejiang, and their electrical industry had lower embodied water intensity and embodied energy intensity than that of Jiangsu. Therefore, Guangdong and Fujian consume less water and energy when providing products of the same value. As another example, Zhejiang-Electrical equipment → Shanghai-Electrical equipment may consider strengthening cooperation between electrical equipment in Shanghai and electrical equipment in Shandong and Henan. In Anhui-General and specialist machinery → Jiangsu-Electrical equipment, it may be considered to strengthen the cooperation between the electrical industry in Jiangsu and the general and special equipment manufacturing industry in Shandong or Shanghai. The above examples all represent the interprovincial resource circulation caused by the industrial division of parts and components; therefore, when the transportation cost, transportation convenience, and other conditions are suitable, product substitution from adjacent or nearby provinces can be considered.

5.2. Deficiencies and Prospects

Based on the embodied resource intensity obtained by MSIO, this study constructed resource networks, explored the resource circulation characteristics, and optimized consumption methods through complex network indicators. The deficiencies and prospects of this study are summarized as follows. First, the national and provincial input–output tables are promulgated every five years, and the interregional input–output table is compiled after a series of balances and adjustments on the basis of the provincial input–output table. At present, the interregional input–output table of 2017 is the most recent version available, so there is a certain time lag in the research, and future research can be updated based on the latest input–output table. Second, when using multiscale resource intensity to construct resource networks, the industry division standard of China’s input–output table is different from that of the world’s input–output table. It is necessary to match 26 sectors at the world scale with 42 sectors in China according to the industry weight, and certain errors may occur in the process of sectoral consolidation, which is also a disadvantage of the multiscale input–output method. More accurate accounting requires a more detailed and unified world-scale input–output table. Third, in this study, four types of resource networks were constructed, namely, water, energy, energy-related water, and water-related energy network, and network topological attributes were quantified, but the resource network models and their computational results were not validated. In future studies, the analysis and validation of the model can be further improved to enhance the accuracy and adaptability of the model and provide a reliable reference for similar studies in other regions.

6. Conclusions

To explore the interprovincial and intersectoral water and energy circulation characteristics in China and determine the key sectors for “dual saving” of water and energy and “bidirectional saving” of energy-related water and water-related energy, this study calculated the resource intensity of water- and energy-related factors in 30 provinces of China based on the MSIO method and constructed a resource intensity database. On this basis, the complex network method was used to construct an interprovincial sector-sector network of water, energy, energy-related water, and water-related energy, and the key nodes and edges in the network were sought to provide countermeasures and suggestions for the saving and efficient utilization of water and energy. The results show that the embodied water intensity presented a spatial distribution of high in the southern area and low in the northern area, while it was high in the northern area and low in the southern area for embodied energy intensity, and sectors with high embodied water intensity and embodied energy intensity showed a “dislocation” distribution in China. The resource networks constructed by water, energy, energy-related water, and water-related energy were all complex networks. For sectors, Jiangsu-Me, Hebei-Me, and Jiangsu-Ch had high node strength in the WN and EN, and they were key sectors in the dual-saving effect on water and energy. Jiangsu-Me, Jiangsu-Co, Jiangsu-Ch, Beijing-Eh, and Hebei-Me had high node strength in the WEN and EWN, and the energy-saving effect brought by water saving and the water-saving effect brought by energy saving could quickly spread to other sectors, presenting the most significant bidirectional saving effect in the whole country. Shaanxi-Co, Yunnan-Co, Beijing-Co, Liaoning-Co, and Jiangsu-Ge all had high eigenvector centrality in the four resource networks, and the resource-saving effect brought by the improvement in their resource utilization efficiency could easily spread throughout the network. For edges that frequently appear in key paths, such as Jiangsu-El → Zhejiang-El, Zhejiang-El → Shanghai-El, Anhui-Ge → Jiangsu-El, Jiangsu-Ge → Anhui-Ge, and Zhejiang-Ge → Jiangsu-Ge, improving the resource utilization efficiency of the source node, strengthening cooperation with upstream sectors with low resource intensity, and expanding the foreign imports of target nodes can effectively reduce the resource consumption of the entire network to achieve water–energy conservation on a national scale.

Author Contributions

The article was mainly written by S.H., H.W. and C.D. collected the data and performed the analysis; H.W. provided many helpful comments and revised the manuscript. All authors have read and agreed to the published version of the manuscript.

Funding

This study is financially supported by the National Natural Science Foundation of China (Grant No. 51879010); Philosophy and Social Science Planning Funded Programs in Guangdong Province (Grant No. GD23YYJ14 and No. GD23YYJ15); China Postdoctoral Science Foundation funded project (Grant No. 2023M730738); Pioneer of Youths Course Project of Guangdong Academy of Agricultural Sciences (Grant No. R2023PY-JX022); Industrial Economics and Urban Agriculture Team Project, Guangdong Academy of Agricultural Sciences (Grant No. 202124TD).

Data Availability Statement

Some or all data, models, or code that support the findings of this study are available from the corresponding author upon reasonable request.

Acknowledgments

We thank anonymous reviewers and editors for constructive comments and suggestions on the manuscript.

Conflicts of Interest

The authors declare no conflicts of interest.

References

  1. Wu, H.J.; Zeng, X.Y.; Zhang, L.; Liu, X.; Jiang, Z.; Dong, Z.; Meng, X.; Wang, Q. Water-energy nexus embedded in coal supply chain of a coal-based city, China. Resour. Policy 2023, 85, 103812. [Google Scholar] [CrossRef]
  2. Chen, S.; Ding, Y.T.; Song, Y.; Zhang, M.; Nie, R. Study on China’s energy system resilience under the scenarios of long-term shortage of imported oil. Energy 2023, 270, 126831. [Google Scholar] [CrossRef]
  3. Li, M.; Cao, X.X.; Liu, D.; Fu, Q.; Li, T.X.; Shang, R.C. Sustainable management of agricultural water and land resources under changing climate and socio-economic conditions: A multi-dimensional optimization approach. Agric. Water Manag. 2022, 259, 107235. [Google Scholar] [CrossRef]
  4. Song, C.; Liu, Z.M.; Chen, H.D.; Zhao, T. The role of intermediate factors in China’s energy consumption from the perspective of global production chain. J. Clean. Prod. 2024, 435, 140263. [Google Scholar] [CrossRef]
  5. Hong, S.Y.; Cheng, T.; Wang, H.R. Characteristics of the water-energy network in the Yangtze River Economic Belt. Resour. Sci. 2021, 43, 1794–1807. (In Chinese) [Google Scholar] [CrossRef]
  6. Qian, X.Y.; Liang, Q.M.; Liu, L.J.; Zhang, K.; Liu, Y. Key points for green management of water-energy-food in the Belt and Road Initiative: Resource utilization efficiency, final demand behaviors and trade inequalities. J. Clean. Prod. 2022, 362, 132386. [Google Scholar] [CrossRef]
  7. Ding, T.H.; Chen, J.F.; Fang, L.P.; Ji, J.; Fang, Z. Urban ecosystem services supply-demand assessment from the perspective of the water-energy-food nexus. Sustain. Cities Soc. 2023, 90, 104401. [Google Scholar] [CrossRef]
  8. Wang, S.; Tang, X.; Zhang, B.; Wang, W.H. Accounting and management of natural resource consumption based on input-output method: A global bibliometric analysis. Front. Energy Res. 2021, 9, 628321. [Google Scholar] [CrossRef]
  9. Cadarso, M.A.; Tobarra, M.A.; Garcia-Alaminos, A.; Nuria, M.O.; Jorge Zafrilla, G. The Input-Output Method for Calculating the Carbon Footprint of Tourism: An Application to the Spanish Tourism Industry. Adv. Footpr. Fam. Sustain. Energy Ind. Syst. 2022, 35–58. [Google Scholar] [CrossRef]
  10. Wang, X.Z.; Zhang, W.L.; Li, Y.; Tong, J.X.; Yu, F.; Ye, Q.L. Impacts of water constraints on economic outputs and trade: A multi-regional input-output analysis in China. J. Clean. Prod. 2024, 434, 140345. [Google Scholar] [CrossRef]
  11. Xu, C.Z.; Zhu, Q.Y.; Li, X.C.; Wu, L.P.; Deng, P. Determinants of global carbon emission and aggregate carbon intensity: A multi-region input-output approach. Econ. Anal. Policy 2024, 81, 418–435. [Google Scholar] [CrossRef]
  12. Islam, K.M.N.; Kenway, S.J.; Renouf, M.A.; Wiedmann, T.; Lam, K.L. A multi-regional input-output analysis of direct and virtual urban water flows to reduce city water footprints in Australia. Sustain. Cities Soc. 2021, 75, 103236. [Google Scholar] [CrossRef]
  13. Jiang, M.D.; Huang, Y.M.; Bai, Y.; Wang, Q. How can Chinese metropolises drive global carbon emissions? Based on a nested multi-regional input-output model for China. Sci. Total Environ. 2023, 856, 159094. [Google Scholar] [CrossRef]
  14. Liang, J.Y.; Wang, S.J.; Liao, Y.T.; Feng, K.S. Carbon emissions embodied in investment: Assessing emissions reduction responsibility through multi-regional input-output analysis. Appl. Energy 2024, 358, 22558. [Google Scholar] [CrossRef]
  15. Zhang, J.B.; Liu, L.R.; Xie, Y.L.; Zhang, Y.; Guo, H.C. An integrated optimization and multi-scale input-output model for interaction mechanism analysis of energy-economic-environmental policy in a typical fossil-energy-dependent region. Energy Strategy Rev. 2022, 44, 100947. [Google Scholar] [CrossRef]
  16. Liu, S.Y.; Zhang, J.J.; Han, M.Y.; Yao, Y.X.; Chen, G.Q. Multi-scale water use balance for a typical coastal city in China. J. Clean. Prod. 2019, 236, 117505. [Google Scholar] [CrossRef]
  17. Tian, Z.Z.; Fang, D.L.; Chen, B. Three-scale input-output analysis for energy and water consumption in urban agglomeration. J. Clean. Prod. 2020, 268, 112148. [Google Scholar] [CrossRef]
  18. Wu, X.F.; Chen, G.Q. Energy use by Chinese economy: A systems cross-scale input-output analysis. Energy Policy 2017, 108, 81–90. [Google Scholar] [CrossRef]
  19. Guo, S.; Li, Y.L.; He, P.; Chen, H.S.; Meng, J. Embodied energy use of China’s megacities: A comparative study of Beijing and Shanghai. Energy Policy 2021, 155, 112243. [Google Scholar] [CrossRef]
  20. Hu, J.M.; Liu, G.Y.; Meng, F.X.; Hu, Y.C.; Casazza, M. Subnational carbon flow pattern analysis using multi-scale input-output model. Ecol. Model. 2020, 431, 109138. [Google Scholar] [CrossRef]
  21. Lu, C.; Du, Q.; Li, J.T.; Li, Y.; Wang, X.Y. Trade embodied CO2 transfers from transportation sector: A nested multi-scale input-output perspective. Transp. Res. Part D Transp. Environ. 2023, 119, 103727. [Google Scholar] [CrossRef]
  22. Shao, L.; Guan, D.B.; Wu, Z.; Wang, P.S.; Chen, G.Q. Multi-scale input-output analysis of consumption-based water resources: Method and application. J. Clean. Prod. 2017, 164, 338–346. [Google Scholar] [CrossRef]
  23. Meng, F.X.; Wang, D.F.; Meng, X.Y.; Li, H.; Liu, G.Y.; Yuan, Q.L.; Hu, Y.C.; Zhang, Y. Mapping urban energy-water-land nexus within a multiscale economy: A case study of four megacities in China. Energy 2022, 239, 12203. [Google Scholar] [CrossRef]
  24. Chen, G.W.; Wiedmann, T.; Wang, Y.F. Transnational city carbon footprint networks-Exploring carbon links between Australian and Chinese cities. Appl. Energy 2016, 184, 1082–1092. [Google Scholar] [CrossRef]
  25. Ma, N.; Sun, W.L.; Wang, Z.; Li, H.J.; Ma, X.T.; Sun, H.C. The effects of different forms of FDI on the carbon emissions of multinational enterprises: A complex network approach. Energy Policy 2023, 181, 113731. [Google Scholar] [CrossRef]
  26. Watts, D.J.; Strogatz, S.H. Collective dynamics of “small-world” networks. Nature 1998, 393, 440. [Google Scholar] [CrossRef]
  27. Cervi, E.; Cammi, A.; Zio, E. A new approach for nuclear reactor analysis based on complex network theory. Prog. Nucl. Energy 2019, 112, 96–106. [Google Scholar] [CrossRef]
  28. Memon, B.A.; Tahir, R. Examining Network Structures and Dynamics of World Energy Companies in Stock Markets: A Complex Network Approach. Int. J. Energy Econ. Policy 2021, 11, 329–344. [Google Scholar] [CrossRef]
  29. Simonel, A.; Cesarol, A.; Del Giudice, G.; Cristo, C.D.; Fecarotta, O. Potentialities of Complex Network Theory Tools for Urban Drainage Networks Analysis. Water Resour. Res. 2022, 58, e2022WR032277. [Google Scholar] [CrossRef]
  30. Kitamura, T.; Managi, S. Driving force and resistance: Network feature in oil trade. Appl. Energy 2017, 208, 361–375. [Google Scholar] [CrossRef]
  31. Ullah, A.; Wang, B.; Sheng, J.F.; Long, J.; Khan, N.; Sun, Z.J. Identifying vital nodes from local and global perspectives in complex networks. Expert Syst. Appl. 2021, 186, 115778. [Google Scholar] [CrossRef]
  32. Feng, L.; Chen, B.; Wu, G.; Zhang, Q. Global renewable energy trade network: Patterns and determinants. Environ. Sci. Pollut. Res. 2024, 31, 15538–15558. [Google Scholar] [CrossRef] [PubMed]
  33. Hong, J.K.; Tang, M.H.; Wu, Z.Z.; Miao, Z. The evolution of patterns within embodied energy flows in the Chinese economy: A multi-regional-based complex network approach. Sustain. Cities Soc. 2019, 47, 101500. [Google Scholar] [CrossRef]
  34. Chen, S.; Ding, Y.T.; Zhang, Y.F.; Zhang, M.; Nie, R. Study on the robustness of China’s oil import network. Energy 2022, 239, 122139. [Google Scholar] [CrossRef]
  35. Lei, H.; Zhang, X.; Han, X.Y. Exploring virtual water network dynamics of China’s electricity trade: Insights into the energy-water nexus. Sustainability 2023, 15, 15977. [Google Scholar] [CrossRef]
  36. Zhang, H.W.; Wang, Y.; Yang, C.; Guo, Y.Q. The impact of country risk on energy trade patterns based on complex network and panel regression analyses. Energy 2021, 222, 119979. [Google Scholar] [CrossRef]
  37. Chen, J.Y.; Luo, Q.; Sun, X.; Zhang, Z.T.; Dong, X.S. The impact of renewable energy consumption on lithium trade patterns: An industrial chain perspective. Resour. Policy 2023, 85, 103837. [Google Scholar] [CrossRef]
  38. Chen, B.; Li, J.S.; Wu, X.F.; Han, M.Y.; Zeng, L.; Li, Z.; Chen, G.Q. Global energy flows embodied in international trade: A combination of environmentally extended input–output analysis and complex network analysis. Appl. Energy 2018, 210, 98–107. [Google Scholar] [CrossRef]
  39. Zhang, X.; Vesselinov, V.V. Integrated modeling approach for optimal management of water, energy and food security nexus. Adv. Water Resour. 2017, 101, 1–10. [Google Scholar] [CrossRef]
  40. Shi, J.L.; Li, H.J.; Guan, J.H.; Sun, X.Q.; Guan, Q.; Liu, X.J. Evolutionary features of global embodied energy flow between sectors: A complex network approach. Energy 2017, 140, 395–405. [Google Scholar] [CrossRef]
  41. Ren, B.; Li, H.J.; Shi, J.; Ma, N.; Qi, Y.J. Detecting the control and dependence relationships within the global embodied energy trade network. Energy 2022, 238, 121678. [Google Scholar] [CrossRef]
  42. Li, K.; Feng, C.Y.; Liang, Y.H.; Qi, J.C.; Li, Y.M.; Li, H.; Liang, S.; Yang, Z.F. Critical transmission sectors for provincial food-water nexus in China. J. Clean. Prod. 2021, 279, 123886. [Google Scholar] [CrossRef]
  43. Hong, S.; Wang, H.; Cheng, T. Circulation characteristic analysis of implied water flow based on a complex network: A case study for Beijing, China. Water 2018, 10, 834. [Google Scholar] [CrossRef]
  44. Chen, G.Q.; Chen, H.; Chen, Z.M.; Zhang, B.; Shao, L.; Guo, S.; Zhou, S.Y.; Jiang, M.M. Low-carbon building assessment and multi-scale input-output analysis. Commun. Nonlinear Sci. Numer. Simul. 2011, 16, 583–595. [Google Scholar] [CrossRef]
  45. Ding, N.; Liu, J.; Yang, J.; Lu, B. Water footprints of energy sources in China: Exploring options to improve water efficiency. J. Clean. Prod. 2018, 174, 1021–1031. [Google Scholar] [CrossRef]
  46. Wang, S.; Liu, Y.; Chen, B. Multiregional input-output and ecological network analyses for regional energy-water nexus within China. Appl. Energy 2018, 227, 353–364. [Google Scholar] [CrossRef]
  47. Mariane, B.; Odemir, M. Exploring ordered patterns in the adjacency matrix for improving machine learning on complex networks. Phys. A Stat. Mech. Its Appl. 2023, 626, 129086. [Google Scholar] [CrossRef]
  48. Barabási, A.L.; Albert, R. Emergence of scaling in random networks. Science 1999, 286, 509–512. [Google Scholar] [CrossRef]
  49. Xu, Y.; Feng, Z.D.; Qi, X.Q. Signless-laplacian eigenvector centrality: A novel vital nodes identification method for complex networks. Pattern Recognit. Lett. 2021, 148, 7–14. [Google Scholar] [CrossRef]
  50. Pradhan, P.; Angeliya, C.U.; Jalan, S. Principal eigenvector localization and centrality in networks: Revisited. Phys. A 2020, 554, 124169. [Google Scholar] [CrossRef]
  51. Sun, X.; An, H.Z.; Gao, X.Y.; Jia, X.L.; Liu, X.J. Indirect energy flow between industrial sectors in China: A complex network approach. Energy 2016, 94, 195–205. [Google Scholar] [CrossRef]
  52. Lenzen, M.; Moran, D.; Kanemoto, K.; Geschke, A. Building Eora: A global multiregion input-output database at high country and sector resolution. Econ. Syst. Res. 2013, 25, 20–49. [Google Scholar] [CrossRef]
  53. NBS. Input-Output Tables of China 2017; China Statistics Press: Beijing, China, 2019. (In Chinese) [Google Scholar]
  54. World Bank Open Data. World Development Indicators Data-Annual Freshwater Withdrawals; World Bank Open Data: Washington, DC, USA, 2018. [Google Scholar]
  55. NBS. China Statistical Yearbook; China Statistics Press: Beijing, China, 2018. (In Chinese) [Google Scholar]
  56. Hong, S.Y.; Yang, H.; Cheng, T.; Cheng, T. Water and energy circulation characteristics and their impacts on water stress at the provincial level in China. Stoch. Environ. Res. Risk Assess. 2021, 35, 147–164. [Google Scholar] [CrossRef]
  57. Dudley, B. BP Statistical Review of World Energy. 2018. Available online: https://www.bp.com/content/dam/bp/business-sites/en/global/corporate/pdfs/news-and-insights/speeches/bp-statistical-review-of-world-energy-2018.pdf (accessed on 20 July 2024).
Figure 1. Circulation characteristics of embodied resources.
Water 16 02132 g001
Figure 2. Embodied water intensity in 30 provinces and each sector.
Water 16 02132 g002
Figure 3. Embodied energy intensity in 30 provinces and each sector.
Water 16 02132 g003
Figure 4. Cumulative probability distribution of weights of edges.
Water 16 02132 g004
Figure 5. Embodied resource networks with 900 sectors as nodes. (a) WN; (b) EN; (c) EWN; (d) WEN. The node size represents the in-strength, and the color shade represents the out-strength. Larger nodes have greater in-strength, and darker nodes have greater out-strength.
Water 16 02132 g005
Figure 6. Top 10 sectors in terms of in-strength and out-strength in four networks. (a) WN; (b) EN; (c) EWN; (d) WEN.
Water 16 02132 g006
Figure 7. Top 3 key edges in terms of weight (a) WN and EN; (b) EWN and WEN. Different colors represent different key paths.
Water 16 02132 g007
Table 1. Correspondence between 30 sectors in the multiregional input–output table and 42 sectors in the single-region input–output table.
30 Sectors CodeSector Name and Abbreviation42 Sectors Code30 Sectors CodeSector Name and Abbreviation42 Sectors Code
S1Agriculture (Ag)S1S16General and specialist machinery (Ge)S16~S17
S2Coal mining (Cm)S2S17Transport equipment (Tr)S18
S3Petroleum and gas (Pe)S3S18Electrical equipment (El)S19
S4Metal mining (Mm)S4S19Electronic equipment (Ec)S20
S5Nonmetal mining (No)S5S20Instrument and meter (In)S21
S6Food processing and tobaccos (Fo)S6S21Other manufacturing (Ot)S22~S24
S7Textile (Te)S7S22Electricity and hot water production and supply (Eh)S25
S8Clothing, leather, fur, etc. (Cl)S8S23Gas and water production and supply (Ga)S26~S27
S9Wood processing and furnishing (Wo)S9S24Construction (Co)S28
S10Paper making, printing, stationery, etc. (Pa)S10S25Transport and storage (Ts)S29
S11Petroleum refining, coking, etc. (Pr)S11S26Wholesale and retailing (Wh)S30
S12Chemical industry (Ch)S12S27Hotel and restaurant (Ho)S31
S13Nonmetal products (Np)S13S28Leasing and commercial services (Le)S32
S14Metallurgy (Me)S14S29Scientific research (Sc)S33
S15Metal products (Mp)S15S30Other services (Os)S34~S42
Table 2. Resource network types and their abbreviations.
AbbreviationWNENEWNWEN
Full nameWater resource networkEnergy networkEnergy-related waterWater-related energy network
Table 3. Indexes of resource networks.
WNENEWNWEN
Average clustering coefficient0.340.360.340.35
average shortest path2.362.512.402.29
Clustering coefficient (random network of the same size)0.070.050.050.07
Average shortest path length (random network of the same size)1.681.851.761.63
Small-world index3.635.844.593.42
Table 4. Top 10 sectors in terms of eigenvector centrality.
WNENEWNWEN
SectorValueSectorValueSectorValueSectorValue
26-Co1.0025-Co1.0026-Co1.0026-Co1.00
25-Co0.9626-Co0.9725-Co1.0025-Co0.96
1-Co0.8410-Ge0.9110-Ge0.906-Co0.85
12-Co0.8210-Co0.896-Co0.881-Co0.82
6-Co0.8216-Ge0.871-Co0.8616-Np0.81
10-Co0.8211-Ge0.8616-Ge0.8510-Ge0.80
10-Ge0.816-Co0.866-Ge0.846-Ge0.80
22-Co0.8011-Co0.8516-Np0.8412-Co0.80
11-Co0.806-Ge0.8512-Co0.8311-Co0.78
16-Np0.791-Co0.8410-Co0.8330-Co0.78
Table 5. Top 10 key edges in terms of weight in four networks.
WN (108 m3)EN (TJ)EWN (108 m3)WEN (TJ)
Source → TargetWeightSource → TargetWeightSource → TargetWeightSource → TargetWeight
8-Ag → 15-Fo15.164-Cm → 10-Eh1.44 × 1064-Cm → 10-Eh2.803-Me → 10-Me7.56 × 103
15-Fo → 10-Ch7.905-Cm → 10-Eh1.36 × 1065-Cm → 10-Eh2.6312-Eh → 14-Eh7.12 × 103
30-Ag → 15-Ag6.775-Cm → 11-Eh1.34 × 1065-Cm → 11-Eh2.6015-Ga → 10-Ga7.07 × 103
8-Ag → 6-Fo6.574-Cm → 11-Eh1.27 × 1064-Cm → 11-Eh2.4710-Ch → 11-Ch6.03 × 103
10-Ch → 11-Ch5.945-Cm → 1-Cm1.13 × 1065-Cm → 1-Cm2.1912-Me → 10-El5.88 × 103
12-Fo → 10-Ch5.905-Cm → 19-Eh1.06 × 1065-Cm → 19-Eh2.0616-Me → 10-Me4.77 × 103
8-Ag → 5-Fo5.854-Cm → 19-Eh8.95 × 1054-Cm → 19-Eh1.753-Me → 11-Me4.27 × 103
30-Ag → 16-Ag5.534-Cm → 3-Pr8.29 × 10512-Cm → 10-Eh1.6910-Ch → 12-Ch4.24 × 103
30-Ag → 15-Ch5.054-Cm → 15-Eh7.64 × 1054-Cm → 3-Pr1.6224-Eh → 22-Eh4.19 × 103
30-Ag → 3-Ag5.034-Cm → 1-Cm7.16 × 10524-Cm → 19-Eh1.6212-Np → 10-Co3.89 × 103
Disclaimer/Publisher’s Note: The statements, opinions and data contained in all publications are solely those of the individual author(s) and contributor(s) and not of MDPI and/or the editor(s). MDPI and/or the editor(s) disclaim responsibility for any injury to people or property resulting from any ideas, methods, instructions or products referred to in the content.

