Abstract
Ensuring access to safe drinking water remains a crucial global challenge, particularly in low-income and developing regions. Point-of-use (POU) sand filters, known for their affordability and efficiency, hold promise for improving water quality. This study explores the use of copper mesh (M-Cu) as a disinfectant in sand filters, focusing on its effectiveness against Escherichia coli (E. coli). Through a series of experiments—kinetic, batch, and column—we investigated the impact of M-Cu on bacterial inactivation. Our findings reveal that the contact time between the M-Cu and bacteria is more critical than the M-Cu mass for achieving significant microbial reduction. Specifically, 1.0 g of M-Cu can substantially reduce E. coli levels, achieving log removal values (LRVs) between 2.03 and 4.81 after 30 min of exposure, across initial bacterial concentrations ranging from 102 to 106 CFU/100 mL. For sand filter testing under dynamic conditions, columns containing 1.0 g of M-Cu achieved a 3.1 LRV, significantly outperforming control columns, which only achieved a 0.6 LRV. These results support the integration of M-Cu into sand filters as a viable strategy for enhancing microbial safety in water treatment, potentially reducing waterborne disease incidence in vulnerable populations.
Keywords:
copper; sand filters; disinfection; point-of-use; mesh-copper; antimicrobial; water treatment 1. Introduction
A lack of access to drinking water, the consumption of contaminated water, and poor hygiene can cause major health concerns, including diarrhea, cholera, dysentery, typhoid, and polio [1,2]. More than 884 million people around the world did not have access to safely managed drinking water in 2017 [2,3]. These numbers are even less encouraging if current trends continue; by 2030, at least 1.6 billion people will lack safely managed drinking water, sanitation, and basic hand hygiene facilities, according to the United Nations [4]. Water quality can deteriorate due to non-point source pollution, including agricultural and urban runoff [5]. Vulnerable communities that lack secure access to safe water and reliable treatment systems are the most affected. Additionally, water quality can be impacted by droughts, overuse in agricultural irrigation, and sudden increases in annual rainfall and runoff, with high turbidity and concentrations of total suspended solids [5].
Organizations worldwide have begun addressing these significant challenges by promoting decentralized point-of-use (POU) systems. The necessity for POU systems is becoming increasingly relevant as climate change continues to impact the global drinking water supply. POU systems, such as ceramic, sand, and bio-sand filters (BSFs), are compact, economical, and easy to implement, particularly in developing countries. BSFs demonstrated effective pathogen removal, significantly reducing E. coli and other contaminants by up to 99% [6,7,8]. This effectiveness is largely attributed to the biofilm, or schmutzdecke, that forms on the sand surface, enhancing microbial degradation [6,8]. The filters are cost-effective, simple to construct, and easy to maintain, making them suitable for low-income and rural areas. However, consistent water flow and proper maintenance are crucial for biofilm development and optimal performance. High particulate loads can clog the filter, necessitating frequent maintenance [6]. The performance of BSFs can vary based on local water quality and user practices, leading to inconsistent results [9]. Further BSFs only work at full capacity when their microbial layer has fully matured, which can take up to six months, making them less ideal for immediate use.
Sand filtration, a granular media filtration process used globally, offers several advantages for household use, including affordability, low maintenance, ease of operation, high flow rates (between 3 and 60 L/h), and the ability to reduce suspended particles in water, especially when sourced from surface water reservoirs [10]. Sand filters are popular POU systems for households, as they are effective at removing bacteria such as Escherichia coli (E. coli). Under laboratory conditions, sand filters achieve an average bacteria reduction of 94%, with slightly lower performance under field conditions [10]. However, these systems can be enhanced with disinfection agents like silver or copper to reduce E. coli levels to the Environmental Protection Agency’s maximum contaminant level goal (EPA MCLG) standard of zero. The use of silver and copper nanoparticles in POUs has been well-researched in both laboratory and field conditions [11,12,13,14]. Although the addition of nanoparticles enhances the bacterial removal capabilities of POU systems, nanoparticles are expensive to manufacture and require techniques that may not be available in low-income and developing communities.
The antimicrobial action of copper involves the release of copper ions (Cu2⁺), which can disrupt cell membranes, generate reactive oxygen species, and interact with cellular proteins and DNA, leading to cell death [15,16]. This multi-targeted mechanism reduces the likelihood of microorganisms developing resistance. Copper is less expensive than silver and has been used in various forms, such as mesh, due to its well-known antimicrobial properties. Singh et al. (2019) used concentrations between 0.2 and 0.8 mg/L of CuNO₃ and achieved a 4-log removal value (LRV) of E. coli in 12 h [17]. Armstrong et al. (2016) found that 0.3 mg/L of CuCl₂ was sufficient for a 2.5 LRV for E. coli in 6 h [18]. Similar results were reported by Sicairos-Ruelas et al. (2019), who achieved a 2.56 LRV reduction for E. coli after 7 h using 0.4 mg/L of CuCl₂H₂O [19]. Higher concentrations, such as 1 and 3 mg/L of CuCl₂, achieved up to an 8.5 LRV for E. coli in 3 and 6 h, respectively. Rossainz-Castro et al. (2016) used zeolite modified with 0.1 M (13.4 g/L) CuCl₂ as a disinfectant and reached 100% removal efficiency for E. coli within 31 h [20]. In addition to its antimicrobial properties, copper is affordable, readily available, and easier to manipulate and control compared to other forms of metallic disinfectants. For instance, the antimicrobial properties of copper as part of a composite coating on high touch surfaces in healthcare facilities were successfully tested by Montero et al. 2019 [21]. In the same way, an antimicrobial second-skin copper nanomesh was studied to prevent cross-infection while maintaining skin naturalness, with an inactivation rate of 99.99% for E. coli in 1 min [22]. On the other hand, nanoparticles are challenging to place systematically inside a filter and can leak excessive amounts of residual ions into the filtrate. Although copper nanoparticles are effective against bacteria, nanoparticles are difficult to control within the filter [23].
This research aims to test the feasibility of enhancing sand filters using copper mesh (M-Cu) through laboratory testing, with the goal of providing clean drinking water (approximately 12 L per day) efficiently and with minimal maintenance for a family of four. By integrating M-Cu into the sand filter design, which combines a compact form, affordability using readily available materials, and reliable performance, the study aims to enhance the filter’s disinfection capabilities. Implementing these improved sand filters could potentially reduce preventable deaths in developing countries by expanding access to clean water. The novelty of this research lies in the integration of copper mesh into traditional sand filters to leverage both mechanical and antimicrobial properties, providing an innovative approach to water purification that addresses both microbial contamination and operational sustainability.
2. Materials and Methods
2.1. Materials
Chemicals and supplies including sodium chloride (99% purity), tryptone, yeast extract, potassium phosphate monobasic, potassium phosphate dibasic, and ethylenediaminetetraacetic acid (EDTA) (99% purity) were all obtained from Fisher Scientific, Hampton, NH, USA, and used as received. A copper mesh with 99.9% purity and a pore diameter of 0.375 mm, conforming to ASTM E-2016-11 standards, was obtained from Edward J. Darby & Son Inc., Philadelphia, PA, USA. This 40 × 40 mesh is made from 0.254 mm diameter copper wire with a 36% open area and a weight of 13.32 g/m2. A nonpathogenic, wild, motile strain of E. coli isolated from a Louisiana swamp (IDEXX, Westbrook, ME, USA) was used for all experiments. This strain was chosen because E. coli serves as a model indicator for fecal coliforms in drinking water treatment.
2.2. Methodology
All experimental solutions were prepared using sterile 1.3 mmol sodium chloride solution. All solutions and labware were sterilized prior to use. E. coli was cultured in Lysogeny Miller broth (LB) at 37.5 °C for approximately 12 h. The bacteria were cleaned and enumerated using procedures described by Schifman et al., 2015 [24]. The enumeration of E. coli was performed using a membrane filtration technique with m-FC broth containing Rosolic Acid (Millipore, Burlington, MA, USA) and subsequent incubation at 44.5 °C for 24 to 48 h. Sterile phosphate-buffer solution was used for any dilutions and cleaning.
A step-by-step screening approach was employed to test the efficacy of M-Cu in removing E. coli as part of sand filters. First, kinetic experiments were conducted to determine the effect of contact time and mass of M-Cu on E. coli inactivation. Based on the results from these kinetic studies and the Chick–Watson model, a specific contact time and mass of copper were chosen for further testing. Next, the effectiveness of the chosen mass of M-Cu was tested with various concentrations (from 102 to 106 coliform units per 100 mL (CFU/100 mL)) of E. coli under batch conditions. Finally, column experiments were conducted to determine the effectiveness of M-Cu in a sand filter on E. coli inactivation. All batch and kinetic experiments were conducted in triplicate, column tests in duplicate, and the data presented in the results are the averages along with standard deviations. The preliminary experiment indicated a decrease in copper ion release from M-Cu autoclaved or exposed to air and water, relative to virgin mesh. This effect was reflected in preliminary E. coli inactivation tests, where virgin mesh showed superior inactivation performance. This is likely due to the oxidization of the M-Cu. To simulate real-world conditions of copper oxidation, washed and autoclaved mesh was utilized for the entirety of this research.
2.3. Copper Ion Release Kinetics
The amount of copper ions released into the solution from M-Cu (0.25 g, 0.5 g, 1.0 g, and 2.0 g) was measured at 15, 30, 60, and 90 min. Test tubes containing M-Cu were filled with 1.3 mmol sodium chloride solution and incubated at 25 °C. At each time interval, the tubes were removed, and the solution was filtered through a 0.22 µm glass fiber filter and digested by adding 20% nitric acid in preparation for analysis using Agilent Inductively Coupled Plasma-Mass Spectrometry ICP-MS 7900 (Agilent Technologies, Santa Clara, CA, USA).
2.4. Inactivation Kinetics Experiments
All kinetics experiments were conducted using solutions with an E. coli concentration of 10⁴ CFU/100 mL. The E. coli solutions were exposed to 0.25 g, 0.5 g, 1.0 g, and 2.0 g masses of M-Cu for 15, 30, 60, and 90 min at 25 °C. The log removal value (LRV) was calculated as the difference between the initial concentration and the concentration after exposure:
where Co is the initial E. coli concentration (CFU/100 mL), and Ct is the final E. coli concentration (CFU/100 mL). The Chick–Watson model was applied to the data obtained from kinetics experiments to determine whether contact time or the concentration of copper has a more significant impact on inactivating E. coli [25]. The model is represented as:
where No is the initial E. coli. concentration (CFU/100 mL), Nt is the E. coli. concentration (CFU/100 mL) at time t (min), k is the inactivation rate constant (min−1), C is the concentration of copper (grams of M-Cu) and n is the coefficient of dilution (unitless). The value of n determines whether contact time or concentration is more important. If n = 1, time and concentration are equally important; if n > 1, concentration is more important than time; and if n < 1, time is more important than concentration.
ln (Nt/No) = −k Cn t
2.5. Batch Testing
Batch experiments were conducted to examine the inhibitory effect of M-Cu against a range of E. coli concentrations from 102 to 106 CFU/100 mL. The concentration of copper and contact time were selected according to the inactivation kinetics results. Sterilized 50 mL polypropylene centrifuge tubes were used as reactors for this experiment. Each tube contained either 0.25 g, 0.5 g, 1.0 g, or 2.0 g of M-Cu, added to 30 mL of E. coli solution. The tubes were then placed in a rotisserie incubator at 25 °C for 30 min. No sand was included during this testing phase.
2.6. Column Testing
Column experiments were conducted to determine the impact of adding M-Cu to a sand filter under dynamic conditions. Two sterilized glass columns (15 cm height × 2.5 cm diameter) were packed with clean sand (size range from 0.2 to 0.5 mm), and two ~0.5 g pieces of M-Cu cut to the diameter of the column were placed at 2.54 cm and 7.62 cm from the inlet of the column. Two control columns with no M-Cu were included in the setup. The column experiments were designed to simulate a total E. coli load equivalent to one year, assuming 10⁴ CFU/100 mL and 12 L of clean water per day for a family of four people. To achieve this, an E. coli solution at 1.5 × 10⁷ CFU/100 mL (on average) was pumped at a flow rate of approximately 2.45 mL/min for approximately 29 h. This flow rate was calculated to attain a contact time determined using the inactivation kinetics experimental data. To evaluate the potential remobilization of the E. coli already retained in the column and to evaluate the E. coli was inactivated and not just filtered, after approximately 29 h, sterile sodium chloride solution was pumped. The switch to sodium chloride solution was instant, and the pumping continued for approximately 29 h. Throughout the column experiment, influent and effluent samples were collected periodically to measure E. coli concentrations and copper ion concentrations. The experiment, including the remobilization study, was conducted in continuous flow conditions.
2.7. Statistical Analysis
All statistical analyses were conducted using SigmaPlot V14 software. A two-way ANOVA, followed by pairwise Tukey tests, was utilized to compare different groups (control, 0.25 g, 0.5 g, 1.0 g, and 2.0 g M-Cu) and factors (time and M-Cu mass). Similarly, a two-way ANOVA with pairwise Tukey tests was employed to compare columns with sand filters versus M-Cu sand filters.
3. Results
3.1. Copper Ion Release Kinetics
Figure 1 shows how copper ion concentrations vary with different M-Cu masses and exposure times. There were significant variations in the copper ion concentrations observed among different levels of M-Cu mass between 0.25 g and 2.0 g until 30 min (p < 0.001). On the other hand, in the range between 1.0 g and 2.0 g of M-Cu, the differences were less pronounced. Similarly, variations in exposure time significantly influenced copper ion concentrations (p = 0.002), though the differences between 60 min and 90 min were not statistically significant. Overall, higher masses of M-Cu and longer exposure times consistently led to increased copper ion concentrations. It is important to highlight that the copper ion concentration results were limited to 90 min, and it is not possible to anticipate the trend after those 90 min. For instance, Quezada et al., 2020, found that the maximum dissolution of copper ions occurred at about 50 h and experienced a decrease after 150 h [26]. In this study, after just 30 min of exposure, copper ion concentrations exceeded the maximum contaminant level (MCL) for drinking water of 1.3 mg/L (1300 µg/L) in all cases except when 0.25 g M-Cu was used. Although the released copper ions values are higher than MCL, those values are limited to batch conditions; these values were not observed under dynamic conditions (Section 3.4). These findings underscore the potential implications for water quality and caution while using 99.9% pure M-Cu in drinking water treatment systems.
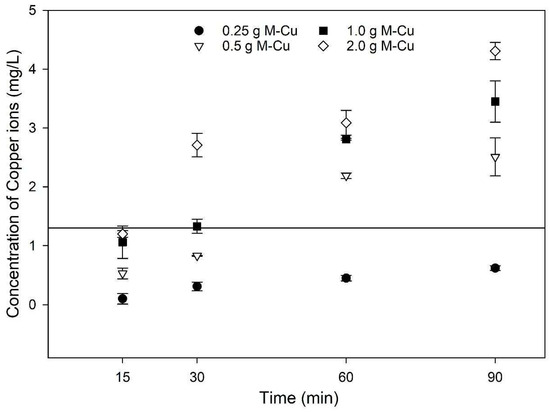
Figure 1.
Results of copper ion release kinetics for varying masses of mesh copper (M-Cu) in 1.3 mmol solution. Horizontal line at 1.3 mg/L of copper concentration represent the EPA MCL for drinking water.
3.2. E. coli Inactivation Kinetics
The results of inactivation kinetics (Figure 2) indicate that with 0.5 g, 1.0 g, and 2.0 g M-Cu, a 2-LRV was possible with a 30 min exposure. The LRV achieved using 0.25 g M-Cu was not significantly different from the control until a higher exposure time of 90 min (p < 0.05). Significantly higher LRVs, between 2 and 6, were observed for 0.5 g, 1.0 g, and 2.0 g M-Cu after 30 min of exposure (p < 0.05). For 0.5 g M-Cu, the LRV did not increase significantly after 60 min of exposure, suggesting a removal threshold or asymptotic behavior. However, 0.5 g M-Cu achieved values similar to 1.0 g M-Cu at 30 and 60 min, reaching LRVs of 2.5 and 3.5 at 30 and 60 min, respectively. In addition, it was observed that the disinfection capacity of 1.0 g and 2.0 g M-Cu increased significantly with increased exposure time (p < 0.05). Arora et al. tested the use of copper wires to disinfect water in storage containers with copper masses between 1.47 and 108 g, exposed to E. coli concentrations around 1.1 × 10⁷ CFU/mL [27]. Their findings similarly showed increased antimicrobial activity over time and with higher copper concentrations, achieving a 4 LRV after 4 h for masses greater than 15 g of copper [27]. This comparison supports our observations of copper’s effectiveness in microbial inactivation, highlighting the influence of both mass and exposure duration on disinfection efficiency.
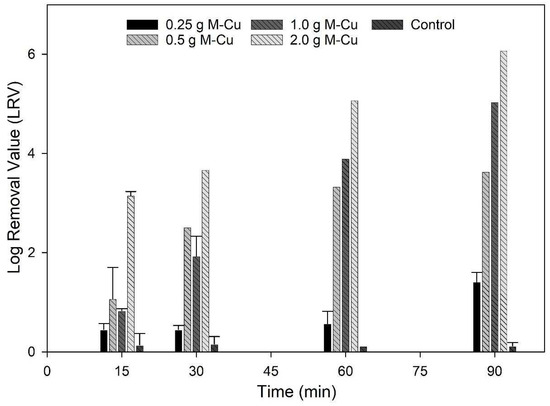
Figure 2.
Inactivation kinetic results. E. coli (104 CFU/100 mL) were exposed to 0.25, 0.5, 1 and 2 g M-CU for 15, 30, 60 and 90 min.
3.3. Chick–Watson Model
The Chick–Watson model (Equation (2)) was applied to the inactivation kinetics data to determine whether the contact time or the concentration of copper has a greater effect on E. coli inactivation. The coefficient of dilution n was calculated to be 0.91, a value lower than 1, indicating that the contact time between bacteria and M-Cu was more relevant than the mass of copper to achieve a 3 LRV. This conclusion is also supported by the results of the two-way ANOVA, which indicated that the effect of different levels of M-Cu depends on the time of exposure, and there is a statistically significant interaction between M-Cu and time (p < 0.001).
The hypothesized inactivation mechanisms of M-Cu support these findings. Based on the literature, it was initially hypothesized that Cu⁺ ions released from the M-Cu must diffuse through cell membranes and enter the organism’s metabolic pathway to inactivate the cell. However, a study by Mathews et al. (2013) suggested that the initial contact between bacteria and the copper surface damages the cell envelope, making cells more vulnerable to additional damage from copper ions [28]. In the case of batch testing, both copper ions and direct contact with M-Cu play significant roles in microbial inactivation.
A study by Grass et al. (2011) indicated that prolonged exposure to copper surfaces enhances bactericidal effects due to the sustained release and interaction of copper ions [15]. The Cu ion release kinetics data indicate that the release of Cu ions is time-dependent and increases significantly at 30 min (Figure 3), thus requiring time to reach the ion concentration necessary for inactivation.
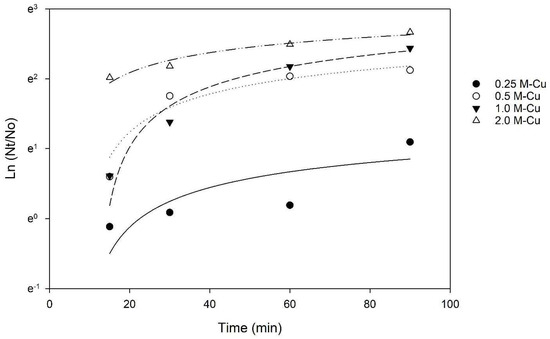
Figure 3.
Chick–Watson Model applied to inactivation kinetics data. R2 values of 0.62, 0.94, 0.97, and 0.96 for 0.25 g, 0.5 g, 1.0 g, and 2.0 g MCu, respectively.
Using the n and k values, for 1.0 g M-Cu, a contact time (t) of 42.3 min was calculated to achieve a 3 LRV. However, a lower contact time of 30 min was used for further experimentation due to the presence/addition of sand in the filters. In practice, the contact time required for a 3 LRV in a filter can be lowered due to the addition of other mechanisms, such as filtration. Considering this, a contact time/retention time of 30 min was chosen for further experimentation.
3.4. Batch Testing
Based on the results from ion release kinetics and inactivation kinetics, 1.0 g M-Cu was selected for further experimentation as it exhibited lower copper ion release and satisfactory LRVs than 2.0 g M-Cu. The data further underscore that 1.0 g M-Cu is sufficient to effectively inhibit pathogenic activity across a broad range of initial bacterial concentrations, from 102 to 106 CFU/100 mL.
The findings revealed a correlation between the initial concentrations of bacteria and the achieved LRVs. Specifically, higher initial concentrations of E. coli led to greater LRVs: an LRV of 2.03 ± 0.01 was observed for an initial concentration of 102 CFU/100 mL, while an LRV of 4.8 ± 0.11 was achieved for an initial concentration of 106 CFU/100 mL (Figure 4).
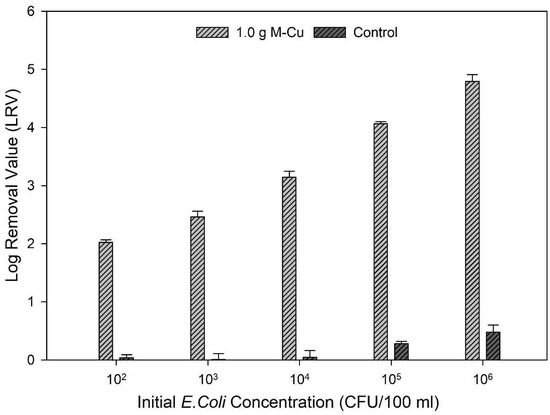
Figure 4.
Log removal values (LRVs) after 1.0 g M-Cu was exposed to five different concentrations of E. coli concentrations for 30 min.
This trend demonstrates that the effectiveness of M-Cu in inhibiting bacterial activity scales with higher initial bacterial concentrations. A similar trend was found by Dankovich and Smith, 2014; in that case, the antimicrobial properties of copper nanoparticles incorporated into paper for point-of-use water purification were studied [11].
The results suggest that the chosen M-Cu concentration optimally balances antimicrobial effectiveness with practical considerations like material cost and copper ion levels in treated water. Other studies had considered these parameters for the design of a copper metal structure for drinking water treatment [28,29].
3.5. Column Testing
The effectiveness of sand filters with and without copper mesh (1.0 g M-Cu per column) under dynamic conditions was evaluated using an average influent E. coli concentration of 1.5 × 10⁷ CFU/100 mL. Figure 5 displays the average E. coli concentrations in the effluent of the tested columns. The results demonstrated a clear trend indicating significantly higher antimicrobial activity in columns with 1.0 g M-Cu compared to those with sand alone (control). The sand columns (control) exhibited an average LRV of 0.6, whereas columns with 1.0 g M-Cu achieved an average LRV of 3.1 (>99.9%) over 1704 min of pumping E. coli solution (Figure 5).
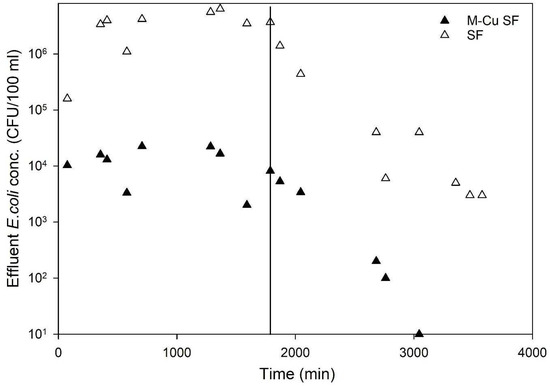
Figure 5.
Effluent E. coli concentration for the control columns (only sand-SF) and the copper sand columns (sand and 1.0 g mesh copper—M-Cu SF). Vertical line represents time switching from E. Coli experimental solution to pumping clean water with 1.3 mmol of sodium chloride solution. Data shown are average values for two columns for each condition.
Furthermore, during the remobilization phase using a clean 1.3 mmol sodium chloride solution (no added E. coli) over 1700 min, the control (sand column) effluent showed an average E. coli concentration of 7.1 × 10⁵ CFU/100 mL, whereas it was significantly lower at 2.1 × 10³ CFU/100 mL for the M-Cu sand columns (data after the vertical solid line in Figure 5). The concentration of E. coli in the effluent of M-Cu sand columns decreased rapidly and consistently approached zero CFU/100 mL after approximately 3000 min, indicating effective bacterial inactivation, likely due to the presence of M-Cu and released ions (Figure 5).
The initial detection of high E. coli levels (103 CFU/100 mL)_ in the effluent immediately following the transition to sterile sodium chloride solution (the first two data points after the line in Figure 5) is likely from residual bacteria within the system tubing and the substantial initial bacterial load (1 × 10⁷ CFU/100 mL). The subsequent data points likely reflect the presence of E. coli that was physically entrapped within the sand media but not effectively inactivated by the copper, which was then released during the flushing process with the sodium chloride solution. During the experiment, five samples were collected and tested for copper concentration using Inductively Coupled Plasma Mass Spectrometry (ICP-MS), as described in the Materials and Methods section. The copper concentrations in all samples were found to be below 0.2 mg/L, significantly lower than the EPA’s MCL of 1.3 mg/L. This finding suggests that under dynamic flow-through conditions, the amount of copper ions released is much lower compared to batch conditions. This reduced ion release likely explains the lower LRVs observed in the column experiments relative to the batch tests. These results indicate that while M-Cu enhances disinfection in dynamic systems, the ion release remains within safe limits, thereby maintaining water quality standards and ensuring safety for drinking water applications. Other research studies using metal copper for disinfection and water treatment has highlighted similar concerns with copper ions [26,28,29].
When a mass balance of E. coli was performed, the M-Cu sand columns exhibited a total E. coli mass removal of 99.91%, compared to 72.9% for the control columns. These findings highlight the substantial antimicrobial benefits of incorporating M-Cu into sand filters, significantly enhancing their effectiveness in removing E. coli from water under dynamic conditions.
These findings carry significant implications for water treatment strategies using a point of use system (POU), particularly in contexts where microbial contamination poses health risks. The study’s demonstration of markedly enhanced antimicrobial activity in sand filters augmented with copper mesh (1.0 g M-Cu per column) underscores a promising approach for improving water purification efficacy. Achieving an average LRV of 3.1 (>99.9%) for E. coli indicates the robustness of copper-enhanced filtration systems in disinfecting water. Moreover, the rapid reduction in E. coli concentrations to near-zero levels in the effluent underscores the reliability of these systems over prolonged operational periods, with a total E. coli mass removal of 99.91%, significantly higher than the 72.9% of the control sand columns.
3.6. Applications and Limitations
The study suggests that integrating M-Cu could offer a practical and efficient solution for mitigating microbial contamination in water supplies. These findings advocate for the adoption and further exploration of copper-based technologies in POU water treatment practices to enhance public health protection against waterborne pathogens. Future studies could explore scaling up these findings to real-world applications and assessing long-term durability and performance under diverse environmental conditions.
Further, in the context of incorporating M-Cu in a bio-sand filter (BSF), it is crucial to consider the dual roles of M-Cu in microbial inactivation and its potential interference with biofilm integrity. While copper’s antimicrobial properties are advantageous for pathogen control, they could inhibit beneficial biofilms that contribute to long-term filtration performance. To mitigate this, integrating adsorptive materials such as activated carbon or biochar within the filter setup could be effective. These materials can absorb excess copper ions, potentially reducing their inhibitory impact on biofilm development, thus preserving the crucial microbial processes essential for biofilm efficacy. Incorporating such biofilm-supportive materials alongside M-Cu may enable a harmonious balance between microbial inactivation and the maintenance of biofilm functionality, thereby enhancing both the mechanical and biological aspects of filtration.
4. Conclusions
The study demonstrated that integrating M-Cu into sand filters significantly enhances POU water treatment systems. Notably, under batch experimental conditions, with just 1.0 g of M-Cu, there was a substantial reduction in E. coli levels, confirming its effectiveness across varied bacterial concentrations. In dynamic conditions, sand filters with 1.0 g of M-Cu achieved a LRV of 3.1, markedly better than control filters, which only reached a LRV of 0.6. Importantly, the copper levels in the effluent remained below safety thresholds, indicating that the antimicrobial benefits do not compromise water safety. These findings suggest that copper-enhanced sand filters can significantly improve water purity, offering a practical solution for reducing microbial contamination in water supplies. This promotes the further adoption of copper-based technologies in POU systems to enhance public health protection against waterborne pathogens, warranting additional research on their application and long-term effectiveness.
Author Contributions
Conceptualization, V.K.K.; Methodology, V.K.K. and M.T.; Formal analysis, V.K.K., M.T. and N.M.A.; Investigation, M.T. and V.K.K.; Writing—original draft, V.K.K.; Writing—review & editing, N.M.A.; Supervision, V.K.K.; Project administration, V.K.K. All authors have read and agreed to the published version of the manuscript.
Funding
This research received no external funding.
Data Availability Statement
The relevant data can be found in this article.
Conflicts of Interest
The authors declare no conflict of interest.
References
- Charles, R.C.; Kelly, M.; Tam, J.M.; Akter, A.; Hossain, M.; Islam, K.; Biswas, R.; Kamruzzaman, M.; Chowdhury, F.; Khan, A.I.; et al. Humans Surviving Cholera Develop Antibodies against Vibrio Cholerae O-Specific Polysaccharide That Inhibit Pathogen Motility. mBio 2020, 11, e02847-20. [Google Scholar] [CrossRef] [PubMed]
- WHO. WHO Factsheet; WHO: Geneva, Switzerland, 2020. [Google Scholar]
- UNICEF. UNICEF Progress on Household Drinking Water, Sanitation and Hygiene, 2000–2020; UNICEF: New York, NY, USA, 2021. [Google Scholar]
- United Nations. UN SDG Report; United Nations: San Francisco, CA, USA, 2022. [Google Scholar]
- Ilcheva, I.; Yordanova, A.; Nikolova, K. Identification and Mitigation Vulnerability of Water Supply and Environment under Climate Change. In Proceedings of the 20th International Multidisciplinary Scientific, Albena, Bulgaria, 18–20 August 2020; Volume 20. [Google Scholar]
- Stauber, C.E.; Elliott, M.A.; Koksal, F.; Ortiz, G.M.; DiGiano, F.A.; Sobsey, M.D. Characterisation of the Biosand Filter for E. coli Reductions from Household Drinking Water under Controlled Laboratory and Field Use Conditions. Water Sci. Technol. 2006, 54, 1–7. [Google Scholar] [CrossRef] [PubMed]
- Stauber, C.E.; Ortiz, G.M.; Loomis, D.P.; Sobsey, M.D. A Randomized Controlled Trial of the Concrete Biosand Filter and Its Impact on Diarrheal Disease in Bonao, Dominican Republic. Am. J. Trop. Med. Hyg. 2009, 80, 286–293. [Google Scholar] [CrossRef]
- Elliott, M.A.; Stauber, C.E.; Koksal, F.; DiGiano, F.A.; Sobsey, M.D. Reductions of E. coli, Echovirus Type 12 and Bacteriophages in an Intermittently Operated Household-Scale Slow Sand Filter. Water Res. 2008, 42, 2662–2670. [Google Scholar] [CrossRef] [PubMed]
- Duran Romero, D.A.; de Almeida Silva, M.C.; Chaúque, B.J.M.; Benetti, A.D. Biosand Filter as a Point-of-Use Water Treatment Technology: Influence of Turbidity on Microorganism Removal Efficiency. Water 2020, 12, 2302. [Google Scholar] [CrossRef]
- Bitton, G. Microbiology of Drinking Water: Production and Distribution; Wiley: Hoboken, NJ, USA, 2014; ISBN 978-1-118-74392-8. [Google Scholar]
- Dankovich, T.A.; Smith, J.A. Incorporation of Copper Nanoparticles into Paper for Point-of-Use Water Purification. Water Res. 2014, 63, 245–251. [Google Scholar] [CrossRef] [PubMed]
- Kallman, E.N.; Oyanedel-Craver, V.A.; Smith, J.A. Ceramic Filters Impregnated with Silver Nanoparticles for Point-of-Use Water Treatment in Rural Guatemala. J. Environ. Eng. 2011, 137, 407–415. [Google Scholar] [CrossRef]
- Moosa, A.A.; Muhsen, M.F. Ceramic Filters Impregnated with Silver Nanoparticles for Household Drinking Water Treatment. Am. J. Mater. Sci. 2017, 7, 232–239. [Google Scholar]
- Zhang, H.; Smith, J.A.; Oyanedel-Craver, V. The Effect of Natural Water Conditions on the Anti-Bacterial Performance and Stability of Silver Nanoparticles Capped with Different Polymers. Water Res. 2012, 46, 691–699. [Google Scholar] [CrossRef]
- Grass, G.; Rensing, C.; Solioz, M. Metallic Copper as an Antimicrobial Surface. Appl. Environ. Microbiol. 2011, 77, 1541–1547. [Google Scholar] [CrossRef] [PubMed]
- Warnes, S.L.; Keevil, C.W. Inactivation of Norovirus on Dry Copper Alloy Surfaces. PLoS ONE 2013, 8, e75017. [Google Scholar] [CrossRef] [PubMed]
- Singh, R.; Edokpayi, J.N.; Odiyo, J.O.; Smith, J.A. E. coli Inactivation by Metals and Effects of Changes in Water Chemistry. J. Environ. Eng. 2019, 145, 04018136. [Google Scholar] [CrossRef]
- Armstrong, A.M.; Sobsey, M.D.; Casanova, L.M. Disinfection of Escherichia Coli and Pseudomonas Aeruginosa by Copper in Water. J. Water Health 2016, 14, 424–432. [Google Scholar] [CrossRef] [PubMed]
- Sicairos-Ruelas, E.E.; Gerba, C.P.; Bright, K.R. Efficacy of Copper and Silver as Residual Disinfectants in Drinking Water. J. Environ. Sci. Health Part A 2019, 54, 146–155. [Google Scholar] [CrossRef] [PubMed]
- Rossainz-Castro, L.G.; De-La-Rosa-Gómez, I.; Olguín, M.T.; Alcántara-Díaz, D. Comparison between Silver- and Copper-Modified Zeolite-Rich Tuffs as Microbicide Agents for Escherichia coli and Candida albicans. J. Environ. Manag. 2016, 183, 763–770. [Google Scholar] [CrossRef] [PubMed]
- Montero, D.A.; Arellano, C.; Pardo, M.; Vera, R.; Gálvez, R.; Cifuentes, M.; Berasain, M.A.; Gómez, M.; Ramírez, C.; Vidal, R.M. Antimicrobial Properties of a Novel Copper-Based Composite Coating with Potential for Use in Healthcare Facilities. Antimicrob. Resist. Infect. Control 2019, 8, 3. [Google Scholar] [CrossRef] [PubMed]
- Kim, J.J.; Ha, S.; Kim, L.; Kato, Y.; Wang, Y.; Okutani, C.; Wang, H.; Wang, C.; Fukuda, K.; Lee, S.; et al. Antimicrobial Second Skin Using Copper Nanomesh. Proc. Natl. Acad. Sci. USA 2022, 119, e2200830119. [Google Scholar] [CrossRef] [PubMed]
- Gopalakrishnana, K.; Rameshb, C.; Ragunathanb, V.; Thamilselvana, M. Antibacterial Activity of Cu 2 O Nanoparticles on E. Coli Synthesized From Tridax Procumbens Leaf Extract And Surface Coating With Polyaniline. Dig. J. Nanomater. Biostructures 2012, 7, 833–839. [Google Scholar]
- Schifman, L.A.; Kasaraneni, V.K.; Sullivan, R.K.; Oyanedel-Craver, V.; Boving, T.B. New Antimicrobially Amended Media for Improved Nonpoint Source Bacterial Pollution Treatment. Environ. Sci. Technol. 2015, 49, 14383–14391. [Google Scholar] [CrossRef] [PubMed]
- Tchobanoglous, G.; Burton, F.L.; Stensel, H.D.; Metcalf & Eddy, Inc.; Burton, F. Wastewater Engineering: Treatment and Reuse; McGraw-Hill Higher Education: New York, NY, USA, 2003; ISBN 978-0-07-112250-4. [Google Scholar]
- Quezada, R.; Quintero, Y.; Salgado, J.C.; Estay, H.; García, A. Understanding the Phenomenon of Copper Ions Release from Copper-Modified TFC Membranes: A Mathematical and Experimental Methodology Using Shrinking Core Model. Nanomaterials 2020, 10, 1130. [Google Scholar] [CrossRef] [PubMed]
- Arora, P.; Tewary, S.; Krishnamurthi, S.; Kumari, N. Development of a Low-Cost Copper Device for Inactivation of Microorganism in Drinking Water for Human Consumption. J. Water Process Eng. 2022, 50, 103302. [Google Scholar] [CrossRef]
- Mathews, S.; Hans, M.; Mücklich, F.; Solioz, M. Contact Killing of Bacteria on Copper Is Suppressed If Bacterial-Metal Contact Is Prevented and Is Induced on Iron by Copper Ions. Appl. Environ. Microbiol. 2013, 79, 2605–2611. [Google Scholar] [CrossRef] [PubMed]
- Vincent, M.; Hartemann, P.; Engels-Deutsch, M. Antimicrobial Applications of Copper. Int. J. Hyg. Environ. Health 2016, 219, 585–591. [Google Scholar] [CrossRef] [PubMed]


Disclaimer/Publisher’s Note: The statements, opinions and data contained in all publications are solely those of the individual author(s) and contributor(s) and not of MDPI and/or the editor(s). MDPI and/or the editor(s) disclaim responsibility for any injury to people or property resulting from any ideas, methods, instructions or products referred to in the content. |
© 2024 by the authors. Licensee MDPI, Basel, Switzerland. This article is an open access article distributed under the terms and conditions of the Creative Commons Attribution (CC BY) license (https://creativecommons.org/licenses/by/4.0/).