Abstract
Ceramsites are extensively employed as substrates for adsorbents in studies focused on phosphorus adsorption, leaving ceramsites crafted from diatomite less explored. Diatomite-based ceramsite, with its distinct porous architecture and surface silanol functionalities, is adept at supporting a variety of metal oxides, presenting a distinct advantage over other ceramsite variants. In light of this, the present study embarked on producing diatomite-based ceramsite using diatomite as the foundational material, subsequently enhancing it through the incorporation of Fe, thus yielding an Fe-modified diatomite-based ceramsite. Through adsorption testing, the modified ceramsite demonstrated a significantly improved adsorption capacity of 4.06 mg P/g, marking a substantial enhancement from the initial capacity of 0.9 mg P/g. The process of phosphorus adsorption exhibited a strong alignment with the Langmuir isotherm model and the pseudo-second-order kinetic model. In-depth analyses employing XRD, FTIR, zeta potential, and XPS techniques have revealed that the principal mechanisms driving the adsorption process are centered on interactions involving electrostatic forces, the formation of chemical precipitates, and the exchange of ligands. This investigation not only opens new avenues for the application of diatomite-based ceramsite but also lays down a theoretical foundation for its modification, thereby enriching the spectrum of its utility.
1. Introduction
Phosphorus (P) is an essential component of life, cycling through ecosystems and significantly impacting both flora and fauna [1]. As society progresses, the utilization of phosphorus in agricultural, industrial, and everyday activities has escalated, resulting in elevated levels of phosphorus in the effluents discharged from industrial operations. The surplus of phosphorus contributes to eutrophication and the proliferation of algal blooms in aquatic environments [2], disrupting natural ecosystems [3] and potentially endangering human health [4] through the production of harmful toxins. In response, rigorous international standards have been established to regulate phosphorus concentrations in wastewater discharges [5], highlighting the critical need for cost-effective and efficient strategies for phosphorus remediation.
The predominant techniques for phosphorus mitigation encompass biological, chemical, and physical methodologies [6]. Although the biological approach is efficacious, it necessitates stringent control conditions and its reliability is often questionable [7]. Conversely, the chemical method entails extensive usage of chemicals, raising concerns about the potential for secondary contamination [8]. In contrast, adsorption emerges as a superior alternative, acclaimed for its cost-efficiency, effectiveness, negligible secondary pollutants [9], stable physicochemical attributes, and recyclability [9]. These merits distinctly position adsorption as a superior and promising avenue for exploration compared to conventional methods.
For adsorbents known for their proficiency in phosphate removal, such as activated carbon, metal oxides, and polymers in powdered form, these materials are typically modified onto substrates that allow for easier separation from aqueous solutions after adsorption [10]. Porous ceramsite, with its significant specific surface area, structural durability, and regenerative capability, is frequently chosen as a base for such adsorptive materials [11]. Recent efforts in ceramsite modification have mainly utilized resources like iron [12] and copper tailings [13], fly ash [14], and sludge [15]. For example, Yang et al. enhanced commercial ceramsite with zinc and zirconium, creating an adsorbent rich in iron oxide, a composition markedly divergent from that of diatomite-derived ceramsite [16]. Similarly, Li et al. used iron tailings and fly ash to create ceramsite [17], modified for improved phosphate adsorption. Despite extensive research, there is a notable lack of studies specifically focusing on modifying diatomite-based ceramsite for phosphate removal.
Diatomite, primarily composed of amorphous silica, derives from the silicate structures of diatoms, showcasing a vast range of porosity from the micro- to the nanoscale [18]. The predominance of silanol groups on its surface makes it an ideal candidate for metal oxide integration [19], enhancing its utility in adsorption processes. The synergy between silica and iron oxide in forming composite materials through mechanisms like covalent bonds, hydroxyl protonation, and hydrogen bonding is well-documented [20]. In this realm, Zhao et al. work on impregnating diatomite with Fe3O4 to craft an adept adsorbent [21], and Wang et al. endeavor to coat diatomite with magnetic zero-valent iron for phosphorus removal [22], underscore diatomite’s adaptability as an adsorbent substrate. These research outcomes also affirm the feasibility of modifying diatomite-based ceramsite, underscoring the potential for advancements in this area.
This research endeavors to: (1) Develop diatomite-based ceramsite optimized for metal oxide loading, followed by the application of a specific iron oxide to its surface, thereby crafting an efficient phosphate-absorbing Fe-modified diatomite-based ceramsite. (2) Investigate and ascertain the ideal material ratios and process conditions for both the ceramsite’s synthesis and its subsequent iron oxide modification, aiming to identify the most efficacious production parameters. (3) Assess the ceramsite’s adsorption capabilities through rigorous testing, employing both theoretical model fitting and detailed instrumental analysis to unravel the underlying mechanisms governing phosphate adsorption. This investigation advances the exploration of phosphorus adsorbents and lays a theoretical foundation for further refinement in the modification of diatomite-based ceramsite, enhancing its efficacy and application potential.
2. Materials and Methods
2.1. Materials
The diatomite was provided by Sichuan Honghui Technology Co, Ltd. in China. Commercial calcium carbonate (CaCO3), sodium bicarbonate (NaHCO3), activated carbon, ethylene glycol (EG), ferrous sulfate heptahydrate (FeSO4⋅7H2O), potassium dihydrogen phosphate (KH2PO4), potassium hydroxide (KOH), and sodium hydroxide (NaOH) were sourced from Shanghai Aladdin Biochemical Technology Co., Ltd. All utilized chemical reagents were of analytical grade, with deionized water employed in the preparation of every solution.
2.2. Preparation of Ceramsite
Diatomite was mixed with 10% calcium carbonate (CaCO3), 10% sodium bicarbonate (NaHCO3), and 5–20% activated carbon to achieve a uniform blend. This mixture was then processed in a disc pelletizer, where the rotational speed and tilt angle were precisely controlled. During the pelletizing process, deionized water was evenly sprayed to facilitate the formation of spherical granules, resulting in particles with diameters ranging from 5–10 mm. Subsequently, the granules were oven-dried at 105 °C to reach a stable mass state. The dried granules were then subjected to a two-stage sintering process in a muffle furnace to form ceramsite [23]. The initial pre-sintering stage, designed to eliminate free water without adversely affecting the porosity, involved elevating the temperature of the granules to 400 °C at a pace of 15 °C/min, followed by sustaining this temperature for a duration of 20 min. Following pre-sintering, the temperature was increased to the target range of 1050–1200 °C and maintained for 15 min to complete the sintering process. After cooling, the resulting product was diatomite-based ceramsite, hereafter referred to as DC, which was then ready for further characterization and modification.
2.3. Modification of Ceramsite
FeSO4⋅7H2O and DC were precisely dissolved in ethylene glycol (EG) following a specific ratio, Fe/DC (mass ratio of FeSO4⋅7H2O to DC) ranging from 0.25:1 to 1:1. The ceramsite was subsequently introduced to the mixture and agitated for 3 h under an oxygen 7-free environment. Following this, the blend was subjected to a hydrothermal treatment at 200 °C for 12 h in an enclosed autoclave. Upon cooling, the ceramsite was subjected to filtration, followed by thorough rinsing with deionized water and ethanol to remove any residual reactants. The final product, after drying, resulted in Fe-modified diatomite-based ceramsite, designated as Fe-DC. Supplementary Figure S1 depicts the comprehensive fabrication procedure for Fe-DC.
2.4. Characterization
Material crystal structures were probed via powder X-ray Diffraction scans (XRD, Ultima IV, Rigaku, Japan). The Brunauer–Emmett–Teller (BET) technique, through nitrogen adsorption–desorption isotherms (specific surface area and pore size analyzer, SAP-2460, Micromeritics, GA, USA), was employed for evaluating surface areas and porosity. Analysis of surface functional groups was conducted with a Nicolet IS50 Fourier Transform Infrared Spectrometer (FTIR, Spectrum Two, PerkinElmer, MA, USA). X-ray Photoelectron Spectroscopy (XPS, Escalab250Xi, Thermo Fisher Scientific, MA, USA) was employed to ascertain electron binding energies and oxidation states. An ion chromatograph (CICD100, Shine, Janesville, WI, USA) was used to measure the phosphate ion concentrations in the solution.
2.5. Adsorption Experiments
A series of adsorption experiments were carried out to evaluate the phosphorus adsorption capacity of Fe-modified ceramsite. The phosphorus adsorption procedure is detailed as follows: Phosphate standard solutions of varying concentrations (0–125 mg P/L) were prepared in 100 mL volumes, with the pH adjusted to 7. Subsequently, 2 g of Fe-DC were introduced into each solution. The mixtures were agitated at 150 rpm and maintained at a temperature of 25 °C for one hour, with samples taken at predetermined time points. The solutions were filtered through a syringe filter (0.22 µm, PES membrane) to remove particulates. Phosphate concentrations in the filtrates were quantified using an ion chromatograph with KOH as the eluent. The Fe-DC samples post-phosphorus adsorption were designated as Fe-DC-P.
The formula used to calculate the equilibrium adsorption capacity for phosphorus is presented as follows:
Here, qe represents the equilibrium adsorption capacity of Fe-DC (mg/g), V represents the volume of solution utilized (L), C0 is the initial concentration of phosphate in the solution (mg/L), Ce denotes the concentration of phosphate at equilibrium post-adsorption (mg/L), and W refers to the weight of the Fe-DC adsorbent employed (g).
To elucidate the adsorption mechanisms of the ceramsite, several adsorption kinetics models were employed [24], including the pseudo-first-order, pseudo-second-order, Elovich kinetic model, Richie kinetics model, intraparticle diffusion, and Bangham’s diffusion models, as shown in Equations (2)–(7):
Here, qe and qt represent the adsorption capacity determined from the fit and the adsorption capacity at time t (mg P/g), respectively. k1 (g/mg min) is the rate constant for the pseudo-first-order kinetics, while K2 (g/mg·min) is the rate constant for the pseudo-second-order kinetics. α (mg/(g⋅min)) denotes the adsorption rate, β (g/mg) represents the desorption rate, while the intraparticle diffusion model’s rate constant is indicated by Kρ (mg/(g·min0.5)). The constant for the adsorption rate is represented by Kb, and m stands as a constant value.
The Langmuir (8), Freundlich (10), and Sips models (11) [25] were employed to investigate the isothermal adsorption of ceramsite (Equations (8)–(11)):
In this context, qm (mg/g) signifies the maximal capacity for monolayer adsorption and KL (L/mg) refers to the Langmuir constant. The separation factor RL serves as a critical indicator, assessing the feasibility of adsorption processes. An RL value within the range of 0 to 1 signifies favorable adsorption performance of the adsorbent. KF ((mg/g)/(mg/L)n) is identified as the Freundlich adsorption constant. n represents the adsorption intensity constant. It is commonly believed that a smaller 1/n value indicates better adsorption performance of the material. KS (L/mg) stands for the Sips constant.
Utilizing data derived from adsorption isotherm experiments, thermodynamic parameters were determined to evaluate the adsorption efficacy of Fe-DC. A quantity of 2 g of Fe-DC was introduced into 100 mL of a solution containing 100 mg P/L with the pH adjusted to 7, and the mixture was then subjected to agitation at 150 rpm for 45 min. To facilitate thermodynamic analysis, temperatures were measured in Celsius during the experiments but converted to Kelvin in the analysis, spanning from 298 K through 328 K in increments of 10 K.
Thermodynamic Equations (12)–(14) were employed for the thermodynamic analysis of the adsorption process.
Here, ΔH0 (KJ/mol) signifies the change in enthalpy, ΔG0 (KJ/mol) corresponds to the Gibbs free energy, T (K) refers to the temperature at which experiments were conducted, ΔS0 (KJ/mol/K) indicates the entropy, KC is the calculated distribution coefficient, and R, valued at 8.314 J/mol/K, is identified as the universal gas constant.
3. Results and Discussion
3.1. Characterization of Diatomite-Based Ceramsite
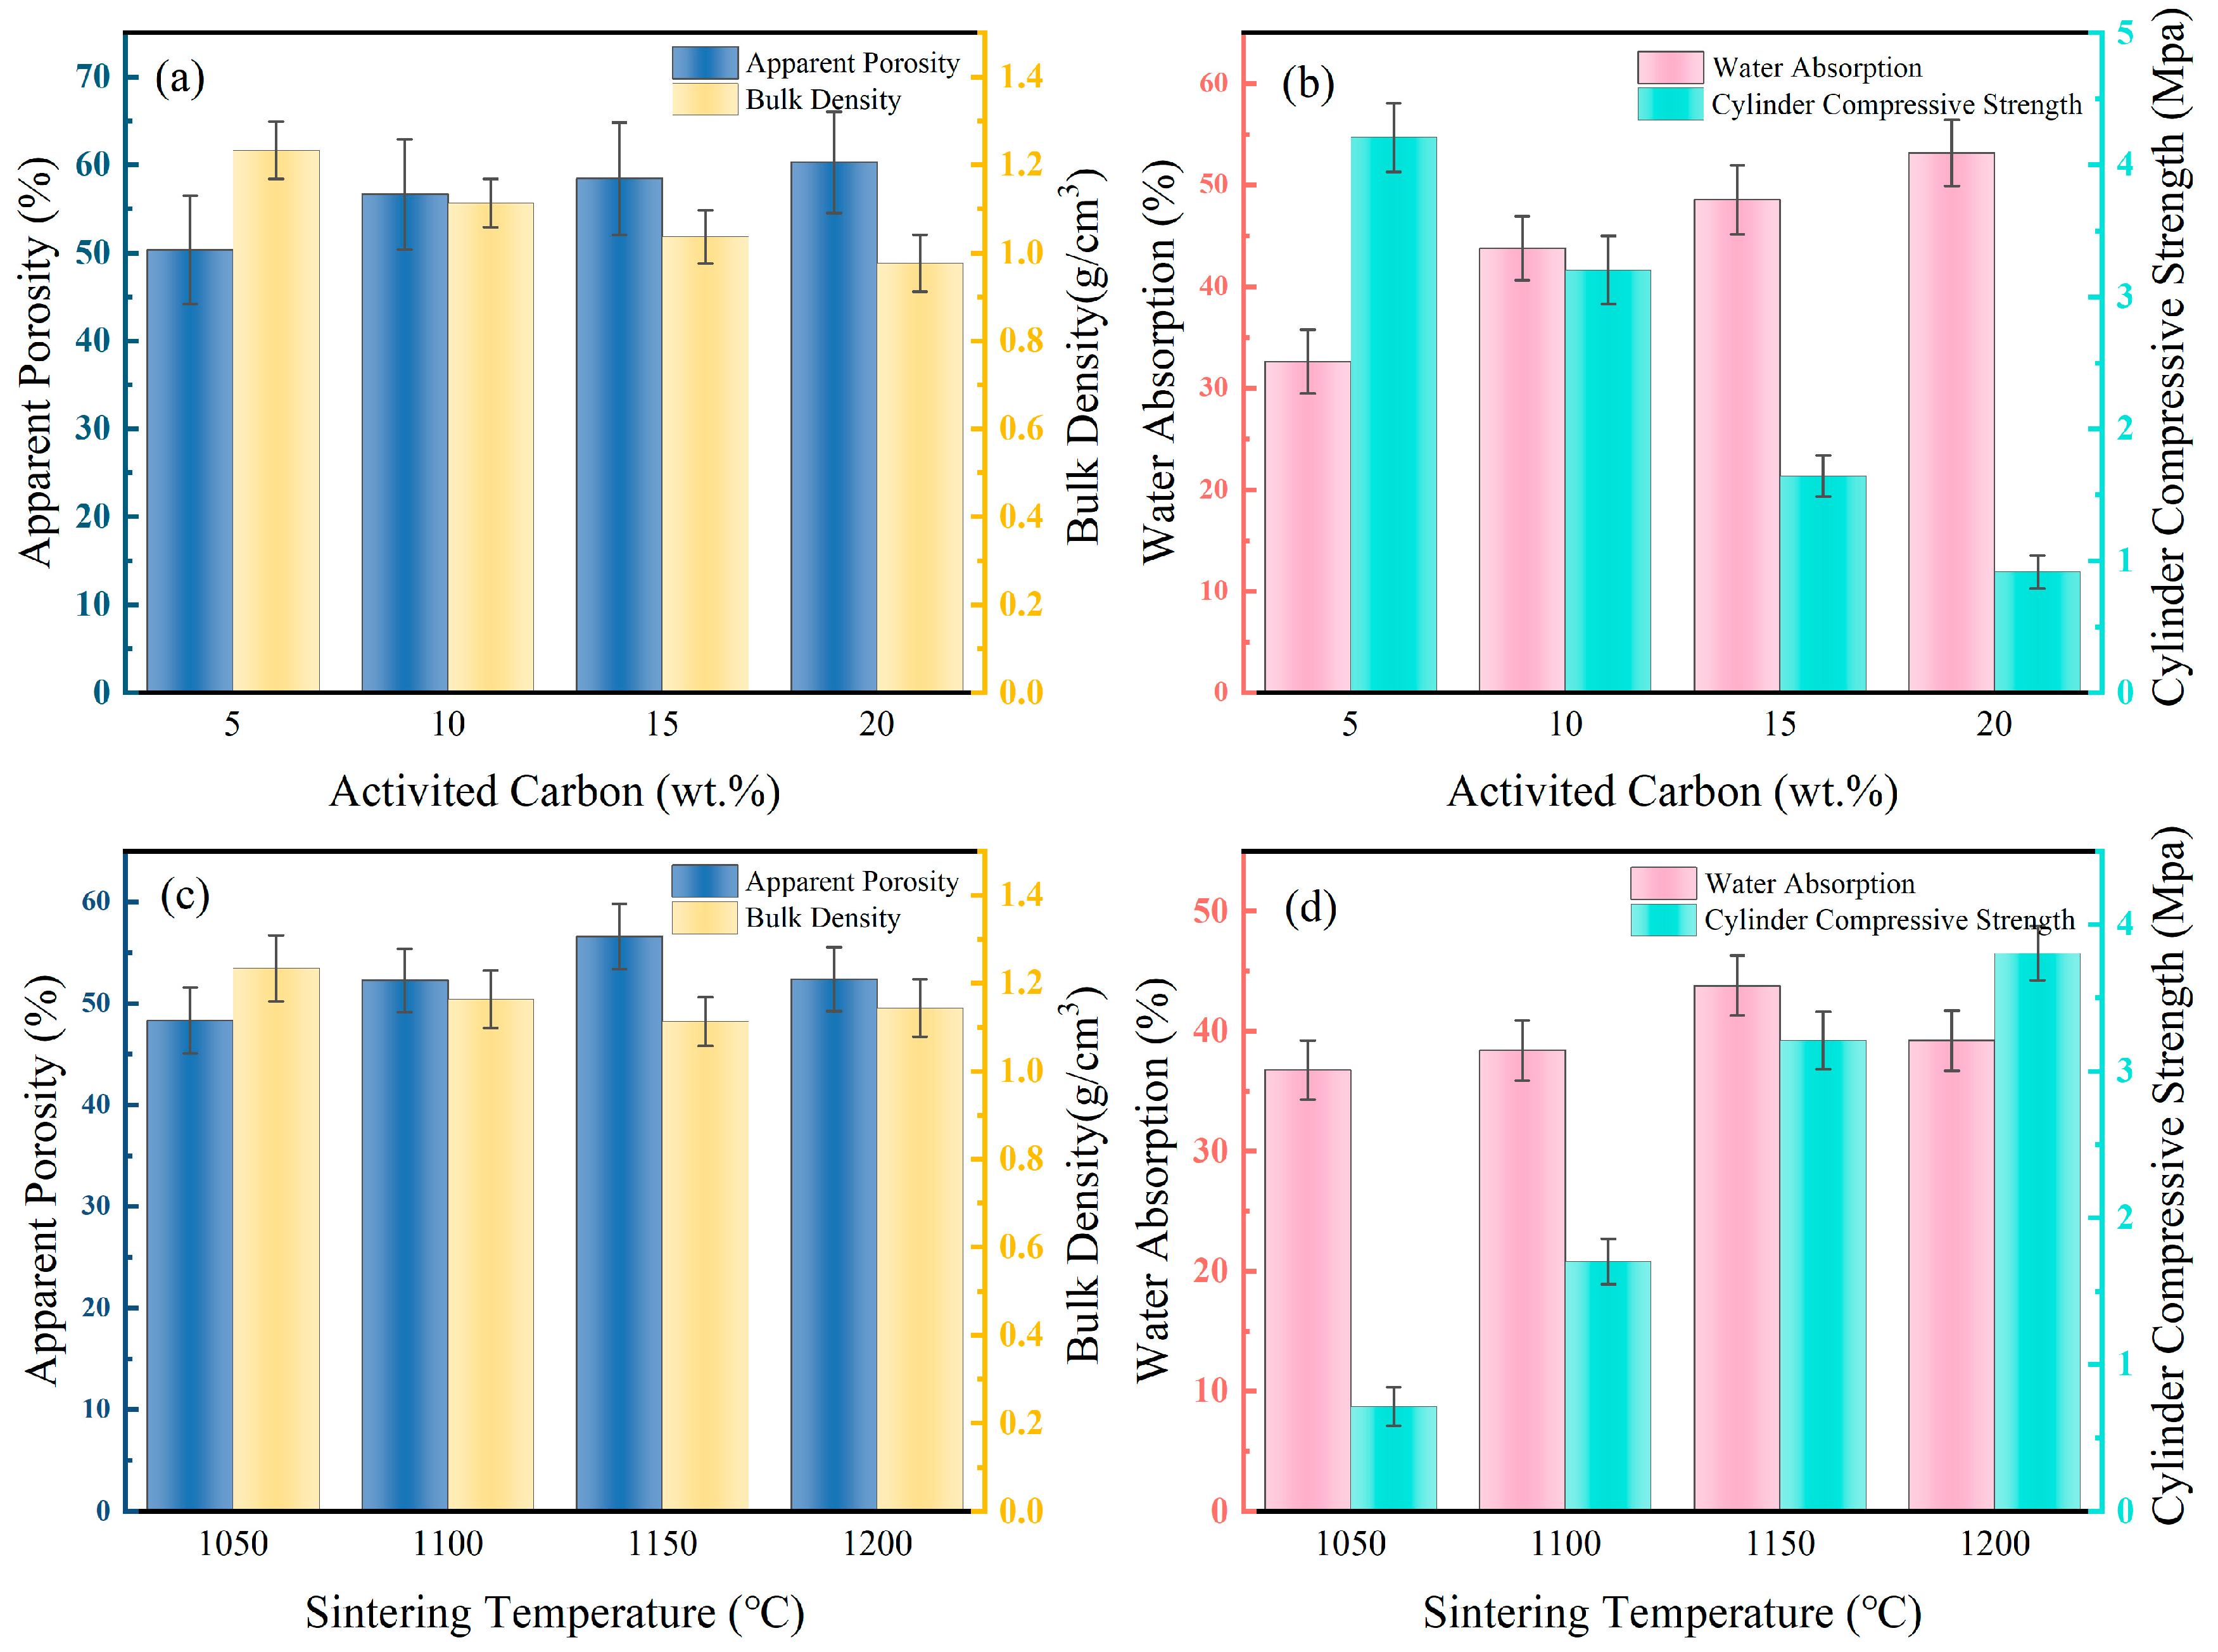
To enhance the performance of DC and improve the loading efficiency of Fe, the effects of the pore-forming agent activated carbon content and sintering temperature on DC are investigated. The optimal conditions for DC preparation are sought based on apparent porosity, bulk density, water absorption rate, and cylindrical compressive strength. Due to the decomposition of activated carbon at high temperatures, forming a large number of micropores, it can be used as a pore-forming agent. As shown in Figure 1a, with the increase in activated carbon content from 5% to 20%, the apparent porosity of DC increases from 50.3% to 60.2%, and the bulk density decreases from 1.23 g/cm3 to 0.98 g/cm3. This is attributed to the increased activated carbon content leading to the formation of more pore structures inside, thereby reducing its density. The increase in porosity provides channels for the diffusion of solutions, as illustrated in Figure 1b. The one-hour water absorption rate of DC increases from 32.6% to 53.2%, and the cylindrical compressive strength decreases from 4.2 MPa to 0.9 MPa. As the porosity increased, DC gained a larger specific surface area, but its structural strength decreased simultaneously. To balance the structural strength and porous structure of DC, the addition of activated carbon is determined to be 10%.
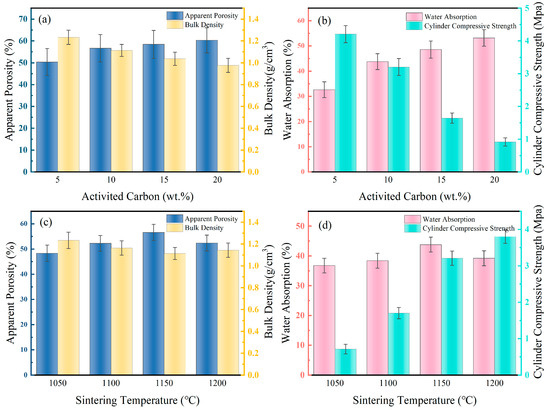
Figure 1.
Effect of activated carbon content (a) and sintering temperature (c) on the apparent porosity and bulk density of DC.the effect of activated carbon content (b) and sintering temperature (d) on the water absorption and compressive strength of DC. Effect of activated carbon and sintering temperature on the performance of ceramsite.
The impact of sintering temperature on DC performance is depicted in Figure 1c,d. With the escalation of DC’s sintering temperature from 1050 °C to 1200 °C, its apparent porosity first rose and then fell, peaking at 1150 °C with a maximum value of 56.6%, while the change in bulk density is not significant, slightly higher at 1150 °C, at 1.11 g/cm3. This is due to the pores within DC enlarging with rising temperatures, and as the temperature continues to increase, more of the DC transforms into a flow phase, filling the pores and causing a reduction in porosity. Consequently, the one-hour water absorption rate of DC also follows an increasing and then decreasing trend, reaching a peak at 1150 °C of 43.8%. As more of the DC transforms into a flow phase and then solidifies, its structural strength increases, with the cylindrical compressive strength rising from 0.7 MPa at 1050 °C to 3.8 MPa at 1200 °C. To ensure that DC has more contact with the solution during modification while maintaining adequate structural strength, 1150 °C is selected as the sintering temperature.
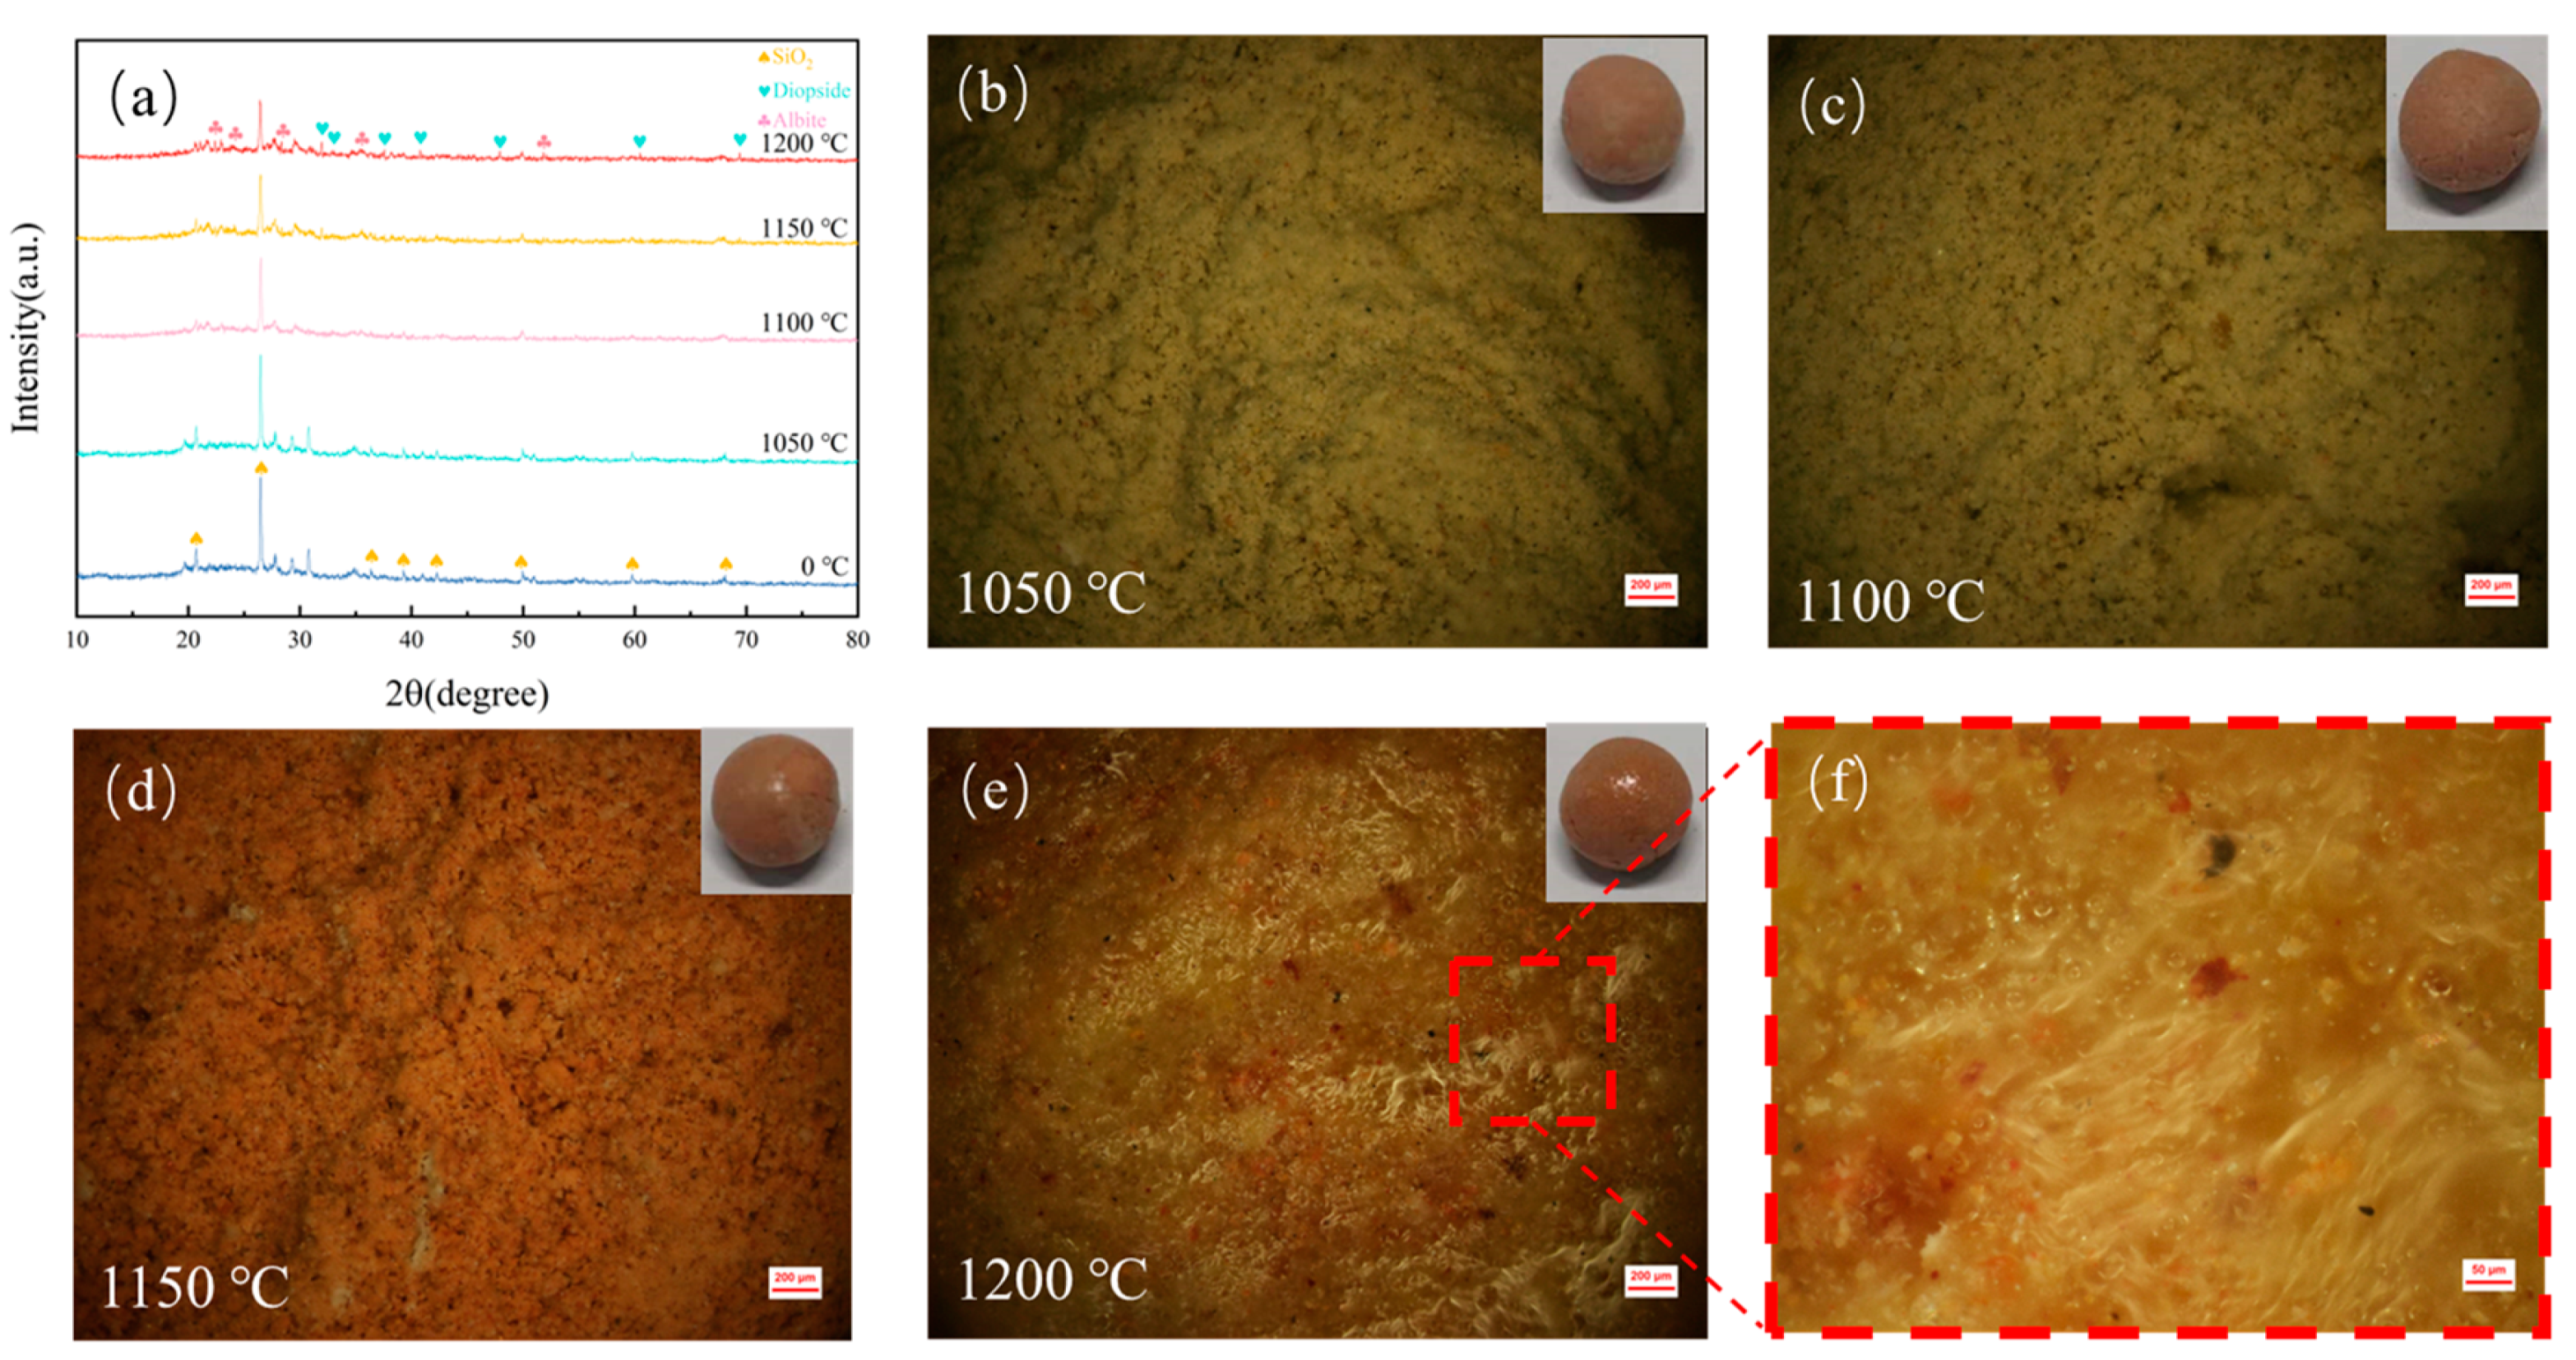
The sintering process of DC involves the bonding, rearrangement, and mass transfer of tiny diatomite particles, culminating in densification, expansion, and vitrification [26]. The reactive SiO2 in diatomite exhibits strong adhesiveness. With increasing sintering temperatures, bonds form between solid particles within the ceramsite, causing minor plastic deformation upon contact. This deformation leads to more particle contact and rearrangement, enhancing the structural strength of DC. Additionally, alkaline metal oxides and their salts in the raw materials gradually form a liquid phase, hindering gas diffusion and leaving numerous pores within the ceramsite. As temperatures continue to rise, more liquid-phase material fills the gaps in DC, forming a glass phase and gradually increasing the cylindrical compressive strength of DC. As illustrated in Figure 2, with the temperature increase from 1050 °C to 1150 °C, metal oxides like CaO and MgO in DC react with SiO2 and Al2O3 to form new phases, further enhancing the strength of DC. However, as the temperature further rises to 1200 °C, the increase in liquid-phase material fills the pores in DC, resulting in a decrease in apparent porosity and water absorption rate compared to 1150 °C, correlating with Figure 2c,d.
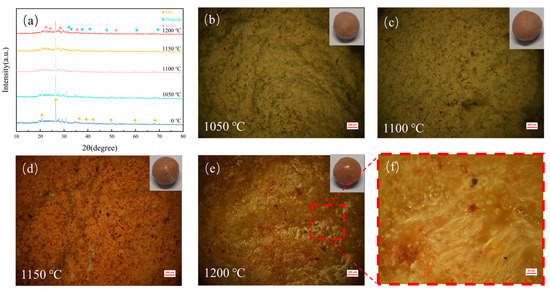
Figure 2.
(a) XRD patterns of DC at different sintering temperatures. (b–e) Pore structures of DC sintered at various temperatures. (f) Magnified view of the local surface structure of DC. The influence of varying sintering temperatures on the crystalline structure and pore characteristics of DC.
3.2. Characterization of Modifed Ceramsite
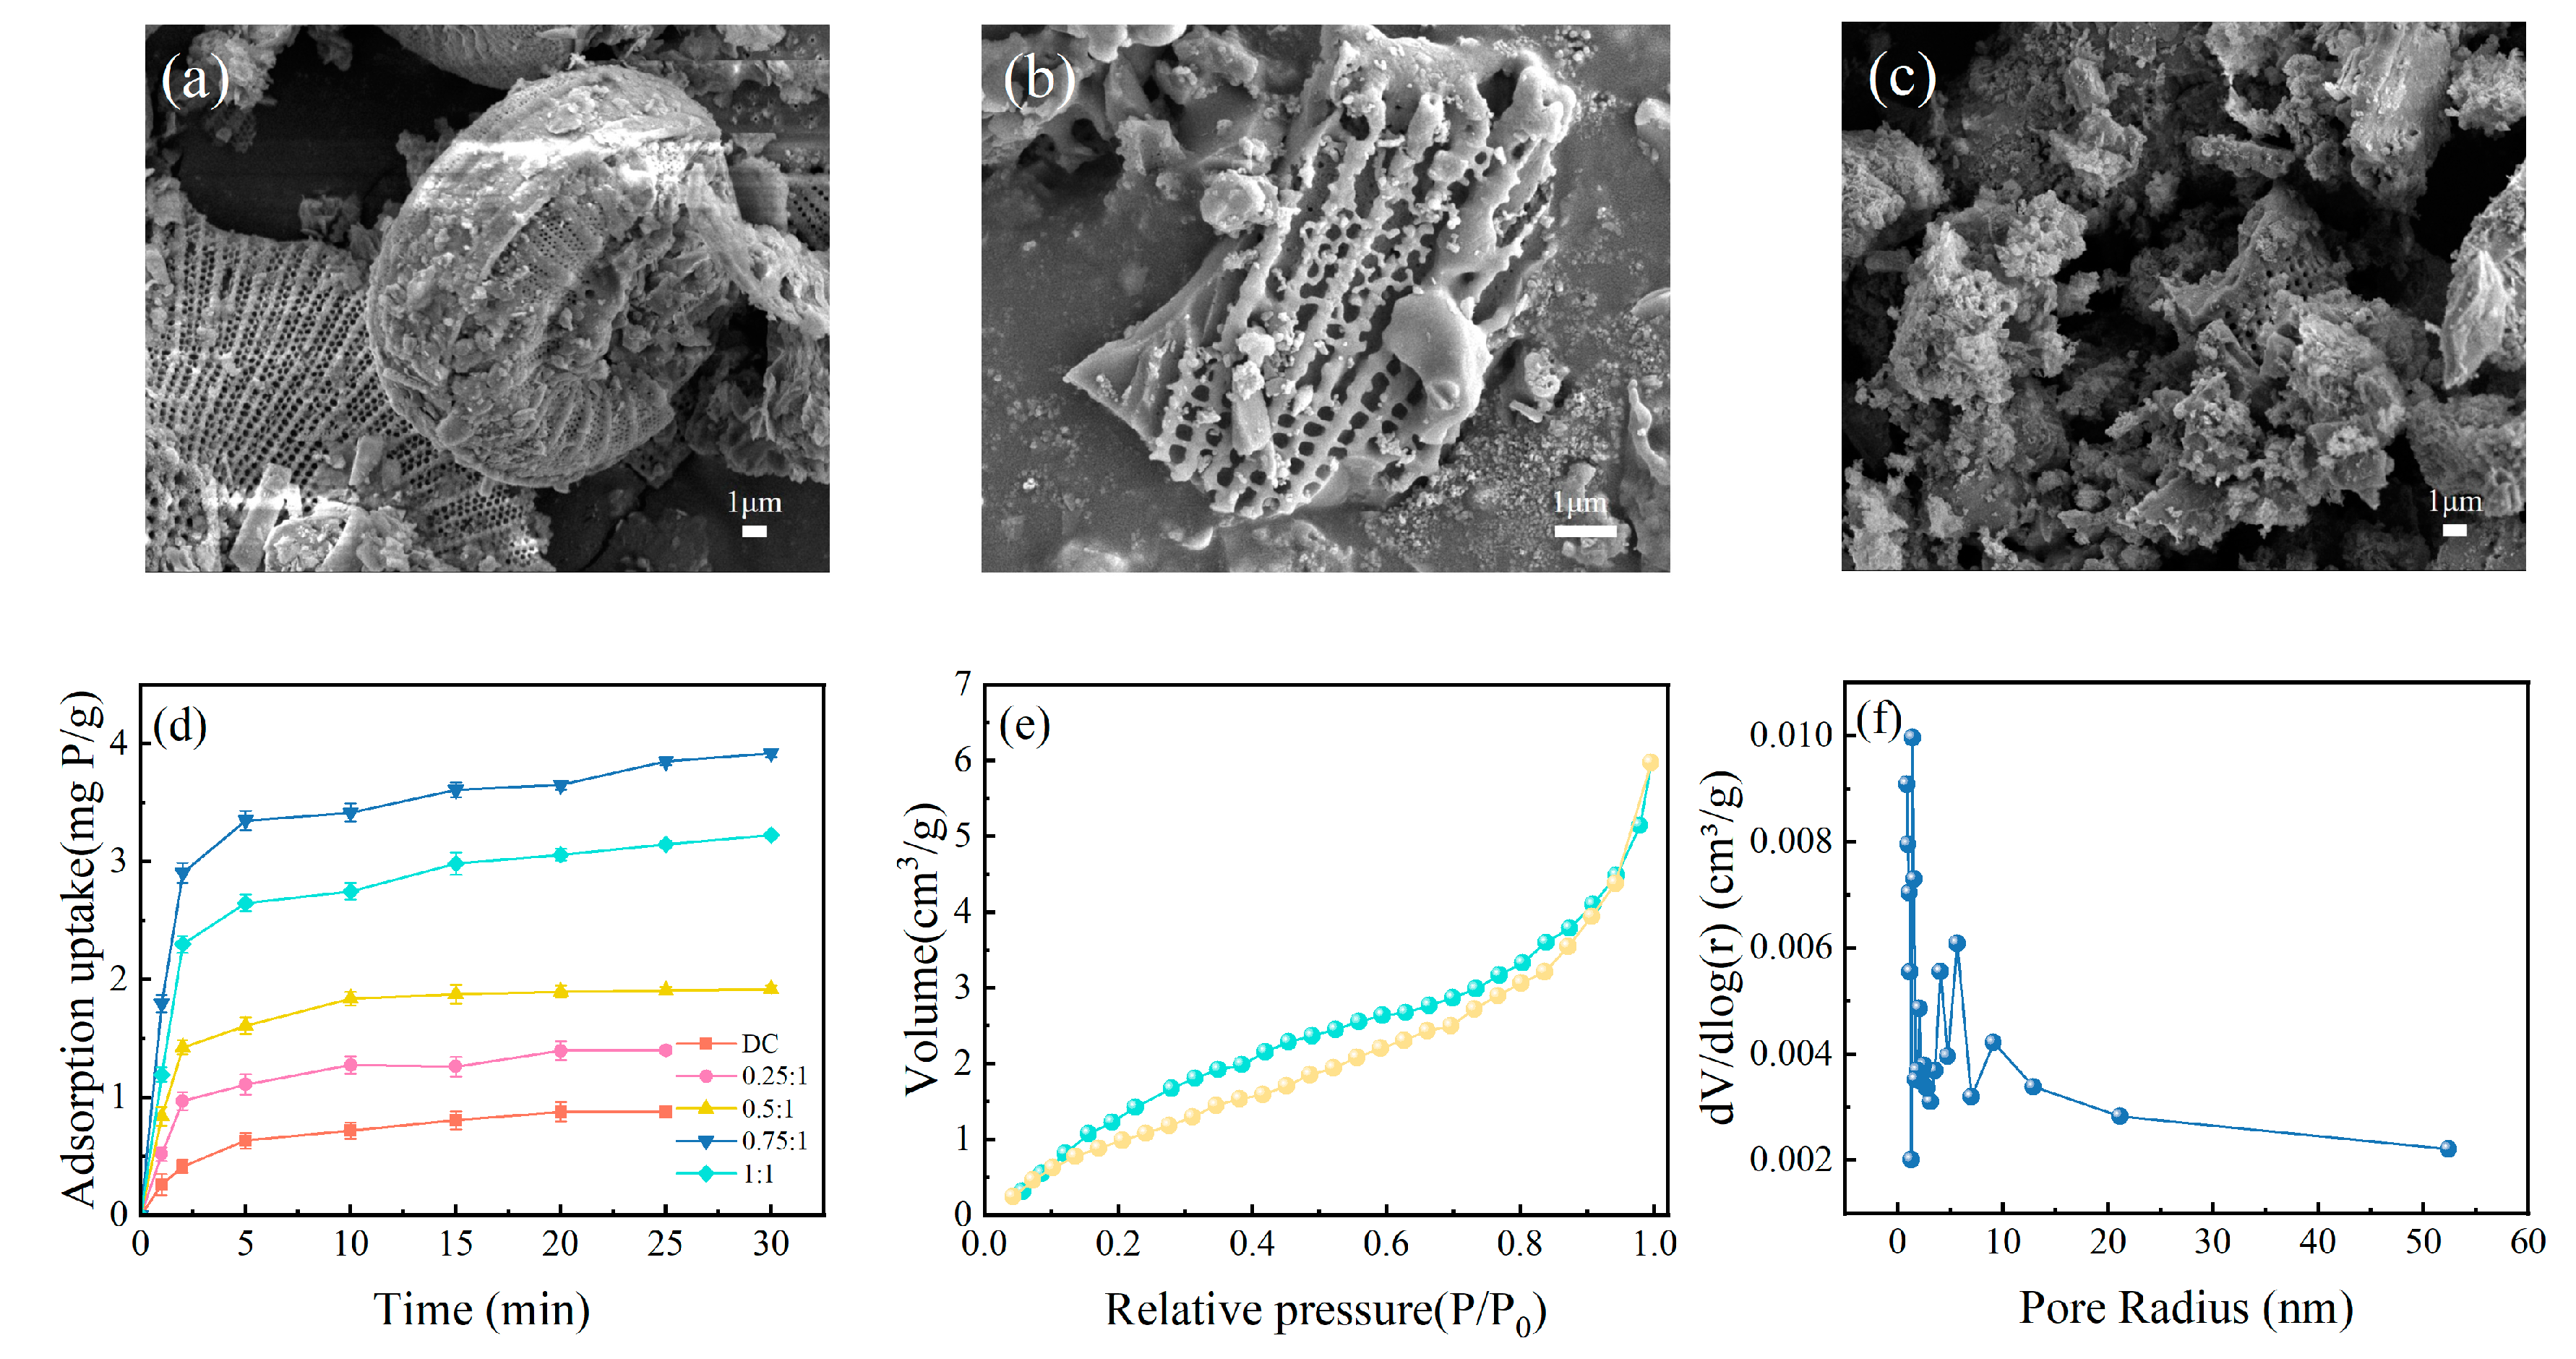
SEM images reveal the changes in surface morphology of diatomite through the processes of granulation and modification. As shown in Figure 3a, the initial diatomite surface features a multitude of regularly arranged pores, which contribute to its large specific surface area and provide ample contact area for subsequent modifications. The surface is not overly covered with inorganic metal ions or organic impurities, showcasing the distinct and clear morphological characteristics of diatomite. After sintering into ceramsite, as depicted in Figure 3b, the surface pores slightly expand, some show signs of damage, and there are instances of agglomeration at the edges. These changes are indicative of the raw material undergoing liquefaction and solidification, enhancing the structural integrity of the ceramsite. Overall, the original structure of diatomite is still maintained, which favorably facilitates the attachment of additional functional groups in subsequent steps. After modification, the surface of the diatomite exhibits a significant amount of flocculent material, as shown in Figure 3c, suggesting that the functionalization process has been effectively realized.
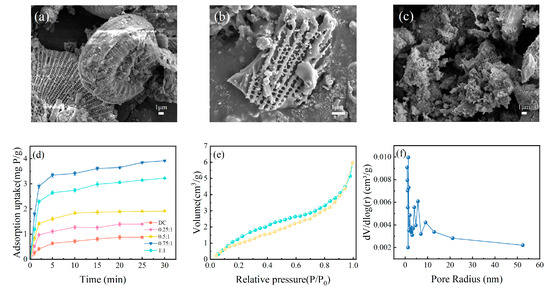
Figure 3.
The SEM images of diatomite (a), DC (b), and Fe-DC (c). (d) Time-dependent adsorption curves for adsorbents modified at varying ratios. Nitrogen adsorption–desorption curves (e) alongside the BJH analysis of pore size distribution for Fe-DC (f).
The mass ratio of Fe to DC during the hydrothermal process determines the loading of Fe on DC, thereby affecting the adsorption performance of Fe-DC. Figure 3d illustrates the phosphorus adsorption performance of Fe-DC at different Fe to DC ratios. It is evident from the figure that the adsorption performance of the ceramsite is significantly enhanced after Fe loading. As the Fe/DC ratio increases, the adsorption capacity of Fe-DC first increases and then decreases, reaching a maximum at an Fe/DC ratio of 0.75:1, indicating the optimal modification effect at this ratio. Therefore, this ratio is chosen for further characterization and adsorption experiments. Additionally, nitrogen adsorption–desorption isotherms and pore size distribution measurements are conducted on Fe-DC to understand the pore structure and distribution of the ceramsite. Given the presence of pores of various diameters in DC, the BJH method is employed for analysis [27]. The specific surface area of Fe-DC reached 11.4956 m2/g, a decrease from the 22 m2/g of diatomite [27], but it still remains a material with a high specific surface area. The adsorption–desorption curve of Fe-DC, as shown in Figure 3e, exhibits a closure at lower relative pressures, resembling an H3-type hysteresis loop, associated with the discontinuous pore size distribution and irreversible adsorption in Fe-DC. The pronounced upward trend of the curve under elevated relative pressures signifies the existence of mesopores, aligning with the structure of diatomite. In the medium pressure region, the slope of the curve changes significantly, indicating the diversity of pore distribution. The pore size distribution graph, as shown in Figure 3f, reveals that the pore sizes of Fe-DC are mainly concentrated between 0–10 nm and are discontinuous, consistent with the pore structure of diatomite and the adsorption–desorption curve, proving that the modification does not destroy the original pore structure of diatomite.
Figure S2 presents the SEM images and EDS element maps of Fe-DC after phosphorus adsorption, showing that Fe is uniformly loaded onto DC and P has been successfully adsorbed onto Fe-DC. The XRF results also confirm the adsorption of P on Fe-DC-P, as indicated in Table S1. Additionally, the increase in Fe2O3 content in the table further corroborates the successful loading of Fe onto DC.
3.3. Adsorption Kinetics
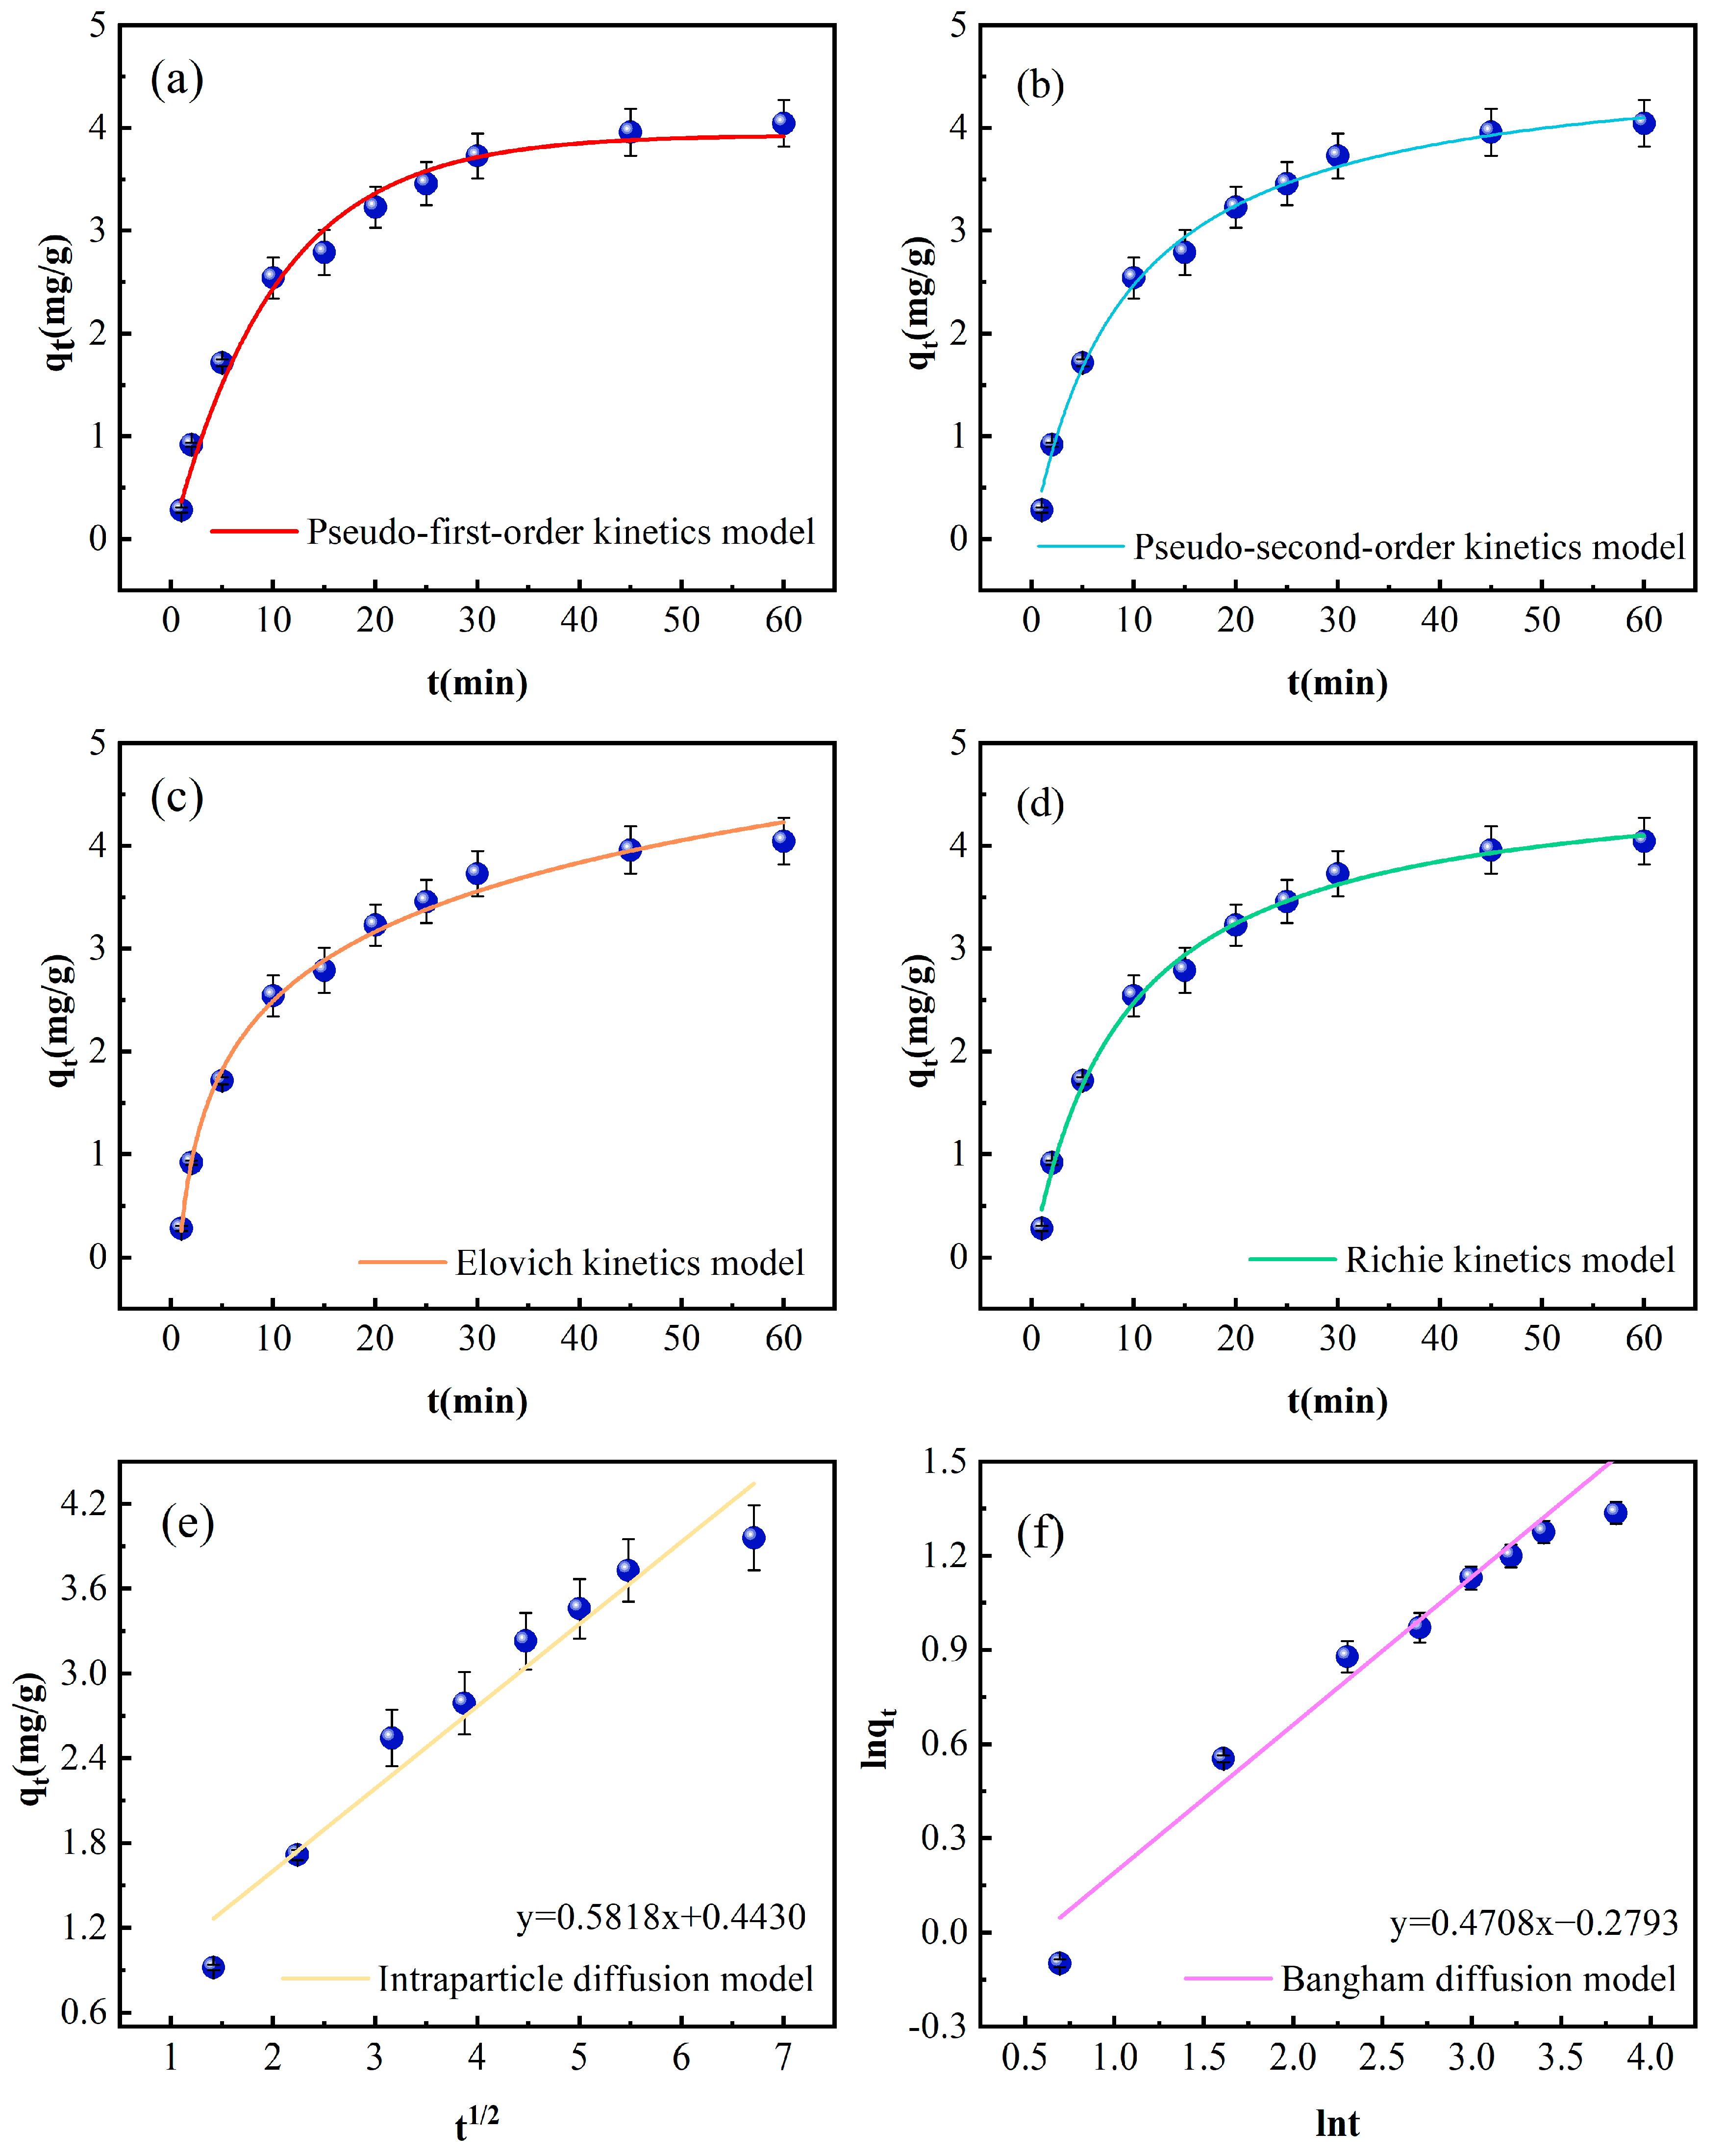
Figure 4 illustrates the influence of time on phosphorus adsorption by Fe-DC. Given the elevated initial concentration of P in the solution and the ceramsite’s abundant adsorption sites, there is a swift rise in adsorption capacity at the onset of the process. As the concentration of P in the solution diminishes over time, the rate of adsorption decreases, stabilizing at an equilibrium with a peak adsorption capacity of 4.01 mg/g after approximately 45 min. Hence, the adsorption process unfolds in two distinct stages: initially, the process is propelled by the concentration gradient across the solid and liquid phases; subsequently, as ions approach a state of equilibrium between these phases, the rate of adsorption diminishes. During this phase, minor desorption may occur concurrently with adsorption [28].
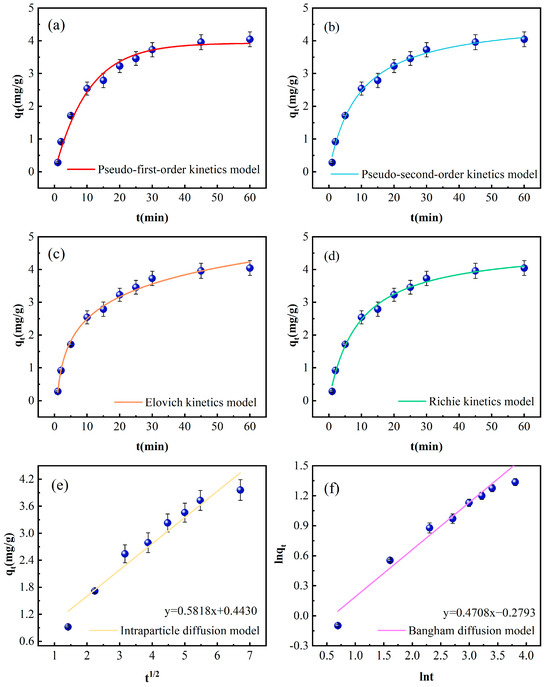
Figure 4.
Kinetic curves of phosphorus adsorption by Fe-DC (C0 = 100 mg/L, pH = 7.00, T = 298 K, m = 2 g, V = 100 mL); (a) pseudo-first-order kinetic models, (b) pseudo-second-order kinetic models, (c) Elovich kinetic models, (d) Richie kinetic models, (e) intraparticle diffusion models, (f) Bangham kinetic models.
The data obtained from fitting the kinetic models are presented in Table 1. The R2 value for the pseudo-second-order kinetic model stands at 0.9937, surpassing the pseudo-first-order model’s R2 of 0.9838. This indicates a predominant influence of chemisorption in the adsorption mechanism, which involves the interaction of valence forces [29]. The fitted saturation adsorption capacity of the pseudo-first-order kinetics is 3.9311 mg/g, closer to the experimental value of Fe-DC (4.05 mg/g), suggesting that the adsorption process is influenced by the initial concentration [30]. Conversely, the pseudo-second-order kinetics yield a saturation capacity of 4.7271 mg/g, exceeding the experimental value, which might be due to the precipitation formed by the reaction of phosphate with metal ions released from the ceramsite [31]. The Elovich model shows a high correlation coefficient of 0.9930, confirming that the adsorption of phosphate by Fe-DC involves chemisorption, consistent with the results from the pseudo-second-order kinetics fitting.

Table 1.
Kinetic parameters and correlation coefficients of phosphorus adsorption on Fe-DC.
The adsorption process typically consists of surface adsorption and intraparticle diffusion within the pores. The correlation coefficient of the Bangham diffusion model is also high (0.9588), indicating pore diffusion during the adsorption process. The correlation coefficient for the intraparticle diffusion model is 0.9378, but with a smaller slope (Kρ = 0.5818), suggesting that the diffusion of phosphate within Fe-DC is not as facile, and adsorption primarily occurs on the surface. The observation that lines derived from both diffusion models fail to intersect the origin corroborates the notion that additional stages of adsorption influence the process, aligning with the observed lesser slope [22].
Table S2 provides a comparative analysis of the phosphorus adsorption performance of various modified ceramsites reported in recent years. The comparison indicates that the Fe-DC prepared in this study exhibits superior adsorption capacity relative to other materials. Compared to other iron-modified ceramsites, diatomite-based ceramsite, due to its unique porous structure, also exhibits stronger adsorption performance.
3.4. Adsorption Isotherms
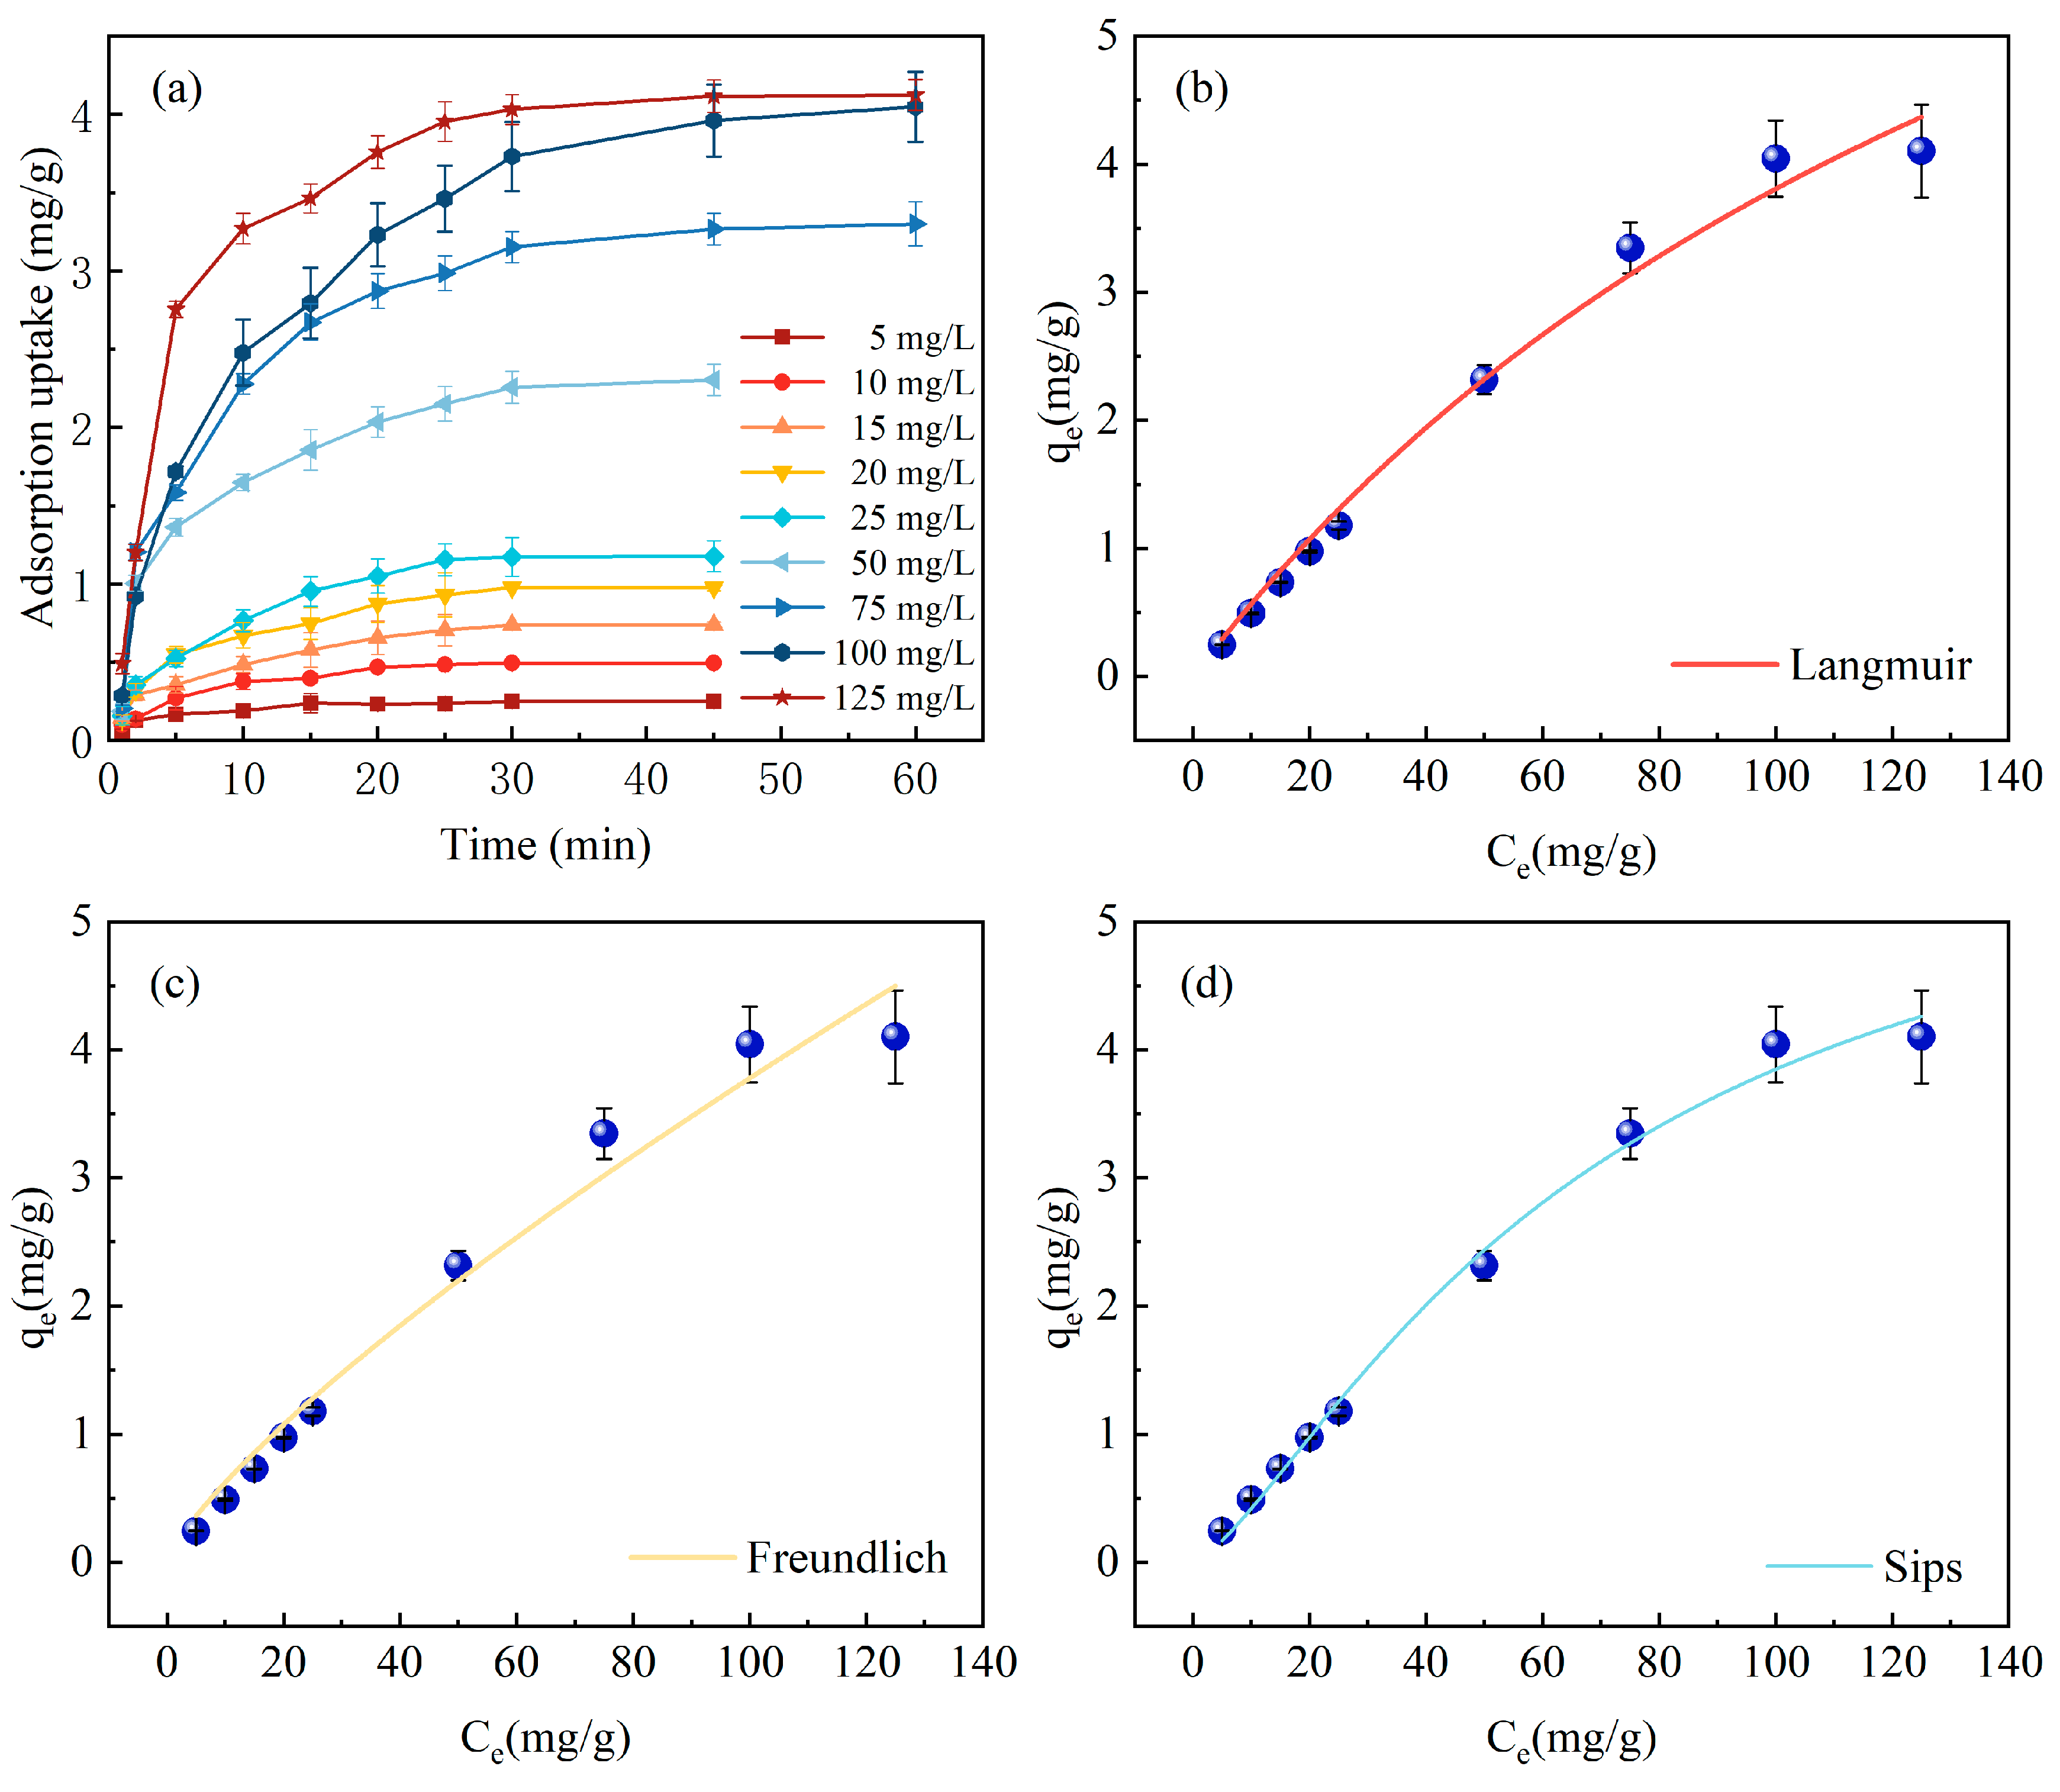
For the study of adsorption isotherms, the Langmuir, Freundlich, and Sips models are utilized, as shown in Figure 5. In Figure 5a, it is observed that with escalating initial concentrations from 5, 10, 15, 20, 25, 50, 75, 100 to 125 mg/L, the time to reach adsorption equilibrium also gradually extends from 20 min at 5–10 mg/L to 30 min at 15–50 mg/L, and up to 45 min at 75–125 mg/L. The corresponding equilibrium adsorption capacities are 0.248, 0.493, 0.735, 0.975, 1.175, 2.301, 3.264, 3.960, and 4.119 mg P/g, respectively. At lower initial P concentrations, the interaction between adsorption sites on Fe-DC and P is not optimal due to a reduced ion mass flow rate, rendering the process predominantly dependent on phosphate concentration. However, with an increase in initial P concentration, there is an expansion in the concentration gradient across the solid and liquid phases, coupled with an enhanced ion mass flow rate, which collectively contribute to a progressive rise in the ceramsite’s adsorption capacity [29].
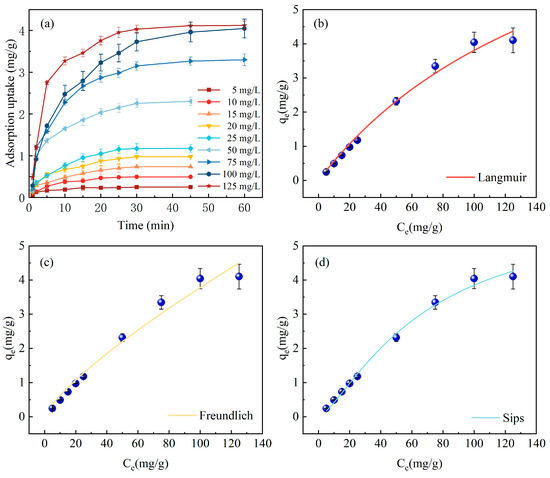
Figure 5.
Variation in adsorption capacity with different phosphorus concentrations and over time. (a) Adsorption isotherm models on Fe-DC (C0 = 100 mg/L, pH = 7.00, T = 298 K, m = 2 g, V = 100 mL), (b) Langmuir model, (c) Freundlich model, (d) Sips model.
Table 2 displays the fitting results of various adsorption isotherm models, with the Langmuir and Freundlich models yielding R2 values of 0.9876 and 0.9752, respectively. This clearly indicates that the Langmuir model more accurately depicts the adsorption behavior of P on Fe-DC, suggesting the adsorption process conforms to uniform monolayer adsorption [28], with all adsorption sites on the Fe-DC surface being equivalent. The RL value of 0.6410, within the 0–1 range, demonstrates good adsorption affinity of Fe-DC for phosphates. The 1/n value from the Freundlich model, at 0.7825, indicates that the adsorption of P on Fe-DC is facile [22]. With a correlation coefficient of 0.9930, the Sips model outperforms the preceding models. Merging the features of limited and non-uniform adsorption inherent to the Langmuir and Freundlich models, respectively, the Sips model describes adsorption in heterogeneous systems and overcomes the concentration limitation of the Freundlich model for P, indicating a non-uniform distribution of adsorption sites on Fe-DC [30], which is related to its internal porosity and the unique porous structure of diatomite. The experimentally determined maximum adsorption capacity is 4.06 mg/g. The discrepancy between the qm predicted by the Langmuir model and the qe during the adsorption process, which deviates from homogeneous adsorption, suggests that adsorption occurs within the pores, reaffirming that Fe-DC is a porous material [31].
Table 2.
Adsorption isotherm parameters and correlation coefficients for phosphorus adsorption by Fe-DC.
3.5. Adsorption Thermodynamics
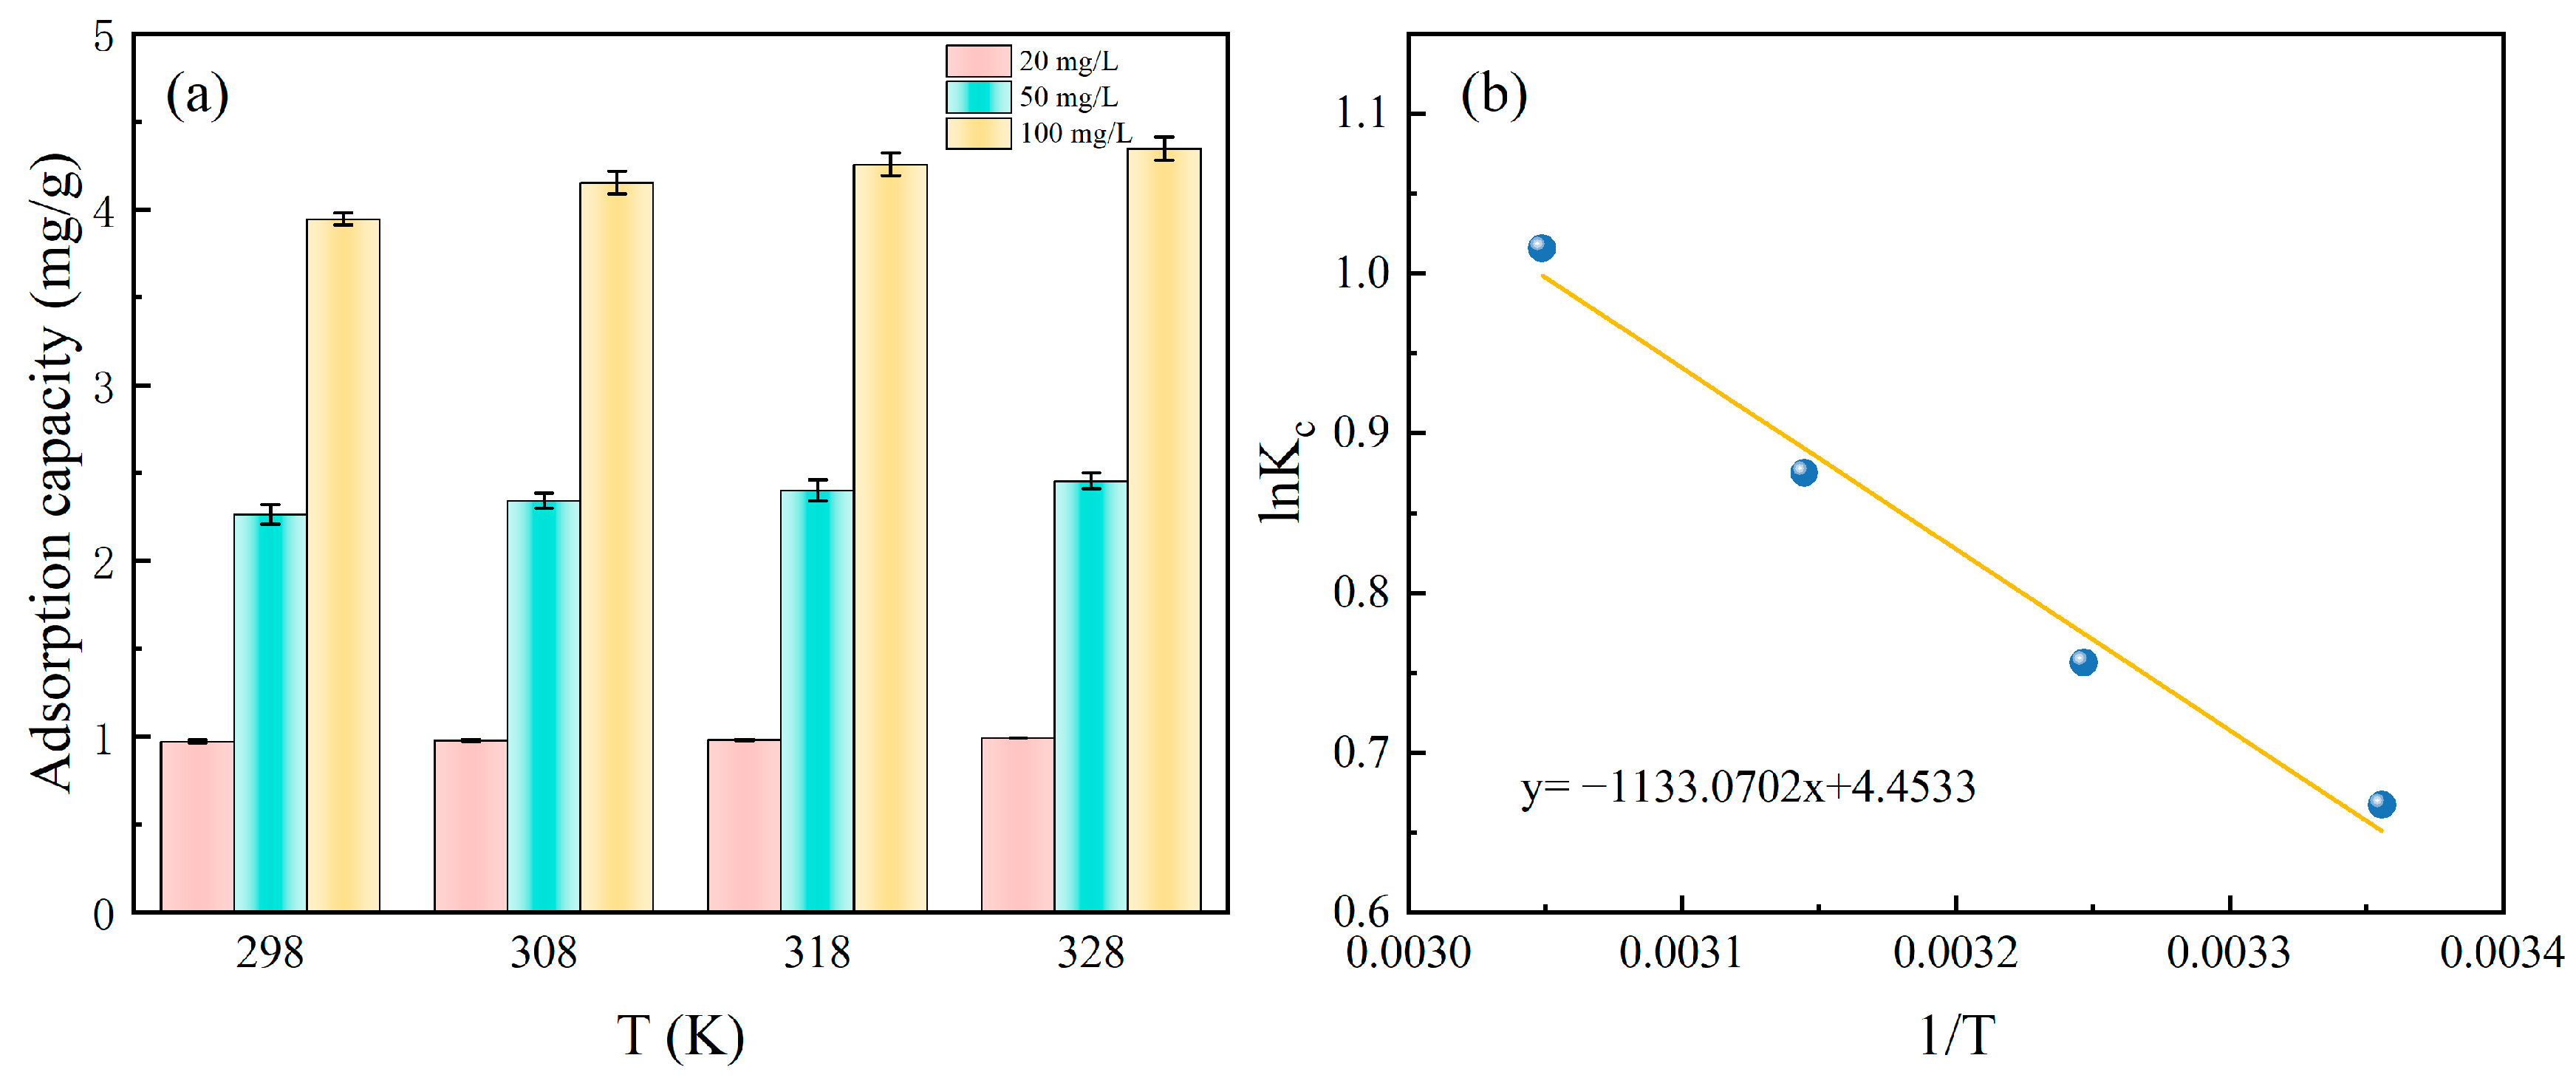
The adsorption performance of Fe-DC at different temperatures is measured, as shown in Figure 6a. At the same initial concentration, the adsorption capacity of Fe-DC for P does not vary significantly with temperature changes. At 20 mg/L, 50 mg/L, and 100 mg/L, the adsorption capacity remains approximately at 1, 2, 3, and 4 mg P/L, indicating that temperature variations do not markedly influence the adsorption efficacy of Fe-DC.
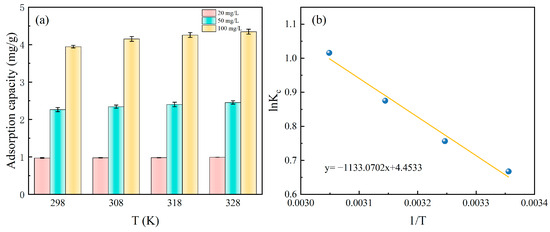
Figure 6.
The effect of temperature on P adsorption by Fe-DC at various concentrations (a) and linear curves of lnKC vs. 1/T for the adsorption process (b).
For deriving thermodynamic parameters like ΔG0, the gathered temperature-variant data are plotted as lnKC vs. 1/T, depicted in Figure 6b. The analysis results, presented in Table 3, demonstrate a significant correlation coefficient of R2 = 0.9756. From this analysis, the values of ΔH0 and ΔS0 are determined to be 9.42 kJ/mol and 37.03 J/(mol·K), based on the slope and intercept, respectively. The positive value of ΔH0 suggests that Fe-DC’s adsorption is an endothermic reaction, implying that higher temperatures enhance the adsorption process [32]. This is consistent with thermodynamic studies on P adsorption by other iron-containing compounds, although the small magnitude suggests a minor temperature effect on adsorption. ΔS0 > 0 indicates an increase in randomness during adsorption. ΔG0 decreases from −1.61 to −2.72 with rising temperature, confirming the spontaneous nature of the adsorption process and that higher temperatures enhance the driving force [33].
Table 3.
Thermodynamic parameters of phosphate adsorption by Fe-DC.
3.6. Adsorption Mechanism
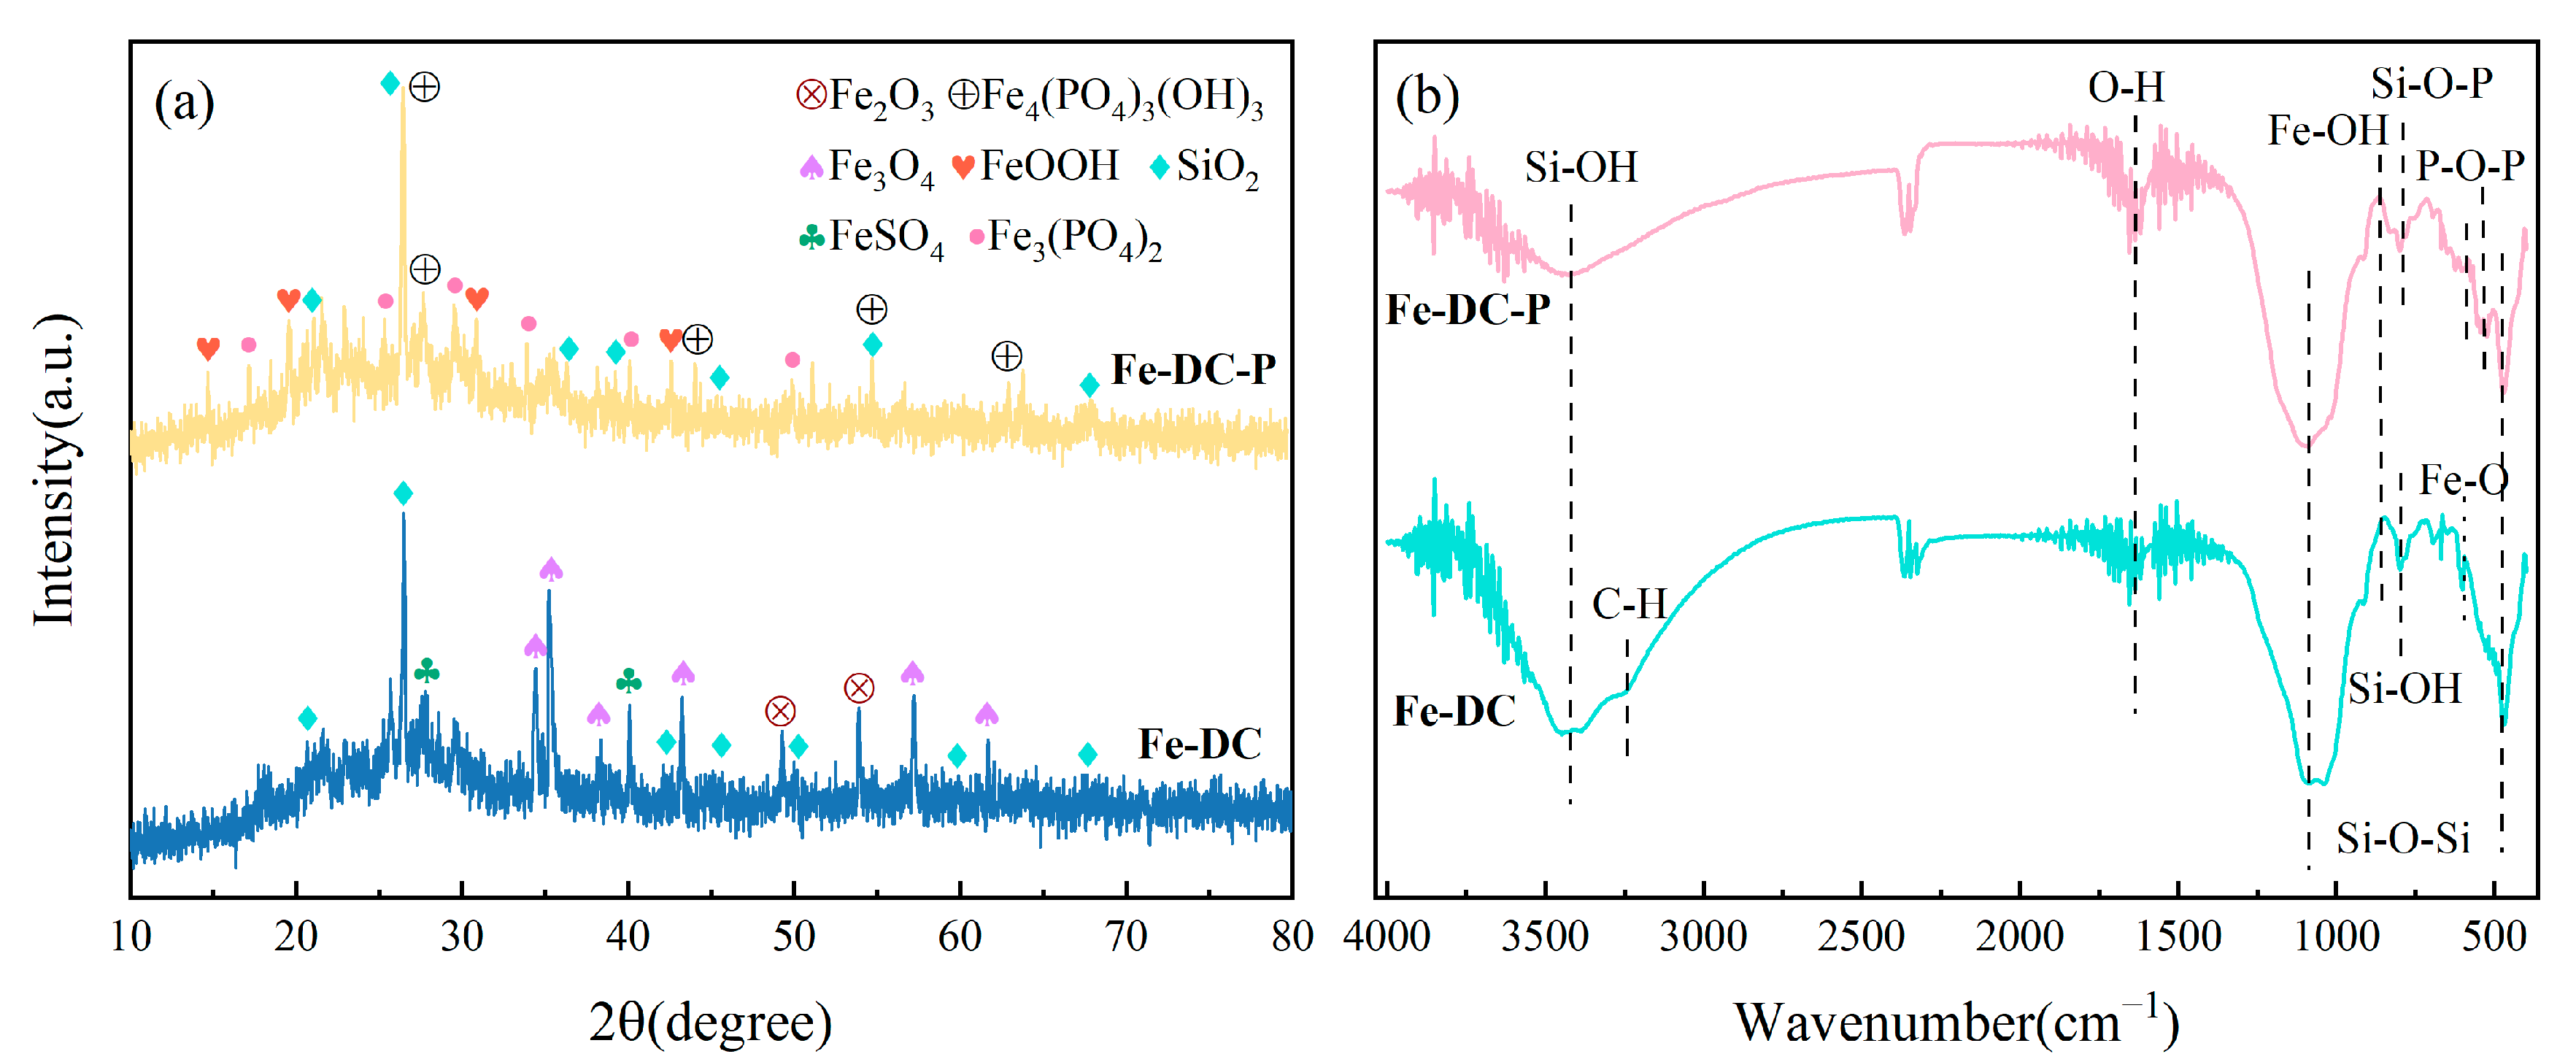
XRD is utilized to examine the crystal structure of Fe-DC before and after adsorption, aiding in elucidating the adsorption mechanism, as shown in Figure 7a. Diffraction peaks of SiO2 at 26.57° and 20.79° are observed in the ceramsite both before and after adsorption, indicating that the modification process does not alter the original structure of the diatomite, consistent with the SEM results. Additionally, the presence of diffraction peaks for Fe2O3 and Fe3O4 on the surface of Fe-DC indicates successful loading of Fe, with the iron oxides providing active sites for P adsorption [33]. Diffraction peaks for residual FeSO4·7H2O are also visible in the figure after washing. In the Fe-DC-P post-adsorption of P, diffraction peaks for Fe4(PO4)3(OH)3 and Fe3(PO4)2⋅8H2O, the reaction products of the adsorption process, are observed. Furthermore, additional minor peaks are present, resulting from the trace amounts of metal oxides contained within the diatomite, which are unrelated to the adsorption process and are not individually labeled here.
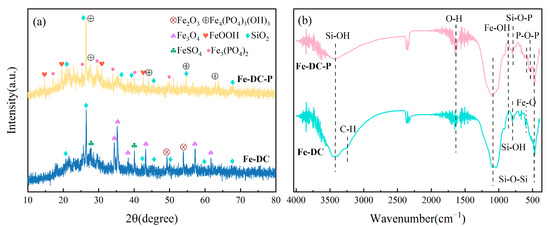
Figure 7.
XRD patterns (a) and FTIR spectra (b) of Fe-DC before and after P adsorption.
As shown in Figure 7b, FTIR is employed to detect changes in surface functional groups after adsorption. The vibrations of Si-OH bonds are the primary reasons for the peaks at 796 cm−1 and 3438 cm−1, while the vibrational peaks of Si-O-Si appear at 475 cm−1 and 1095 cm−1. These are characteristic peaks of diatomite, and their presence indicates that the loading of Fe does not disrupt the inherent structure of the diatomite, consistent with SEM and XRD results. The peak at 604 cm−1 corresponds to the vibration of Fe-O [34], indicating successful loading of Fe onto the surface of DC. After P adsorption, the vibrational peaks of P-O-P and Si-O-P on Fe-DC-P appear at 532 cm−1 and 798 cm−1, confirming the successful adsorption of P [35]. The shift of the Si-OH vibrational peak at 3438 cm−1 compared to before the reaction suggests a reaction between Fe-DC and phosphates. The minor peaks around 540, 550, and 580 cm−1 are confirmed to be HPO42− or H2PO4 [36], further verifying P adsorption. The O-H vibrational peaks at 2352 cm−1 and 1640 cm−1 are attributed to background and water peaks [37].
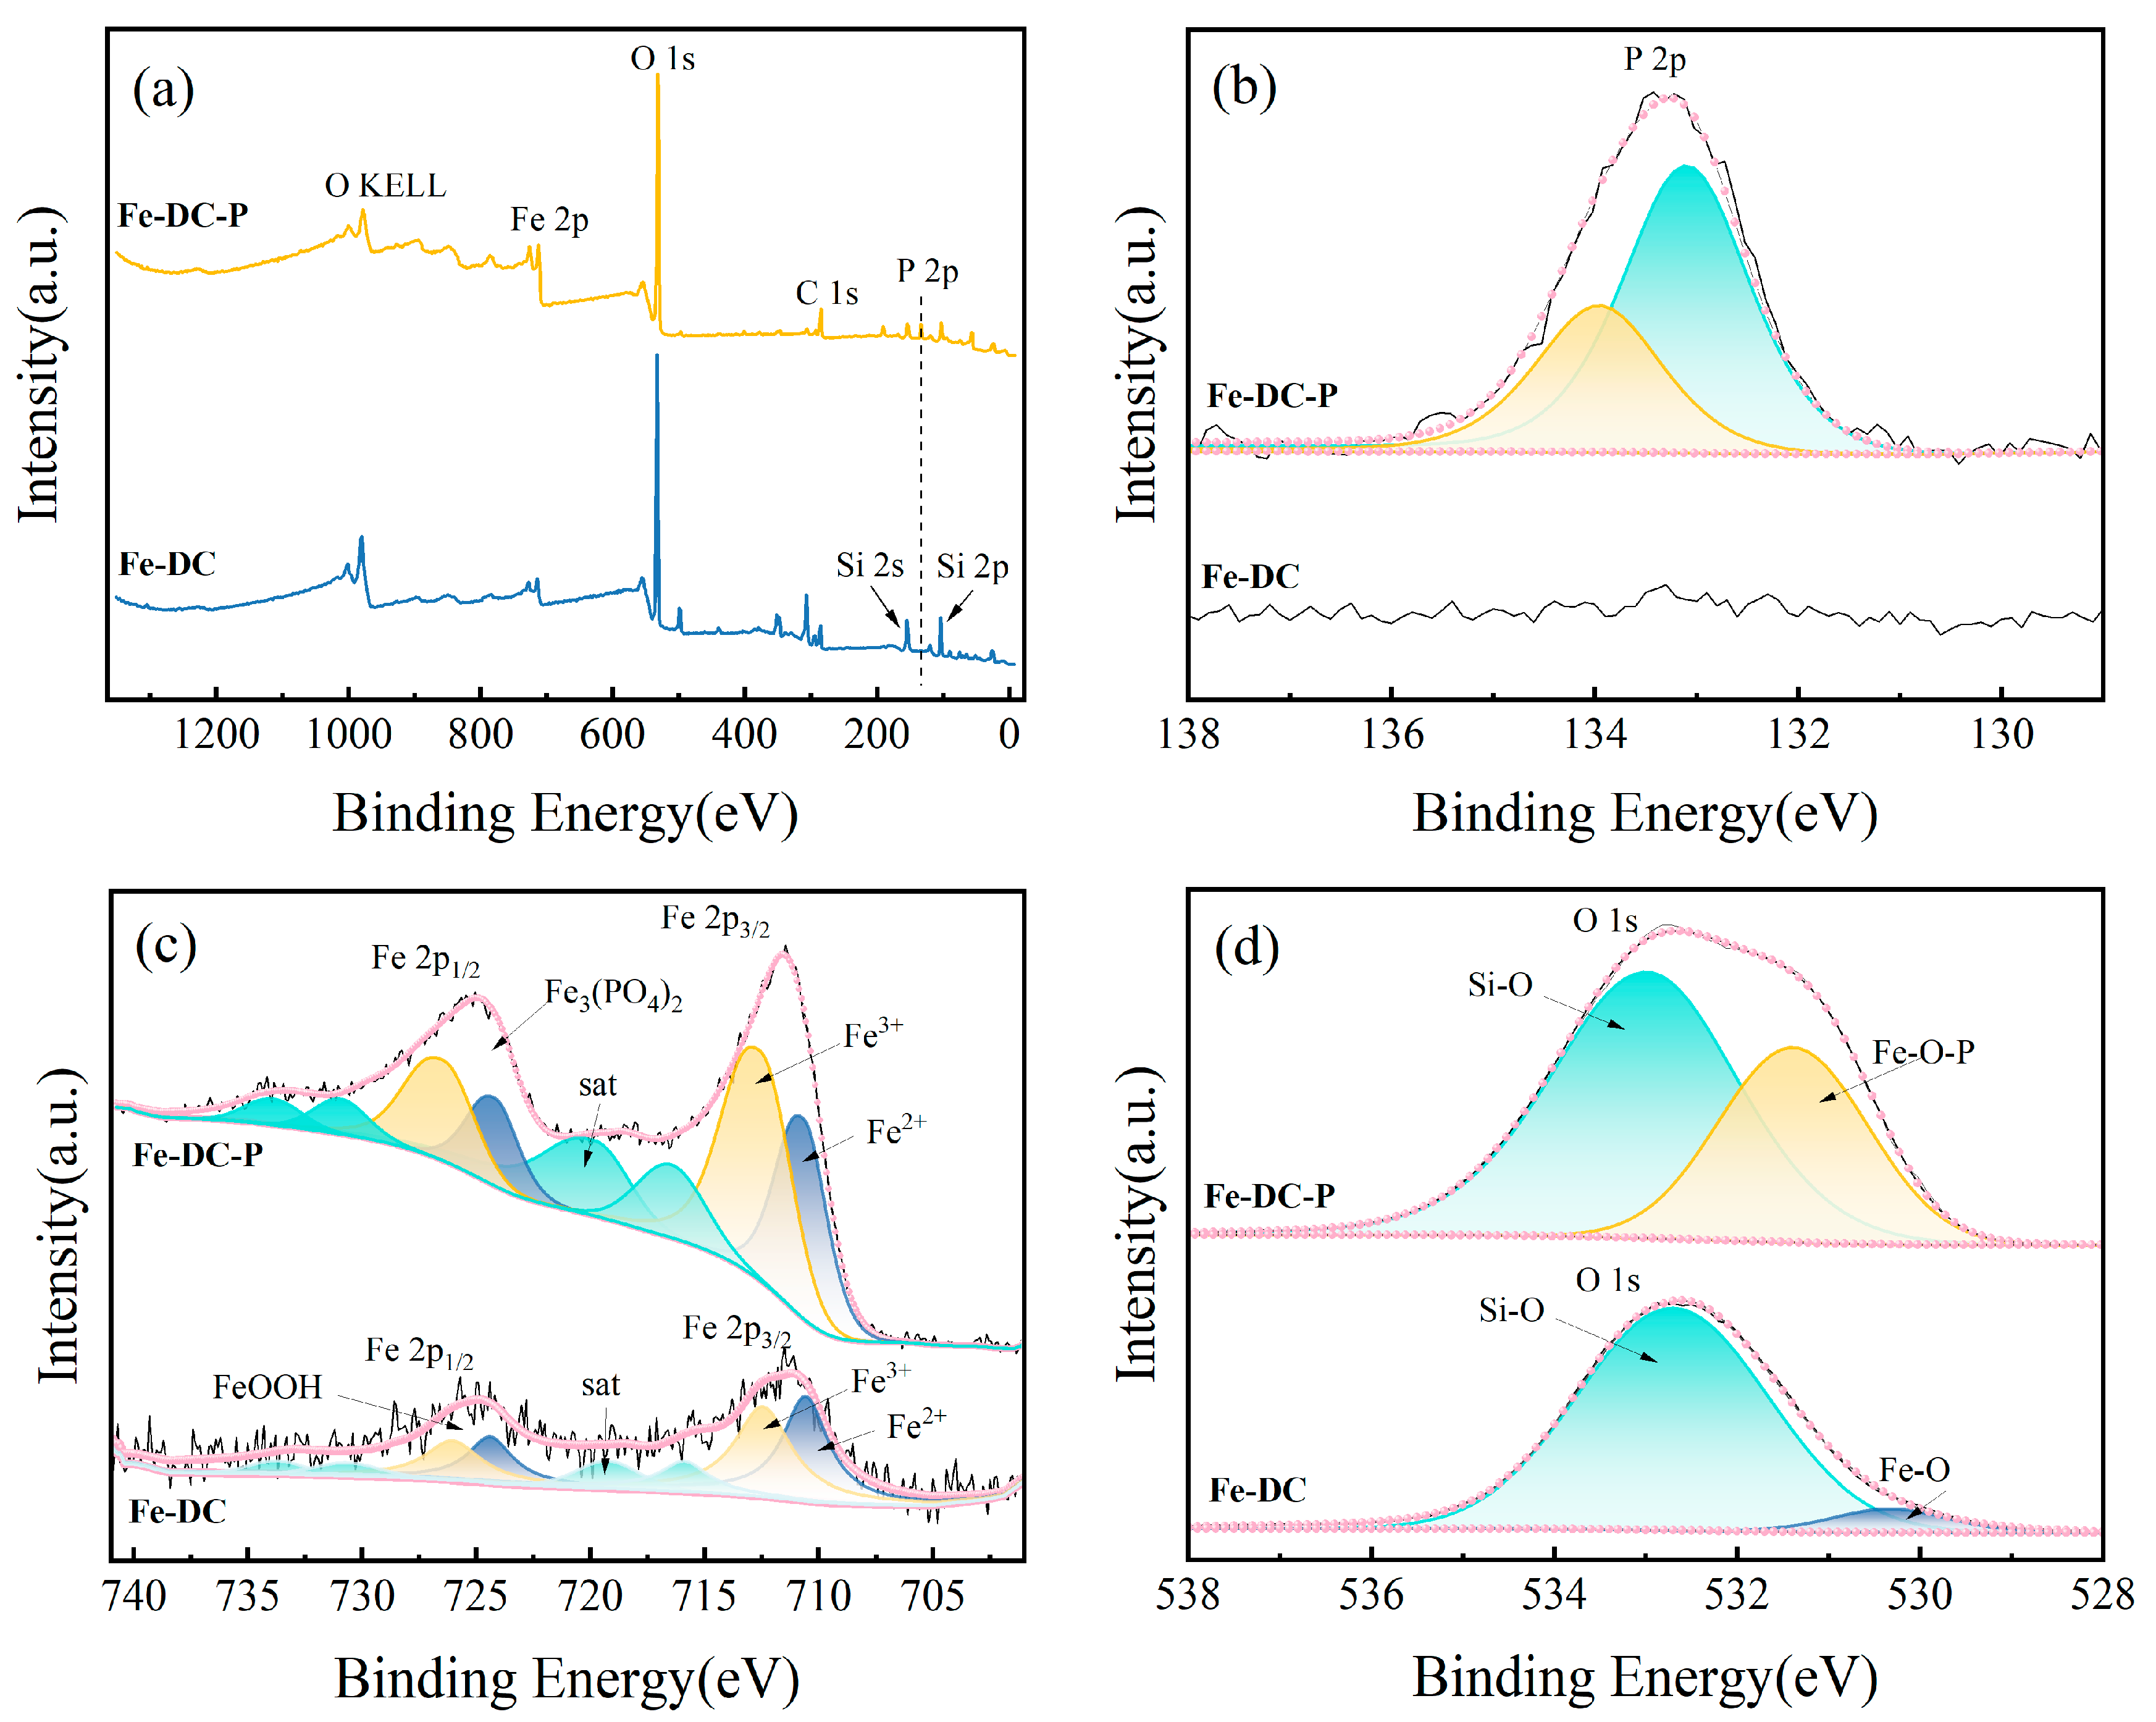
The XPS spectra are depicted in Figure 8. The P 2p spectra of Fe-DC before and after P adsorption are shown in Figure 8b, which reveal the emergence of peaks at 133.9 and 133.1 eV corresponding to HPO42− and PO43− [38], respectively. This indicates the presence of P in its adsorbed form. In the O1s spectra of Fe-DC before and after P adsorption (Figure 8d), peaks at 532.7 and 530.3 eV are attributed to Si-O and Fe-O within Fe-DC, respectively [39,40]. After P adsorption, these peaks shift to 532.9 and 531.4 eV, corresponding to Si-O and Fe-O-P in Fe-DC-P [41]. Figure 8c presents the spectra for Fe 2p1/2 and Fe 2p3/2, with peaks located at 724.3 and 711.1 eV [40], indicating that Fe on Fe-DC predominantly exists in the form of oxides. The Fe 2p1/2 peak at 724.3 eV confirms the presence of FeOOH [42,43]. The elevation of the Fe 2p3/2 peak at 711.1 eV after adsorption, fitting to Fe3+, proves a chemical reaction between Fe2+ and phosphates, forming Fe3(PO4)2⋅8H2O, corroborating the P 2p spectra. Together with XRD results, it is confirmed that P is adsorbed in the forms of Fe3(PO4)2⋅8H2O and Fe4(PO4)3(OH)3 [44].
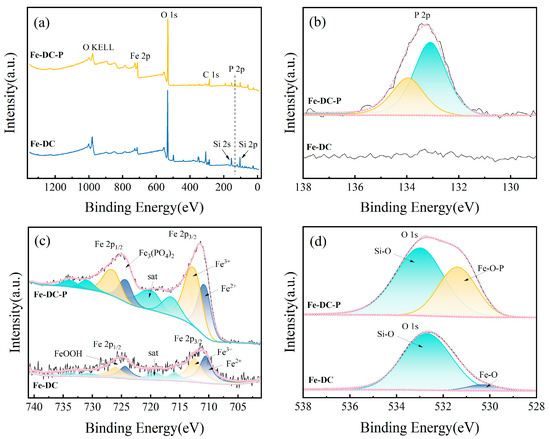
Figure 8.
The XPS spectra of Fe-DC before and after phosphate adsorption. (a) Full spectra. High-resolution XPS spectrum of P 2p (b), Fe 2p (c), and O 1s (d).
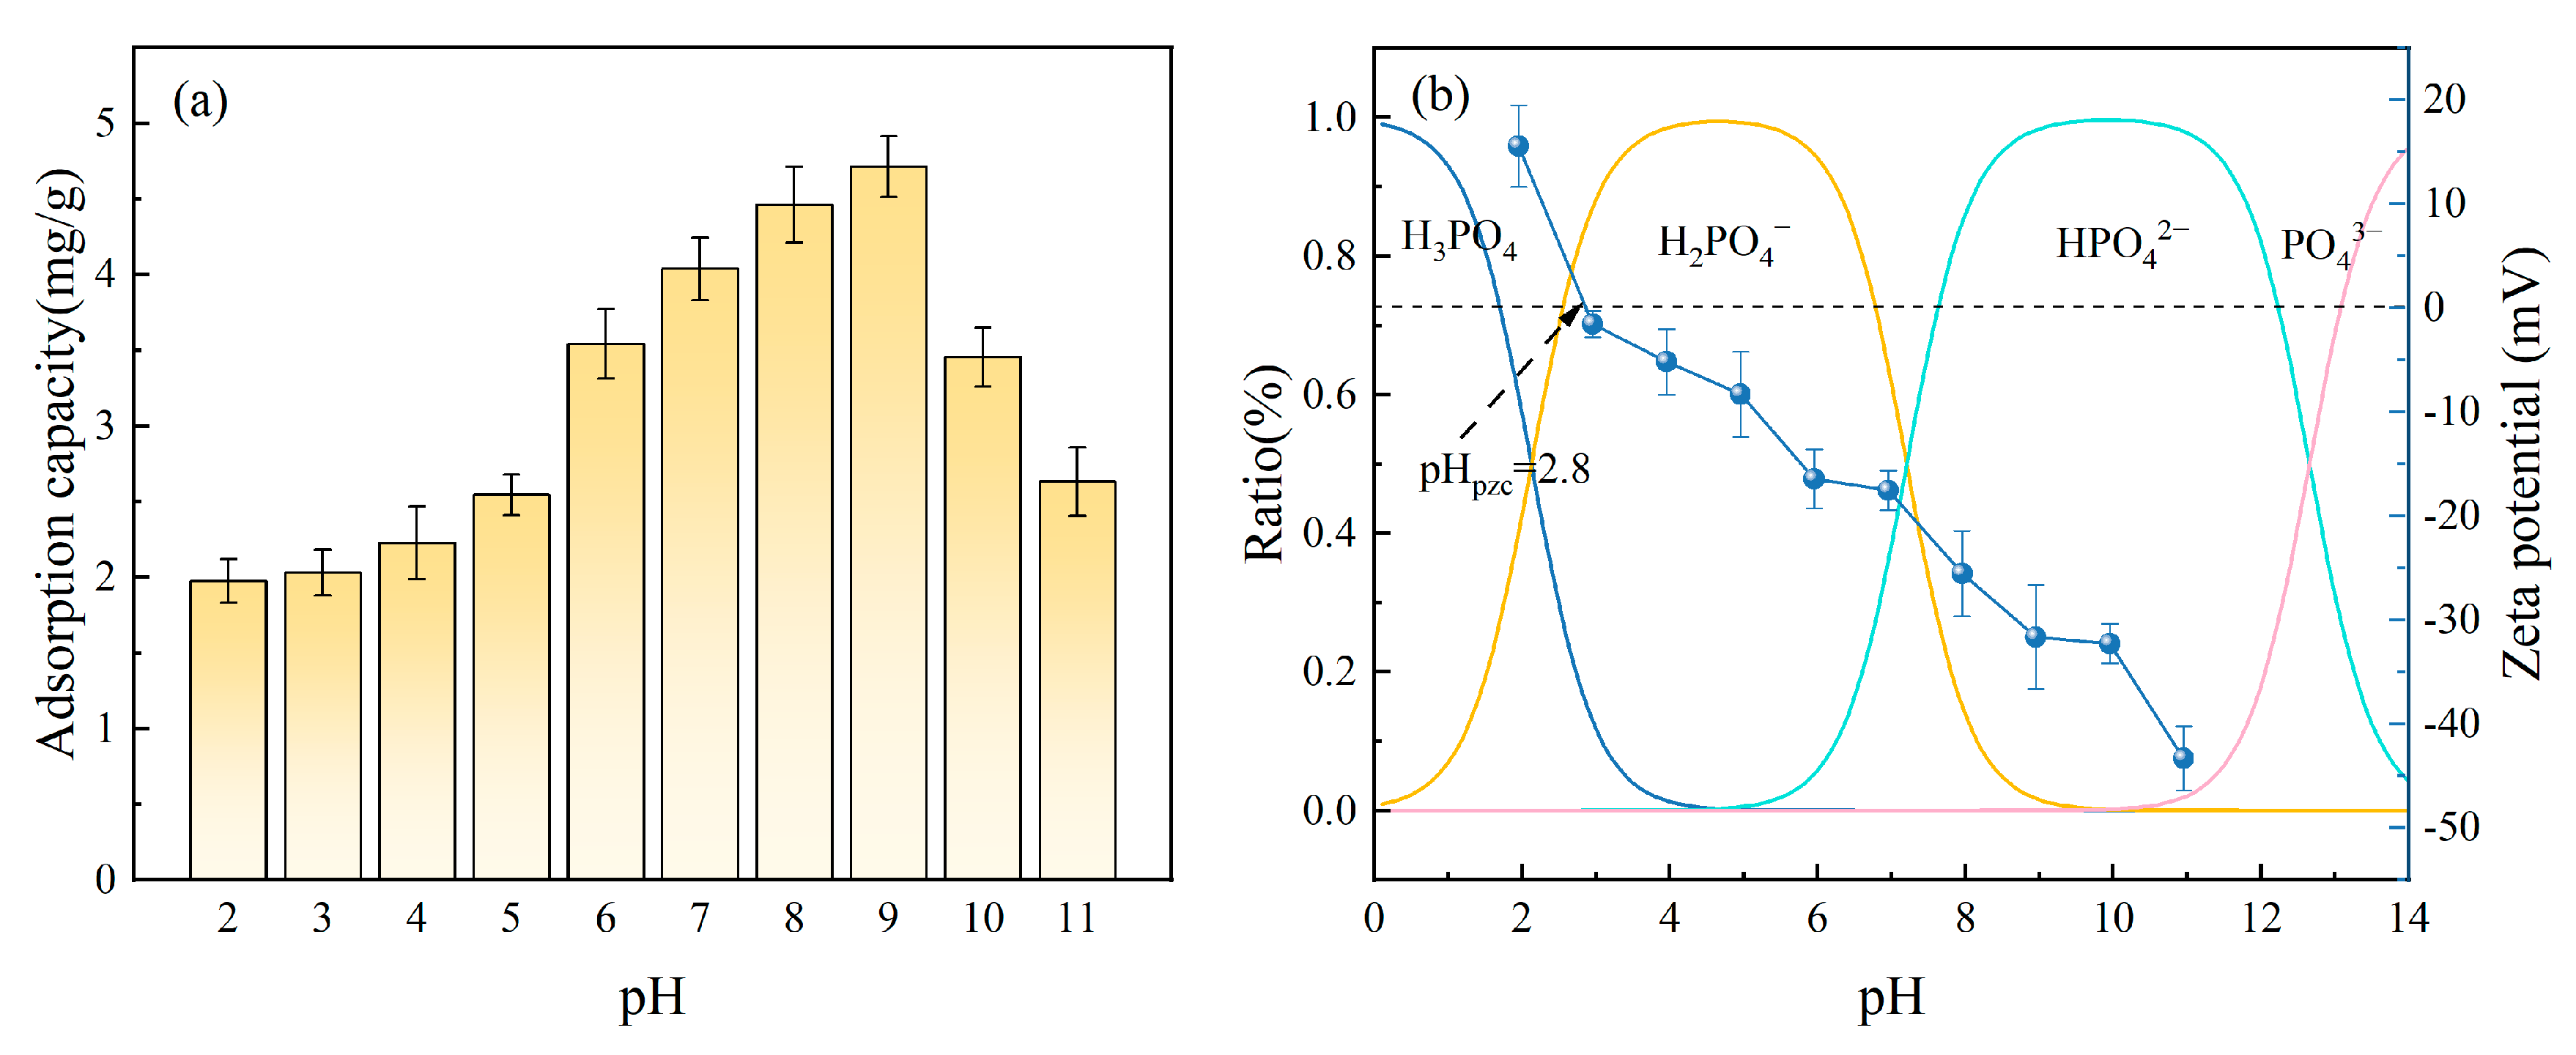
The pH value can alter the existing forms of phosphates in solution and also affect the hydroxyl groups’ protonation on the Fe-DC surface, leading to changes in adsorption performance [45]. Figure 9a demonstrates how the pH variation affects Fe-DC’s capacity to adsorb P. With the pH rising from 2 to 11, the ceramsite’s adsorption capability initially increases, subsequently declines, and stabilizes at 4–5 mg P/g within the pH range of 7–9. This indicates that a neutral to slightly alkaline environment (pH 7–9) is favorable for the adsorption by Fe-DC. To further understand the reasons behind the changes in adsorption performance, the distribution curve of phosphates at different pH levels was calculated, and the zeta potential of Fe-DC at various pH levels was measured, as shown in Figure 9b. Across the pH range of 0–14, with transition points at 2.1, 7.2, and 12.7, the predominant forms of phosphates are H3PO4, H2PO4−, HPO42−, and PO43− [46], respectively. The zeta potential of Fe-DC gradually decreases from 15.53 mV to −43.33 mV as pH increases from 2 to 11. The point of zero charge (PZC) of Fe-DC is 2.8 mV, which is close to that of SiO2 (2 mV).
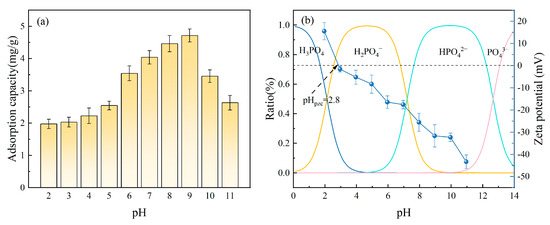
Figure 9.
(a) The effect of pH alterations in the solution on the adsorption of P by Fe-DC (C0 = 100 mg/L, T = 298 K, m = 2 g, V = 100 mL). (b) Changes in the distribution of phosphorus morphology and the zeta potential of Fe-DC across varying pH levels.
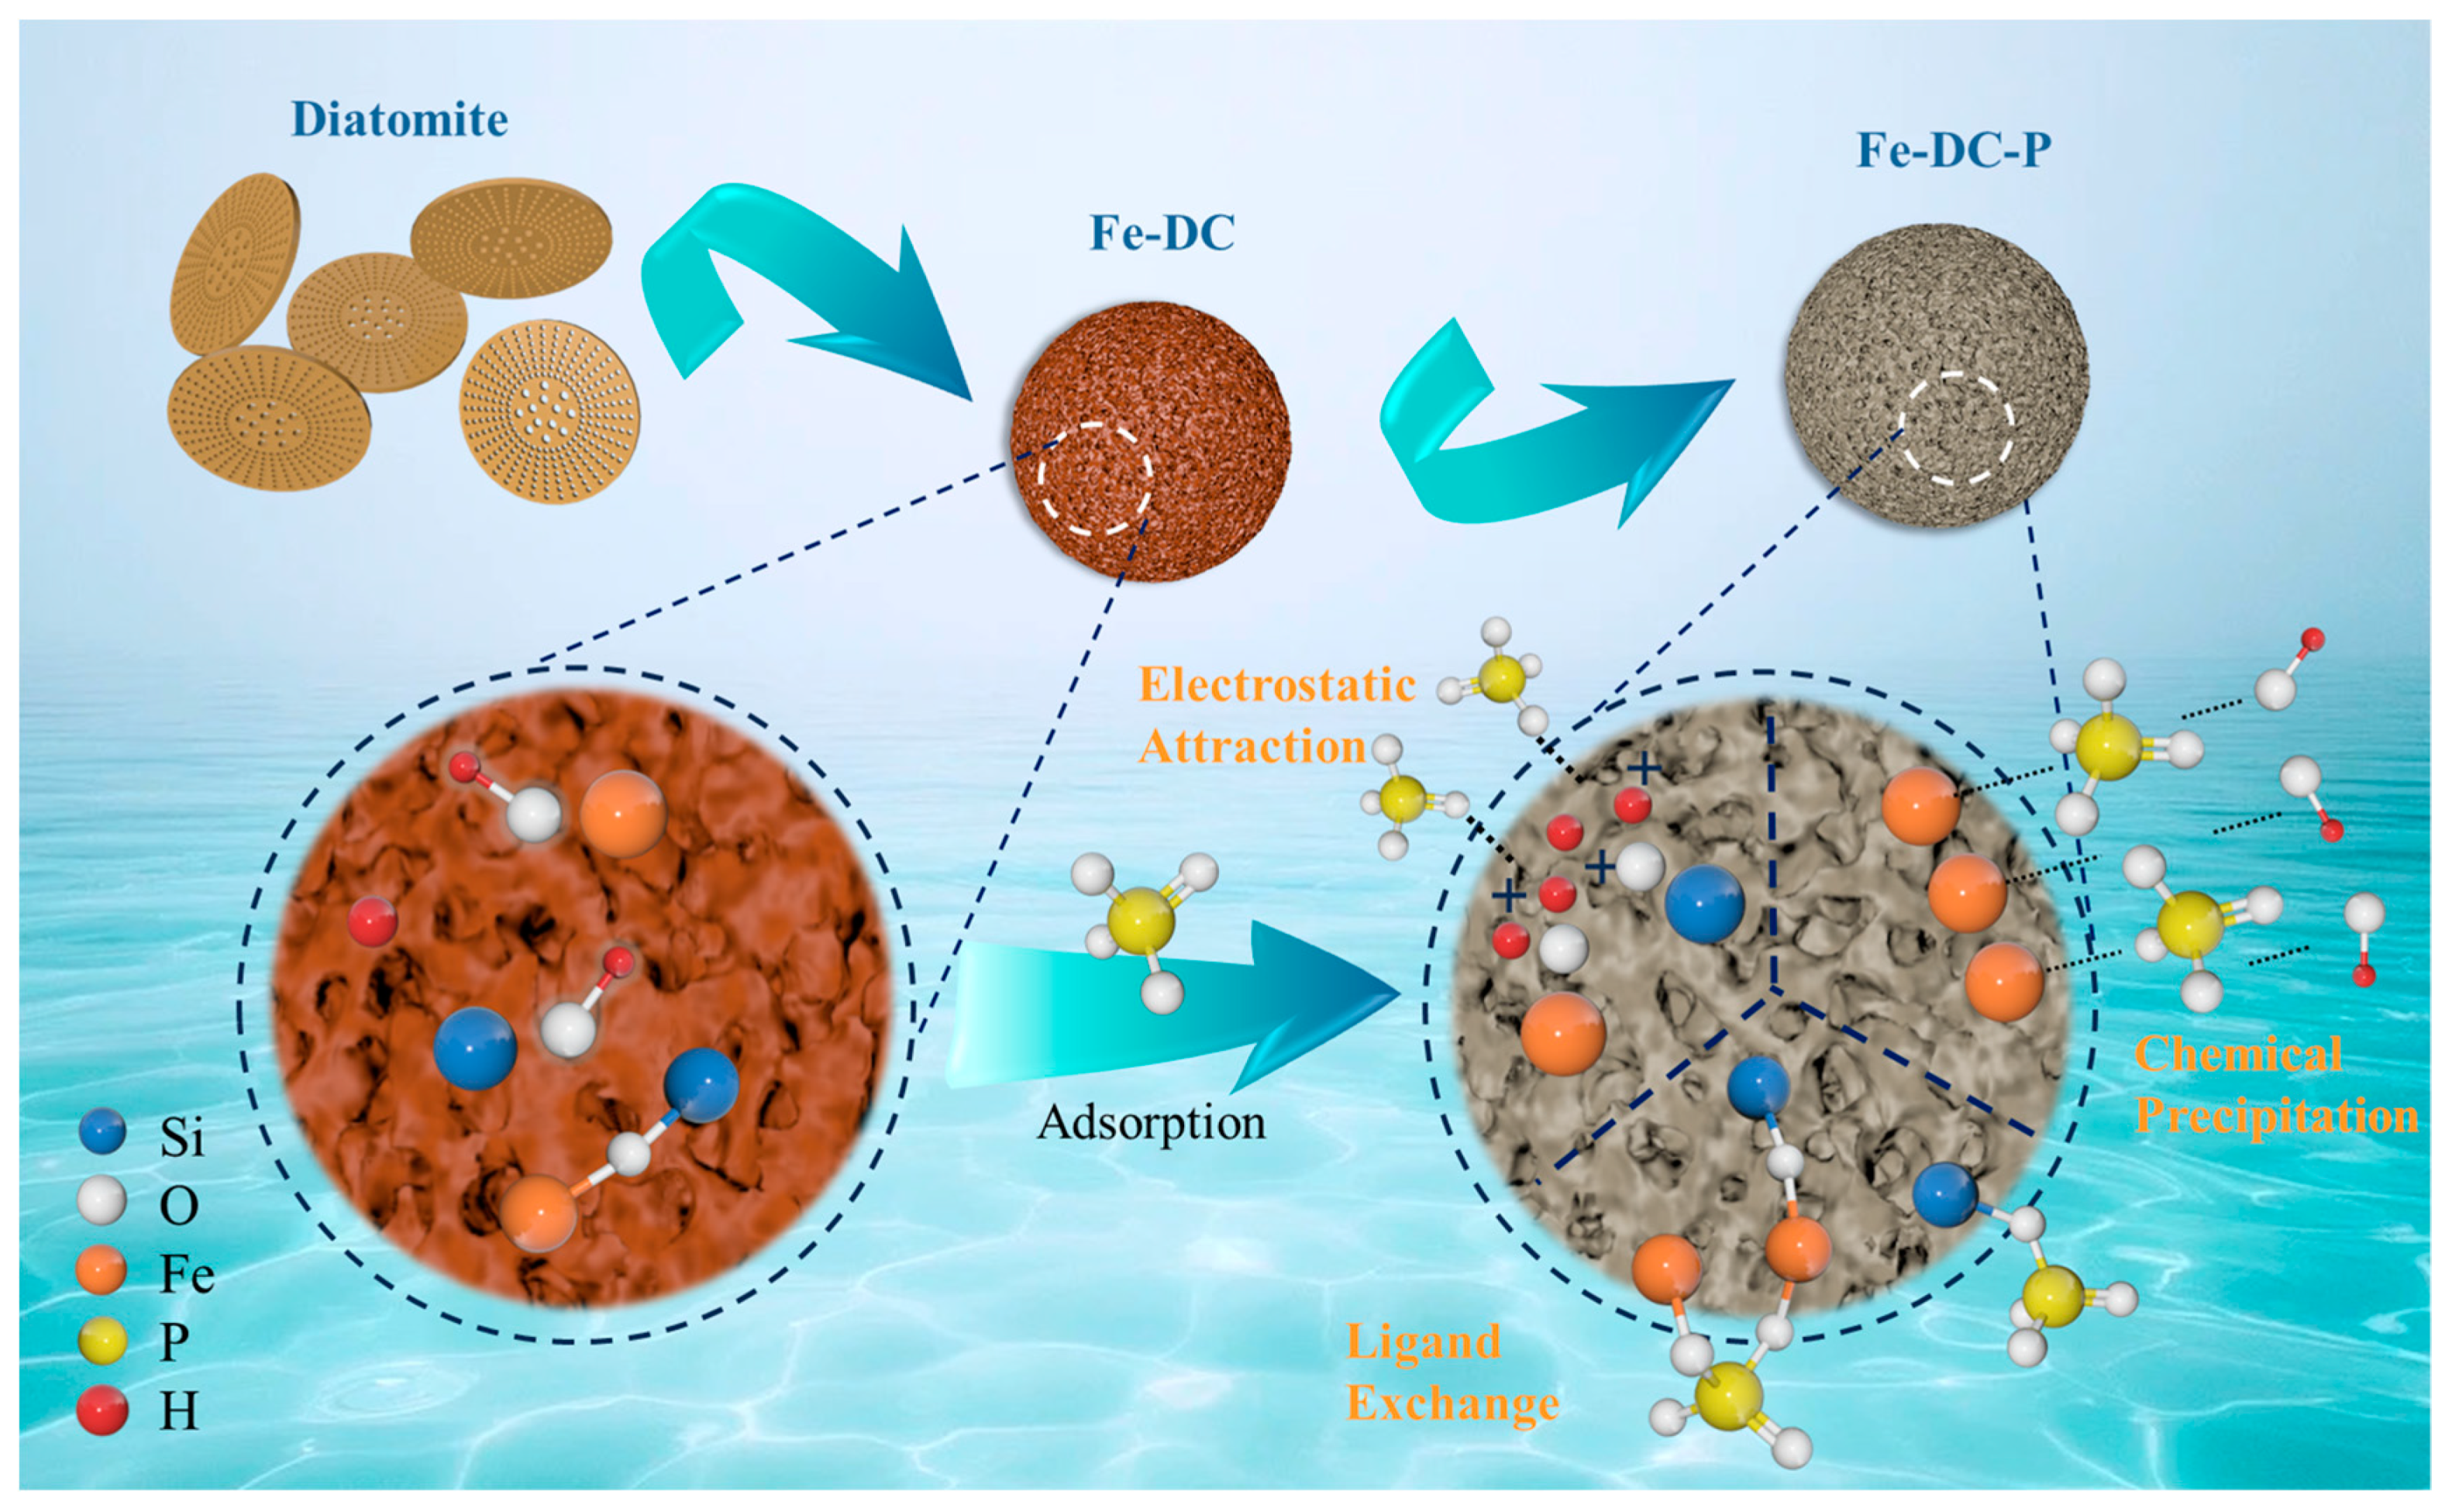
It is evident that the adsorption process of Fe-DC for P is closely related to the pH of the solution. Overall, the adsorption of P by Fe-DC with varying pH primarily relies on three mechanisms: the forces of electrostatic attraction, the process of ligand exchange, and the phenomenon of chemical precipitation, as illustrated in Figure 10. When the pH < 2.8, the surface of Fe-DC becomes protonated and positively charged, with the Fe-OH and Si-OH on the Fe-DC surface transforming into Fe-OH2+ and Si-OH2+ groups during protonation [47]. At this pH, the solution mainly contains H3PO4 and H2PO4− ions, which undergo electrostatic interactions with the Fe-DC surface [48], forming Si-OH2+·PO43− and Fe-OH2+·PO43−, leading to adsorption. When the pH > 2.8, due to the deprotonation of hydroxyl groups [49], the surface of Fe-DC becomes negatively charged, with Fe-OH2+ and Si-OH2+ groups transforming back into Fe-OH and Si-OH, respectively. As the pH increases and more OH− ions are present in the solution, the Fe-DC surface becomes more negatively charged, leading to repulsion between the Fe-DC surface and phosphate ions, yet the adsorption capacity increases. This is because Fe2+ and Fe3+ form hydroxides with the increasing OH−, and phosphates chemically precipitate with these hydroxides to form Fe4(PO4)3(OH)3 [50] and Fe4(PO4)2 [51], resulting in P adsorption. Additionally, ligand exchange occurs where Si-OH can cross-link with phosphates to form Si-O-P, and Fe-OH forms monodentate [52] and bidentate [53] complexes with phosphates. As pH increases, the ligand exchange process intensifies [54]. Therefore, chemical precipitation and ligand exchange are the reasons why Fe-DC’s adsorption capacity gradually increases between pH 2.8 and 9. However, as pH continues to rise, the rapid increase in OH− ions and the abundance of negative charges on the Fe-DC surface lead to competition between OH− and PO43− for the active sites on Fe-DC [55], resulting in a decrease in adsorption capacity, which is consistent with the trend observed in the figure.

Figure 10.
Mechanisms of phosphate adsorption onto Fe-enhanced diatomite-based ceramsite.
4. Conclusions
In this study, diatomite was used as the primary raw material to prepare diatomite-based ceramsite through a sintering process, followed by the hydrothermal synthesis method to load iron onto the ceramsite surface, resulting in modified diatomite-based ceramsite for phosphate adsorption in water. The experimental results indicated that under the conditions of a 7:1:1:1 ratio of diatomite, calcium carbonate, sodium bicarbonate, and activated carbon, a sintering temperature of 1150 °C, and an Fe/DC ratio of 0.75:1 with a hydrothermal reaction at 200 °C for 12 h, the modified diatomite-based ceramsite exhibited excellent phosphate adsorption capacity, reaching 4.06 mg P/g. Kinetic model analysis revealed that the adsorption process conformed to the pseudo-second-order kinetic model, indicating that the adsorption was primarily governed by chemisorption. Adsorption isotherm analysis showed that the adsorption behavior followed the Langmuir model, suggesting uniform monolayer adsorption with equivalent adsorption sites on the surface. Thermodynamic results confirmed the spontaneity of the adsorption process. Table S2 determines that the adsorption process mainly involved electrostatic attraction, ligand exchange, and chemical precipitation. The modified diatomite-based ceramsite demonstrated excellent phosphate removal performance across various initial phosphate concentrations and exhibited high phosphate adsorption efficiency over a wide pH range, indicating its adaptability and reliability under different environmental conditions.
In summary, this study successfully prepared and optimized modified diatomite-based ceramsite, demonstrating its significant potential for phosphate adsorption in water. While this study focused on the adsorption performance of Fe-DC under different pH conditions, the regeneration performance and long-term stability of the material were not investigated. Future research will address these aspects to provide a more comprehensive evaluation of Fe-DC’s potential for sustainable phosphorus removal from water. In conclusion, this research provides a foundation and direction for the further development and application of diatomite-based ceramsite in environmental remediation.
Supplementary Materials
The following supporting information can be downloaded at: https://www.mdpi.com/article/10.3390/w16162218/s1, Figure S1. Flow chart of preparation of Fe-DC and related physical drawings. Figure S2. SEM image and EDS spectra of Fe-DC-P and EDS element maps (Si, Fe, P). Table S1. Chemical composition of DE,Fe-DC and Fe-DC-P by XRF(Mass percentage m/m%). Table S2. Comparison of Phosphorus Adsorption Properties between Different Modified Ceramsites and Similar Materials. References [14,16,56,57,58,59,60] are cited in the Supplementary Materials.
Author Contributions
Z.C.: Conceptualization, formal analysis, data curation, writing—original draft preparation. Y.M.: Supervision, validation, visualization. X.Z.: Funding acquisition, methodology. P.S.: Funding acquisition, methodology, writing—review and editing, formal analysis, data curation, software. H.L.: Resources, supervision, conceptualization, project administration. All authors have read and agreed to the published version of the manuscript.
Funding
The study was supported by the Science and Technology Innovation Plan of Shanghai Science and Technology Commission (21ZR1425200, 19DZ2271100).
Data Availability Statement
The data that have been used are confidential.
Conflicts of Interest
The authors declare no conflicts of interest.
References
- Xiong, W.; Tong, J.; Yang, Z.; Zeng, G.; Zhou, Y.; Wang, D.; Song, P.; Xu, R.; Zhang, C.; Cheng, M. Adsorption of Phosphate from Aqueous Solution Using Iron-Zirconium Modified Activated Carbon Nanofiber: Performance and Mechanism. J. Colloid Interface Sci. 2017, 493, 17–23. [Google Scholar] [CrossRef] [PubMed]
- Awual, M.R.; Jyo, A.; Ihara, T.; Seko, N.; Tamada, M.; Lim, K.T. Enhanced Trace Phosphate Removal from Water by Zirconium(IV) Loaded Fibrous Adsorbent. Water Res. 2011, 45, 4592–4600. [Google Scholar] [CrossRef] [PubMed]
- Xu, H.; Paerl, H.W.; Qin, B.; Zhu, G.; Gao, G. Nitrogen and Phosphorus Inputs Control Phytoplankton Growth in Eutrophic Lake Taihu, China. Limnol. Oceanogr. 2010, 55, 420–432. [Google Scholar] [CrossRef]
- Miao, C.; Tang, Y.; Zhang, H.; Wu, Z.; Wang, X. Harmful Algae Blooms Removal from Fresh Water with Modified Vermiculite. Environ. Technol. 2014, 35, 340–346. [Google Scholar] [CrossRef] [PubMed]
- Kumar, P.S.; Korving, L.; Van Loosdrecht, M.C.M.; Witkamp, G.-J. Adsorption as a Technology to Achieve Ultra-Low Concentrations of Phosphate: Research Gaps and Economic Analysis. Water Res. X 2019, 4, 100029. [Google Scholar] [CrossRef] [PubMed]
- Hupfer, M.; Reitzel, K.; Kleeberg, A.; Lewandowski, J. Long-Term Efficiency of Lake Restoration by Chemical Phosphorus Precipitation: Scenario Analysis with a Phosphorus Balance Model. Water Res. 2016, 97, 153–161. [Google Scholar] [CrossRef]
- Bacelo, H.; Pintor, A.M.A.; Santos, S.C.R.; Boaventura, R.A.R.; Botelho, C.M.S. Performance and Prospects of Different Adsorbents for Phosphorus Uptake and Recovery from Water. Chem. Eng. J. 2020, 381, 122566. [Google Scholar] [CrossRef]
- Recepoglu, Y.K.; Goren, A.Y.; Orooji, Y.; Khataee, A. Carbonaceous Materials for Removal and Recovery of Phosphate Species: Limitations, Successes and Future Improvement. Chemosphere 2022, 287, 132177. [Google Scholar] [CrossRef] [PubMed]
- Feng, L.; Zhang, Q.; Ji, F.; Jiang, L.; Liu, C.; Shen, Q.; Liu, Q. Phosphate Removal Performances of Layered Double Hydroxides (LDH) Embedded Polyvinyl Alcohol/Lanthanum Alginate Hydrogels. Chem. Eng. J. 2022, 430, 132754. [Google Scholar] [CrossRef]
- Lu, J.; Liu, H.; Zhao, X.; Jefferson, W.; Cheng, F.; Qu, J. Phosphate Removal from Water Using Freshly Formed Fe–Mn Binary Oxide: Adsorption Behaviors and Mechanisms. Colloids Surf. A Physicochem. Eng. Asp. 2014, 455, 11–18. [Google Scholar] [CrossRef]
- Zhao, D.; Gao, Y.; Nie, S.; Liu, Z.; Wang, F.; Liu, P.; Hu, S. Self-Assembly of Honeycomb-like Calcium-Aluminum-Silicate-Hydrate (CASH) on Ceramsite Sand and Its Application in Photocatalysis. Chem. Eng. J. 2018, 344, 583–593. [Google Scholar] [CrossRef]
- Li, W.; Cai, G.; Luo, K.; Zhang, J.; Li, H.; Li, G.; Zhang, J.; Chen, X.; Xie, F. Synthesis of Magnesium-Modified Ceramsite from Iron Tailings as Efficient Adsorbent for Phosphorus Removal. Sep. Purif. Technol. 2023, 326, 124817. [Google Scholar] [CrossRef]
- Cheng, Y.; Li, J.; Qin, C.; Huang, Q. Template-Free Route to Fabricate Extra-Lightweight Ceramsite with a Single Large Pore Structure. Ceram. Int. 2023, 49, 36446–36457. [Google Scholar] [CrossRef]
- Shao, Q.; Zhang, Y.; Liu, Z.; Long, L.; Liu, Z.; Chen, Y.; Hu, X.-M.; Lu, M.; Huang, L.-Z. Phosphorus and Nitrogen Recovery from Wastewater by Ceramsite: Adsorption Mechanism, Plant Cultivation and Sustainability Analysis. Sci. Total Environ. 2022, 805, 150288. [Google Scholar] [CrossRef] [PubMed]
- Nie, J.; Wang, Q.; Gao, S.; Poon, C.S.; Zhou, Y.; Li, J. Novel Recycling of Incinerated Sewage Sludge Ash (ISSA) and Waste Bentonite as Ceramsite for Pb-Containing Wastewater Treatment: Performance and Mechanism. J. Environ. Manag. 2021, 288, 112382. [Google Scholar] [CrossRef] [PubMed]
- Yang, J.; Lu, Y.; Eltohamy, K.M.; Liu, B.; Xin, H.; He, S.; Fang, Y.; Liang, X. Zr/Zn Nanocomposites Modified Ceramsite Enhances Phosphorus Removal from Agricultural Drainage Water. Chemosphere 2023, 340, 139852. [Google Scholar] [CrossRef] [PubMed]
- Li, P.; Luo, S.; Zhang, L.; Wang, Q.; Huang, X.; Zhang, Y.; Liu, X.; Liang, J.; Duan, X. Study on Preparation and Performance of Iron Tailings-Based Porous Ceramsite Filter Materials for Water Treatment. Sep. Purif. Technol. 2021, 276, 119380. [Google Scholar] [CrossRef]
- Toster, J.; Kusumawardani, I.; Eroglu, E.; Iyer, K.S.; Rosei, F.; Raston, C.L. Superparamagnetic Imposed Diatom Frustules for the Effective Removal of Phosphates. Green Chem. 2014, 16, 82–85. [Google Scholar] [CrossRef]
- Sriram, G.; Kigga, M.; Uthappa, U.T.; Rego, R.M.; Thendral, V.; Kumeria, T.; Jung, H.-Y.; Kurkuri, M.D. Naturally Available Diatomite and Their Surface Modification for the Removal of Hazardous Dye and Metal Ions: A Review. Adv. Colloid Interface Sci. 2020, 282, 102198. [Google Scholar] [CrossRef]
- Chanéac, C.; Tronc, E.; Jolivet, J.P. Magnetic Iron Oxide–Silica Nanocomposites. Synthesis and Characterization. J. Mater. Chem. 1996, 6, 1905–1911. [Google Scholar] [CrossRef]
- Zhao, P.; Sun, N.; Liu, X.; Chen, Z.; Li, Y.; Hu, T.; Xue, X.; Zhang, S.; Sheetah, G.; Xie, Y. Diatomite-Based Adsorbent Decorated with Fe3O4 Nanoparticles for the Removal of Hazardous Metal Ions. ACS Appl. Nano Mater. 2023, 6, 8958–8970. [Google Scholar] [CrossRef]
- Wang, J.; Zhang, G.; Qiao, S.; Zhou, J. Magnetic Fe0/Iron Oxide-Coated Diatomite as a Highly Efficient Adsorbent for Recovering Phosphorus from Water. Chem. Eng. J. 2021, 412, 128696. [Google Scholar] [CrossRef]
- Sun, B.; Yang, Q.; Zhu, J.; Shao, T.; Yang, Y.; Hou, C.; Li, G. Pore Size Distributions and Pore Multifractal Characteristics of Medium and Low-Rank Coals. Sci. Rep. 2020, 10, 22353. [Google Scholar] [CrossRef] [PubMed]
- Li, R.; Wang, J.J.; Zhang, Z.; Awasthi, M.K.; Du, D.; Dang, P.; Huang, Q.; Zhang, Y.; Wang, L. Recovery of Phosphate and Dissolved Organic Matter from Aqueous Solution Using a Novel CaO-MgO Hybrid Carbon Composite and Its Feasibility in Phosphorus Recycling. Sci. Total Environ. 2018, 642, 526–536. [Google Scholar] [CrossRef] [PubMed]
- Zhang, Y.; Guo, X.; Wu, F.; Yao, Y.; Yuan, Y.; Bi, X.; Luo, X.; Shahbazian-Yassar, R.; Zhang, C.; Amine, K. Mesocarbon Microbead Carbon-Supported Magnesium Hydroxide Nanoparticles: Turning Spent Li-Ion Battery Anode into a Highly Efficient Phosphate Adsorbent for Wastewater Treatment. ACS Appl. Mater. Interfaces 2016, 8, 21315–21325. [Google Scholar] [CrossRef] [PubMed]
- Gao, R.; Gu, Y.; Li, G.; Sun, Q. Study on Preparation and Adsorption Properties of Diatomite-Based Porous Ceramsite. Nat. Environ. Pollut. Technol. 2017, 16, 1283–1286. [Google Scholar]
- Xiong, W.; Peng, J. Development and Characterization of Ferrihydrite-Modified Diatomite as a Phosphorus Adsorbent. Water Res. 2008, 42, 4869–4877. [Google Scholar] [CrossRef] [PubMed]
- Chen, Y.; Wang, N.; An, S.; Cai, C.; Peng, J.; Xie, M.; Peng, J.; Song, X. Synthesis of Novel Hierarchical Porous Zeolitization Ceramsite from Industrial Waste as Efficient Adsorbent for Separation of Ammonia Nitrogen. Sep. Purif. Technol. 2022, 297, 121418. [Google Scholar] [CrossRef]
- Jiang, W.; Jiang, Y.; Li, P.; Liu, D.; Ren, Y.; Li, D.; Liu, Z.; Chen, Y.; Ye, Y. Reuse of Phosphogypsum and Phosphorus Ore Flotation Tailings as Adsorbent: The Adsorption Performance and Mechanism of Phosphate. J. Phys. Chem. Solids 2023, 178, 111313. [Google Scholar] [CrossRef]
- Debnath, S.; Das, R. Strong Adsorption of CV Dye by Ni Ferrite Nanoparticles for Waste Water Purification: Fits Well the Pseudo Second Order Kinetic and Freundlich Isotherm Model. Ceram. Int. 2023, 49, 16199–16215. [Google Scholar] [CrossRef]
- Guo, T.; Gu, H.; Ma, S.; Wang, N. Increasing Phosphate Sorption on Barium Slag by Adding Phosphogypsum for Non-Hazardous Treatment. J. Environ. Manag. 2020, 270, 110823. [Google Scholar] [CrossRef] [PubMed]
- Kizito, S.; Wu, S.; Kirui, W.K.; Lei, M.; Lu, Q.; Bah, H.; Dong, R. Evaluation of Slow Pyrolyzed Wood and Rice Husks Biochar for Adsorption of Ammonium Nitrogen from Piggery Manure Anaerobic Digestate Slurry. Sci. Total Environ. 2015, 505, 102–112. [Google Scholar] [CrossRef] [PubMed]
- Wu, Z.; Zhang, X.; Zhou, C.; Pang, J.; Zhang, P. Adsorption Neutralization Model and Floc Growth Kinetics Properties of Aluminum Coagulants Based on Sips and Boltzmann Equations. ACS Appl. Mater. Interfaces 2017, 9, 5992–5999. [Google Scholar] [CrossRef] [PubMed]
- Zhang, B.; Chen, N.; Feng, C.; Zhang, Z. Adsorption for Phosphate by Crosslinked/Non-Crosslinked-Chitosan-Fe (III) Complex Sorbents: Characteristic and Mechanism. Chem. Eng. J. 2018, 353, 361–372. [Google Scholar] [CrossRef]
- Ren, Y.; Wei, X.; Zhang, M. Adsorption Character for Removal Cu (II) by Magnetic Cu (II) Ion Imprinted Composite Adsorbent. J. Hazard. Mater. 2008, 158, 14–22. [Google Scholar] [CrossRef] [PubMed]
- Nagoya, S.; Nakamichi, S.; Kawase, Y. Mechanisms of Phosphate Removal from Aqueous Solution by Zero-Valent Iron: A Novel Kinetic Model for Electrostatic Adsorption, Surface Complexation and Precipitation of Phosphate under Oxic Conditions. Sep. Purif. Technol. 2019, 218, 120–129. [Google Scholar] [CrossRef]
- Zhao, J.; Yang, X.; Liang, G.; Wang, Z.; Li, S.; Wang, Z.; Xie, X. Effective Removal of Two Fluoroquinolone Antibiotics by PEG-4000 Stabilized Nanoscale Zero-Valent Iron Supported onto Zeolite (PZ-NZVI). Sci. Total Environ. 2020, 710, 136289. [Google Scholar] [CrossRef] [PubMed]
- Kandiah, M.; Usseglio, S.; Svelle, S.; Olsbye, U.; Lillerud, K.P.; Tilset, M. Post-Synthetic Modification of the Metal–Organic Framework Compound UiO-66. J. Mater. Chem. 2010, 20, 9848–9851. [Google Scholar] [CrossRef]
- Kwaśniak-Kominek, M.; Matusik, J.; Bajda, T.; Manecki, M.; Rakovan, J.; Marchlewski, T.; Szala, B. Fourier Transform Infrared Spectroscopic Study of Hydroxylpyromorphite Pb10(PO4)6OH2–Hydroxylmimetite Pb10(AsO4)6(OH)2 Solid Solution Series. Polyhedron 2015, 99, 103–111. [Google Scholar] [CrossRef]
- Štandeker, S.; Novak, Z.; Knez, Ž. Adsorption of Toxic Organic Compounds from Water with Hydrophobic Silica Aerogels. J. Colloid Interface Sci. 2007, 310, 362–368. [Google Scholar] [CrossRef]
- Paraknowitsch, J.P.; Zhang, Y.; Wienert, B.; Thomas, A. Nitrogen-and Phosphorus-Co-Doped Carbons with Tunable Enhanced Surface Areas Promoted by the Doping Additives. Chem. Commun. 2013, 49, 1208–1210. [Google Scholar] [CrossRef] [PubMed]
- Xie, Q.; Li, Y.; Lv, Z.; Zhou, H.; Yang, X.; Chen, J.; Guo, H. Effective Adsorption and Removal of Phosphate from Aqueous Solutions and Eutrophic Water by Fe-Based MOFs of MIL-101. Sci. Rep. 2017, 7, 3316. [Google Scholar] [CrossRef] [PubMed]
- Zhou, K.; Wu, B.; Su, L.; Xin, W.; Chai, X. Enhanced Phosphate Removal Using Nanostructured Hydrated Ferric-Zirconium Binary Oxide Confined in a Polymeric Anion Exchanger. Chem. Eng. J. 2018, 345, 640–647. [Google Scholar] [CrossRef]
- Wu, K.C.-W.; Yamauchi, Y.; Hong, C.-Y.; Yang, Y.-H.; Liang, Y.-H.; Funatsu, T.; Tsunoda, M. Biocompatible, Surface Functionalized Mesoporous Titania Nanoparticles for Intracellular Imaging and Anticancer Drug Delivery. Chem. Commun. 2011, 47, 5232–5234. [Google Scholar] [CrossRef] [PubMed]
- Mäkie, P.; Westin, G.; Persson, P.; Österlund, L. Adsorption of Trimethyl Phosphate on Maghemite, Hematite, and Goethite Nanoparticles. J. Phys. Chem. A 2011, 115, 8948–8959. [Google Scholar] [CrossRef] [PubMed]
- Wang, H.; Lin, X.; Huang, Y.; Bian, W.; Ma, L. Two Advanced Oxidation Pathways of Modified Iron-Shavings Participation in Ozonation. Sep. Purif. Technol. 2020, 244, 116838. [Google Scholar] [CrossRef]
- Cui, G.; Liu, M.; Chen, Y.; Zhang, W.; Zhao, J. Synthesis of a Ferric Hydroxide-Coated Cellulose Nanofiber Hybrid for Effective Removal of Phosphate from Wastewater. Carbohydr. Polym. 2016, 154, 40–47. [Google Scholar] [CrossRef] [PubMed]
- Li, L.; Zhu, Z.; Ni, J.; Zuo, X. Sustainable Phosphorus Adsorption and Recovery from Aqueous Solution by a Novel Recyclable Ca-PAC-CTS. Sci. Total Environ. 2023, 897, 165444. [Google Scholar] [CrossRef] [PubMed]
- Pérez, S.; Muñoz-Saldaña, J.; Garcia-Nunez, J.A.; Acelas, N.; Flórez, E. Unraveling the Ca–P Species Produced over the Time during Phosphorus Removal from Aqueous Solution Using Biocomposite of Eggshell-Palm Mesocarp Fiber. Chemosphere 2022, 287, 132333. [Google Scholar] [CrossRef]
- Chen, J.; Yan, L.; Yu, H.; Li, S.; Qin, L.; Liu, G.; Li, Y.; Du, B. Efficient Removal of Phosphate by Facile Prepared Magnetic Diatomite and Illite Clay from Aqueous Solution. Chem. Eng. J. 2016, 287, 162–172. [Google Scholar] [CrossRef]
- Xue, P.; Hou, R.; Fu, Q.; Li, T.; Wang, J.; Zhou, W.; Shen, W.; Su, Z.; Wang, Y. Potentially Migrating and Residual Components of Biochar: Effects on Phosphorus Adsorption Performance and Storage Capacity of Black Soil. Chemosphere 2023, 336, 139250. [Google Scholar] [CrossRef] [PubMed]
- Wang, W.; Zhou, J.; Wei, D.; Wan, H.; Zheng, S.; Xu, Z.; Zhu, D. ZrO2-Functionalized Magnetic Mesoporous SiO2 as Effective Phosphate Adsorbent. J. Colloid Interface Sci. 2013, 407, 442–449. [Google Scholar] [CrossRef] [PubMed]
- Du, X.; Han, Q.; Li, J.; Li, H. The Behavior of Phosphate Adsorption and Its Reactions on the Surfaces of Fe–Mn Oxide Adsorbent. J. Taiwan Inst. Chem. Eng. 2017, 76, 167–175. [Google Scholar] [CrossRef]
- Wan, J.; Jiang, X.; Zhang, T.C.; Hu, J.; Richter-Egger, D.; Feng, X.; Zhou, A.; Tao, T. The Activated Iron System for Phosphorus Recovery in Aqueous Environments. Chemosphere 2018, 196, 153–160. [Google Scholar] [CrossRef] [PubMed]
- Zhang, H.; Elskens, M.; Chen, G.; Chou, L. Phosphate Adsorption on Hydrous Ferric Oxide (HFO) at Different Salinities and pHs. Chemosphere 2019, 225, 352–359. [Google Scholar] [CrossRef] [PubMed]
- Gao, L.; Zhang, C.; Sun, Y.; Ma, C. Effect and Mechanism of Modification Treatment on Ammonium and Phosphate Removal by Ferric-Modified Zeolite. Environ. Technol. 2019, 40, 1959–1968. [Google Scholar] [CrossRef] [PubMed]
- Xu, Q.; Li, W.; Ma, L.; Cao, D.; Owens, G.; Chen, Z. Simultaneous Removal of Ammonia and Phosphate Using Green Synthesized Iron Oxide Nanoparticles Dispersed onto Zeolite. Sci. Total Environ. 2020, 703, 135002. [Google Scholar] [CrossRef] [PubMed]
- Zhang, X.; Gao, J.; Lei, Y.; Xu, Z.; Xia, S.; Jiang, Y.; Cheng, J. Phosphorus Removal and Mechanisms by Zn-Layered Double Hydroxide (Zn-LDHs)-Modified Zeolite Substrates in a Constructed Rapid Infiltration System. RSC Adv. 2019, 9, 39811–39823. [Google Scholar] [CrossRef] [PubMed]
- Wu, L.; Liu, C.; Hu, Y.; Tan, B.; He, Y.; Li, N. Dephosphorization Using Ceramsites Modified by Coprecipitation with FeSo4 and KMnO4 and High-Temperature Combustion. J. Water Process Eng. 2020, 34, 101162. [Google Scholar] [CrossRef]
- Li, N.; Lai, B.; Ding, L.; Li, J.; Liu, C.; Wu, L. Synchronous Algae and Phosphorus Removal by Ceramsite@Fe2O3 (FC) via Taking the Algae as Crystal Nuclei of Hydroxylapatite. Chem. Eng. J. 2021, 426, 130748. [Google Scholar] [CrossRef]
Disclaimer/Publisher’s Note: The statements, opinions and data contained in all publications are solely those of the individual author(s) and contributor(s) and not of MDPI and/or the editor(s). MDPI and/or the editor(s) disclaim responsibility for any injury to people or property resulting from any ideas, methods, instructions or products referred to in the content. |
© 2024 by the authors. Licensee MDPI, Basel, Switzerland. This article is an open access article distributed under the terms and conditions of the Creative Commons Attribution (CC BY) license (https://creativecommons.org/licenses/by/4.0/).