Integration of Building Age into Flood Hazard Mapping: A Case Study of Al Ain City, United Arab Emirates
Abstract
:1. Introduction
2. Materials and Methods
2.1. Study Area
2.2. Flood-Hazard Factors and Mapping
2.3. Score and Weight Assignment
3. Results
Building Age Extraction
4. Discussion
5. Conclusions
6. Recommendations
- There is a need to document flood events spatially and temporally, both from rainfall and from infrastructure failure. Moreover, predictive analysis needs to be improved to assess areas that could be prone to flooding by adding more accurate data coupled with hydrological models.
- Soft solutions: Implementing effective planning rules and enhancing public awareness can play a crucial role in addressing the issue of flooding potential. By establishing comprehensive planning regulations, including zoning and land-management guidelines, Al Ain can ensure sustainable development and minimize the impact of flooding.
- Hard solutions: Al Ain has already constructed several dams to harness rainfall, and further dams can be considered as land use alters the topography. Expansion of green areas and maintenance of efficient drainage systems are also important.
- In assessing building resilience and establishing construction guidelines, it is essential to allow zoning planning and to establish more stringent requirements for issuing building permits. This will ensure that the structures can withstand potential disasters. Educating people about the hazard levels of their structures will provide valuable insights into their structural vulnerabilities and encourage them to implement the necessary improvements to make their buildings more resilient and better prepared for potential hazards [18].
- Assessing the effectiveness of property-level resistance and resilience measures can reduce loss and repair time due to flooding. For example, property owners can retrofit or demolish old buildings and adjust building heights in flood-vulnerable areas [65]. Develop a comprehensive database about buildings, including building age, and use the database in flood hazard and risk mapping.
- Cooperation between various stakeholders, such as central and local governments and the private sector, is needed. Future research can use machine learning models and satellite-derived rainfall data to predict flash floods in Al Ain [66].
Author Contributions
Funding
Data Availability Statement
Acknowledgments
Conflicts of Interest
References
- UNDRR Hazard. Available online: https://www.undrr.org/terminology/hazard (accessed on 28 July 2024).
- UNISDR. Flood Hazard and Risk Assessment. 2017. Available online: https://www.unisdr.org/files/52828_04floodhazardandriskassessment.pdf (accessed on 22 June 2024).
- Asare-Kyei, D.; Forkuor, G.; Venus, V. Modeling Flood Hazard Zones at the Sub-District Level with the Rational Model Integrated with GIS and Remote Sensing Approaches. Water 2015, 7, 3531–3564. [Google Scholar] [CrossRef]
- Dung, N.B.; Long, N.Q.; An, D.T.; Minh, D.T. Multi-Geospatial Flood Hazard Modelling for a Large and Complex River Basin with Data Sparsity: A Case Study of the Lam River Basin, Vietnam. Earth Syst. Environ. 2022, 6, 715–731. [Google Scholar] [CrossRef]
- Ogania, J.L.; Puno, G.R.; Alivio, M.B.T.; Taylaran, J.M.G. Effect of Digital Elevation Model’s Resolution in Producing Flood Hazard Maps. Glob. J. Environ. Sci. Manag. 2019, 5, 95–106. [Google Scholar] [CrossRef]
- Hamlat, A.; Meharzi, S.; Guidoum, A.; Sekkoum, M.; Mokhtari, Y.; Kadri, C.B. GIS-Based Multi-Criteria Analysis for Flood Hazard Areas Mapping of M’zab Wadi Basin (Ghardaia, North-Central Algeria). Arid. Land Res. Manag. 2023, 38, 1–25. [Google Scholar] [CrossRef]
- Papaioannou, G.; Vasiliades, L.; Loukas, A. Multi-Criteria Analysis Framework for Potential Flood Prone Areas Mapping. Water Resour. Manag. 2015, 29, 399–418. [Google Scholar] [CrossRef]
- Allafta, H.; Opp, C. GIS-Based Multi-Criteria Analysis for Flood Prone Areas Mapping in the Trans-Boundary Shatt Al-Arab Basin, Iraq-Iran. Geomat. Nat. Hazards Risk 2021, 12, 2087–2116. [Google Scholar] [CrossRef]
- Marco, J.B. Flood Risk Mapping. In Coping with Floods; Springer: Dordrecht, The Netherlands, 1994; pp. 353–373. [Google Scholar]
- Barredo, J.I.; de Roo, A.; Lavalle, C. Flood Risk Mapping at European Scale. Water Sci. Technol. 2007, 56, 11–17. [Google Scholar] [CrossRef]
- Santos, P.P.; Pereira, S.; Zêzere, J.L.; Tavares, A.O.; Reis, E.; Garcia, R.A.C.; Oliveira, S.C. A Comprehensive Approach to Understanding Flood Risk Drivers at the Municipal Level. J. Environ. Manag. 2020, 260, 110127. [Google Scholar] [CrossRef]
- Saha, A.K.; Agrawal, S. Mapping and Assessment of Flood Risk in Prayagraj District, India: A GIS and Remote Sensing Study. Nanotechnol. Environ. Eng. 2020, 5, 1–18. [Google Scholar] [CrossRef]
- Hu, S.; Cheng, X.; Zhou, D.; Zhang, H. GIS-Based Flood Risk Assessment in Suburban Areas: A Case Study of the Fangshan District, Beijing. Nat. Hazards 2017, 87, 1525–1543. [Google Scholar] [CrossRef]
- Torab, M.M. Flood-Hazard Mapping of The Hafit Mountain Slopes—The Eastern of United Arab Emirates (U.A.E.). Bull. Soc. Cartogr. 2002, 36, 39–44. [Google Scholar]
- Elhakeem, M. Flood Prediction at The Northern Region of UAE. MATEC Web Conf. 2017, 103, 04004. [Google Scholar] [CrossRef]
- Pakam, S.; Ahmed, A.; Ebraheem, A.A.; Sherif, M.; Mirza, S.B.; Ridouane, F.L.; Sefelnasr, A. Risk Assessment and Mapping of Flash Flood Vulnerable Zones in Arid Region, Fujairah City, UAE-Using Remote Sensing and GIS-Based Analysis. Water 2023, 15, 2802. [Google Scholar] [CrossRef]
- Komolafe, A.A.; Herath, S.; Avtar, R. Establishment of Detailed Loss Functions for the Urban Flood Risk Assessment in Chao Phraya River Basin, Thailand. Geomat. Nat. Hazards Risk 2019, 10, 633–650. [Google Scholar] [CrossRef]
- Lahmer, T.; Harirchian, E.; Novelli, V.; Gacu, J.G.; Monjardin, C.E.F.; Lawrence, K.; De Jesus, M.; Senoro, D.B. GIS-Based Risk Assessment of Structure Attributes in Flood Zones of Odiongan, Romblon, Philippines. Buildings 2023, 13, 506. [Google Scholar] [CrossRef]
- Darabi, H.; Choubin, B.; Rahmati, O.; Torabi Haghighi, A.; Pradhan, B.; Kløve, B. Urban Flood Risk Mapping Using the GARP and QUEST Models: A Comparative Study of Machine Learning Techniques. J. Hydrol. 2019, 569, 142–154. [Google Scholar] [CrossRef]
- Yu, Y.; Xu, H.; Wang, X.; Wen, J.; Du, S.; Zhang, M.; Ke, Q. Residents’ Willingness to Participate in Green Infrastructure: Spatial Differences and Influence Factors in Shanghai, China. Sustainability 2019, 11, 5396. [Google Scholar] [CrossRef]
- GFDRR. 2010 Haiti Earthquake Final Report. Available online: https://www.gfdrr.org/sites/default/files/publication/2010haitiearthquakepost-disasterbuildingdamageassessment.pdf (accessed on 26 July 2024).
- Garbasevschi, O.-M. Large Scale Building Age Classification for Urban Energy Demand Estimation. Master’s Thesis, Delft University of Technology, Delft, The Netherlands, 2010. [Google Scholar]
- Aksoezen, M.; Daniel, M.; Hassler, U.; Kohler, N. Building Age as an Indicator for Energy Consumption. Energy Build. 2015, 87, 74–86. [Google Scholar] [CrossRef]
- Tooke, T.R.; Coops, N.C.; Webster, J. Predicting Building Ages from LiDAR Data with Random Forests for Building Energy Modeling. Energy Build. 2014, 68, 603–610. [Google Scholar] [CrossRef]
- Burnham, J.F. Scopus Database: A Review. Biomed. Digit. Libr. 2006, 3, 1. [Google Scholar] [CrossRef]
- NCEMA. National Emergency Crisis and Disaster Management Authority. 2022. Available online: https://www.ncema.gov.ae/ (accessed on 20 May 2024).
- Al-Shamsei, M.H. Drinage Basins and Flash Flood Hazards in Al Ain Area, United Arab Emirates. Master’s Thesis, United Arab Emirates University, Al Ain, United Arab Emirates, 1993. [Google Scholar]
- WAM. UAE Witnesses Largest Rainfall in 75 Years. Available online: https://www.wam.ae/en/article/13vbuq9-uae-witnesses-largest-rainfall-over-past-years (accessed on 31 July 2024).
- Elmahdy, S.; Ali, T.; Mohamed, M. Flash Flood Susceptibility Modeling and Magnitude Index Using Machine Learning and Geohydrological Models: A Modified Hybrid Approach. Remote Sens. 2020, 12, 2695. [Google Scholar] [CrossRef]
- Terry, J.P.; Al Ruheili, A.; Almarzooqi, M.A.; Almheiri, R.Y.; Alshehhi, A.K. The Rain Deluge and Flash Floods of Summer 2022 in the United Arab Emirates: Causes, Analysis and Perspectives on Flood-Risk Reduction. J. Arid. Environ. 2023, 215, 105013. [Google Scholar] [CrossRef]
- Gulf News Video: Heavy Rains and Hail Cause Trees to Fall in Al Ain, Traffic Disruptions Ensue. Available online: https://gulfnews.com/uae/weather/video-heavy-rains-and-hail-cause-trees-to-fall-in-al-ain-traffic-disruptions-ensue-1.1691159537359 (accessed on 7 August 2023).
- Kumar, A. Heavy Rains, Hail, Flood Lash Al Ain. Available online: https://www.khaleejtimes.com/uae/video-heavy-rains-hail-flood-lash-al-ain (accessed on 26 July 2024).
- Campbell, M. Al Ain Residents Struggle to Manage Flooding Water as Heavy Rains Hit. Available online: https://www.thenationalnews.com/uae/al-ain-residents-struggle-to-manageflooding-water-as-heavy-rains-hit-1.156224 (accessed on 10 July 2023).
- Arabianbusines Work Starts on $32 m Plan to Reduce Al Ain Flash Flooding Risk. Available online: https://www.arabianbusiness.com/gcc/uae/437749-work-starts-on-32m-plan-to-reduce-al-ain-flash-flooding-risk (accessed on 31 July 2024).
- ESA Sentinel-2-Missions-Sentinel Online-Sentinel Online. Available online: https://sentinels.copernicus.eu/web/sentinel/missions/sentinel-2 (accessed on 25 October 2022).
- EROS; USGS; EROS. Archive-Digital Elevation-Shuttle Radar Topography Mission (SRTM) 1 Arc-Second Global. Available online: https://www.usgs.gov/centers/eros/science/usgs-eros-archive-digital-elevation-shuttle-radar-topography-mission-srtm-1 (accessed on 14 August 2023).
- USGS. Landsat 8|U.S. Geological Survey. Available online: https://www.usgs.gov/landsat-missions/landsat-8 (accessed on 26 October 2022).
- FAO. Harmonized World Soil Database v 1.2. Available online: https://www.fao.org/soils-portal/data-hub/soil-maps-and-databases/harmonized-world-soil-database-v12/en/ (accessed on 14 August 2023).
- Sheykhmousa, M.; Mahdianpari, M.; Ghanbari, H.; Mohammadimanesh, F.; Ghamisi, P.; Homayouni, S. Support Vector Machine Versus Random Forest for Remote Sensing Image Classification: A Meta-Analysis and Systematic Review. IEEE J. Sel. Top. Appl. Earth Obs. Remote Sens. 2020, 13, 6308–6325. [Google Scholar] [CrossRef]
- Weiss, A.D. Topographic position and landforms analysis. Presented at the ESRI Users Conference, SanDiego, CA, USA, 9–13 July 2001. [Google Scholar]
- Jenness, J.S. Calculating Landscape Surface Area from Digital Elevation Models. Wildl. Soc. Bull. 2004, 32, 829–839. [Google Scholar] [CrossRef]
- Al-Husban, Y. Landforms Classification of Wadi Al-Mujib Basin in Jordan, Based on Topographic Position Index (TPI), and the Production of a Flood Forecasting Map. Human. Social. Sci. 2019, 46, 44–55. [Google Scholar]
- Kopecký, M.; Macek, M.; Wild, J. Topographic Wetness Index Calculation Guidelines Based on Measured Soil Moisture and Plant Species Composition. Sci. Total Environ. 2021, 757, 143785. [Google Scholar] [CrossRef]
- Chen, J.; Yang, S.T.; Li, H.W.; Zhang, B.; Lv, J.R. Research on Geographical Environment Unit Division Based on the Method of Natural Breaks (Jenks). Int. Arch. Photogramm. Remote Sens. Spat. Inf. Sci. 2013, XL-4/W3, 47–50. [Google Scholar] [CrossRef]
- USDA. Urban Hydrology for Small Watersheds. 1986. Available online: https://www.nrc.gov/docs/ML1421/ML14219A437.pdf (accessed on 1 July 2024).
- Zhan, X.; Huang, M.L. ArcCN-Runoff: An ArcGIS Tool for Generating Curve Number and Runoff Maps. Environ. Model. Softw. 2004, 19, 875–879. [Google Scholar] [CrossRef]
- Periyasamy, P.; Yagoub, M.M.; Sudalaimuthu, M. Flood Vulnerable Zones in the Rural Blocks of Thiruvallur District, South India. Geoenviron. Disasters 2018, 5, 21. [Google Scholar] [CrossRef]
- Tesfaldet, Y.T.; Puttiwongrak, A. Seasonal Groundwater Recharge Characterization Using Time-Lapse Electrical Resistivity Tomography in the Thepkasattri Watershed on Phuket Island, Thailand. Hydrology 2019, 6, 36. [Google Scholar] [CrossRef]
- Tesfaldet, Y.T.; Puttiwongrak, A.; Arpornthip, T. Spatial and Temporal Variation of Groundwater Recharge in Shallow Aquifer in the Thepkasattri of Phuket, Thailand. J. Groundw. Sci. Eng. 2020, 8, 10–19. [Google Scholar] [CrossRef]
- Nigusse, A.G.; Adhanom, O.G. Flood Hazard and Flood Risk Vulnerability Mapping Using Geo-Spatial and MCDA around Adigrat, Tigray Region, Northern Ethiopia. Momona Ethiop. J. Sci. 2019, 11, 90. [Google Scholar] [CrossRef]
- Hazarika, N.; Barman, D.; Das, A.K.; Sarma, A.K.; Borah, S.B. Assessing and Mapping Flood Hazard, Vulnerability and Risk in the Upper Brahmaputra River Valley Using Stakeholders’ Knowledge and Multicriteria Evaluation (MCE). J. Flood Risk Manag. 2018, 11, S700–S716. [Google Scholar] [CrossRef]
- Alaigba, D.; Orewole, M.; Oviasu, O. Riparian Corridors Encroachment and Flood Risk Assessment in Ile-Ife: A GIS Perspective. Open Trans. Geosci. 2015, 2015, 17–32. [Google Scholar] [CrossRef]
- MMarin-Ferrer, M.; Luca, V.; Karmen, P. Index for Risk Management Inform Concept and Methodology Report—Version 2017; European Union Publications: Luxembourg, 2017. [Google Scholar] [CrossRef]
- Saaty, T.L. How to Make a Decision: The Analytic Hierarchy Process. Eur. J. Oper. Res. 1990, 48, 9–26. [Google Scholar] [CrossRef]
- Teknomo, K. Analytic Hierarchy Process (AHP) Tutorial. Available online: https://people.revoledu.com/kardi/tutorial/AHP/ (accessed on 28 July 2024).
- Yagoub, M.M.; AlSumaiti, T.; Tesfaldet, Y.T.; AlArfati, K.; Alraeesi, M.; Alketbi, M.E. Integration of Analytic Hierarchy Process (AHP) and Remote Sensing to Assess Threats to Preservation of the Oases: Case of Al Ain, UAE. Land 2023, 12, 1269. [Google Scholar] [CrossRef]
- Foody, G.M. Status of Land Cover Classification Accuracy Assessment. Remote Sens. Environ. 2002, 80, 185–201. [Google Scholar] [CrossRef]
- Thomlinson, J.R.; Bolstad, P.V.; Cohen, W.B. Coordinating Methodologies for Scaling Landcover Classifications from Site-Specific to Global. Remote Sens. Environ. 1999, 70, 16–28. [Google Scholar] [CrossRef]
- Ballerine, C. Topographic Wetness Index Urban Flooding Awareness Act Action Support Will and DuPage Counties, Illinois. 2017. Available online: https://www.isws.illinois.edu/pubdoc/CR/ISWSCR2017-02.pdf (accessed on 1 July 2024).
- Cunha, N.S.; Magalhães, M.R.; Domingos, T.; Abreu, M.M.; Küpfer, C. The Land Morphology Approach to Flood Risk Mapping: An Application to Portugal. J. Environ. Manag. 2017, 193, 172–187. [Google Scholar] [CrossRef]
- Mahmood, S.; Ullah, S. Assessment of 2010 Flash Flood Causes and Associated Damages in Dir Valley, Khyber Pakhtunkhwa Pakistan. Int. J. Disaster Risk Reduct. 2016, 16, 215–223. [Google Scholar] [CrossRef]
- Abu Dhabi Culture. The Bronze Age Tombs of Jabel Hafit. Available online: https://abudhabiculture.ae/en/discover/pre-historic-and-palaeontology/jebel-hafeet-tombs (accessed on 19 July 2023).
- AECOM. Drainage of Flood Water in Al Ain Region; Report Prepared by AECOM for Al Ain Municipality; AECOM: Dallas, TX, USA, 2011. [Google Scholar]
- Finn, H. Dam Failure and Inundation Modeling: Test Case for Ham Dam; Summary Report, Project Conducted by “DHI Gulf” for UAE Ministry of Environment & Water; UAE Ministry of Environment & Water: Dubai, United Arab Emirates, 2008.
- Lamond, J.; Rose, C.; Bhattacharya-Mis, N.; Joseph, R. Evidence For Property Flood Resilience Phase 2 Report; University of the West of England: Bristol, UK, 2018. [Google Scholar]
- Hamouda, M.A.; Hinge, G.; Yemane, H.S.; Al Mosteka, H.; Makki, M.; Mohamed, M.M. Reliability of GPM IMERG Satellite Precipitation Data for Modelling Flash Flood Events in Selected Watersheds in the UAE. Remote Sens. 2023, 15, 3991. [Google Scholar] [CrossRef]
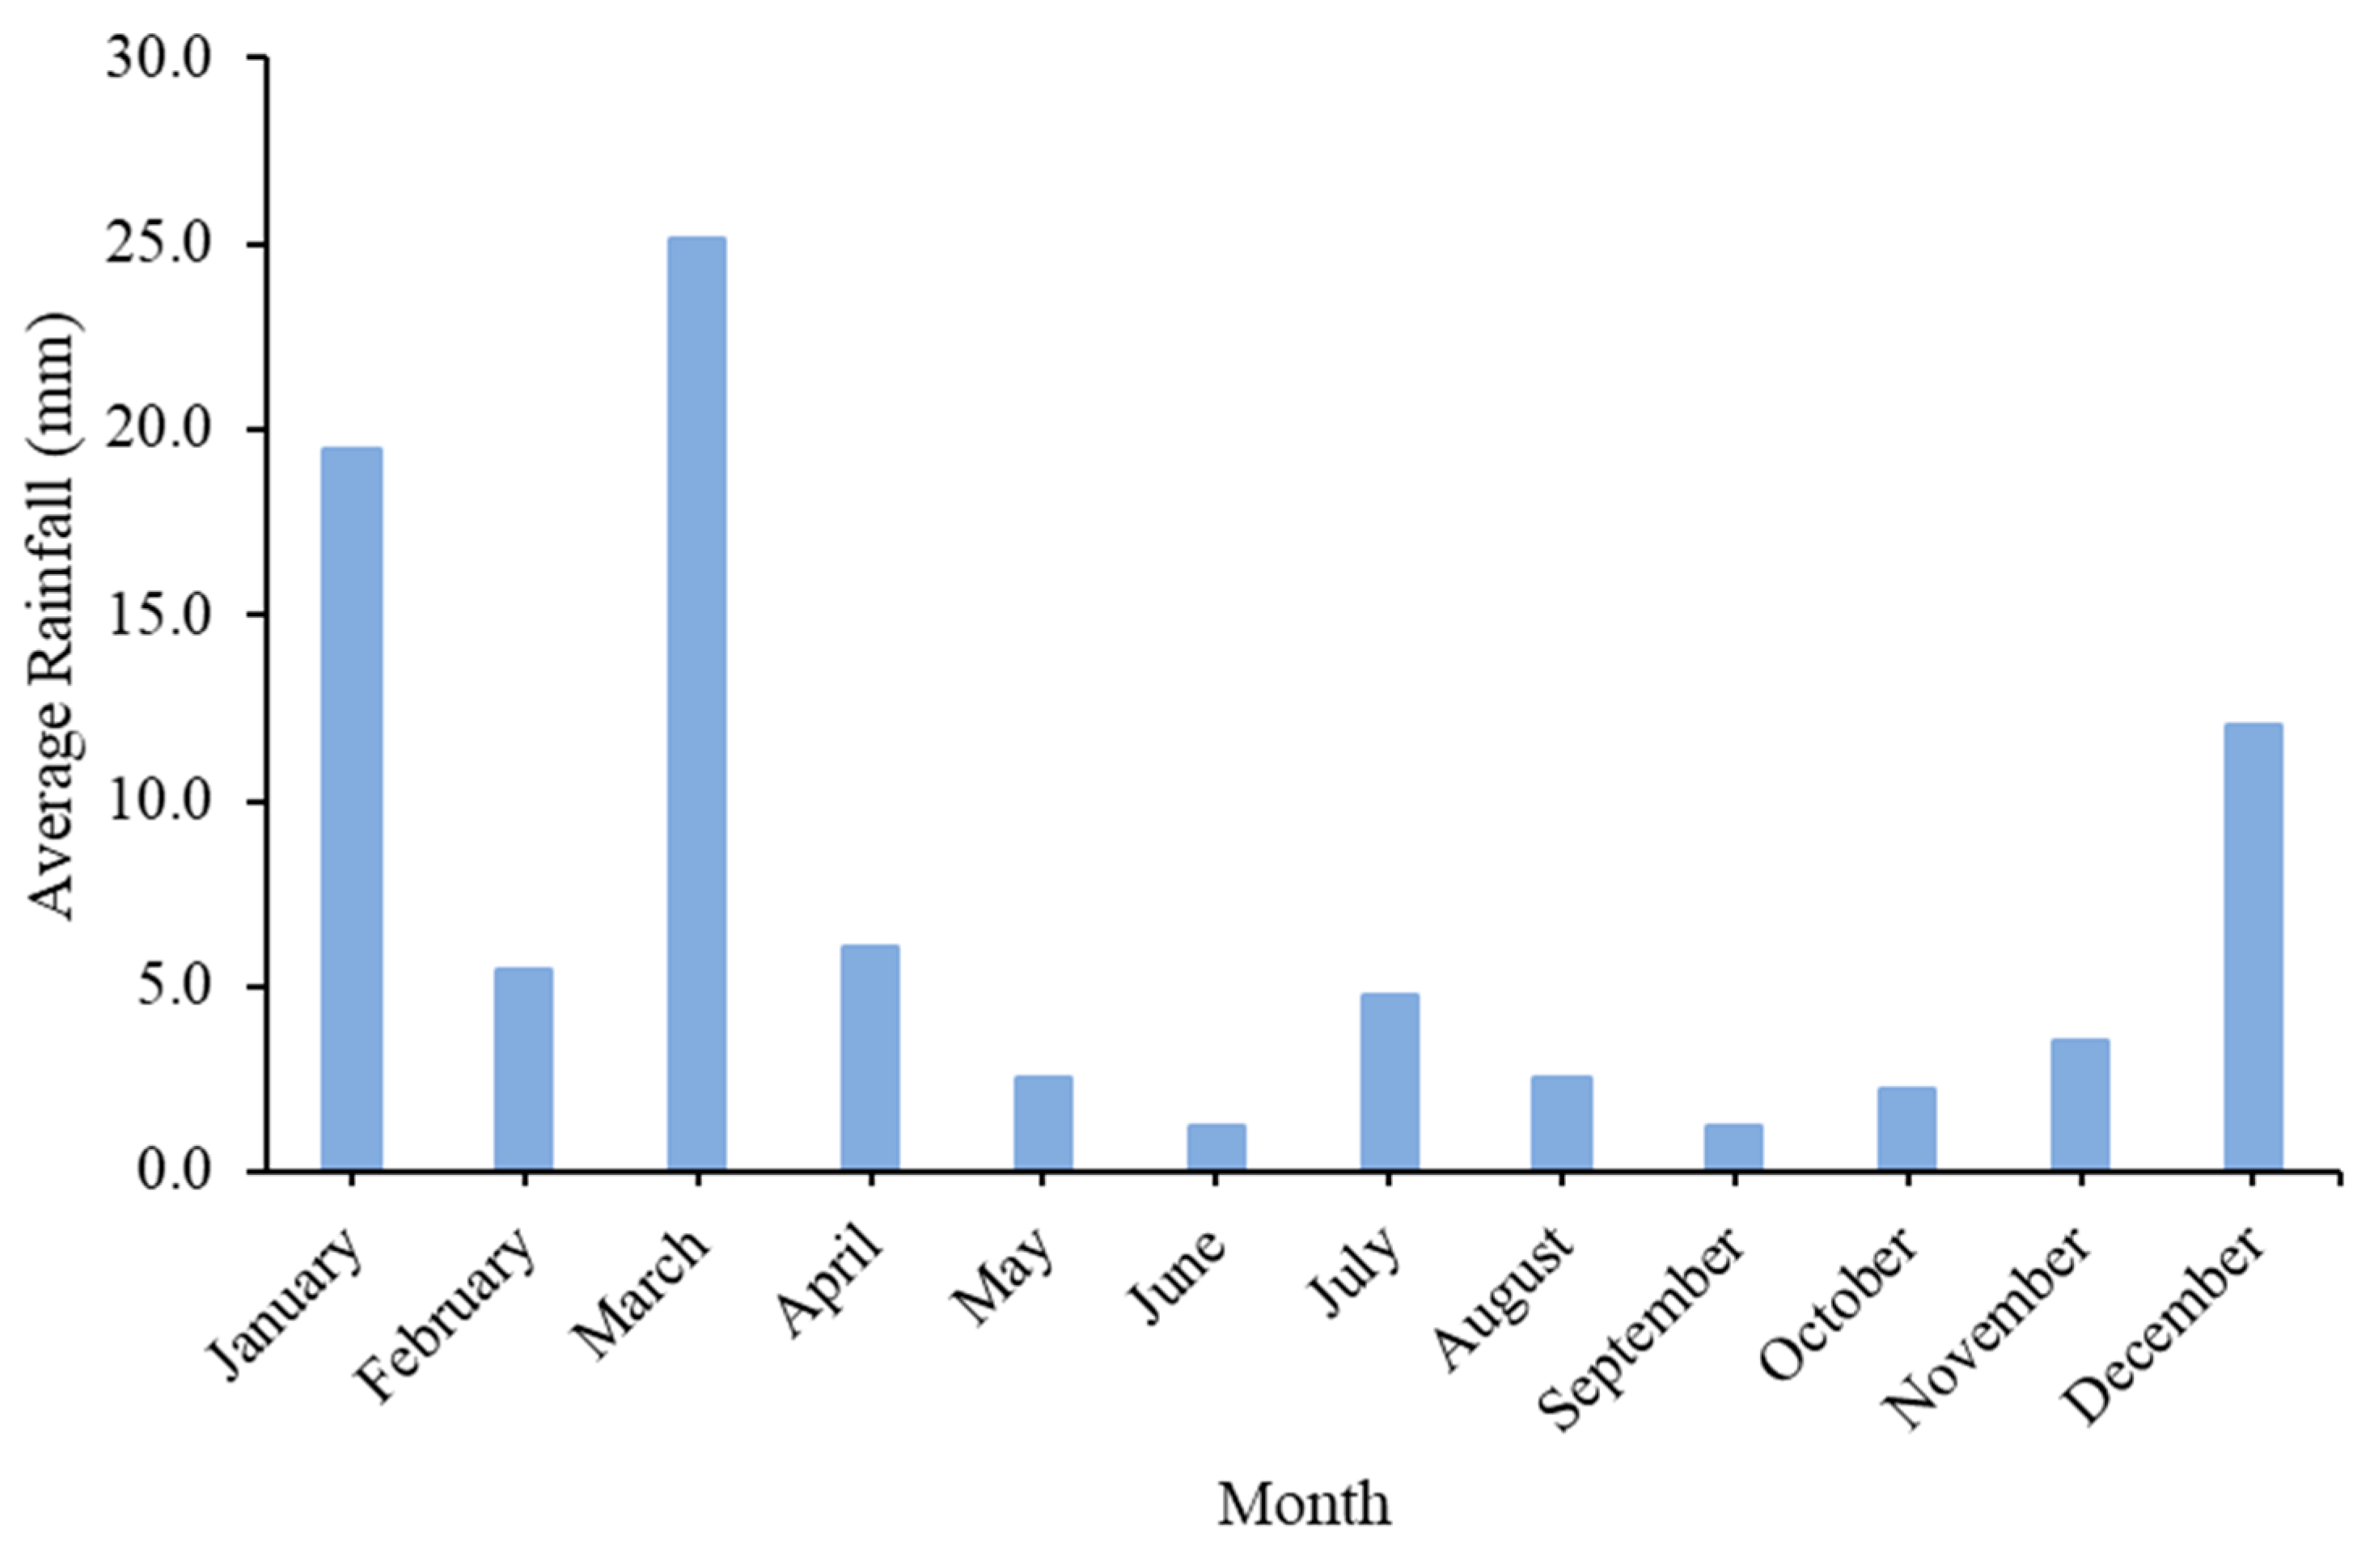

| Station | Jan. | Feb. | Mar. | Apr. | May | Jun. | Jul. | Aug. | Sep. | Oct. | Nov. | Dec. | Average |
|---|---|---|---|---|---|---|---|---|---|---|---|---|---|
| Al Shuaibah | 33.8 | 7.9 | 40.4 | 4.6 | 6 | 1 | 1 | 0 | 0 | 4 | 4.1 | 11 | 9.5 |
| Al Qattara | 8.5 | 2.2 | 10.5 | 3.2 | 1 | 1 | 3 | 2 | 0 | 1 | 2.5 | 5 | 3.3 |
| Al Foah | 20.8 | 7.1 | 31.7 | 10.2 | 2 | 2 | 10 | 6 | 4 | 4 | 5.5 | 25 | 10.7 |
| Airport | 14.7 | 4.6 | 17.9 | 6.1 | 1 | 1 | 5 | 2 | 1 | 0 | 2.1 | 7.1 | 5.2 |
| Average | 19.5 | 5.5 | 25.1 | 6.0 | 2.5 | 1.3 | 4.8 | 2.5 | 1.3 | 2.3 | 3.6 | 12.0 |
| Data | Spatial Resolution | Source | Type |
|---|---|---|---|
| Digital elevation model | 30 m | (EROS, 2023) [36] | Raster |
| Landsat image | 30 m | (USGS, 2022) [37] | Raster |
| Population | District level | Statistics Centre, Abu Dhabi | Vector |
| Geology | - | Ministry of Energy and Infrastructure, Petroleum, Gas and Mineral Resources sector | Vector |
| Soil | - | (FAO, 2023) [38] | Raster |
| Valleys | - | Digitized from Google Earth and UAE Atlas | Vector |
| LULC | Curve Number for Hydrologic Soil Group A | Curve Number for Hydrologic Soil Group B |
|---|---|---|
| Bare soil | 63 | 77 |
| Built-up | 77 | 85 |
| Highland | 98 | 98 |
| Vegetation and date palms | 39 | 61 |
| 2022 | Built-Up | Vegetation | Date Palm | Bare Soil | Highland | Total |
|---|---|---|---|---|---|---|
| Built-up | 55 | 0 | 1 | 0 | 3 | 59 |
| Vegetation | 3 | 46 | 0 | 0 | 0 | 49 |
| Date Palm | 0 | 0 | 49 | 0 | 0 | 49 |
| Bare Soil | 1 | 1 | 2 | 51 | 1 | 56 |
| Highland | 0 | 0 | 0 | 0 | 49 | 49 |
| Total | 59 | 47 | 52 | 51 | 53 | 262 |
| PA | 0.92 | 0.92 | 0.98 | 0.94 | 0.98 | |
| UA | 0.9 | 0.88 | 0.94 | 0.93 | 1 | |
| Overall | PA = 0.94 and Kappa = 0.91 | |||||
| Factor | Feature Category | Score | Weight | Factor | Feature Category | Score | Weight |
|---|---|---|---|---|---|---|---|
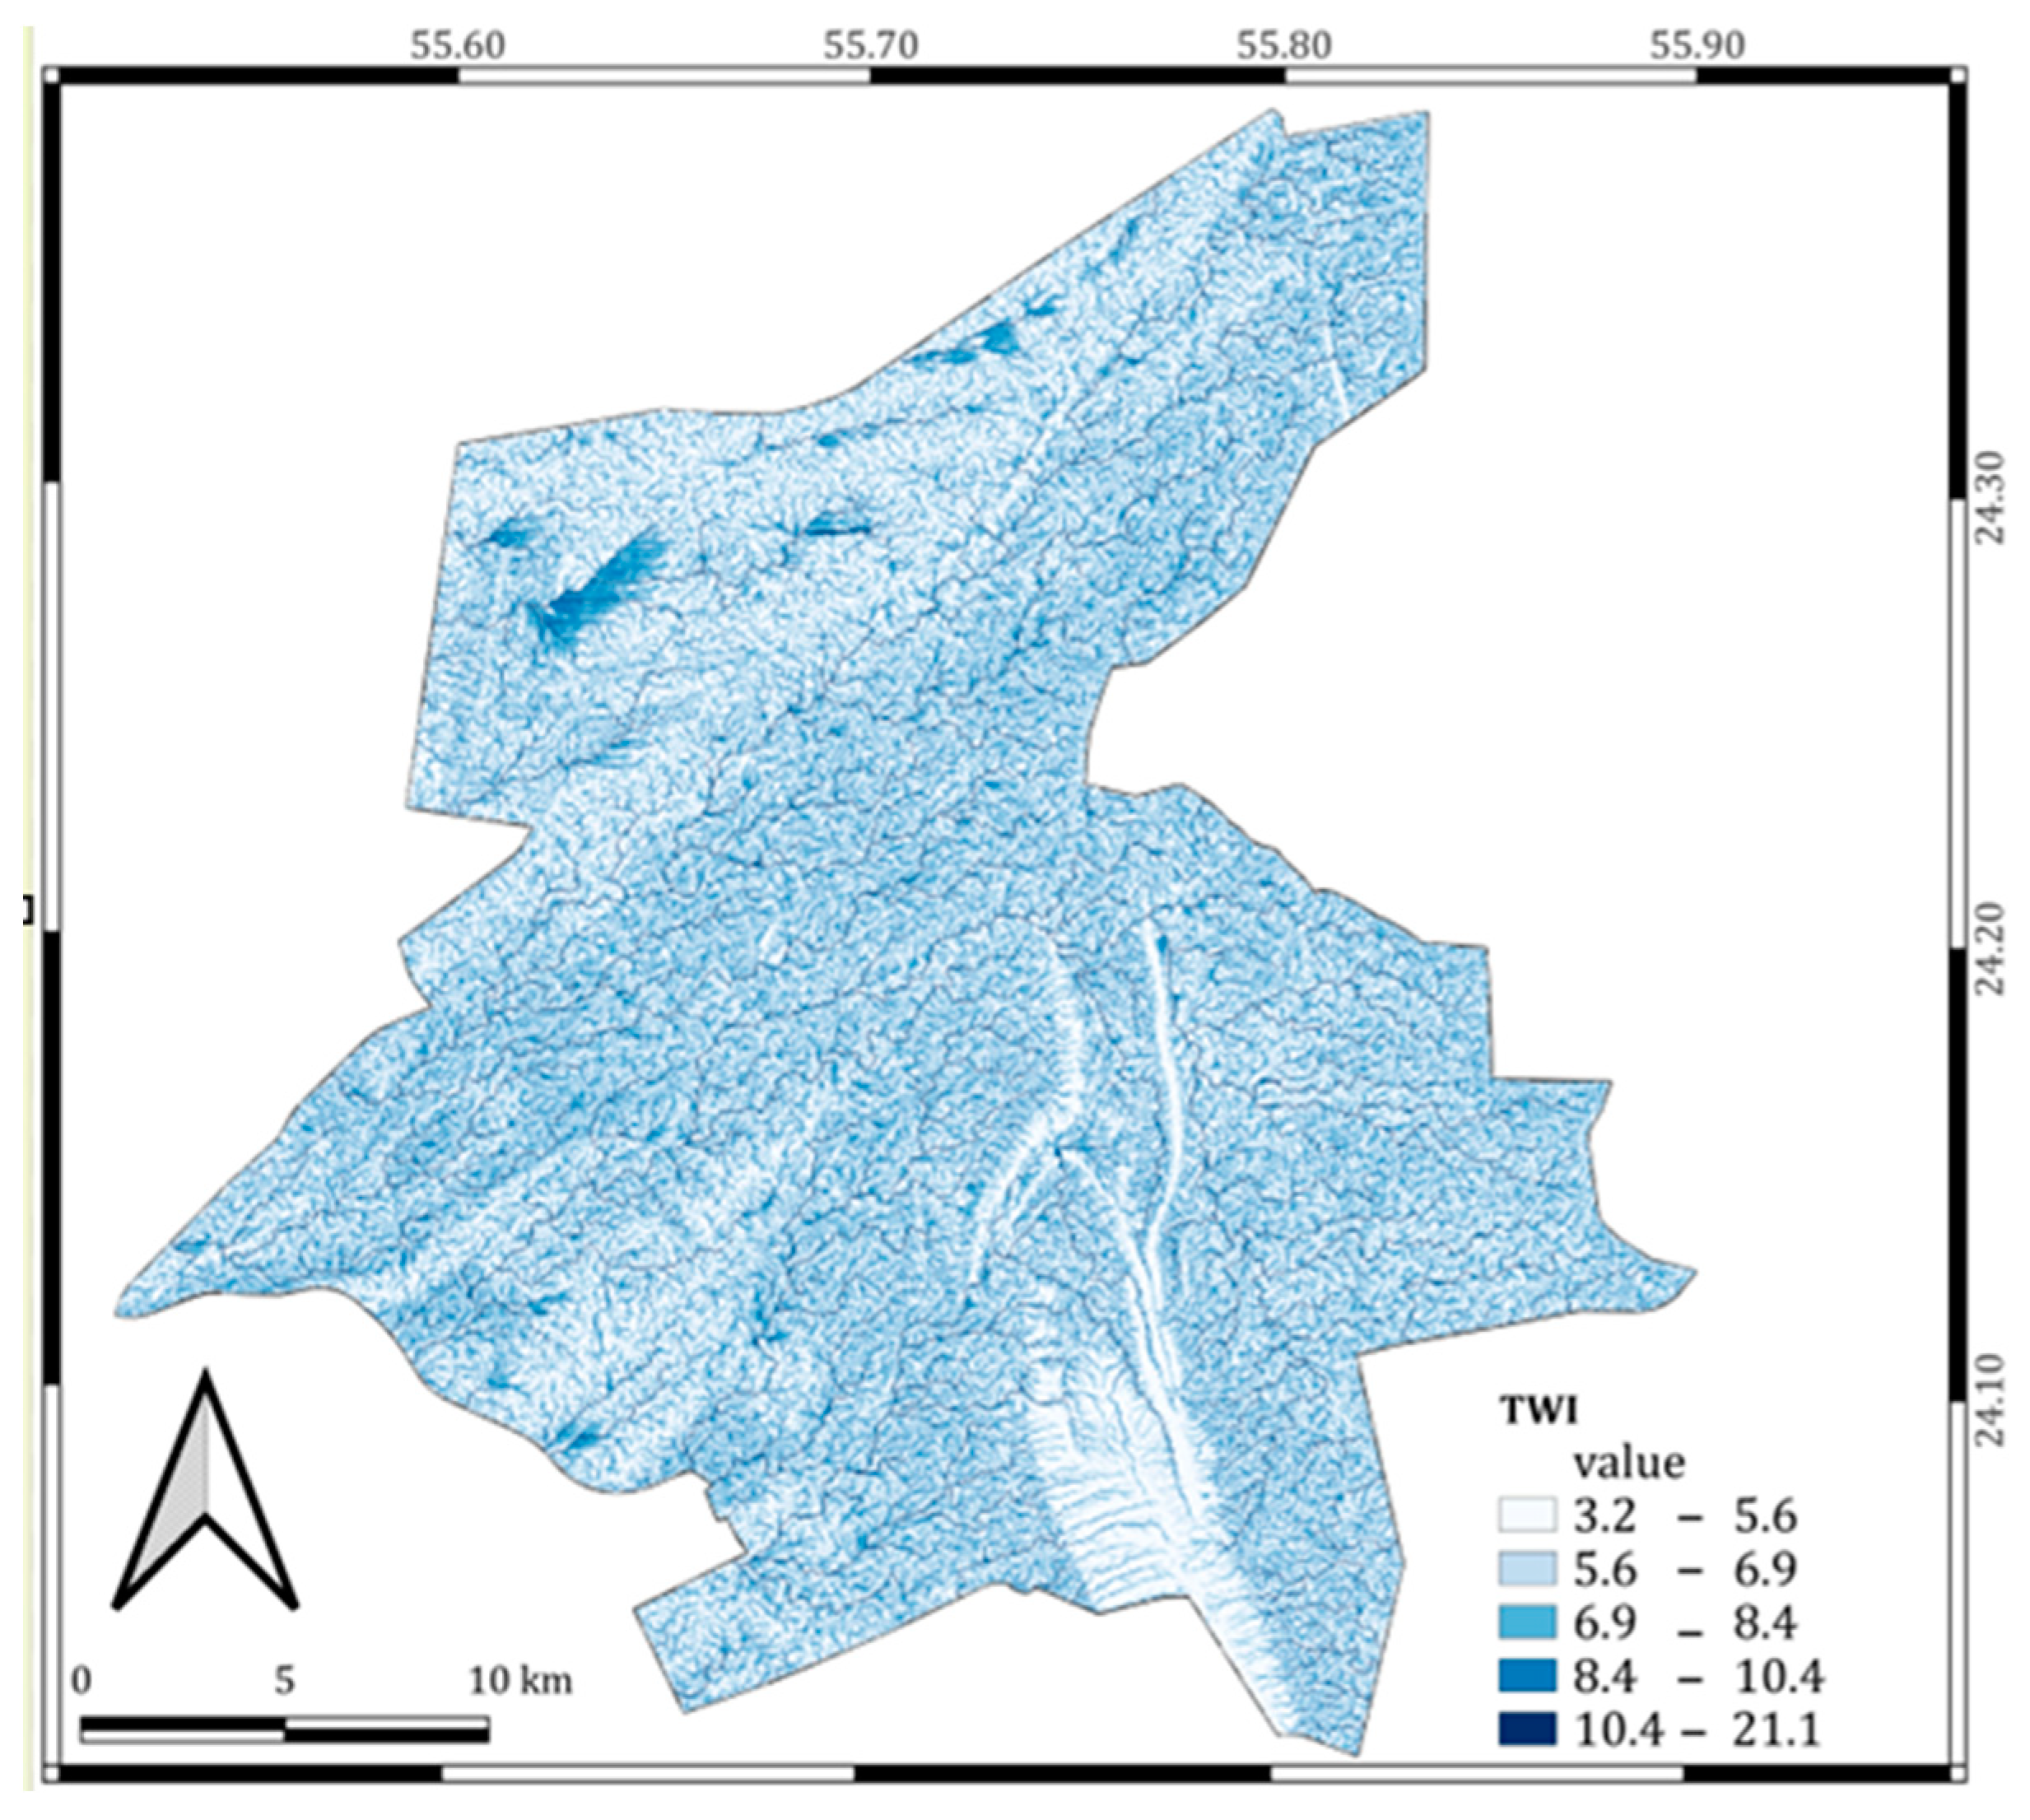
| Elevation (meters) | 0–20 | 5 | 0.10 | TWI | 3.2–5.6 | 1 | 0.19 |
| 20–40 | 4 | 5.6–6.9 | 2 | ||||
| 40–60 | 3 | 6.9–8.4 | 3 | ||||
| 60–80 | 2 | 8.4–10.4 | 4 | ||||
| >100 | 1 | 10.4–21.1 | 5 | ||||
| Building age | 1972 | 5 | 0.16 | Valley | 300 | 5 | 0.24 |
| 1993 | 4 | 500 | 4 | ||||
| 2013 | 3 | 700 | 3 | ||||
| 2022 | 1 | 900 | 2 | ||||
| 1100 | 1 | ||||||
| TPI | −209 to −45 | 3 | 0.08 | Geology | Silt | 5 | 0.03 |
| −45 to −15 | 4 | Mudstone | 4 | ||||
| −15 to 13 | 5 | Limestone | 3 | ||||
| 13 to 55 | 2 | Sand | 2 | ||||
| 55 to 214 | 1 | Gravel | 1 | ||||
| LULC | Built-up | 5 | 0.05 | CN | 61 | 5 | 0.05 |
| Vegetation | 3 | 77 | 4 | ||||
| Desert | 2 | 85 | 3 | ||||
| Highland | 1 | 98 | 1 | ||||
| Population density | 0–105 | 1 | 0.10 | ||||
| 105–494 | 2 | ||||||
| 494–927 | 3 | ||||||
| 927–1480 | 4 | ||||||
| 1480–3813 | 5 |
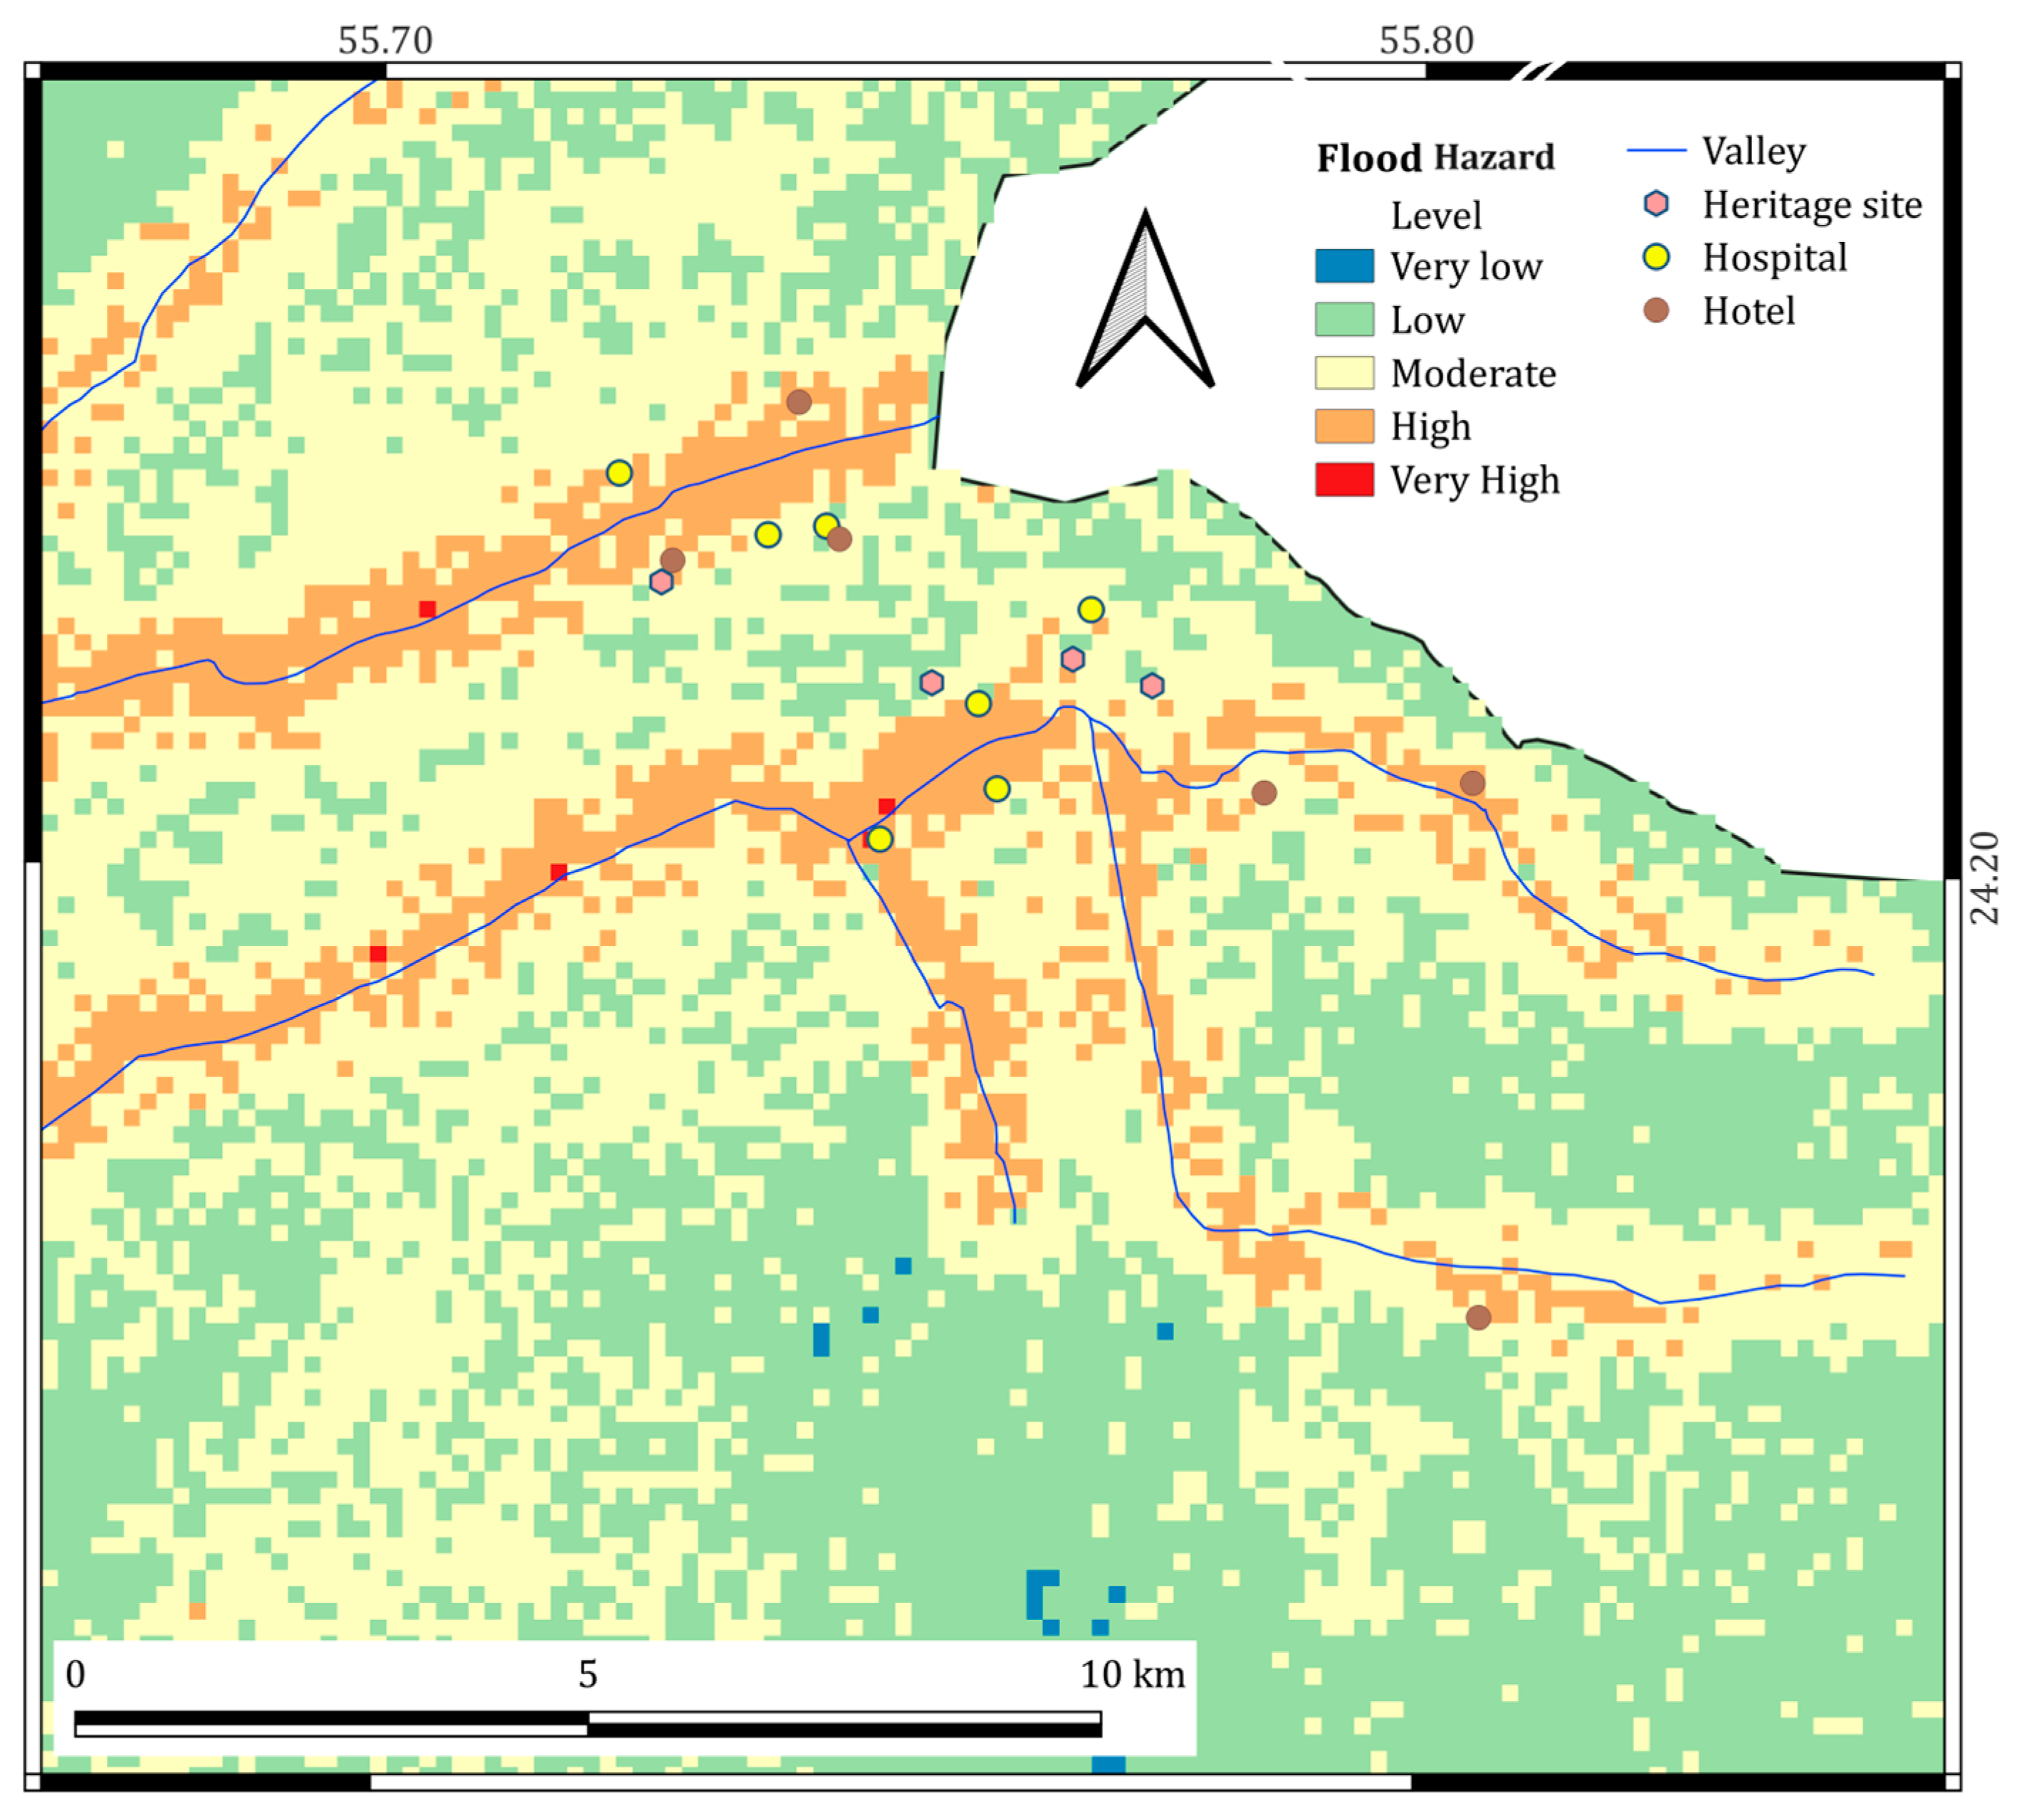
| Buffer Zone (m) | LULC (km2) | Counts | |||||||
|---|---|---|---|---|---|---|---|---|---|
| Built-Up | Vegetation | Desert | Heritage Sites | Schools | Hospitals | Petrol Station | Mosques | Hotels | |
| 500 | 37.68 | 10.65 | 43.03 | 1 | 50 | 4 | 4 | 184 | 4 |
| 1000 | 74.79 | 21.55 | 84.29 | 4 | 70 | 7 | 6 | 374 | 6 |
| 1500 | 107.26 | 32.16 | 122.77 | 5 | 88 | 11 | 10 | 515 | 7 |
Disclaimer/Publisher’s Note: The statements, opinions and data contained in all publications are solely those of the individual author(s) and contributor(s) and not of MDPI and/or the editor(s). MDPI and/or the editor(s) disclaim responsibility for any injury to people or property resulting from any ideas, methods, instructions or products referred to in the content. |
© 2024 by the authors. Licensee MDPI, Basel, Switzerland. This article is an open access article distributed under the terms and conditions of the Creative Commons Attribution (CC BY) license (https://creativecommons.org/licenses/by/4.0/).
Share and Cite
Alsumaiti, T.; Yagoub, M.M.; Tesfaldet, Y.T.; Alhosani, N.; Pakam, S. Integration of Building Age into Flood Hazard Mapping: A Case Study of Al Ain City, United Arab Emirates. Water 2024, 16, 2408. https://doi.org/10.3390/w16172408
Alsumaiti T, Yagoub MM, Tesfaldet YT, Alhosani N, Pakam S. Integration of Building Age into Flood Hazard Mapping: A Case Study of Al Ain City, United Arab Emirates. Water. 2024; 16(17):2408. https://doi.org/10.3390/w16172408
Chicago/Turabian StyleAlsumaiti, Tareefa, M. M. Yagoub, Yacob T. Tesfaldet, Naeema Alhosani, and Subraelu Pakam. 2024. "Integration of Building Age into Flood Hazard Mapping: A Case Study of Al Ain City, United Arab Emirates" Water 16, no. 17: 2408. https://doi.org/10.3390/w16172408
APA StyleAlsumaiti, T., Yagoub, M. M., Tesfaldet, Y. T., Alhosani, N., & Pakam, S. (2024). Integration of Building Age into Flood Hazard Mapping: A Case Study of Al Ain City, United Arab Emirates. Water, 16(17), 2408. https://doi.org/10.3390/w16172408


