Article

Improvement of Removal Rates for Iron and Manganese in Groundwater Using Dual-Media Filters Filled with Manganese-Oxide-Coated Sand and Ceramic in Nepal

by
Ankit Man Shrestha
1,
Shinobu Kazama
2,
Benyapa Sawangjang
1 and
Satoshi Takizawa
1,*
1
Department of Urban Engineering, Graduate School of Engineering, The University of Tokyo, 7-3-1 Hongo, Bunkyo-ku, Tokyo 113-8654, Japan
2
Department of Socio-Cultural Environmental Studies, Graduate School of Frontier Sciences, The University of Tokyo, 5-1-5 Kashiwanoha, Kashiwa, Chiba 277-8563, Japan
*
Author to whom correspondence should be addressed.
Water 2024, 16(17), 2450; https://doi.org/10.3390/w16172450
Submission received: 14 July 2024 / Revised: 24 August 2024 / Accepted: 27 August 2024 / Published: 29 August 2024

Abstract

:
Iron and manganese in groundwater impair the quality of drinking water; however, the rates of iron and manganese removal with conventional aeration and rapid sand filtration (RSF) processes vary extensively. Five full-scale aeration–RSF processes in Nepal also showed varying efficiencies of iron and manganese removal; while the iron concentration was below the national standard (0.30 mg/L) in 31 out of the 37 treated waters, the manganese concentration was higher than the standard (0.20 mg/L) in all of the treated waters. Re-aeration and stirring of the treated water did not oxidize soluble manganese, and this caused the poor removal rates for manganese. Bench-scale dual-media filters comprising anthracite on top of sand/ceramic layers with dosages of poly aluminum chloride and chlorine worked well by removing coagulated iron in the anthracite layer and then removing manganese in the sand/ceramic layers. A manganese-oxide-coated ceramic filter provided the highest manganese removal from 1.10 mg/L to <0.01 mg/L, followed by manganese-oxide-coated sand and quartz sand. Increasing the pH from 7.5 to 9.0 stabilized the manganese removal. Therefore, we propose a re-design of the present treatment processes and the selection of suitable filter media for better removal of iron and manganese.

Graphical Abstract

1. Introduction

Iron and manganese occur naturally in soils, rocks, and minerals. In aquifers, groundwater dissolves iron and manganese, giving rise to elevated concentrations thereof [1]. The iron and manganese concentrations in groundwater depend on several factors, such as the iron and manganese contents in rocks, the depth of the aquifer, hydraulic residence time, temperature, the porosity of the soil, rainfall, humidity, and the acidity of the soil and rocks [2].
Because of their common chemical characteristics, iron and manganese coexist in groundwater [3]. Iron and manganese in water cause an unpleasant taste, color, and increased turbidity. Iron and manganese stain laundry and plumbing fixtures at levels of >0.30 mg/L and >0.02 mg/L, respectively [4]. Dissolved iron can promote the growth of iron bacteria in groundwater and piped water [5]. Even at a concentration of 0.02 mg/L, manganese may be deposited in pipes, and it may slough off as a black precipitate [6]. Long-term exposure to high concentrations of manganese in groundwater has been linked to chronic poisoning, which poses a severe threat to human health [7]. A high concentration of manganese in water may lead to learning disabilities, deficits in intellectual function, compulsive behavior, and attention disorders in children [8].
Iron concentrations in groundwater are higher than 0.30 mg/L in many countries, including Bangladesh [3,9], China [7], Finland [10], India [3], Indonesia [11], Italy [12], Nigeria [13], Slovakia [7] and Vietnam [3]. More than 50 countries supply drinking water containing manganese at concentration of >0.40 mg/L [14]; in South Asia, people’s awareness of the occurrence and potential health effects of manganese in drinking water is low despite its frequent detection at elevated levels [8]. Manganese concentrations above 0.20 mg/L in drinking water have also been reported in Afghanistan [8], Bangladesh [9], China [7], Egypt [3], Finland [10], India [3], Indonesia [11], Italy [12], Korea [15], Myanmar [8], Nigeria [13], and Sri Lanka [8].
Considerable laboratory studies have been conducted to remove iron and manganese from drinking water; these include studies of membrane filtration [16], electrocoagulation [17,18], coagulation/flocculation [18], ion exchange [19], flotation [20], biological [21] and chemical oxidation (chlorine, hypochlorite [22], ozone [23], or potassium permanganate [22]), and filtration and adsorption [24]. However, application of the above methods in full-scale water treatment plants (WTPs) is limited due to the following limitations: electrocoagulation is effective only for colloidal contaminants and consumes energy [25], membrane fouling causes high operational costs and low permeate flux [26], and chemical coagulation requires large dosages of coagulants and produces sludge containing toxic elements. In addition, coagulation–flocculation followed by gravity sedimentation may be time-consuming [26]; ion exchange has challenges related to waste disposal, as resins can be fouled due to the precipitation of iron and manganese with dissolved oxygen [25]. Floatation requires high capital, maintenance, and operation costs [26]; the manganese concentration in effluents from biological oxidation filters fluctuates under complex operating conditions [25], and chemical oxidation has limitations such as difficulty in the storage and transport of oxidants, corrosion, the formation of solid manganese compounds that may interfere with system operations, and the formation of by-products [27]. The chemical oxidation of iron and manganese can be combined with aeration; it was reported that the oxidation of iron using aeration and chlorination used less chlorine than a system using chlorination only, which indicated that adopting aeration before chlorination reduced the amount of chlorine required for the oxidation of iron [28]. Dissolved oxygen and free chlorine readily oxidize iron in a pH range of 6.0–8.5, but manganese oxidation is very slow, while manganese removal through sorption and surface-catalyzed chlorine oxidation is effective [29].
Adsorption processes are widely used for metal removal due to the simplicity of operation, high removal efficiency, ease of recovery, and cost-effectiveness. Furthermore, adsorbents can be regenerated through desorption processes for multiple uses [24]. Iron and manganese oxides are well known as effective adsorbents for heavy metal removal due to their microporous structure and high surface area. In general, manganese oxides (MnO2) have a higher adsorption capacity for manganese than iron oxides do [30]. To remove iron and manganese through adsorption, it is necessary to oxidize dissolved iron and manganese. In addition, metal oxides are used extensively as heterogeneous catalysts for oxidation reactions. Manganese has stable high-oxidation states, so it is more thermally and chemically stable than iron [31]. Manganese oxide is a catalyst for manganese oxidation and adsorbs the oxidized manganese in a filter bed packed with MnO2-coated sand (manganese sand) [32]. Manganese ore has better manganese removal efficiency than that of quartz sand; however, manganese sand is the most stable and has the highest efficiency of manganese removal [33]. The adsorption process and the rate of manganese removal in water depend on several factors, including the pH, adsorbent dosage, adsorbent particle size, contact time, temperature, and manganese concentration [34].
At a full-scale WTP in Hingna, India, a cascade aerator and rapid sand filter (RSF) partially removed iron (0.08–1.51 mg/L) and manganese (0.23–1.70 mg/L) in raw water, reaching levels of 0.02–0.80 mg/L and 0.08–0.70 mg/L, respectively [22]. At a WTP in Mazandaran, Iran, tray aerators and RSF removed iron (0.93 ± 0.91 mg/L) and manganese (0.24 ± 0.10 mg/L) by 57.0% and 48.7%, respectively, whereas with additional pre-chlorine injection, the removal efficiencies moderately increased to 77.7% and 62.5%, respectively [35]. At the Koskuuslahde WTP in Ilmajoki, Finland, manganese (0.90 mg/L) in raw water was effectively removed through the addition of potassium permanganate to an aeration–RSF process; however, without potassium permanganate, the manganese reduction was only 5% on average, which improved to >91% with potassium permanganate [10]. At 26 WTPs in Korea, an average manganese removal rate of 93.5% (0.05–0.97 mg/L) was achieved with MnO2-coated media [15]. Experimental results with a full-scale test filter at a WTP in Belgium showed that filters containing MnO2-coated anthracite (MOCA) had a very high (>90%) manganese removal rate compared with filters without an MOCA layer (~10%) [36]. Aeration followed by RSF is a common method for drinking water treatment to remove iron and manganese [37], but due to a lack of comprehensive understanding regarding the efficiencies of iron and manganese removal using aeration–RSF, the effective removal of iron and manganese has not been achieved in different WTPs. Information gathered from over 100 WTPs in the Netherlands, Belgium, Germany, Jordan, and Serbia showed that manganese removal through aeration–RSF is complex and simultaneously influenced by several parameters of water quality, such as the pH, oxygen in the filtrate, and iron loading per filter run, as well as process parameters, such as the filtration rate, filter bed depth, and contact time [38]. Recently, researchers in the Netherlands reported that manganese removal rates varied extensively from merely 9% to 100% depending on the operational periods of dual-media RSFs using anthracite and sand, whereas the iron and ammonia removal rates were stable at 97–100% and 80–100%, respectively [39].
Groundwater in the southern part of Nepal, i.e., the Terai region, is abundant and, thus, a reliable and sustainable source of water [40]. In most of the Terai region, the depth of wells is approximately 150 m, with an average well yield of 25 L/s [41]. However, the quality of the groundwater as a source of drinking water is a major concern [42]. In three districts of the eastern Terai region, 107/175 samples and 88/175 samples of groundwater had iron and manganese concentrations exceeding the National Drinking Water Quality Standards of Nepal (NDWQS), which are 0.30 mg/L and 0.20 mg/L, respectively [43]. The existing groundwater treatment systems installed for iron and manganese removal are aeration–RSF systems because of their low investment cost and simple operation [37]. Although there are some methods that have higher removal rates for iron and manganese than those of the aeration–RSF processes mentioned above, these processes are not employed in Nepal and other developing countries due to their high investment costs, requirements for chemicals, and difficulty of operation and maintenance. While iron oxidation is fast in simple aeration systems [44], manganese oxidation and removal in aeration–RSF treatment plants are slow and influenced by several parameters, including the water quality and process design [38]. Therefore, this study aimed to evaluate the removal efficiencies for iron and manganese in the existing aeration–RSF plants in the Terai region and to evaluate the removal efficiency of MnO2-coated media as an appropriate method for the removal of iron and manganese in the study area. This study compared the removal efficiencies for iron and manganese using dual-media filters filled with anthracite on the top and three different filter media (quartz sand, manganese sand, and MnO2-coated ceramics (ferrolite) with pre-chlorination and coagulation under various conditions.

2. Materials and Methods

2.1. Study Area

The study area was the urban municipalities in the Sunsari district, one of 14 districts in the Koshi province in southern Terai, Nepal [45]. The district has a total area of 1275 km2 and is located in the southeastern part of Nepal (Figure 1) [46]. This district is the second most populous district in the Koshi province [45], with a total population of 926,962 and an annual population growth rate of 1.86% as per the census in 2021 [47]. The study area is characterized by a subtropical monsoon climate, and the average monthly temperature ranges from 9 to 40 °C. The mean annual precipitation is 1794 mm, and 85% of the precipitation occurs in the rainy season from June to September [46]. The district consists of 12 municipalities, 6 urban municipalities (2 sub-metropolitan cities and 4 municipalities), and 6 rural municipalities [48] based on the constitutional provision of Nepal [49]. Most of the aquifers in the study area are recharged by rivers and precipitation at higher altitudes [50].

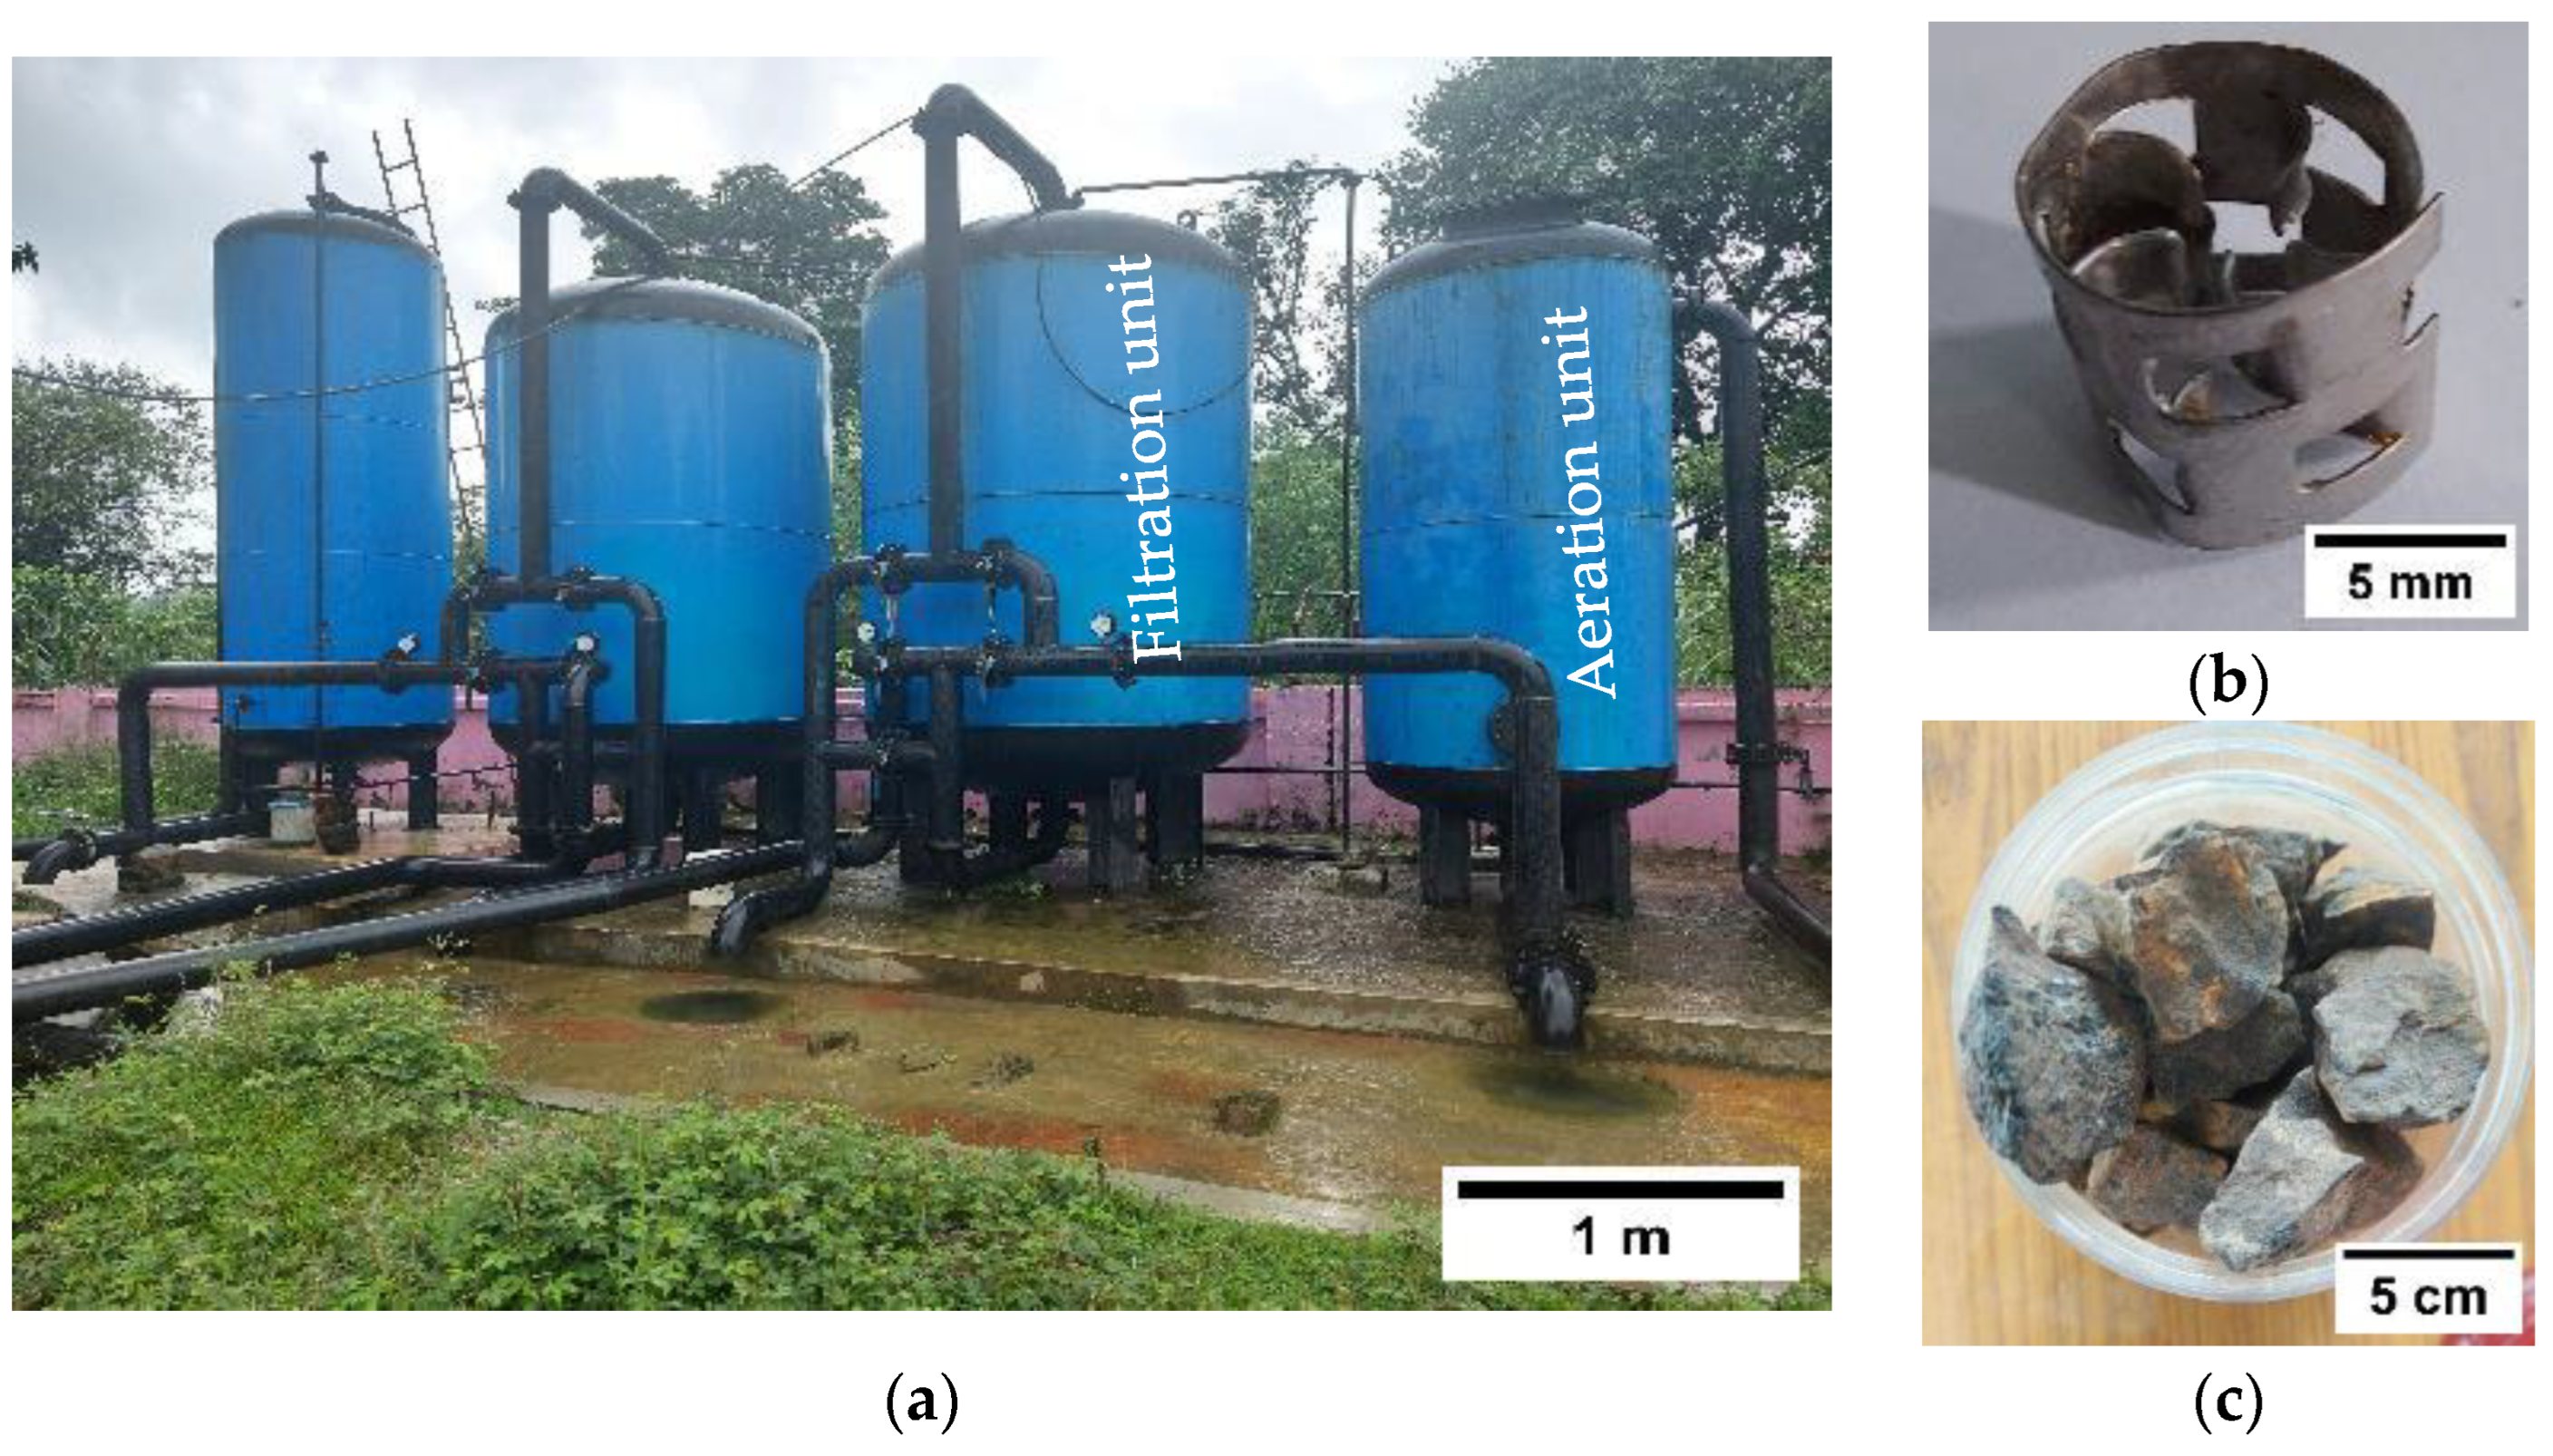
2.2. Water Supply Projects in the Study Area

The water supply projects (WSPs) in the study area are operated by water users and sanitation associations (WUSAs); one of the main water service providers is managed by the communities, which are responsible for the planning, construction, operation, and management of water supply systems with support from the central/provincial/municipal government [51]. Members of WUSAs are mostly elected by the community, and they do not require any qualifications or prior experience with water supply systems [52]. In the study area, there are 119 WSPs operated by WUSAs [53]. Out of the 119 WSPs, 14 (out of 23 WSPs) in Baraha municipality and all (81) WSPs in the sub-metropolitan city of Dharan (Table A1) use surface water as the main water source; most of these projects depend on the tributaries of the Sardhukhola River for their water supply [54]. Only 22 WSPs in 5 urban municipalities, namely, Baraha, Duhabi, Inaruwa, Itahari, and Ramdhuni, abstract groundwater from deep tube wells as their main source of water; of these, 12 WSPs have water treatment plants [53]. One WSP with a groundwater treatment plant was selected from each of the five urban municipalities (Figure 1), totaling five WSPs, namely, Duhabi, Inaruwa, Jhumka, Mahendranagar, and Pakali, with a total of sixteen tube wells (Table A1). The depth of the wells in the study area ranges from 80 to 125 m.

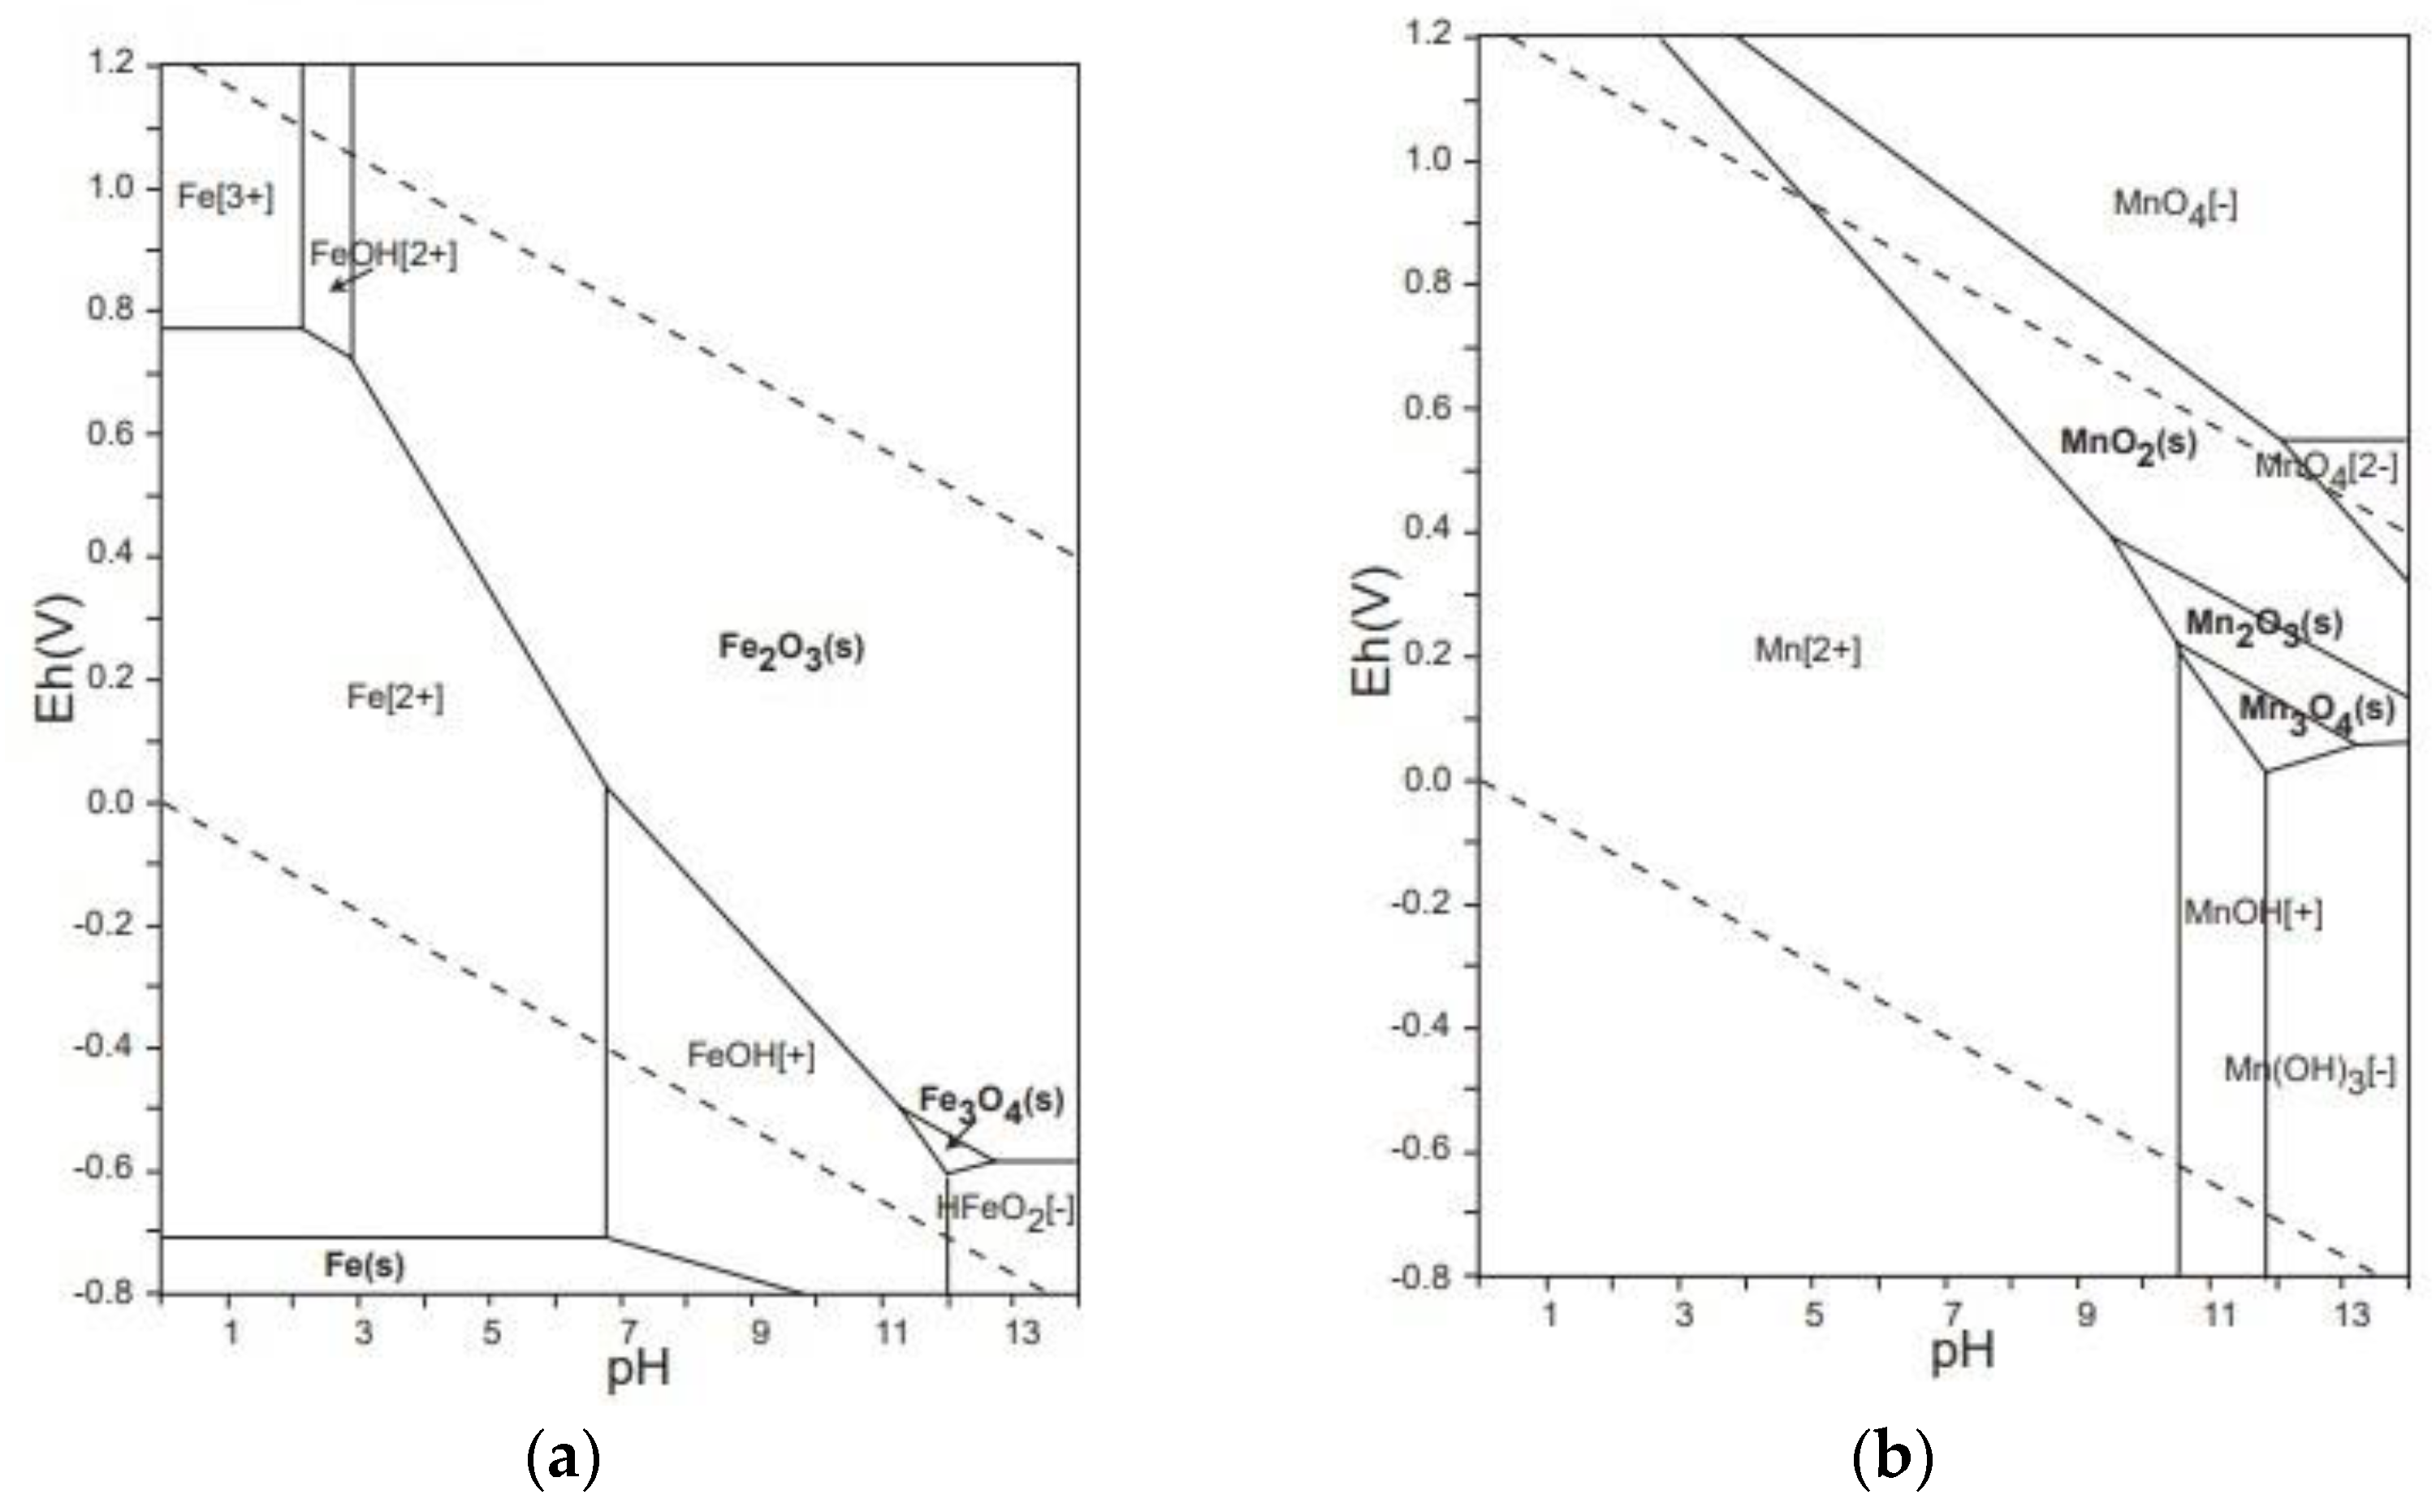
2.3. Iron and Manganese Removal Processes in the Study Area

Among the five WSPs, Duhabi, Inaruwa, and Pakali have two treatment plants that treat raw water from different groundwater sources (Figure 2a), whereas the other two WSPs, Jhumka and Mahendranagar, have only one treatment plant that treats raw water from one or more groundwater sources in time-shifted modes (Figure 2b). Different numbers of tube wells are connected to the water treatment plants in different WSPs.
These water treatment plants have aeration–RSF processes for iron and manganese removal (Figure 3a). Both TPs in Duhabi and the TP in Mahendranagar have been operated since 2017; the RSFs are backwashed twice per week in both WSPs. Both TPs in Pakali and TP2 in Inaruwa have been operated since 2021; the RSFs are backwashed daily. The TP in Jhumka and TP1 in Inaruwa have been operated since 2006 and 2000, respectively; the filter media (including MnO2-coated pebbles in the aeration unit of Inaruwa) are replaced every 5 years, and the filter media and pebbles were replaced in 2020; RSFs are backwashed daily in these TPs.

2.3.1. Aeration Unit

Air is supplied to the raw water in the aeration tanks with air compressors. To enhance the aeration and oxidation of iron and manganese, two types of aeration media—pall rings (Figure 3b) or MnO2-coated pebbles (Figure 3c)—are used in the different water supply projects (Table 1).

2.3.2. Filtration Unit

In all WSPs, the filters are filled with quartz sand (effective size (d10) = 0.45–0.60 mm, uniformity coefficient d60/d10 = 1.3–1.7) at a thickness of 600–750 mm. At the Duhabi WSP, a dual-medium filter with manganese sand (250 mm) on top of a quartz sand layer (400 mm) has been installed.

2.4. Field Survey

Field surveys were conducted three times during the following periods:
  • 23 February–13 March 2023 (dry season);
  • 8 August–26 September 2023 (rainy season);
  • 27 February–15 March 2024 (dry season).
In the first field survey, one sample was collected from each of the WSPs in the study area; the WSPs with high iron and/or manganese contents in the treated water were selected to evaluate the treatment efficiency for iron and manganese. In the second field survey, triplicate samples of raw water, i.e., groundwater from deep tube wells, and treated water from each TP of the five selected WSPs were collected for analyses in the field on the same day. No rainfall was recorded from December of 2022 to 15 March 2023 in the study area, while an average precipitation of 1384.8 mm was recorded at three rainfall stations near the study area in the rainy season (June–September 2023) [55]. In the third field survey, the iron and manganese removal efficiencies were compared using bench-top experimental units filled with three different filter media with pre-chlorination and coagulation under different operating conditions.

2.5. Iron and Manganese Oxidation through the Re-Aeration and Stirring of Treated Water

Stirring water in the presence of suspended reactant particles can promote the oxidation of iron and manganese by increasing the frequency of collision, leading to oxidation reactions [56]. Therefore, to examine the effects of stirring for the oxidation of iron and manganese, bench-top experiments were performed using the devices shown in Figure A1. In the stirring experiments, treated water containing iron and manganese was stirred in a 500 mL vessel at 1500 rpm for up to 60 min; the pH, dissolved oxygen, ferrous iron, and soluble manganese were measured every 15 min.
The efficiency of iron and manganese removal may be affected by low concentrations of dissolved oxygen [38] and short detention times; thus, saturated dissolved oxygen in water may facilitate the better oxidation of iron and manganese with an extended aeration time. In the aeration experiments, 1 L of treated water containing iron and manganese was aerated with an air pump for up to 90 min; the pH, dissolved oxygen, ferrous iron, and soluble manganese were measured every 15 min.

2.6. Filtration Experiment

To conduct bench-scale filtration experiments, raw water was transported from the Jhumka and Inaruwa WSPs to the laboratory at the Urban Water Supply and Sanitation Project, Regional Project Management Office, Itahari, Sunsari, which is 8 and 15 km away from Jhumka and Inaruwa, respectively. In the bench-scale filtration experiments for iron and manganese removal, we compared three different filter media: quartz sand, manganese sand, and MnO2-coated ceramics (ferrolite, Tohkemy Corporation, Osaka, Japan). The three filtration columns were made of acrylic pipes with a diameter of 30 mm and a height of 1 m (Figure 4a). The bottom sections of the columns were filled with gravel (diameter 2–12 mm) to a thickness of up to 150 mm (Figure 4b). Above the gravel layers, three different filter media, namely, quartz sand (effective size = 0.6 mm, density = 2.63–2.64 g/cm3, uniformity coefficient d60/d10 = 1.4–1.5), manganese sand (effective size = 0.6 mm, density = 2.58–2.65 g/cm3, uniformity coefficient d60/d10 = 1.4–1.5, MnO2 content >0.5 mg/gm), and ferrolite (effective size = 0.3 mm, apparent density = 0.8–1.0 gm/cm3, MnO2 content >3.4 mg/gm), were filled to a thickness of 400 mm in Column 1, Column 2, and Column 3, respectively. Anthracite (effective size = 1.2 mm) was filled to a thickness of 200 mm above the quartz sand and manganese sand in Columns 1 and 2, respectively, whereas fine anthracite (effective size = 0.7 mm) was filled to a thickness of 200 mm in Column 3. The remaining 250 mm of space was used for bed expansion during the backwashing of the filter media after each filtration experiment.
Dual-media filtration was performed to retain oxidized iron flocs in the anthracite layer and to maintain the high reactivity of the quartz sand, manganese sand, or ferrolite layer for manganese removal. A comparatively fine size of anthracite (0.7 mm) was used in Column 3; this depended on the small size of ferrolite (0.3 mm) used in the lower layer, which was expected to trap fine particles and improve the filtration efficiency in comparison with Columns 1 and 2.
To activate the filter media, they were soaked in water containing 200 mg/L of chlorine for 1 h; this was prepared using sodium hypochlorite (NaClO). After washing the media with tap water, the filter media were put into the filtration columns. Before conducting the filtration experiments, the filter media were cleaned by filtering clean water containing chlorine at 2.0–3.0 mg/L for 3 h. Then, the filter media were backwashed with clean water with about 30% of bed expansion at average flow rates of 0.388 L/h, 0.380 L/h, and 0.200 L/h for Columns 1, 2, and 3, respectively. After backwashing, raw water containing iron and manganese was filtered through the filtration columns at a filtration rate, i.e., linear velocity, of 5 m/h.
Chlorine was injected into raw water for the chemical and catalytic oxidation (MnO2 as a catalyst) of iron and manganese. The chlorine dosage in the raw water before filtration was based on the stoichiometric dose to oxidize iron and manganese, namely, 0.62 mg/L of chlorine per mg/L of iron and 1.29 mg/L of chlorine per mg/L of manganese plus chlorine consumption by the filter media, which was measured by filtering water containing 2–3 mg/L of chlorine added to the 0.50 mg/L of residual chlorine in the treated water. Every 30 min, raw water and treated water were collected for water quality analyses. Sodium hydroxide was added in the experiments to study the effect of pH on manganese, as it was reported that a high pH enhances manganese removal in MnO2-coated filter media [30] and the chlorine oxidation of manganese [28].
Poly aluminum chloride (PACl) solution was added to the raw water to coagulate suspended iron oxide if the total iron concentration was above 0.30 mg/L in the treated water. To determine the effects of the PACl dose, the raw water was filtered through a filter paper (pore size: 5 μm) after being mixed with PACl at increasing dosages of 5 mg/L and 10 mg/L until the total iron in the filtered water was below 0.10 mg/L.

2.7. Water Quality Analysis

The water quality was analyzed through 10 physicochemical parameters. Temperature, electrical conductivity, total dissolved solids (TDSs), and pH were measured with LAQUAtwin (HORIBA Advanced Techno Co., Ltd., Kyoto, Japan); turbidity was measured with a Eutech™ TN-100 Turbidimeter (Gul Circle, Singapore); dissolved oxygen (DO) was measured with a D-210PD-S LAQUA (HORIBA Advanced Techno Co., Ltd., Kyoto, Japan); oxidation–reduction potential (ORP) was measured with portable HMP6 m (HACH LANGE®, Loveland, CO, USA) using a Ag/AgCl reference electrode; then, the measured ORP values were converted into Eh, i.e., the ORP of the standard hydrogen electrode (SHE), by adding C (electrode potential across the reference electrode relative to the SHE) using the formula C = −0.828T + 229, where T is the water temperature in °C [57].
Soluble manganese, chlorine, and ammonia were analyzed using a portable colorimeter (DR 900, HACH LANGE®, Loveland, CO, USA) and powdered reagents according to the USEPA periodate oxidation method, USEPA DPD method, and salicylate method, respectively. In the first and third field surveys, ferrous and total iron were analyzed using HACH DR 900 (HACH LANGE®, Loveland, CO, USA) and powdered reagents according to the phenanthroline method and USEPA Ferro Ver® method, respectively, whereas in the second field survey, both ferrous and total iron were analyzed with an HI 83399 (Hannah Instruments, Cluj-Napoca, Romania) and powdered reagents according to the phenanthroline method. The results of the water quality analysis were compared with those of NDWQS [58] to ascertain the treatment efficiency.

2.8. Data Analysis

A paired t-test was performed using R (version 4.3) to compare the ferrous iron, total iron, and soluble manganese in groundwater in the dry and rainy seasons. The results of the statistical tests were considered significant at p < 0.05.

3. Results

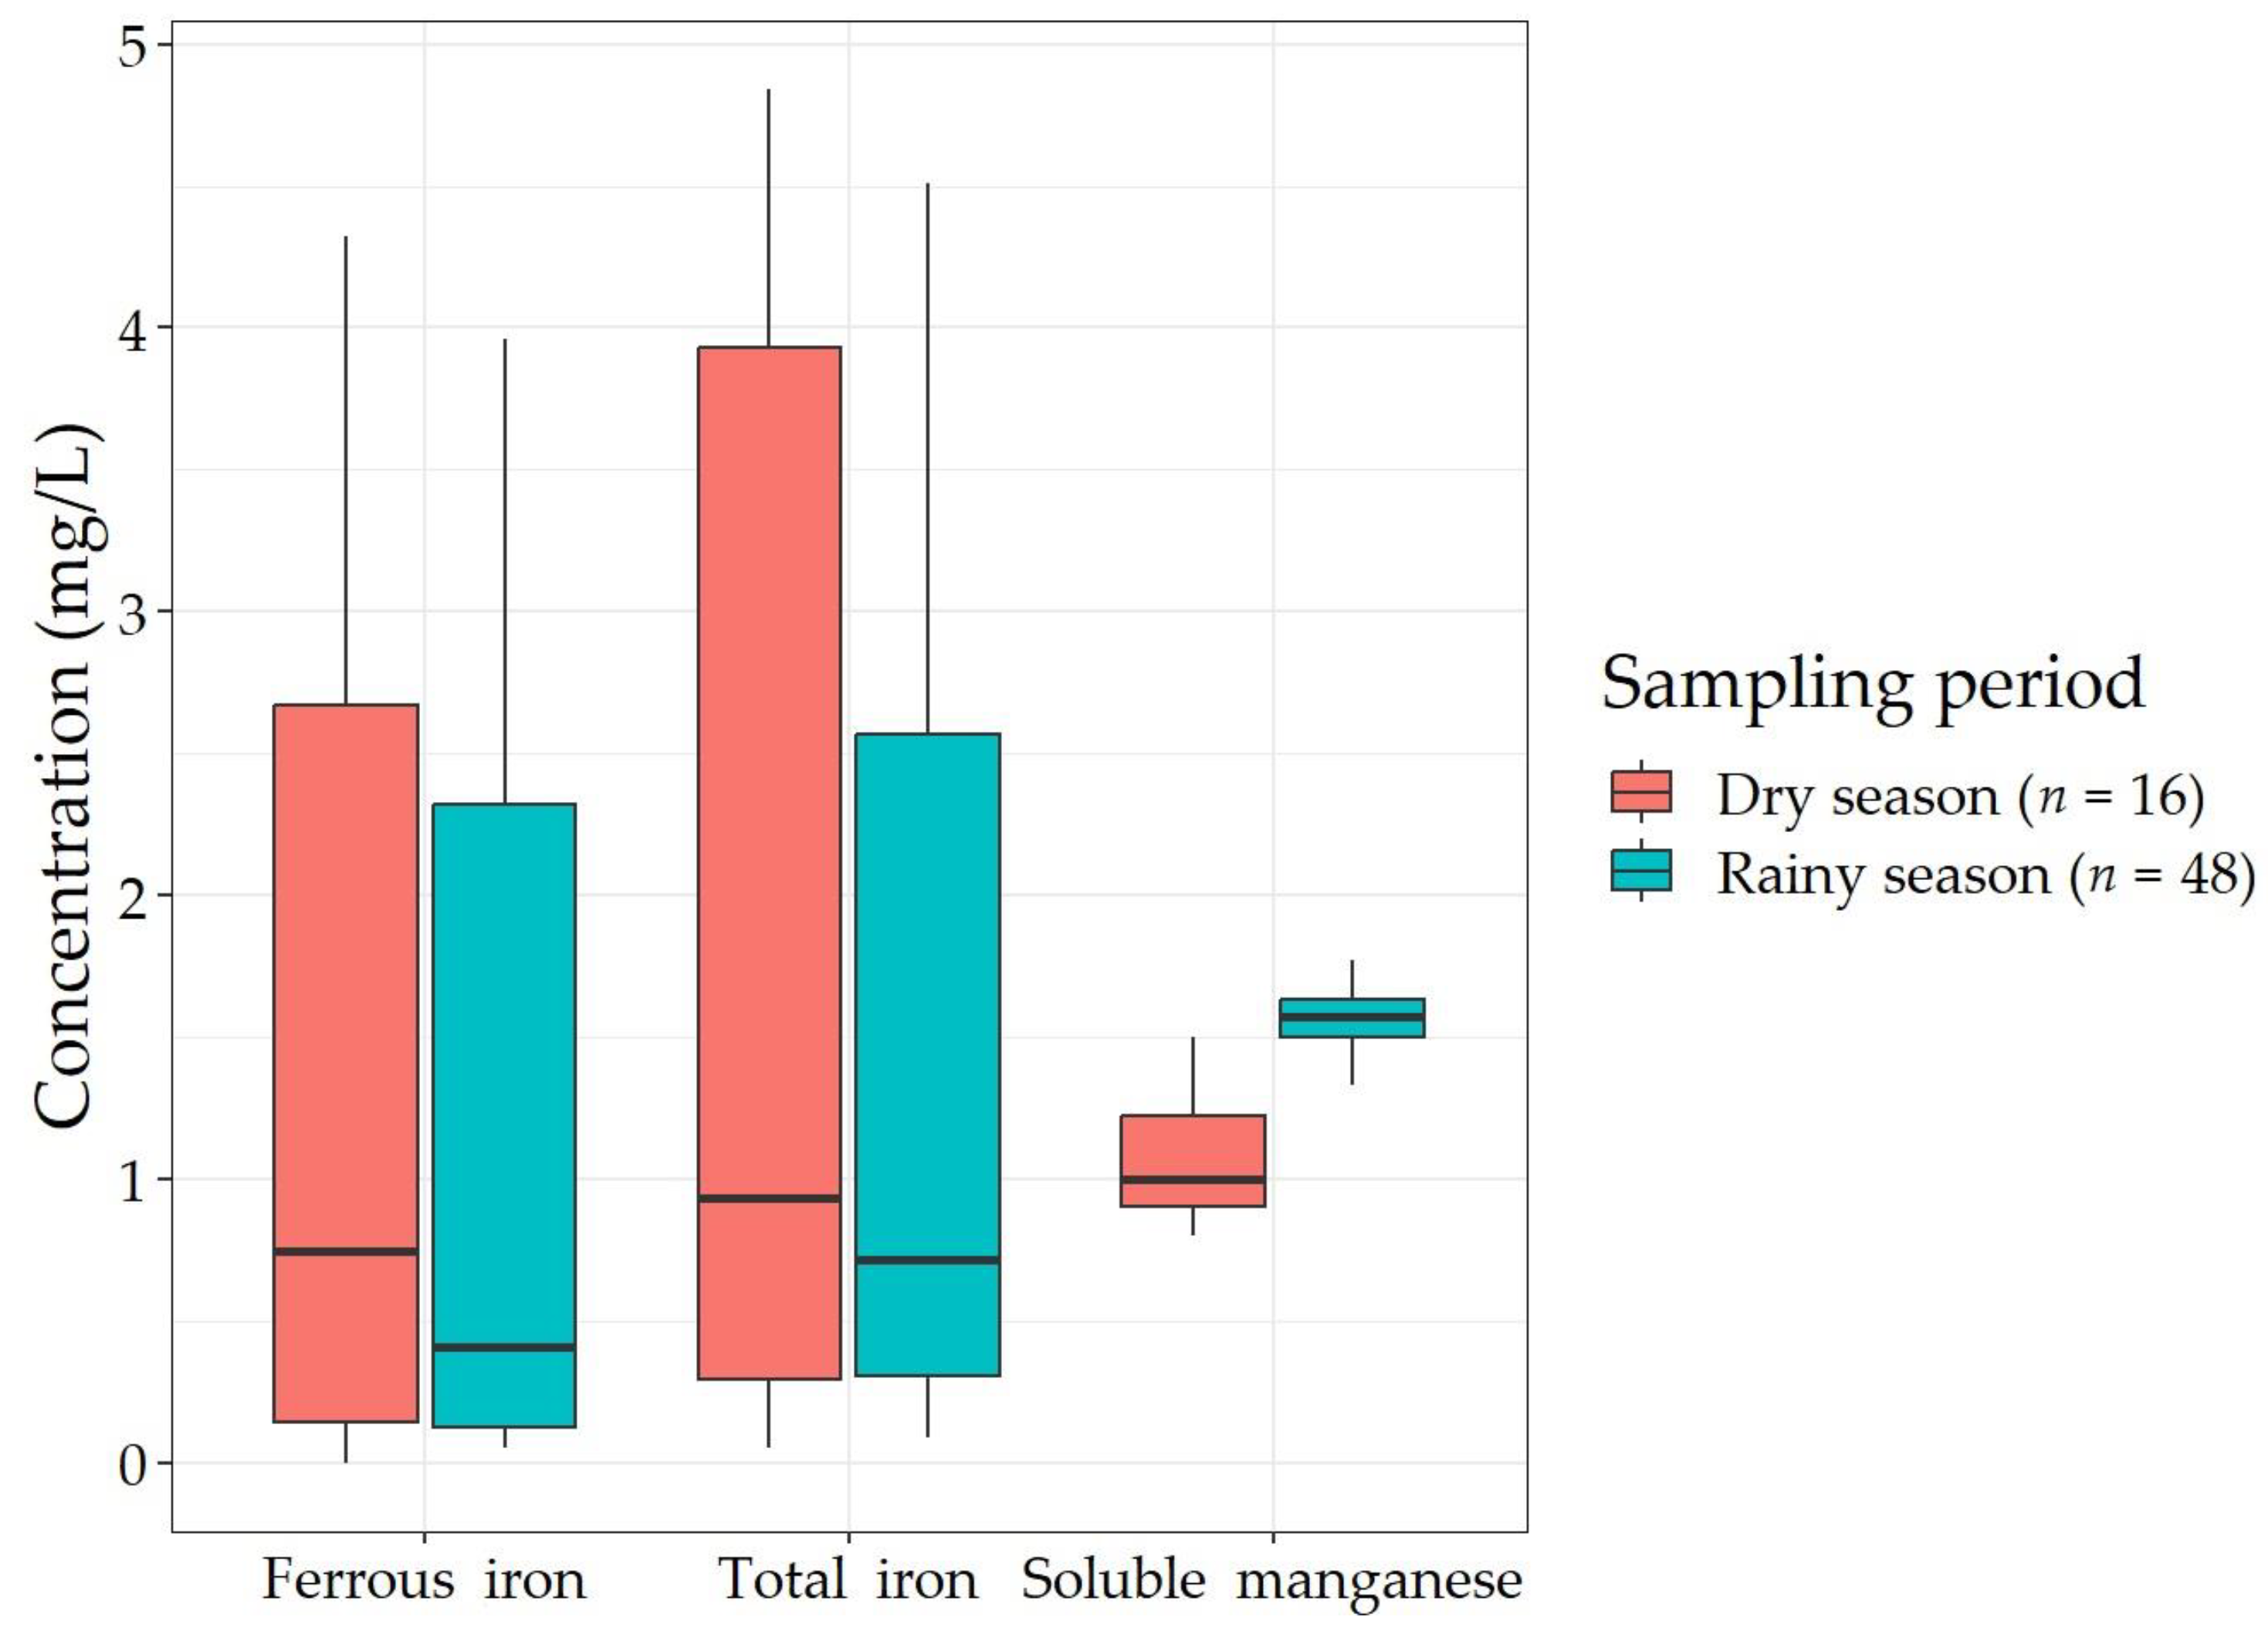
3.1. Physiochemical Water Quality of Raw and Treated Water

Table A2 shows the physiochemical water quality parameters collected in the first field survey (23 February–13 March 2023, dry season). The treated water of Duhabi was not measured, as the aeration unit was not in operation during the survey period. The groundwater temperature was 24–29 °C, and the treated water temperature was 25–28 °C. The groundwater pH was 6.66–7.85, which was within the range of the pH standard (6.50–8.50). The groundwater pH was comparatively high (>7.32) in Duhabi but comparatively low in Mahendranagar (<6.80); at low pH, the physiochemical removal of manganese may be difficult in aeration–RSF treatment plants [38]. After treatment, the pH increased in all WSPs, except in Inaruwa, which was possibly because of the decarbonation through aeration. The groundwater in Inaruwa contained a high ferrous iron concentration (>3.28 mg/L), and the ferrous iron in the raw water was oxidized and removed below the detection limit (BDL, <0.02 mg/L); the oxidation of ferrous iron follows a stoichiometric equation (4Fe2+ + O2(aq) + 10H2O → 4Fe(OH)3 + 8H+) [59], thus increasing the proton concentration [60] and decreasing the pH in Inaruwa [61].
The turbidity of all groundwater was lower than the standard of 5 NTU, except in Pakali (11.7 NTU), which was possibly because the sample was taken just after starting the water pump; however, it was reduced below the standard of 5 NTU after the treatment. The TDSs in the groundwater of Duhabi were high (215–244 mg/L), but they were low in Inaruwa (111–137 mg/L); however, the TDSs in all groundwater was lower than the standard of 1000 mg/L. TDSs in groundwater may vary naturally due to the dissolution of minerals contained in aquifers’ rocks and soils [60]. The TDSs in the treated water (128–203 mg/L) remained almost unchanged with respect to those in raw water.
The ORP (Eh) in the groundwater was in a range of −71 to 80 mV (Eh: 0.14–0.29 V); half (8/16) of the groundwater had negative ORP values (Eh < 0.20 V), which indicated a reduction in the environment of groundwater that prevented the oxidation of ferrous iron and soluble manganese [59]. In Inaruwa, all groundwater had negative ORP values of −71 to −11 mV (Eh: 0.14–0.20 V), and the ferrous iron concentration was high (2.08–4.32 mg/L), whereas in Jhumka, Mahendranagar, and Pakali, groundwater with positive ORP values (Eh: > 0.21 V) had low ferrous iron concentrations. In all of the treated water, Eh increased after aeration; in Inaruwa, Jhumka, and Mahendranagar, it increased to 0.37–0.41 V, 0.41–0.43 V, and 0.41 V, respectively, while in Pakali, Eh slightly increased to 0.25–0.30 V. A high ORP above 100 mV (Eh: 0.33 V) is characterized by the presence of oxygen in water [62], so the aeration systems in Inaruwa, Jhumka, and Mahendranagar had high aeration efficiency, while that in Pakali had low aeration efficiency.
The ferrous iron concentrations in groundwater were in a range from BDL (<0.02 mg/L) to 4.22 mg/L, and the total iron concentration was 0.05–4.54 mg/L. In Duhabi, all groundwater had a total iron concentration below the standard of 0.30 mg/L, except for one groundwater sample (0.44 mg/L). In Inaruwa, Jhumka, and Mahendranagar, all groundwater had a total iron concentration higher than 0.30 mg/L, while in Pakali, one groundwater sample had a total iron concentration of 0.24 mg/L, and another had a concentration of 1.3 mg/L.
In all treated water, the ferrous iron concentration was <0.30 mg/L, except for one treated water sample in Jhumka (0.87 mg/L). Although aeration did not work in Duhabi and the DO was low (1.48–2.39 mg/L), the ferrous iron concentration decreased from <0.15 mg/L in the raw water to <0.03 mg/L in the treated water. Due to the presence of ferric iron, the total iron concentration in the treated water of Inaruwa was above 0.30 mg/L; the high ferric iron concentration in the treated water indicated poor filtration efficiency. The soluble manganese concentration in the groundwater was 0.80–1.40 mg/L; all of the groundwater failed to meet the national standard for manganese (0.20 mg/L). The soluble manganese concentration was lowered to 0.40 mg/L in the treated water in Jhumka, while all other treated water had high soluble manganese concentration (0.50–1.10 mg/L), indicating inefficiency in the removal of soluble manganese.
Figure 5a shows the physiochemical water quality parameters (temperature, turbidity, and TDSs) collected in the second field survey (8 August–26 September 2023, rainy season). The temperature of the raw water was 26.4–30.1 °C, and it was 26.5–32.0 °C for the treated water. Compared with that in the dry season, the water temperature was slightly higher due to the higher ambient temperature in the rainy season [55]. The turbidity of all raw water (0.24–4.75 NTU) was within the range of the national standard of 5 NTU. In the first survey, one of the groundwater samples in Pakali had high turbidity, as it was collected just after starting the pump; however, in the second survey, the sample collected during the continuous operation of the pump had low turbidity (3.79–4.52 NTU). The turbidity in all of the treated water decreased to 0.03–2.00 NTU. The TDSs in the raw water varied from 95.5 to 225.0 mg/L; similarly to the dry season, TDSs were high in Duhabi (198–200 mg/L) and low in Inaruwa (95.5–155 mg/L). However, the TDSs were within the range of the national standard of 1000 mg/L. The TDSs in the treated water (109–216 mg/L) remained almost unchanged.
Figure 5b shows the physiochemical water quality parameters (pH, Eh, and DO) in the rainy season. The pH in raw water (pH 6.57–7.58) was within the range of the national standard of 6.50–8.50. Similarly to the dry season, the pH in the groundwater was comparatively high (>7.27) in Duhabi and low (<6.79) in Mahendranagar, making it difficult to remove soluble manganese in aeration–RSF treatment plants [38]. In most of the treated water, the pH increased after the treatment; however, in some of the treated water, the pH was decreased. As mentioned before, decarbonation through aeration increases pH [61], whereas the oxidation of ferrous iron decreases pH. The Eh values of the raw water at different WSPs varied from 0.14 to 0.38 V and increased in the treated water. Similarly to the dry season, raw water with low Eh values (0.11–0.91 V) in Inaruwa had high ferrous iron concentrations (3.22–4.31 mg/L), whereas in Jhumka, Mahendranagar, and Pakali, groundwater with higher Eh values had lower ferrous iron concentrations.
The dissolved oxygen (DO) in the raw water was 0.12–5.50 mg/L. The Eh value in the RW 2 of Inaruwa was the lowest, while the DO was the highest among all of the raw water samples; the high DO values may have been due to the recharging of the aquifer with water containing high DO values in the rainy season, whereas the lower Eh values may have been due to the presence of reducing species in groundwater; many studies have reported that reducing species can coexist with DO at disequilibrium due to slow redox equilibrium processes [63]. After treatment, the DO values increased in all of the treated water (>4.33 mg/L), except for that of Duhabi due to the breakdown of the aeration system, with a maximum DO value of 8.83 mg/L in Inaruwa.
The total iron concentration of the raw water was 0.03–4.49 mg/L (Figure 6a). Ferrous iron comprised most (83.35%) of the total iron, while ferric iron was a minor component (16.65%). The total iron concentration was above the national standard of 0.30 mg/L in 7 out of the 10 raw water samples; however, in Duhabi, the total iron concentration in all raw water was below the standard of 0.30 mg/L, which was possibly due to unique geology in the southernmost location in the Sunsari district (Figure 1).
The soluble manganese concentration in the raw water at different WSPs varied from 1.40 to 1.77 mg/L (Figure 6b), which was higher than the national standard of 0.20 mg/L. The efficiency of soluble manganese removal was low (8.28–27.56%); as a result, the soluble manganese concentration in the treated water was 1.07–1.37 mg/L. Due to the high concentration of soluble manganese in treated water, a black precipitate was found in piped water supplied to the community (Figure A4). As per the field visit and information from the WUSA members, the black precipitate of manganese was mostly found at the ends of the water supply networks.
The soluble manganese removal rates in Jhumka [TW 2 (23.6%) > TW 1 (10.5%)] and Mahendranagar [TW 1 (21.7%) > TW 2 (8.3%)] were higher for raw water that had low iron concentrations (Jhumka [RW 2 (0.27 mg/L) < RW 1 (1.91 mg/L)] and Mahendranagar [RW 1 (0.42 mg/L) < RW 2 (1.56 mg/L)]). Similarly, in Inaruwa, because both raw water samples had high iron concentrations (>3.80 mg/L), the iron removal was efficient, but the manganese removal rate was low. The manganese removal in TP-1 (27.6%) was higher than that in TP-2 (10.1%), which was possibly due to the MnO2-coated pebbles in the aeration unit of TP-1 [64]. In Duhabi, even though the aeration system was not in operation due to dysfunction, the manganese removal rates were 16.4–23.5% because of the low iron concentration in the raw water (<0.27 mg/L), the higher pH of the raw water (pH 7.26–7.56) in comparison with the other WSPs (pH 6.65–7.12), and the manganese sand layer on top of the quartz sand [10,34].
Figure 7 shows a comparison of iron and manganese in the rainy and dry seasons. The mean ferrous iron concentration in the rainy season (1.25 mg/L) was lower than that in the dry season (1.42 mg/L) (Figure 7); however, the difference of 0.17 mg/L was not significant (paired t-test: p > 0.05) due to the large variations in the ferrous iron concentrations in the groundwater. Similarly, the average total iron concentration in the groundwater in the dry season was higher than that in the wet season by 0.35 mg/L, but the difference was not significant (paired t-test: p > 0.05). In the rainy season, the increased infiltration of rainwater could dilute the iron concentration [65]; however, these effects were not obvious in the study area.
Unlike the iron concentration, the average concentration of soluble manganese in the rainy season (1.55 mg/L) was significantly higher than that in the dry season (1.07 mg/L), by 0.48 mg/L (Figure 7) (paired t-test: p < 0.05). The manganese concentrations in groundwater are dependent on aquatic chemistry, dissolution from rocks and manganese-bearing minerals [65], and soil [66]. As most of the aquifers in the study area are recharged by rivers and precipitation [50], the recharging of groundwater by rivers could influence the manganese concentration [67]. Variations in the Eh values in the groundwater (0.14–0.28 V) could be a cause of the larger variations in ferrous/total iron than in soluble manganese in the groundwater (Figure 7).

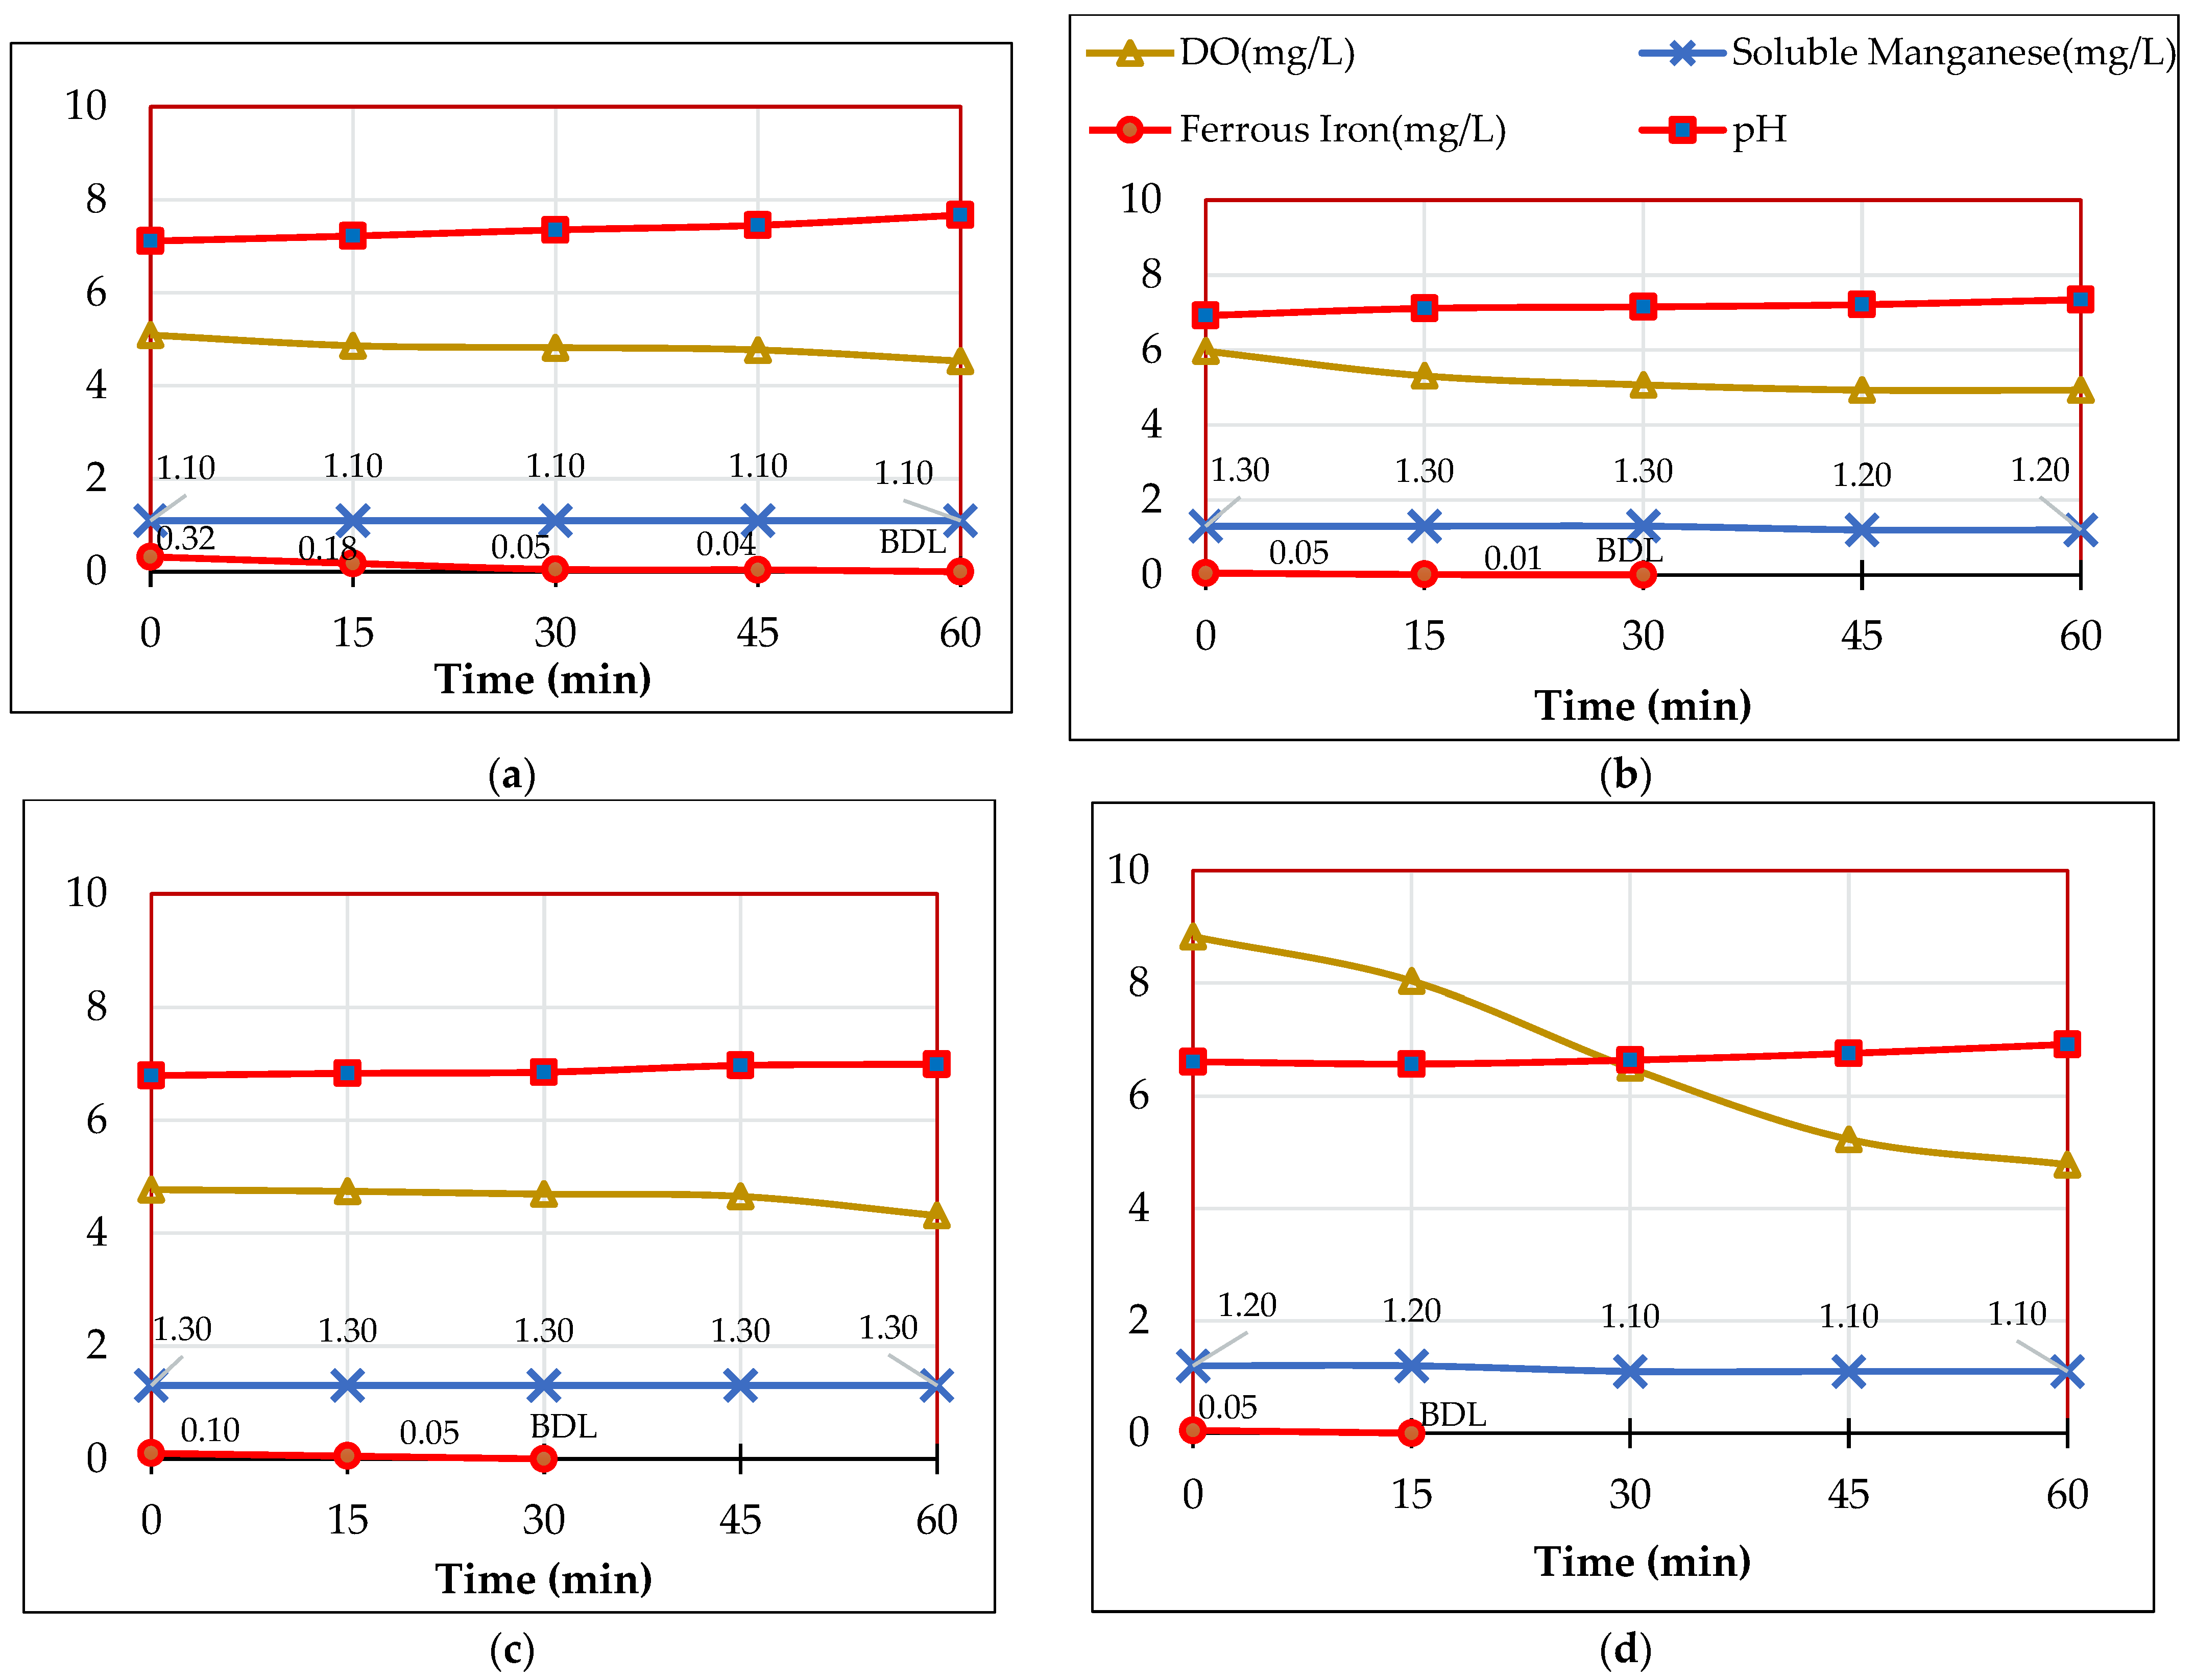
3.2. Iron and Manganese Oxidation through Stirring and Re-Aeration

The ferrous iron (0.05–0.32 mg/L) remaining in the treated water from the full-scale aeration–RSF plants was oxidized to BDL within 60 min of stirring; however, the soluble manganese (1.10–1.20 mg/L) slightly decreased by less than 8.33% even after 60 min of stirring (Figure A2), indicating the slow oxidation of manganese compared with ferrous iron. For the treated water of Duhabi, a stirring experiment was not performed due to the low DO value (<2.48 mg/L). As a result of aeration to saturate DO, the ferrous iron (0.05–0.44 mg/L) in treated water was oxidized below the BDL within 90 min; however, the soluble manganese (1.10–1.40 mg/L) decreased by less than 27.27% even after 90 min, remaining at concentrations above the national standard of 0.20 mg/L (Figure A3). These results show the inefficiency of aeration and the requirement of oxidizing chemicals and catalysts for the oxidation of soluble manganese.

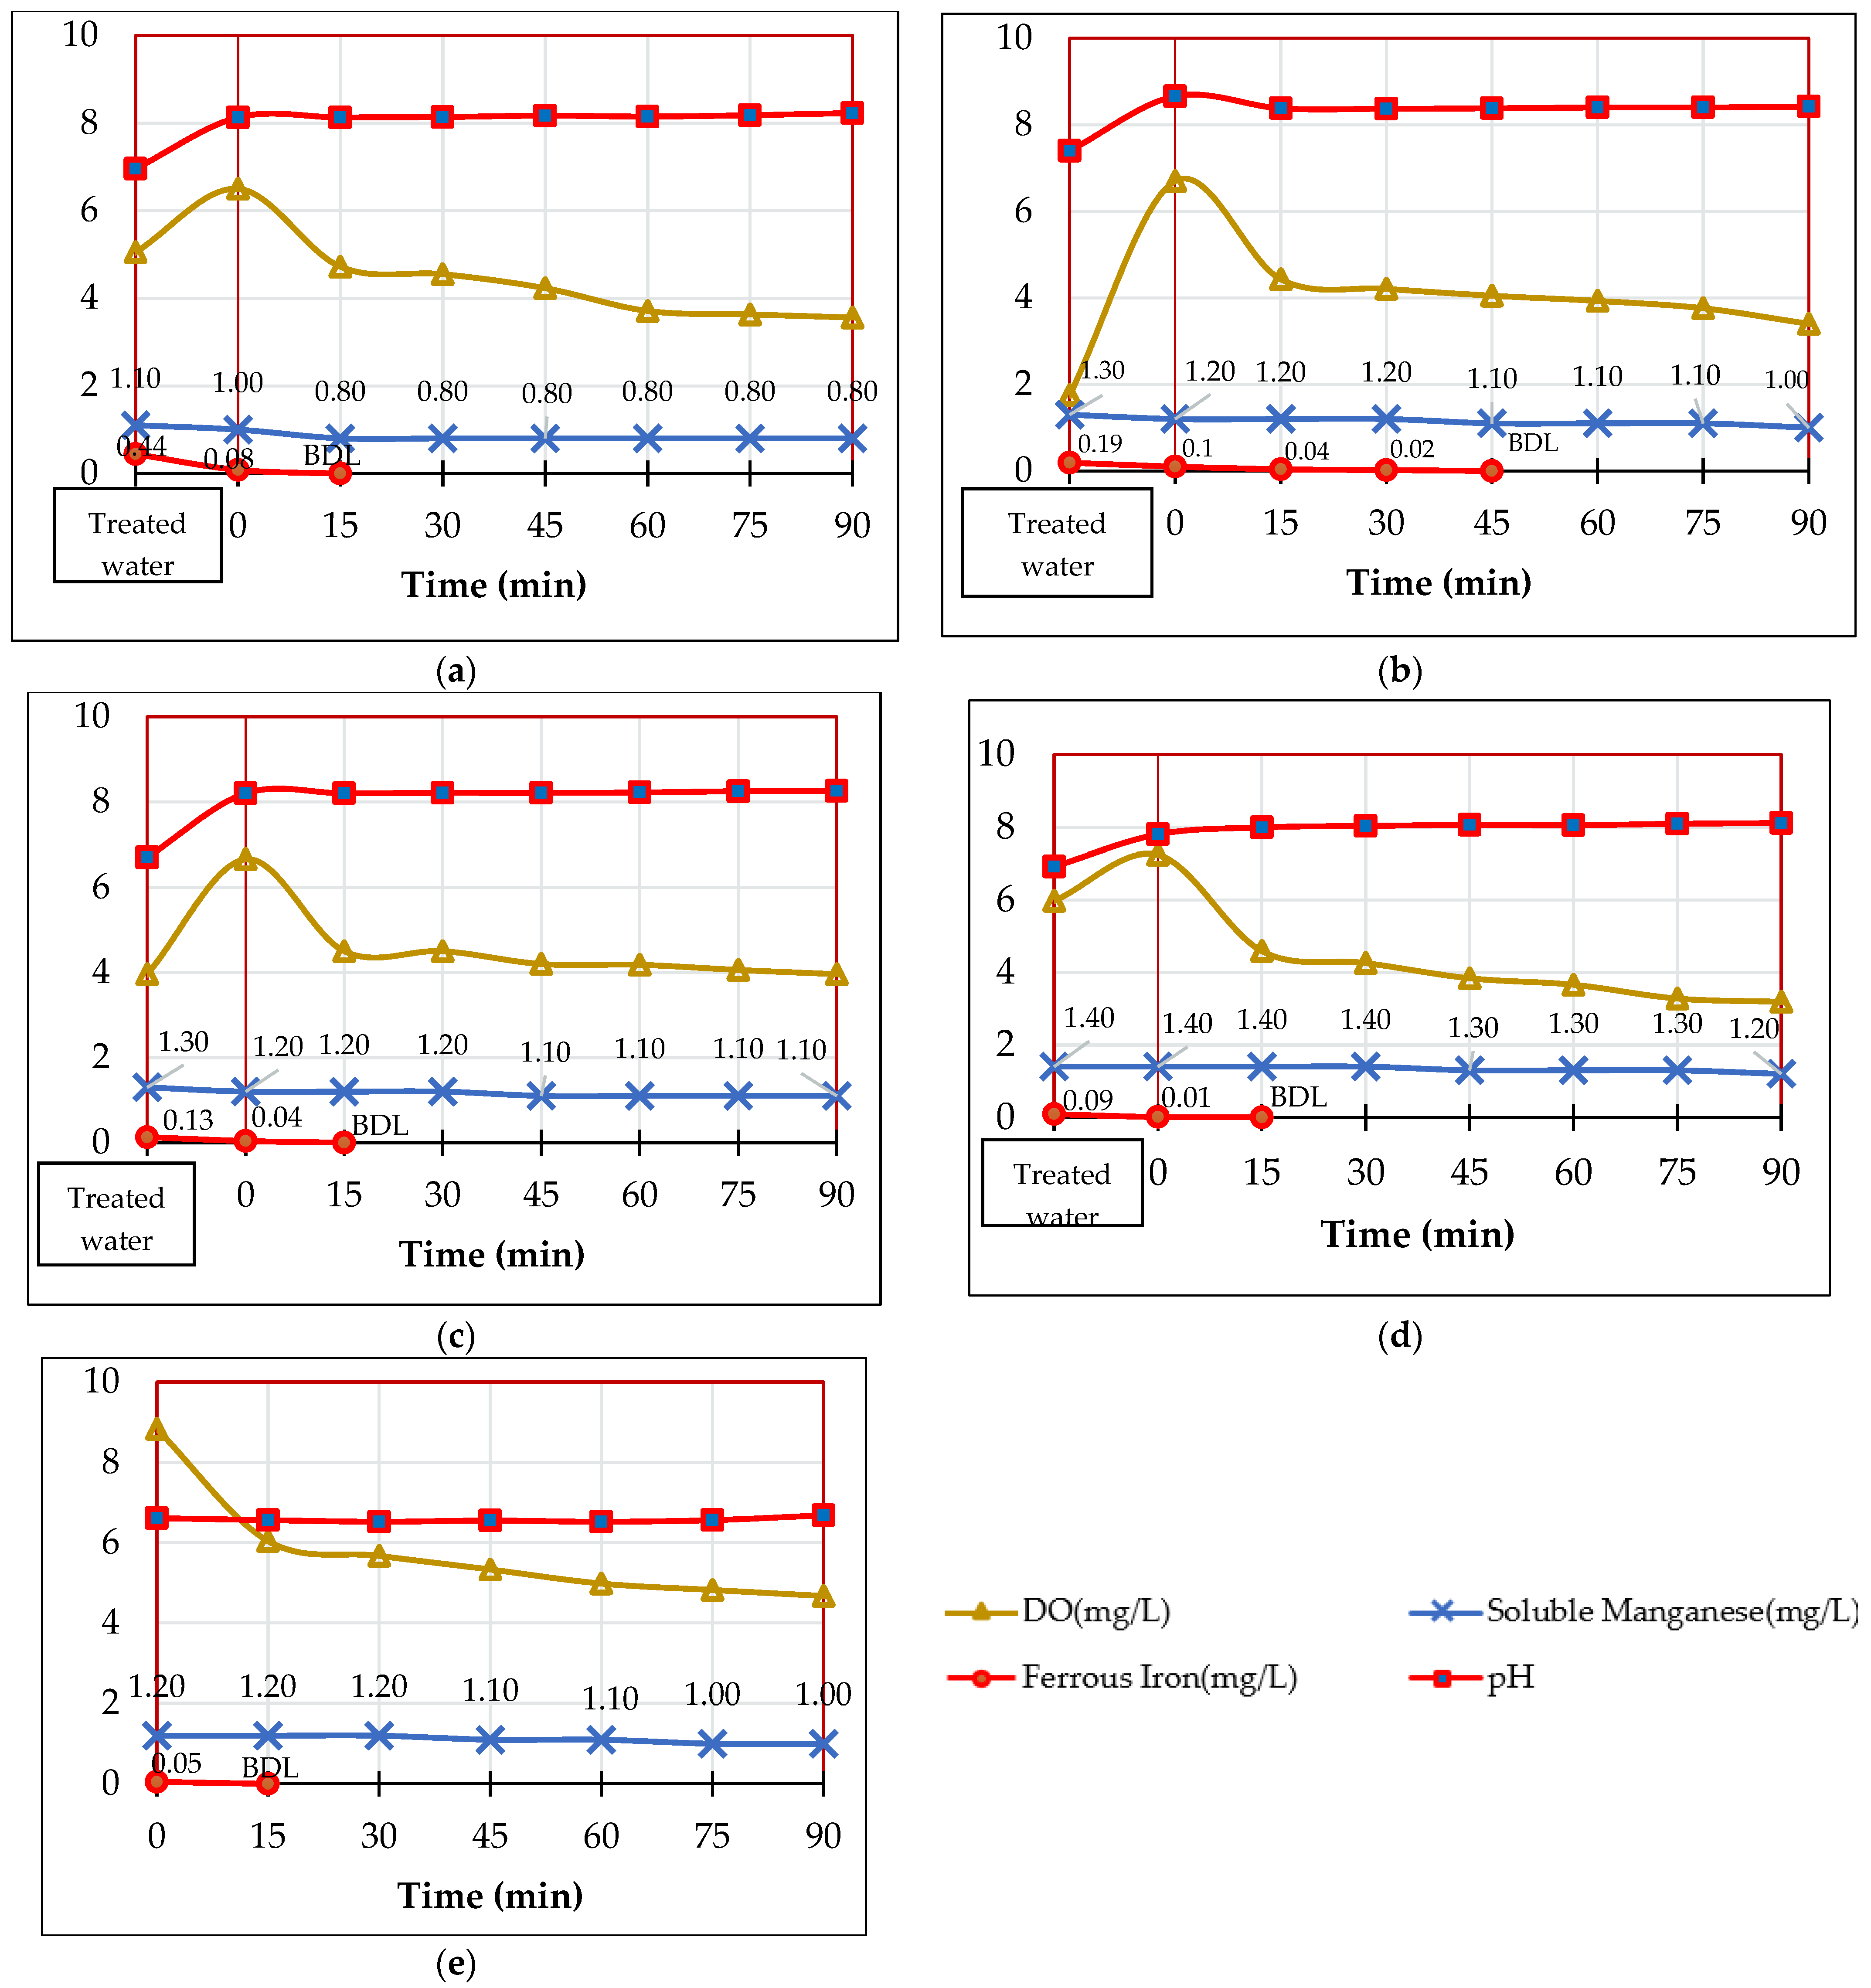
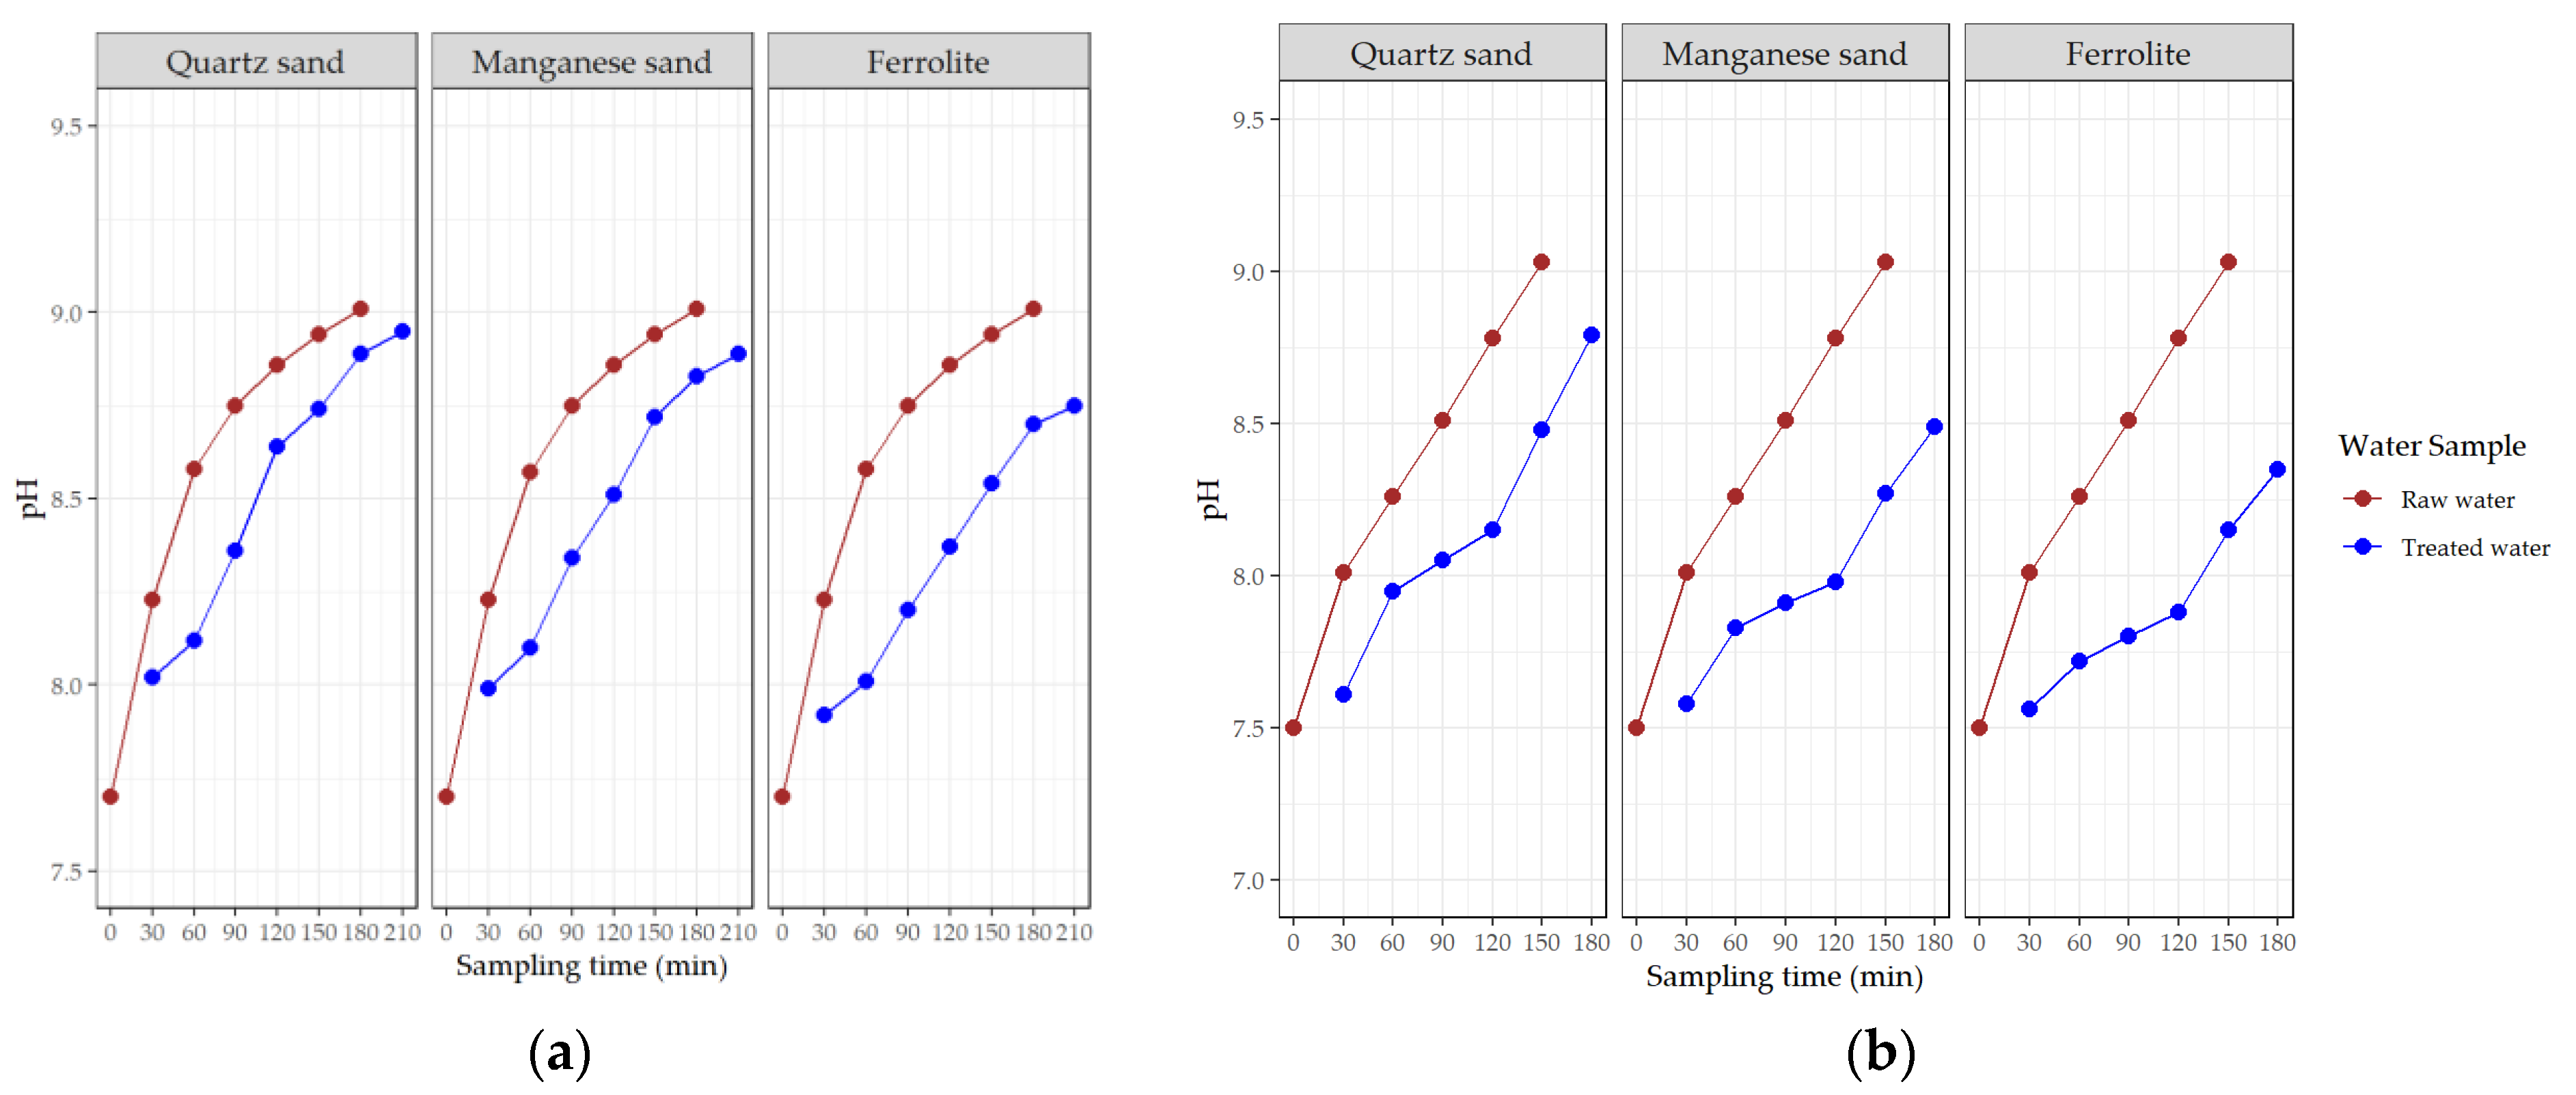
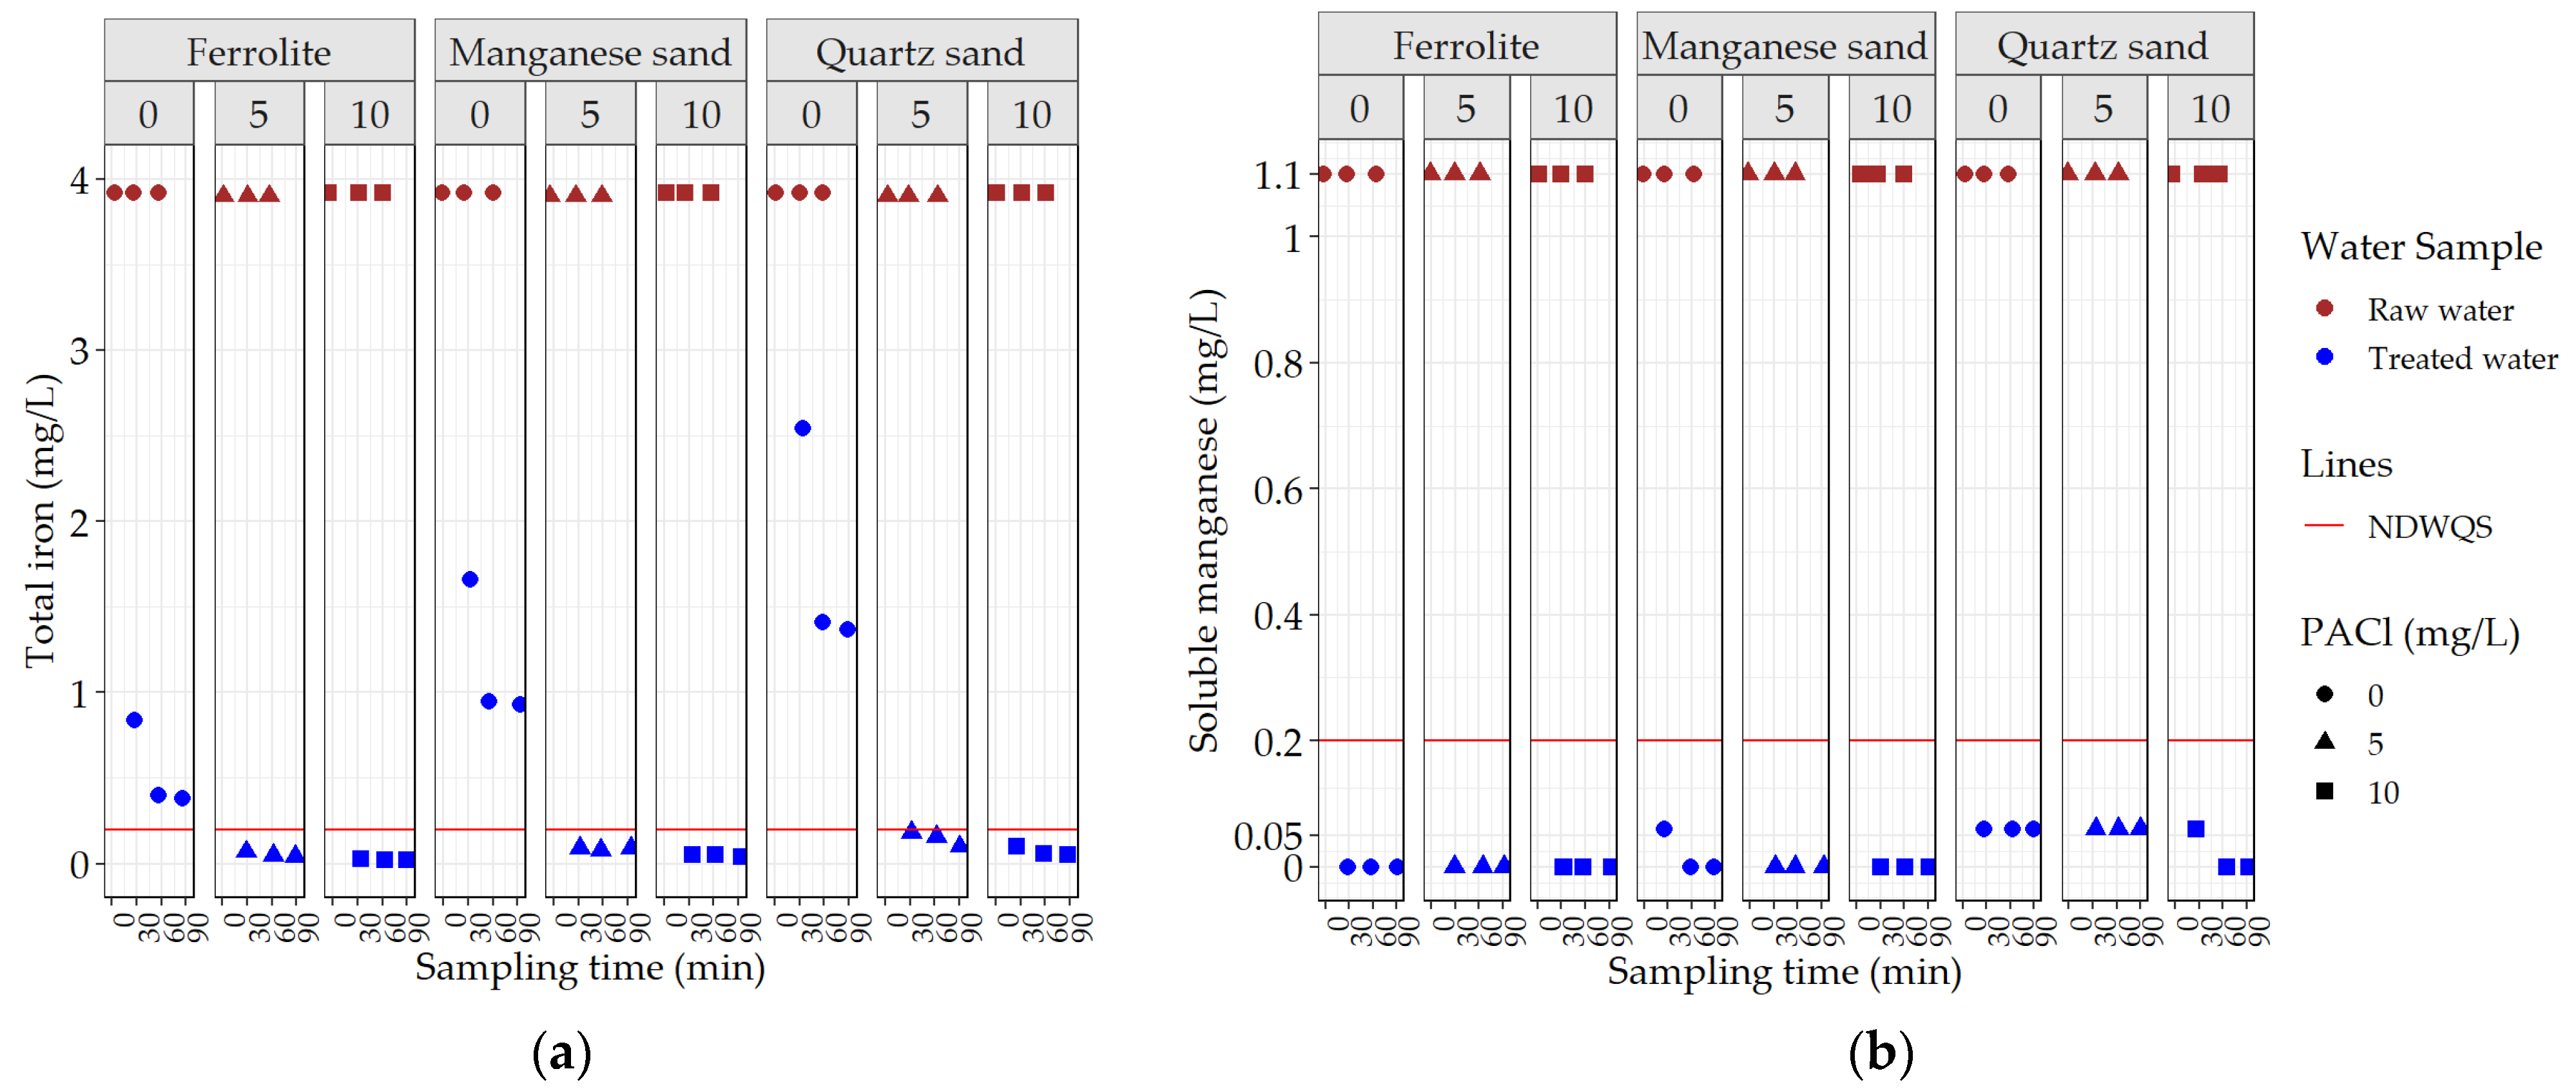
3.3. Bench-Top Filtration Experiments on Raw Water

Raw water from two WSPs, i.e., Jhumka and Inaruwa, was filtered separately using dual-media filters filled with three different filter media: quartz sand, manganese sand, and ferrolite beneath anthracite. Table 2 shows the raw water quality measured after transportation from the WSPs to the laboratory. The pH of the raw water was weakly alkaline, with a slightly higher pH in Jhumka (7.60) than in Inaruwa (7.45), which favored the adsorption of iron and manganese [10]. The turbidity of the raw water from Inaruwa was very high (30.28 NTU); this indicated increased turbidity compared with that measured at the sampling point (2.01 NTU) due to the oxidation of a high concentration of ferrous iron (3.54 mg/L) during transportation from the sampling point to the experimental laboratory. High turbidity in raw water interferes with manganese adsorption on filter media [68]; thus, a PACl solution was added to the raw water from Inaruwa to remove the turbidity in the anthracite layer of the filtration columns.
Among the three filtration columns, Column 3 (with ferrolite on the lower layer) consumed the maximum amounts of chlorine by filtering clean water containing chlorine through the filter media. The filter media used to filter the raw water from Jhumka were cleaned with 2 mg/L of chlorine, which resulted in 1.12 mg/L of chlorine consumption by Column 3 even after 3 h of cleaning; then, the filter media used to filter the raw water from Inaruwa were cleaned with 3 mg/L of chlorine for up to 5 h, which resulted in chlorine consumption by Column 3 of up to 0.42 mg/L. Based on these results, the chlorine dosage to be injected into the raw water from Jhumka was calculated to be approximately 3.05 mg/L as follows: the stoichiometric dose needed to oxidize iron and manganese (0.62 × 0.03 +1.29 × 1.10 = 1.43 mg/L) + chlorine consumed by filter media (1.12 mg/L) + minimum residual chlorine (0.50 mg/L). The chlorine dosage for the raw water from Inaruwa was calculated to be approximately 2.59 mg/L as follows: the stoichiometric dose needed to oxidize iron and manganese (0.62 × 0.42 +1.29 × 1.10 = 1.67 mg/L) + chlorine consumed by filter media (0.42 mg/L) + minimum residual chlorine (0.50 mg/L).
Figure 8a shows the total iron concentrations in the raw water and treated water from Jhumka in the bench-scale filtration experiments, which were operated for 180 min with a pre-dose of 3.10–3.18 mg/L chlorine and without PACl. The total iron concentration in the raw water (0.82 mg/L) was reduced below the national standard of 0.30 mg/L through filtration with any of the three filter media. However, the total iron concentration in the treated water decreased when using quartz sand (0.09–0.19 mg/L), manganese sand (0.04–0.12 mg/L), and ferrolite (0.01–0.05 mg/L). Figure 8b shows the soluble manganese concentrations in the raw and treated water from Jhumka in the bench-scale filtration experiments, which were operated for 180 min with a chlorine pre-dose of 3.10–3.18 mg/L and without PACl. After filtration, the soluble manganese concentration in raw water (1.10 mg/L) decreased below 0.20 mg/L when using any of the three filter media. However, 0.06 mg/L of soluble manganese remained in the water filtered with quartz sand until 120 min, but the concentration was reduced to below the BDL (soluble manganese 0.01 mg/L) after a filtration time of 150 min. The soluble manganese in the raw water was reduced to the BDL after 90 min of filtration with manganese sand, whereas the soluble manganese in the water filtered with ferrolite was below the BDL before 30 min of filtration.
To determine the effects of the PACl dosage, paper filtration using a paper filter (pore size 5 μm) was conducted at various PACl doses of 0, 5, and 10 mg/L. Since 0.42 mg/L of ferrous iron in 3.92 mg/L of total iron was present in the raw water, which could not be filtered using paper filtration, chlorine was dosed at 1 mg/L to oxidize the ferrous iron before filtration; then, filtering the raw water through the filter paper without a PACl dosage reduced the 3.92 mg/L of total iron to 2.74 mg/L. At a PACl dosage of 5 mg/L, the total iron was decreased to 0.24 mg/L through paper filtration. Then, at a PACl dosage of 10 mg/L, the total iron concentration in the filtered water was decreased to 0.10 mg/L. Based on these paper filtration experiments, the bench-scale filtration experiments for the raw water of Inaruwa were conducted at PACl dosages of 0, 5, and 10 mg/L.
Figure 9a shows the total iron concentrations in the raw water and treated water from Inaruwa in the bench-scale filtration experiments with different PACl dosages of 0, 5, and 10 mg/L. After filtration, without a PACl dose, the total iron concentration (3.92 mg/L) decreased to 0.38 mg/L in 90 min using ferrolite, which was above the national standard of 0.30 mg/L. The total iron concentrations in the filtered water decreased from those at 30 min to 1.37–2.54 mg/L, 0.93–1.66 mg/L, and 0.38–0.84 mg/L when using quartz sand, manganese sand, and ferrolite, respectively, after 60–90 min of filtration due to the clogging and retention of iron-oxide particles in the filter layers; however, all of the filtered water contained total iron concentrations above the standard of 0.3 mg/L without the addition of the coagulant (PACl).
After backwashing the filter media, PACl at a dosage of 5 mg/L was injected into the raw water before the bench-scale filtration experiments; then, the total iron concentrations in the filtered water were reduced to 0.10–0.18 mg/L, 0.08–0.09 mg/L, and 0.04–0.07 mg/L when using quartz sand, manganese sand, and ferrolite, respectively, after 90 min. A further increase in the PACl dose to 10 mg/L slightly decreased the total iron concentrations in the filtered water to 0.05–0.10 mg/L, 0.04–0.05 mg/L, and 0.02–0.03 mg/L when using quartz sand, manganese sand, and ferrolite, respectively, after 90 min.
Figure 9b shows the soluble manganese concentrations in the raw water and treated water from Inaruwa in the bench-scale filtration experiments and in the filtered water over the course of 90 min of filtration with PACl doses of 0, 5, and 10 mg/L. Even without the PACl doses, the soluble manganese concentrations in the raw water (1.10 mg/L) decreased below the standard of 0.2 mg/L for all three of the filter media; ferrolite decreased the soluble manganese concentration to the BDL within 30 min of filtration, whereas it took 60 min of filtration to bring the soluble manganese concentration to the BDL using manganese sand. However, soluble manganese was present at a concentration of 0.06 mg/L when using no PACl and a 5 mg/L dose in the filtered water when using the quartz sand filter, whereas, with a PACl dose of 10 mg/L, the manganese concentration decreased to the BDL after 60 min of filtration.
Figure 10a shows the soluble manganese concentrations in the raw water and filtered water from Jhumka at various pH levels with chlorine doses of 3.10–3.18 mg/L and without PACl. The concentration of soluble manganese in the raw water was 1.00 mg/L, which was reduced to the BDL at a pH of 7.70–9.01 when using all three media. Figure 10b shows the soluble manganese concentration in the raw water from Inaruwa and in the filtrate at various pH levels with a chlorine dose of 2.60–2.78 mg/L and 10 mg/L of PACl in the bench-scale filtration experiments. The concentration of soluble manganese in the raw water was 1.10 mg/L, which was reduced to the BDL using manganese sand and ferrolite at a pH of 7.50–9.03. For quartz sand, a soluble manganese concentration of 0.06 mg/L was present at a pH below 8.26; however, when the pH was increased to 8.26–9.03, the soluble manganese concentration was reduced to the BDL. These results show that pH levels in the range of 7.5–9.1 had little effect on the removal of soluble manganese.
Figure A5 shows the chlorine consumed in the bench-scale filtration experiments. Free chlorine at 3.10–3.18 mg/L and 2.60–2.78 mg/L was injected into the raw water from Jhumka and Inaruwa, respectively. Figure A5a shows the chlorine consumption of the three filter media in the filtration of raw water from Jhumka, namely, 0.64–0.46 mg/L, 1.18–0.89 mg/L, and 2.67–2.12 mg/L for quartz sand, manganese sand, and ferrolite, respectively. By increasing the pH in the raw water (Figure A5b), the consumption of chlorine by the filter media decreased from 0.78 mg/L to 0.43 mg/L, from 1.21 mg/L to 0.43 mg/L, and from 2.09 mg/L to 0.92 mg/L for quartz sand, manganese sand, and ferrolite, respectively. Similarly, the consumption of chlorine by the filter media in the filtration of raw water from Inaruwa was as follows: 0.78–0.60 mg/L, 1.05–0.80 mg/L, and 1.60–1.07 mg/L for quartz sand, manganese sand, and ferrolite, respectively (Figure A5c). With a PACl dosage of 10 mg/L, increasing the pH of the raw water decreased the chlorine consumption from 0.92 mg/L to 0.53 mg/L, from 1.10 mg/L to 0.62 mg/L, and from 1.38 mg/L to 0.87 mg/L for quartz sand, manganese sand, and ferrolite, respectively (Figure A5d). The higher chlorine consumption of ferrolite and manganese sand indicated the higher reactivity of these filter media than of quartz sand. The chlorine consumption decreased with increased filtration time and pH in the raw water. The pH in the raw water from Jhumka (7.70) was increased to 8.23–9.01; after filtration, the pH in the treated water decreased to 8.12–8.95, 8.10–8.89, and 8.01–8.75 for quartz sand, manganese sand, and ferrolite, respectively (Figure A6a). The pH in the raw water from Inaruwa (7.50) was increased to a pH of 8.01–9.03; after filtration, the pH in the treated water was 7.95–8.79, 7.83–8.49, and 7.72–8.35 for quartz sand, manganese sand, and ferrolite, respectively (Figure A6b). For the filtered water, at 30 min, the increased pH was due to the addition of NaClO (pH = 13), as the pH of the raw water at 0 min was measured without the addition of NaClO. However, when the pH in the raw water was increased to 9 after the addition of sodium hydroxide and NaClO, there was a decrease in the pH of the filtered water. At a high pH (>6), the quantity of hypochlorite ions increased through the dissociation of hypochlorous acid (HOCl → OCl¯ + H+ [69]) according to the following equation: NaClO + H2O → HOCl + NaOH. Thus, H+ ions were released; this may have been the reason for the decrease in the pH of the filtered water. The pH reduction in the treated water from Inaruwa was greater than that in the water from Jhumka because of the dose of PACl for coagulation [70].

4. Discussion

4.1. Variations in Iron and Manganese in the Groundwater in the Study Area

The water quality parameters, such as the pH, TDSs, and iron concentration, of the groundwater were similar among some WSPs, indicating that the groundwater might have been extracted from aquifers with similar geological conditions. However, the iron concentrations in the groundwater varied extensively at each location of the WSPs, indicating the effects of the reduction–oxidation (redox) conditions in the local aquifers on the iron concentration. Although the iron concentrations in the groundwater varied extensively in both the dry and rainy seasons, the mean iron concentration decreased from the dry season to the rainy season. However, the soluble manganese concentration in the groundwater in the rainy season significantly increased on that in the dry season, indicating increased leaching from manganese-bearing minerals and rocks [66,71]. These results suggest that it is important to monitor groundwater quality throughout the year or at least to set the design and operational conditions of iron and manganese removal processes in the dry and rainy seasons.

4.2. Iron and Manganese Removal through Aeration–RSF in the WSPs

The WSPs installed and operated aeration–RSF processes for the removal of iron and manganese, with some WSPs employing MnO2-coated pebbles and manganese sand. Although ferrous iron was oxidized and removed to concentrations below the national standard of 0.30 mg/L through aeration–RSP processes, small amounts of ferrous iron remained in the treated water. With additional stirring and re-aeration, the remaining ferrous iron in the treated water was removed to the BDL within 60 min, which indicated the importance of effective and extended aeration for oxidation for the removal of ferrous iron in raw water. The oxidation of manganese in the existing aeration–RSF processes was very slow, even in those using MnO2-coated pebbles and manganese sand; additional stirring and re-aeration of treated waters could not oxidize soluble manganese. The Eh−pH diagrams of iron and manganese (Figure A7) [71] show the most stable forms of iron and manganese based on the Eh and pH of water [72]; because the pH and Eh values of water treated through aeration–RSF were 6.68–7.37 and 0.25–0.43 V, respectively, in the dry season and 6.62–7.42 and 0.23–0.38 V, respectively, in the rainy season, the most stable form of iron was found to be Fe2O3, whereas the most stable form of manganese was found to be Mn[2+]. Therefore, ferrous iron is readily oxidized through aeration, whereas soluble manganese is not [64]; thus, to oxidize soluble manganese to MnO2, a high pH (>10) and/or high Eh (>0.40 V) for oxidation through the addition of alkaline solution and/or oxidizing chemicals is required.
Because the iron loading per filter run is inversely correlated with manganese removal efficiency in aeration–RSF [38], for the treatment plants at Jhumka and Mahendrangar, the raw water with high iron concentrations may have resulted in comparatively low manganese removal. The iron concentration was high in the raw water from Jhumka (1.91 mg/L) and Mahendranagar (1.56 mg/L) and in both raw water samples from Inaruwa (3.81 and 4.09 mg/L); therefore, the installation of additional pre-treatment or dual-media filters for iron removal may improve the manganese removal efficiency in those WSPs.
The low pH in the raw water from Mahendrangar may be one reason for the low soluble manganese removal rate, as the physiochemical removal of manganese in aeration–RSF is poor at a low pH [38]; with the lowest value overall, a soluble manganese removal rate of only 8.28% was found in the process of treating raw water with a low pH of 6.70 in Mahendranagar. High iron concentrations (1.56 mg/L) and poor backwashing of the filter media (twice a week) might also have caused low soluble manganese removal rates. The MnO2-coated pebbles in the aeration unit of TP1 in Inaruwa showed comparatively better manganese removal efficiency than that of TP2 in Inaruwa, which had pall rings in its aeration unit (without MnO2-coated pebbles). MnO2-coated pebbles were also present in the aeration unit of Mahendranagar, but the manganese removal in Inaruwa and Mahendranagar was not sufficient to decrease the soluble manganese below the national standard of 0.20 mg/L. Large sizes of the MnO2-coated media (pebbles) and improper placement of coated media (in the aeration unit) are possible reasons for the incomplete removal of soluble manganese. A high specific surface area is an important property of adsorbents, as they must provide a large number of active sites for adsorption [73]; however, because the raw water had a high iron concentration, the iron attached to the surfaces of MnO2-coated pebbles in the aeration unit might have covered the adsorption sites for manganese [68]. In the Inaruwa WSP, the treated water had a high total iron concentration comprising mostly ferric iron, which indicated the poor performance of the RSF unit despite the daily backwashing of the RSF. Although the oxidation of iron can be increased by providing effective oxidation, the removal of ferric iron in colloidal form requires efficient filtration; proper filter media, proper backwashing, regular monitoring of media (condition and level), and addition/replacement are required. Therefore, the design and operation of the aeration–RSF systems in WSPs should be closely examined and revised if necessary.
In the Duhabi WSP, even though the aeration system was not in operation, a manganese removal efficiency of 16.4–23.5% was achieved; this was mostly due to the adsorption of soluble manganese to the filter media. The low iron concentration, high pH of the raw water, and additional manganese sand layer, along with the quartz sand, may have contributed to the removal of manganese [10,34]. Operation of the aeration system or setting up another oxidant system would further improve the manganese removal rate in Duhabi.

4.3. Improvement of Manganese Removal Using Dual-Media Filters Filled with Different Filter Media

Dual-media filtration was effective in the two-step removal of iron and manganese; iron was removed in the top anthracite layer even without the injection of a coagulant (PACl); this was followed by the removal of manganese in the sand or ceramic layer. The removal of iron flocs in the anthracite layer reduced the clogging of the sand or ceramic layer below the anthracite layer. Coagulant injection is recommended only if the iron concentration in the raw water is high, which interferes with the auto-catalytic oxidation and removal of soluble manganese. Among the three filter media tested, ferrolite was the most efficient in the removal of soluble manganese, while manganese sand and quartz sand were also able to reduce the concentration of soluble manganese to below the national guideline of 0.2 mg/L through the addition of chlorine. In addition, the filter media used in this study can be regenerated using chorine or permanganate solutions when they lost adsorption capacities of manganese. Thus, it is expected that we can use these filter media for several years. The dual-media filtration process could be used as a measure for controlling high iron and manganese concentrations in Water Safety Plans proposed by the World Health Organization [74].
When the pH of the raw water is >7.50, the oxidation of soluble manganese using chlorine with all three media was effective at a linear velocity of 5 m/h, while further increasing the pH contributed to a reduction in the required chlorine dose and the stabilization of manganese removal. The full-scale treatment plants of WSPs are operated at a very high linear filtration velocity of above 20 m/h, which is another reason for the low efficiency of soluble manganese removal. Thus, increasing the pH might allow us to increase the filtration velocity by increasing the adsorption capacity of MnO2-coated filter media [30] and making chlorine oxidation more effective [28].
Although the dual-media filters used in this study showed high iron and manganese removal efficiencies, the initial and operational costs may increase from the conventional RSFs. While chlorine and PACl are easily available and affordable because these chemicals are used in the water treatment plants sourced from surface waters, high-quality products of MnO2-coated filter media, both sand and ceramics, are not available locally; thus, the initial construction cost might increase from those of conventional RSFs. Therefore, considering the importance of iron and manganese removal from groundwater, national and regional governments should subsidize construction of dual-media filters. In the design and operation of full-scale plants, it is important to prevent by-pass flow that might cause leakages of iron and manganese. Furthermore, chlorine dosages for oxidation of iron and manganese might produce disinfection by-products (DBPs). Therefore, to prevent DBP formation, chlorine doses should be carefully controlled to a level minimally adequate for oxidation of iron and manganese.

5. Conclusions

The iron concentration in the groundwater of five WSPs in the Sunsari district, Nepal, varied extensively, while the variations in manganese concentrations were small among these WSPs. These results show the susceptibility of iron leaching to local geological conditions—especially the redox potential—in comparison with manganese, which indicates that the design and operation of aeration–RSF processes should be modified even in the same areas based on the maximum concentrations of iron and manganese. While the iron concentration decreased in the rainy season compared with the dry season, the manganese concentration increased, which indicated that different processes influenced the iron and manganese concentrations in groundwater. Therefore, we should monitor iron and manganese concentrations throughout the year for the design and operation of aeration–RSF processes.
Although ferrous iron was removed through aeration–RSF processes in the WSPs, soluble manganese was not oxidized even with an extended duration of stirring and aeration. Manganese-oxide-coated pebbles and sand were not effective in the oxidation and removal of soluble manganese; this was possibly due to the large surface areas (pebbles) and clogging of sand filters by iron oxide flocs. The chlorine oxidation of manganese followed by dual-medium filtration using anthracite and sand or ceramics was found to be efficient in removing soluble manganese by retaining iron oxide flocs in the top anthracite layer followed by the auto-catalytic oxidation of soluble manganese in the lower filter layer, which was filled with manganese sand or MnO2-coated ceramics (ferrolite). Among the three filter media used in this study, ferrolite was the most efficient, as it showed a stable manganese concentration in the treated water, followed by manganese sand and quartz sand. A chlorine dose is indispensable for the oxidation of manganese; maintaining 0.5 mg/L of residual chlorine in the effluent from filters was sufficient to oxidize soluble manganese.
Although sand and manganese sand are used as filter media in the WSPs in Nepal, the results of this study suggest the importance of designing RSF units with dual-medium filters, selecting filter media with a high capacity for manganese adsorption, and dosing chlorine to remove manganese from groundwater. Because iron concentrations are higher than manganese concentrations and iron is readily oxidized through aeration, it is suggested to oxidize ferrous iron completely in an aeration unit, followed by a chlorine dose for the oxidation of soluble manganese to reduce the chlorine dosage. Dual-media filtration using anthracite and sand/ceramics is an efficient method for removing iron and manganese in small filter units. Therefore, we propose the standardization of the design and operation of processes for removing iron and manganese from groundwater in developing countries, including Nepal.

Author Contributions

Conceptualization, S.T. and S.K.; methodology, S.T. and B.S.; validation, B.S., S.K. and S.T.; formal analysis, A.M.S.; investigation, A.M.S.; data curation, A.M.S.; writing—original draft preparation, A.M.S.; writing—review and editing, B.S., S.K. and S.T.; visualization, A.M.S.; supervision, B.S., S.K. and S.T.; project administration, S.T.; funding acquisition, S.T. All authors have read and agreed to the published version of the manuscript.

Funding

This research was supported by the Japan International Cooperation Agency (JICA) through a collaborative program with the University of Tokyo and a scholarship provided to Ankit Man Shrestha for his graduate studies. This study was also supported by a Grant-in-Aid for Scientific Research (No. 22H01621) provided by the Japan Society for the Promotion of Sciences (JSPS).

Data Availability Statement

The data presented in this study are available upon request.

Acknowledgments

The authors would like to express their gratitude to Duhabi, Inaruwa, Jhumka, Mahendranagar, and Pakali Water Supply and Sanitation Users Committees, the Urban Water Supply and Sanitation Sector Project, the Regional Project Management Office, Sunsari and Tohkemy Corporation, Osaka, Japan for their support in conducting this research.

Conflicts of Interest

The authors declare no conflicts of interest.

Abbreviations

DBPsDisinfection by-products
PAClPoly aluminum chloride
MnO2Manganese oxide
WTPWater treatment plant
RedoxReduction–oxidation
RSFRapid sand filter
MOCAManganese-oxide-coated anthracite
NDWQSNational Drinking Water Quality Standards, Nepal
WUSAWater Users and Sanitation Association
RWRaw water
TWTreated water
GWGroundwater
TPTreatment plant
TDSsTotal dissolved solids
DODissolved oxygen
ORPOxidation reduction potential
SHEStandard hydrogen electrode
BDLBelow detection limit
NaClOSodium hypochlorite

Appendix A

Table A1. Selected water supply projects in the study.
Name of Urban MunicipalityNo. of WSPsNo. of WSPs with DTB as Main SourceNo. of WSPs with GWTPSelected WSPs (No. of DTBs)Name of Selected WSPsRemarks
Dharan81000 WSP based on surface water
Duhabi1111 (5)DuhabiOne WSP from each of five urban municipalities is selected
Inaruwa1111 (4)Inaruwa
Ramdhuni8731 (2)Jhumka
Baraha23951 (3)Mahendranagar
Itahari5421 (2)Pakali
Total11922125 (16)
Notes: WSP: water supply project, DTB: deep tubewell, GWTP: groundwater treatment plant.
Table A2. Physicochemical water quality of the water samples (first field survey: 23 February–13 March 2023, dry season).
Water Supply ProjectWater SourceTemperature (°C)pHTurbidity (NTU)TDS (mg/L)Eh (V)Ferrous Iron (mg/L)Total Iron (mg/L)Soluble Manganese (mg/L)
DuhabiGW 129.07.320.142300.270.030.051.0
GW 229.07.440.332150.180.040.390.8
GW 328.07.340.322440.150.270.441.3
GW 428.07.850.272380.27BDL0.091.0
GW 528.07.440.342380.240.050.211.1
InaruwaGW 126.07.161.361240.172.083.901.2
GW 227.06.660.311360.204.324.681.4
TW126.06.680.561280.41BDL0.521.0
GW 327.47.020.761110.163.004.020.8
GW 427.07.012.541370.143.244.840.9
TW228.06.720.161070.37BDL0.500.7
JhumkaGW 126.86.853.072280.184.224.541.1
TW126.16.990.321910.430.870.990.6
GW 228.07.102.602070.260.260.310.9
TW226.07.110.102000.41BDL0.040.4
MahendranagarGW 124.06.703.941820.260.791.170.8
GW 326.06.690.231730.290.700.701.5
TW125.07.030.371850.410.030.161.1
GW 225.06.800.332120.212.562.721.0
PakaliGW 124.06.950.721830.230.170.240.9
TW125.07.690.341850.30BDL0.060.5
GW 226.07.0311.702160.181.021.301.4
TW226.07.370.712030.25BDL0.070.6
Notes: GW: groundwater, TW: treated water, TDS: total dissolved solids, BDL (below detection limit): ferrous iron 0.02 mg/L.
Figure A1. Oxidation experiments on treated water: (a) stirring in a sealed bottle; (b) aeration experiment.
Water 16 02450 g0a1
Figure A2. Parameters after stirring treated water from different water supply projects: (a) Jhumka; (b) Pakali; (c) Mahendranagar; (d) Inaruwa.
Water 16 02450 g0a2
Figure A3. Parameters after the aeration of treated water from different water supply projects up to the saturation level of DO: (a) Jhumka; (b) Duhabi; (c) Mahendranagar; (d) Pakali; (e) Inaruwa (the DO in treated water from Inaruwa was at the saturation level).
Water 16 02450 g0a3
Figure A4. Black precipitate in treated water due to manganese at (a) household tap (in Jhumka) and (b) dead-end washout point (in Mahendranagar).
Water 16 02450 g0a4
Figure A5. Chlorine consumption in the bench-scale filtration experiment for raw water from (a) Jhumka without pH adjustment (pH 7.60), (b) from Jhumka with pH adjustment (pH 7.70–9.01), (c) from Inaruwa without pH adjustment (pH 7.40), and (d) from Inaruwa with pH adjustment (pH 7.50–9.03).
Water 16 02450 g0a5
Figure A6. pH in water samples after pH adjustment in the bench-scale filtration experiment for raw water from (a) Jhumka and (b) Inaruwa.
Water 16 02450 g0a6
Figure A7. Eh−pH diagrams of the system: (a) Fe-O-H; (b) Mn-O-H [71].
Water 16 02450 g0a7

References

  1. Zhang, X.; Hu, B.; Wang, P.; Chen, J.; Yang, L.; Xiao, K.; Zhang, X. Hydrogeochemical Evolution and Heavy Metal Contamination in Groundwater of a Reclaimed Land on Zhoushan Island. Water 2018, 10, 316. [Google Scholar] [CrossRef]
  2. Sharma, G.K.; Jena, R.K.; Ray, P.; Yadav, K.K.; Moharana, P.C.; Cabral-Pinto, M.M.S.; Bordoloi, G. Evaluating the Geochemistry of Groundwater Contamination with Iron and Manganese and Probabilistic Human Health Risk Assessment in Endemic Areas of the World’s Largest River Island, India. Environ. Toxicol. Pharmacol. 2021, 87, 103690. [Google Scholar] [CrossRef]
  3. Islam, M.Z.; Mostafa, M.G. Iron, Manganese, and Lead Contamination in Groundwater of Bangladesh: A Review. Water Pract. Technol. 2024, 19, 745–760. [Google Scholar] [CrossRef]
  4. WHO. Fourth Edition Incorporating the First and Second Addenda Guidelines for Drinking-Water Quality; World Health Organization: Geneva, Switzerland, 2022. [Google Scholar]
  5. Krishnakumari, B.; Mohit Abhishek, V.; Puneeth, T.E.; Vignesh, S.; Mohamed, M.K. Irfan Removal of Iron and Manganese From Ground Water. Int. J. Eng. Res. 2018, V6, 02. [Google Scholar] [CrossRef]
  6. Amin, S.; Kazama, S.; Sawangjang, B.; Takizawa, S. Causes and Effects of Scale Deposition in Water Supply Pipelines in Surakarta City, Indonesia. Water 2024, 16, 2275. [Google Scholar] [CrossRef]
  7. Wang, M.; Wang, M.; Yang, L.; Yang, T.; Li, J.; Chen, Y. Distribution Characteristics and Genesis of Iron and Manganese Ions in Groundwater of Eastern Sanjiang Plain, China. Water 2023, 15, 2068. [Google Scholar] [CrossRef]
  8. Rahman, M.F.; Ali, M.A.; Chowdhury, A.I.A.; Ravenscroft, P. Manganese in Groundwater in South Asia Needs Attention. ACS ES&T Water 2023, 3, 1425–1428. [Google Scholar] [CrossRef]
  9. Islam, M.S.; Mostafa, M.G. Occurrence, Source, and Mobilization of Iron, Manganese, and Arsenic Pollution in Shallow Aquifer. Geofluids 2023, 2023, 6628095. [Google Scholar] [CrossRef]
  10. Piispanen, J.K.; Sallanko, J.T. Mn(II) Removal from Groundwater with Manganese Oxide-Coated Filter Media. J. Environ. Sci. Health Tox. Hazard. Subst. Environ. Eng. 2010, 45, 1732–1740. [Google Scholar] [CrossRef]
  11. Rusydi, A.F.; Onodera, S.I.; Saito, M.; Ioka, S.; Maria, R.; Ridwansyah, I.; Delinom, R.M. Vulnerability of Groundwater to Iron and Manganese Contamination in the Coastal Alluvial Plain of a Developing Indonesian City. SN Appl. Sci. 2021, 3, 399. [Google Scholar] [CrossRef]
  12. Palmucci, W.; Rusi, S.; Di Curzio, D. Mobilisation Processes Responsible for Iron and Manganese Contamination of Groundwater in Central Adriatic Italy. Environ. Sci. Pollut. Res. 2016, 23, 11790–11805. [Google Scholar] [CrossRef] [PubMed]
  13. Moyosore, J.O.; Coker, A.O.; Sridhar, M.K.C.; Mumuni, A. Iron and Manganese Levels of Groundwater in Selected Areas in Ibadan and Feasible Engineering Solutions. Eur. Sci. J. 2014, 10, 11. [Google Scholar]
  14. Frisbie, S.H.; Mitchell, E.J.; Sarkar, B. Urgent Need to Reevaluate the Latest World Health Organization Guidelines for Toxic Inorganic Substances in Drinking Water. Environ. Health 2015, 14, 63. [Google Scholar] [CrossRef]
  15. Kim, J. Manganese Treatment to Reduce Black Water Occurrence in the Water Supply. Environ. Eng. Res. 2015, 20, 230–236. [Google Scholar] [CrossRef]
  16. Tang, X.; Zhu, X.; Huang, K.; Wang, J.; Guo, Y.; Xie, B.; Li, G.; Liang, H. Can Ultrafiltration Singly Treat the Iron- and Manganese-Containing Groundwater? J. Hazard. Mater. 2021, 409, 124983. [Google Scholar] [CrossRef] [PubMed]
  17. McBeath, S.T.; Hajimalayeri, A.; Jasim, S.Y.; Mohseni, M. Coupled Electrocoagulation and Oxidative Media Filtration for the Removal of Manganese and Arsenic from a Raw Ground Water Supply. J. Water Process. Eng. 2021, 40, 101983. [Google Scholar] [CrossRef]
  18. Xu, L.; Cao, G.; Xu, X.; Liu, S.; Duan, Z.; He, C.; Wang, Y.; Huang, Q. Simultaneous Removal of Cadmium, Zinc and Manganese Using Electrocoagulation: Influence of Operating Parameters and Electrolyte Nature. J. Environ. Manag. 2017, 204, 394–403. [Google Scholar] [CrossRef]
  19. Kononova, O.N.; Bryuzgina, G.L.; Apchitaeva, O.V.; Kononov, Y.S. Ion Exchange Recovery of Chromium (VI) and Manganese (II) from Aqueous Solutions. Arab. J. Chem. 2019, 12, 2713–2720. [Google Scholar] [CrossRef]
  20. Wang, L.K.; Wang, M.-H.S. Evolutionary Progress in Science, Technology, Engineering, Arts and Mathematics (Steam). In Series Innovative Process System Consisting of Dissolved Air Flotation, Recarbonation and Filtration, Using Lime and Sodium Aluminate for Removal of Hardness, Iron and Manganese from Groundwater; Lenox Institute of Water Technology: Lenox, MA, USA, 2022; Volume 4. [Google Scholar] [CrossRef]
  21. Hoyland, V.W.; Knocke, W.R.; Falkinham, J.O.; Pruden, A.; Singh, G. Effect of Drinking Water Treatment Process Parameters on Biological Removal of Manganese from Surface Water. Water Res. 2014, 66, 31–39. [Google Scholar] [CrossRef]
  22. Khadse, G.K.; Patni, P.M.; Labhasetwar, P.K. Removal of Iron and Manganese from Drinking Water Supply. Sustain. Water Resour. Manag. 2015, 1, 157–165. [Google Scholar] [CrossRef]
  23. Jasim, S.Y.; Mohseni, M. Ozone Application for Arsenic and Manganese Treatment at the City of White Rock, BC, Canada. Ozone Sci. Eng. 2019, 41, 322–331. [Google Scholar] [CrossRef]
  24. Hua, M.; Zhang, S.; Pan, B.; Zhang, W.; Lv, L.; Zhang, Q. Heavy Metal Removal from Water/Wastewater by Nanosized Metal Oxides: A Review. J. Hazard. Mater. 2012, 211–212, 317–331. [Google Scholar] [CrossRef]
  25. Jerroumi, S.; Amarine, M.; Gourich, B. Technological Trends in Manganese Removal from Groundwater: A Review. J. Water Process. Eng. 2023, 56, 104365. [Google Scholar] [CrossRef]
  26. Patil, D.S.; Chavan, S.M.; Oubagaranadin, J.U.K. A Review of Technologies for Manganese Removal from Wastewaters. J. Environ. Chem. Eng. 2016, 4, 468–487. [Google Scholar] [CrossRef]
  27. Kouzbour, S.; El Azher, N.; Gourich, B.; Gros, F.; Vial, C.; Stiriba, Y. Removal of Manganese (II) from Drinking Water by Aeration Process Using an Airlift Reactor. J. Water Process. Eng. 2017, 16, 233–239. [Google Scholar] [CrossRef]
  28. El-Sheikh, M.A.; Guirguis, H.S.; Fathy, A. A Comparative Study of Methods Used for Fe and Mn Oxidation and Removal from Groundwater Assessing the Impact of Climate Change on the Eastern Nile View Project Iron and Manganese Removal from Groundwater View Project. J. Eng. Appl. Sci. 2016, 63, 277–292. [Google Scholar]
  29. Tobiason, J.E.; Bazilio, A.; Goodwill, J.; Mai, X.; Nguyen, C. Manganese Removal from Drinking Water Sources. Curr. Pollut. Rep. 2016, 2, 168–177. [Google Scholar] [CrossRef]
  30. Kan, C.C.; Aganon, M.C.; Futalan, C.M.; Dalida, M.L.P. Adsorption of Mn2+ from Aqueous Solution Using Fe and Mn Oxide-Coated Sand. J. Environ. Sci. 2013, 25, 1483–1491. [Google Scholar] [CrossRef] [PubMed]
  31. Mabate, T.P.; Maqunga, N.P.; Ntshibongo, S.; Maumela, M.; Bingwa, N. Metal Oxides and Their Roles in Heterogeneous Catalysis: Special Emphasis on Synthesis Protocols, Intrinsic Properties, and Their Influence in Transfer Hydrogenation Reactions. SN Appl. Sci. 2023, 5, 196. [Google Scholar] [CrossRef]
  32. Michel, M.M.; Reczek, L.; Papciak, D.; Wlodarczyk-Makula, M.; Siwiec, T.; Trach, Y. Mineral Materials Coated with and Consisting of MnOx—Characteristics and Application of Filter Media for Groundwater Treatment: A Review. Materials 2020, 13, 2232. [Google Scholar] [CrossRef]
  33. Jez-Walkowiak, J.; Dymaczewski, Z.; Szuster-Janiaczyk, A.; Nowicka, A.B.; Szybowicz, M. Efficiency of Mn Removal of Different Filtration Materials for Groundwater Treatment Linking Chemical and Physical Properties. Water 2017, 9, 498. [Google Scholar] [CrossRef]
  34. Rudi, N.N.; Muhamad, M.S.; Te Chuan, L.; Alipal, J.; Omar, S.; Hamidon, N.; Abdul Hamid, N.H.; Mohamed Sunar, N.; Ali, R.; Harun, H. Evolution of Adsorption Process for Manganese Removal in Water via Agricultural Waste Adsorbents. Heliyon 2020, 6, e05049. [Google Scholar] [CrossRef]
  35. Kalvani, N.; Mesdaghinia, A.; Yaghmaeian, K.; Abolli, S.; Saadi, S.; Rashidi Mehrabadi, A.; Alimohammadi, M. Evaluation of Iron and Manganese Removal Effectiveness by Treatment Plant Modules Based on Water Pollution Index: A Comprehensive Approach. J. Environ. Health Sci. Eng. 2021, 19, 1005–1013. [Google Scholar] [CrossRef]
  36. Bruins, J.H.; Petrusevski, B.; Slokar, Y.M.; Huysman, K.; Joris, K.; Kruithof, J.C.; Kennedy, M.D. Reduction of Ripening Time of Full-Scale Manganese Removal Filters with Manganese Oxide-Coated Media. J. Water Supply Res. Technol. AQUA 2015, 64, 434–441. [Google Scholar] [CrossRef]
  37. Haukelidsaeter, S.; Boersma, A.S.; Piso, L.; Lenstra, W.K.; van Helmond, N.A.G.M.; Schoonenberg, F.; van der Pol, E.; Hurtarte, L.C.C.; van der Wielen, P.W.J.J.; Behrends, T.; et al. Efficient Chemical and Microbial Removal of Iron and Manganese in a Rapid Sand Filter and Impact of Regular Backwash. Appl. Geochem. 2024, 162, 105904. [Google Scholar] [CrossRef]
  38. Bruins, J.H.; Vries, D.; Petrusevski, B.; Slokar, Y.M.; Kennedy, M.D. Assessment of Manganese Removal from over 100 Groundwater Treatment Plants. J. Water Supply: Res. Technol. AQUA 2014, 63, 268–280. [Google Scholar] [CrossRef]
  39. Haukelidsaeter, S.; Boersma, A.S.; Kirwan, L.; Corbetta, A.; Gorres, I.D.; Lenstra, W.K.; Schoonenberg, F.K.; Borger, K.; Vos, L.; van der Wielen, P.W.J.J.; et al. Influence of Filter Age on Fe, Mn and NH4+ Removal in Dual Media Rapid Sand Filters Used for Drinking Water Production. Water Res. 2023, 242, 120184. [Google Scholar] [CrossRef]
  40. Pathak, D. Water Availability and Hydrogeological Condition in the Siwalik Foothill of East Nepal. Nepal J. Sci. Technol. 2016, 17, 31–38. [Google Scholar] [CrossRef]
  41. Pathak, D. Status of Groundwater Exploitation and Investigation in Terai and Inner Terai Region of Nepal. Bull. Nepal Hydrogeol. Assoc. 2018, 3, 77–83. [Google Scholar]
  42. Shrestha, S.R.; Tripathi, G.N.; Laudari, D. Groundwater Resources of Nepal: An Overview. In Groundwater of South Asia; Springer: Berlin/Heidelberg, Germany, 2018; pp. 169–193. [Google Scholar] [CrossRef]
  43. Mahato, S.; Mahato, A.; Karna, P.K.; Balmiki, N. Investigating Aquifer Contamination and Groundwater Quality in Eastern Terai Region of Nepal. BMC Res. Notes 2018, 11, 321. [Google Scholar] [CrossRef]
  44. Liu, J.; Chen, Q.; Yang, Y.; Wei, H.; Laipan, M.; Zhu, R.; He, H.; Hochella, M.F. Coupled Redox Cycling of Fe and Mn in the Environment: The Complex Interplay of Solution Species with Fe- and Mn-(Oxyhydr)Oxide Crystallization and Transformation. Earth Sci. Rev. 2022, 232, 104105. [Google Scholar] [CrossRef]
  45. National Statistics Office. National Population and Housing Census Provincial Report (Koshi Province). 2021. Available online: https://censusnepal.cbs.gov.np/results/files/result-folder/National Report_English.pdf (accessed on 24 August 2024).
  46. Ghimire, D.; Dhakal, D.R.; Bhusal, G.; Khadka, A.K.; Shrestha, S.; Regmi, R.P. Post Monsoon Season Spatial Distribution of Groundwater Depth over the Low-Lands of Sunsari District of Eastern Nepal. J. Nepal Phys. Soc. 2022, 8, 32–38. [Google Scholar] [CrossRef]
  47. National Statistics Office. National Population and Housing Census 2021 National Report. Available online: https://censusnepal.cbs.gov.np/results/files/result-folder/National%20Report_English.pdf (accessed on 24 August 2024).
  48. Khadka, D.B.; Bhattarai, M. Delineation of Ground Water Potential Zoning Using GIS and Remote Sensing by AHP of Sunsari District (Koshi Basin) Area of Nepal. J. Eng. Res. Rep. 2023, 24, 42–61. [Google Scholar] [CrossRef]
  49. Acharya, K.K. Local Governance Restructuring in Nepal: From Government to Governmentality. Dhaulagiri J. Sociol. Anthropol. 2018, 12, 37–49. [Google Scholar] [CrossRef]
  50. Neupane, S.; Gajurel, A.P.; Shakya, N.; Lupker, M.; Hada, R. Assessment on Connection between Shallow and Deep Aquifers Using Isotope Analysis of Surface Water and Groundwater in Sunsari and Morang Districts. J. Nepal Geol. Soc. 2019, 59, 73–78. [Google Scholar] [CrossRef]
  51. Shrestha, A.; Kazama, S.; Takizawa, S. Influence of Service Levels and COVID-19 on Water Supply Inequalities of Community-Managed Service Providers in Nepal. Water 2021, 13, 1349. [Google Scholar] [CrossRef]
  52. Kumar Mishra, A.; Kumar Karna, A. Assessment of Management Transfer Process of Water Supply Systems in Sunsari District of Nepal. Int. J. Res.-Granthaalayah 2019, 7, 1–24. [Google Scholar] [CrossRef]
  53. NWASH. Available online: https://nwash.gov.np/ (accessed on 25 November 2022).
  54. Bhandari, M.R.; Aryal, K.; Bhanadari, M.R. Status of Water Sources and Its Impact on Livelihood Practices in Sardhukhola Watershed of Eastern Nepal Agriculture and Forestry Journal Status of Water Sources and Its Impact on Livelihood Practices in Sardhukhola Watershed of Eastern Nepal (Sunsari). Agric. For. J. 2020, 4, 19–31. [Google Scholar] [CrossRef]
  55. Government of Nepal Ministry of Energy, Water Resource and Irrigation Department of Hydrology and Meteorology Climate Division. Preliminary Precipitation and Temperature Summary. 2023. Available online: https://www.dhm.gov.np/uploads/dhm/climateService/Preliminary_precipitation_and_temperature_summary_July_2023.pdf (accessed on 24 August 2024).
  56. The Collision Theory. Available online: https://chem.libretexts.org/Bookshelves/Physical_and_Theoretical_Chemistry_Textbook_Maps/Supplemental_Modules_(Physical_and_Theoretical_Chemistry)/Kinetics/06%3A_Modeling_Reaction_Kinetics/6.01%3A_Collision_Theory/6.1.06%3A_The_Collision_Theory (accessed on 22 May 2024).
  57. Hach Company Oxidation Reduction Potential (ORP) Direct Measurement Method Method 10228-2000 to 2000 MV ORP Electrode. 2021. Available online: https://images.hach.com/ (accessed on 24 August 2024).
  58. Government of Nepal National Drinking Water Quality Standard 2023: Implementation Directive. Available online: https://dwssm.gov.np/storage/listies/March2023/khanepani-mapdanda-kitab-final.pdf (accessed on 8 May 2024).
  59. Fu, X.; Niu, Z.; Lin, M.; Gao, Y.; Sun, W.; Yue, T. Strengthened Oxygen Oxidation of Ferrous Ions by a Homemade Venturi Jet Microbubble Generator towards Iron Removal in Hydrometallurgy. Minerals 2021, 11, 1342. [Google Scholar] [CrossRef]
  60. Kent, R.; Landon, M.K. Trends in Concentrations of Nitrate and Total Dissolved Solids in Public Supply Wells of the Bunker Hill, Lytle, Rialto, and Colton Groundwater Subbasins, San Bernardino County, California: Influence of Legacy Land Use. Sci. Total Environ. 2013, 452–453, 125–136. [Google Scholar] [CrossRef]
  61. Siwiec, T.; Michel, M.M.; Reczek, L.; Nowak, P. The Influence of Aeration on the Change in Corrosiveness and Aggressiveness of Groundwater. Water Supply 2016, 16, 445–452. [Google Scholar] [CrossRef]
  62. Goncharuk, V.V.; Bagrii, V.A.; Mel’nik, L.A.; Chebotareva, R.D.; Bashtan, S.Y. The Use of Redox Potential in Water Treatment Processes. J. Water Chem. Technol. 2010, 32, 1–9. [Google Scholar] [CrossRef]
  63. Wątor, K.; Dobrzyński, D.; Sugimori, K.; Kmiecik, E. Redox Potential Research in the Field of Balneochemistry: Case Study on Equilibrium Approach to Bioactive Elements in Therapeutic Waters. Int. J. Biometeorol. 2020, 64, 815–826. [Google Scholar] [CrossRef]
  64. Vries, D.; Bertelkamp, C.; Schoonenberg Kegel, F.; Hofs, B.; Dusseldorp, J.; Bruins, J.H.; de Vet, W.; van den Akker, B. Iron and Manganese Removal: Recent Advances in Modelling Treatment Efficiency by Rapid Sand Filtration. Water Res. 2017, 109, 35–45. [Google Scholar] [CrossRef]
  65. Islam, M.Z.; Mostafa, M.G. Seasonal Variation of Fe, Mn, and Pb in Groundwater of Northwestern Bangladesh. J. Chem. Environ. 2024, 3, 77–97. [Google Scholar] [CrossRef]
  66. Kousa, A.; Komulainen, H.; Hatakka, T.; Backman, B.; Hartikainen, S. Variation in Groundwater Manganese in Finland. Environ. Geochem. Health 2021, 43, 1193–1211. [Google Scholar] [CrossRef] [PubMed]
  67. Liu, W.; Qin, D.; Yang, Y.; Guo, G. Enrichment of Manganese at Low Background Level Groundwater Systems: A Study of Groundwater from Quaternary Porous Aquifers in Changping Region, Beijing, China. Water 2023, 15, 1537. [Google Scholar] [CrossRef]
  68. Cheng, L.H.; Xiong, Z.Z.; Cai, S.; Li, D.W.; Xu, X.H. Aeration-Manganese Sand Filter-Ultrafiltration to Remove Iron and Manganese from Water: Oxidation Effect and Fouling Behavior of Manganese Sand Coated Film. J. Water Process. Eng. 2020, 38, 101621. [Google Scholar] [CrossRef]
  69. Basic Chemistry of Chlorination. Available online: https://www.hydroinstruments.com (accessed on 30 June 2024).
  70. Wei, N.; Zhang, Z.; Liu, D.; Wu, Y.; Wang, J.; Wang, Q. Coagulation Behavior of Polyaluminum Chloride: Effects of PH and Coagulant Dosage. Chin. J. Chem. Eng. 2015, 23, 1041–1046. [Google Scholar] [CrossRef]
  71. Takeno, N. Atlas of Eh-PH Diagrams Intercomparison of Thermodynamic Databases. 2005. Available online: https://www.nrc.gov/docs/ML1808/ML18089A638.pdf (accessed on 24 August 2024).
  72. Kobylin, P.; Mäenpää, L.; Roine, A.; Anttila, K. E—PH (Pourbaix) Diagrams Module. 2014. Available online: https://www.metso.com/globalassets/portfolio/hsc-chemistry/17-eh---ph---diagrams.pdf (accessed on 24 August 2024).
  73. Iwuozor, K.O.; Ighalo, J.O.; Chizitere Emenike, E.; Adaobi Igwegbe, C.; Adeniyi, A.G. Do Adsorbent Pore Size and Specific Surface Area Affect the Kinetics of Methyl Orange Aqueous Phase Adsorption? J. Chem. Lett 2021, 2, 188–198. [Google Scholar]
  74. Water Safety Portal. Available online: https://wsportal.org/ (accessed on 23 August 2024).
Figure 1. Urban municipalities in the Sunsari district selected for this study. The red area on the index map indicates the Sunsari district in Nepal (upamahanagarpalika = sub-metropolitan city, nagarpalika = municipality, gaupalika = rural municipality).
Water 16 02450 g001
Figure 2. Treatment processes of water supply projects: (a) two treatment plants treat raw water from different groundwater sources; (b) one treatment plant treats raw water from different groundwater sources in a time-shifted mode.
Water 16 02450 g002
Figure 3. Groundwater treatment system: (a) two sets of aeration–RSF units; (b) pall rings in aeration units; (c) MnO2-coated pebbles in aeration units.
Water 16 02450 g003
Figure 4. Filtration experiments using different filter media: (a) assembly of the filtration equipment; (b) thickness of different filter media (numbers in () show the effective sizes of the media).
Water 16 02450 g004
Figure 5. Average water quality parameters in raw and treated water: (a) temperature, turbidity, and TDSs; (b) pH, Eh, and DO (sampling date: 8 August–26 September 2023).
Water 16 02450 g005
Figure 6. Water quality in raw and treated water: (a) average ferrous iron and total iron concentrations; (b) average soluble manganese concentrations (n = 3 for all samples; sampling date: 8 August–26 September 2023).
Water 16 02450 g006
Figure 7. Variations in iron and manganese in the dry and rainy seasons (dry season: 23 February–13 March 2023; rainy season: 8 August–26 September 2023).
Water 16 02450 g007
Figure 8. (a) Total iron and (b) soluble manganese in raw water (pH = 7.60) and filtered water from the Jhumka WSP.
Water 16 02450 g008
Figure 9. Effects of PACl on the removal of (a) total iron and (b) soluble manganese in raw water from Inaruwa (pH = 7.40).
Water 16 02450 g009
Figure 10. Effects of pH on the removal of soluble manganese from raw water from (a) Jhumka and (b) Inaruwa after the filtration experiment.
Water 16 02450 g010
Table 1. Aeration and filtration media used in the groundwater treatment plants of the WSPs.
WSPDuhabi
TP1/TP2
InaruwaJhumka
TP1
Mahendranagar
TP1
Pakali
TP1/TP2
TP1TP2
Aeration MediaNot in operationMnO2-coated pebblesPall ringsPall ringsMnO2-coated pebblesPall rings
Filtration MediaManganese sand + Quartz sandQuartz sandQuartz sandQuartz sandQuartz sandQuartz sand
Note: TP: Treatment plant.
Table 2. Raw water quality after transportation from the Jhumka and Inaruwa WSPs.
Water Quality ParametersJhumkaInaruwa
pH7.607.45
Temperature (°C)24.025.3
Turbidity (NTU)3.5730.28
Electrical conductivity (μS/cm)414246
Ammonia (mg/L)BDL (<0.02)0.06
Ferrous iron (mg/L)0.030.42
Total iron (mg/L)0.823.92
Manganese (mg/L)1.101.10
Disclaimer/Publisher’s Note: The statements, opinions and data contained in all publications are solely those of the individual author(s) and contributor(s) and not of MDPI and/or the editor(s). MDPI and/or the editor(s) disclaim responsibility for any injury to people or property resulting from any ideas, methods, instructions or products referred to in the content.

