Abstract
Drought, characterized by frequent occurrences, an extended duration, and a wide range of destruction, has become one of the natural disasters posing a significant threat to both socioeconomic progress and agricultural livelihoods. Large-scale geographical environments often exhibit obvious spatial heterogeneity, leading to significant spatial differences in drought’s development and outcomes. However, traditional drought monitoring models have not taken into account the impact of regional spatial heterogeneity on drought, resulting in evaluation results that do not match the actual situation. In response to the above-mentioned issues, this study proposes the establishment of ecological–geographic zoning to adapt to the spatially stratified heterogeneous characteristics of large-scale drought monitoring. First, based on the principles of ecological and geographical zoning, an appropriate index system was selected to carry out ecological and geographical zoning for Yunnan Province. Second, based on the zoning results and using data from NASA’s Moderate Resolution Imaging Spectroradiometer (MODIS) and the Tropical Rainfall Measuring Mission (TRMM) 3B43, the vegetation condition index (VCI), the temperature condition index (TCI), the precipitation condition index (TRCI), and three topographic factors including the digital elevation model (DEM), slope (SLOPE), and aspect (ASPECT) were selected as model parameters. Multiple linear regression models were then used to establish integrated drought monitoring frameworks at different eco–geographical zoning scales. Finally, the standardized precipitation evapotranspiration index (SPEI) was used to evaluate the monitoring effects of the model, and the spatiotemporal variation patterns and characteristics of winter and spring droughts in Yunnan Province from 2008–2019 were further analyzed. The results show that (1) compared to the traditional non-zonal models, the drought monitoring model constructed based on ecological–geographic zoning has a higher correlation and greater accuracy with the SPEI and (2) Yunnan Province experiences periodic and seasonal drought patterns, with spring being the peak period of drought occurrence and moderate drought and light drought being the main types of drought in Yunnan Province. Therefore, we believe that ecological–geographic zoning can better adapt to geographical spatial heterogeneity characteristics, and the zonal drought monitoring model constructed can more effectively identify the actual occurrence of drought in large regions. This research finding can provide reference for the formulation of drought response policies in large-scale regions.
1. Introduction
The World Meteorological Organization characterizes drought as a prolonged and abnormal shortage of precipitation with complex formation mechanisms. Its main characteristics are frequent recurrence, an extended duration, and a wide range of hazards [1,2]. Drought, a prevalent and devastating meteorological calamity in China, not only affects national food security, but also places severe constraints on the long-term growth of both social economy and the natural ecosystem [3]. Against the current backdrop of global warming and increasingly scarce water resources, the acceleration of the hydrological circulation has exacerbated the frequency of extreme weather events, notably droughts, and their intensity is showing a significant increasing trend. This poses formidable hurdles for the enduring progress of both the ecological environment and social economy [4,5]. According to statistics, about 61% of the total losses caused by natural hazards are attributed to meteorological disasters, while drought losses account for 55% of losses caused by meteorological disasters [6]. Therefore, accurately understanding the spatiotemporal changes and causes of drought is beneficial for improving regional drought prevention and resistance capabilities, reducing disaster losses, ensuring regional food security, and promoting sustainable development of economy and ecology.
Choosing different drought indices for quantification based on different drought monitoring purposes is an important way to monitor drought [7,8]. Currently, drought monitoring indices in widespread use are categorized into three distinct groups according to the quantity of variables they incorporate: single-variable indices, simple multivariable indices, and complex multivariable indices combined with complicated calculations [9]. Single-variable indices refer to the use of only one characteristic to characterize drought, such as the Vegetation Condition Index (VCI) [10], the Temperature Condition Index (TCI) [11], and the Standardized Precipitation Index (SPI) [12,13]. Although such indices are simple and easy to implement, they only consider a single factor to describe the complex mechanisms of drought formation from multiple perspectives, and are insufficient to fully describe the drought situation [14]. Simple multivariable indices use two or more variables to create simple difference, ratio, and combination indices for drought monitoring, such as the Temperature Vegetation Dryness Index (TVDI) [15] and the Vegetation Supply Water Index (VSWI) [16]. However, due to the specificity of selected variables, these indices have obvious regional applicability and practicality, and may not be suitable for all areas. Multi-variable indices, also known as complex composite indices, use multiple data fusion and complex calculations to construct comprehensive drought indices. For example, Hao [17] introduced the Multi-Scalar Drought Index (MSDI) for the continental United States, leveraging precipitation and soil moisture data as its foundation; Yu [18] comprehensively considered variables encompassing precipitation, temperature, and vegetation to construct the Comprehensive Drought Index (CDI) for the Beijing–Tianjin–Hebei region; in addition, there are other indices such as the Palmer Drought Severity Index (PDSI) [19] and the Vegetation Drought Response Index (VegDRI) [20]. These indices, by comprehensively considering multiple drought impact factors, effectively improve the applicability and effectiveness of monitoring. However, in macro-scale drought monitoring, drought indices often exhibit different drought processes and results depending on the region (i.e., spatial heterogeneity effects of drought indices). Therefore, how to reflect the spatial heterogeneity characteristics of drought is an important issue for establishing drought monitoring models using drought indices.
Recently, many scholars have conducted extensive research on drought monitoring at different spatial scales, generally falling into two main categories. The first category involves establishing drought monitoring models based on administrative jurisdictions, where the idea is to assess drought conditions by dividing the area into existing administrative regions. For example, Amani et al. [21] evaluated drought conditions in Australia using the temperature–vegetation–soil moisture drought index (TVMDI). Liu et al. [22] assessed the drought characteristics under different time scales in Shandong Province using a composite drought index. However, administrative jurisdictions are divided based on the needs of socio-economic development and often exhibit a significant degree of natural environmental homogeneity between regions. As a result, they cannot objectively reflect the differences in drought processes between regions, leading to suboptimal performance in the evaluation of such drought monitoring models. The second category involves establishing drought monitoring models based on geographic divisions, where the idea is to assess drought conditions using specific geographic units as the basis for partitioning. Among these, watersheds are the most widely used geographic units by scholars. For example, Mousavi et al. [23] analyzed historical drought conditions in the South Saskatchewan River Basin in Canada at different time scales using the Standardized Precipitation Index (SPI) and the Standardized Precipitation Evapotranspiration Index (SPEI) on a watershed zoning basis. Similarly, Tan et al. [24] evaluated the reliability of the Tropical Rainfall Measuring Mission (TRMM) in drought monitoring in the Kelantan River basin in Malaysia. These methods are more accurate in revealing the spatiotemporal characteristics of drought than administrative divisions. However, geographic zoning based on watersheds typically only considers the influence of hydrological response elements such as topography while neglecting the role of natural factors like meteorology and vegetation, which have significant impacts on drought formation [25,26]. It is evident that establishing a more reasonable geographic zoning to adapt to the spatial heterogeneity of drought processes is an important issue that needs to be addressed in large-scale drought monitoring. Ecological–geographic zoning incorporates comprehensive information such as meteorology, topography, and land cover types, enabling a more accurate reflection of the regional differences in the formation of drought processes. Consequently, it can better adapt to the spatial heterogeneity of drought in large-scale regions. Therefore, how to comprehensively consider both natural geographic and socio-economic factors, perform ecological–geographic zoning, and establish spatially adaptive zonal drought monitoring models are key factors in improving the effectiveness of drought monitoring in large-scale regions.
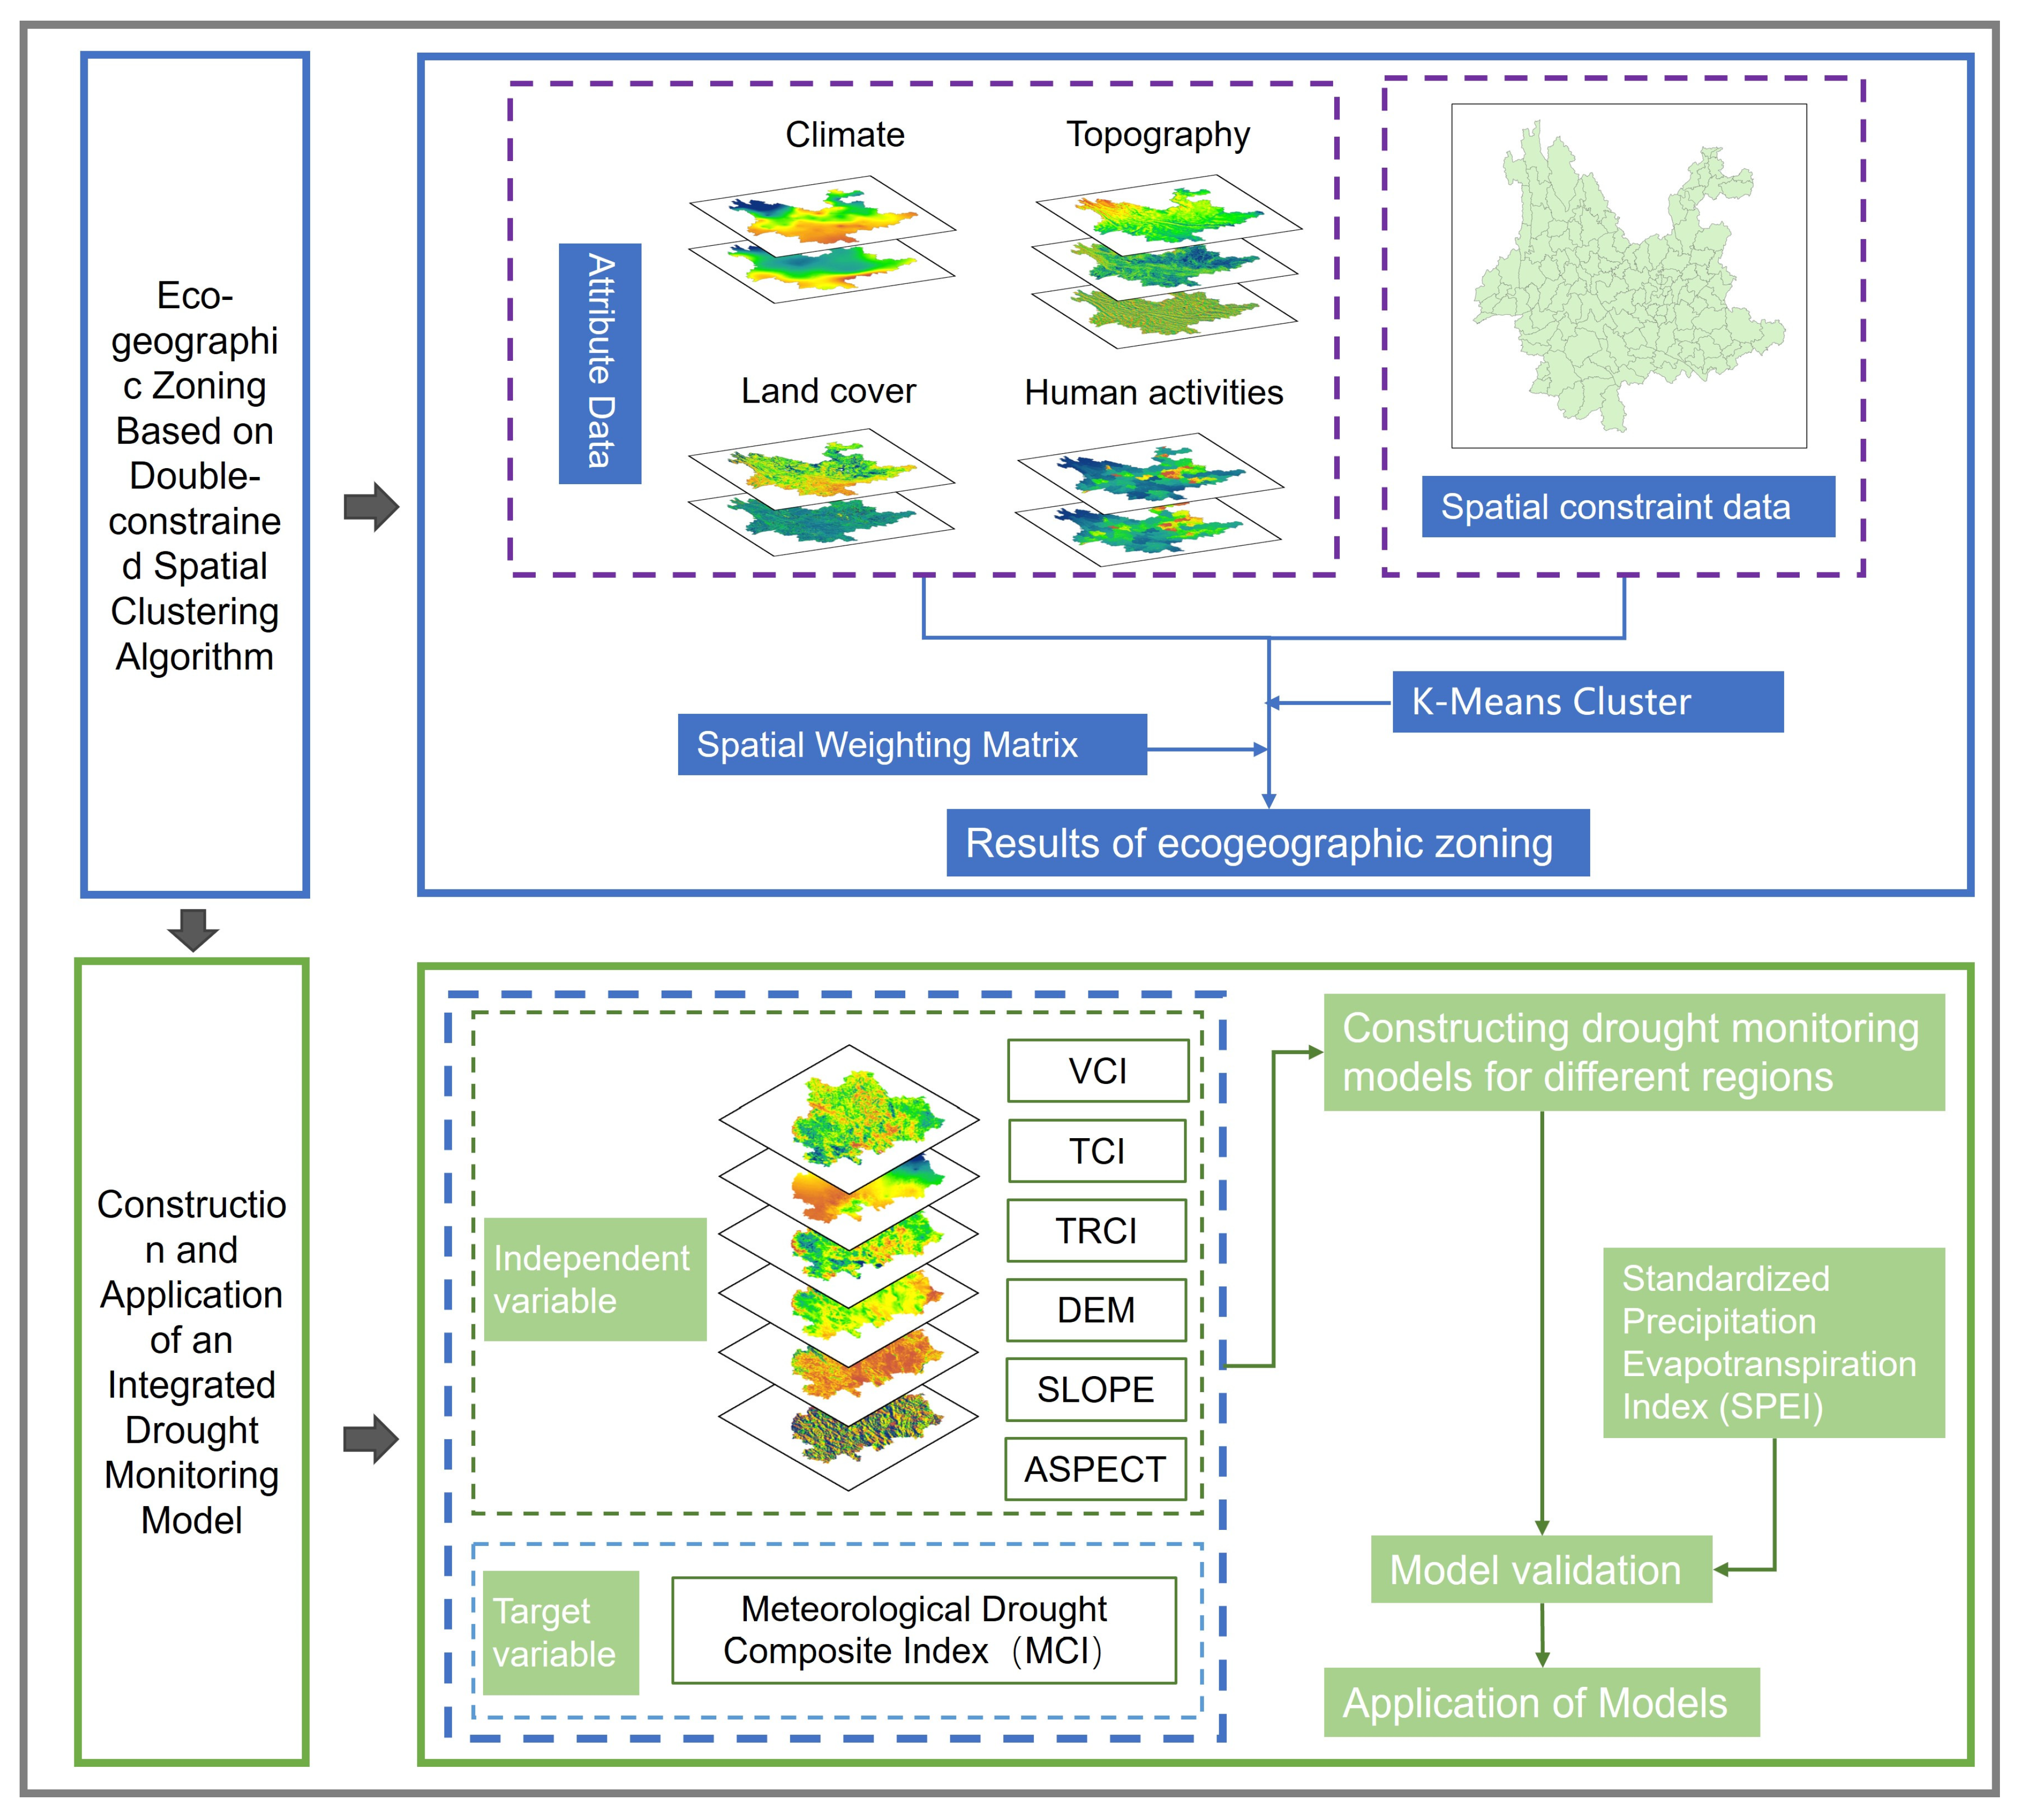
In conclusion, this study intends to use Yunnan Province as the research area and establish zonal drought monitoring models through the comprehensive consideration of natural geography and socio-economic factors. This aims to enhance the models’ capability to adapt to the spatial heterogeneity of drought indices, consequently improving the overall effectiveness of drought monitoring. Firstly, by combining remote sensing data such as the MODIS and TRMM with meteorological data, and incorporating factors like temperature, precipitation, vegetation, as well as terrain features like elevation, slope, and aspect, we will construct comprehensive drought monitoring models for different geographical zones. Next, we will employ a combination of qualitative and quantitative methods to assess the monitoring performance of the constructed drought models. Finally, leveraging our validated drought monitoring models, we will evaluate the incidence of drought events in Yunnan Province spanning the years 2008 to 2019 to assess the applicability and practicality of the models. The specific research process is shown in Figure 1.

Figure 1.
Overall research flowchart.
2. Materials and Methods
2.1. Study Area
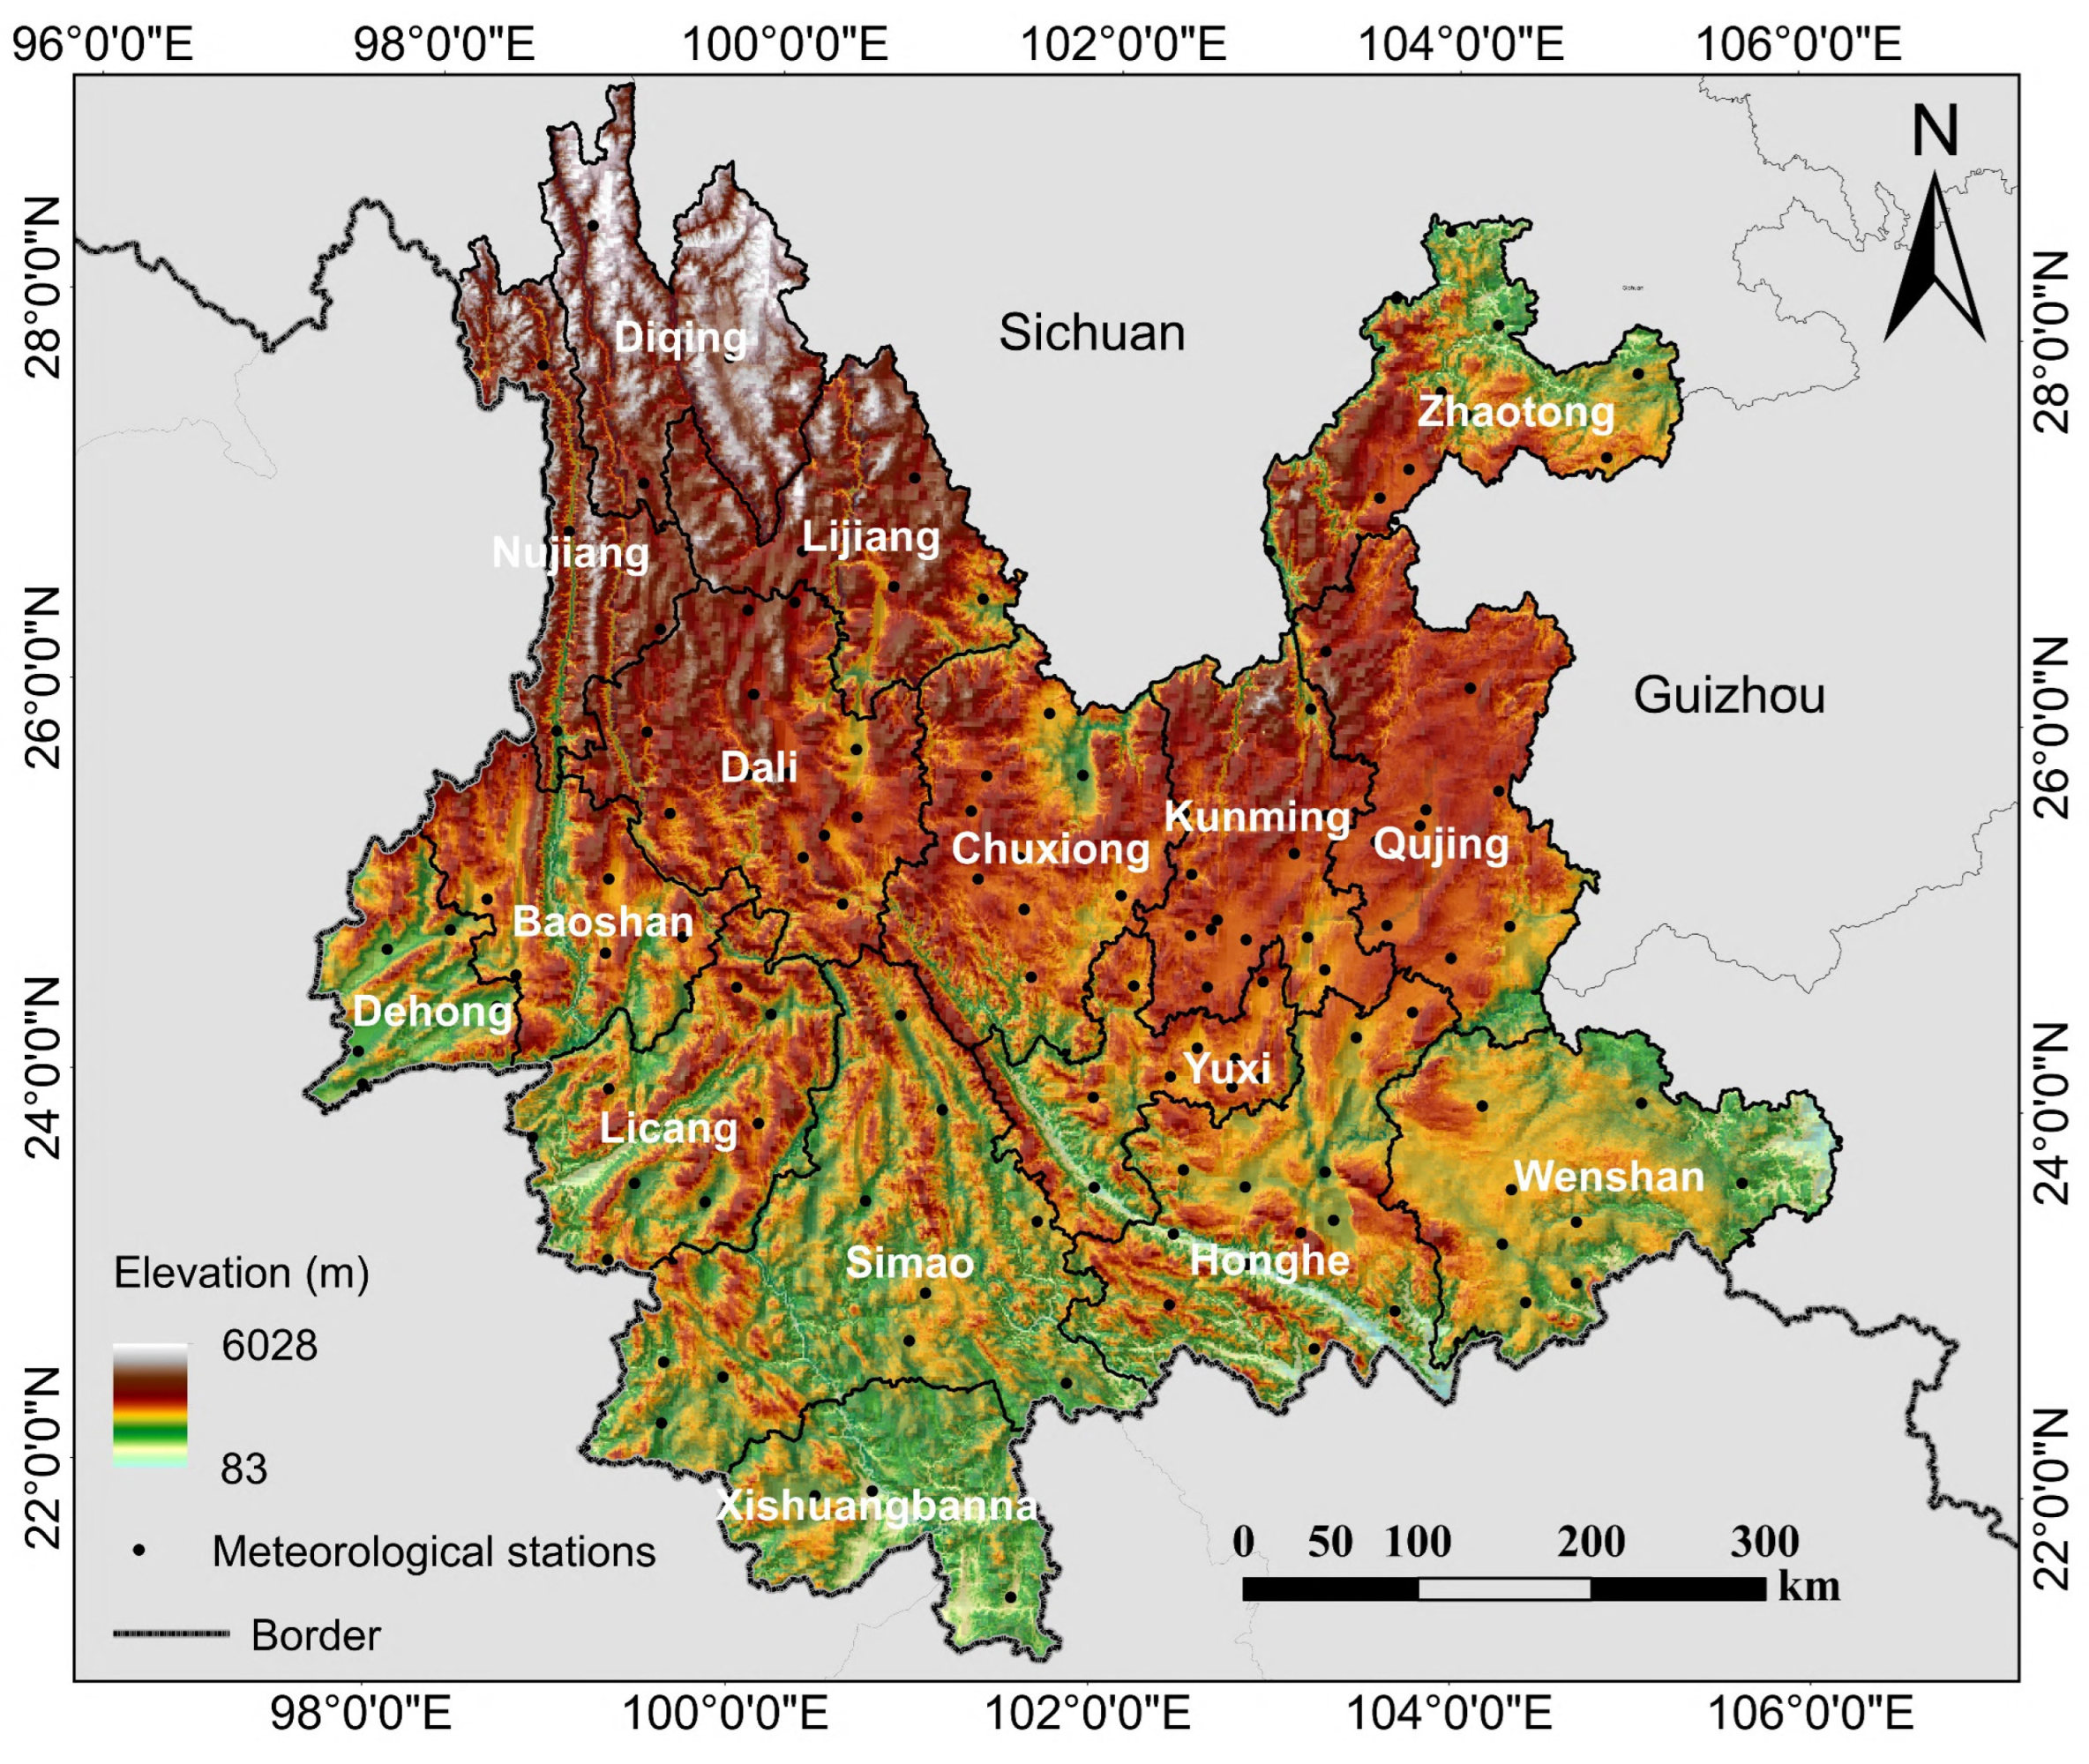
Yunnan Province, depicted in Figure 2, sits at the southwestern frontier of China, between 21°08′–29°15′ N and 97°31′–106°11′ E. It includes 8 prefecture-level cities and 8 autonomous prefectures and boasts a vast territory of roughly 394,100 square kilometers. It borders Guizhou Province and the Guangxi Zhuang Autonomous Region to the east, Sichuan Province to the north, the Tibet Autonomous Region to the northwest, and shares international borders with Myanmar to the west, and Laos and Vietnam to the south. This province falls within the subtropical highland monsoon zone, characterized by a pronounced three-dimensional climate profile. The average temperature in summer is 19–22 °C, and in winter it is above 6–8 °C, with an annual temperature difference generally between 10 and 15 °C. Precipitation is distributed extremely unevenly by season and region, being more abundant in the western and southern parts compared to the east and north. Notably, the dry season, spanning November to April of the subsequent year, contributes merely 15% of the annual precipitation, and the wet and dry seasons are distinct. The terrain presents a trend of high in the north and low in the south, with three rivers converging, and high mountains and deep valleys alternating. The mountainous and plateau areas account for 94% of the total area, with a relative elevation difference of more than 6000 m. Additionally, karst landforms are widely developed in the area, causing frequent droughts, which seriously affect the ecological environment and social and economic development of the region.
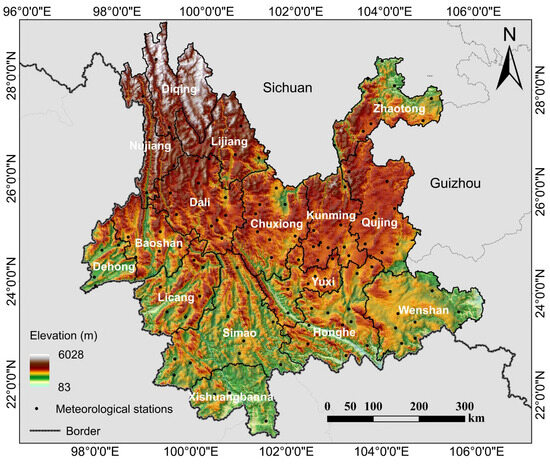
Figure 2.
Study area.
2.2. Data Descriptions and Preprocessing
2.2.1. Remote Sensing Data
The present study primarily utilizes vegetation data, land surface temperature data, elevation data, and precipitation data as the primary sources of remote sensing data. Specifically, the vegetation data used are the MODIS 13A3 monthly NDVI data, offering a spatial resolution of 1 km, and the land surface temperature data used are the MODIS 11A2 8-day composite LST data with a spatial resolution of 1 km. Both of these datasets are sourced from the NASA website (https://ladsweb.modaps.eosdis.nasa.gov (accessed on 8 July 2021)). The DEM data used here are the SRTM_DEM dataset, which is sourced from the Geo Space Cloud (http://www.gscloud.cn (accessed on 23 July 2021)), featuring a spatial resolution of 90 m. To facilitate the extraction of pertinent slope and aspect information, this dataset has undergone a process of mosaicking, projection, and resampling to a uniform spatial resolution of 1 km.
TRMM (Tropical Rainfall Measuring Mission) is the world’s first space-borne rainfall radar for precipitation monitoring. The research relies on the TRMM 3B43 data product as its source of precipitation information, accessible through the NASA website (https://disc.gsfc.nasa.gov (accessed on 19 July 2021)), featuring a spatial resolution of 0.25 degrees. The data are downscaled to unify its spatial resolution to 1 km.
2.2.2. Meteorological Data
This research utilizes meteorological records consisting of daily rainfall and average temperature data from 125 weather stations in Yunnan Province and its surrounding areas from 2008 to 2019. The data are obtained from the China Meteorological Data Network (http://data.cma.cn (accessed on 5 July 2021)). In the process of data production, the observation data are repeatedly quality-checked and controlled to ensure data consistency and accuracy. The data are organized and calculated to obtain monthly precipitation and average temperature data for each station across the 2008–2019 period, which are employed for the computation of the Meteorological Drought Composite Index (MCI) and Standardized Precipitation Evapotranspiration Index (SPEI).
2.2.3. Social and Economic Data
The social and economic data involved in this paper include population density data, GDP data, etc. The population density and GDP data are from the Chinese Academy of Sciences Resource and Environment Science Data Center platform (http://www.resdc.cn (accessed on 15 December 2022)), and the spatial resolution and coordinate system are consistent with other data.
2.3. Methods
2.3.1. Construction of Ecological–Geographic Zoning Index System
Before carrying out ecological–geographic zoning, it is essential to make a reasonable selection of the zoning criteria, which serves as a crucial basis for defining the zoning boundaries. Eco–geographical zoning evolved from natural zoning and reflects the spatial patterns of environmental factors and biological elements in a comprehensive way, revealing regional ecological characteristics and internal differences. Therefore, its indicator system has inherited and been developed on the basis of the original system. Climate, terrain, vegetation, and other natural factors are the basic elements of ecological and geographical zoning, which can best reflect the regional differentiation of ecological factors [27]. In addition, as the ecological environment is the material foundation for human survival and has been more or less affected by human activities, it is imperative to give thought to the role and status of human activities when conducting ecological–geographical zoning [28,29]. Factors such as population, economic activities, and land use should also be included in the zoning system. At the same time, when selecting indicators, objectivity, scientificity, and practicality should be considered. Based on this, indicator screening and optimization are also needed to ensure the rationality and scientificity of zoning standards. Therefore, based on the previous research and comprehensive consideration of the factors affecting aridity, this study selected nine indicators of climate, terrain, land cover, and socio-economy to divide the ecological–geographic regions of Yunnan Province. The details are shown in Table 1.

Table 1.
Eco–geographic zoning index system of Yunnan Province.
The 9 indicators were used to perform zoning statistics for 129 county-level administrative regions in Yunnan Province. The county-level spatial distribution maps for each indicator were obtained. In this case, the land use type data mainly selected the vegetation cover type with the largest proportion of the area as the dominant type for the region, and the remaining data were calculated using the mean value.
2.3.2. Eco–Geographic Zoning Based on Dual-Constrained Spatial Clustering Algorithm
With the rise of the geospatial revolution and the advancement of computer technology, more and more ecological–geographic studies have incorporated mathematical methods. Among them, cluster analysis is a commonly used method for data mining and classification, which can analyze the degree of similarity between multiple factors to study the differences between different regions [30]. This method can be used to classify and partition ecological systems, biological population distributions, and geographic phenomena, and is an important tool for quantitative research on geographic issues. It has been widely used in the field of geography, with clustering analysis being one of the most common data mining and classification methods. Common clustering analysis methods include hierarchical clustering, dynamic clustering, and fuzzy clustering [31]. However, traditional clustering algorithms usually ignore the distribution characteristics of spatial objects in non-spatial domains when dealing with spatial objects, and simply classify spatial objects into compact clusters distributed in spatial regions. This processing method may classify objects with similar attributes but relatively distant spatial distances into the same area, which often cannot reflect the comprehensive characteristics of geographical phenomena well. Moreover, the geographical regions partitioned are often not in line with the actual situation [32,33]. To address this issue, this paper draws inspiration from the dual-constrained spatial clustering algorithm proposed by Ke Xinli [34,35] for partitioning geographic zones. This algorithm simultaneously considers both spatial locations and attribute similarity values. On this basis, spatial data are introduced to further constrain the number of clustering clusters, accurately reflecting the comprehensive characteristics of regional geographical phenomena, making the partitioned regions more in line with the actual situation, and obtaining more accurate and reliable zoning results.
The distance definition for the dual-constrained spatial clustering algorithm is as follows:
where Dij represents the generalized Euclidean distance metric between point i and point j; xi, yi, and xj, yj denote their respective spatial coordinates. The variables zik and zjk correspond to the k-th attribute values of point i and point j, with m being the total number of attributes across the point set. wp and wa signify the relative significance of spatial distance and non-spatial attribute similarity in computing this generalized distance. wk quantifies the importance of each individual attribute within the spatial dataset. The strategy for determining the weight values is as follows: a range of weight values is prescribed, and the model’s simulation accuracy is subsequently evaluated under each configuration. The optimal weight values are those at which the model accuracy reaches its peak.
2.3.3. Construction of an Integrated Drought Monitoring Model Based on Eco–Geographic Zoning
Regional drought disasters are brought about by the combined effects of numerous causative factors. These factors involve not only precipitation, vegetation conditions, and the soil moisture status but also types of land utilization, topographic features, and more. It is a comprehensive and complex geographical evolutionary process. Given the significant differences in precipitation, vegetation, and drought conditions in different seasons in Yunnan Province, this study mainly monitors the drought conditions in winter and spring because the drought season spans November to April of the subsequent year. The Vegetation Condition Index (VCI), the Temperature Condition Index (TCI), and the Rainfall Condition Index (TRCI) are mainly used as independent variables in the model, and three terrain factors including the Digital Elevation Model (DEM), Slope (SLOPE), and Aspect (ASPECT) are introduced simultaneously. Meteorological Drought Composite Index (MCI) is used as a dependent variable. Using the commonly used seasonal division method in meteorology, March to May is the spring season, and December to February of the previous year is the winter season. Utilizing a multivariate linear regression method, we construct seasonal comprehensive drought monitoring for different ecological–geographic zones and calculate their Comprehensive Drought Index (CDI). Finally, we perform a comparative analysis of the monitoring performance of the models and apply them.
The formulas for calculating each factor are as follows (Table 2):
Table 2.
Calculation formulas for each factor.
The Normalized Vegetation Index (NDVI) can reflect vegetation health, and if drought occurs, it will result in low NDVI values, affecting the growth status of vegetation. However, the NDVI alone fails to directly quantify drought’s impact on vegetation. Therefore, we employ the vegetation condition index (VCI) to standardize NDVI values on a pixel-by-pixel basis, enabling a portrayal of vegetation’s developmental stages across varying timeframes. The surface temperature data lack direct applicability in drought monitoring. Drawing inspiration from the vegetation condition index concept, we introduce the temperature condition index (TCI), a remotely sensed thermal stress metric that serves to assess and quantify the temperature composition of drought [37]. Precipitation holds an important position within the intricate climate system; it balances energy flows and, being integral to the atmospheric water cycle, contributes significantly to shaping the global climate [38]. Despite downscaling, the precipitation data from TRMM accurately capture the spatial and temporal characteristics of rainfall within the research area. Leveraging this accuracy, we introduce the precipitation condition index (TRCI) as a tool to characterize drought conditions. At different elevations, slopes, and aspects, there will be certain differences in precipitation, temperature, and so on. Consequently, drought conditions vary accordingly in different topographic regions [39,40]. Here, the slope data are re-encoded, converting it from a categorical variable to a continuous variable, subsequently being normalized to mitigate the effects of varying scales.
2.3.4. Model Effectiveness Evaluation
To assess the capability of the model in monitoring drought conditions, this study employed the SPEI calculated from meteorological station observation data to confirm the Comprehensive Drought Index (CDI) estimated by the model based on the previous research. The SPEI is a drought indicator that spans multiple time scales and is calculated using two key climate factors: precipitation and evapotranspiration [41,42]. It can not only sensitively reflect the evaporation changes caused by temperature fluctuations but also characterize the severity of drought across varying temporal horizons, and has gained extensive usage in drought monitoring [43]. SPEI values exhibit different physical significance across varying timescales. For instance, the SPEI calculated over a shorter period can effectively reflect the changes in relative soil moisture within that short period of time, and the SPEI value at a three-month scale can reflect the seasonal changes in drought [44]. Therefore, this study used the SPEI-3 index at a three-month scale to further verify the drought monitoring model in different ecological and geographical zones. Similarly, the Comprehensive Drought Index (CDI) values for the corresponding station locations from 2008 to 2019 in the model were extracted, and subsequently, both a correlation analysis and an error assessment were undertaken in comparison with the SPEI-3. The correlation coefficient (R) and Root Mean Square Error (RMSE) between the two were calculated. R can quantify the strength and direction of the linear relationship between variables, while the RMSE can accurately assess the prediction accuracy of the model. These two indices have been widely used in measuring data relationships and model prediction errors [45,46]. A larger R and a smaller RMSE indicate better model performance. By improving or reducing these indices, we can explore the evaluation effects of different models before and after ecological–geographic zoning.
3. Results and Analysis
3.1. Eco–Geographic Division of Yunnan Province
This study uses Geoda1.16 software to calculate spatial weight matrix, select K-Means clustering method, and couple spatial data with attribute data to perform ecological–geographic division of Yunnan Province at the county and township level. The division results are shown in Figure 3.
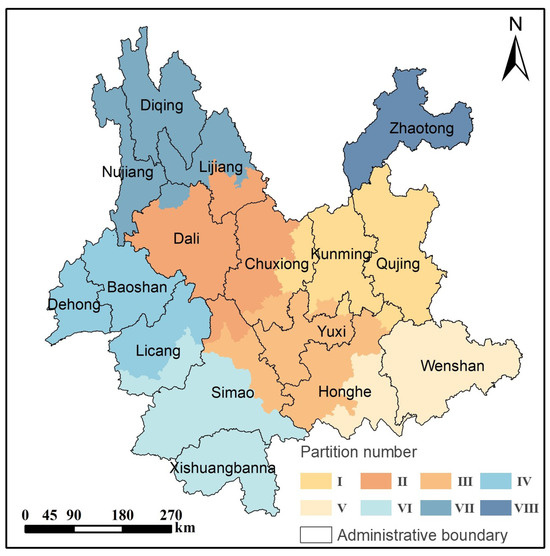
Figure 3.
Eco–geographical zoning map of Yunnan Province.
From Figure 3, one observes that the 16 prefectures and cities in Yunnan Province are mainly divided into eight regions. Zone I is located in the east, mainly including Qujing City, Kunming City, and the eastern part of Chuxiong Prefecture. It is the main part of the Dianzhong Urban Agglomeration and an important commercial and transportation hub. Zone II mainly includes Dali Prefecture, the southern part of Lijiang City, the western part of Chuxiong Prefecture, and a few areas in the northern part of Pu’er City. The topography in this area is dominated by plateaus and mountains, and the terrain is undulating. Zone III is located in the middle of Yunnan Province, mainly including Yuxi City, the southeastern part of Chuxiong Prefecture, the northeastern part of Pu’er City, and the western part of Honghe Prefecture. The terrain in this area is complex, with mountains, hills, and basins distributed vertically and horizontally. The water system is developed, with the main rivers being the Yuanjiang River, Lancang River, and Honghe River. Water resources are abundant, and the basin area is extensive. Zone IV is located in the west of Yunnan Province, mainly including Dehong Prefecture, Baoshan City, and most of the central and northern parts of Lincang City. This area is characterized by high mountains, hills, and valleys, with significant changes in altitude. Rainfall is concentrated in the summer, and the winters are relatively dry. Zone V is located in the southeast of Yunnan Province, mainly including Wenshan Prefecture and the southeastern part of Honghe Prefecture. The topography in this area is mainly mountains, with a humid and rainy summer and a dry and less rainy winter. The annual average temperature is around 18 °C. Zone VI is located in the southwest of Yunnan Province, mainly including Xishuangbanna Prefecture, Pu’er City, and a few areas in the southern part of Lincang City. The topography in this area is mainly mountainous, hilly, and valley regions, with complex terrain and dense water network. The climate is a tropical monsoon climate, warm and humid, with abundant rainfall and a rainy season lasting for several months. The annual average temperature is around 20 °C, and the relative humidity is relatively high. Zone VII is located in the northeast of Yunnan Province, only including Zhaotong City. This region lies deep within the Wumeng Mountain area at the junction of Yunnan, Guizhou, and Sichuan provinces. Characterized by a southwest-high, northeast-low terrain, with main topographic types including mountains, hills, and basins and an average altitude of 1685 m. Zone VIII mainly includes Diqing Prefecture, Nujiang Prefecture, the northern part of Lijiang City, and a few areas in the northern part of Dali Prefecture. The region lies in the northwestern part of Yunnan, at the junction of Yunnan, Tibet, and Sichuan provinces, boasting the highest elevation within the province’s boundaries. The highest peak is Meili Snow Mountain with an altitude of 6740 m, and the lowest point is the Nujiang River Valley with an altitude of 738 m. The relative height difference exceeds 5000 m, and high mountain gorges are everywhere. The deepest gorge in the world, the Nujiang Grand Canyon is located here.
3.2. Verification of Comprehensive Drought Monitoring Model
The CDI values of the corresponding station locations in different ecological and geographical regions in the model from 2008 to 2019 were extracted for correlation and error analysis with the SPEI-3, exploring the evaluation effect of different models before and after ecological and geographical zoning. The outcomes of this analysis are presented in Figure 4 and Table 3.
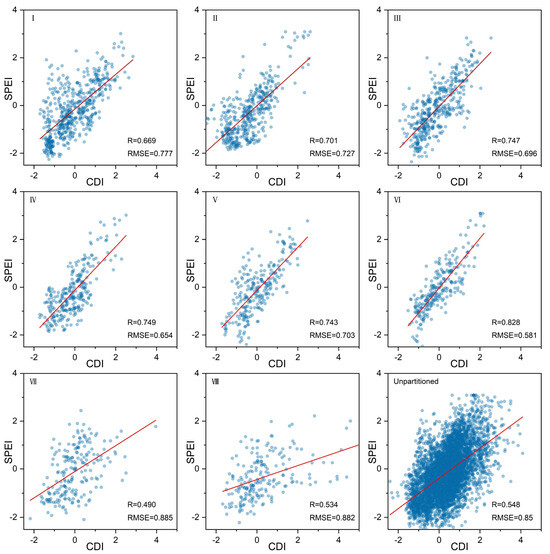
Figure 4.
Comparison of drought monitoring accuracy in Yunnan Province before and after zoning.
Table 3.
Comparison of the evaluation performance between the zonal and non-zonal drought monitoring models.
From Figure 4 and Table 3, it can be observed that the correlation tests for all zones have passed the significance level test with p < 0.01. The drought monitoring results for Zone I to Zone VI show a strong correlation with the SPEI, with correlation coefficients (R) ranging between 0.65 and 0.85. These values are higher than the drought monitoring index for the non-zoned case, with the maximum value reaching 0.828 for Zone VI. In terms of percentage change, the improvement in R and the reduction in the RMSE are significant. Simultaneously, the RMSE for these zones ranges from 0.5 to 0.8, all of which are lower than the root mean square error (RMSE) for the non-zoned case. This indicates that by dividing Yunnan Province into different ecological–geographic zones, the accuracy and reliability of the drought monitoring model can be effectively improved. However, the comprehensive drought monitoring results for Zone VII and Zone VIII show weaker correlations, with the SPEI being 0.49 and 0.534, respectively. Both R and the RMSE changes are negative. The analysis suggests that the complex topography and significant elevation differences in Zone VII and Zone VIII, combined with a complex local climate and fewer meteorological stations, may contribute to the constructed drought monitoring model not adequately representing the regional drought conditions, thereby affecting the model’s monitoring effectiveness in that specific area. In summary, compared to the non-zoned drought assessment outcomes, the drought monitoring model constructed based on ecological–geographic zoning is suitable for drought monitoring in most regions of Yunnan Province and achieves better evaluation results.
3.3. Model Application: Spatial and Temporal Evolution and Analysis of Drought in Different Years in Yunnan Province
3.3.1. Characteristics of Drought Time Variations in Different Ecological and Geographical Regions
To investigate the practical effectiveness of the model, we evaluated the drought conditions in Yunnan Province during the period from 2008 to 2019 using the previously constructed comprehensive drought monitoring model based on ecological–geographic zoning. We calculated the station averages of the CDI for eight ecological–geographic zones in the winter and spring seasons and plotted time series change graphs. The results are shown in Figure 5.
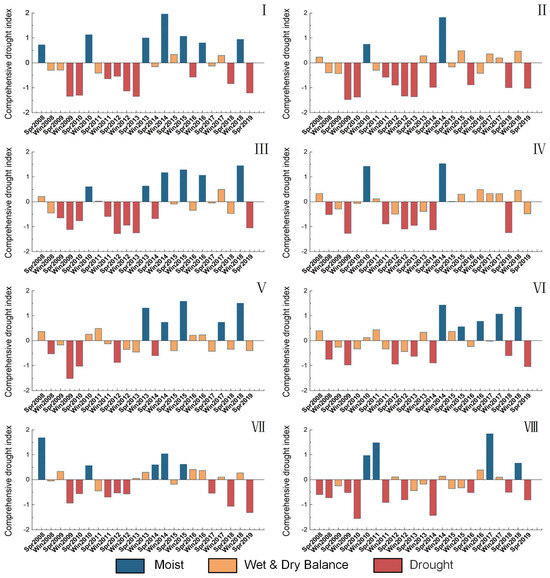
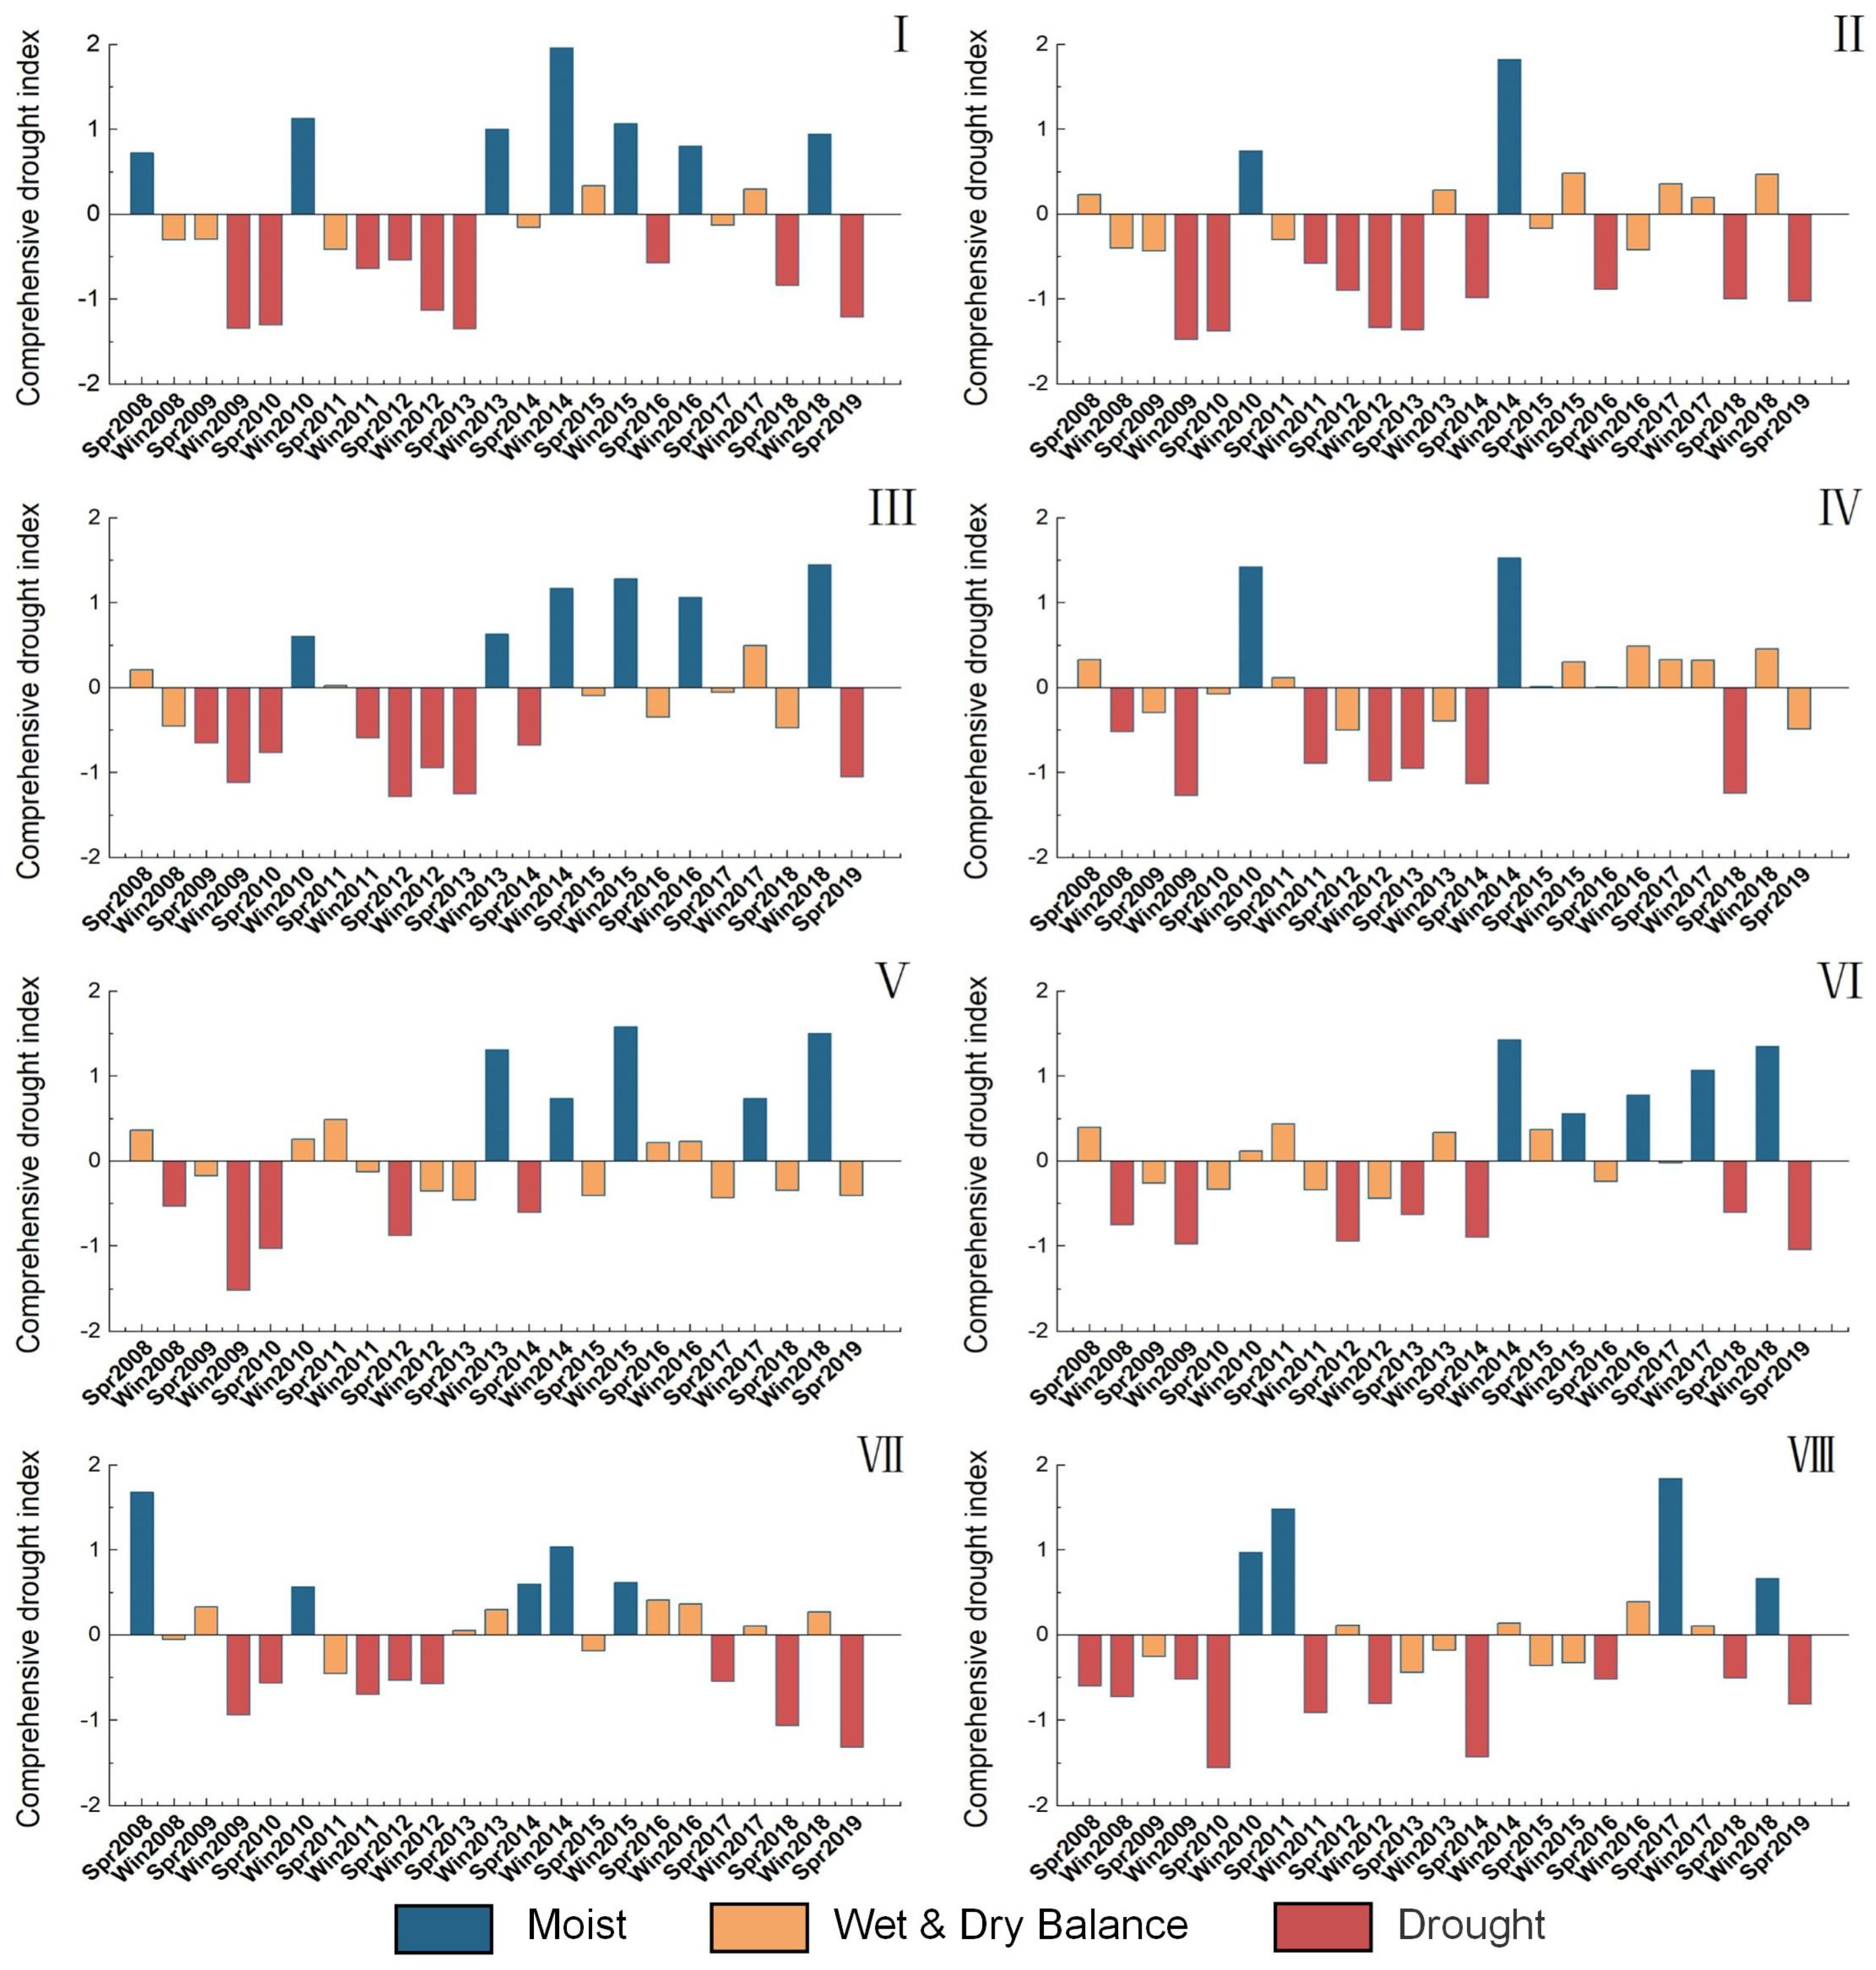
Figure 5.
CDI values variation in winter and spring seasons from 2008 to 2019 for each ecological–geographic regions.
In the graph, blue represents wet events (0.5 ≤ CDI), orange represents dry–wet balance (−0.5 < CDI < 0.5), and red represents drought events (CDI ≤ −0.5). The graph reveals the presence of drought, varying in severity, across all eight regions during the winter and spring periods spanning 2008 to 2019. For example, before the winter of 2013, Zone I showed a clear seasonal consecutive drought phenomenon in terms of CDI values. After the winter of 2013, the drought situation was greatly alleviated, and it remained in a wet or dry–wet balance state until the springs of 2018 and 2019 when drought occurred again. Zone II had similar overall drought characteristics to Zone I and showed large-scale drought events before the winter of 2013, followed by spring drought and winter dry–wet balance. Zone III had similar drought characteristics to Zones I and II before the winter of 2014, with negative CDI values indicating severe drought. However, it was mostly in a wet state afterwards, with no drought occurring except in the spring of 2019. Zones IV, V, and VI alternated between drought and dry–wet balance from 2008 to 2014, but there were no significant droughts after 2014, and some seasons showed wet conditions. Zones VII and VIII alternated between wet, dry–wet balance, and drought throughout the entire study period without any clear seasonal boundaries. Overall, Zones I, II, and III experienced more severe droughts during the entire study period, lasting for 10 quarters with a drought frequency of about 45%. Zone V had significantly less severe droughts, with a drought frequency of only 20%.
3.3.2. Spatial Variation Characteristics of Drought in Different Ecological and Geographical Regions
Using the CDI calculated from the above model for each ecological and geographical region, and based on the drought classification in Table 4, the drought distribution maps for the winter and spring seasons in different ecological and geographical regions of Yunnan Province were obtained (Figure 6 and Figure 7).
Table 4.
Classification of drought levels.
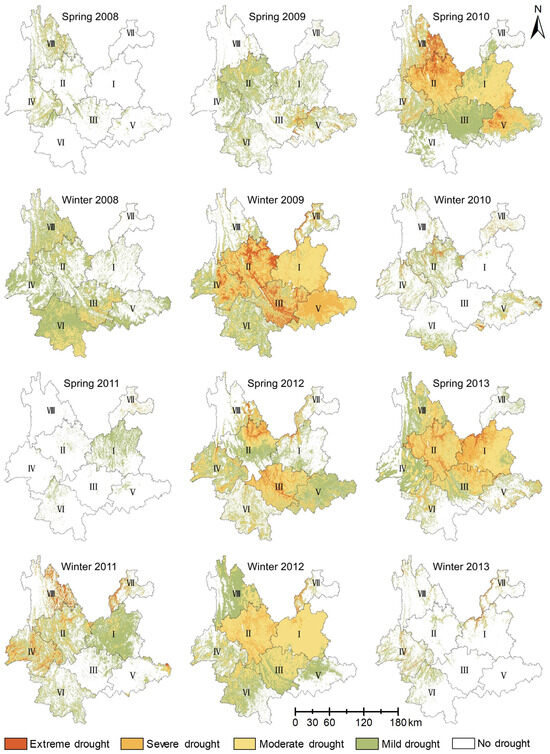
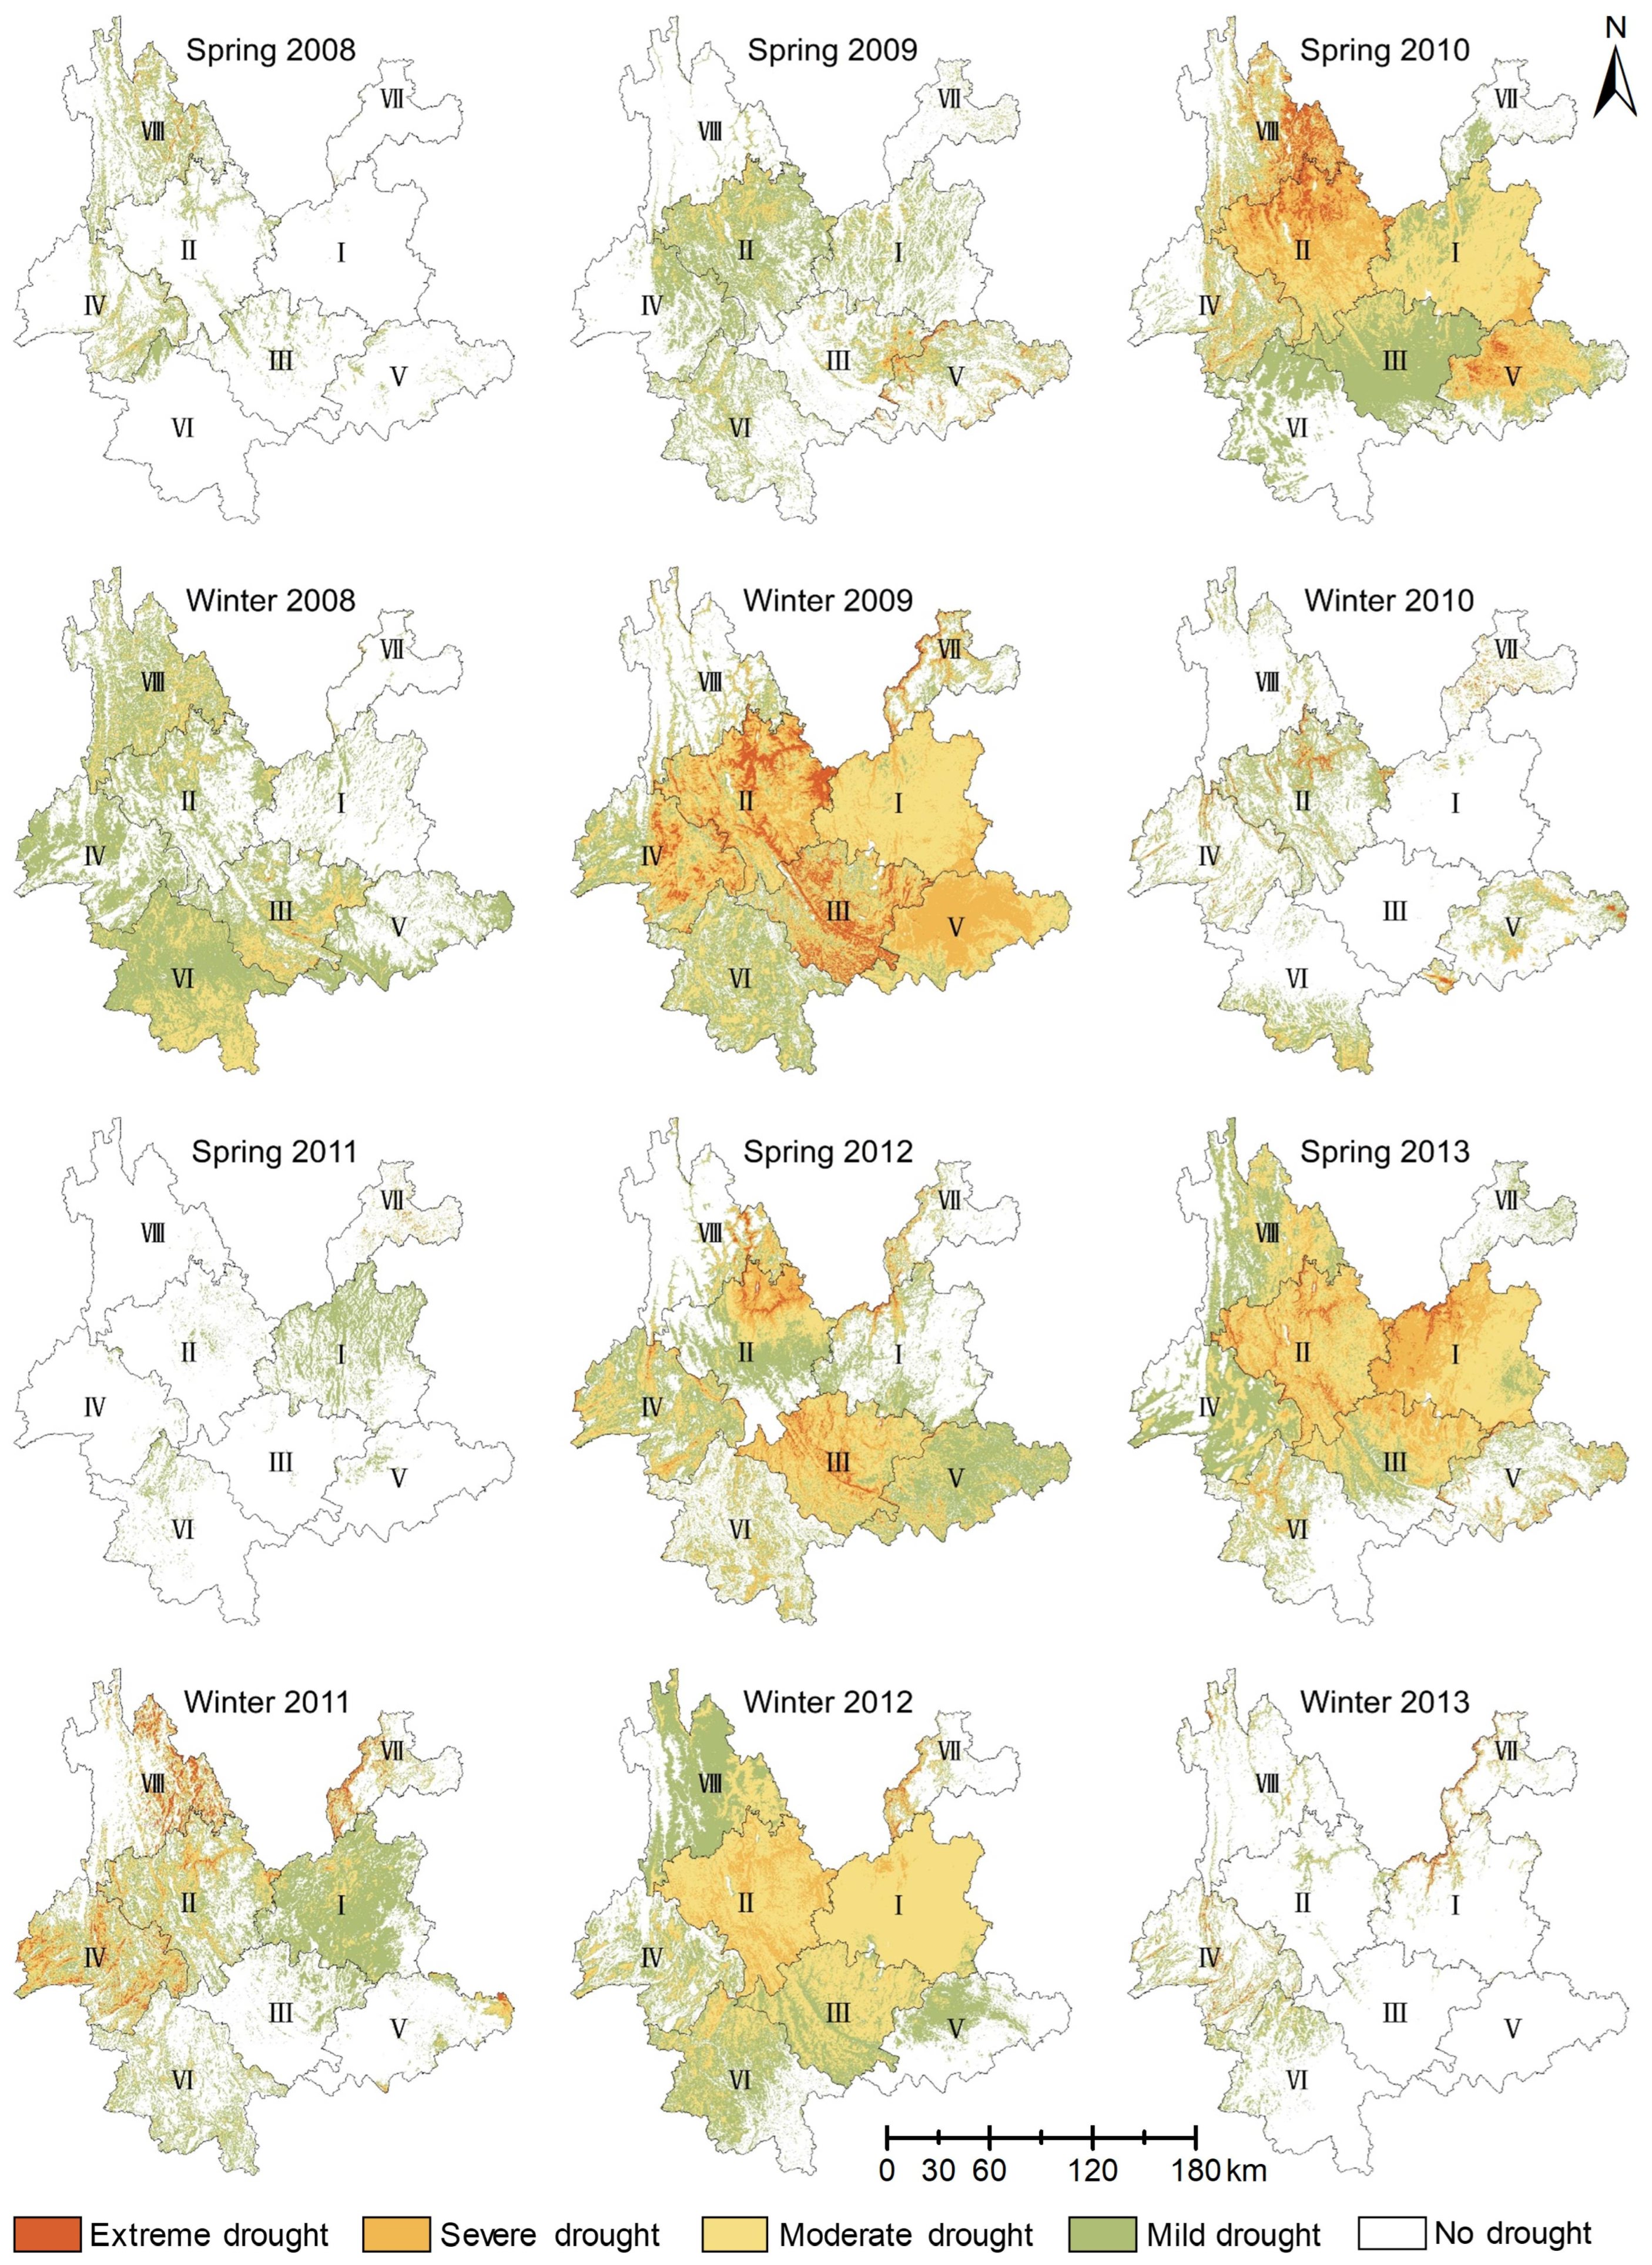
Figure 6.
CDI value changes of different ecological and geographical zones during winter and spring seasons from 2008 to 2013.
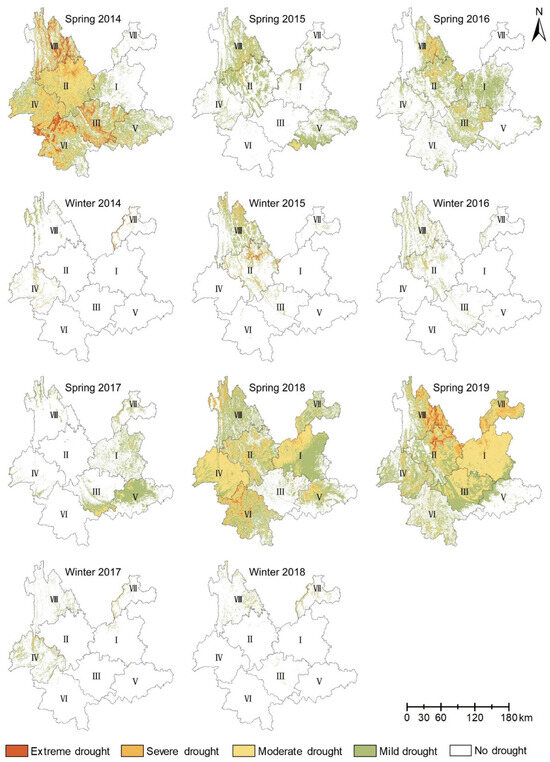
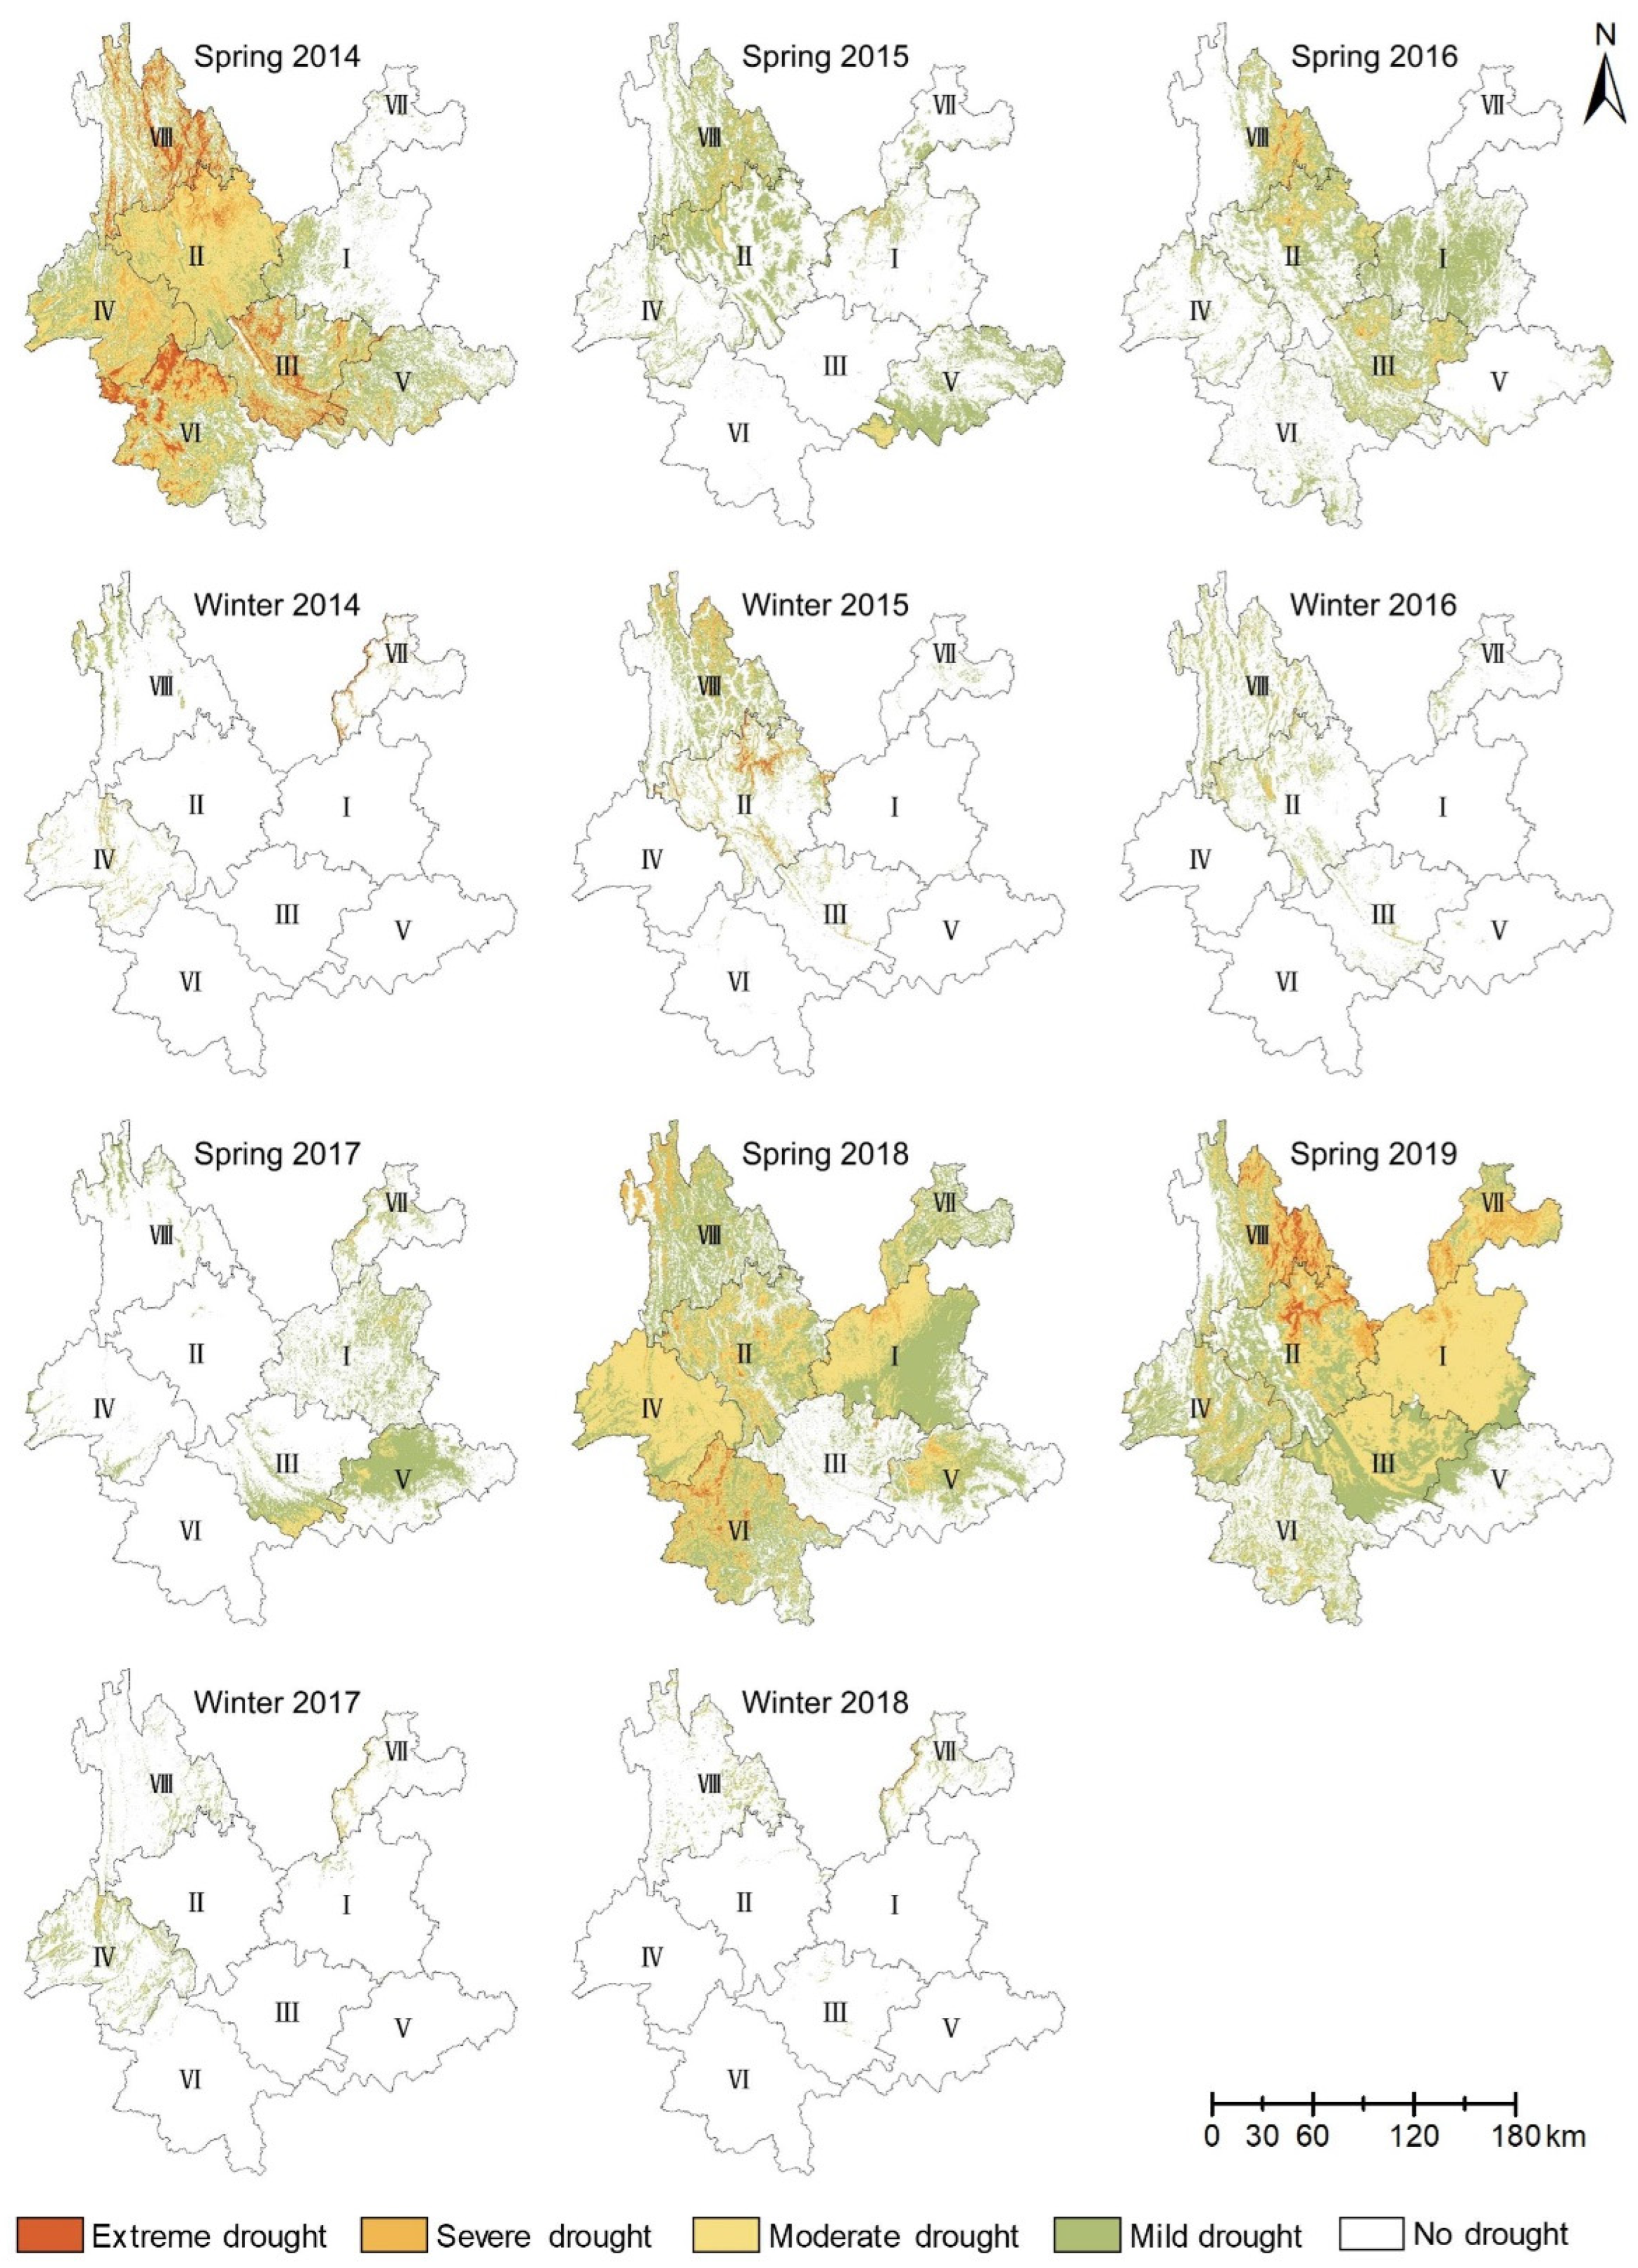
Figure 7.
CDI value changes of different ecological and geographical zones during winter and spring seasons from 2014 to 2019.
From Figure 6, it can be seen that in the spring of 2008, the drought was mainly concentrated in Lincang City of Zone IV, Diqing Prefecture and the northern part of Lijiang City of Zone VIII, mostly in a mild drought state. However, the drought intensified in the winter of 2008, and varying degrees of drought occurred in the entire Yunnan Province except for Zone VII. In the spring of 2009, the central region of Yunnan Province was the primary focus of the drought, with Zone II having the largest coverage of drought, and severe drought mainly occurred in the southeastern part of Wenshan Prefecture of Zone V and the central part of Honghe Prefecture. In the winter of 2009, the drought spread throughout Yunnan Province, with a wider coverage and increased severity level. The most severe drought occurred in the central part of Yunnan Province. The drought situation remained severe in the spring of 2010, with severe droughts occurring in the northern part of Lijiang City and the northern part of Honghe Prefecture. In the winter of 2010, the overall drought situation decreased, but some areas still had severe droughts, mainly distributed in Dali Prefecture, Chuxiong Prefecture, Baoshan City, the western part of Honghe Prefecture, and some parts of Wenshan Prefecture in the east. In the spring of 2011, except for Zone I where a large area of mild drought occurred, there were no severe drought situations in other areas. In the winter of 2011, the drought spread to the northwest and northeast regions of Yunnan Province, with some areas experiencing moderate drought. Zone III and Zone V had a smaller area affected by drought, and the severity was relatively mild. In the spring of 2012, the drought was mainly concentrated in Zone II, Zone III, Zone IV, and Zone V, with a wide distribution and serious severity. However, the winter drought covered the surrounding areas to the central and northwestern parts of Yunnan Province, with Zone II being the most severe and the drought coverage being large. In the spring of 2013, except for the alleviation of the drought severity in Zone VIII, the severity of drought in other areas increased, especially in Zone I, Zone II, and Zone III, where severe drought and a small amount of extreme drought occurred. The drought coverage in Zone IV expanded, and the drought in some areas of Zone VI reached the extreme drought level. In the winter of 2013, although there were still some areas affected by drought, most of the regions did not have a significant drought occurrence.
From Figure 7, it can be seen that in the spring of 2014, severe drought occurred in most areas of western to central Yunnan Province. The areas with the most severe drought were located in Zones II, III, IV, VI, and VIII. The winter of 2014 had the lightest drought conditions, with the exception of a small area in Zone VII, where drought occurred. The scope of the spring 2015 drought was smaller, with no drought in Zones I, III, and VI, while drought in Zones II, V, and VIII was distributed along higher altitude mountain ranges. The severity of the winter 2015 drought also decreased, with no significant drought in all areas except for Zones II, III, and VIII. In the spring of 2016, drought was concentrated in the central part of Yunnan Province, where Zone I had a mild drought, Zone II had a mixture of moderate and mild droughts in the northeast, and a few areas in the northern part of Dali Prefecture experienced severe drought; Zone III had similar drought severity to Zone II, while Zone VIII had drought in the northern part of Lijiang City and the eastern part of Diqing Prefecture. The distribution of drought in the winter of 2016 was basically the same as the previous winter, mainly occurring in a few areas of Zones II, III, and VIII. In the spring of 2017, there was mild to moderate drought in the eastern part of Yunnan Province, with concentrated drought in the border areas of Honghe Prefecture and Wenshan Prefecture in the south. In the winter of 2017, the drought shifted to the western part of Yunnan Province, mainly mild drought. In the spring of 2018, drought conditions worsened, with moderate to severe drought occurring in most areas, with Zones II and IV experiencing more severe drought. The winter of 2018 saw relief from the drought. In the spring of 2019, drought spread rapidly, with light drought covering the entire region and moderate drought concentrated in Zones I and II. Serious severe and extreme drought occurred in the northern part of Chuxiong Prefecture and Dali Prefecture in Zone II, and the northern part of Lijiang City in Zone VIII, which seriously affected the social and economic development of the region.
To sum up, the spatiotemporal characteristics of drought in Yunnan Province from 2008 to 2019 are basically consistent. Spring is the high incidence period of drought, and it is extremely prone to consecutive droughts in winter and spring. Most areas of drought in spring are alleviated, and moderate drought and mild drought are the main types of droughts in Yunnan Province. Zones I, II, III, and IV, located in the central and northwest parts of Yunnan Province, are extremely prone to drought, and the severity and duration of drought are long-lasting. Overall, since the winter of 2014, the occurrence of drought during the winter and spring seasons from 2015 to 2019 has been less than that from 2008 to 2014, with the drought-prone area significantly reduced, and mild drought being the main type of drought.
3.3.3. Analysis of Drought Areas in Different Ecological and Geographical Regions
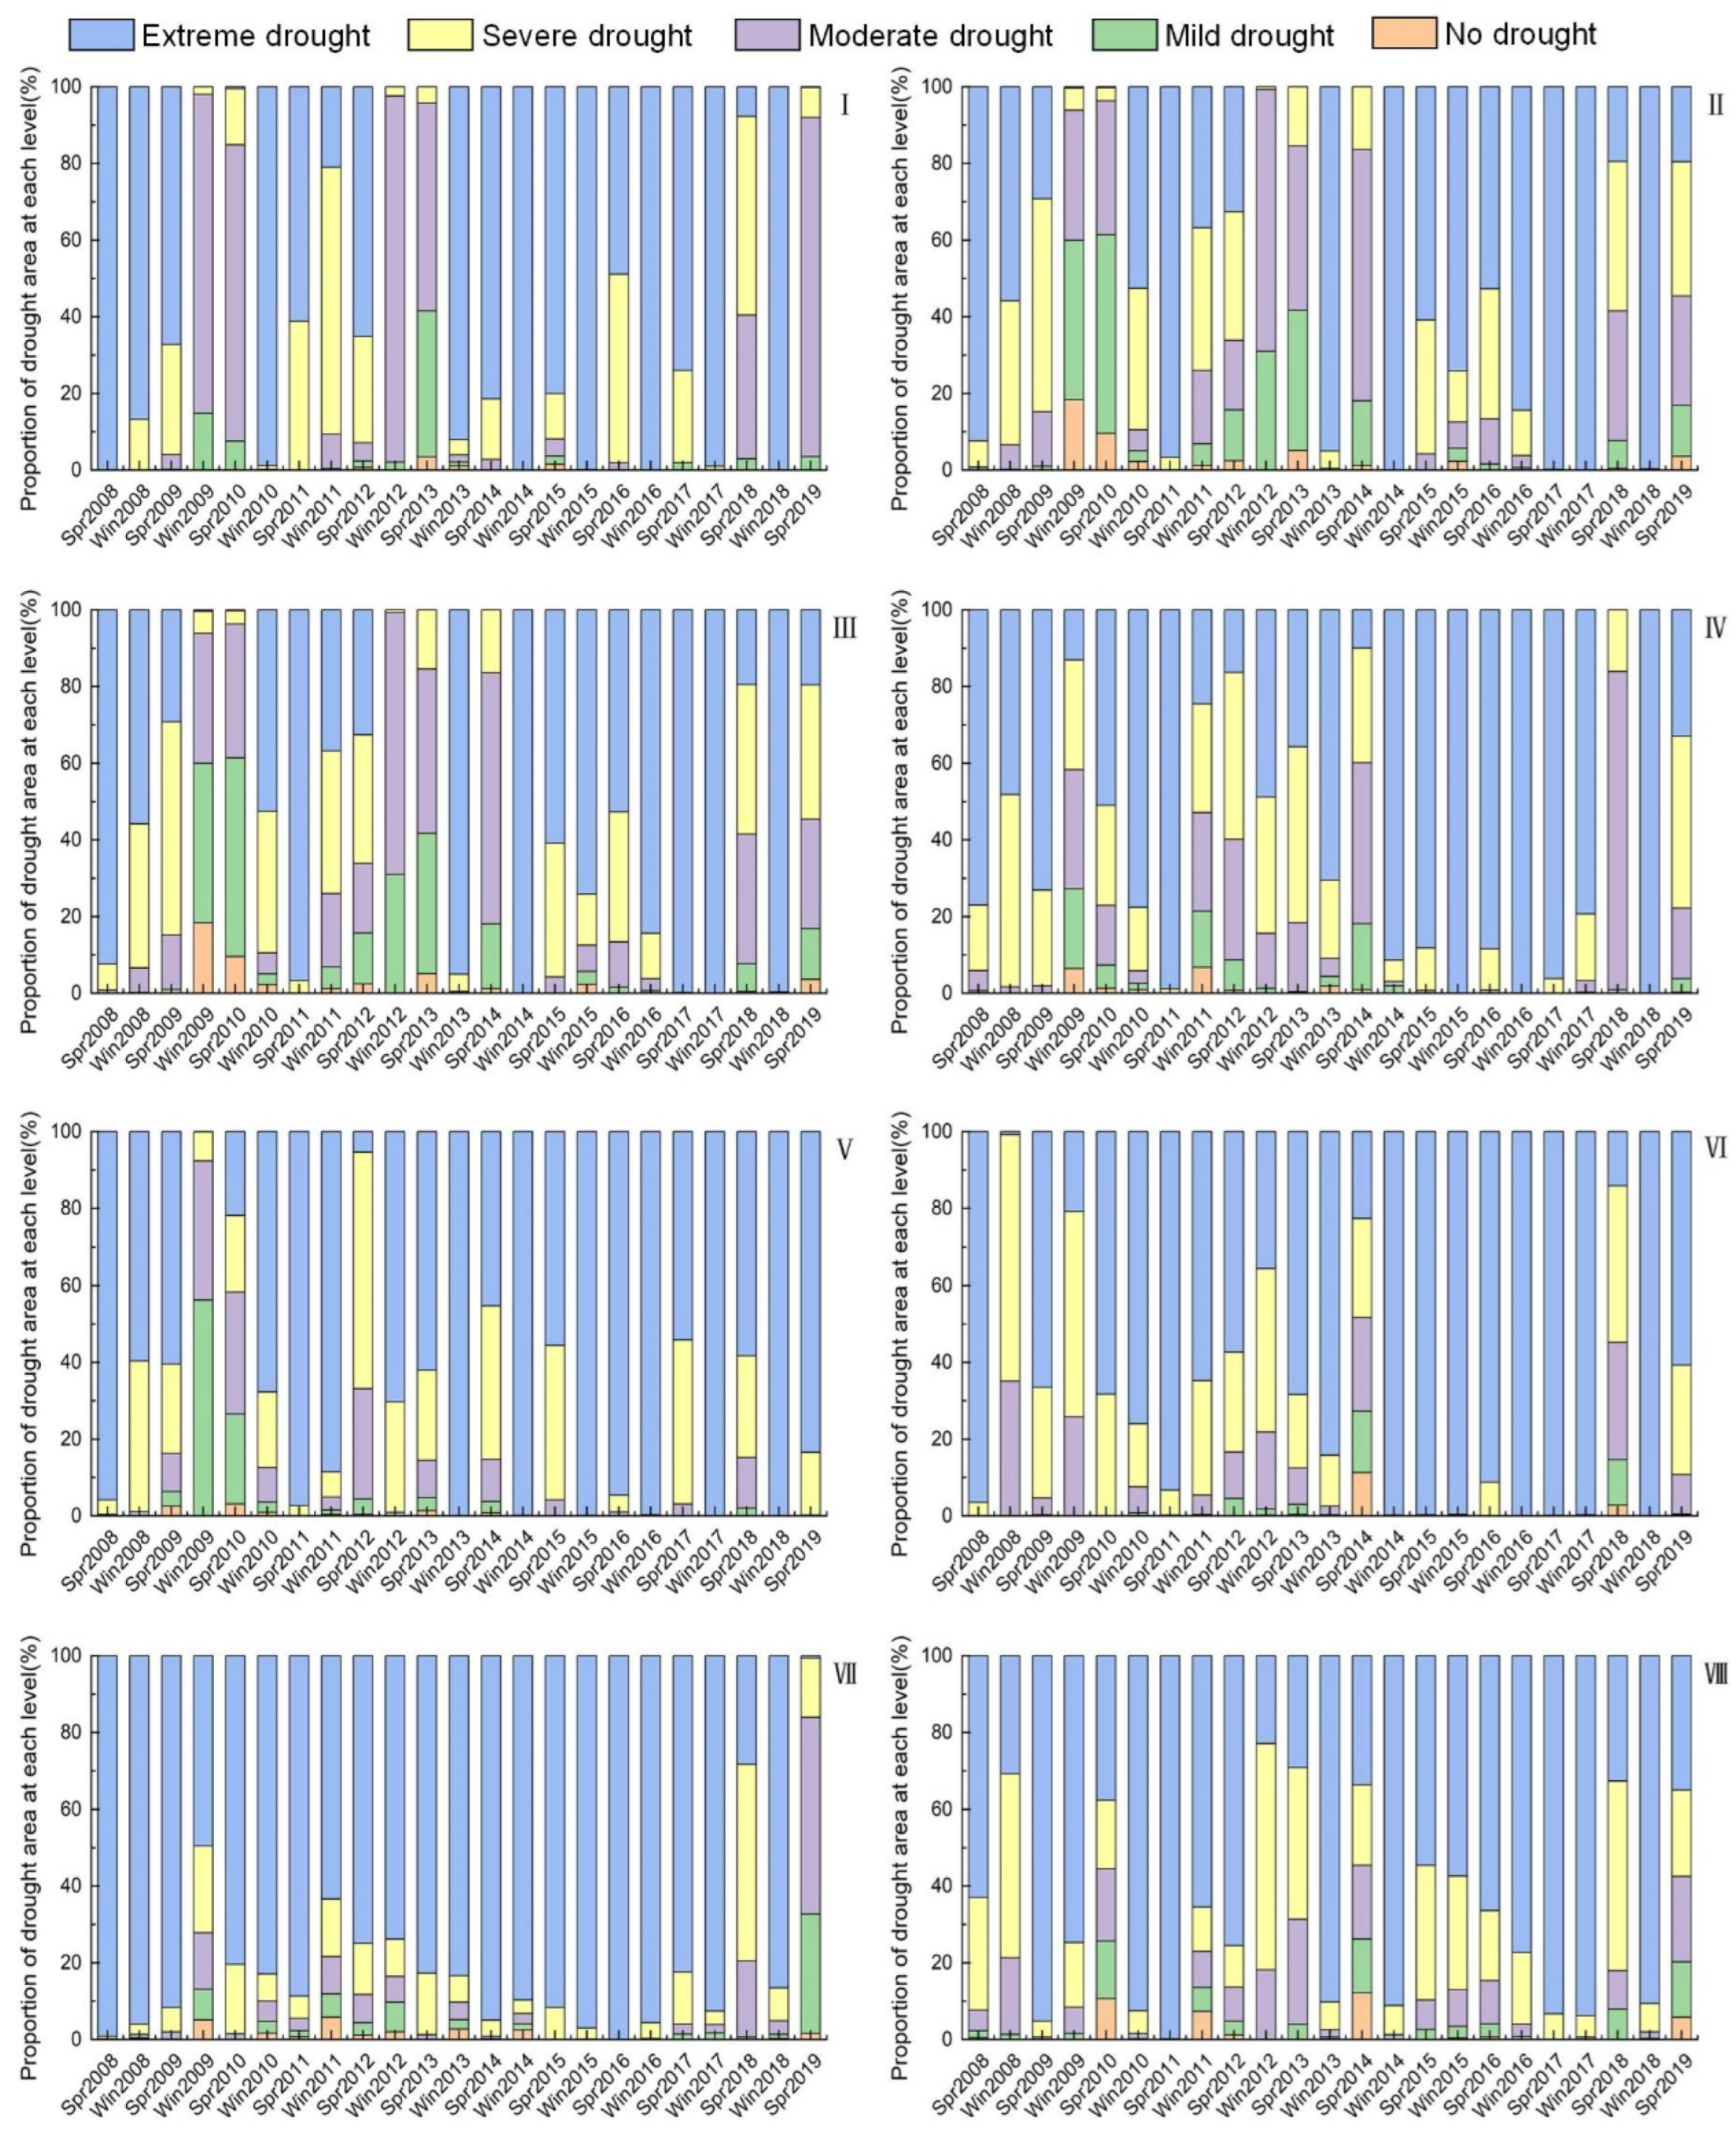
For the purpose of further exploring the extent of the impact of drought in different ecological and geographical regions from 2008 to 2019, the CDI value was calculated based on raster calculations, and based on the CDI, the proportion of drought areas at different levels in different ecological and geographical regions was calculated. The results are shown in Figure 8.
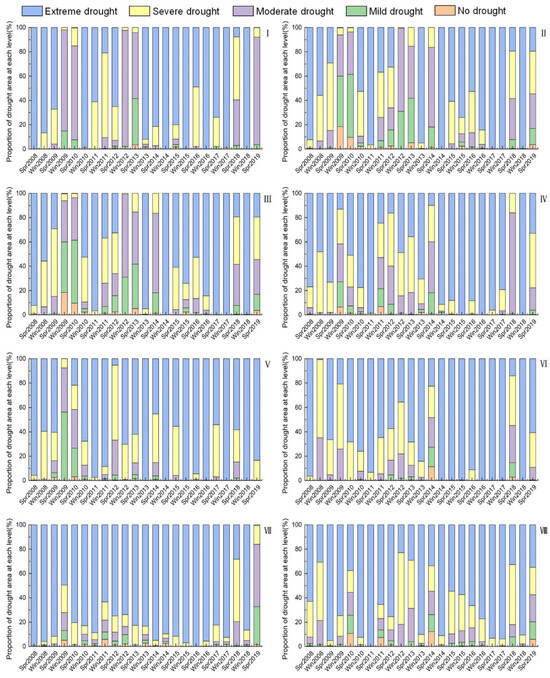
Figure 8.
Proportions of different levels of drought area in different ecological–geographic regions.
In Zone I, the severity of drought was relatively light in the springs of 2008–2009, with no drought area accounting for over 60% of the total area. However, in the winter of 2009, spring of 2010, and winter of 2012, the proportion of moderate or severe drought areas exceeded 70%, and there was also a large area of mild drought from the spring of 2011 to spring of 2012. From the winter of 2013 to winter of 2017, the severity of drought eased significantly, and there were almost no large-scale moderate or severe droughts. In the spring of 2018, the proportion of moderate or severe drought areas reached 30%, and in the spring of 2019, it even reached 90%. In Zone II, the severity of drought was generally more serious from 2008 to 2019, and there were frequent occurrences of consecutive droughts in multiple seasons. From the spring of 2009 to spring of 2014, the proportion of drought areas was the highest, with almost 100% of the area experiencing mild drought or worse in some quarters, and there were even severe or exceptional droughts, with proportions ranging from 30% to 60%. The severity of drought has eased somewhat since 2014. Drought in Zone III can be divided into three stages. The first stage was from the winter of 2008 to spring of 2010, during which the proportion of mild drought or worse reached 70% in the winter of 2008. The second stage was from the spring of 2012 to spring of 2014, during which almost 100% of the area experienced drought in the spring and winter of 2012, and the proportion of drought areas was also close to 80% in the springs of 2013 and 2014. Different levels of drought occurred in the winter and springs of 2012 and 2014. The third stage was from the spring of 2016 to spring of 2019, during which the severity of drought was less than the previous two stages, with almost no drought except for a few mild or moderate cases. Drought in Zone IV can be divided into two stages based on the winter of 2014. In the first stage, from the spring of 2008 to spring of 2014, there were obvious seasonal consecutive drought and aggregation drought events. In the second stage, from the winter of 2014 to spring of 2017, the severity of drought was relatively light, with the proportion of drought areas being around 10% in quarters experiencing drought. However, in the spring of 2018, the drought worsened, with almost 100% of the area experiencing drought, and in the spring of 2019, the proportion of mild or worse drought areas also exceeded 60%.
Compared with the above four regions, the drought situation in Zone V was relatively mild. The period of most severe drought occurred from the winter of 2008 to the spring of 2010, during which the proportion of drought area reached 100%, and the drought covered the entire region, with the severe drought area accounting for more than 50%. In the spring of 2010, the drought-affected area was around 80%, with severe, moderate, and mild drought each accounting for about 20% of the area, and the severity of the drought cannot be underestimated. In addition, there was also a large area affected by drought in the spring of 2012, with more than 90% affected, mainly mild and moderate drought. The drought situation in Zone VI mainly occurred from the winter of 2008 to the spring of 2014, with mainly mild and moderate drought, where in the winter of 2008, the drought-affected area exceeded 95%, while the drought-affected area in the winters of 2009, 2012, and spring of 2014 was between 60% and 80%, and the drought situation was equally severe. Drought was relatively mild in other seasons, with drought-affected areas all below 50%, and even less than 10% in the spring of 2011. The drought situation in Zone VII was relatively mild overall, with only the drought-affected area in 2009 exceeding 50%, and the drought-affected area in other parts of the region was below 40% and even less than 10% in some seasons, indicating a relatively small impact of drought. Zone VIII experienced varying degrees of drought in most seasons during the study period, with the drought levels mainly being mild and moderate. The moderate drought area in the winters of 2008, 2012, and 2018 each accounted for more than 50% of the area, while the mild, moderate, severe, and extreme drought areas were relatively evenly distributed in the spring of 2010, winter of 2011, and spring of 2014, indicating a relatively severe drought situation. Apart from the above-mentioned period, the drought situation in other seasons was relatively mild.
Overall, during the entire study period, the regions with severe drought conditions were mainly in Zones I, II, III, and IV, while Zone VII had the lightest drought conditions. Most regions were prone to seasonal droughts, and the cycles were relatively long. Mild drought was the main type of drought in all zones, occurring frequently and covering a large area. Moderate drought was the second most common type of drought.
3.3.4. Analysis of Drought Frequency in Different Eco–Geographic Regions
Based on the quarterly time series of drought grades from 2008 to 2019 for 125 meteorological stations in Yunnan Province, the frequency of different drought grades in winter and spring seasons at each station was calculated. The results are shown in Table 5 and Table 6.
Table 5.
Drought frequency by severity level in different ecological and geographic regions during spring (%).
Table 6.
Drought frequency by severity level in different ecological and geographic regions during winter (%).
From Table 5, it can be seen that in the spring season, the drought in Yunnan Province is mainly moderate and mild. Among the regions where drought occurred, Zone VII stands out as having the most frequent occurrence of extreme drought, at 0.83%; Zone IV stands out as having the most frequent occurrence of severe drought, at 5.16%; Zone I stands out as having the most frequent occurrence of moderate drought, reaching 32.64%; Zone V stands out as having the most frequent occurrence of light drought, reaching 42.95%, far higher than other regions. Zones IV and VII have relatively light drought levels, with no drought frequency above 60% throughout the spring season.
From Table 6, it can be seen that in winter, the severity of drought in Yunnan Province is significantly reduced compared to spring, and the frequency of moderate and severe droughts is significantly reduced. Among the regions afflicted by drought, Zone VI records the highest frequency of extreme drought, accounting for 0.7%. Meanwhile, Zone V experiences the most frequent occurrence of severe drought, at 10.49%. For moderate drought, Zone I tops the list with a frequency of 19.17%, while Zone III suffers the highest rate of light drought, reaching 18.69%. Throughout the winter season, all regions experience drought-free conditions for over 65% of the time.
In summary, the drought situation in Yunnan province has obvious seasonality, with the main types being moderate and mild drought. Notably, the frequency of drought occurrences in spring, markedly surpassing that of winter. Furthermore, notable disparities exist in the intensity of drought across different ecological and geographical landscapes. This conclusion is consistent with the above analysis of the spatial and temporal variations of drought across regions and the changes in drought-affected areas.
4. Discussion
In the process of conducting comprehensive drought remote sensing monitoring in large-scale regions, the spatial heterogeneity of the land surface often affects the effectiveness and accuracy of regional drought assessment. Regional division can effectively mitigate the impact of climate and ecological spatial heterogeneity on a large scale. However, in the choice of zoning methods, most of the existing ecological–geographic zoning approaches predominantly use a top-down deductive approach to partition regions from high to low [47,48]. This is a relatively simple and feasible method, which only requires spatial data overlay of various indicators to obtain the initial partitioning results. Then, the partitioning results can be appropriately adjusted based on expert experience and knowledge to obtain the final partitioning results. However, such methods have a relatively high degree of subjectivity, and there are significant differences between different approaches. Moreover, although combining ecological and socio-economic factors can improve the targeting of different regional partitioning, this process did not consider the spatiotemporal differences in the data, which affects the stability of regional information extraction [49]. The partitioning method based on dual-constraint spatial clustering proposed in this study considers both spatial position and attribute similarity. On this basis, spatial vector data are introduced to further constrain the number of partitions, not only focusing on the spatial distance between spatial objects but also paying more attention to the attribute distance between them. This makes the partitioned regions more consistent with the actual situation and can obtain more accurate and reliable partitioning results [50]. In addition, it is worth noting that due to the limitations of partition size and quantity, only a small number of meteorological stations are included in Zone VII and Zone VIII, which may be the main reason for the poor monitoring effect in this region.
In this study, we introduced an approach for constructing a comprehensive drought monitoring model based on ecological and geographical zoning. The findings of our research indicate that the comprehensive drought surveillance indicator, which incorporates topographic factors, may be a reliable index based on ecological and geographical zoning. Previous research has shown that conventional remote sensing metrics, including the TCI and the VCI, are only dependent on elements like rainfall and vegetation cover. Consequently, the effectiveness of numerous remote sensing indicators is constrained across diverse geographical regions [51]. For example, in their study, Nichol et al. [52] found that a single precipitation–vegetation aridity index has different characteristics under different land use types in the drought-prone area of central Yunnan Province, China. Zhang et al. [53] observed that remote sensing drought indices performed well in the central region of Texas but poorly in the western and northeastern parts of the state. In comparison, the drought monitoring model proposed in this study, which is based on ecological–geographic zoning and incorporates topographical factors, exhibits better performance in different climatic regions of Yunnan Province. Compared with the study of Yu et al. [54] on Yunnan Province, the drought monitoring effect has been improved, effectively enhancing the accuracy of drought monitoring models in large-scale and complex topographical regions by mitigating spatial heterogeneity. Furthermore, this not only enriches the theoretical framework of drought monitoring but also provides new practical guidance for drought monitoring in large-scale and complex topographical regions.
However, there are also some limitations that may affect the performance of this index, with the most notable concern being how to determine the weights of the distance and attribute variables when using the dual-constrained clustering algorithm for ecological–geographic zoning. The weights represent how we assess the influence of these two different variables on the zoning results, so different weightings can lead to different partitions. It is evident that assigning weights to variables is a critical factor influencing zoning results, and finding the right weighting to align the zoning results more closely with reality is an area that requires further research and effort.
5. Conclusions
Effectively monitoring the occurrence and development of drought is a prerequisite for conducting scientific drought prevention and mitigation. One of the key challenges in current research is how to construct drought models suitable for regional drought monitoring while considering the impact of spatial heterogeneity in drought. To address this issue, this study introduced an approach for establishing drought monitoring models that adapt to spatial heterogeneity using ecological–geographic zoning. Taking Yunnan Province as an example, we first applied the dual-constrained spatial clustering method to perform ecological–geographic zoning. Subsequently, we constructed a large-scale drought monitoring model based on zoning and evaluated the model’s monitoring performance using the SPEI. Finally, we conducted further analysis of the spatiotemporal variations and characteristics of drought during the winter and spring seasons in Yunnan Province from 2008 to 2019. The research results indicate the following: (1) Ecological–geographic zoning is effective in distinguishing the differences in drought processes at a large-scale regional level. Zonal drought monitoring models outperform conventional non-zonal models in terms of assessment effectiveness. (2) Our zonal drought monitoring model performs well in assessing historical drought occurrences in Yunnan Province, and its assessment results align well with the observed spatiotemporal differentiation patterns. These findings demonstrate that our study offers a new modeling approach and application method for drought monitoring in complex large-scale geographic environments. However, the determination of distance and attribute variable weights in ecological–geographic zoning remains a key focus for future research.
Author Contributions
Conceptualization, S.L., Q.X., J.Y. and X.W.; methodology, S.L., Q.X. and J.Y.; software, S.L. and X.W.; validation, S.L., Q.X. and J.Y.; formal analysis, S.L. and Q.X.; investigation, S.L. and J.Y.; resources, Q.X.; data curation, S.L. and X.W.; writing—original draft preparation, S.L.; writing—review and editing, Q.X. and J.Y.; visualization, S.L. and X.W.; supervision, Q.X. and J.Y.; funding acquisition, Q.X. and J.Y. All authors have read and agreed to the published version of the manuscript.
Funding
This research was funded by the National Natural Science Foundation of China (grant numbers: 42161065, 41461038).
Data Availability Statement
The datasets used and analyzed during the current study are available from the corresponding author on reasonable request.
Acknowledgments
We would like to express our sincere gratitude to the editors and reviewers who invested considerable time and effort into our comments on this paper. We have gained useful insights from and would like to express their sincere gratitude to A-Xing Zhu for his lecture “Condensation of scientific problems and writing of SCI papers and grant projects.”
Conflicts of Interest
The authors declare no conflicts of interest.
References
- Alahacoon, N.; Edirisinghe, M. A comprehensive assessment of remote sensing and traditional based drought monitoring indices at global and regional scale. Geomat. Nat. Hazards Risk 2022, 13, 762–799. [Google Scholar] [CrossRef]
- Bhardwaj, J.; Kuleshov, Y.; Chua, Z.-W.; Watkins, A.B.; Choy, S.; Sun, C. Pairing monitoring datasets with probabilistic forecasts to provide early warning of drought in Australia. J. Hydrol. 2023, 626, 130259. [Google Scholar] [CrossRef]
- Liu, Y.; Liu, Y.; Wang, W. Inter-comparison of satellite-retrieved and Global Land Data Assimilation System-simulated soil moisture datasets for global drought analysis. Remote Sens. Environ. 2019, 220, 1–18. [Google Scholar] [CrossRef]
- Vicente-Serrano, S.M.; Quiring, S.M.; Peña-Gallardo, M.; Yuan, S.; Domínguez-Castro, F. A review of environmental droughts: Increased risk under global warming? Earth-Sci. Rev. 2020, 201, 102953. [Google Scholar] [CrossRef]
- Du, E.; Chen, F.; Jia, H.; Wang, L.; Yang, A. Spatiotemporal Evolution and Hysteresis Analysis of Drought Based on Rainfed-Irrigated Arable Land. Remote Sens. 2023, 15, 1689. [Google Scholar] [CrossRef]
- Yu, H.; Li, L.; Liu, Y.; Li, J. Construction of Comprehensive Drought Monitoring Model in Jing-Jin-Ji Region Based on Multisource Remote Sensing Data. Water 2019, 11, 1077. [Google Scholar] [CrossRef]
- Tran, A.P.; Tran, B.C.; Campbell, S.B.; Nguyen, N.A.; Tran, D.H.; Nguyen, T.T.; Nguyen, A.D.; Duong, H.S. Spatio-temporal characterization of drought variability in data-scarce regions using global precipitation data: A case study in Cauto river basin, Cuba. Sci. Rep. 2024, 14, 11659. [Google Scholar] [CrossRef]
- Khosravi, Y.; Homayouni, S.; St-Hilaire, A. An integrated dryness index based on geographically weighted regression and satellite earth observations. Sci. Total Environ. 2024, 911, 168807. [Google Scholar] [CrossRef]
- Tapas, M.R.; Kumar, U.; Mogili, S.; Jayakumar, K. Development of multivariate integrated drought monitoring index (MIDMI) for Warangal region of Telangana, India. J. Water Clim. Chang. 2022, 13, 1612–1630. [Google Scholar] [CrossRef]
- Jiao, W.; Zhang, L.; Chang, Q.; Fu, D.; Cen, Y.; Tong, Q. Evaluating an enhanced vegetation condition index (VCI) based on VIUPD for drought monitoring in the continental United States. Remote Sens. 2016, 8, 224. [Google Scholar] [CrossRef]
- Brown, J.F.; Wardlow, B.D.; Tadesse, T.; Hayes, M.J.; Reed, B.C. The Vegetation Drought Response Index (VegDRI): A new integrated approach for monitoring drought stress in vegetation. GIScience Remote Sens. 2008, 45, 16–46. [Google Scholar] [CrossRef]
- Mehta, D.J.; Yadav, S. Trend analysis of drought events over the Sirohi District in Western Rajasthan of India. In International Conference on Hydraulics, Water Resources and Coastal Engineering; Springer Nature Singapore: Singapore, 2021; pp. 257–269. [Google Scholar]
- Mehta, D.J.; Yadav, S. Meteorological drought analysis in Pali District of Rajasthan State using standard precipitation index. Int. J. Hydrol. Sci. Technol. 2023, 15, 1–10. [Google Scholar] [CrossRef]
- Ayantobo, O.O.; Li, Y.; Song, S.; Javed, T.; Yao, N. Probabilistic modelling of drought events in China via 2-dimensional joint copula. J. Hydrol. 2018, 559, 373–391. [Google Scholar] [CrossRef]
- Fitriyah, A.; Fatikhunnada, A.; Okura, F.; Nugroho, B.D.A.; Kato, T. Analysis of the Drought Mitigated Mechanism in Terraced Paddy Fields Using CWSI and TVDI Indices and Hydrological Monitoring. Sustainability 2019, 11, 6897. [Google Scholar] [CrossRef]
- Cunha, A.; Alvalá, R.C.; Nobre, C.A.; Carvalho, M.A. Monitoring vegetative drought dynamics in the Brazilian semiarid region. Agric. For. Meteorol. 2015, 214, 494–505. [Google Scholar] [CrossRef]
- Hao, Z.; AghaKouchak, A. A nonparametric multivariate multi-index drought monitoring framework. J. Hydrometeorol. 2014, 15, 89–101. [Google Scholar] [CrossRef]
- Yu, H.; Li, L.; Li, J. Construction of a comprehensive drought monitoring model based on TRMM downscaling and MODIS data. J. Nat. Resour. 2020, 35, 2553–2568. [Google Scholar]
- Zhong, R.; Chen, X.; Lai, C.; Wang, Z.; Lian, Y.; Yu, H.; Wu, X. Drought monitoring utility of satellite-based precipitation products across mainland China. J. Hydrol. 2019, 568, 343–359. [Google Scholar] [CrossRef]
- Lee, S.-J.; Kim, N.; Lee, Y. Development of Integrated Crop Drought Index by Combining Rainfall, Land Surface Temperature, Evapotranspiration, Soil Moisture, and Vegetation Index for Agricultural Drought Monitoring. Remote Sens. 2021, 13, 1778. [Google Scholar] [CrossRef]
- Amani, M.; Salehi, B.; Mahdavi, S.; Masjedi, A.; Dehnavi, S. Temperature-vegetation-soil moisture dryness index (TVMDI). Remote Sens. Environ. 2017, 197, 1–14. [Google Scholar] [CrossRef]
- Liu, Q.; Zhang, S.; Zhang, H.; Bai, Y.; Zhang, J. Monitoring drought using composite drought indices based on remote sensing. Sci. Total Environ. 2020, 711, 134585. [Google Scholar] [CrossRef] [PubMed]
- Mousavi, R.; Johnson, D.; Kroebel, R.; Byrne, J. Analysis of historical drought conditions based on SPI and SPEI at various timescales in the South Saskatchewan River Watershed, Alberta, Canada. Theor. Appl. Climatol. 2023, 153, 873–887. [Google Scholar] [CrossRef]
- Tan, M.L.; Tan, K.C.; Chua, V.P.; Chan, N.W. Evaluation of TRMM product for monitoring drought in the Kelantan River Basin, Malaysia. Water 2017, 9, 57. [Google Scholar] [CrossRef]
- Quiring, S.M.; Ganesh, S. Evaluating the utility of the Vegetation Condition Index (VCI) for monitoring meteorological drought in Texas. Agric. For. Meteorol. 2010, 150, 330–339. [Google Scholar] [CrossRef]
- Zhang, X.; Chen, N.; Li, J.; Chen, Z.; Niyogi, D. Multi-sensor integrated framework and index for agricultural drought monitoring. Remote Sens. Environ. 2017, 188, 141–163. [Google Scholar] [CrossRef]
- Bailey; Robert, G. Explanatory Supplement to Ecoregions Map of the Continents. Environ. Conserv. 1989, 16, 307–309. [Google Scholar] [CrossRef]
- Fu, B.; Chen, L.; Liu, G. The purpose, tasks, and characteristics of ecological regionalization in China. Acta Ecol. Sin. 1999, 5, 591–595. [Google Scholar]
- Fu, B.; Liu, G.; Chen, L.; Ma, K.; Li, J. The ecological regionalization plan for China. Acta Ecol. Sin. 2001, 1, 1–6. [Google Scholar]
- Piniarski, W. Challenges of a GIS-based physical-geographical regionalization of Poland. Environ. Monit. Assess. 2023, 195, 1125. [Google Scholar] [CrossRef]
- Murray, A.T.; Grubesic, T.H.; Wei, R. Spatially significant cluster detection. Spat. Stat. 2014, 10, 103–116. [Google Scholar] [CrossRef]
- Kaufman, L.; Rousseeuw, P.J. Finding Groups in Data: An Introduction to Cluster Analysis; John Wiley & Sons: Hoboken, NJ, USA, 2009. [Google Scholar]
- Fritz, C.E.; Schuurman, N.; Robertson, C.; Lear, S. A scoping review of spatial cluster analysis techniques for point-event data. Geospat. Health 2013, 7, 183–198. [Google Scholar] [CrossRef]
- Ke, X.; Qi, L.; Zeng, C. A partitioned and asynchronous cellular automata model for urban growth simulation. Int. J. Geogr. Inf. Sci. 2016, 30, 637–659. [Google Scholar] [CrossRef]
- Xu, Q.; Wang, Q.; Liu, J.; Liang, H. Simulation of Land-Use Changes Using the Partitioned ANN-CA Model and Considering the Influence of Land-Use Change Frequency. Int. J. Geo-Inf. 2021, 10, 346. [Google Scholar] [CrossRef]
- Administration, C.M. GB/T 20481-2017 Meteorological Drought Level; Meteorol. Press: Beijing, China, 2017. [Google Scholar]
- Molavizadeh, N.; Sertel, E.; Demirel, H. Drought Conditions in Turkey between 2004 and 2013 Via Drought Indices Derived from Remotely Sensed Data. In Energy, Transportation and Global Warming; Springer: Berlin/Heidelberg, Germany, 2016; pp. 113–121. [Google Scholar]
- Ashouri, H.; Hsu, K.-L.; Sorooshian, S.; Braithwaite, D.K.; Knapp, K.R.; Cecil, L.D.; Nelson, B.R.; Prat, O.P. PERSIANN-CDR: Daily precipitation climate data record from multisatellite observations for hydrological and climate studies. Bull. Am. Meteorol. Soc. 2015, 96, 69–83. [Google Scholar] [CrossRef]
- Sindosi, O.; Bartzokas, A.; Kotroni, V.; Lagouvardos, K. Influence of orography on precipitation amount and distribution in NW Greece; a case study. Atmos. Res. 2015, 152, 105–122. [Google Scholar] [CrossRef]
- Li, S.; Xu, Q.; Yi, J.; Liu, J. Construction and application of comprehensive drought monitoring model considering the influence of terrain factors: A case study of southwest Yunnan, China. Environ. Sci. Pollut. Res. 2022, 29, 72655–72669. [Google Scholar] [CrossRef]
- Vicente-Serrano, S.M.; Beguería, S.; López-Moreno, J.I. A multiscalar drought index sensitive to global warming: The standardized precipitation evapotranspiration index. J. Clim. 2010, 23, 1696–1718. [Google Scholar] [CrossRef]
- Mehta, D.; Yadav, S.; Ladavia, C.; Caloiero, T. Drought projection using GCM & statistical downscaling technique: A case study of Sirohi District. Results Eng. 2023, 20, 101605. [Google Scholar]
- Shen, R.; Huang, A.; Li, B.; Guo, J. Construction of a drought monitoring model using deep learning based on multi-source remote sensing data. Int. J. Appl. Earth Obs. Geoinf. 2019, 79, 48–57. [Google Scholar]
- Stefanidis, S.; Rossiou, D.; Proutsos, N. Drought severity and trends in a Mediterranean oak forest. Hydrology 2023, 10, 167. [Google Scholar] [CrossRef]
- Li, J. Assessing the accuracy of predictive models for numerical data: Not r nor r2, why not? Then what? PLoS ONE 2017, 12, e0183250. [Google Scholar] [CrossRef] [PubMed]
- Li, J. Assessing spatial predictive models in the environmental sciences: Accuracy measures, data variation and variance explained. Environ. Model. Softw. 2016, 80, 1–8. [Google Scholar] [CrossRef]
- Ke, X.; Liu, M.; Deng, X. Lake nutrient ecological zoning: A zoning experiment in Northeast China. J. Nat. Resour. 2014, 29, 789–800. [Google Scholar]
- Zhang, Q.F.; Wu, F.Q.; Wang, L.; Yuan, L.; Zhao, L.S. Application of PCA integrated with CA and GIS in eco-economic regionalization of Chinese Loess Plateau. Ecol. Econ. 2011, 70, 1051–1056. [Google Scholar] [CrossRef]
- Xu, T.; Li, E.; Samat, A.; Li, Z.; Liu, W.; Zhang, L. Estimating Large-Scale Interannual Dynamic Impervious Surface Percentages Based on Regional Divisions. Remote Sens. 2022, 14, 3786. [Google Scholar] [CrossRef]
- Jiao, L.; Liu, Y.; Ren, Z. Spatial point clustering based on self-organizing neural networks and its application analysis. Geomat. Inf. Sci. Wuhan Univ. 2008, 2, 168–171. [Google Scholar]
- Zhang, Q.; Shi, R.; Xu, C.Y.; Sun, P.; Yu, H.; Zhao, J. Multisource data-based integrated drought monitoring index: Model development and application. J. Hydrol. 2022, 615, 128644. [Google Scholar] [CrossRef]
- Nichol, J.E.; Abbas, S. Integration of remote sensing datasets for local scale assessment and prediction of drought. Sci. Total Environ. 2015, 505, 503–507. [Google Scholar] [CrossRef]
- Zhang, L.; Jiao, W.; Zhang, H.; Huang, C.; Tong, Q. Studying drought phenomena in the Continental United States in 2011 and 2012 using various drought indices. Remote Sens. Environ. 2017, 190, 96–106. [Google Scholar] [CrossRef]
- Yu, Y.; Shen, Y.; Wang, J.; Wei, Y.; Nong, L.; Deng, H. Assessing the response of vegetation change to drought during 2009–2018 in Yunnan Province, China. Environ. Sci. Pollut. Res. 2021, 28, 47066–47082. [Google Scholar] [CrossRef]


Disclaimer/Publisher’s Note: The statements, opinions and data contained in all publications are solely those of the individual author(s) and contributor(s) and not of MDPI and/or the editor(s). MDPI and/or the editor(s) disclaim responsibility for any injury to people or property resulting from any ideas, methods, instructions or products referred to in the content. |
© 2024 by the authors. Licensee MDPI, Basel, Switzerland. This article is an open access article distributed under the terms and conditions of the Creative Commons Attribution (CC BY) license (https://creativecommons.org/licenses/by/4.0/).