
Simulation of Abnormal Evolution and Source Identification of Groundwater Chemistry in Coal-Bearing Aquifers at Gaohe Coal Mine, China


Abstract
1. Introduction
2. Geological Background
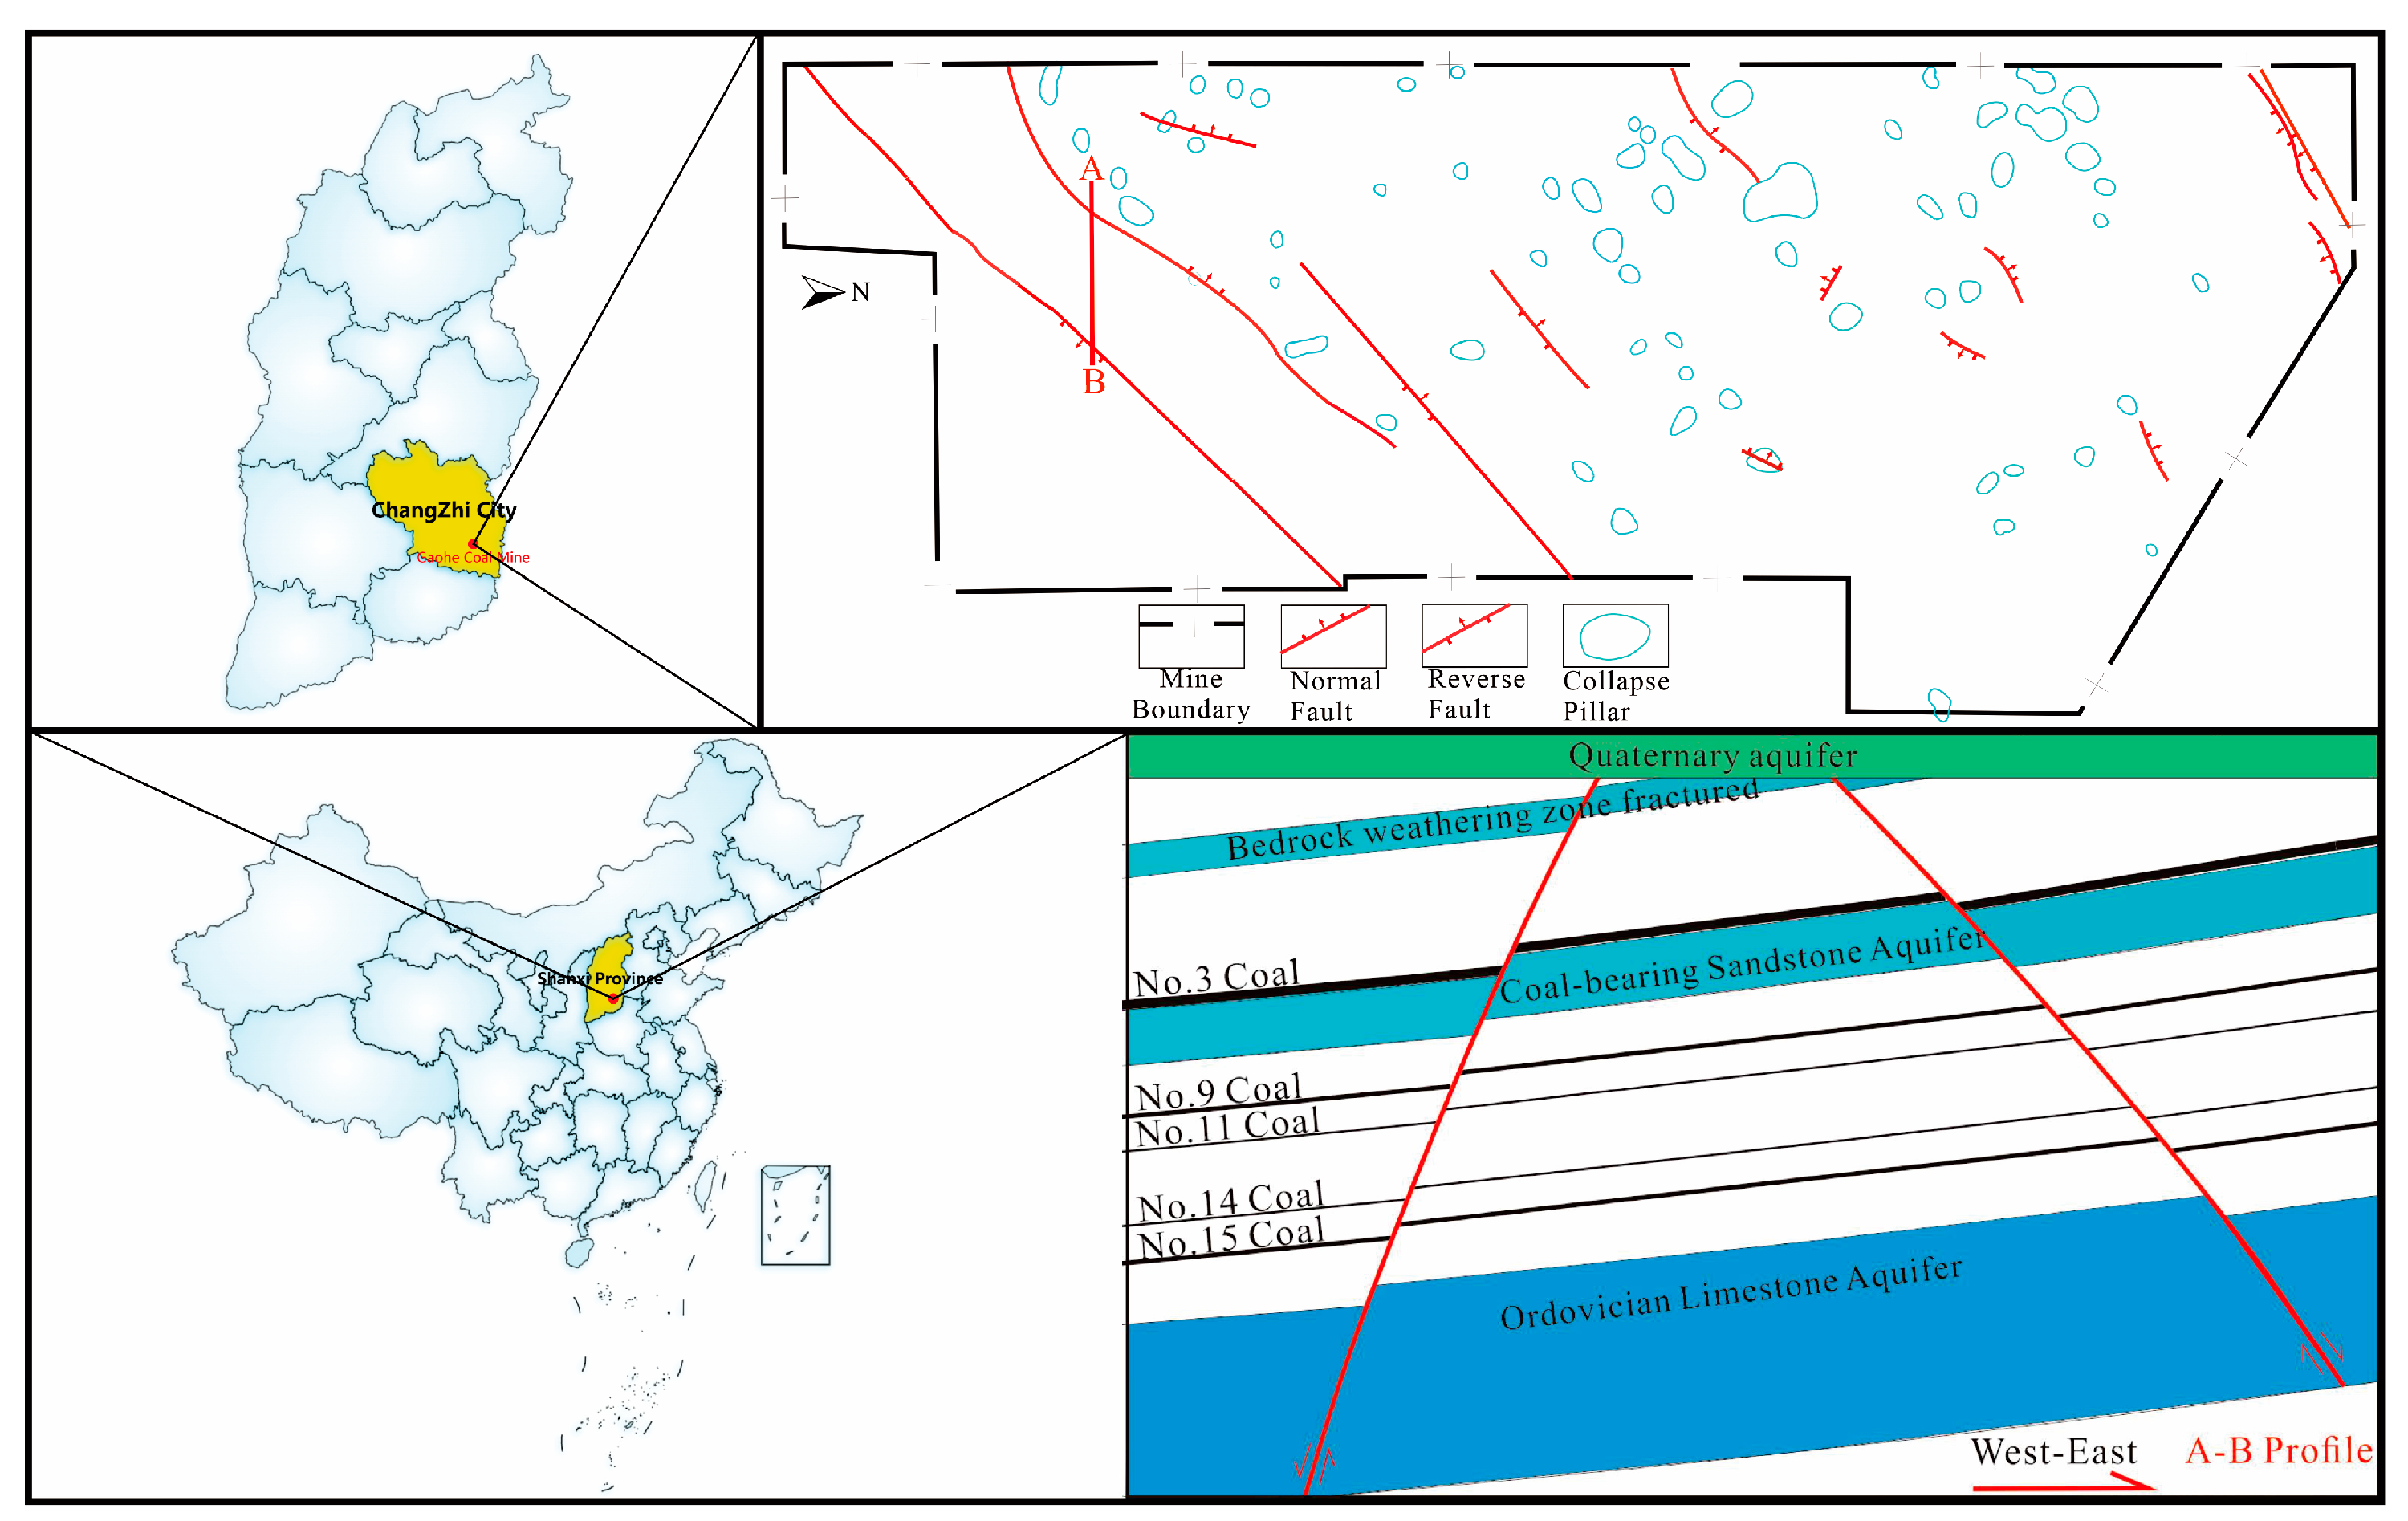
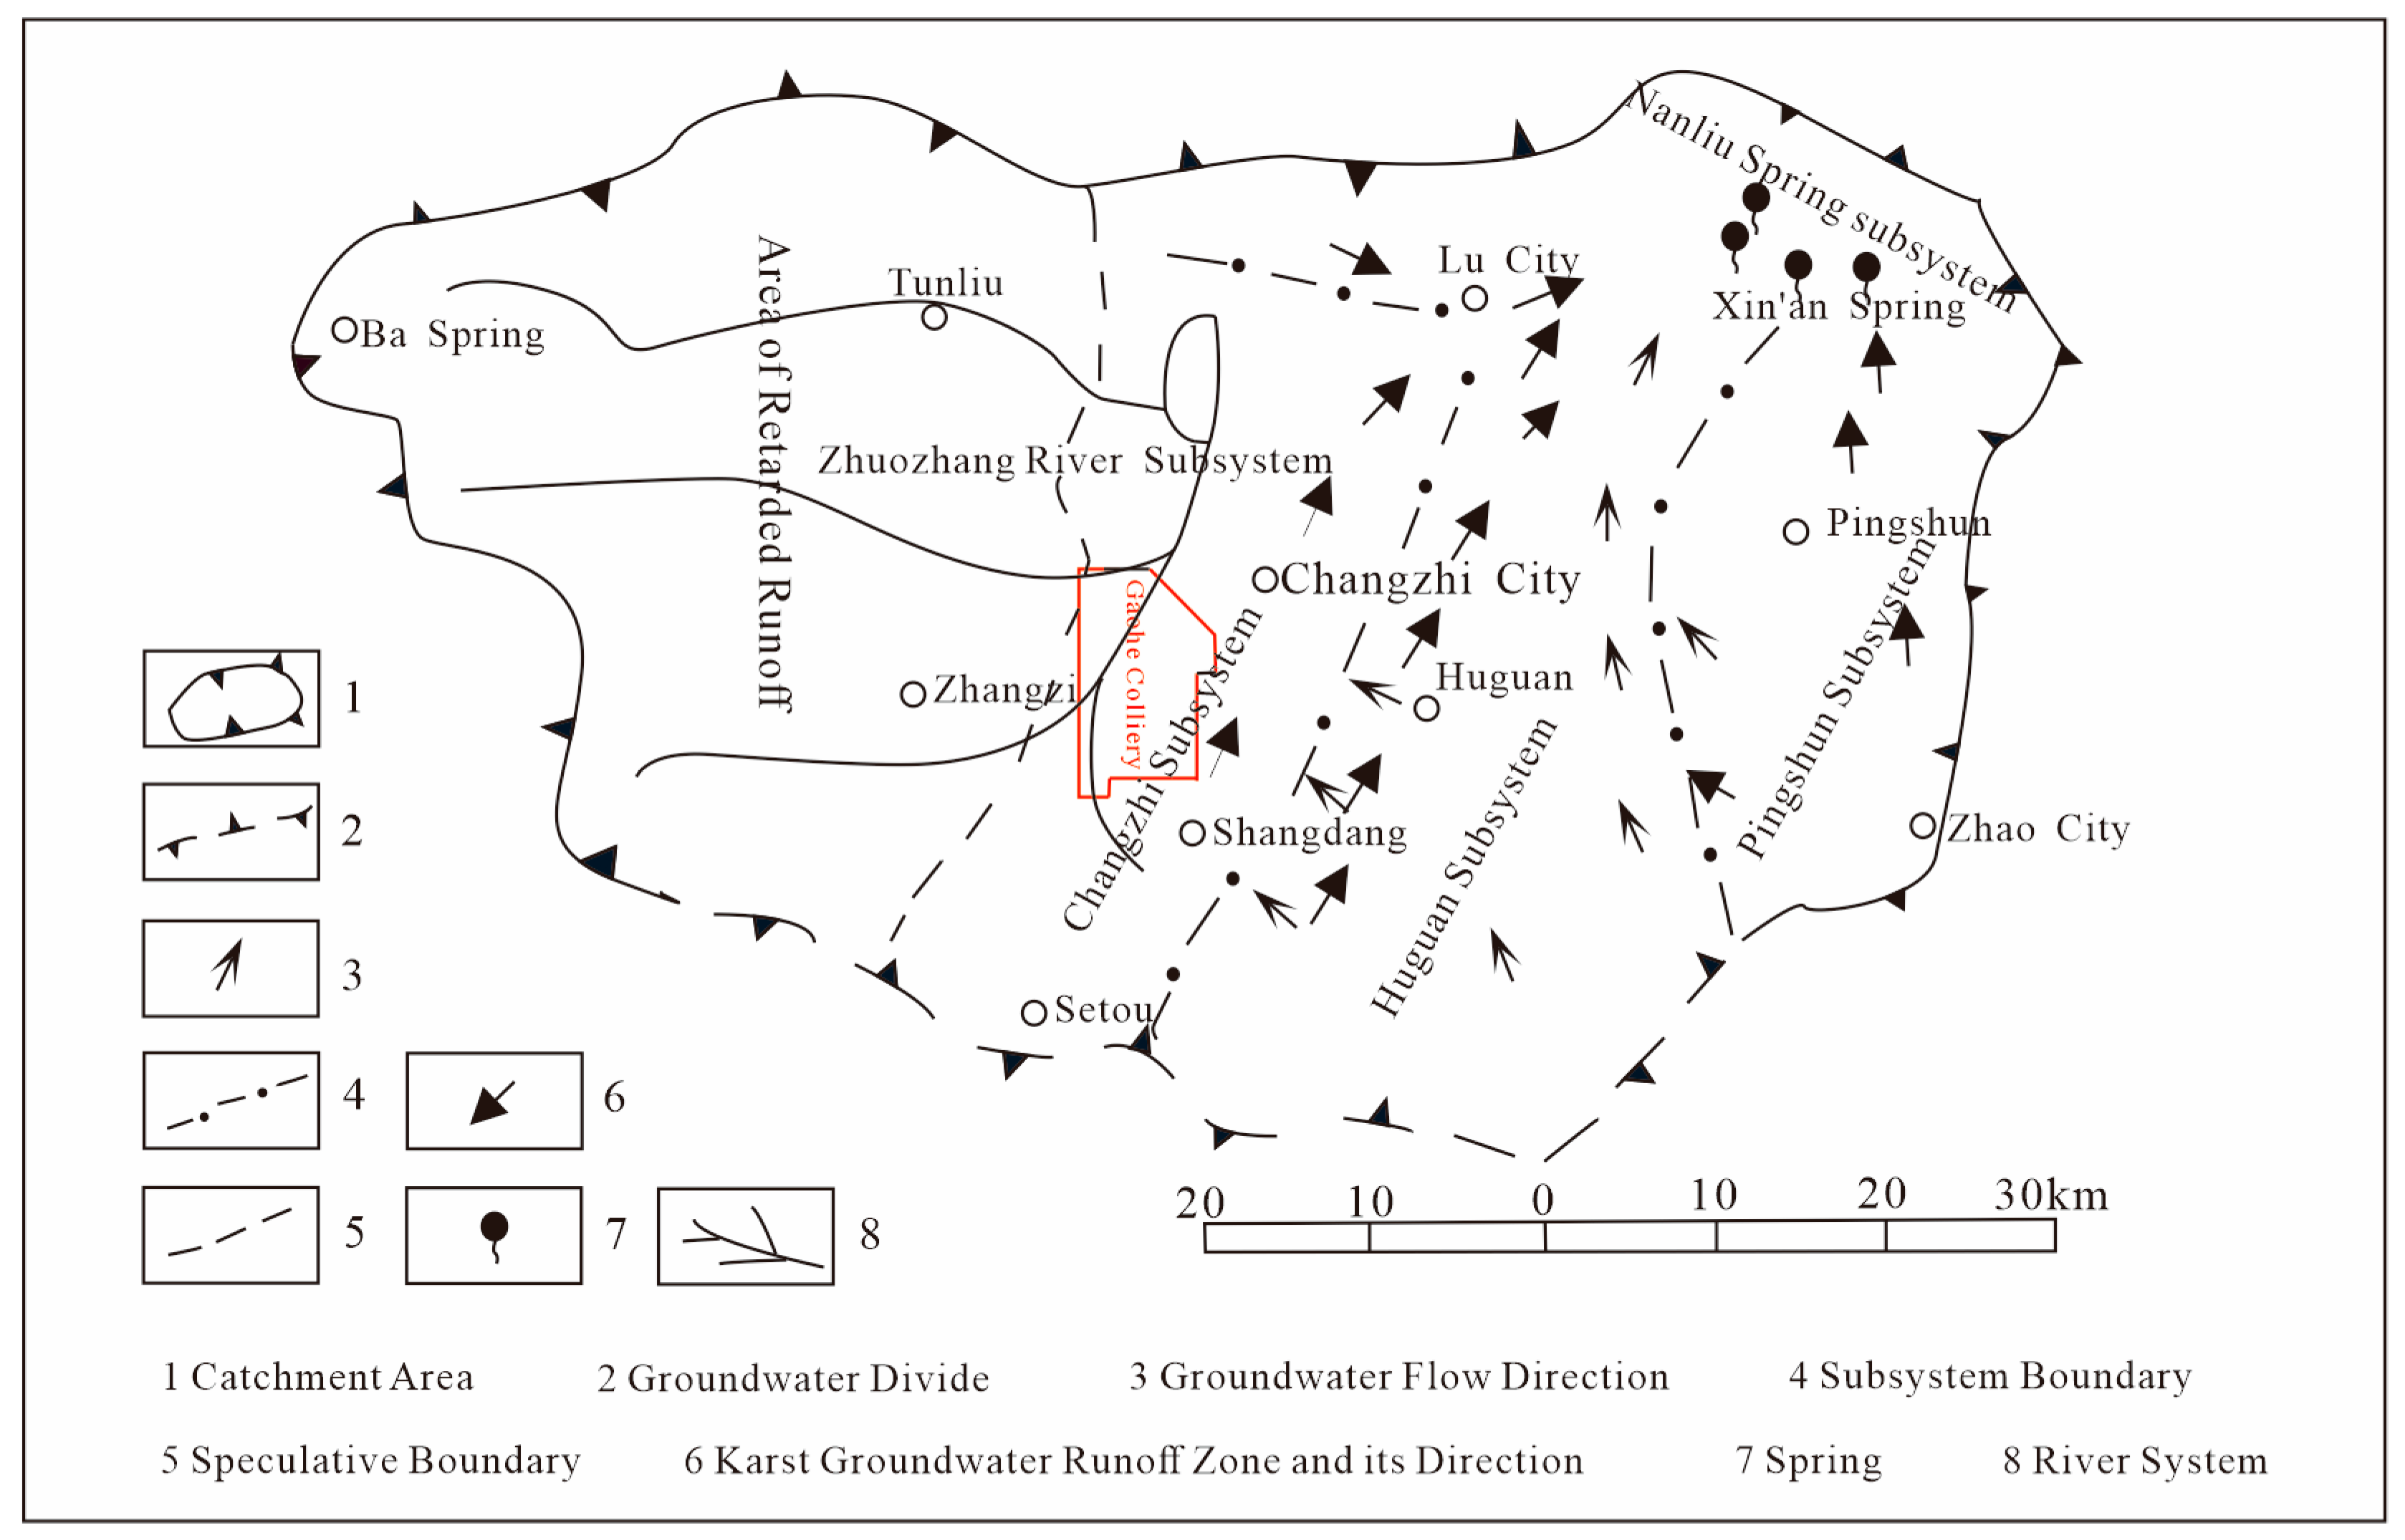
2.1. Overview of the Study Area
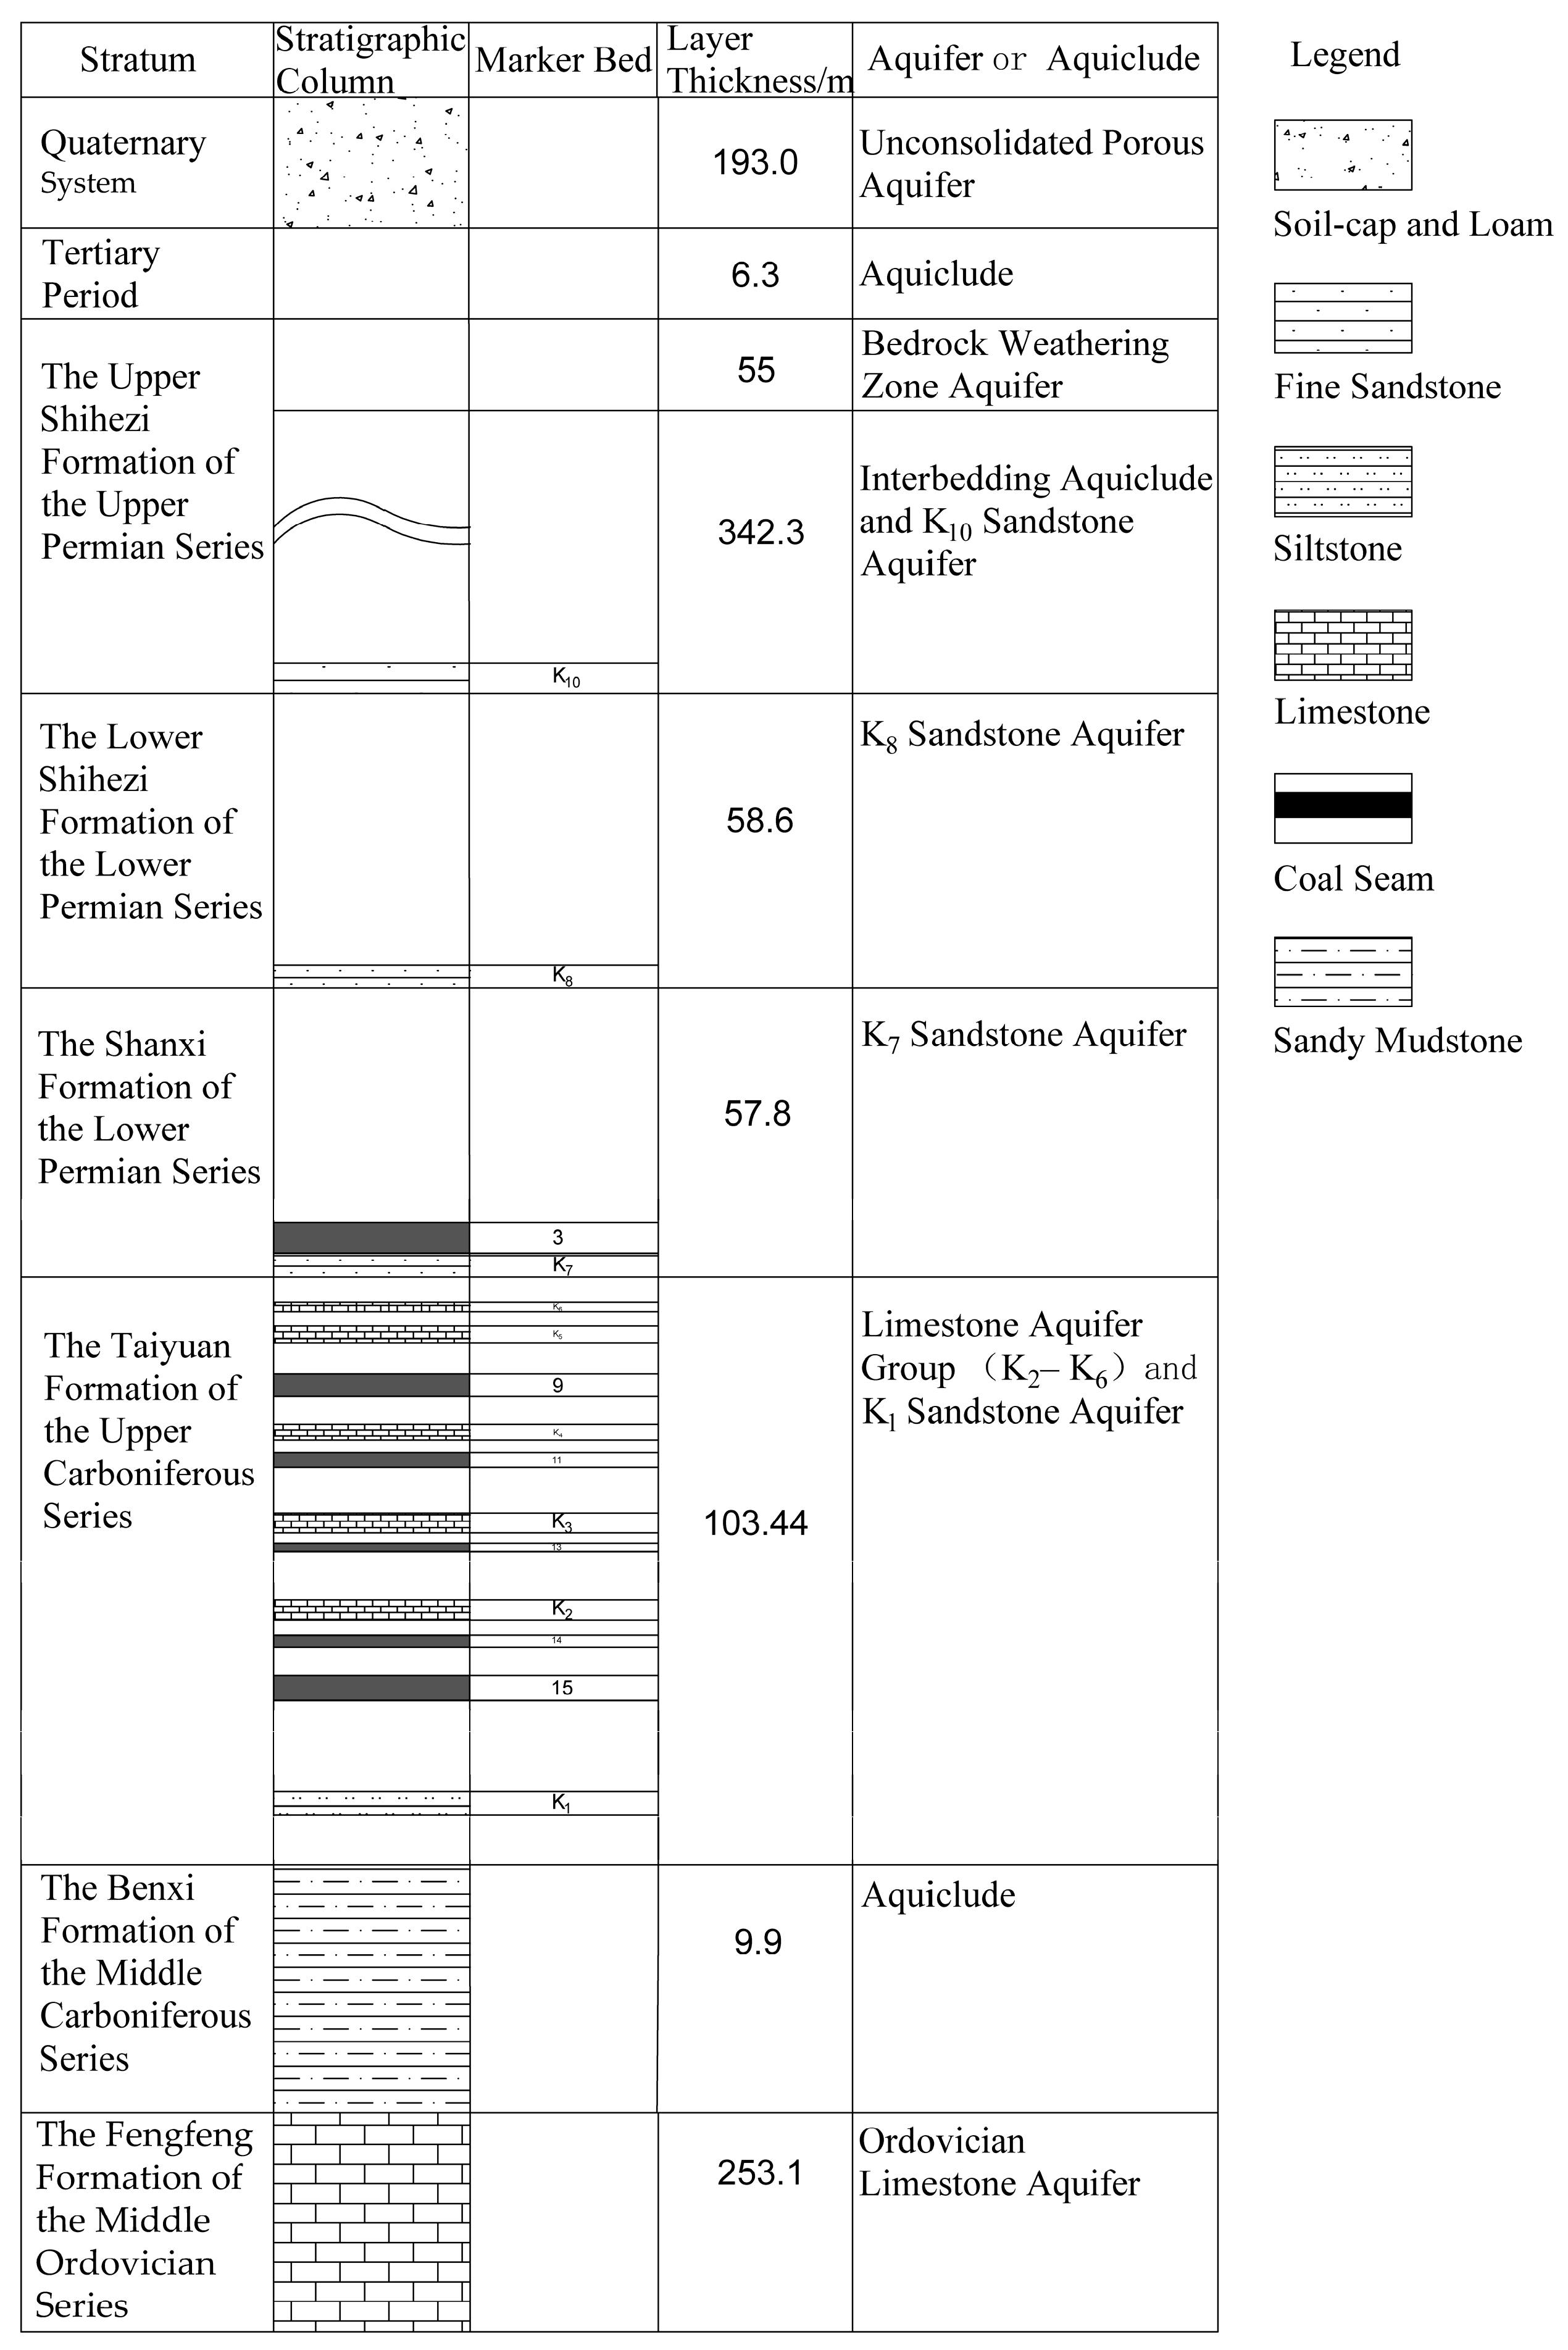
2.2. Hydrogeological Characteristics of the Mining Area
3. Methods
3.1. Acquisition of Hydrogeochemical Characteristics of Aquifers and Rock Sample Information
3.2. Preliminary Analysis of Water Quality Anomalies
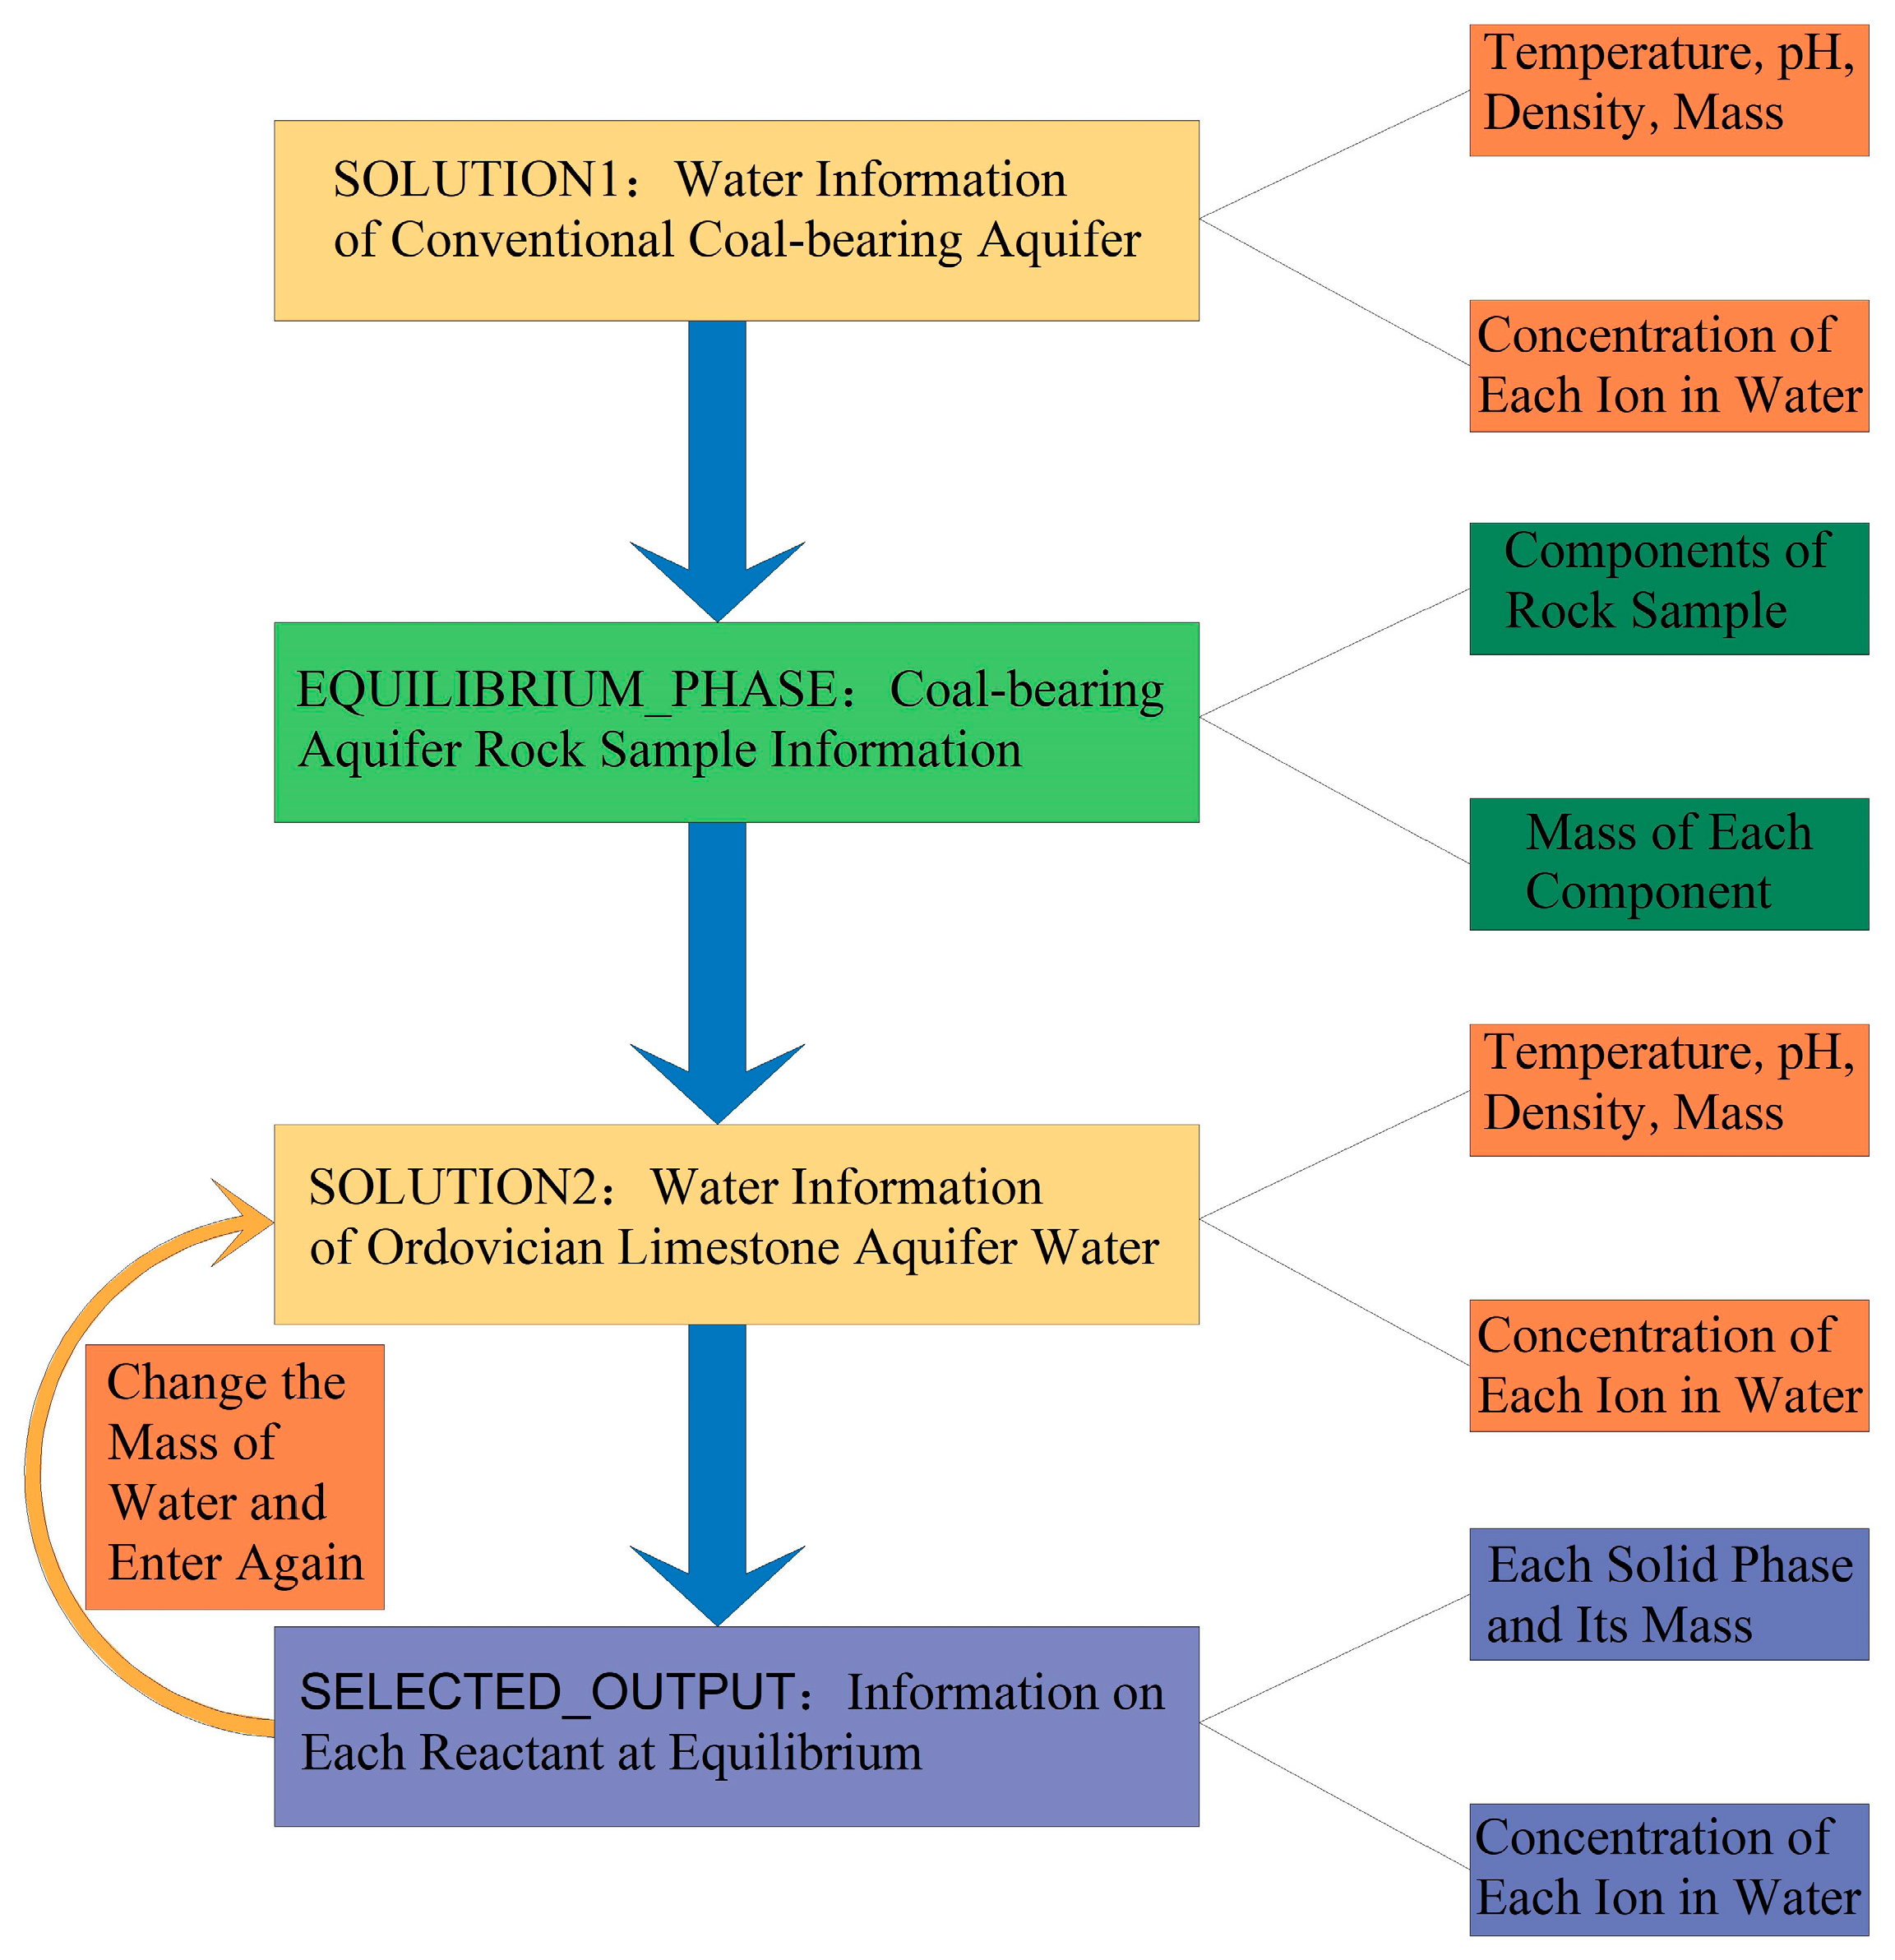
3.3. Water Quality Evolutionary Simulation Experiment
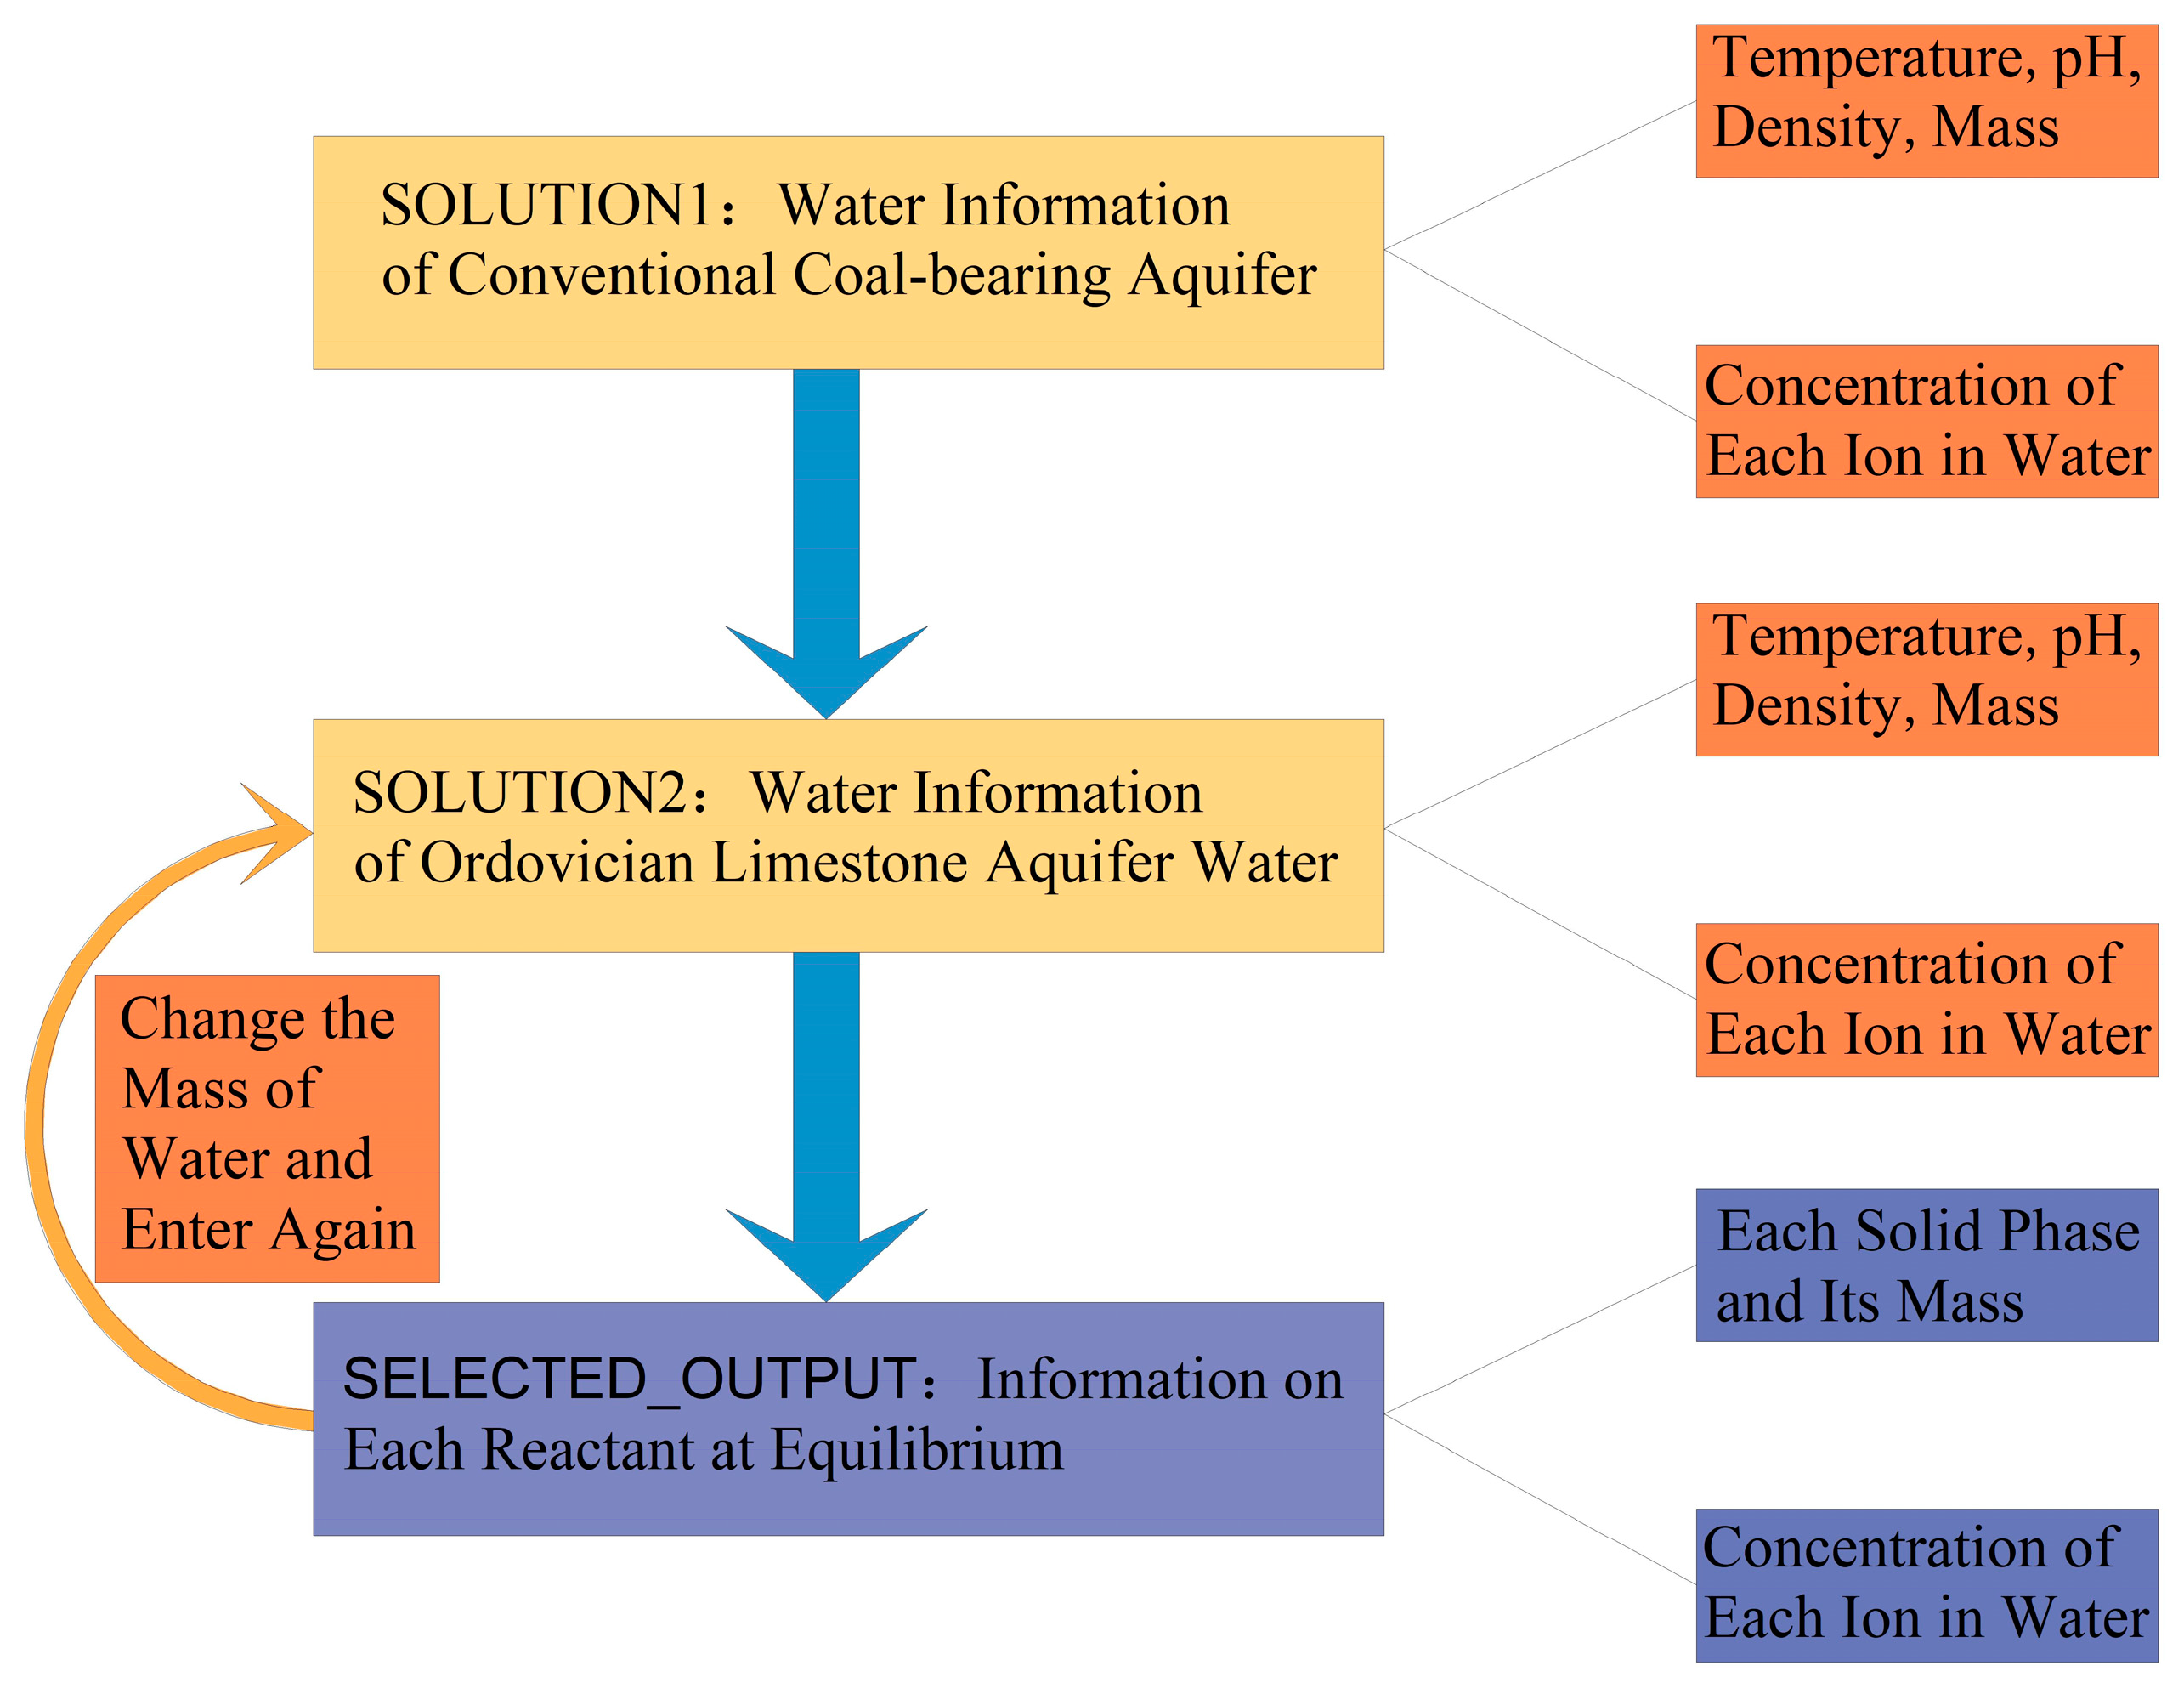
3.4. Water Quality Mixing Simulation Experiment
4. Result
4.1. Water Quality Information
4.2. Coal-Bearing Aquifer Rock Sample Information
4.3. The Data from Water Quality Evolutionary Simulation Experiment and Mixing Simulation Experiment
- (1)
- The similarities between the two sets of experiments:
- (2)
- The differences between the two sets of experiments:
5. Discussion
5.1. The Differences in Hydrochemical Reactions between the Evolutionary Simulation Experiment and the Mixing Simulation Experiment
- (1)
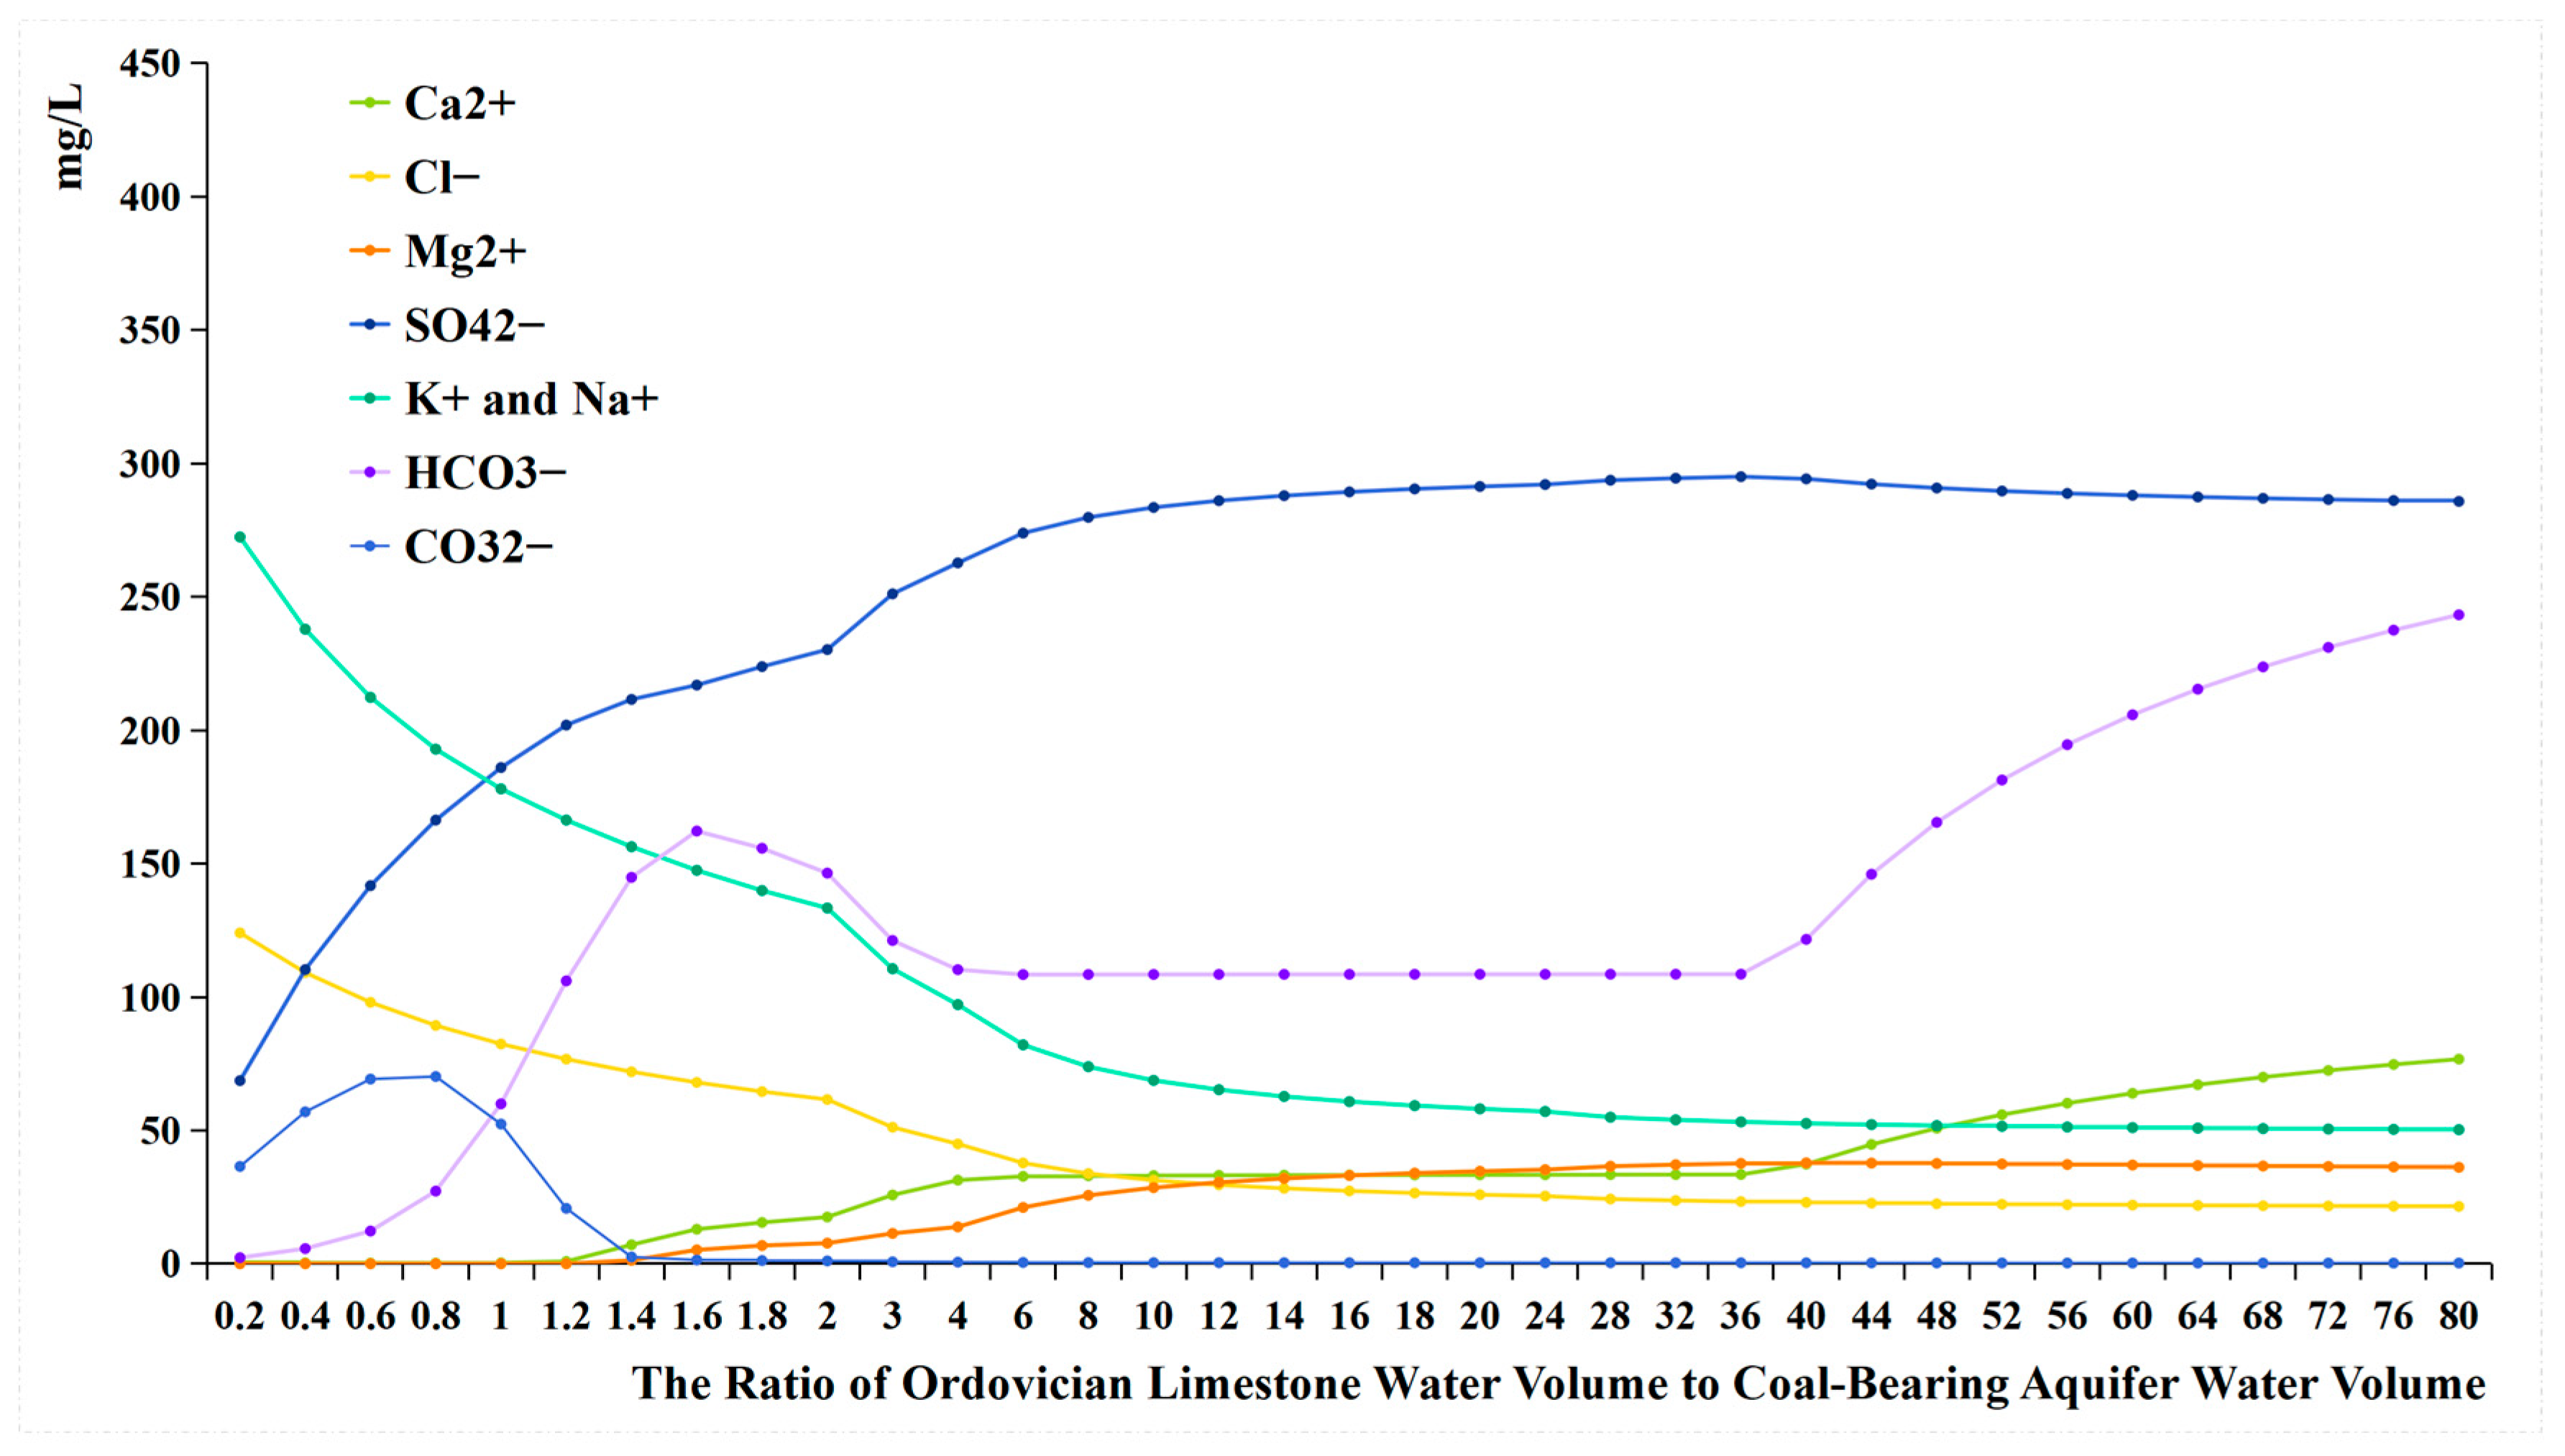
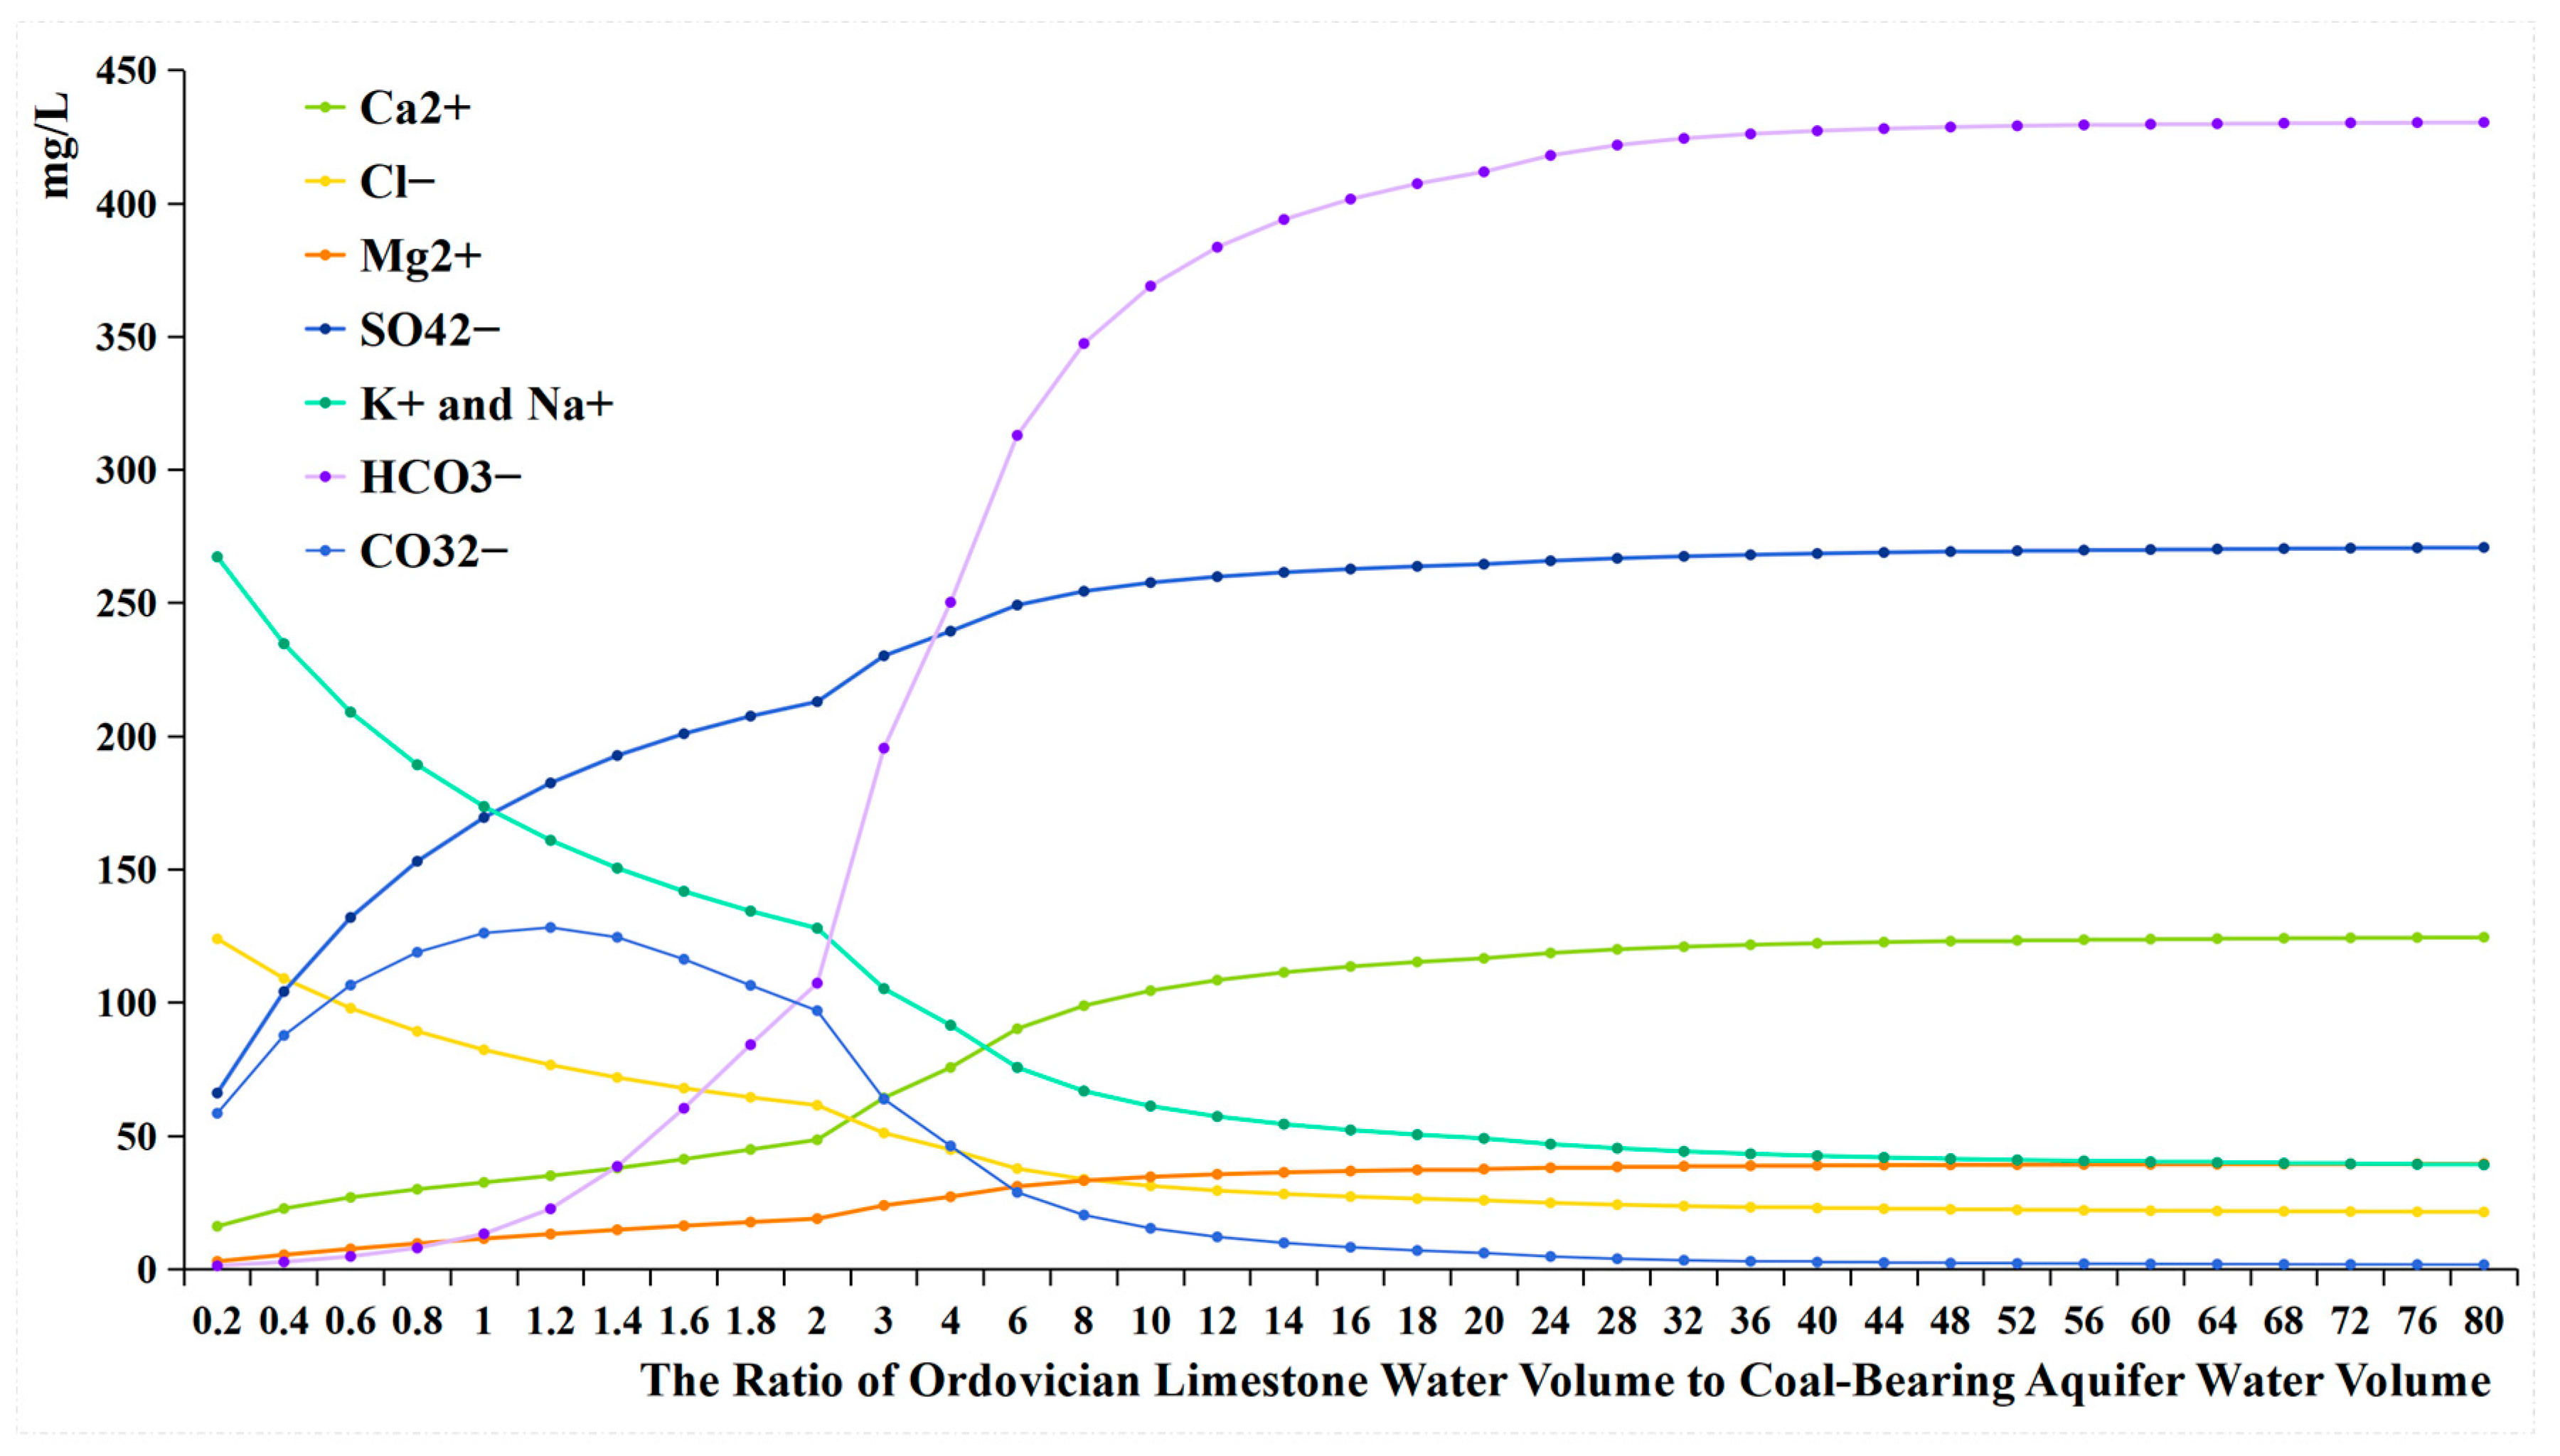
- Comparing the ion concentration graphs of the evolutionary simulation experiment and the mixing simulation experiment reveals that, initially, when Ordovician limestone water is introduced, the pH-neutral Ordovician limestone water supplements the alkaline coal-bearing aquifer water. As a result of pH influence, the concentration of HCO3− is initially low, with a large amount of HCO3− converting to CO32−, leading to the precipitation of oversaturated CO32− with Ca2+ to form calcite. Therefore, in both graphs, the early introduction of Ordovician limestone water is characterized by high CO32− concentration and low concentrations of HCO3− and Ca2+ (Table 6);
- (2)
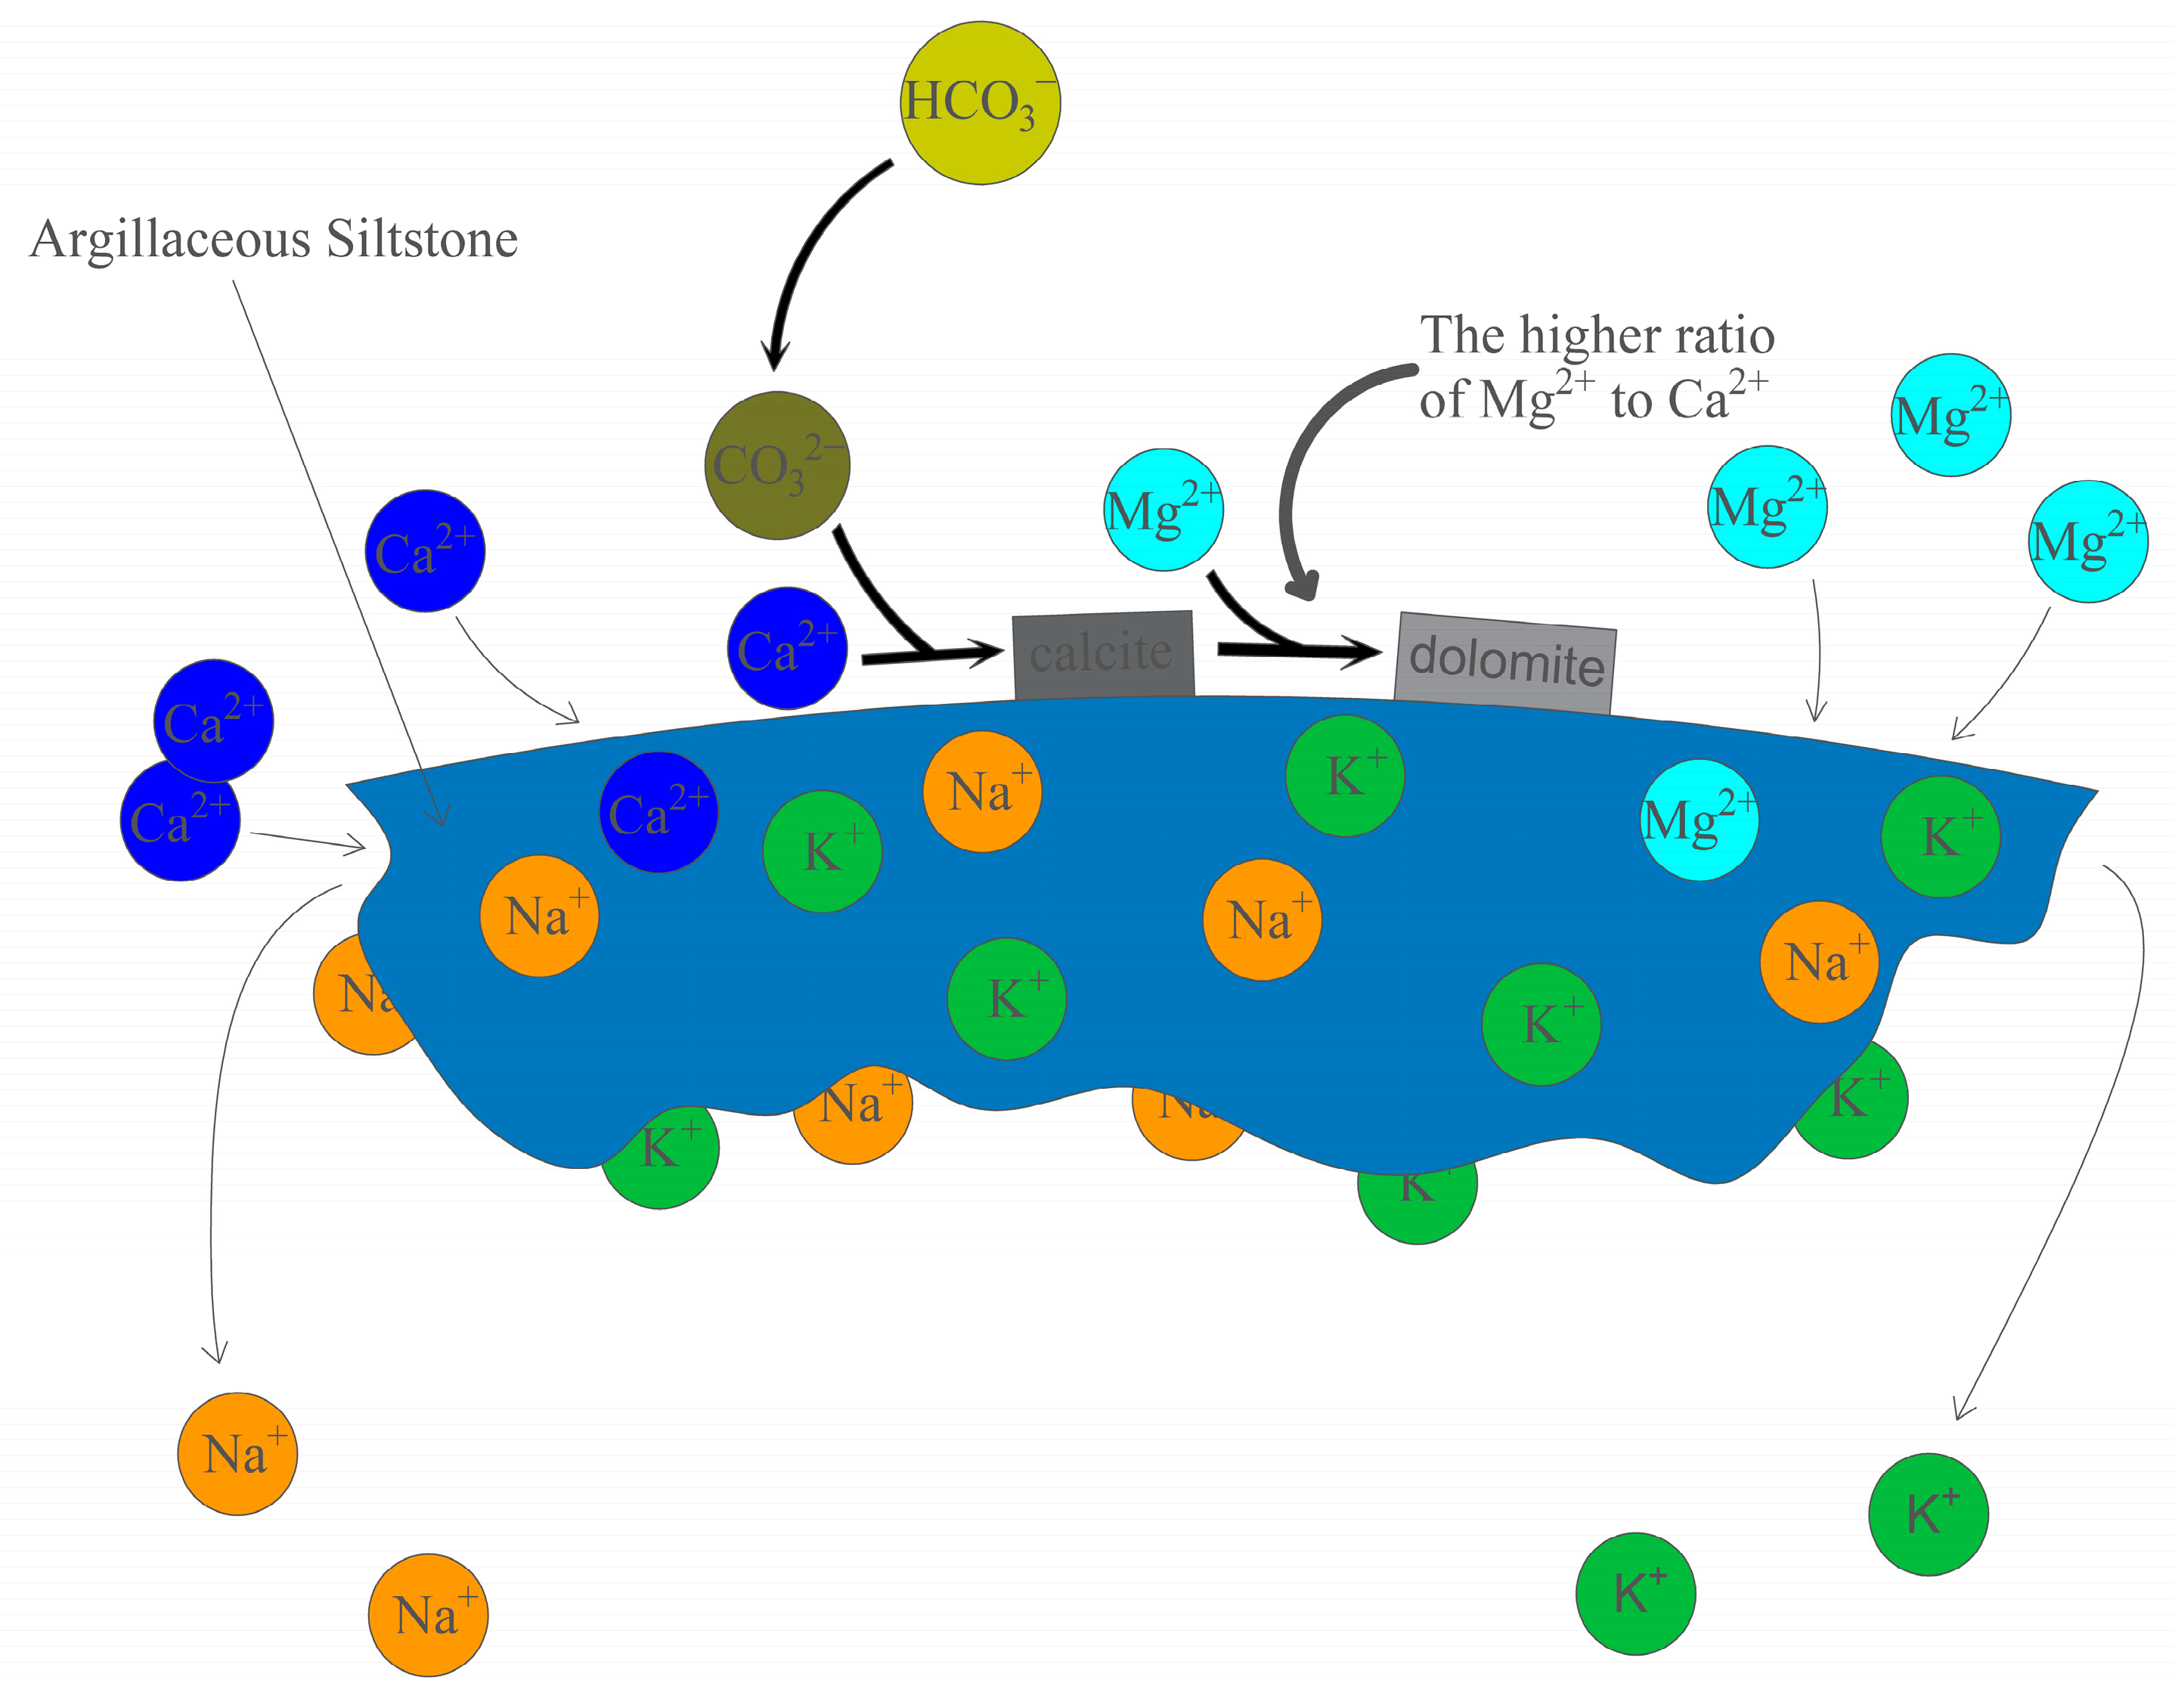
- When the water source ratio is between 0.2 and 0.8, the amount of calcite generated in the two sets of experiments is basically similar. However, in the evolutionary simulation experiment, the concentrations of Ca2+ and Mg2+ are lower compared to those in the mixing simulation experiment (Table 7). This indicates that cation exchange adsorption occurs in the evolution simulation. Different cations have different affinities for adsorption onto the rock surface, in the order of Ca2+ > Mg2+ > K+ > Na+. When Ordovician limestone water with mainly Ca2+ and Mg2+ enters the coal-bearing aquifer, which predominantly adsorbs Na+ and K+, Ca2+ and Mg2+ in the water replace some of the Na+ and K+ adsorbed by the coal-bearing aquifer rocks. The concentrations of K+ and Na+ and the amount of potassium and albite also reflect the occurrence of cation exchange adsorption. During the process of change from a water source ratio of 0.2 to 1.6, the concentrations of K+ and Na+ in the evolutionary simulation experiment are higher than those in the mixing simulation experiment. However, during this process, the amount of potassium feldspar and albite does not decrease, indicating that the higher concentrations of K+ and Na+ are not due to the dissolution of potassium feldspar and albite, but rather due to cation exchange adsorption, where Ca2+ and Mg2+ replace some of the Na+ and K+ adsorbed by the coal-bearing aquifer rocks. In fact, from a water source ratio of 1.6 to 80, the mass of potassium feldspar and albite decreases, as the concentration of K+ and Na+ in the solution decreases, leading to the dissolution of potassium feldspar and albite, supplying K+ and Na+ to the water;
- (3)
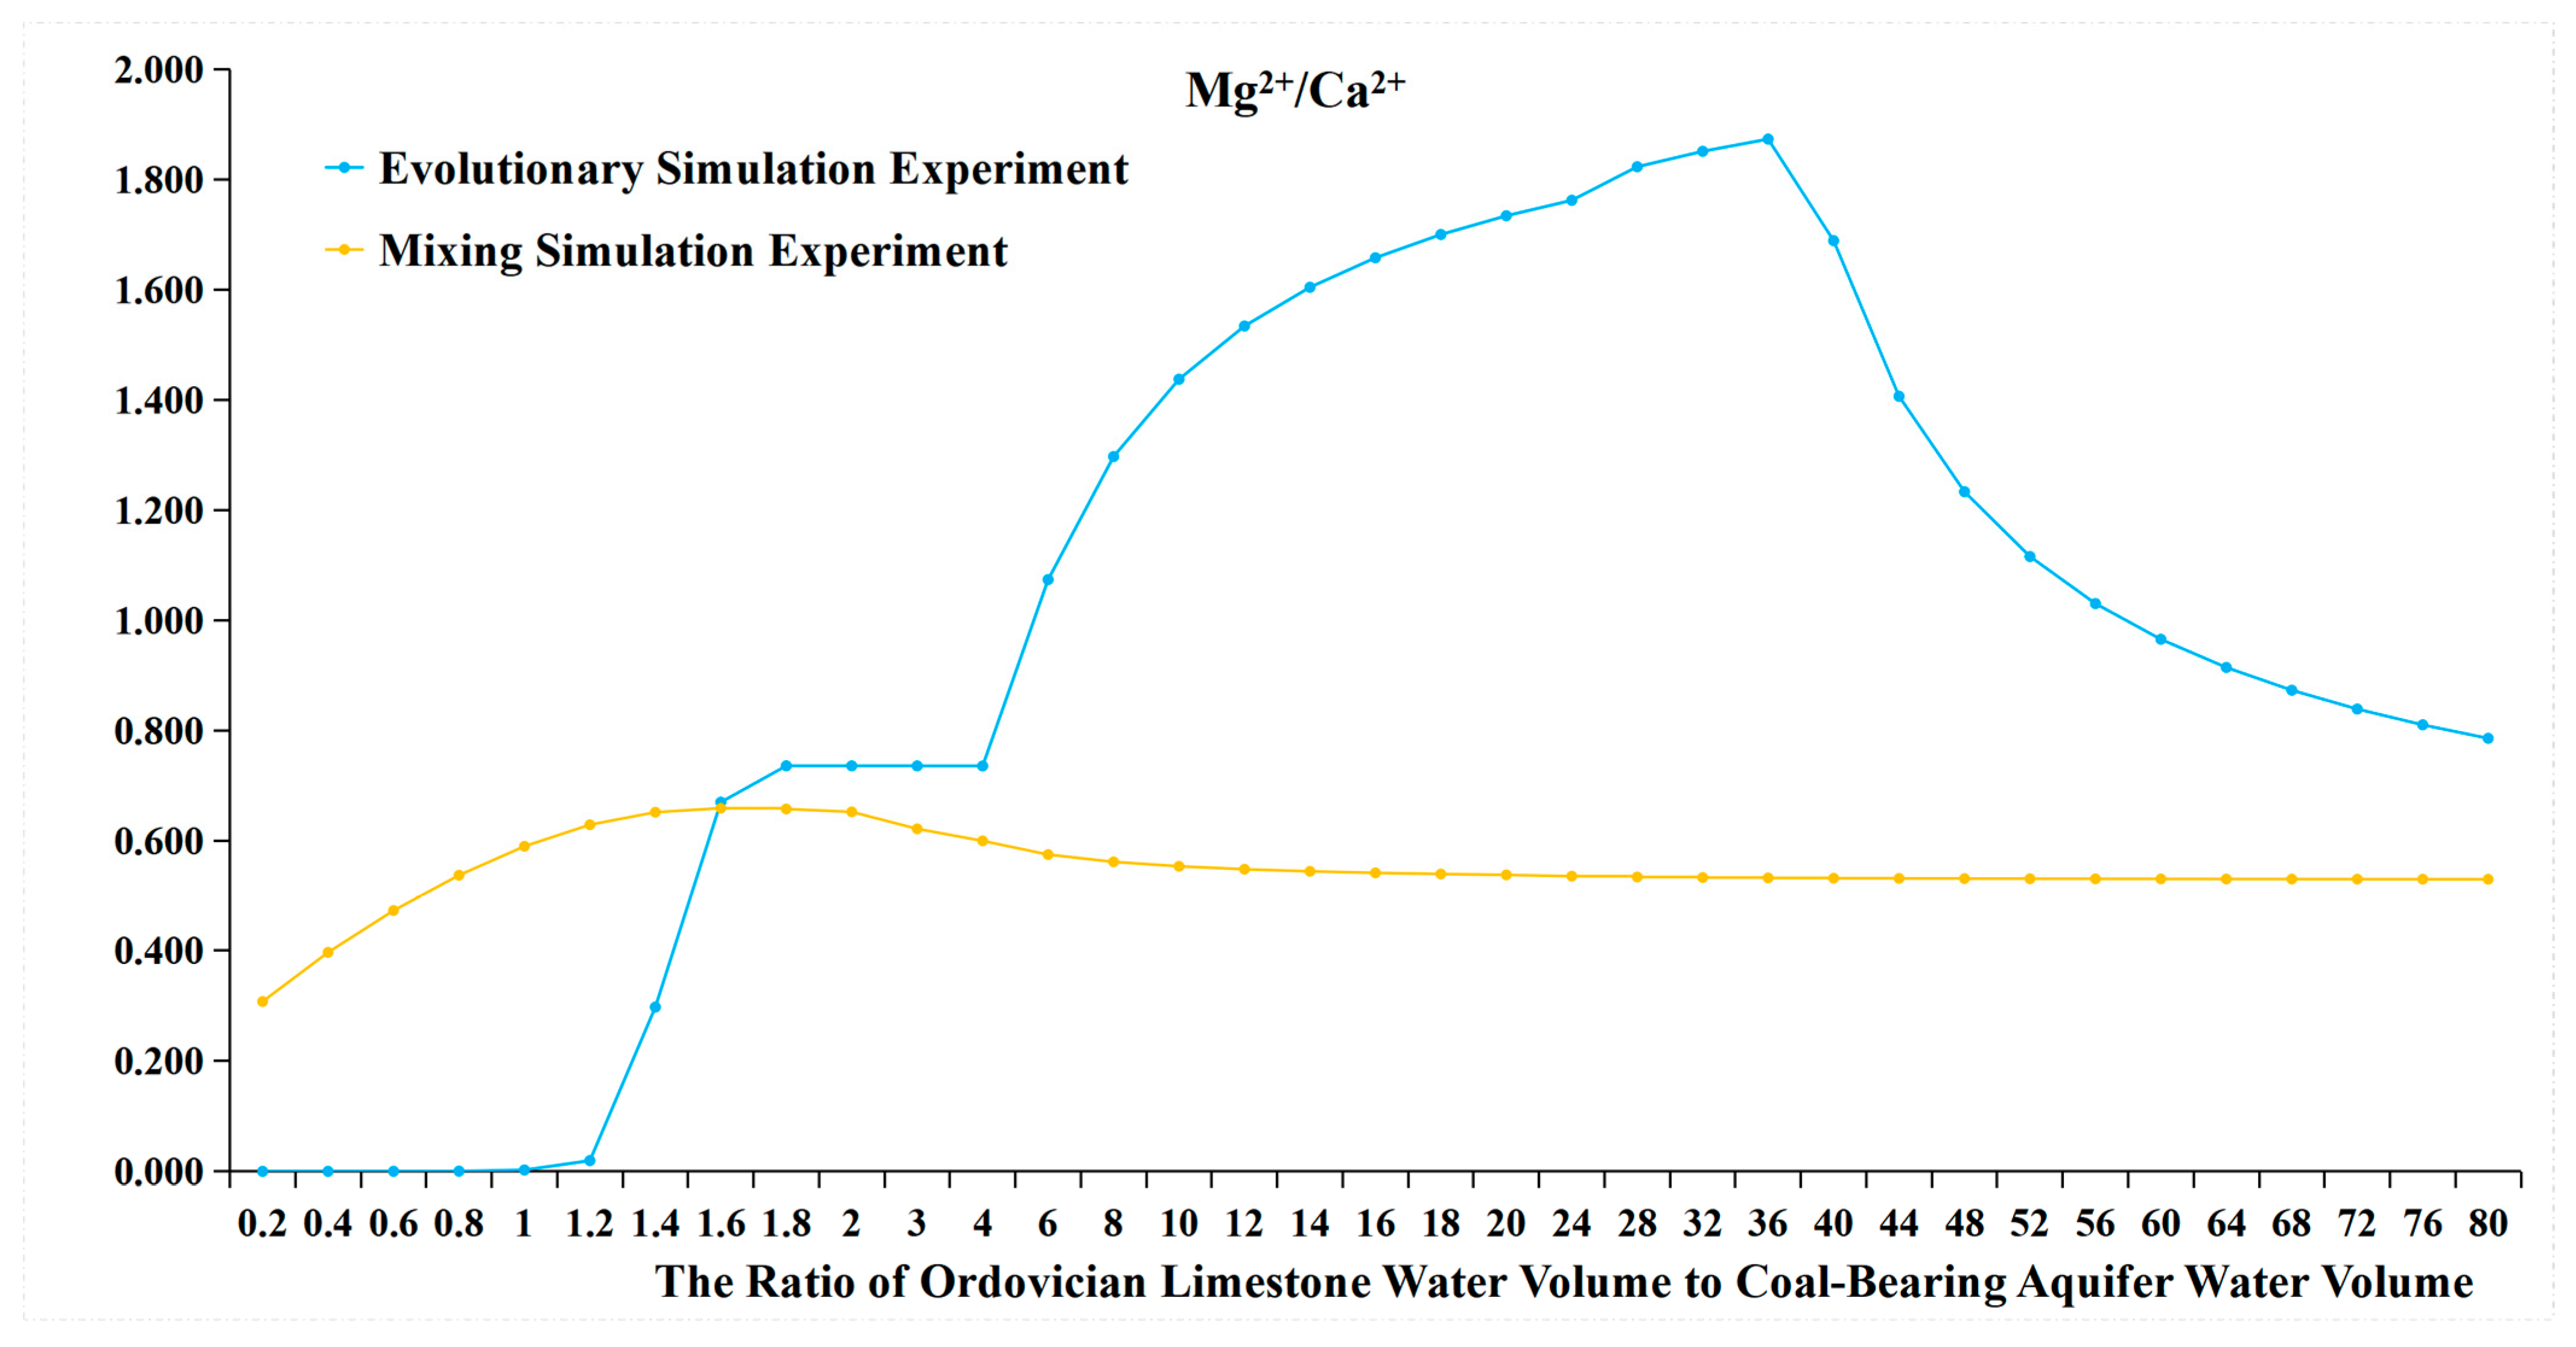
- It can be observed that from a water source ratio of 1.6 to 40, in the evolutionary simulation experiment, calcite decreases while dolomite increases, and the concentration of HCO3− initially increases then decreases, stabilizes for a period, and then increases again. In contrast, in the mixing simulation experiment, the concentration of HCO3− continuously increases, while calcite does not decrease, and no dolomite is generated. It is possible that dolomitization occurs in the evolution simulation, where calcite undergoes transformation into dolomite under certain Mg2+ and Ca2+ ratios. Dolomitization involves several steps, including calcite → magnesian calcite → high-calcium dolomite → low-calcium dolomite → dolomite transformation, and it is influenced by various factors such as fluid dynamic conditions and the Mg2+/Ca2+ ratio [26]. There are four chemical reaction formulas that have been proposed for dolomitization in recent studies [27,28,29,30]. Generally, dolomitization is favored when the Mg2+/Ca2+ ratio is approximately 1.24 to 3.64 [27].
- The ratio of Mg2+ molar concentration to Ca2+ molar concentration in the two sets of experiments is shown in Figure 14 and Table 8. In the evolutionary simulation experiment, as the water source ratio increases from 1.6 to 36, the concentration ratio of Mg2+ to Ca2+ increases. The ratio reaches its maximum between a water source ratio of 24 and 40 and then decreases from a water source ratio of 40 to 80. Comparing this with the composition of rock samples, from a water source ratio of 1.6 onwards, there is a gradual increase in dolomite in the evolution simulation. The maximum increase in dolomite is observed between a water source ratio of 24 and 40, after which the increase diminishes from a water source ratio of 40 to 80. In contrast, in the mixing simulation experiment, the molar ratio of Mg2+ to Ca2+ remains consistently low, indicating the absence of dolomite formation.
- The changes in HCO3− concentration also illustrate the process of dolomitization. In the evolutionary simulation experiment, the HCO3− concentration continuously increases, then gradually decreases, and then stabilizes from a water source ratio of 1.6 to 40. This trend similarly reflects the process of dolomitization, where HCO3− continuously converts to CO32−, complementing the dolomitization process;
- (4)
- Only the precipitation of calcite occurs in the mixing simulation experiment, while the evolutionary simulation experiment involves more complex hydrochemical reactions, such as the precipitation of calcite, cation exchange adsorption, and dolomitization. The mechanism of hydrochemical reactions is illustrated in Figure 15.
5.2. Hydrochemical Reactions and Water Source Proportions at Mine Water Discharge Points
5.3. Analysis of Different Reasons for the Proportion of Ordovician Limestone Water in Typical Discharge Points
- (1)
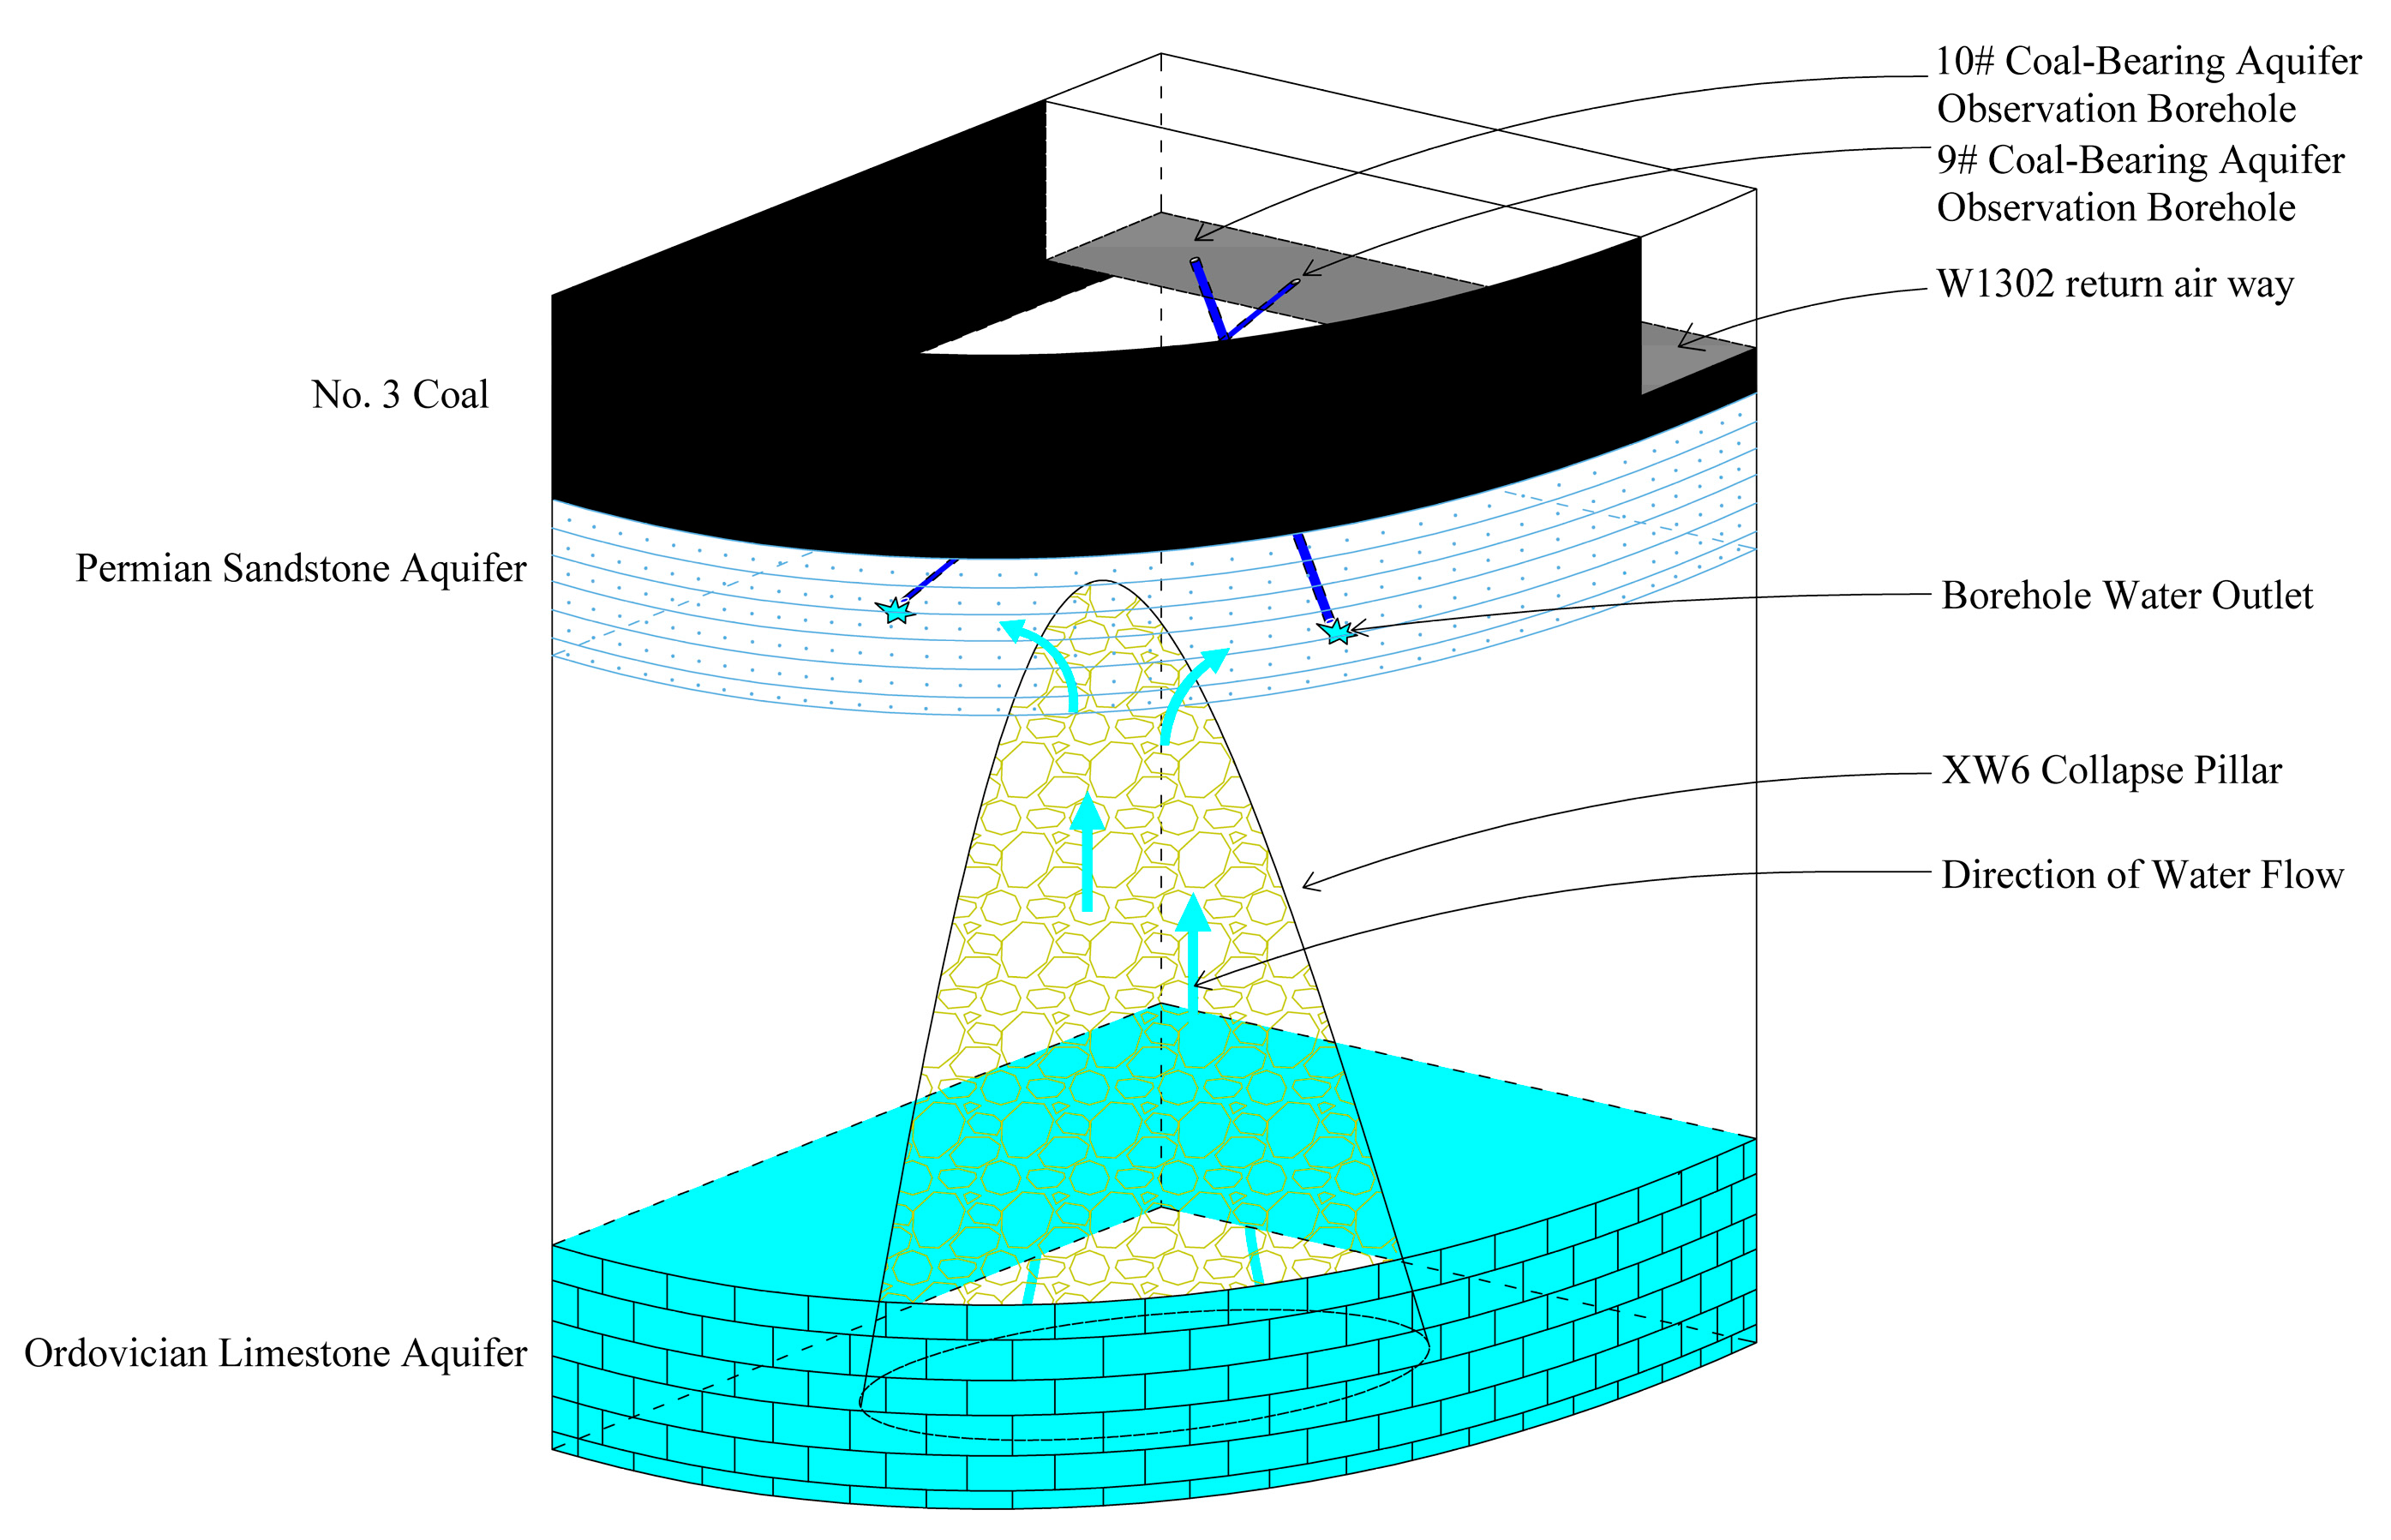
- The Ordovician limestone water supplies the coal-bearing aquifer through water-conducting channels formed by collapse pillars.
- (2)
- The Ordovician limestone water supplies the coal-bearing aquifer through water-conducting channels formed by poorly closed boreholes
6. Conclusions
- (1)
- The chemical reactions occurring in the evolutionary simulation experiment and mixing simulation experiment are different. The evolutionary simulation experiment involves more complex water evolution reactions, including cation exchange adsorption and dolomitization reactions, rather than simple mixing reactions;
- (2)
- At the four water quality anomaly points in the Gaohe Coal Mine, water quality evolutionary reactions that are influenced by Ordovician limestone water recharge have occurred, with the ratio of Ordovician limestone water to coal-bearing aquifer water in the 8# Coal-Bearing Aquifer Observation Borehole ranging from 1:1 to 1.2:1; in the 9# Coal-Bearing Aquifer Observation Borehole, the ratio ranged from 56:1 to 60:1; in the 10# Coal-Bearing Aquifer Observation Borehole, the ratio ranged from 64:1 to 68:1; and in the 11# Coal-Bearing Aquifer Observation Borehole, the ratio ranged from 48:1 to 52:1;
- (3)
- Collapse pillars, serving as water conduits, have larger dimensions compared to poorly sealed boreholes, allowing for greater Ordovician limestone water transmission. Consequently, the Ordovician limestone water proportion is higher in the 9# Coal-Bearing Aquifer Observation Borehole, 10# Coal-Bearing Aquifer Observation Borehole, and 11# Coal-Bearing Aquifer Observation Borehole, while it is lower in the 8# Coal-Bearing Aquifer Observation Borehole;
- (4)
- The investigation of the above-mentioned water quality evolution laws serves three primary purposes: firstly, to analyze the causes of water quality abnormalities and determine whether Ordovician limestone water is the source of water inrush; secondly, to assess the ratio of Ordovician limestone water recharge to the water volume in the coal-bearing aquifer; and thirdly, to evaluate the scale of water-conducting channels. This is of paramount importance for the prevention and control of water hazards in coal mines, particularly those related to Ordovician limestone water hazards caused by water-conducting channels, and for ensuring the safety of coal mine production.
Author Contributions
Funding
Data Availability Statement
Conflicts of Interest
References
- Wu, Q. Progress, problems and prospects of prevention and control technology of mine water and reutilization in China. J. China Coal Soc. 2014, 5, 795–805. [Google Scholar]
- Xu, X.; Tian, K.Y.; Sun, G.Z. Discrimination of Water Inrush Water Source in Mine Based on Bayes Stepwise Method. Coal Technol. 2018, 37, 130–131. [Google Scholar]
- Gao, X.W.; Huang, H. Discrimination of Water Bursting Source Based on Change of Water Quantity and Water Level and Hydrochemical Characteristics. Coal Technol. 2018, 37, 198–200. [Google Scholar]
- Yuan, W.H.; Gui, H.R. The Characteristics of Geothermal Temperature and Its Application in Distinguishing the Source of Water in Ren lou Mine. J. Anhui Univ. Sci. Technol. 2005, 25, 9–11. [Google Scholar]
- Ren, D.J.; Sun, Y.Y.; Li, J.Y. Hydrochemical characteristics and control of water hazard from coal seam roof in Gaojiabao coal mine. Coal Geol. Explor. 2019, 47, 26–311. [Google Scholar]
- Huang, P.H.; Chen, J.S. The chemical features of ground water and FDA model used to distinguish source of water burst in Jiaozuo mine area. Coal Geol. Explor. 2011, 2, 42–46. [Google Scholar]
- Yang, W.F.; Xia, X.H.; Pan, B.L.; Gu, C.S.; Yue, J.G. The fuzzy comprehensive evaluation of water and sand inrush risk during underground mining. J. Intell. Fuzzy Syst. 2016, 30, 2289–2295. [Google Scholar] [CrossRef]
- Yan, P.C.; Shang, S.H.; Zhang, C.Y.; Yin, N.N.; Zhang, X.F.; Yang, G.K.; Zhang, Z.; Sun, Q.S. Research on the Processing of Coal Mine Water Source Data by Optimizing BP Neural Network Algorithm with Sparrow Search Algorithm. IEEE Access 2021, 9, 108718–108730. [Google Scholar] [CrossRef]
- Zhang, H.T.; Xu, G.Q.; Chen, X.Q.; Wei, J.; Yu, S.T.; Yang, T.T. Hydrogeochemical Characteristics and Groundwater Inrush Source Identification for a Multi-aquifer System in a Coal Mine. Acta Geol. Sin.-Engl. Ed. 2019, 93, 1922–1932. [Google Scholar] [CrossRef]
- Zhang, H.; Yao, D.X. The Bayes Recognition Model for Mine Water Inrush Source Based on Multiple Logistic Regression Analysis. Mine Water Environ. 2020, 39, 888–901. [Google Scholar] [CrossRef]
- Wang, T.T.; Jin, D.W.; Liu, J.; Yang, J.; Wang, X.Y.; Zhao, W. Application of dynamic weight-set pair analysis model in mine water inrush discrimination. J. China Coal Soc. 2019, 44, 2840–2850. [Google Scholar]
- Bi, Y.S.; Wu, J.W.; Zhai, X.R.; Wang, G.T.; Shen, S.H.; Qing, X.B. Discriminant analysis of mine water inrush sources with multi-aquifer based on multivariate statistical analysis. Environ. Earth Sci. 2021, 80, 144. [Google Scholar] [CrossRef]
- Jiang, C.L.; Jiang, Z.Q.; Sun, Q. Classification of rocks surrounding tunnel using Fisher discriminant analysis method. J. China Coal Soc. 2012, 10, 1665–1670. [Google Scholar]
- Kang, Y.; Morooka, K.; Nagahashi, H. Texture classification using hierarchical linear discriminant space. IEICE Trans. Inf. Syst. 2005, E88D, 2380–2388. [Google Scholar] [CrossRef]
- Chen, Y.; Zhu, S.Y.; Xiao, S.J. Discussion on controlling factors of hydrogeochemistry and hydraulic connections of groundwater in different mining districts. Nat. Hazards 2019, 99, 689–704. [Google Scholar] [CrossRef]
- Zhang, M.; Chen, L.W.; Yao, D.X.; Zhang, J. Hydrogeochemical characteristics and water-rock interaction of limestone groundwater of Carboniferous Taiyuan Formation in Suxian mining area. J. Hefei Univ. Technol. 2022, 45, 396–405. [Google Scholar]
- Zheng, X.Q.; Wang, K.; Zhang, F.; Chen, J.F.; Li, A.M.; Chen, Y.P. Analysis of the Erosion Law of Karst Groundwater Using Hydrogeochemical Theory in Liulin Spring Area, North China. Water 2018, 10, 674. [Google Scholar] [CrossRef]
- Yin, S.X.; Lian, H.Q.; Liu, D.M.; Yin, H.C. 70 years of investigation on Karst collapse column in North China Coalfield: Cause of origin, mechanism and prevention. Coal Sci. Technol. 2019, 47, 1–29. [Google Scholar]
- Zhang, T.; Sun, L.Y.; Yang, Y.; TU, S.; Wang, J.F. A method for identifying karst collapse columns based on an improved residual network. Coal Geol. Explor. 2023, 51, 171–179. [Google Scholar]
- Cao, Z.Z.; Ren, Y.L.; Wang, Q.T.; Yao, B.H.; Zhang, X.C. Evolution Mechanism of Water-Conducting Channel of Collapse Column in Karst Mining Area of Southwest China. Geofluids 2021, 2021, 1–8. [Google Scholar] [CrossRef]
- Phurst, D.L.; Appelo, C.A.J. User’s Guide to PHREEQC (Version 2): A Computer Program for Speciation, Batch-Reaction, One-Dimensional Transport, and Inverse Geochemical Calculations. Available online: https://doi.org/10.3133/wri994259 (accessed on 28 August 2024).
- Charlton, S.R.; Parkhurst, D.L. Modules based on the geochemical model PHREEQC for use in scripting and programming languages. Comput. Geosci. 2011, 37, 1653–1663. [Google Scholar] [CrossRef]
- Holmes, N.; Tyrer, M.; West, R.; Lowe, A.; Kelliher, D. Using PHREEQC to model cement hydration. Constr. Build. Mater. 2022, 319, 126129. [Google Scholar] [CrossRef]
- Elakneswaran, Y.; Owaki, E.; Miyahara, S.; Ogino, M.; Maruya, T.; Nawa, T. Hydration study of slag-blended cement based on thermodynamic considerations. Constr. Build. Mater. 2016, 124, 615–625. [Google Scholar] [CrossRef]
- Lu, P.; Zhang, G.R.; Apps, J.; Zhu, C. Comparison of thermodynamic data files for PHREEQC. Earth-Sci. Rev. 2022, 225, 103888. [Google Scholar] [CrossRef]
- Aref, M.A.; Taj, R.J. Hydrochemical characteristics of sabkha brines, evaporite crystallization and microbial activity in Al-Kharrar sabkha and their implication on future infrastructures in Rabigh area. Red Sea Coast. Plain Saudi Arab. 2017, 76, 360. [Google Scholar]
- He, Y.L.; Liu, B.; Qin, S. Study on the Dolomitization and Dolostone Genesis. Acta Sci. Nat. Univ. Pekin. 2010, 6, 53–63. [Google Scholar]
- Wang, Y. Dolomite Problem and Precambrian Enigma. Adv. Earth Sci. 2006, 8, 857–862. [Google Scholar]
- Huang, S.J.; Qing, H.R.; Hu, Z.W.; Zou, M.L.; Feng, W.L.; Wang, C.M.; Gao, X.Y.; Wang, Q.D. Closed-system dolomitization and the significance for petroleum and economic geology:An example from Feixianguan carbonates, Triassic NE Sichuan basin of China. Acta Petrol. Sin. 2007, 23, 2955–2963. [Google Scholar]
- Montes-Hernandez, G.; Findling, N.; Renard, F.; Auzende, A.-L. Precipitation of ordered dolomite via simultaneous dissolution of calcite and magnesite: New experimental insights into an old precipitation enigma. Cryst. Growth Des. 2014, 14, 671–677. [Google Scholar] [CrossRef]
- Wu, Q.; Guo, X.M.; Bian, K.; Du, X.; Xu, K.; Bu, W.Y.; Zeng, Y.F. Carrying out general survey of the water disaster-causing factors to prevent the occurrence of coal mine water disasters. China Coal 2023, 49, 3–15. [Google Scholar]


| Aquifers | Specific Yield (L/s·m) | Hydraulic Conductivity (m/d) | Hydrogeochemical Type (Schaefer Classification) |
|---|---|---|---|
| Unconsolidated layer porous aquifer group | 0.102–0.061 | 0.446–0.498 | HCO3·Cl—Ca·K + Na·Mg |
| Bedrock weathering zone fractured aquifer | 0.024–0.227 | 0.076–0.478 | HCO3·SO4—K + Na, HCO3·Cl—K + Na·Ca |
| Sandstone fractured aquifer of the Lower Shihezi Formation of the Lower Permian Series | 9.8 × 10⁻⁵–0.008 | 4.82 × 10⁻⁴–0.074 | HCO3·Cl—K + Na |
| Sandstone fractured aquifer of the Shanxi Formation of the Lower Permian Series | 9.8 × 10⁻⁵–0.008 | 4.82 × 10⁻⁴–0.074 | HCO3·Cl—K + Na |
| Aquifer in clastic rocks with intercalated carbonate rocks of the Taiyuan Formation of the Upper Carboniferous Series | 0.000244–0.001 | 0.00107–0.004 | HCO3·Cl—Na |
| Middle series of Ordovician Fengfeng Formation limestone karst fractured aquifer | 0.1098–2.142 | 0.3362–15.718 | SO4·HCO3—Ca·Mg |
| Number | Collection Point | Analysis Time |
|---|---|---|
| 1# Coal-Bearing Aquifer Observation Borehole | West II Panel Air Inlet Tunnel | 10 February 2023 |
| 2# Coal-Bearing Aquifer Observation Borehole | W3305 Air Inlet Tunnel | 3 February 2023 |
| 3# Coal-Bearing Aquifer Observation Borehole | W2307 Transportation Tunnel | 16 February 2023 |
| 4# Coal-Bearing Aquifer Observation Borehole | W3303 Air Inlet Tunnel | 16 June 2023 |
| 5# Coal-Bearing Aquifer Observation Borehole | E2310 Transportation Tunnel | 7 October 2023 |
| 6# Coal-Bearing Aquifer Observation Borehole | South 9# Transportation Tunnel | 25 October 2023 |
| 7# Coal-Bearing Aquifer Observation Borehole | W4302 Return Air Way | 20 February 2023 |
| 8# Coal-Bearing Aquifer Observation Borehole | No. 2507 Borehole | 1 August 2023 |
| 9# Coal-Bearing Aquifer Observation Borehole | W1302 Return Air Way 6–8# Borehole | 7 April 2023 |
| 10# Coal-Bearing Aquifer Observation Borehole | W1302 Return Air Way 5–11# Borehole | 6 April 2023 |
| 11# Coal-Bearing Aquifer Observation Borehole | Dx7 collapse pillar | 8 April 2023 |
| 1# Ordovician Limestone Observation Borehole | 1# Ordovician Limestone Observation Borehole | 10 May 2023 |
| 2# Ordovician Limestone Observation Borehole | 2# Ordovician Limestone Observation Borehole | 6 January 2023 |
| 3# Ordovician Limestone Observation Borehole | 3# Ordovician Limestone Observation Borehole | 2 May 2023 |
| 4# Ordovician Limestone Observation Borehole | 4# Ordovician Limestone Observation Borehole | 16 May 2023 |
| 5# Ordovician Limestone Observation Borehole | 5# Ordovician Limestone Observation Borehole | 2 June 2023 |
| Number | Collection Point | Quantity | Analysis Time |
|---|---|---|---|
| 1# Coal-Bearing Aquifer Rock Sample | E2310 Transportation Tunnel D6 Borehole | 2 | 29 December 2023 |
| 2# Coal-Bearing Aquifer Rock Sample | E2310 Transportation Tunnel D9 Borehole | 2 | 29 December 2023 |
| 3# Coal-Bearing Aquifer Rock Sample | W2306 Air Inlet Tunnel | 2 | 29 December 2023 |
| Number | K+, Na+ (mg/L) | Ca2+ (mg/L) | Mg2+ (mg/L) | Cl− (mg/L) | SO42− (mg/L) | HCO3− (mg/L) | CO32− (mg/L) | pH | TDS (mg/L) | Temperature (°C) |
|---|---|---|---|---|---|---|---|---|---|---|
| 1# Coal-Bearing Aquifer Observation Borehole | 256.57 | 1.66 | 1.51 | 199.01 | 13.95 | 586.6 | 4.85 | 8.24 | 866 | 19 |
| 2# Coal-Bearing Aquifer Observation Borehole | 251.53 | 3.01 | 1.22 | 105.68 | 2.4 | 467.35 | 10.55 | 8.39 | 598 | 18 |
| 3# Coal-Bearing Aquifer Observation Borehole | 392.75 | 1.07 | 0.65 | 155.15 | 22.62 | 708.14 | 18.37 | 8.89 | 936 | 19 |
| 4# Coal-Bearing Aquifer Observation Borehole | 283.92 | 2.44 | 0.49 | 118.16 | 3.9 | 542.43 | 4.85 | 9.03 | 680 | 17 |
| 5# Coal-Bearing Aquifer Observation Borehole | 302.21 | 1.67 | 0.5 | 142.67 | 9.98 | 604.9 | 6.26 | 8.64 | 720 | 17 |
| 6# Coal-Bearing Aquifer Observation Borehole | 348.36 | 2.00 | 1.82 | 121.16 | 9.58 | 642.92 | 15.67 | 9 | 1080 | 19 |
| 7# Coal-Bearing Aquifer Observation Borehole | 236.64 | 3.35 | 1.55 | 141.51 | 17.637 | 511.91 | 7.035 | 8.52 | 823 | 17 |
| 8# Coal-Bearing Aquifer Observation Borehole | 46.08 | 0.49 | 0 | 97 | 200.23 | 84.43 | 0.16 | 7.4 | 538.95 | 16 |
| 9# Coal-Bearing Aquifer Observation Borehole | 177.07 | 61.77 | 30.55 | 22.54 | 288.32 | 404.32 | 0 | 7.62 | 779 | 16 |
| 10# Coal-Bearing Aquifer Observation Borehole | 163.11 | 68.28 | 35.48 | 33.82 | 272.73 | 411.12 | 0 | 7.76 | 776 | 16 |
| 11# Coal-Bearing Aquifer Observation Borehole | 163.17 | 52.37 | 22.68 | 23 | 239.07 | 359.84 | 18.37 | 7.87 | 677 | 17 |
| 1# Ordovician Limestone Observation Borehole | 44.88 | 142.67 | 58.98 | 22.45 | 336.65 | 389.95 | 0.63 | 7.4 | 856 | 18 |
| 2# Ordovician Limestone Observation Borehole | 29.8 | 163.76 | 41.63 | 24.32 | 384.25 | 312.37 | 0.54 | 7.3 | 854 | 18 |
| 3# Ordovician Limestone Observation Borehole | 36.09 | 159.35 | 52.22 | 19.9 | 376.13 | 372.66 | 0 | 7.6 | 813 | 17 |
| 4# Ordovician Limestone Observation Borehole | 34.79 | 152.85 | 47.65 | 18.85 | 371.15 | 404.5 | 0 | 7.8 | 850 | 16 |
| 5# Ordovician Limestone Observation Borehole | 33.06 | 179.13 | 62.11 | 13.35 | 355.16 | 295.65 | 0.21 | 7.7 | 833 | 17 |
| Composition of Rock Samples | Mass Ratio |
|---|---|
| Quartz | 1 |
| Potassium Feldspar | 0.189 |
| Albite | 0.077 |
| Muscovite | 0.104 |
| Calcite | 0.021 |
| Dolomite | 0.010 |
| Water Mass Ratio | Evolutionary Simulation Experiment | Mixing Simulation Experiment |
|---|---|---|
| 0.2 | 16.26 | 45.80 |
| 0.4 | 10.19 | 32.19 |
| 0.6 | 5.74 | 22.36 |
| 0.8 | 2.62 | 15.06 |
| Water Mass Ratio | Ca2+ | Mg2+ | K+ and Na+ |
|---|---|---|---|
| 0.2 | 0.03 | 0.00 | 1.02 |
| 0.4 | 0.02 | 0.00 | 1.01 |
| 0.6 | 0.01 | 0.00 | 1.02 |
| 0.8 | 0.01 | 0.00 | 1.02 |
| 1 | 0.01 | 0.00 | 1.02 |
| 1.2 | 0.02 | 0.00 | 1.03 |
| 1.4 | 0.19 | 0.09 | 1.04 |
| 1.6 | 0.31 | 0.32 | 1.04 |
| Water Mass Ratio | Evolutionary Simulation Experiment | Mixing Simulation Experiment |
|---|---|---|
| 0.2 | 0.000 | 0.308 |
| 0.4 | 0.000 | 0.397 |
| 0.6 | 0.000 | 0.473 |
| 0.8 | 0.000 | 0.537 |
| 1 | 0.002 | 0.589 |
| 1.2 | 0.019 | 0.629 |
| 1.4 | 0.298 | 0.651 |
| 1.6 | 0.669 | 0.659 |
| 1.8 | 0.735 | 0.657 |
| 2 | 0.735 | 0.652 |
| 3 | 0.735 | 0.621 |
| 4 | 0.735 | 0.599 |
| 6 | 1.074 | 0.574 |
| 8 | 1.297 | 0.561 |
| 10 | 1.438 | 0.553 |
| 12 | 1.534 | 0.548 |
| 14 | 1.605 | 0.544 |
| 16 | 1.658 | 0.541 |
| 18 | 1.700 | 0.539 |
| 20 | 1.734 | 0.537 |
| 24 | 1.763 | 0.535 |
| 28 | 1.823 | 0.534 |
| 32 | 1.851 | 0.533 |
| 36 | 1.874 | 0.532 |
| 40 | 1.689 | 0.531 |
| 44 | 1.406 | 0.531 |
| 48 | 1.233 | 0.531 |
| 52 | 1.116 | 0.530 |
| 56 | 1.030 | 0.530 |
| 60 | 0.965 | 0.530 |
| 64 | 0.914 | 0.530 |
| 68 | 0.873 | 0.530 |
| 72 | 0.839 | 0.530 |
| 76 | 0.810 | 0.530 |
| 80 | 0.785 | 0.530 |
Disclaimer/Publisher’s Note: The statements, opinions and data contained in all publications are solely those of the individual author(s) and contributor(s) and not of MDPI and/or the editor(s). MDPI and/or the editor(s) disclaim responsibility for any injury to people or property resulting from any ideas, methods, instructions or products referred to in the content. |
© 2024 by the authors. Licensee MDPI, Basel, Switzerland. This article is an open access article distributed under the terms and conditions of the Creative Commons Attribution (CC BY) license (https://creativecommons.org/licenses/by/4.0/).
Share and Cite
Li, P.; Wei, J.; Xu, J.; Li, F.; Liu, B.; Zheng, Y.; Chai, J. Simulation of Abnormal Evolution and Source Identification of Groundwater Chemistry in Coal-Bearing Aquifers at Gaohe Coal Mine, China. Water 2024, 16, 2506. https://doi.org/10.3390/w16172506
Li P, Wei J, Xu J, Li F, Liu B, Zheng Y, Chai J. Simulation of Abnormal Evolution and Source Identification of Groundwater Chemistry in Coal-Bearing Aquifers at Gaohe Coal Mine, China. Water. 2024; 16(17):2506. https://doi.org/10.3390/w16172506
Chicago/Turabian StyleLi, Pu, Junxian Wei, Jinpeng Xu, Feng Li, Bo Liu, Yinan Zheng, and Jincheng Chai. 2024. "Simulation of Abnormal Evolution and Source Identification of Groundwater Chemistry in Coal-Bearing Aquifers at Gaohe Coal Mine, China" Water 16, no. 17: 2506. https://doi.org/10.3390/w16172506
APA StyleLi, P., Wei, J., Xu, J., Li, F., Liu, B., Zheng, Y., & Chai, J. (2024). Simulation of Abnormal Evolution and Source Identification of Groundwater Chemistry in Coal-Bearing Aquifers at Gaohe Coal Mine, China. Water, 16(17), 2506. https://doi.org/10.3390/w16172506