

Review on the Collaborative Research of Water Resources–Water Environment–Water Ecology in Hulun Lake

 , , ,
, , ,
Abstract
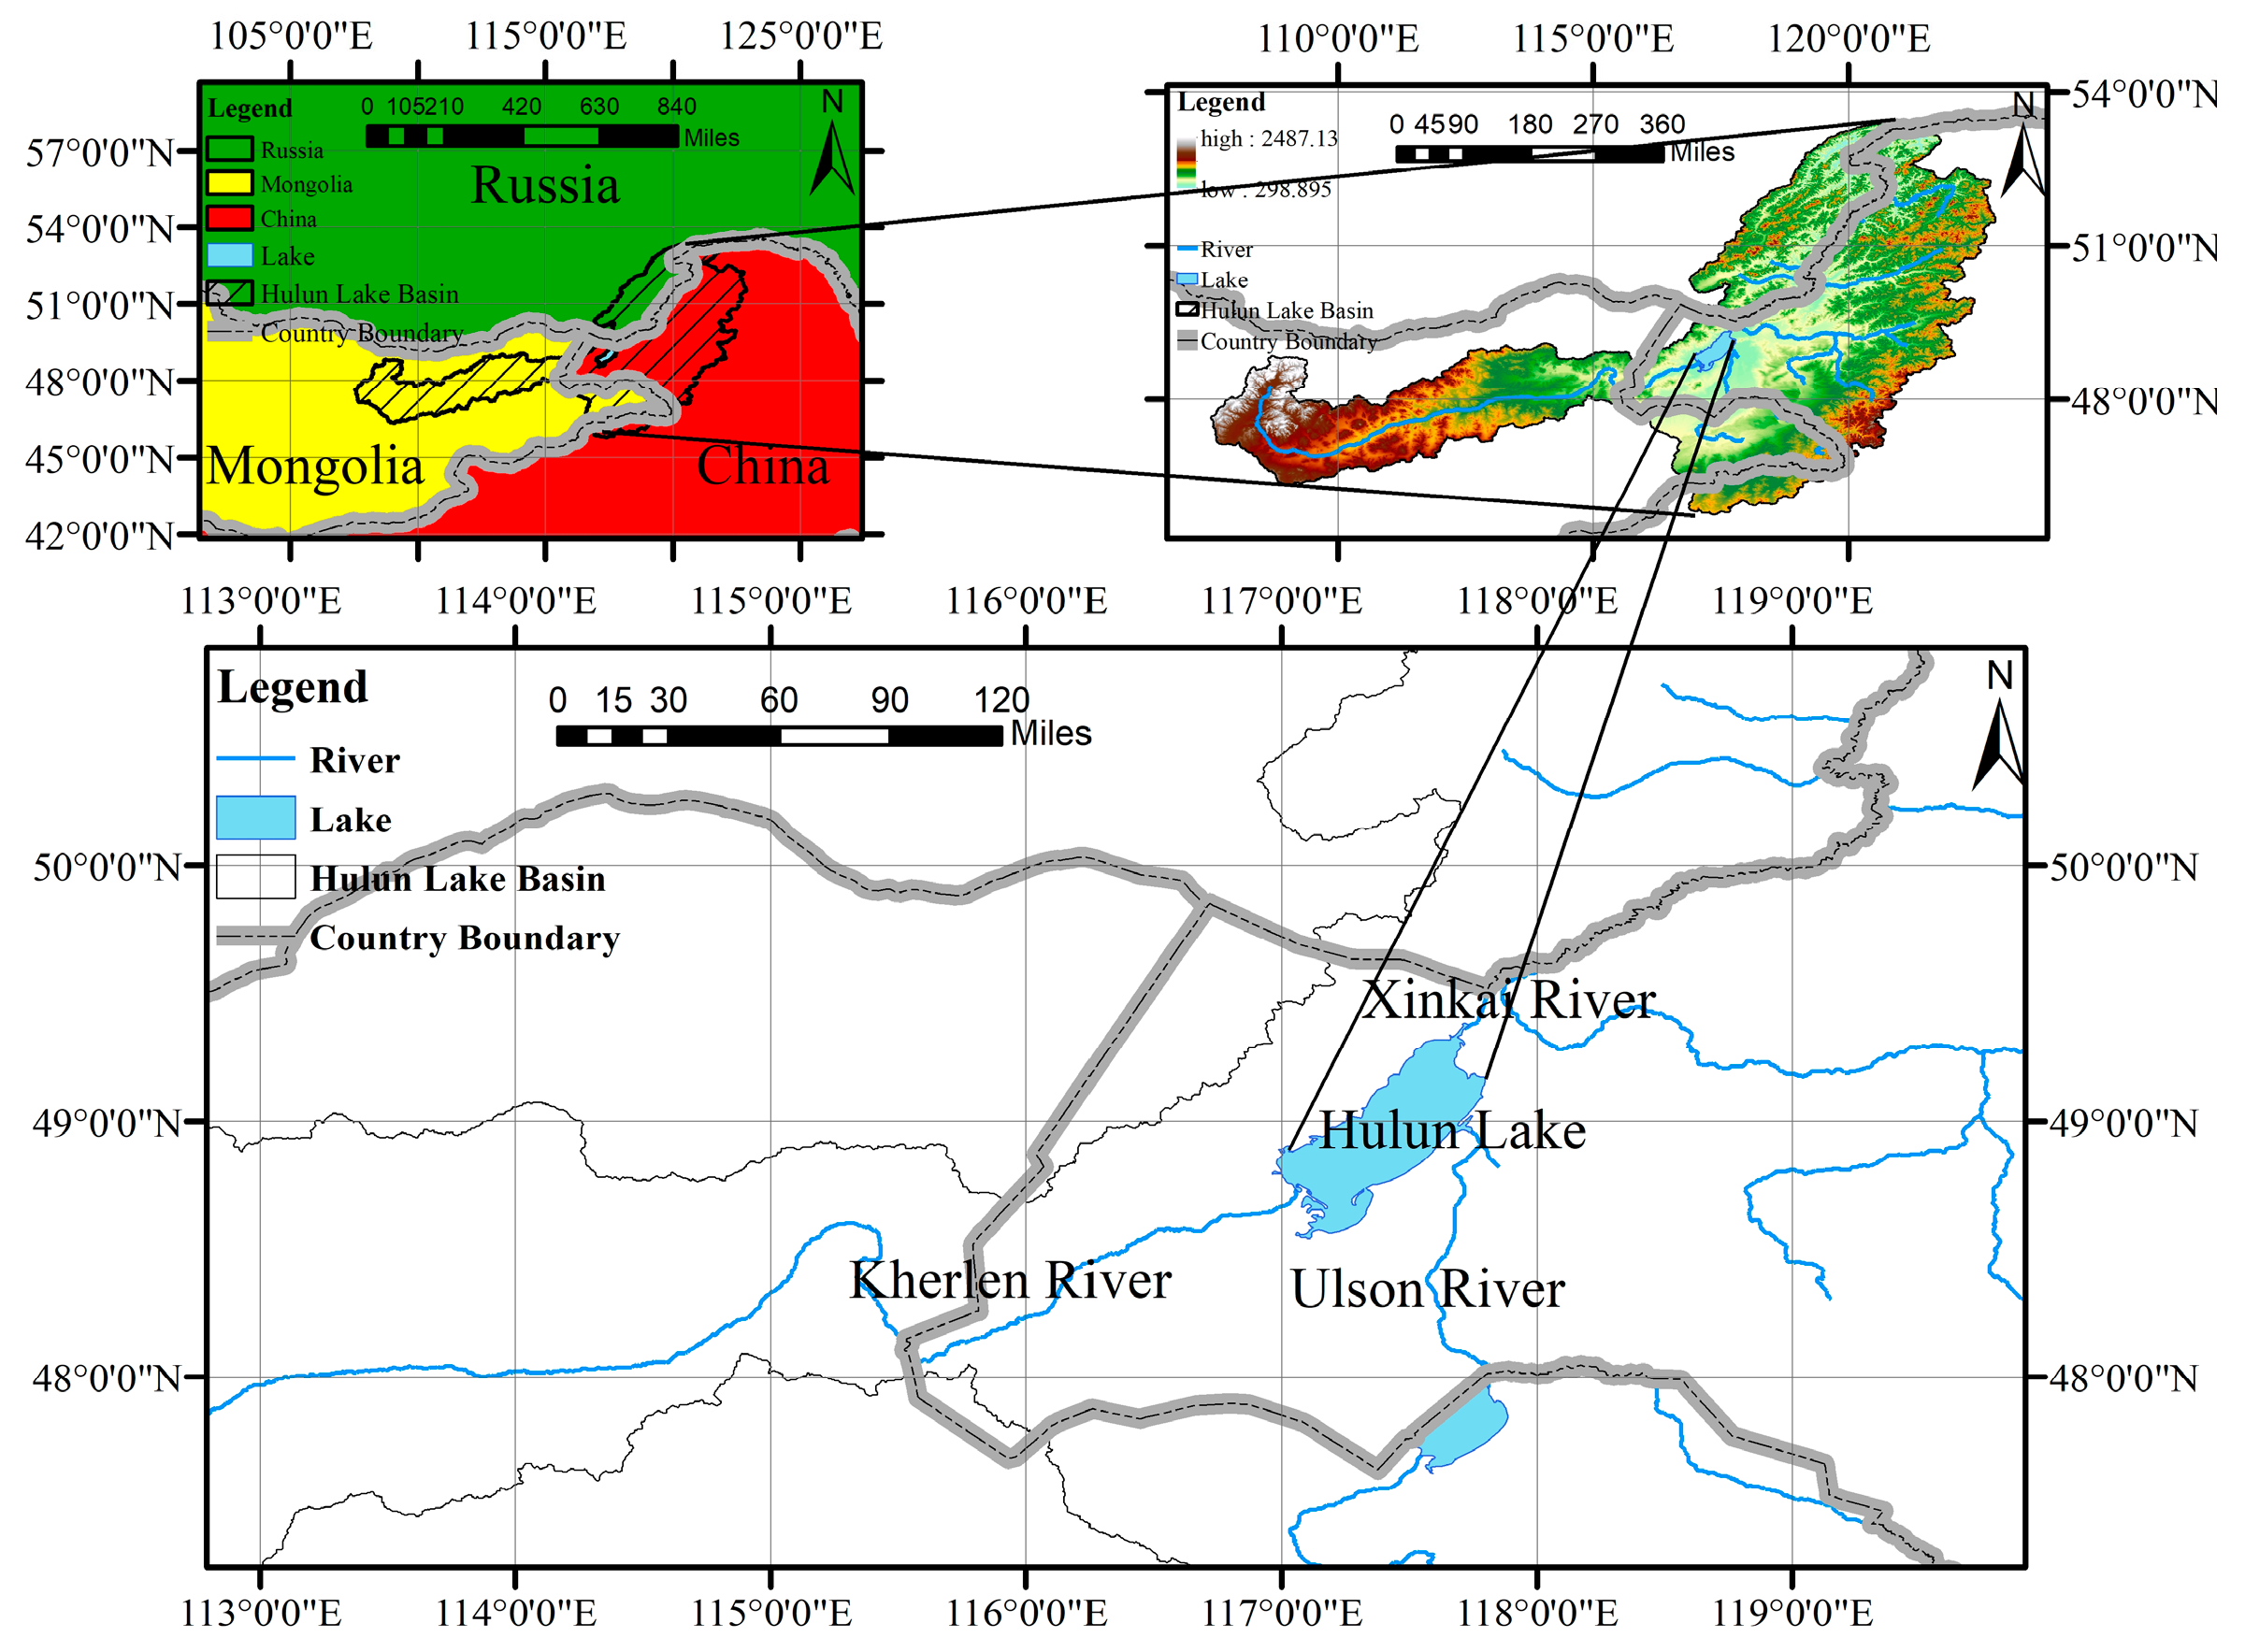
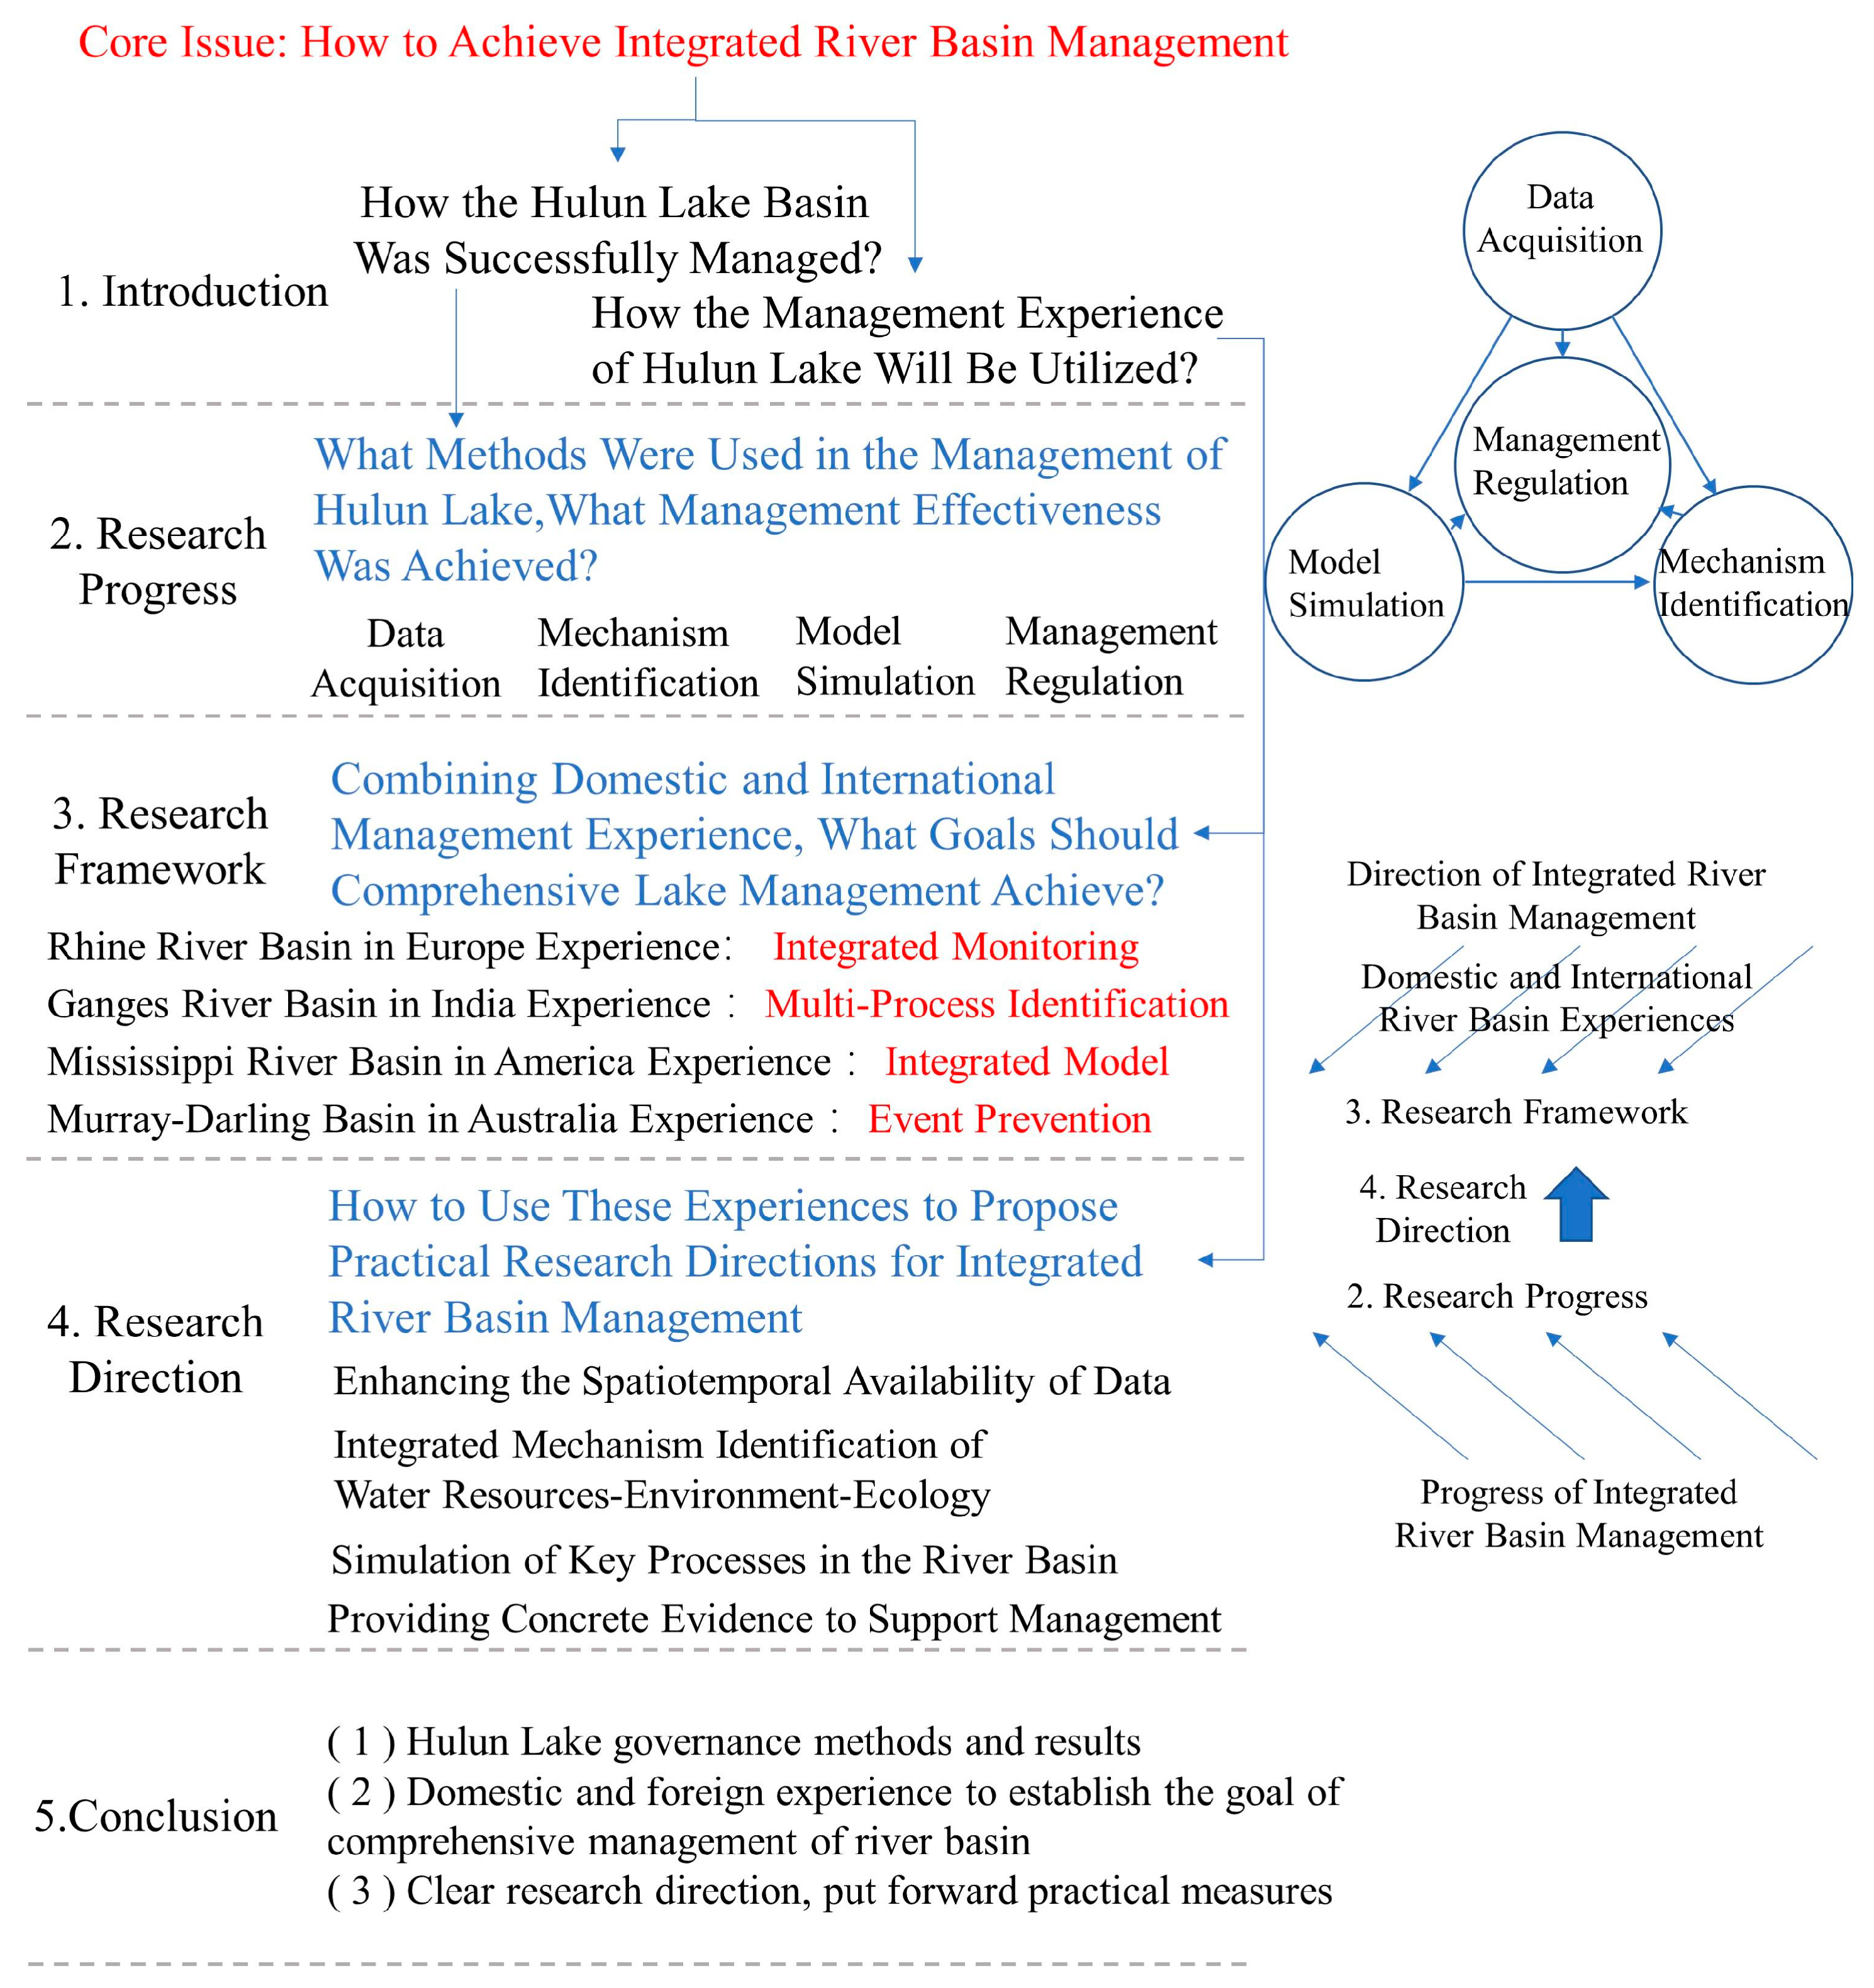
:1. Introduction
2. Research Progress
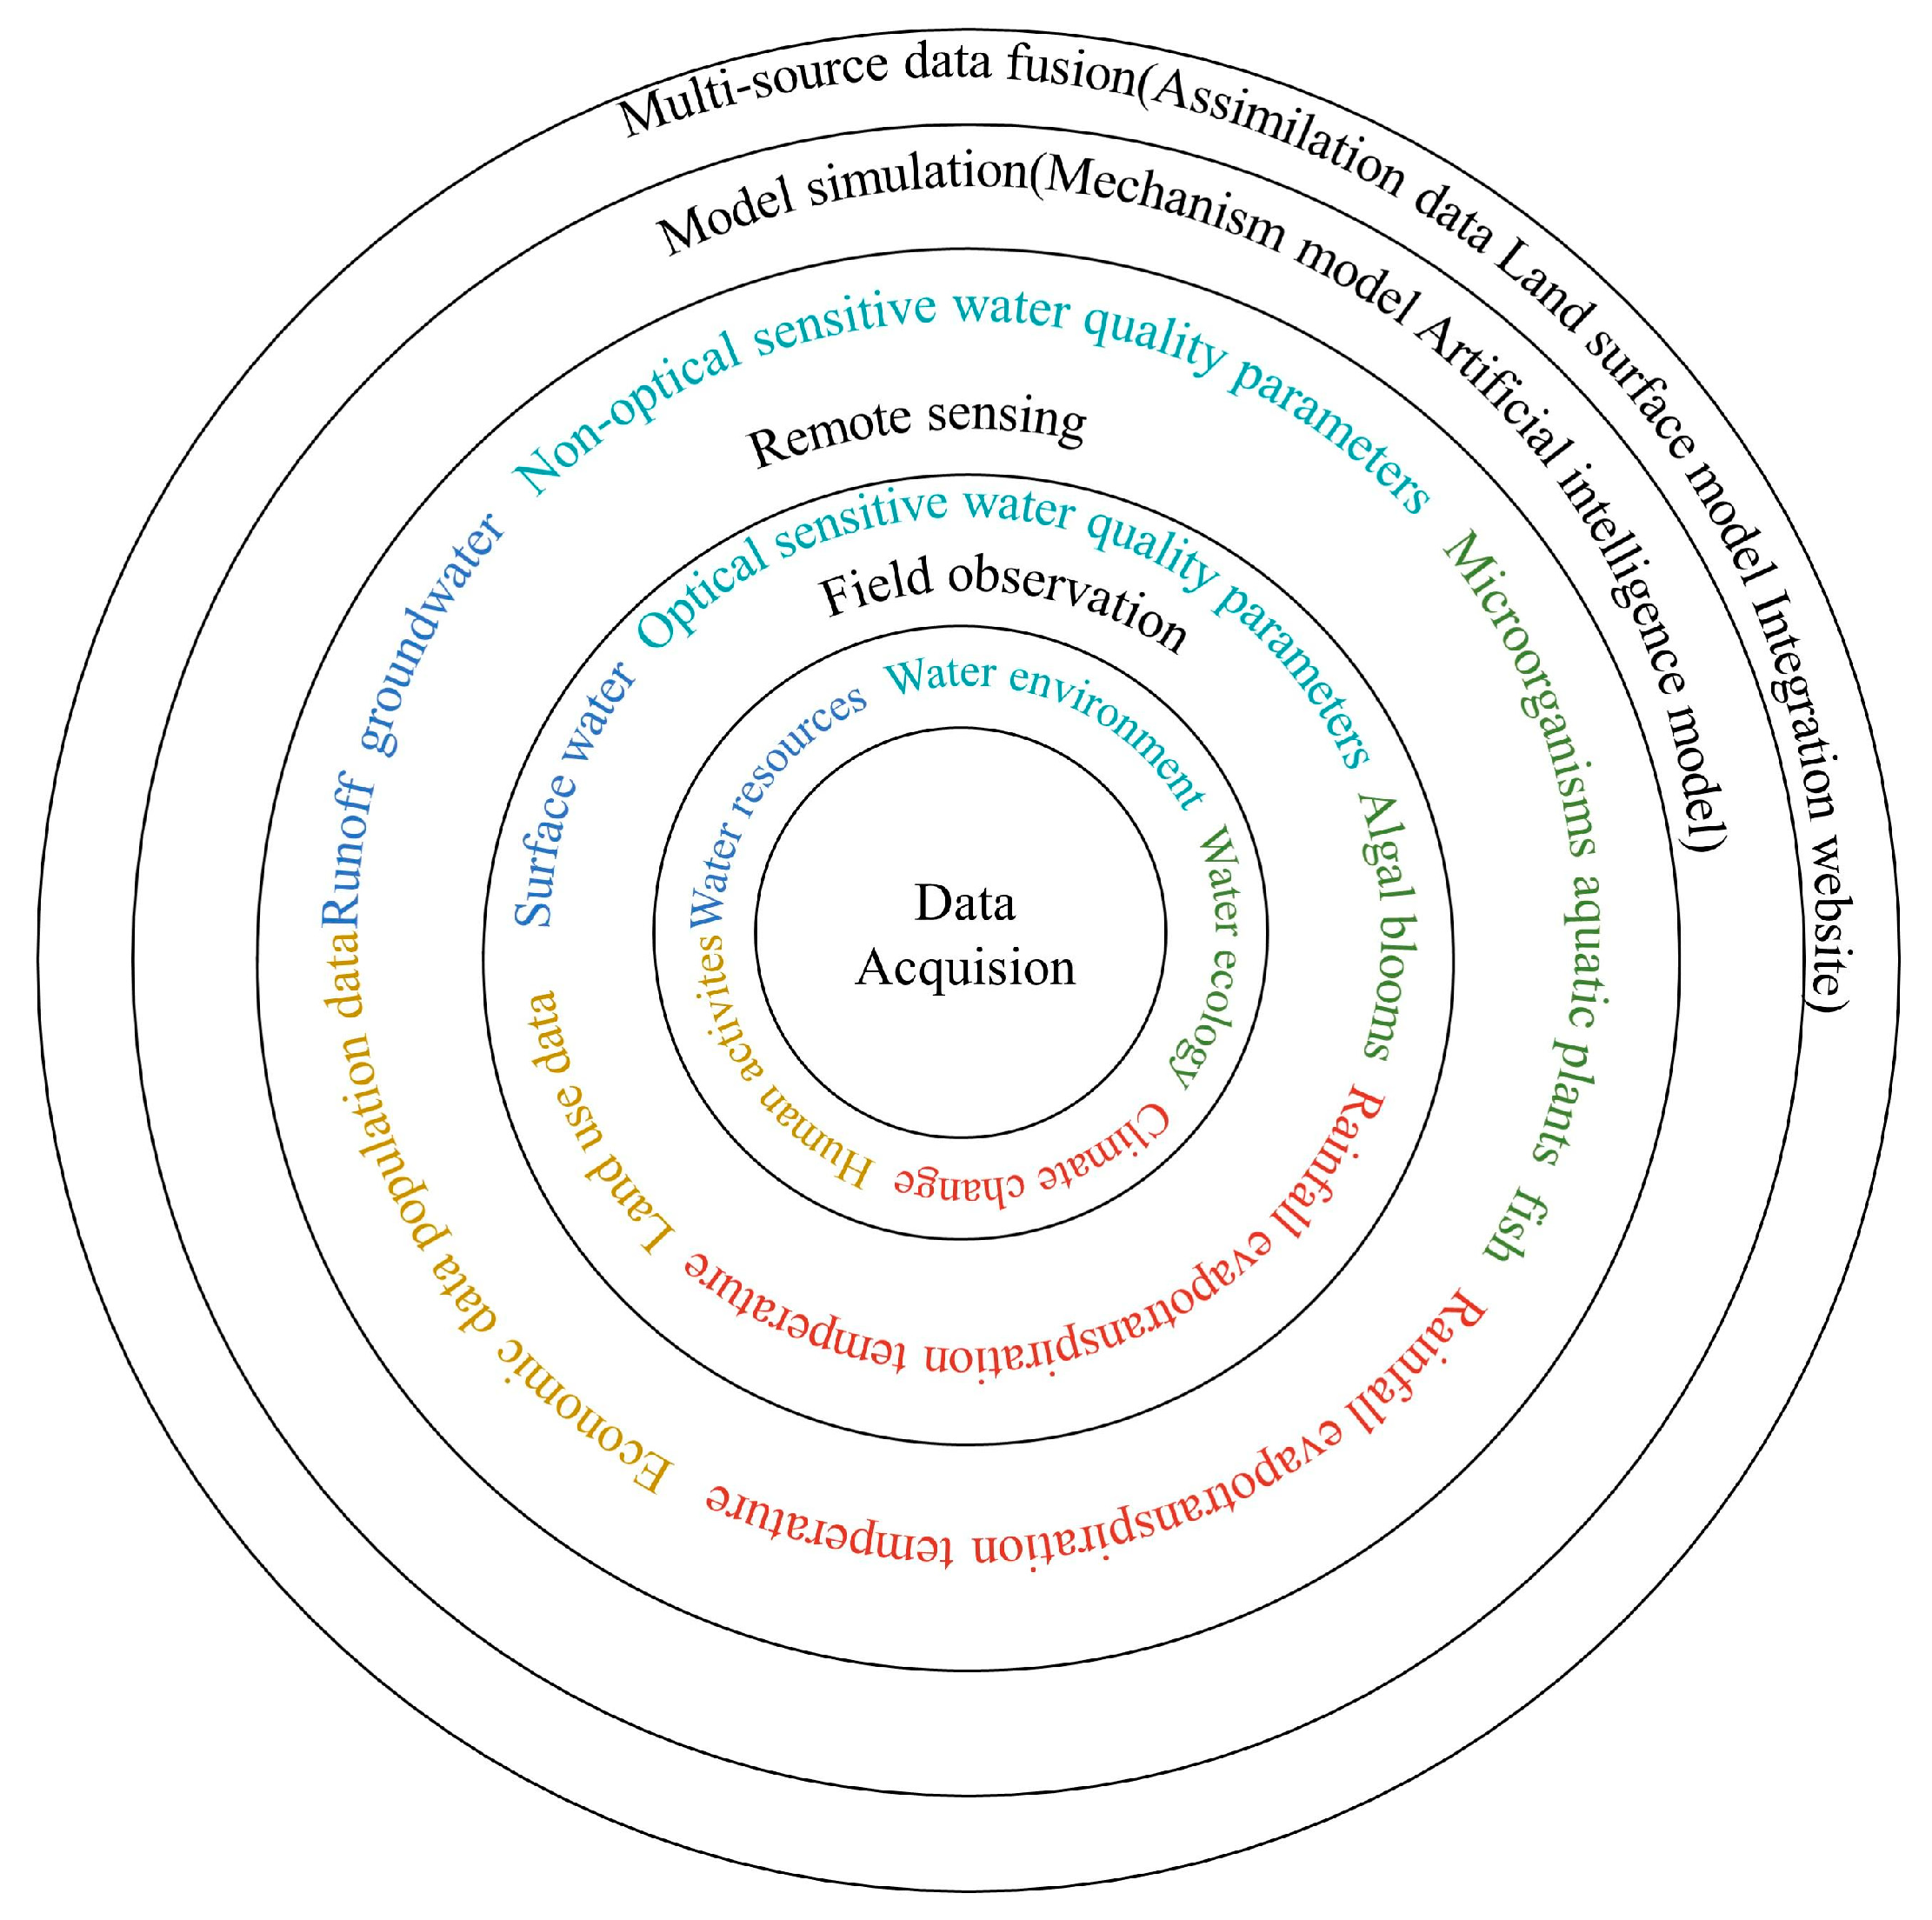
2.1. Methods and Results of Data Acquisition
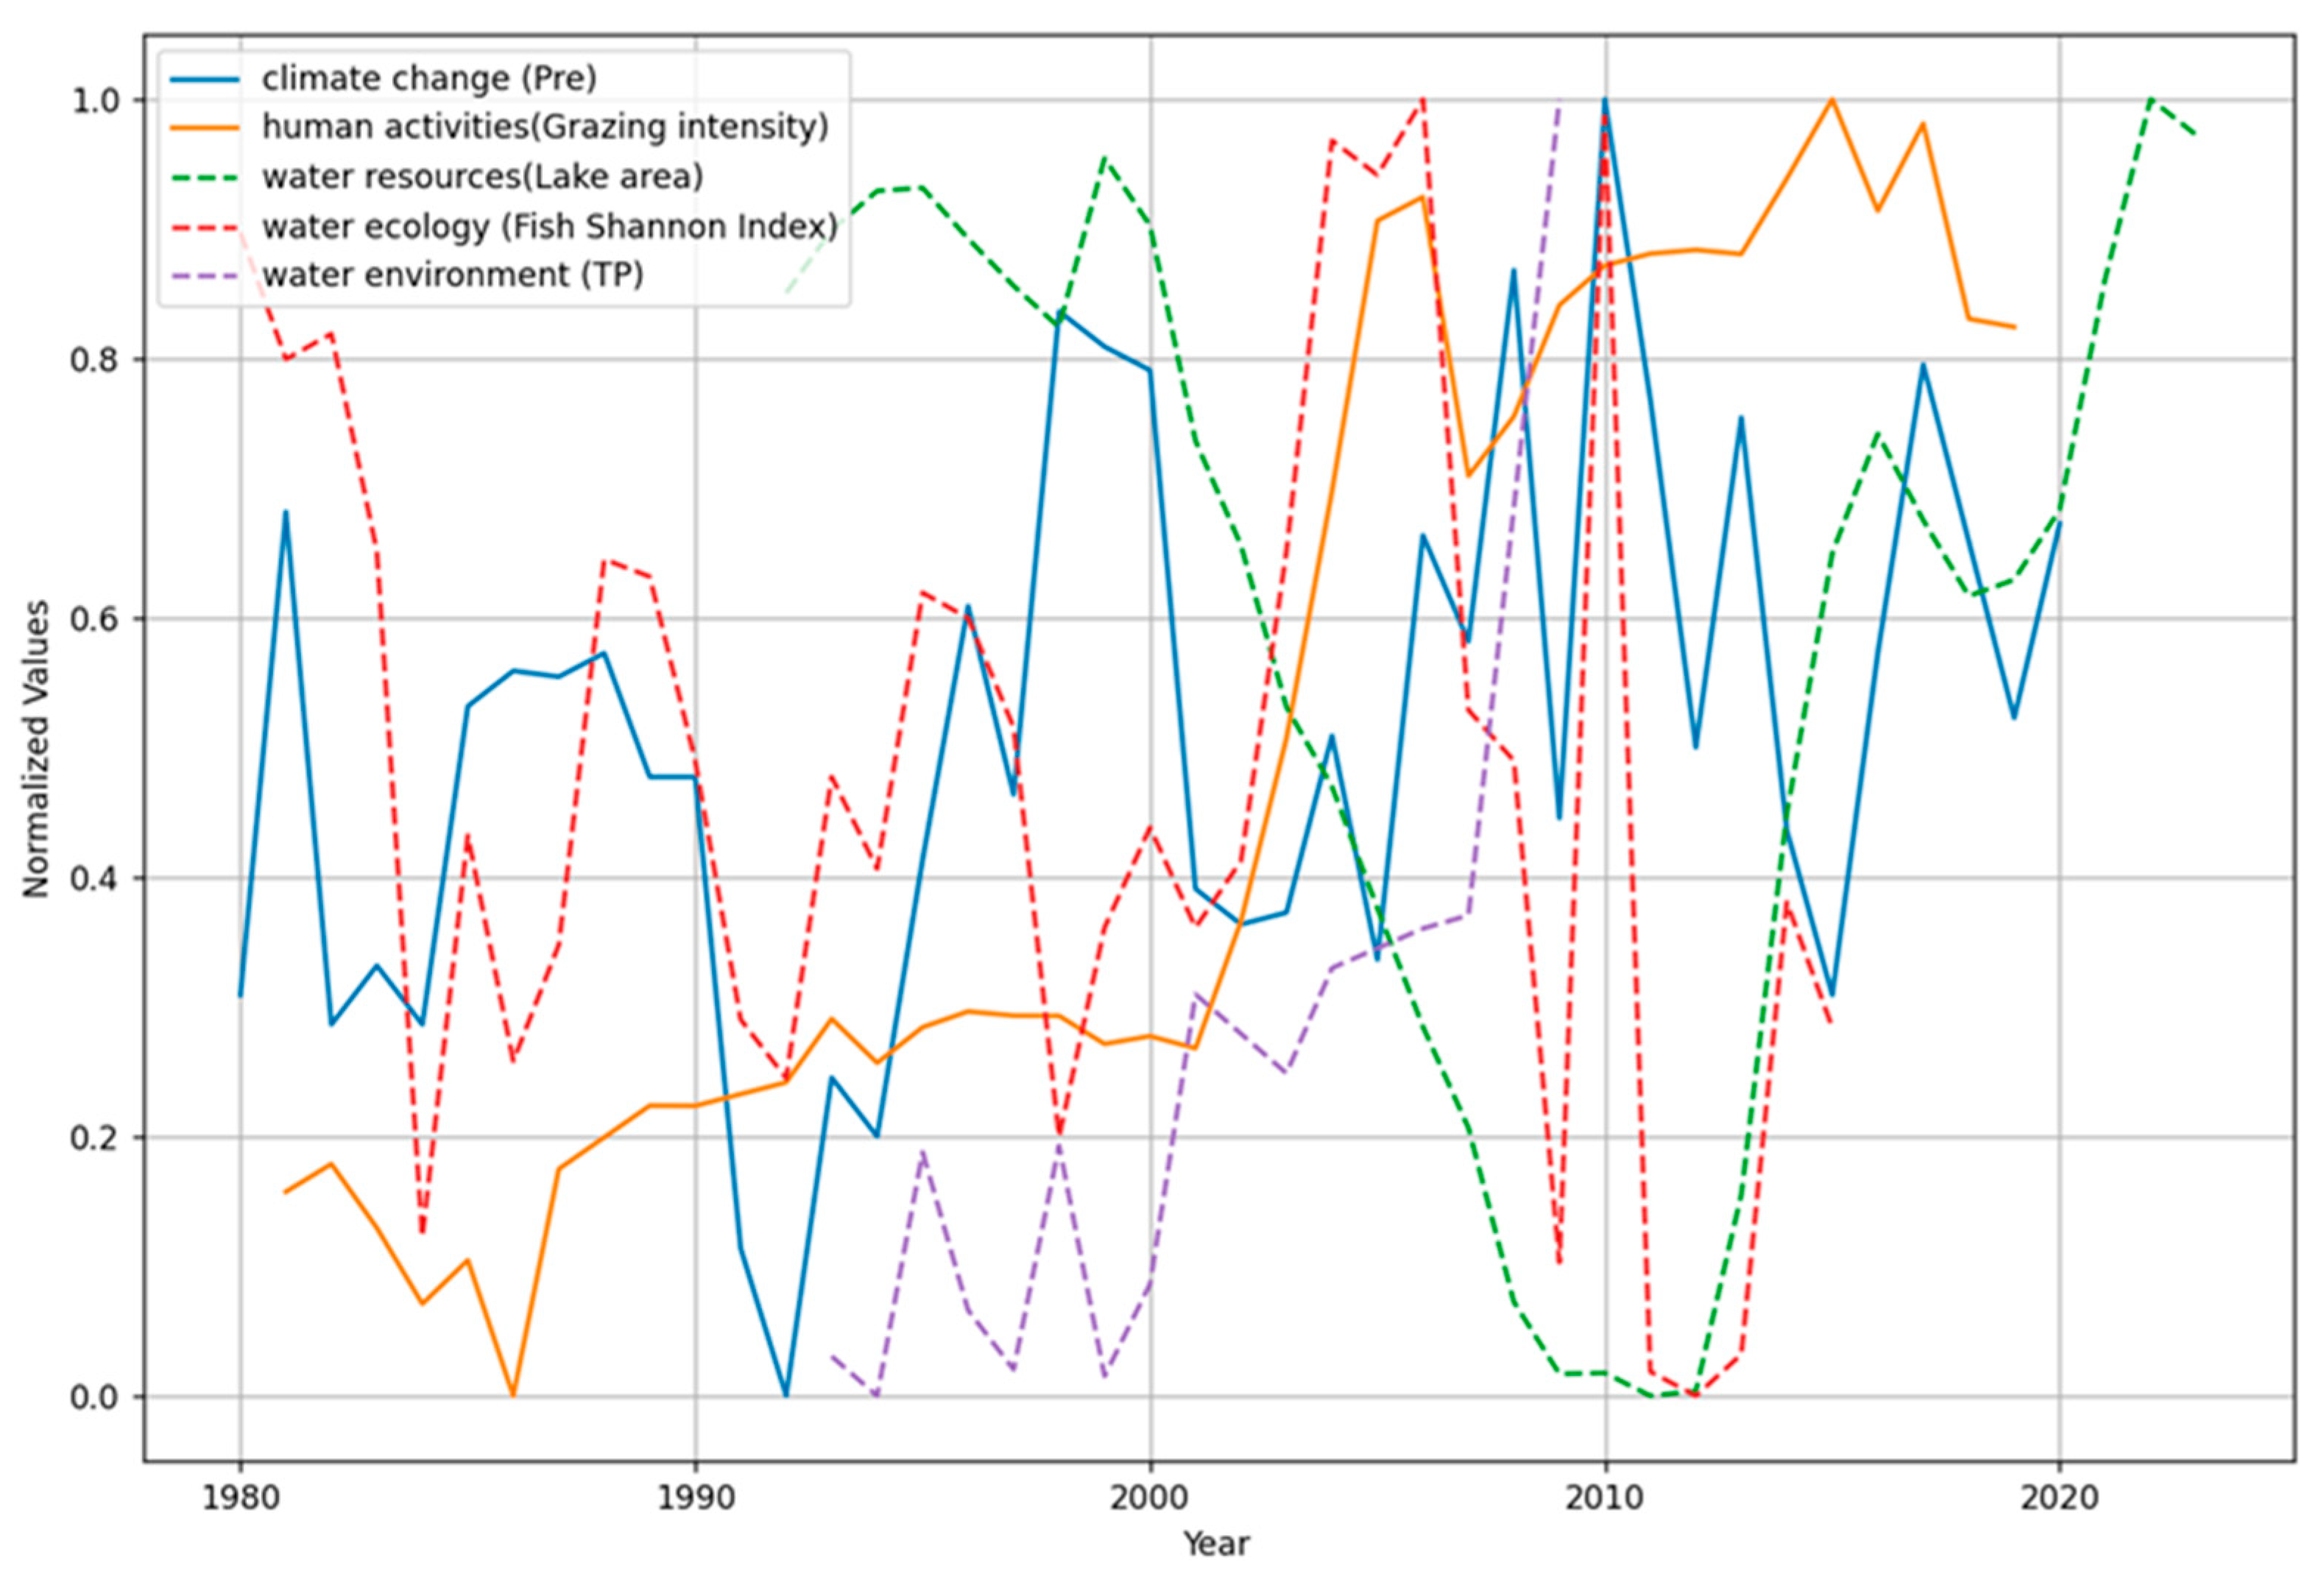
2.2. Methods and Results of Mechanism Identification
2.2.1. Impacts of External Drivers of Climate Change on Water Resources
2.2.2. Impacts of External Drivers of Climate Change on Water Environment
2.2.3. Impacts of External Drivers of Human Activities on Water Resources
2.2.4. Impacts of External Drivers of Human Activities on Water Environment
2.2.5. Impacts of Internal Interaction between Water Resources and Water Environment
2.2.6. Impacts of Internal Interaction between Water Resources and Water Ecology
2.2.7. Impacts of Internal Interaction between Water Ecology and Water Environment
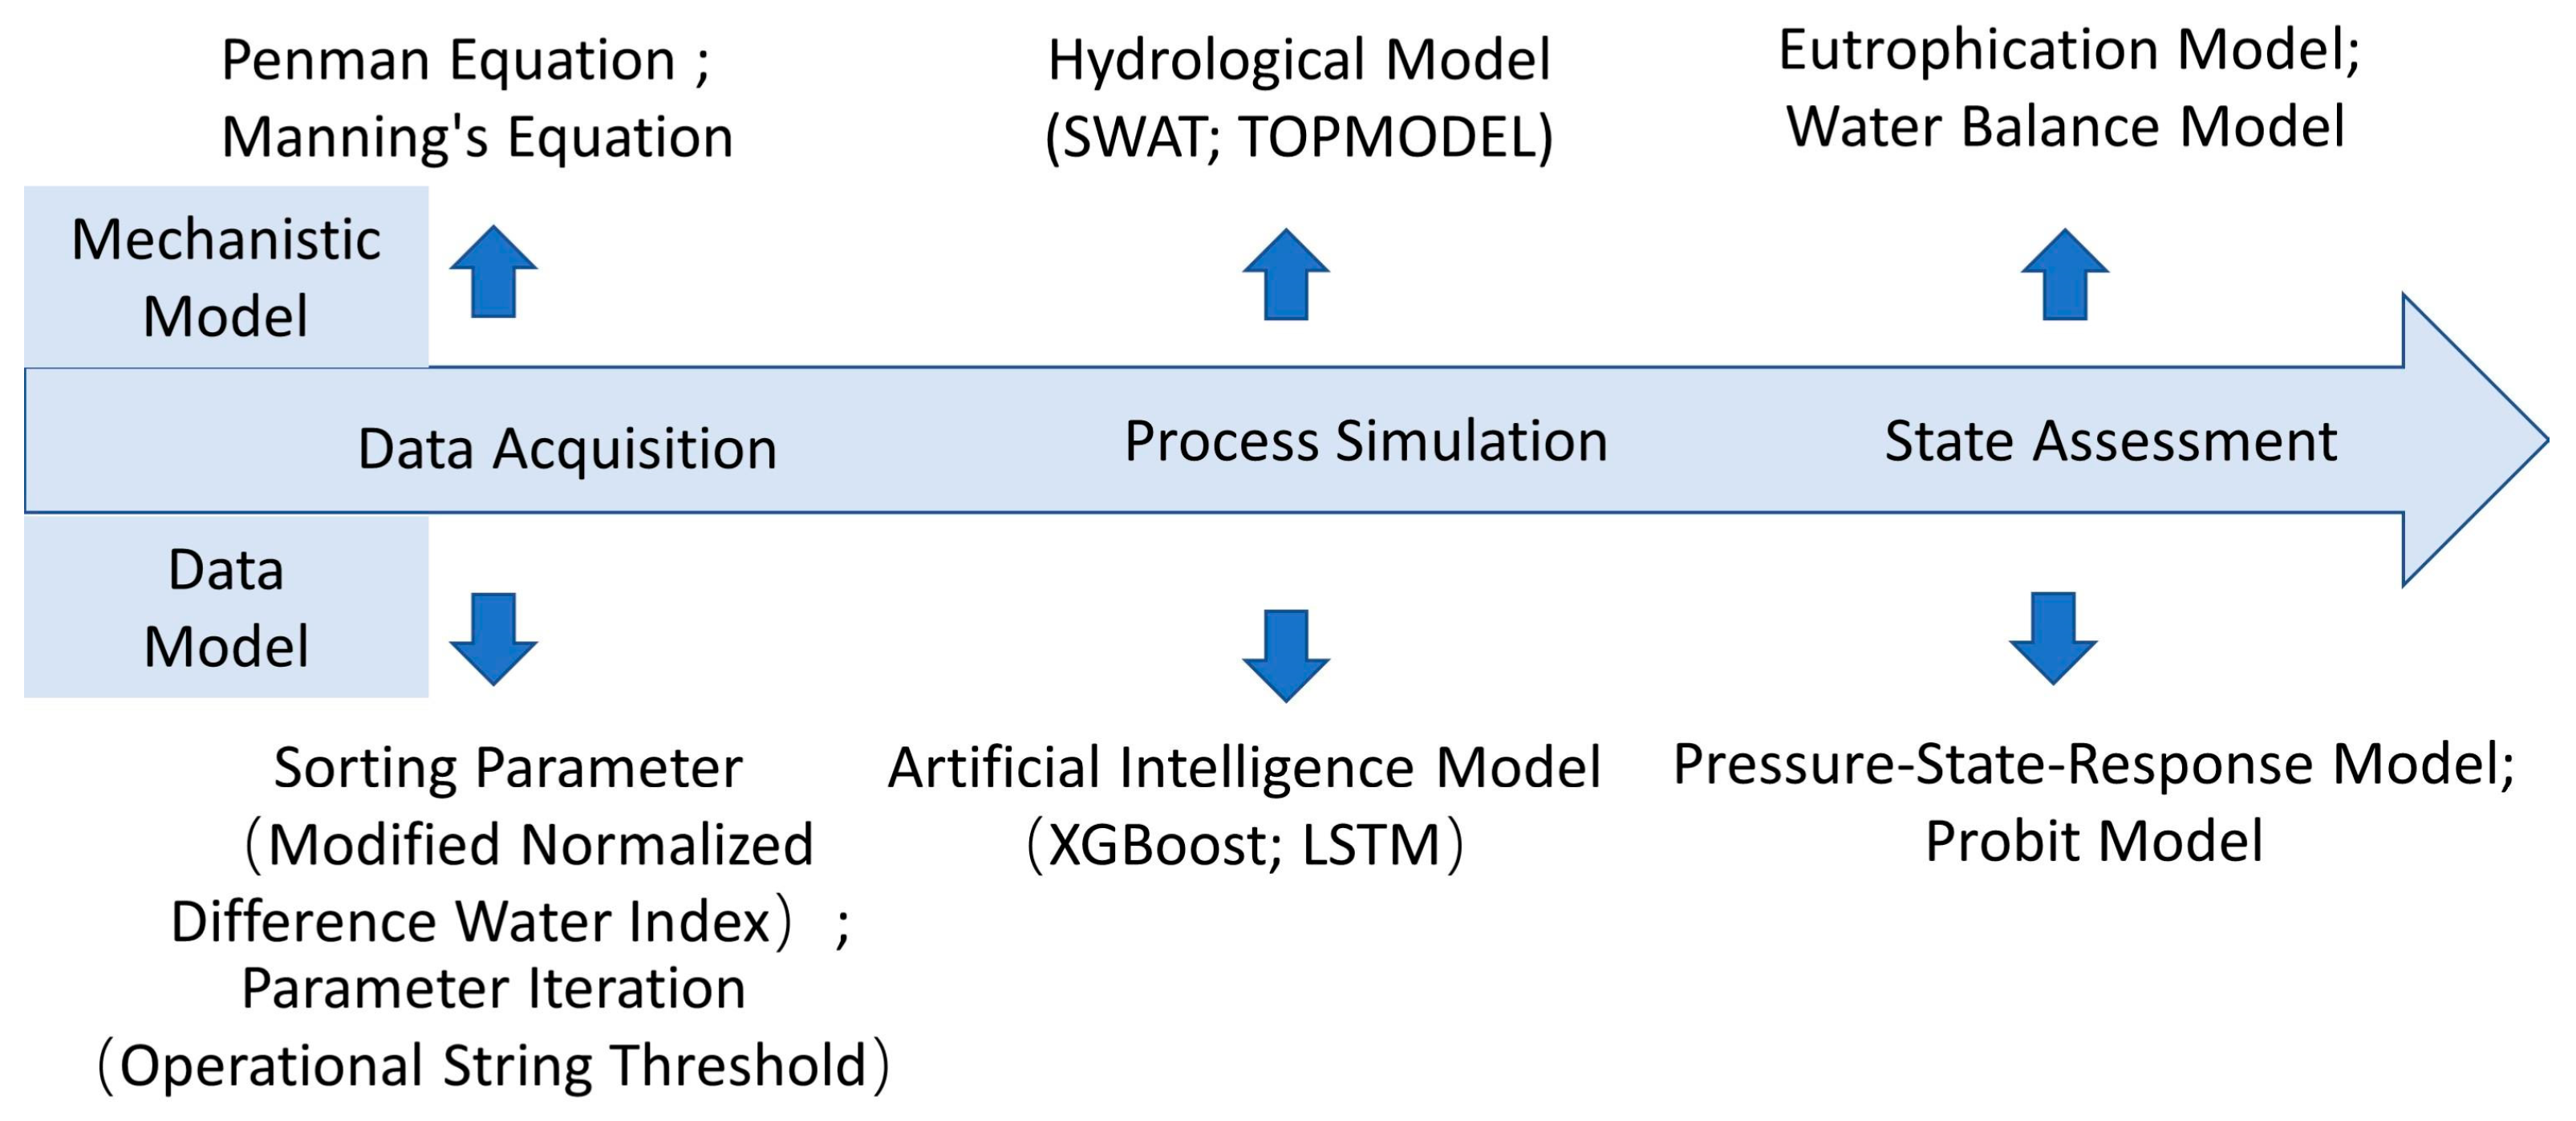
2.3. Methods and Results of Model Simulation
2.4. Methods and Results of Management Regulation
3. Research Framework
3.1. Integrated Monitoring
3.2. Multi-Process Identification
3.3. Integrated Model
3.4. Event Prevention
4. Research Direction
4.1. Enhancing the Spatiotemporal Availability of Data
4.2. Integrated Mechanism Identification of Water Resources–Water Environment–Water Ecology
4.3. Simulation of Key Processes in the River Basin
4.4. Providing Concrete Evidence to Support Management
5. Conclusions
Author Contributions
Funding
Data Availability Statement
Conflicts of Interest
References
- Allan, C.; Xia, J.; Pahl-Wostl, C. Climate change and water security: Challenges for adaptive water management. Curr. Opin. Environ. Sustain. 2013, 5, 625–632. [Google Scholar] [CrossRef]
- Li, X.Y.; Wang, Y.T.; Xue, B.L.; Yinglan, A.; Zhang, X.J.; Wang, G.Q. Attribution of runoff and hydrological drought changes in an ecologically vulnerable basin in semi-arid regions of China. Hydrol. Process. 2023, 37, e15003. [Google Scholar] [CrossRef]
- Yang, P.; Zhu, Y.; Zhai, X.; Xia, J.; Chen, Y.; Huang, H.; Li, Z.; Shi, X.; Zhou, L.; Fu, C. Adaptive management of water resources system in the arid Aksu river basin, northwest China. J. Clean. Prod. 2023, 419, 138185. [Google Scholar] [CrossRef]
- Geng, X.; Hu, Z.; Zhao, X.; Shen, H.; Fang, J. Three-decadal changes of lakes in Hulun Buir grasslands, Inner Mongolia. Arid Land Geogr. 2021, 44, 400–408. [Google Scholar]
- Wu, R.; Zhang, S.; Liu, Y.; Shi, X.; Zhao, S.; Kang, X.; Quan, D.; Sun, B.; Arvola, L.; Li, G. Spatiotemporal variation in water quality and identification and quantification of areas sensitive to water quality in Hulun lake, China. Ecol. Indic. 2023, 149, 110176. [Google Scholar] [CrossRef]
- Huo, T.; Zhang, X.; Dou, H.; Pang, B.; Wang, G.; Song, D.; Hu, Y.; Jin, X. Structure and Species Diversity of Fish Communities in Hulun LakeWater System. Wetl. Sci. 2022, 20, 76–85. [Google Scholar]
- Wang, W.; Zhao, L.; Li, W.; Chen, J.; Wang, S. Response mechanism of sediment organic matter of plateau lakes in cold and arid regions to climate change: A case study of Hulun Lake, China. Environ. Sci. Pollut. Res. 2023, 30, 26778–26790. [Google Scholar] [CrossRef]
- Huang, Y.; Yao, B.; Li, Y.; Zhang, H.; Wang, S. Deciphering Hulun lake level dynamics and periodical response to climate change during 1961-2020. J. Hydrol. Reg. Stud. 2023, 46, 101352. [Google Scholar] [CrossRef]
- Guo, J.; Zhang, Y.; Shi, X.; Sun, B.; Wu, L.; Wang, W. Driving Mechanisms of the Evolution and Ecological Water Demand of Hulun Lake in Inner Mongolia. Water 2022, 14, 3415. [Google Scholar] [CrossRef]
- Sun, B.; Yang, Z.; Zhao, S.; Shi, X.; Liu, Y.; Ji, G.; Huotari, J. Water Balance Analysis of Hulun Lake, a Semi-Arid UNESCO Wetland, Using Multi-Source Data. Remote Sens. 2023, 15, 2028. [Google Scholar] [CrossRef]
- Chen, J.; Chen, S.; Ma, F.; Chen, J. Analysis of water balance of Hulun Lake based on digital remote sensing images. Water Resour. Prot. 2020, 36, 73–79. [Google Scholar]
- Yue, H.; Liu, Y.; Yang, W.; Wang, X. Remote sensing analysis on lake area variations of 5 typical lakes in the Northwest of China over the past 40 years. J. Water Resour. Water Eng. 2017, 28, 27–32. [Google Scholar]
- Li, G.; Tang, X. Accuracy evaluation of large lake water level measurement based on GF-7 laser altimetry data. J. Remote Sens. 2022, 26, 138–147. [Google Scholar] [CrossRef]
- Li, C.; Wang, J.; Hu, R.; Yin, S.; Bao, Y.; Li, Y. ICESat/GLAS-derived changes in the water level of Hulun Lake, Inner Mongolia, from 2003 to 2009. Front. Earth Sci. 2018, 12, 420–430. [Google Scholar] [CrossRef]
- Yuan, C.; Gong, P.; Liu, C.; Ke, C. Water-volume variations of Lake Hulun estimated from serial Jason altimeters and Landsat TM/ETM plus images from 2002 to 2017. Int. J. Remote Sens. 2019, 40, 670–692. [Google Scholar] [CrossRef]
- Li, S.; Chen, J.; Xiang, J.; Pan, Y.; Huang, Z.; Wu, Y. Water level changes of Hulun Lake in Inner Mongolia derived from Jason satellite data. J. Vis. Commun. Image Represent. 2019, 58, 565–575. [Google Scholar] [CrossRef]
- Liu, Y.; Yue, H. Estimating the fluctuation of Lake Hulun, China, during 1975-2015 from satellite altimetry data. Environ. Monit. Assess. 2017, 189, 630. [Google Scholar] [CrossRef]
- Fan, C.; Song, C.; Liu, K.; Ke, L.; Xue, B.; Chen, T.; Fu, C.; Cheng, J. Century-Scale Reconstruction of Water Storage Changes of the Largest Lake in the Inner Mongolia Plateau Using a Machine Learning Approach. Water Resour. Res. 2021, 57, e2020WR028831. [Google Scholar] [CrossRef]
- Wang, P.; Guo, Y.; Zhou, K.; Zheng, S.; Jiang, X.; Wang, S. Variation of Lake Area of Hulun Lake during 1961–2018 and Its Response to Climate Change. Res. Environ. Sci. 2021, 34, 792–800. [Google Scholar]
- Zhou, Y.; Dong, J.; Xiao, X.; Liu, R.; Zou, Z.; Zhao, G.; Ge, Q. Continuous monitoring of lake dynamics on the Mongolian Plateau using all available Landsat imagery and Google Earth Engine. Sci. Total Environ. 2019, 689, 366–380. [Google Scholar] [CrossRef]
- Wu, S.; Sun, Y. Analysis of Surface and Groundwater Changes of the Hulun Lake based on Multi-source Data. Remote Sens. Technol. Appl. 2021, 36, 155–164. [Google Scholar]
- Gao, H.; Li, C.; Sun, B.; Shi, X.; Zhao, S.; Fan, C. Characteristics of hydrogen and oxygen stable isotopes in Lake Hulun Basin and its indicative function in evaporation. J. Lake Sci. 2018, 30, 211–219. [Google Scholar]
- Ma, F.; Chen, J.; Chen, J.; Wang, T. Hydrogeochemical and isotopic evidences of unique groundwater recharge patterns in the Mongolian Plateau. Hydrol. Process. 2022, 36, e14554. [Google Scholar] [CrossRef]
- Han, Z.; Shi, X.; Jia, K.; Sun, B.; Zhao, S.; Fu, C. Determining the Discharge and Recharge Relationships between Lake and Groundwater in Lake Hulun Using Hydrogen and Oxygen Isotopes and Chloride Ions. Water 2019, 11, 264. [Google Scholar] [CrossRef]
- Wang, Z.; Li, C.; Zhang, S.; Jia, K.; Li, W. Hydrological changes in Lake Hulun based on water balance model. Sci. Limnol. Sin. 2012, 24, 667–674. [Google Scholar]
- Shang, Y.; Wu, X.; Wei, Q.; Dou, H.; Wang, X.; Chen, J.; Zhang, H.; Ma, S.; Zhang, H. Total Arsenic, pH, and Sulfate Are the Main Environmental Factors Affecting the Microbial Ecology of the Water and Sediments in Hulun Lake, China. Front. Microbiol. 2020, 11, 548607. [Google Scholar] [CrossRef]
- Shang, Y.; Wu, X.; Wang, X.; Wei, Q.; Ma, S.; Sun, G.; Zhang, H.; Wang, L.; Dou, H.; Zhang, H. Factors affecting seasonal variation of microbial community structure in Hulun Lake, China. Sci. Total Environ. 2022, 805, 150294. [Google Scholar] [CrossRef]
- Wu, D.; Xu, Z.; Ma, G.; Gao, Y. Characteristics and Variation of Phytoplankton Assemblage in Typical Lakes of Inner Mongolia. Hydrology 2012, 32, 80–85. [Google Scholar]
- Pan, H.; Liu, Y.; Ma, C. Characteristics and Physical Factors of Cyanobacteria Outbreak in Northern Cold Region Inland Alkaline Water. J. North East For. Univ. 2017, 45, 79–83. [Google Scholar]
- Zhao, M.; Shi, X.; Zhao, S.; Yu, H. Species Diversity of Aquatic Animals and Plants and Ecological Status of Hulun Lake in Summer 2019. Wetl. Sci. 2022, 20, 139–148. [Google Scholar]
- An, X.P.; Du, Z.H.; Zhang, J.H.; Li, Y.P.; Qi, J.W. Structure of the zooplankton community in Hulun Lake, China. In Proceedings of the 18th Biennial ISEM Conference on Ecological Modelling for Global Change and Coupled Human and Natural Systems, Beijing, China, 20–23 September 2012; pp. 1099–1109. [Google Scholar]
- Jiang, Z.; Li, C.; Zhang, S. Zooplankton in Hulun Lake and the eutrophication evaluation. J. Arid Land Resour. Environ. 2014, 28, 158–162. [Google Scholar]
- Mao, Z.; Gu, X.; Zeng, Q. The structure of fish community and changes of fishery resources in Lake Hulun. J. Lake Sci. 2016, 28, 387–394. [Google Scholar]
- Ao, W.; Dou, H.S.; Yu, C.C.; Wang, W.L.; Wang, Z.L.; Wang, Q.; Lu, L.; Zhou, X.J.; Han, R.M.; Zou, C.X. The ice cover shapes the spatial and temporal characteristics of water quality in Hulun Lake during winter. Water Supply 2020, 20, 2589–2602. [Google Scholar] [CrossRef]
- Han, Z.; Jia, K.; Shi, X.; Sun, B.; Yang, F.; Wu, Q. Hydrochemical and hydrogen and oxygen isotopic characteristics of water in the low reach of Kherlen River. Arid Land Geogr. 2019, 42, 85–93. [Google Scholar]
- Wu, D.; Geng, X.; Li, M. Characteristics of Climatic Changes in Hulun Lake Basin in Recent 55 Years. Res. Soil Water Conserv. 2016, 23, 174–178.184. [Google Scholar]
- Zhang, N.; Wu, L.; Liu, S.; Dou, H.; Li, J. The characteristics of climate change and its influence on water area of Hulun lake. J. Arid Land Resour. Environ. 2015, 29, 192–197. [Google Scholar]
- Ning, S.; Ishidaira, H.; Udmale, P.; Ichikawa, Y. Remote Sensing Based Analysis of Recent Variations in Water Resources and Vegetation of a Semi-Arid Region. Water 2015, 7, 6039–6055. [Google Scholar] [CrossRef]
- Zhao, H.; Gu, R.; Bai, X.; Li, C.; Wang, Y.; Song, W. Influences of meteorological and hydrological factors to climatic potential productivity in Hulun Lake wetland. Ecol. Environ. Sci. 2012, 21, 997–1003. [Google Scholar]
- Gao, Y.; Zhao, H.; Li, C.; Song, W.; Meng, J. Integrated Model Describing the Growth and Decline of the Hulun Lake Wetland Based on Meteorological and Hydrological Factors. J. Glaciol. Geocryol. 2012, 34, 1310–1318. [Google Scholar]
- Chi, D.; Wang, H.; Li, X.; Liu, H.; Li, X. Estimation of the ecological water requirement for natural vegetation in the Ergune River basin in Northeastern China from 2001 to 2014. Ecol. Indic. 2018, 92, 141–150. [Google Scholar] [CrossRef]
- Wang, J.R.; Hu, L.T.; Sun, K.N.; Liu, X.M. Numerical studies on groundwater-grassland relations in an inland arid region in China. In Proceedings of the 3rd International Conference on Water Resource and Environment (WRE), Qingdao, China, 26–29 June 2017. [Google Scholar]
- Wang, W.; Li, W.; Yan, Y.; Liu, B.; Wang, T.; Mao, S.; Song, L.; Dou, H.; Ao, W.; Zou, C. Organic Matter Pollution During the Spring Thaw in Hulun Lake Basin: Contribution of Multiform Human Activities. Bull. Environ. Contam. Toxicol. 2020, 105, 307–316. [Google Scholar] [CrossRef] [PubMed]
- Li, X.; Liu, Y.; Zhang, S.; Li, G.; Tao, Y.; Wang, S.; Yu, H.; Shi, X.; Zhao, S. Evolution Characteristics and Driving Factors of Cyanobacterial Blooms in Hulun Lake from 2018 to 2022. Water 2023, 15, 3765. [Google Scholar] [CrossRef]
- Wang, W.; Chen, J.; Jiang, X.; Li, H.; Wang, S. Release Effect of Surface Sediment Organic Matters in Lake Hulun. Res. Environ. Sci. 2021, 34, 812–823. [Google Scholar]
- Lai, L.; Liu, Y.; Zhang, Y.; Cao, Z.; Yang, Q.; Chen, X. MODIS Terra and Aqua images bring non-negligible effects to phytoplankton blooms derived from satellites in eutrophic lakes. Water Res. 2023, 246, 120685. [Google Scholar] [CrossRef] [PubMed]
- Song, T.; Liu, G.; Zhang, H.; Yan, F.; Fu, Y.; Zhang, J. Lake Cyanobacterial Bloom Color Recognition and Spatiotemporal Monitoring with Google Earth Engine and the Forel-Ule Index. Remote Sens. 2023, 15, 3541. [Google Scholar] [CrossRef]
- Zhou, C.; Xie, Y.; Zhang, A.; Liu, C.; Yang, J. Spatiotemporal analysis of interactions between seasonal water, climate, land use, policy, and socioeconomic changes: Hulun-Buir Steppe as a Case Study. Water Res. 2022, 209, 3541. [Google Scholar] [CrossRef]
- Liu, J.; Wang, S. Monitoring of Hulun Lake water level changes based on ICESat-2 satellite altimetry data. Arid Zone Res. 2023, 40, 1438–1445. [Google Scholar]
- Cai, Z.; Jin, T.; Li, C.; Ofterdinger, U.; Zhang, S.; Ding, A.; Li, J. Is China’s fifth-largest inland lake to dry-up? Incorporated hydrological and satellite-based methods for forecasting Hulun lake water levels. Adv. Water Resour. 2016, 94, 185–199. [Google Scholar] [CrossRef]
- Fu, Z.; Zhang, Y.; Jiang, X.; Guo, Y.; Wang, S. Risk Analysis of Impact of Human Activities on Ecological Health Based on Watershed Scale:A Case Study of Hulun Lake. Res. Environ. Sci. 2021, 34, 785–791. [Google Scholar]
- Wang, C.; Dong, S.; Jia, Z.; Xia, M.; Hou, Q. Responses of vegetation to depth to the groundwater table in the grassland openpit coal mine area. Acta Ecol. Sin. 2020, 40, 6925–6937. [Google Scholar]
- Wang, G.; Song, J.; Xue, B.-L.; Xu, X.; Otsuki, K. Land Use and Land Cover Change of Hulun Lake Nature Reserve in Inner Mongolia, China: A Modeling Analysis. J. Fac. Agric. Kyushu Univ. 2012, 57, 219–225. [Google Scholar] [CrossRef]
- Yang, H.; Jiang, M.; Yinglan, A.; Wang, G.; Wu, B. Changes in Land Use and Landscape Pattern in Hulun Lake Nature Reserve. J. Beijing Norm. Univ. Nat. Sci. 2013, 49, 318–325. [Google Scholar]
- Zhu, N.; Xu, Y.; Wang, X.; Feng, A.; Huang, L. Simulated Study on Carbon, Nitrogen and Phosphorus Release from the Soils of Water-level-fluctuating Zone in Hulun Lake. Environ. Sci. Technol. 2021, 44, 108–114. [Google Scholar]
- Liu, T.; Zhang, D.; Yue, W.; Wang, B.; Huo, L.; Liu, K.; Zhang, B.-T. Heavy Metals in Sediments of Hulun Lake in Inner Mongolia: Spatial-Temporal Distributions, Contamination Assessment and Source Apportionment. Water 2023, 15, 1329. [Google Scholar] [CrossRef]
- Yu, H.; Shi, X.; Sun, B.; Zhao, S.; Liu, Y.; Zhao, M. Analysis of water quality and eutrophication changes in Hulun Lake from 2011 to 2020. Arid Zone Res. 2021, 38, 1534–1545. [Google Scholar]
- Gao, H.; Fan, Y.; Wang, G.; Li, L.; Zhang, R.; Li, S.; Wang, L.; Jiang, Z.; Zhang, Z.; Wu, J.; et al. The Sources of Sedimentary Organic Matter Traced by Carbon and Nitrogen Isotopes and Environmental Effects during the Past 60 Years in a Shallow Steppe Lake in Northern China. Water 2023, 15, 2224. [Google Scholar] [CrossRef]
- Guo, Z.; Li, C.; Shi, X.; Sun, B.; Zhao, S.; Quan, D.; Hou, B. Spatial and Temporal Distribution Characteristics of Chlorophyll A Content and Its Influencing Factor Analysis in Hulun Lake of Cold and Dry Areas. Ecol. Environ. Sci. 2019, 28, 1434–1442. [Google Scholar]
- Wang, Q.; Song, K.; Wen, Z.; Shang, Y.; Li, S.; Fang, C.; Du, J.; Zhao, F.; Liu, G. Long-term remote sensing of total suspended matter using Landsat series sensors in Hulun Lake, China. Int. J. Remote Sens. 2021, 42, 1379–1397. [Google Scholar] [CrossRef]
- Wang, J.; Wu, J.; Zeng, H.; Ma, L. Changes of Water Resources of the Main Lakes in Inner Mongolia. Arid Zone Res. 2015, 32, 7–14. [Google Scholar]
- Li, W.; Chen, A.; Yu, L.; Yang, W.; Yin, Z.; Yang, P.; Jiao, L. Pollutant influx from the main river (Kherlen River) of Lake Hulun in wet seasons, 20102014. J. Lake Sci. 2016, 28, 281–286. [Google Scholar]
- Zhang, W.; Chen, R.; Meng, F.; Yuan, H.; Geng, M.; Cheng, L.; Yin, H.; Xue, B.; Wang, J. Ecosystem functioning is linked to microbial evenness and community composition along depth gradient in a semiarid lake. Ecol. Indic. 2021, 132, 108314. [Google Scholar] [CrossRef]
- Yuan, H.; Zhang, W.; Yin, H.; Zhang, R.; Wang, J. Taxonomic dependency of beta diversity for bacteria, archaea, and fungi in a semi-arid lake. Front. Microbiol. 2022, 13, 998496. [Google Scholar] [CrossRef]
- Wang, W.; Liu, L.; Ma, Y.; He, J. Spatial distributions and environmental implications of diatom assemblages in surface sediments of Hulun Lake, China. Environ. Earth Sci. 2015, 74, 1803–1813. [Google Scholar] [CrossRef]
- Qu, X.; Zhang, M.; Yang, Y.; Xie, Y.; Ren, Z.; Peng, W.; Du, X. Taxonomic structure and potential nitrogen metabolism of microbial assemblage in a large hypereutrophic steppe lake. Environ. Sci. Pollut. Res. 2019, 26, 21151–21160. [Google Scholar] [CrossRef] [PubMed]
- Shi, Y.; Li, W.; Guo, X. Composition, interaction networks, and nitrogen metabolism patterns of bacterioplankton communities in a grassland type Lake: A case of Hulun Lake, China. Front. Microbiol. 2023, 14, 1305345. [Google Scholar] [CrossRef]
- Ma, C.; Zhao, C.; Mwagona, P.C.; Li, Z.; Liu, Z.; Dou, H.; Zhou, X.; Bhadha, J.H. Bottom-up and top-down effects on phytoplankton functional groups in Hulun Lake, China. Ann. De Limnol.-Int. J. Limnol. 2021, 57, 3. [Google Scholar] [CrossRef]
- Li, X.C.; Sun, X.; Ma, C.X.; Yu, H.X. Phytoplankton Functional Groups and Their Relationship with Environmental Factors in a Eutrophic and High-Alkalinity Lake in The Cold Regions of Northern China. Appl. Ecol. Environ. Res. 2021, 19, 1549–1569. [Google Scholar] [CrossRef]
- Liu, X.; Wang, Z.; Wang, X.; Yang, C.; Song, X.; Lv, X.; Li, Z. Ecological risks assessment of selected heavy metals in the waters of Chinese lakes based on species sensitivity distributions. J. Lake Sci. 2018, 30, 1206–1217. [Google Scholar]
- Zeng, J.; Yang, L.Y.; Chuai, X.M.; Chen, X.F.; Zhao, H.Y.; Wu, Q.L. Comparison of metal(loid) concentrations in water, sediments and fish from two large shallow lakes. Int. J. Environ. Sci. Technol. 2013, 10, 1209–1218. [Google Scholar] [CrossRef]
- Shang, Y.; Wu, X.; Wang, X.; Dou, H.; Wei, Q.; Ma, S.; Sun, G.; Wang, L.; Sha, W.; Zhang, H. Environmental factors and stochasticity affect the fungal community structures in the water and sediments of Hulun Lake, China. Ecol. Evol. 2022, 12, e9510. [Google Scholar] [CrossRef]
- Qian, X.; Li, J.; Ao, W.; Pang, B.; Bao, S.; Wang, Q.; Liu, B.; Wang, Z. Seasonal dynamics of phytoplankton and its relationship with environmental factors in Lake Hulun. J. Lake Sci. 2022, 34, 1814–1827. [Google Scholar]
- Jiang, Z.; Li, C.; Zhang, S.; Jia, K.; Shi, X. Phytoplankton and Nutrition Evaluation in Hulun Lake. J. Agro-Environ. Sci. 2011, 30, 726–732. [Google Scholar]
- Cao, Y.; Fu, C.; Wang, X.; Dong, L.; Yao, S.; Xue, B.; Wu, H.; Wu, H. Decoding the dramatic hundred-year water level variations of a typical great lake in semi-arid region of northeastern Asia. Sci. Total Environ. 2021, 770, 145353. [Google Scholar] [CrossRef] [PubMed]
- Ye, A.Z.; Zhou, Z.; You, J.J.; Ma, F.; Duan, Q.Y. Dynamic Manning’s roughness coefficients for hydrological modelling in basins. Hydrol. Res. 2018, 49, 1379–1395. [Google Scholar] [CrossRef]
- Ren, X.; Yu, R.; Liu, X.; Sun, H.; Yue, G.; Qi, Z.; Zhang, Z.; Li, X.; Wang, J.; Zhu, P.; et al. Spatial changes and driving factors of lake water quality in Inner Mongolia, China. J. Arid Land 2023, 15, 164–179. [Google Scholar] [CrossRef]
- Li, C.; Leal Filho, W.; Nagy, G.J.; Wang, J.; Ciani, A.; Sidsaph, H.; Fedoruk, M.; Yin, S.; Bao, Y.; Ayal, D.Y.; et al. Satellite imagery evidence for a multiannual water level decline in Hulun Lake, China, with suggestions to future policy making responses. Erde 2019, 150, 31–39. [Google Scholar] [CrossRef]
- Li, Y.; Zhang, Y.; Zhang, X.; Ye, W.; Xu, L.; Han, Q.; Li, Y.; Liu, H.; Peng, S. A continuous simulation of Holocene effective moisture change represented by variability of virtual lake level in East and Central Asia. Sci. China Earth Sci. 2020, 63, 1161–1175. [Google Scholar] [CrossRef]
- Pu, J.; Song, K.; Lv, Y.; Liu, G.; Fang, C.; Hou, J.; Wen, Z. Distinguishing Algal Blooms from Aquatic Vegetation in Chinese Lakes Using Sentinel 2 Image. Remote Sens. 2022, 14, 1988. [Google Scholar] [CrossRef]
- Song, W.; Yinglan, A.; Wang, Y.; Xue, B. Landsat Satellite Image-Derived Area Evolution and the Driving Factors Affecting Hulun Lake from 1986 to 2020. Remote Sens. 2023, 15, 2682. [Google Scholar] [CrossRef]
- Cao, B.; Xu, D.; Dou, H.; Pang, B.; Ao, W.; Gu, Y.; Shan, N.; Wang, W.; Liu, B.; Zou, C. Index system of ecological security of inland lakes in cold arid region: A case study of Hulun Lake, China. Acta Ecol. Sin. 2021, 41, 2996–3006. [Google Scholar]
- Yang, Z.; Li, C.; Shi, X.; Sun, B.; Du, D.; Quan, D. Study on the Characteristics of Water Nutrition Status and Its Main Influencing Factors in Hulun Lake. Ecol. Environ. Sci. 2019, 28, 2273–2280. [Google Scholar]
- Shi, W.J.Y.; Wu, Y.Y.; Sun, X.; Gu, X.Y.; Ji, R.; Li, M. Environmental Governance of Western Europe and Its Enlightenment to China: In Context to Rhine Basin and the Yangtze River Basin. Bull. Environ. Contam. Toxicol. 2021, 106, 819–824. [Google Scholar] [CrossRef] [PubMed]
- Jalink, H.; Dieperink, C. Towards Design Principles for Good Multi-Level Drought Risk Governance: Some Lessons from the Rhine Basin. Water 2024, 16, 879. [Google Scholar] [CrossRef]
- van Pelt, S.C.; Swart, R.J. Climate Change Risk Management in Transnational River Basins: The Rhine. Water Resour. Manag. 2011, 25, 3837–3861. [Google Scholar] [CrossRef]
- Sharma, B.; Amarasinghe, U.; Cai, X.L.; de Condappa, D.; Shah, T.; Mukherji, A.; Bharati, L.; Ambili, G.; Qureshi, A.; Pant, D.; et al. The Indus and the Ganges: River basins under extreme pressure. Water Int. 2010, 35, 493–521. [Google Scholar] [CrossRef]
- Prasai, S.; Surie, M.D. Water and Climate Data in the Ganges Basin: Assessing Access to Information Regimes and Implications for Cooperation on Transboundary Rivers. Water Altern. Interdiscip. J. Water Politics Dev. 2015, 8, 20–35. [Google Scholar]
- Zawahri, N.A.; Hensengerth, O. Domestic environmental activists and the governance of the Ganges and Mekong Rivers in India and China. Int. Environ. Agreem. Politics Law Econ. 2012, 12, 269–298. [Google Scholar] [CrossRef]
- Ward, N.K.; Lynch, A.J.; Beever, E.A.; Booker, J.; Bouska, K.L.; Embke, H.; Houser, J.N.; Kocik, J.F.; Kocik, J.; Lawrence, D.J.; et al. Reimagining large river management using the Resist-Accept-Direct (RAD) framework in the Upper Mississippi River. Ecol. Process. 2023, 12, 48. [Google Scholar] [CrossRef]
- Miranda, L.E.; Coppola, G.; Hatcher, H.R.; Jargowsky, M.B.; Moran, Z.S.; Rhodes, M.C. A bird’s-eye view of reservoirs in the Mississippi Basin tips a need for large-scale coordination. Fish Fish. 2021, 22, 128–140. [Google Scholar] [CrossRef]
- West, G.H.; Kovacs, K.F.; Nayga, R.M. The Influence of a Climate Change Narrative on the Stated Preferences for Long-term Groundwater Management. Environ. Manag. 2022, 69, 61–74. [Google Scholar] [CrossRef]
- Hupfeld, R.N.; Phelps, Q.E.; Tripp, S.J.; Herzog, D.P. Mississippi River Basin Paddlefish Population Dynamics: Implications for the Management of a Highly Migratory Species. Fisheries 2016, 41, 600–610. [Google Scholar] [CrossRef]
- Kucharik, C. INFEWS/T1: Sustaining Food, Energy, and Water Security in Agricultural Landscapes of the Upper Mississippi River Basin. Available online: https://www.nsf.gov/awardsearch/showAward?AWD_ID=1855996&HistoricalAwards=false (accessed on 10 January 2023).
- Dare, L.; Evans, M. Understanding water governance: The case of Australia’s Murray-darling basin. Policy Stud. 2017, 38, 411–417. [Google Scholar] [CrossRef]
- Samnakay, N.; Alexandra, J.; Wyborn, C.A.; Bender, I. Climate adaptive water policy in Australia’s Murray Darling basin: Soft options or hard commitments? Ecol. Soc. 2024, 29, 1. [Google Scholar] [CrossRef]
- Papas, M. Supporting Sustainable Water Management: Insights from Australia’s Reform Journey and Future Directions for the Murray-Darling Basin. Water 2018, 10, 1649. [Google Scholar] [CrossRef]


| Domain | Indicators | Current Spatial and Temporal Resolution | Future Needs |
|---|---|---|---|
| Climate change | Wind speed, Relative humidity, Temperature, Wetland situation, Precipitation, Evapotranspiration | Weather stations, long time series | Watershed scale, forecast prediction |
| Human activities | Artificial water injection, Social and economic data, Changes in land cover | Statistical data, long time series | Process reduction, real-time simulation |
| Water resources | Surface water, groundwater, soil–water | Data are multi-source and difficult to couple. | monitoring on water circulation |
| Water environment | Chl-a, TP/TN, COD, DO, DOM, SOM, SPOM, Heavy metals, Salinity | Mainly based on sampling data, the time series is short. | Multi-index observation, long time series |
| Water ecology | Microorganisms, Phytoplankton, Zooplankton, Fish | Mainly based on sampling data, the time series is short. | Multi-means rapid monitoring and identification; regular observation |
Disclaimer/Publisher’s Note: The statements, opinions and data contained in all publications are solely those of the individual author(s) and contributor(s) and not of MDPI and/or the editor(s). MDPI and/or the editor(s) disclaim responsibility for any injury to people or property resulting from any ideas, methods, instructions or products referred to in the content. |
© 2024 by the authors. Licensee MDPI, Basel, Switzerland. This article is an open access article distributed under the terms and conditions of the Creative Commons Attribution (CC BY) license (https://creativecommons.org/licenses/by/4.0/).
Share and Cite
Dai, X.; A, Y.; Wang, L.; Xue, B.; Wang, Y.; Zhou, X.; Ma, G.; Li, H.; Chen, H.; Liao, T.; et al. Review on the Collaborative Research of Water Resources–Water Environment–Water Ecology in Hulun Lake. Water 2024, 16, 2508. https://doi.org/10.3390/w16172508
Dai X, A Y, Wang L, Xue B, Wang Y, Zhou X, Ma G, Li H, Chen H, Liao T, et al. Review on the Collaborative Research of Water Resources–Water Environment–Water Ecology in Hulun Lake. Water. 2024; 16(17):2508. https://doi.org/10.3390/w16172508
Chicago/Turabian StyleDai, Xianglong, Yinglan A, Libo Wang, Baolin Xue, Yuntao Wang, Xiyin Zhou, Guangwen Ma, Hui Li, He Chen, Tongkui Liao, and et al. 2024. "Review on the Collaborative Research of Water Resources–Water Environment–Water Ecology in Hulun Lake" Water 16, no. 17: 2508. https://doi.org/10.3390/w16172508