Article

Spatiotemporal Changes in the Quantity and Quality of Water in the Xiao Bei Mainstream of the Yellow River and Characteristics of Pollutant Fluxes

1
Yellow River Water Resources Protection Institute, Zhengzhou 450004, China
2
School of Water Conservancy and Transportation, Zhengzhou University, 100 Kexue Avenue, Zhengzhou 450001, China
3
Ecohydrology Research Group, Department of Earth and Environmental Sciences, University of Waterloo, 200 University Avenue West, Waterloo, ON N2L 3G1, Canada
*
Author to whom correspondence should be addressed.
Water 2024, 16(18), 2616; https://doi.org/10.3390/w16182616
Submission received: 7 August 2024 / Revised: 7 September 2024 / Accepted: 11 September 2024 / Published: 15 September 2024

Abstract

:
The Xiao Bei mainstream, located in the middle reaches of the Yellow River, plays a vital role in regulating the quality of river water. Our study leveraged 73 years of hydrological data (1951–2023) to investigate long-term runoff trends and seasonal variations in the Xiao Bei mainstream and its two key tributaries, the Wei and Fen Rivers. The results indicated a significant decline in runoff over time, with notable interannual fluctuations and an uneven distribution of runoff within the year. The Wei and Fen Rivers contributed 19.75% and 3.59% of the total runoff to the mainstream, respectively. Field monitoring was conducted at 11 locations along the investigated reach of Xiao Bei, assessing eight water quality parameters (temperature, pH, dissolved oxygen (DO), chemical oxygen demand (COD), ammonia nitrogen (NH3-N), total phosphorus (TP), permanganate index (CODMn), and 5-day biochemical oxygen demand (BOD5)). Our long-term results showed that the water quality of the Xiao Bei mainstream during the monitoring period was generally classified as Class III. Water quality parameters at the confluence points of the Wei and Fen Rivers with the Yellow River were higher compared with the mainstream. After these tributaries merged into the mainstream, local sections show increased concentrations, with the water quality parameters exhibiting spatial fluctuations. Considering the mass flux process of transmission of the quantity and quality of water, the annual NH3-N inputs from the Fen and Wei Rivers to the Yellow River accounted for 11.5% and 67.1%, respectively, and TP inputs accounted for 6.8% and 66.18%. These findings underscore the critical pollutant load from tributaries, highlighting the urgent need for effective pollution management strategies targeting these tributaries to improve the overall water quality of the Yellow River. This study sheds light on the spatiotemporal changes in runoff, water quality, and pollutant flux in the Xiao Bei mainstream and its tributaries, providing valuable insights to enhance the protection and management of the Yellow River’s water environment.

1. Introduction

The Yellow River, as the second longest river in China, spans over 5400 km and flows through nine provinces [1]. It originates in the Bayangela Mountains in the west and terminates in the Bohai Gulf. The entire river is commonly divided into three reaches by the Toudaoguai and Huayuankou gauging stations, where the middle reach plays a significant role in the basin water’s balances and availability for human use [2]. The middle reach has the most detrimental impact on water conditions, not only due to the inflow of the two largest tributaries, the Fen River and the Wei River. The mainstream also flows through the Loess Plateau, which passes highly erodible soils into the main water body, contributing up to 90% of the its sediments [2,3]. As an important source of water for the Northwest and North China regions, the Yellow River supports food production in major agricultural areas [4], energy for power generation, and basic industrial sectors such as forestry, animal husbandry, and fisheries [5]. Specifically, about 15% of the irrigated agricultural land and 12% of the water supply for the Chinese population rely on the Yellow River [6]. Therefore, the Yellow River holds significant importance in national socioeconomic development.
Despite its importance, the Yellow River Basin faces water resource challenges, centred on water shortages and high pollutant levels [7,8]. From 2000 to 2016, the average runoff measured at Lanzhou, Sanmenxia, and Huayuankou hydrometric stations was reduced by 20.77%, 60.39%, and 59.48%, respectively [6]. Alongside the decreasing runoff trend, the pollutant load in the mainstream of the Yellow River has seen significant contributions from both discharge points and tributaries [1]. From the 1980s to 2017, the discharge of wastewater almost doubled from 21.7 to 44.94 million tons, while the average rate of water flow decreased continuously [9]. Most tributaries in the middle and lower reaches carry notable amounts of pollutants and contribute low-quality water to the mainstream [1,9]. Among these, the Jindi River in the lower reaches exhibits particularly poor water quality, with levels of total phosphorus (TP), total nitrogen (TN), biochemical oxygen demand (BOD5), chemical oxygen demand (COD), total organic carbon (TOC), and coliform bacteria exceeding national standards by 155%, 1%, 97.5%, 35.5%, 114.2%, and 80%, respectively [9].
Anthropogenic activities, including excessive development of water resources and substantial industrial and agricultural discharge, have caused the accumulation of pollution levels, posing a serious threat to the ecological and socioeconomic stability of the region [8,10]. The construction of cascade dams can have significant impacts on the entire river basin, altering natural flow regimes, sediment transport, and nutrient dynamics [11,12,13,14]. Since 1976, the construction of cascade dams along the upper stretch of the Yellow River has notably transformed its original hydrological characteristics [15]. Specifically, the dams have reduced the maximum monthly difference in streamflow from 430 to 115 m3/s, and decreased differences in the sand concentration from 0.52 to 0.39 kg/m3 between 1977 and 2006 [16]. The Xiaolangdi Reservoir (XLDR) has significantly altered the hydrology and nutrient dynamics in the Yellow River, affecting nutrient levels upstream and downstream, with nutrient retention efficiencies of −1.4% for dissolved inorganic nitrogen (DIN), −11% for dissolved inorganic phosphorus (DIP), and −7% for dissolved silica (DSi) [17]. Furthermore, agriculture, industry, and urban residential areas account for 40%, 26%, and 16% of the reduced amount of water, respectively, with industrial wastewater, domestic wastewater, phosphorus, and nitrogen accounting for 66%, 21%, 8%, and 5% of the influence on water quality, respectively [6]. Combined with the effects of global warming, rising temperatures may further decrease the ability of natural water bodies to assimilate oxygen-demanding wastes [18,19]. Despite recent improvements in the Yellow River’s water quality and ecological vulnerability, ongoing monitoring remains crucial [20,21,22].
Therefore, investigating runoff, water quality indicators, and pollutant dynamics in the Yellow River Basin is crucial for developing effective water management strategies. Understanding the spatiotemporal variations in these factors provides insights into the underlying causes of pollution and helps identify critical intervention points for improving the water quality. This knowledge is essential for ensuring the sustainable use of water resources, protecting ecosystem services, and ensuring compliance with water quality standards.
In light of these considerations, this study focused on the spatiotemporal changes in the quantity and quality of water in the Xiao Bei mainstream in the middle reach of the Yellow River. Three major investigations were included as follows. (1) The long-term variations in the average annual and intra-annual runoff at both the start and end of the Xiao Bei mainstream, as well as the Wei River and Fen River tributaries, were studied, spanning 73 years from 1951 to 2023. (2) The midstream section exhibited the highest concentrations of over-standard indexed pollutants for ammonia nitrogen, chemical oxygen demand (COD), and permanganate index (CODMn) [9]. According to the specified national indices in the “Surface Water Environment Quality Standard” (GB 3838-2002) [23], these pollutants are key metrics for assessing river water’s quality. Therefore, the study aimed to measure parameters including temperature, pH, dissolved oxygen (DO), COD, ammonia nitrogen (NH3-N), total phosphorus (TP), CODMn, and 5-day biochemical oxygen demand (BOD5) at 11 sampling points along the Xiao Bei mainstream during 28–30 August 2023. These test results allowed an analysis of the spatial trends along the Xiao Bei water body. (3) We examined the monthly changes in TP and NH3-N fluxes in the Xiao Bei mainstream for 2021 to gain insights into intra-annual variations in the pollutant level. These data aimed to provide a comprehensive baseline to elucidate the patterns of water status and pollution in the Yellow River.

2. Materials and Methods
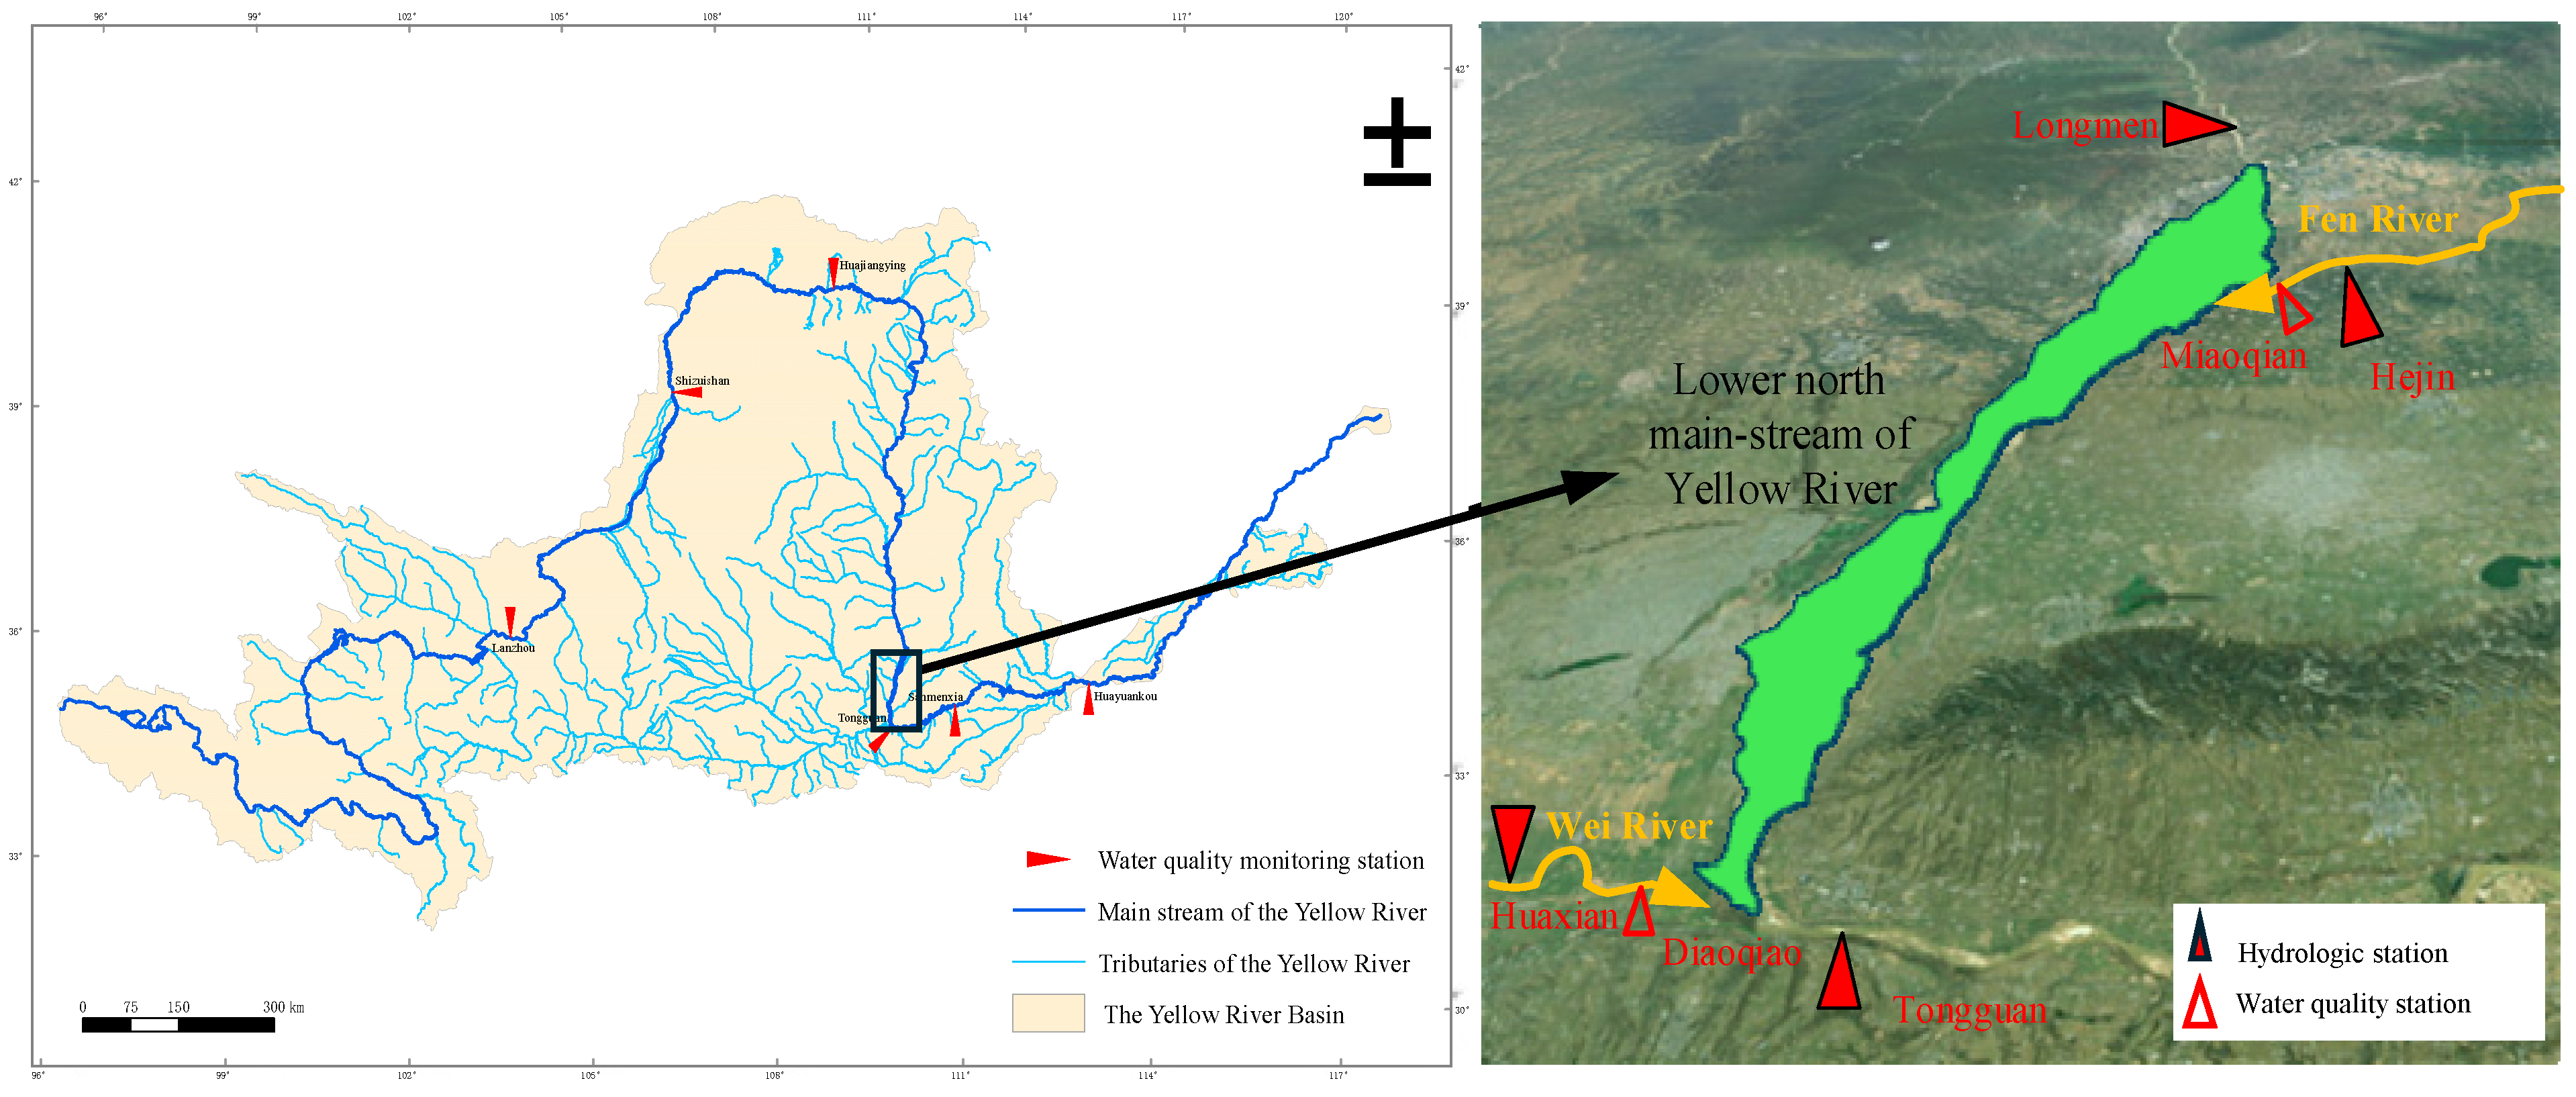
2.1. Study Area

The studied segment of the Yellow River, spanning from Longmen to Tongguan, lies in the middle reaches of the river, and this section extends over 132.5 km, constituting only 2.42% of the Yellow River’s total length. It forms the lower part of the northern mainstream, known as the Xiao Bei mainstream, stretching from Tuoketuo in Inner Mongolia to Tongguan (Figure 1).
The Xiao Bei mainstream is situated above the Xiaolangdi and Sanmenxia reservoirs and the entire lower Yellow River, lying below the outlet of the Yellow River’s longest continuous gorge. This positioning gives it a critical role in connecting the upper and lower reaches, making it highly significant in the management and development of the Yellow River. This river section is characterized by its wide and shallow channel, numerous sandbars, and braided streams, exhibiting significant variability in its erosion and deposition patterns. The main channel frequently shifts, making it a typical wandering, sediment-laden river. The channel’s width varies dramatically, from as wide as 18 km to as narrow as 3 km, resembling a dumbbell shape in plan view. Historically, there has been a saying, “Thirty years east of the river, thirty years west of the river”, reflecting the river’s unpredictable nature. All major management challenges of the Yellow River are concentrated in this Xiao Bei mainstream.
From the upper to the lower reaches, the left bank of the Xiao Bei mainstream receives inflows from tributaries such as the Fen River and Sushui River, while the right bank is joined by the Zhuoshui, Xushui, Jinshui, and Wei Rivers. Among these, the Wei and Fen Rivers significantly impact the mainstream. The Wei River is the largest tributary of the Yellow River, entering the Yellow River at Tongguan County in Shaanxi Province, and is a major source of sediment. The Fen River, the second-largest tributary, flows within Shanxi Province and joins the Yellow River near Miaoqian Village in Wanrong County.

2.2. Runoff Data Collection

Our study collected data from various sources to conduct the analysis. The runoff data spanning 73 years of the Longmen and Tongguan hydrological stations were obtained from the Hydrological Yearbook of the People’s Republic of China from 1951 to 2020, Volume 4: Hydrological Data of the Yellow River Basin. The runoff data from 2020 to 2023 were directly measured by our team. The concentrations of water quality parameters along the Xiao Bei mainstream were measured through field tests, with details provided in Section 2.3. Lastly, the monthly variations in the TP and NH3-N pollutant fluxes for 2021 were derived from the Hydrological Yearbook of the People’s Republic of China (2021) and the concentration data were from the National Surface Water Quality Data Release System”.

2.3. Water Sampling and Analysis

2.3.1. Sampling Sites and Procedures

Water samples were collected from the Xiao Bei tributary river section on 28–30 August 2023. Selection of the sampling points was guided by several key considerations to ensure comprehensive and representative monitoring of water quality. The goal was to use the fewest possible points to obtain sufficient environmental information while considering practical feasibility during sampling. Specific points included background sections, control sections, and estuary sections for watersheds or water systems. For administrative regions, the points included background sections for water sources or entry points for transboundary rivers. Selected points avoided stagnant water zones, return flow areas, and sewage outlets, preferring stable, straight river sections with a smooth flow and wide water surfaces. Monitoring points were aligned with the hydrological measurement sections to integrate monitoring of the water’s quality and quantity. The layout also considered long-term monitoring needs, socioeconomic development, and current monitoring requirements. In synchronized watershed monitoring, the points were determined on the basis of watershed plans and pollution sources’ compliance targets. According to these considerations, 11 sampling points were set up along a 237 km river section of the Xiao Bei mainstream for on-site monitoring of water quality, as shown in Table 1.
The sampling procedure ensured the collection of representative samples by avoiding disturbance of the sediment, positioning the sampling points accurately, and using GPS for precise location tracking. During sampling, careful documentation was maintained using the “Water Quality Sampling Record Form”.

2.3.2. Sample Collection and Determination

Water samples were analyzed for parameters including temperature, pH, DO, COD, CODMn, BOD5, NH3-N, and TP. Samples were transported in a dedicated vehicle, protected from sunlight and physical damage, and the microbiological samples were transported in a cold, dark environment to reach the laboratory within 6 h. Each sample was tested three times to ensure accuracy, and the average value was taken as the result.
Water temperature was measured using a thermometer according to GB/T 13195-1991 The thermometer was inserted into the water at the desired depth, left for 5 min, and then read. DO was measured using an electrochemical probe as per HJ 506-2009, where oxygen permeated a selective membrane, creating a current proportional to the oxygen concentration. The pH was measured using a pH meter and electrodes according to HJ 1147-2020, with the calibration and measurement procedures involving standard buffer solutions. In the laboratory, COD was determined using the dichromate method (HJ 828-2017) by refluxing the sample with dichromate, cooling, and titrating. The permanganate index was measured according to GB 11892-89 by oxidizing the sample with permanganate in an acidic medium, reducing excess permanganate, and titrating with permanganate. BOD5 was measured using the dilution and inoculation method (HJ 505-2009) by incubating the samples and measuring the dissolved oxygen before and after incubation. NH3-N was measured using the colorimetric method of Nessler’s reagent (HJ 535-2009) by preparing a standard series, treating the samples, and measuring the absorbance at 420 nm. TP was determined using the ammonium molybdate spectrophotometric method (GB/T 11893-1989) by digesting the samples, adding reagents, and measuring the absorbance at 700 nm.

2.3.3. Quality Assurance

The sampling process adhered to the guidelines provided in several key documents, including the Environmental Quality Standards for Surface Water (GB3838-2002), the Environmental Water Quality Monitoring Quality Assurance Manual (Second Edition), the Technical Guidelines for Water Quality Sampling (HJ/T 494-2009), the Technical Specifications for Environmental Quality Monitoring of Surface Water (HJ/T 91.2-2022), and the Technical Regulations for the Preservation and Management of Water Quality Sampling Samples (HJ/T 493-2009).
Quality assurance and quality control for the laboratory analyses were performed following the standard methods outlined in the Standard Methods for the Examination of Water and Wastewater of China (HJ/T 91-2002). Blank samples were used at all monitoring stations to ensure the accuracy of the analyses. The samples were preserved and transported according to the specified guidelines to prevent contamination or degradation. The samples were also properly labeled and stored to maintain their integrity, including using specific preservatives and maintaining appropriate temperatures. The samples were transported using dedicated vehicles to prevent exposure to sunlight and to ensure that they reached the laboratory within the specified timeframe.

3. Results

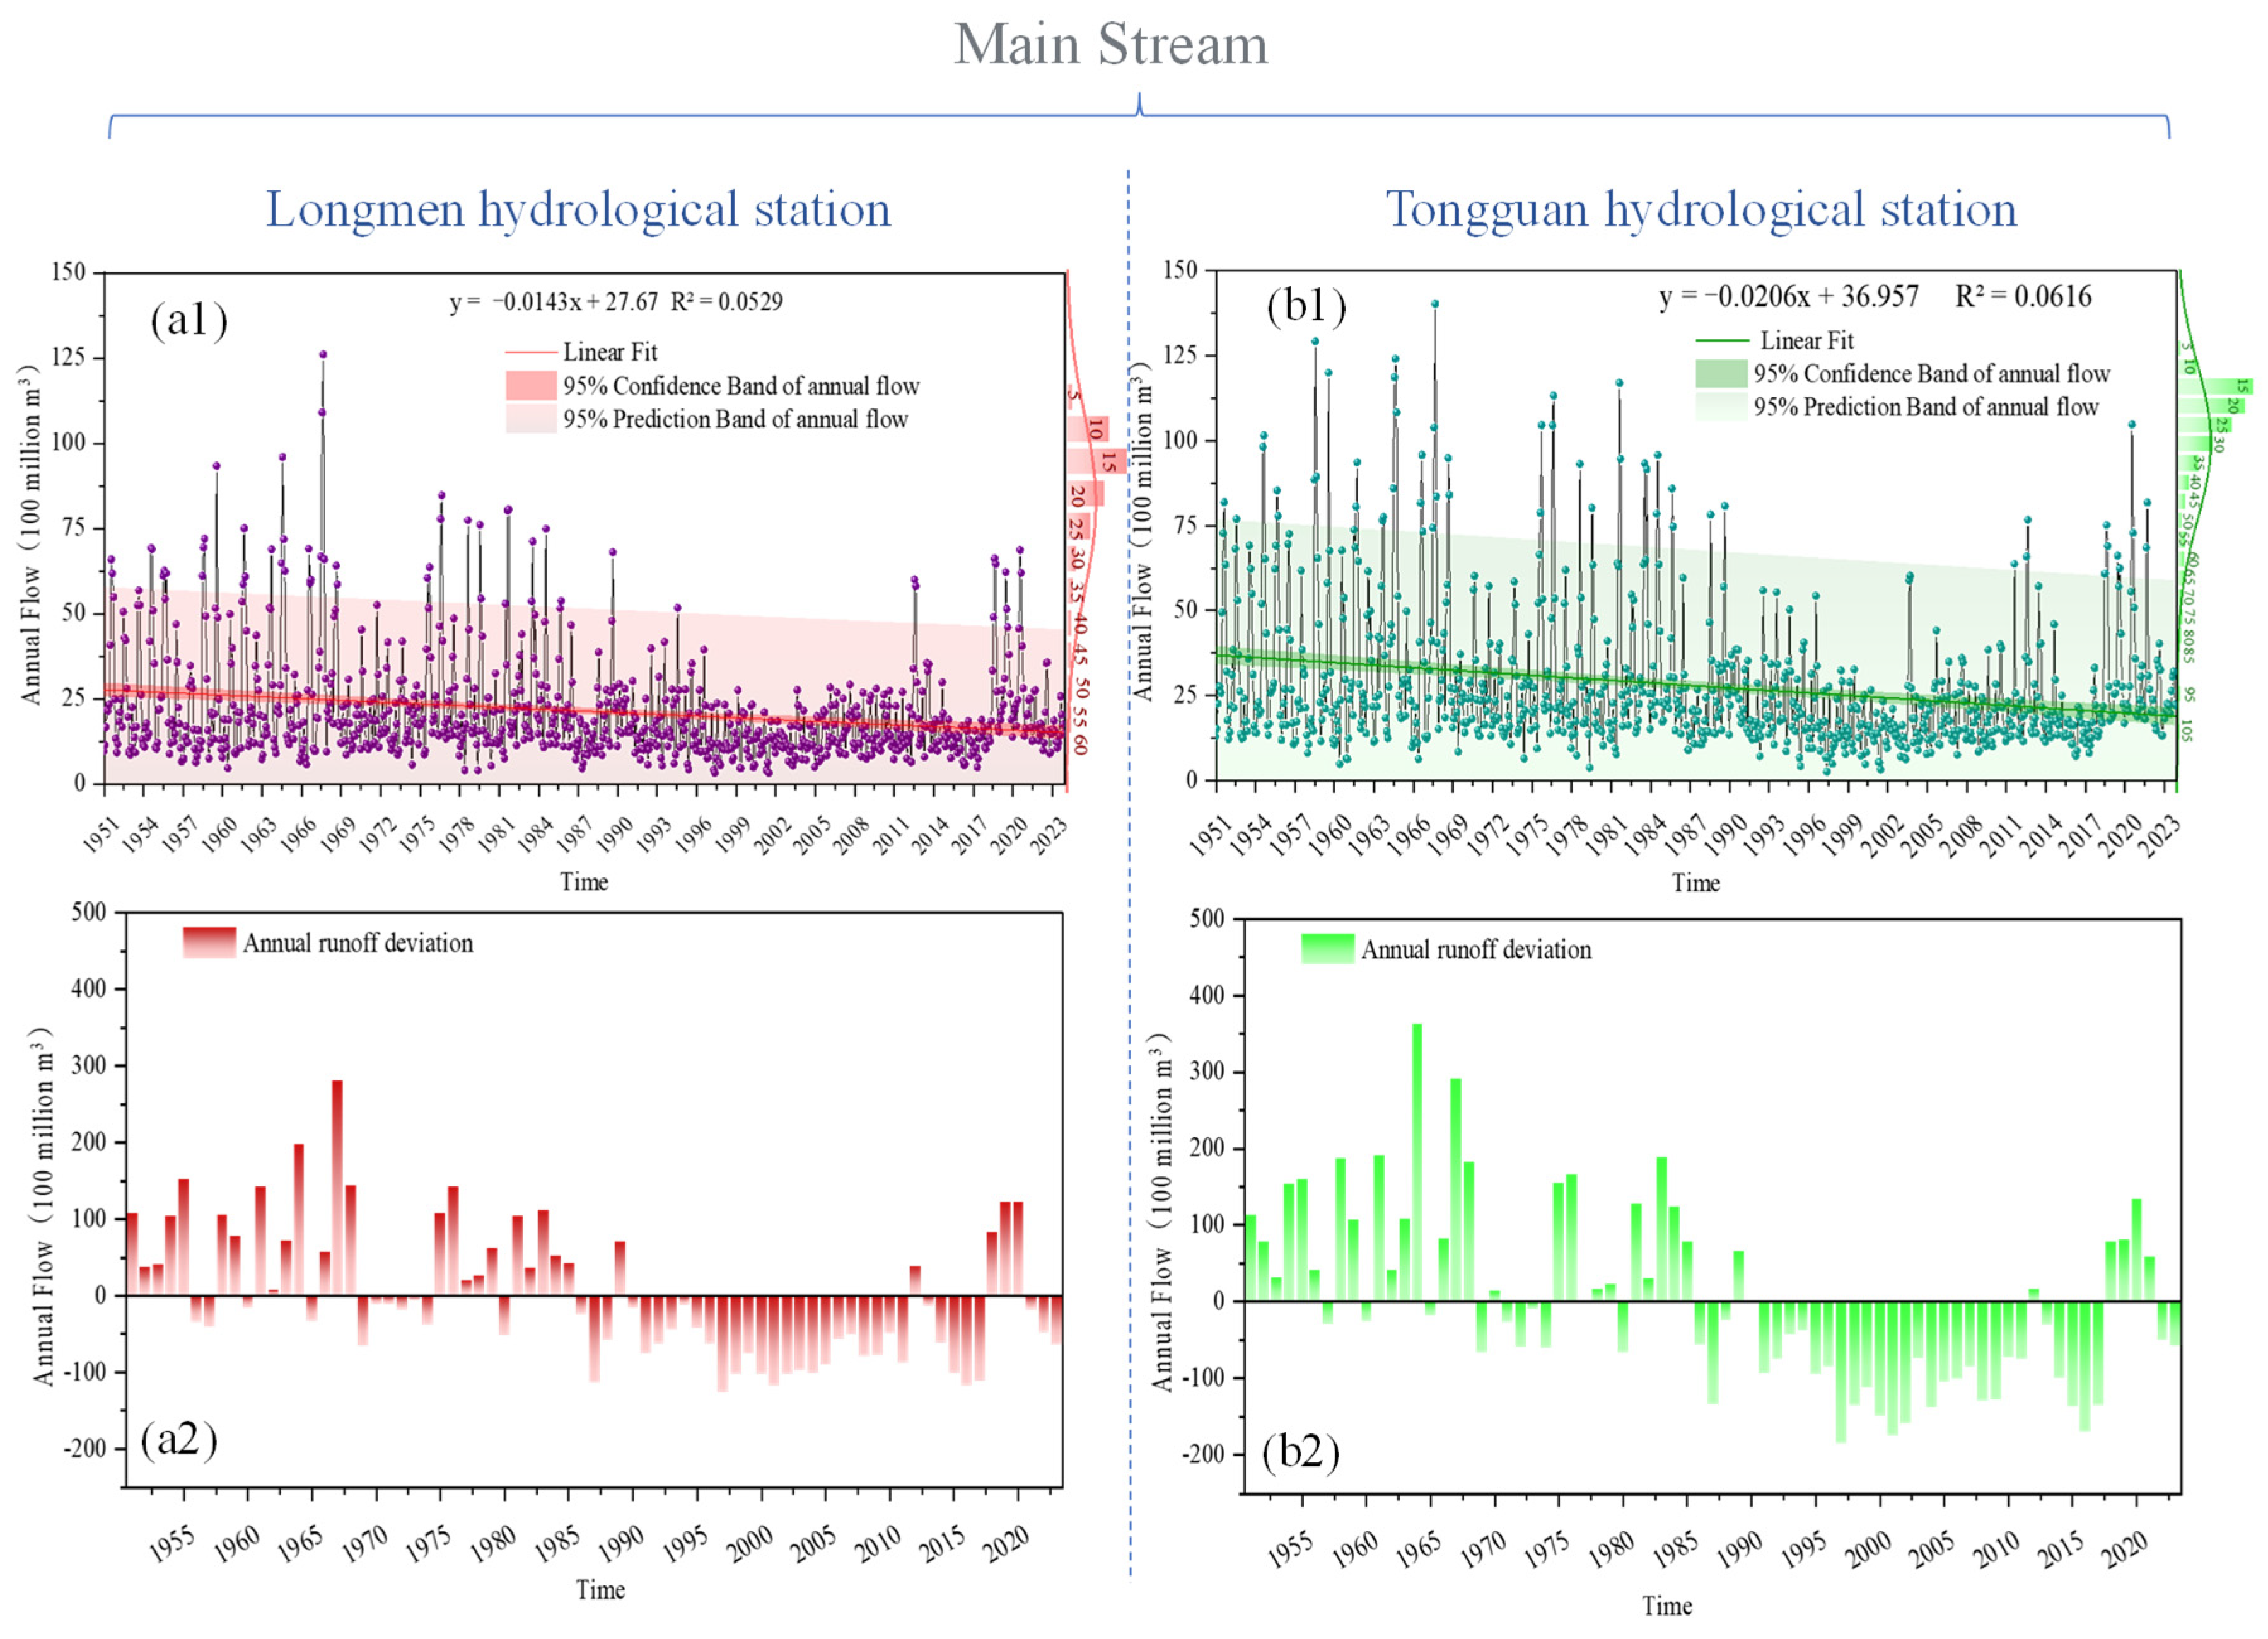
3.1. Mainstream Section

3.1.1. Evolution of the Long-Term Runoff Series

According to 73 years of measured data from 1951 to 2023, the average annual runoff measured at the Longmen hydrological station, located in the initial section of the Xiao Bei mainstream, was 25.638 billion cubic meters, with a maximum of 53.729 billion cubic meters (1967) and a minimum of 13.019 billion cubic meters (1997). This represented a peak-to-trough ratio of 4.13. Significant interannual variability existed, with large fluctuations each year (Figure 2(a1)). Overall, there was a decreasing trend in runoff (y = −0.0143x + 27.67, R2 = 0.0529, Figure 2(a1), where y represents the annual runoff in billion cubic meters and x represents the year.), with a sharp decline in 1986. The downward trend continued and remained at constantly low runoff volumes after 1986, which was evident in the comparison of the runoff with the average for each year (Figure 2(a2)). Except for a few positive deviations that mainly occurred around 2019, negative deviations from the average dominant were observed in the latter half of the investigated years. From 1986 to 2023, runoff decreased by 33.8% compared with 1951–1985, with a more significant reduction reaching 48.9% during the flood season, primarily due to the construction of reservoir groups upstream, which mitigated flood-related runoff.
Based on the same series of annual statistics, the average annual runoff at the Tongguan hydrological station, located at the end of the Xiao Bei mainstream, was 33.448 billion cubic meters, with a maximum of 69.734 billion cubic meters (1964) and a minimum of 14.936 billion cubic meters (1997), demonstrating a difference of 4.67-fold. The runoff trend at the Tongguan section was similar to those at Longmen, also showing a decreasing trend (y = −0.0206x + 36.957, R2 = 0.0616, Figure 2(b1), where y again represents the annual runoff in billion cubic meters and x represents the year). From 1986 to 2023, runoff decreased by 36% compared with 1951–1985, with a reduction of 48.3% during the flood season. Meanwhile, Tongguan’s downstream station had overall higher runoff volumes than the upstream Longmen station from year to year, accompanied by greater variability.
The measured runoff at both the Longmen and Tongguan stations further decreased after 1995. This marked the beginning of a prolonged and extensive dry period for the Yellow River mainstream. From 1996 to 2011, the average runoff at Longmen and Tongguan was 17.055 billion cubic meters and 21.563 billion cubic meters, respectively. These figures were significantly lower than the long-term averages of 8.583 billion cubic meters for Longmen and 11.875 billion cubic meters for Tongguan.
Despite a prolonged period of low runoff, it was noteworthy that from 2018 to 2020, the Longmen hydrological station experienced a significant increase in runoff, surpassing the average levels and stabilizing at approximately 30 billion cubic meters. Similarly, the Tongguan station observed a comparable rise in runoff from 2018 to 2021, with values ranging from 35 to 40 billion cubic meters.

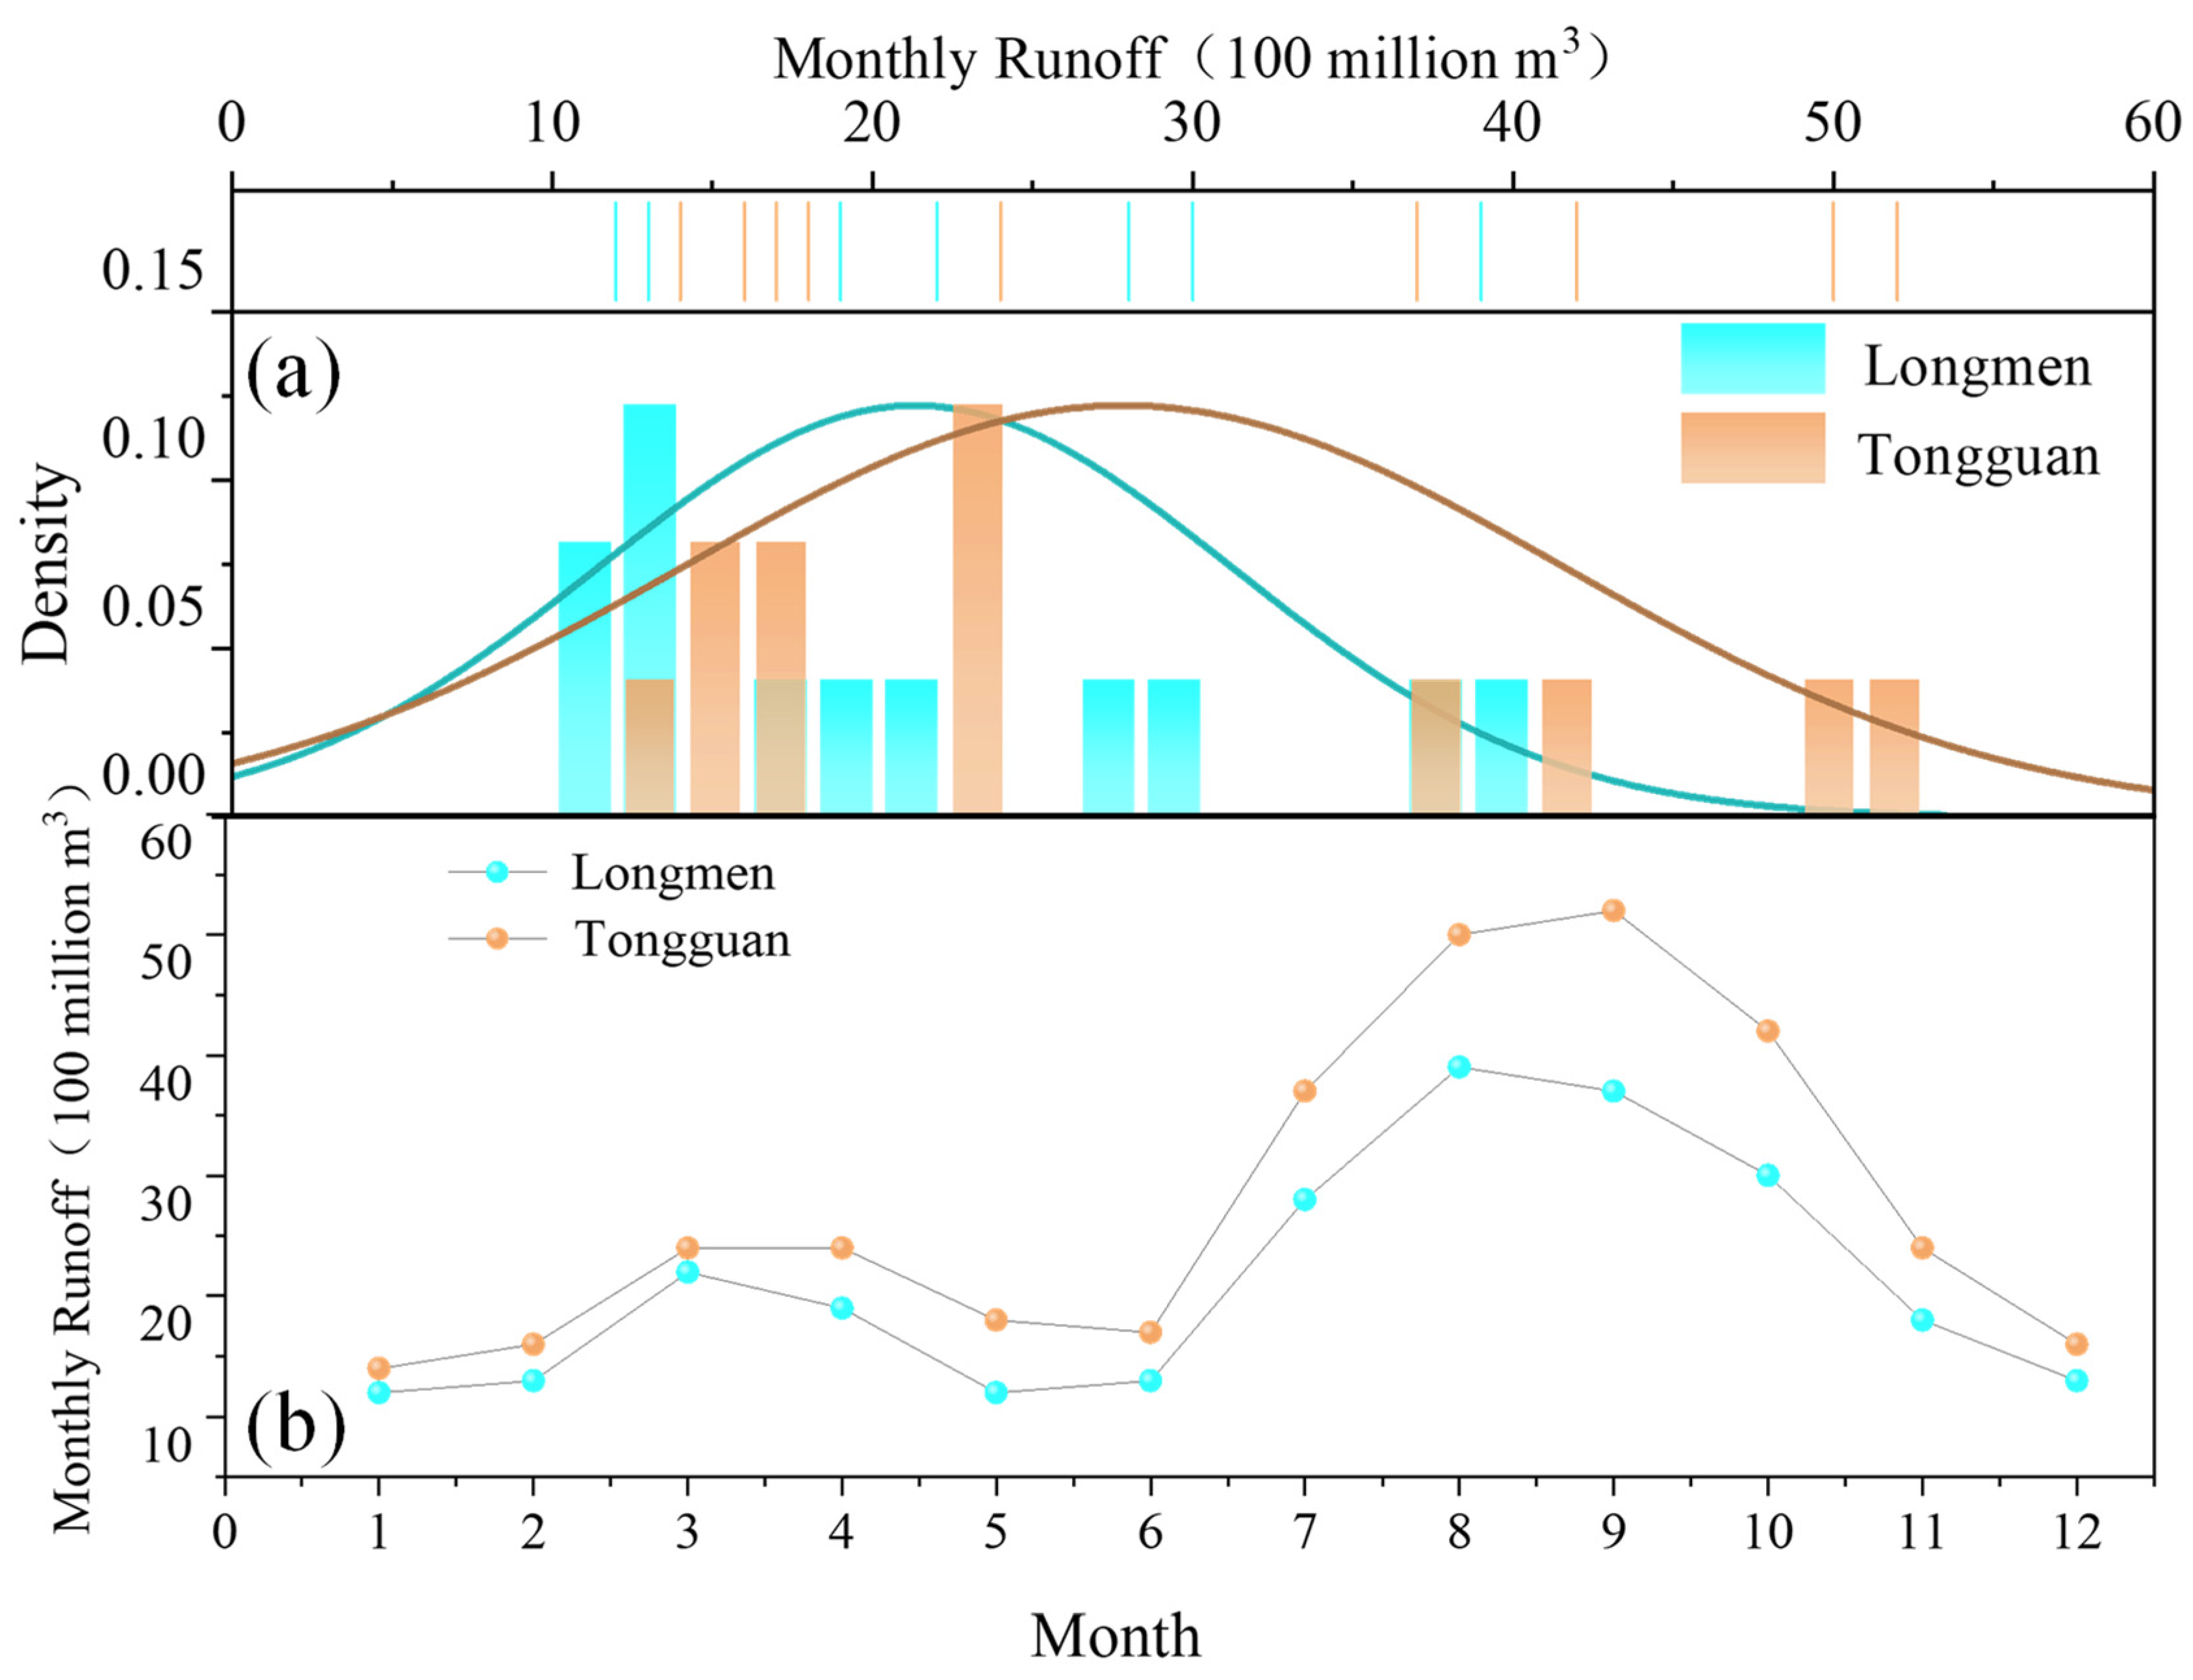
3.1.2. Intra-Annual Variations in Runoff

The distribution of runoff within the year was uneven in the Xiao Bei mainstream, characterized by seasonal peaks and troughs. Figure 3 illustrates the distribution of the long-term average measured runoff for the Longmen (blue) and Tongguan (orange) stations over a period of 73 years. At Longmen, the highest monthly runoff occurred in August, reaching 3.9 billion cubic meters. In contrast, Tongguan experienced its peak runoff in September, with a value of 5.2 billion cubic meters. The lowest runoff was observed in January for both stations, with Longmen recording 1.2 billion cubic meters and Tongguan recording 1.4 billion cubic meters. The peak runoff months from July to October were particularly significant in both locations, accounting for 52% of the annual runoff at Longmen and 54% at Tongguan. This seasonal concentration highlighted the uneven distribution of runoff throughout the year. A notable spring flood occurred in March for both locations, driven by the melting of ice in the upper Yellow River. During this period, Longmen recorded a runoff of 2.2 billion cubic meters, while Tongguan recorded 2.4 billion cubic meters.
If we compare the data from two hydrological stations, the downstream Tongguan station witnessed higher average runoff each month, as demonstrated by the higher frequency of high-value data in the distribution. The higher runoff at Tongguan station aligned with the annual evolutionary trend mentioned in the previous section.

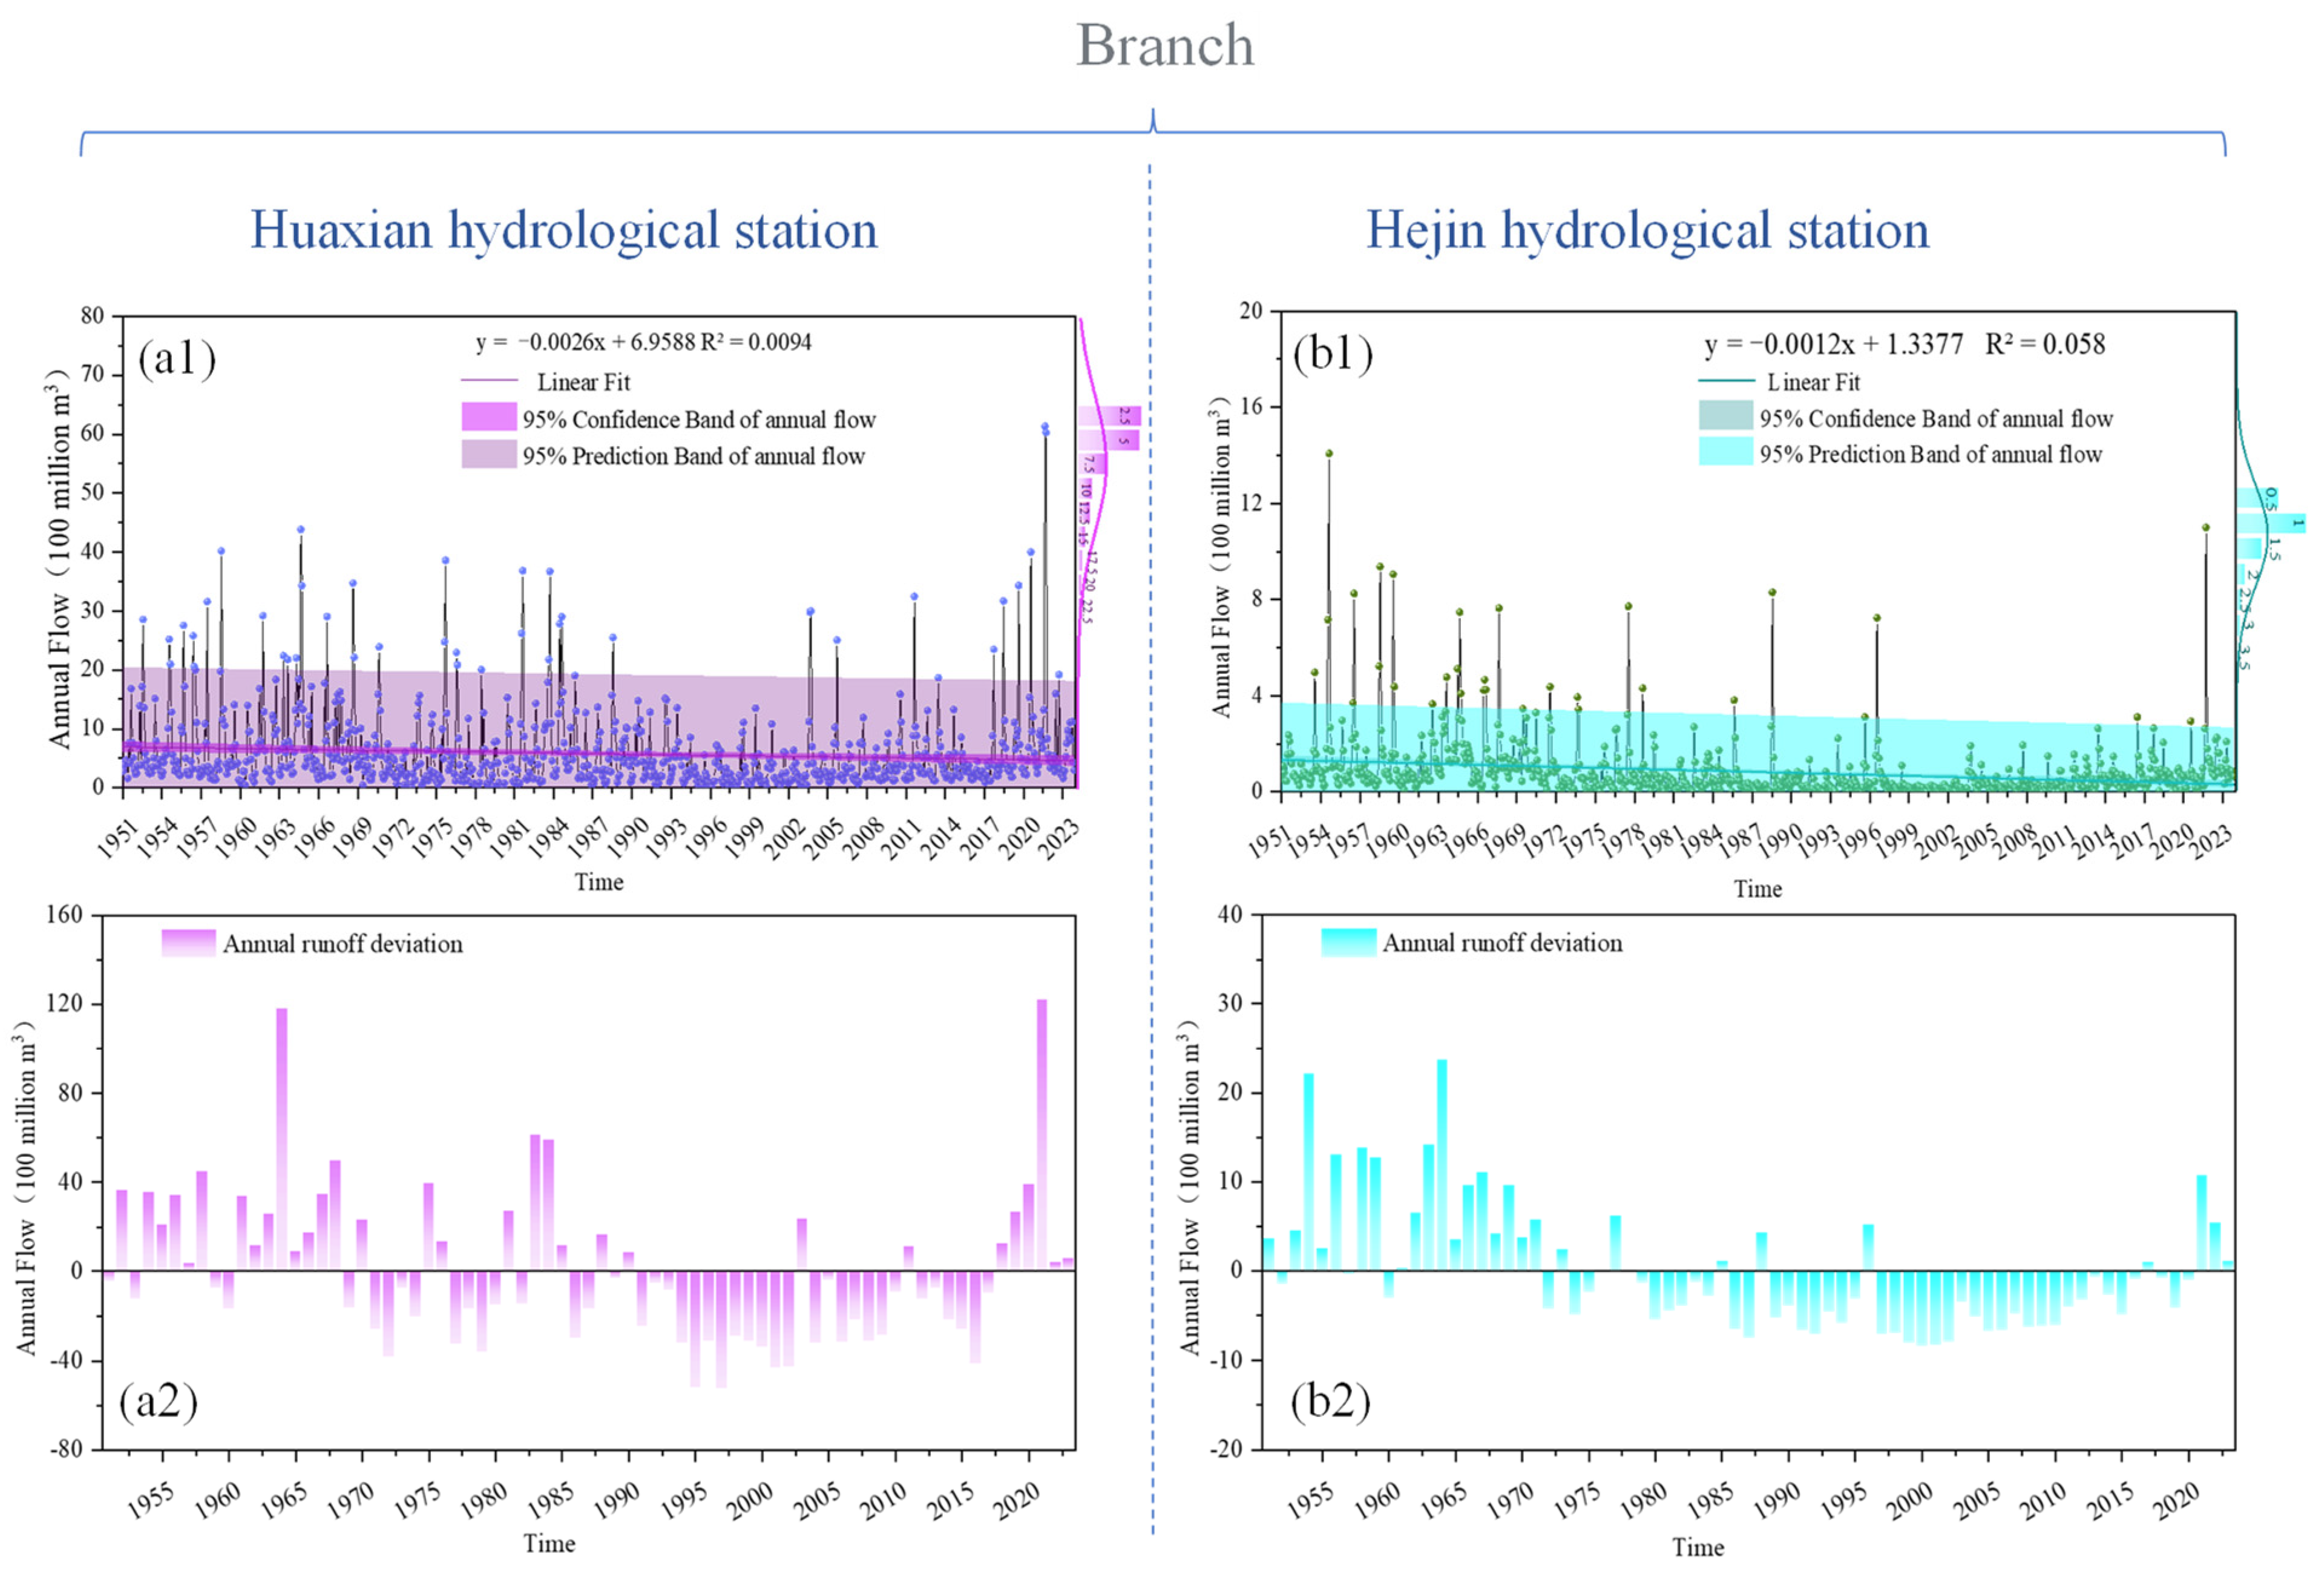
3.2. Major Tributaries

3.2.1. Evolution of the Long-Term Runoff Series

The average annual runoff at the Huaxian hydrological station on the Wei River from 1951 to 2023 was 6.937 billion cubic meters, while at the Hejin hydrological station on the Fen River, it was 0.987 billion cubic meters. The peak-to-trough ratios for the annual runoff extremes at Huaxian and Hejin were 11.40 and 22.24, respectively, with coefficients of variation (Cv) of 0.53 and 0.81. The long-term data indicated an overall decreasing trend in runoff for both the Wei (y = −0.0026x + 6.9588, R2 = 0.0094, Figure 4(a1)) and Fen Rivers (y = −0.0012x + 1.3377, R2 = 0.058, Figure 4(b1), where y represents the runoff and x is the time in years.
Both hydrological stations showed lower values in the second half of the measurement year and continued transitioning from positive to negative deviations in annual runoff (Figure 4(a2,b2)). A drastic increase in flow was also noted at the Huaxian hydrological station in 2018, peaking in 2021. The same low-to-high turnaround was observed at the Hejin station in similar years. However, the two tributaries exhibited significant differences in runoff, with the Wei River showing much higher values than the Fen River. This disparity was evident in the average values, maximum values, and overall distribution of runoff.

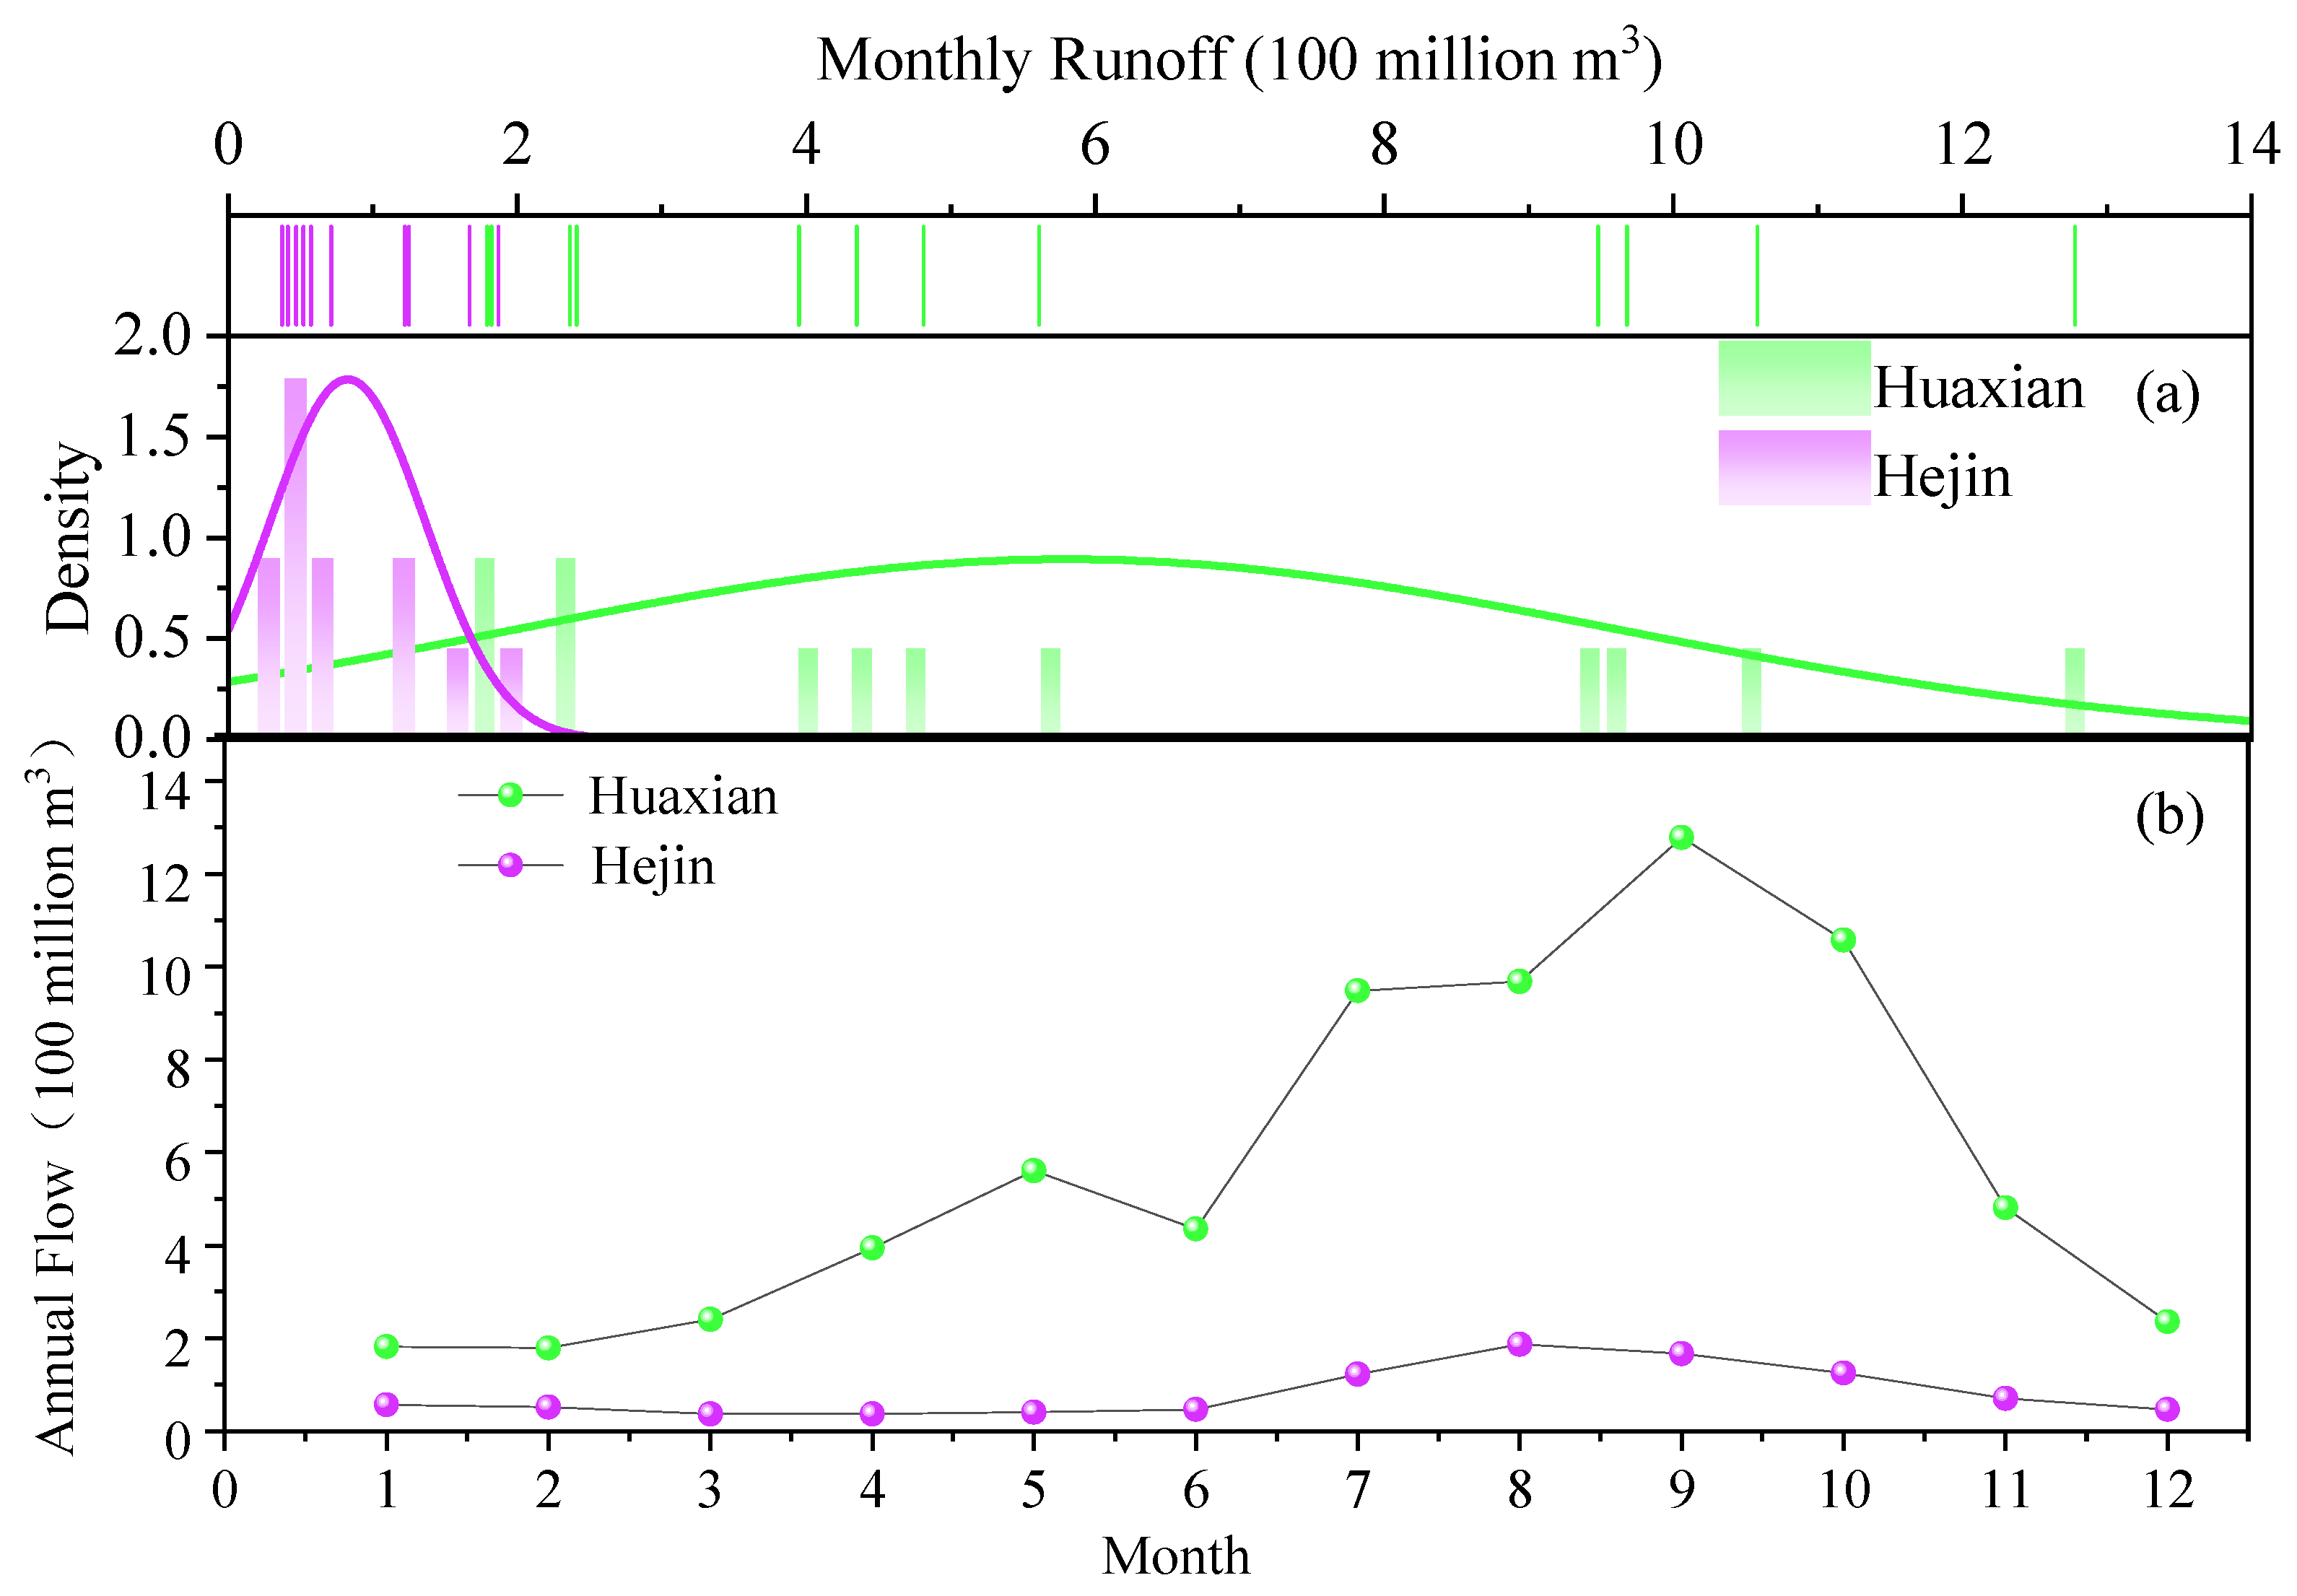
3.2.2. Intra-Annual Variations in Runoff

The intra-annual distribution of average monthly runoff over 73 years at Huaxian and Hejin is shown in Figure 5. In Figure 5a, the centered distribution below 2 billion cubic meters measured at Hejin station indicated relatively small intra-annual variations with low runoff in the Fen River. In contrast, the scattered distribution, ranging widely from around 2 to 13 billion cubic meters, suggested significant fluctuations and higher runoff volumes in the Wei River.
In Figure 5b, we can observe that the highest monthly runoff at Huaxian and Hejin occurred in September (1.278 billion cubic meters) and August (0.187 billion cubic meters), respectively; the lowest was in February (0.179 billion cubic meters at Huaxian) and March–April (0.037 billion cubic meters at Hejin). The surface runoff in the Wei and Fen Rivers was generated by rainfall, with the flood season (July to October) accounting for 61% of the annual runoff at both Huaxian and Hejin.

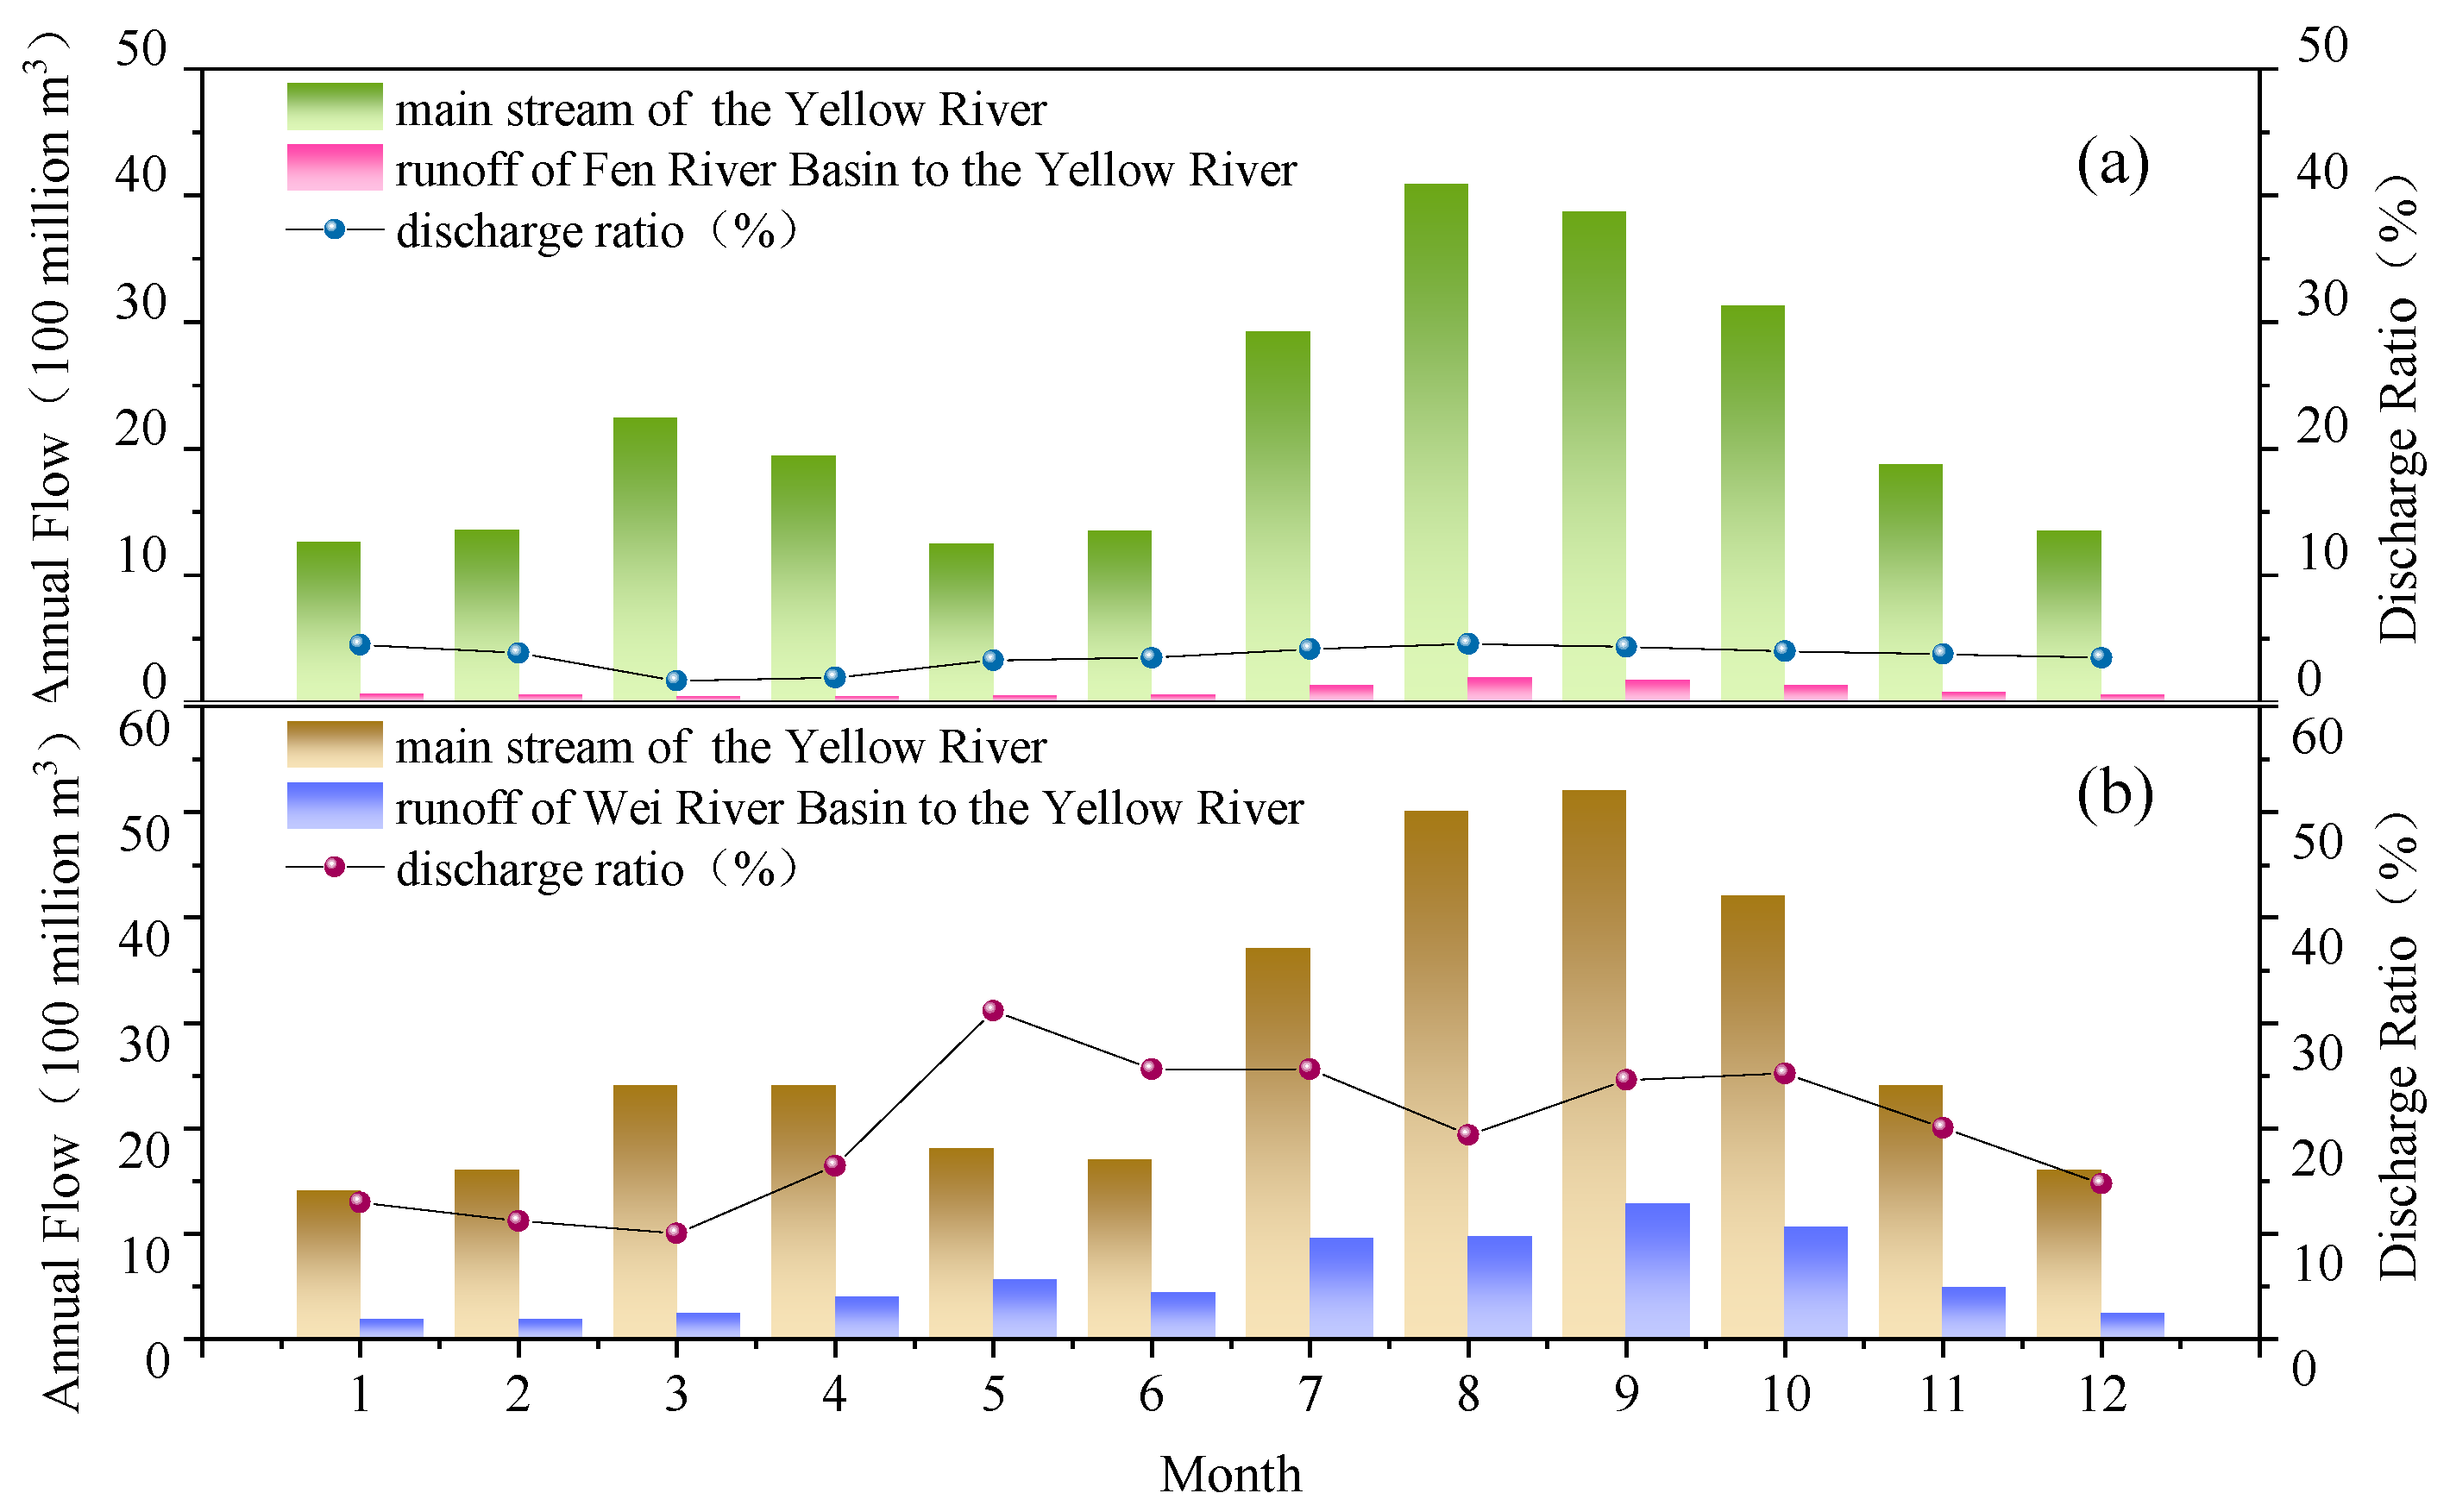
3.2.3. Intra-Annual Contribution Ratios of Tributaries’ Runoff

The lower reaches of the Wei River transition from a meandering to a braided channel, with a gradient of 0.1–0.8‰. It is wide at the top and narrow at the bottom, with the river mouth having a width of approximately 0.2 km. Figure 6 provides a comparison of the average monthly runoff over the 73 years between the Yellow River mainstream and the Wei River and Fen River tributaries. The line plots showing the monthly contribution ratio of the tributaries to the mainstream are also included. Specifically, the monthly contribution ratio of the Wei River to the Yellow River mainstream’s runoff ranged from 10.04% to 31.17%, averaging 19.75%. The runoff of the Fen River is relatively small compared with the Wei River, forming a wide and shallow river segment at the confluence with the Yellow River. The monthly contribution ratio of the Fen River to the Yellow River mainstream’s runoff ranged from 1.65% to 4.58%, averaging 3.59%. Considering the low runoff volumes of the Fen River discovered in the previous section, the contribution ratio to the mainstream was correspondingly smaller.

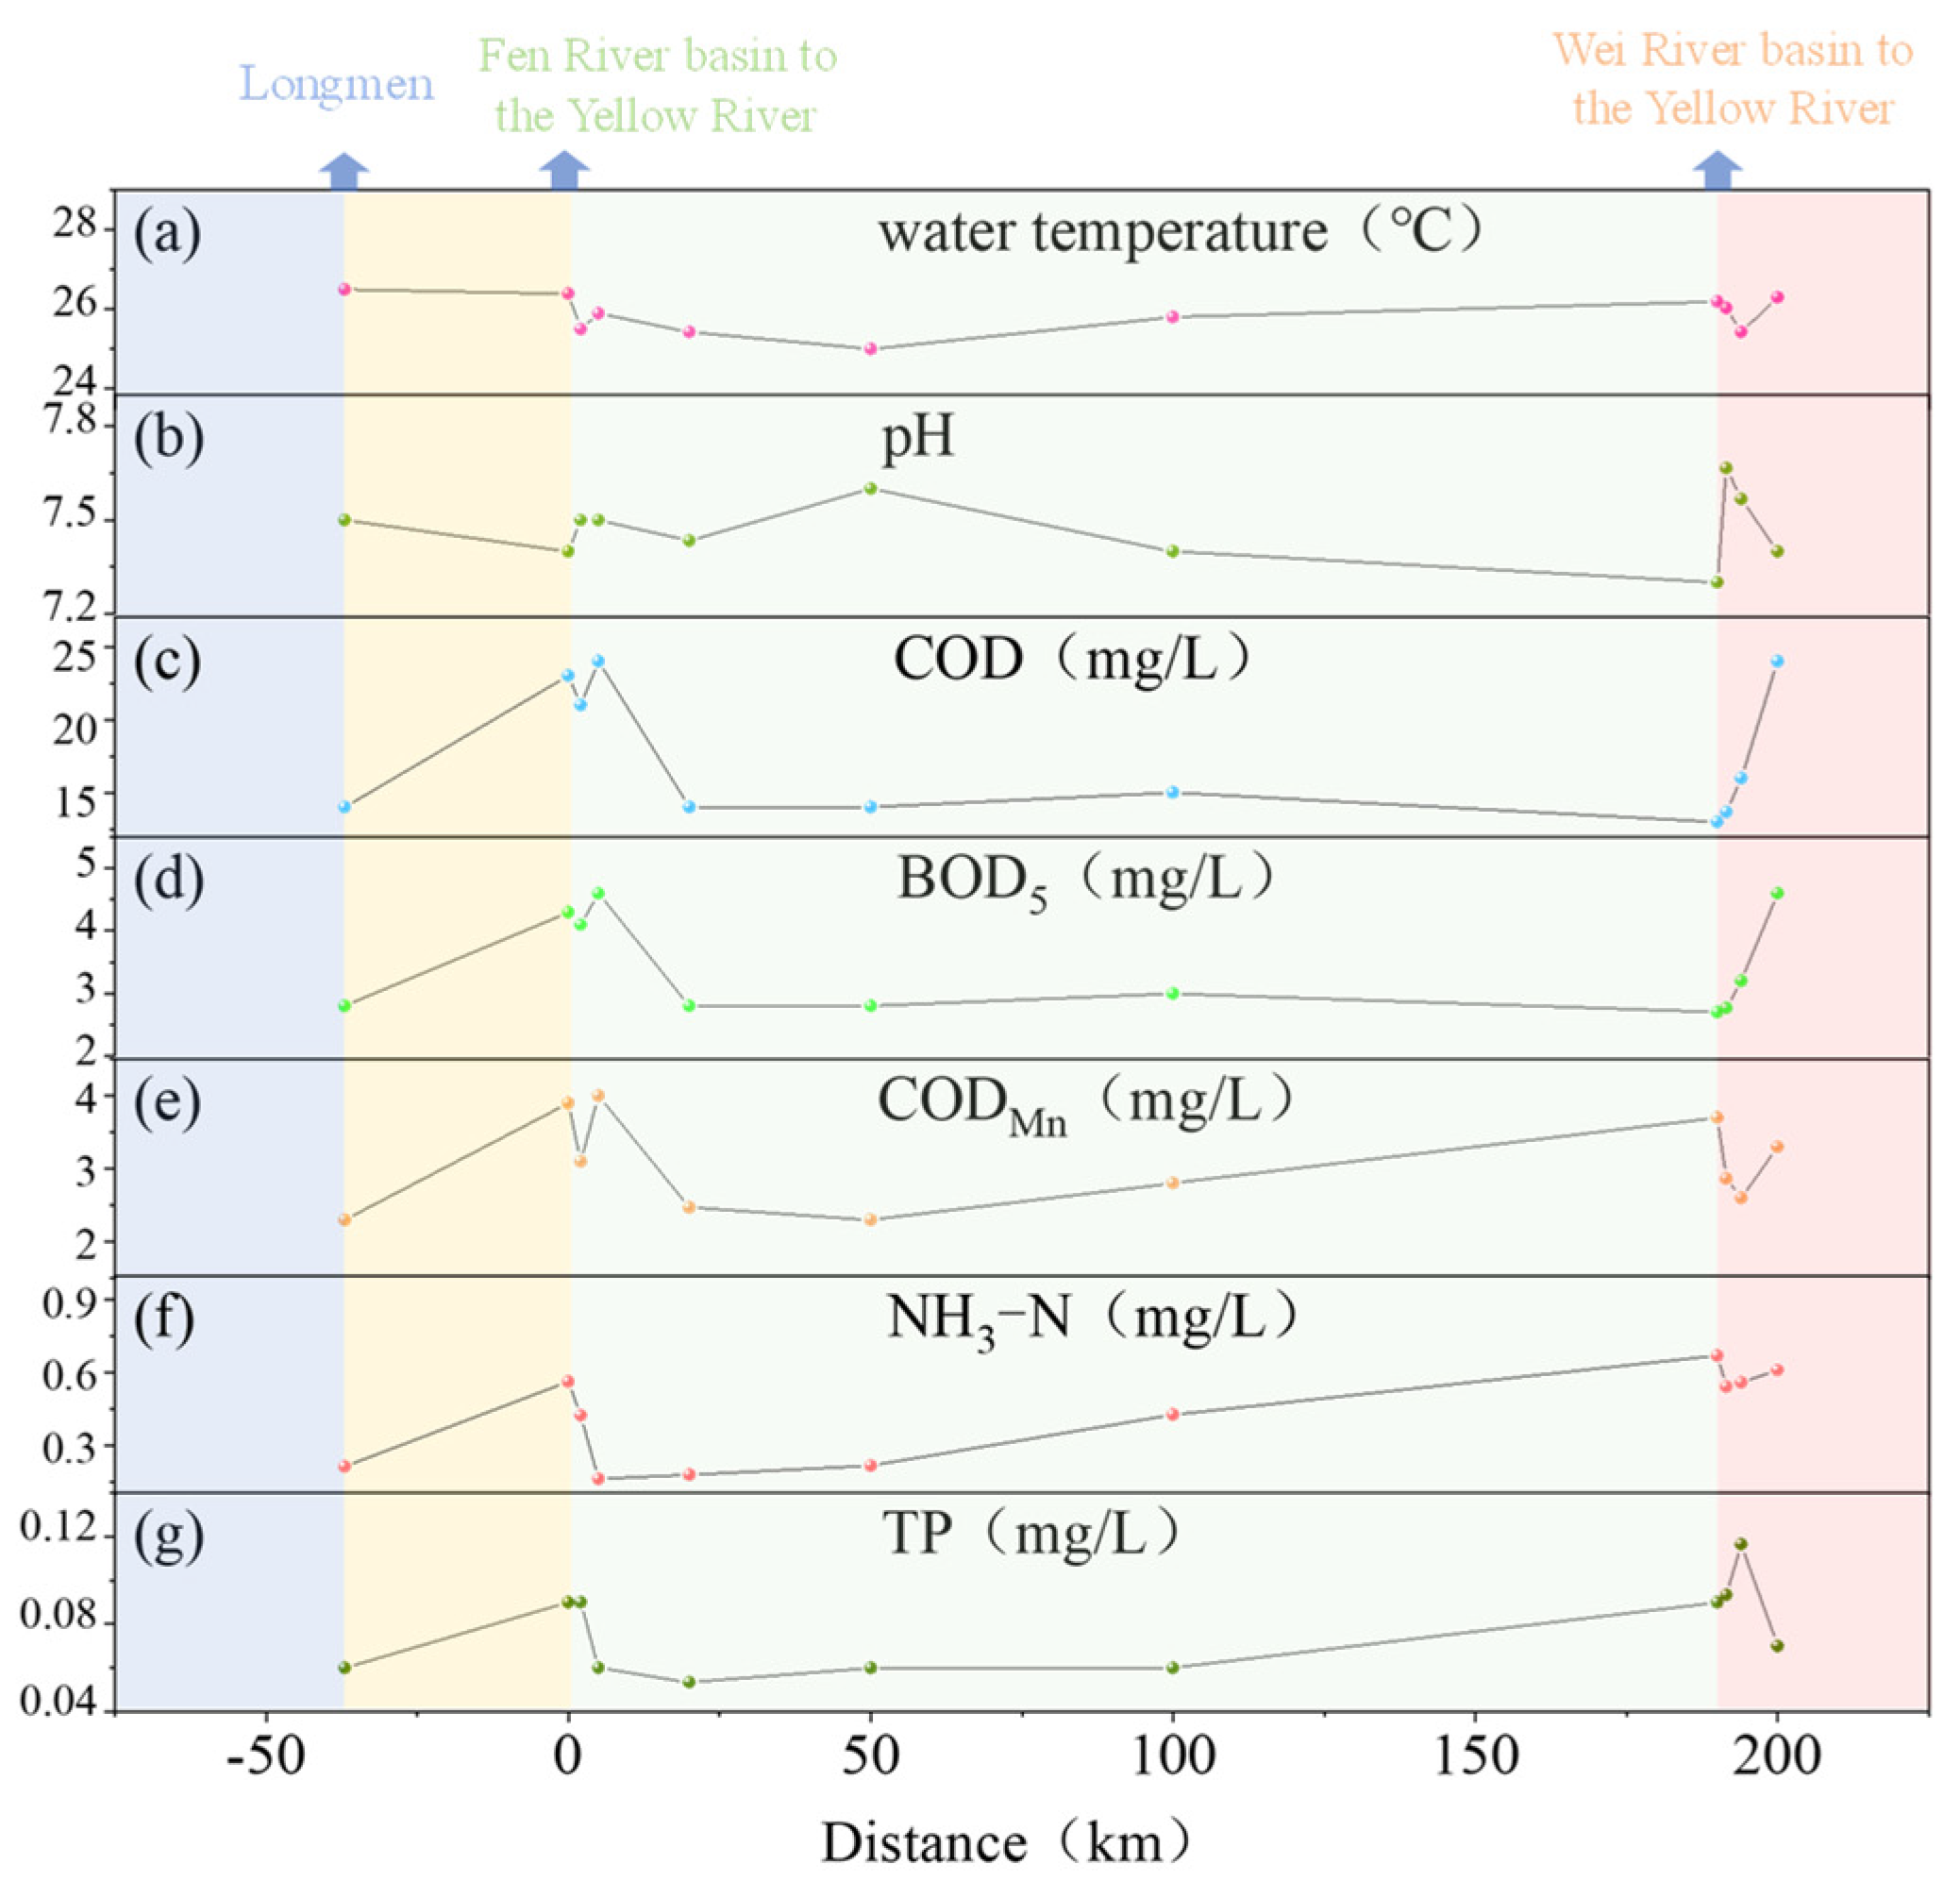
3.3. Assessment of Water Quality

The concentration ranges of the water quality indicators at the monitoring point of the Xiao Bei mainstream were as follows and are shown in Figure 7: DO, 5.92–6.75 mg/L; COD, 13–24 mg/L; BOD5, 2.7–4.6 mg/L; CODMn, 2.3–4.0 mg/L; NH3-N, 0.16–0.67 mg/L; and TP, 0.05–0.12 mg/L.
The runoff volumes of the Wei River and the Fen River were relatively small, resulting in a low capacity for the assimilation of pollution. The Miaoqiao and Huaxian cross-sections represented the entrance from the upstream Fen River and downstream Wei River, reaching the Yellow River at 0 km. The concentrations of pollutants at Miaoqian and Diaoqiao were relatively higher compared with the initial section of the Xiao Bei mainstream measured at Longmen. The comparison shown in Figure 8 revealed that the concentrations of COD, BOD5, CODMn, NH3-N, and TP at the Miaoqian section of the Fen River were 1.29 to 2.15 times higher than those at the Longmen section of the mainstream. Similarly, the concentrations of these same water quality factors at the Diaoqiao section of the Wei River were 1.57 to 2.08 times higher than those at the Longmen section of the mainstream.
The results of monitoring from the 11 sampling points are shown in Figure 9, illustrating the spatial distribution characteristics of water quality parameters along the Xiao Bei mainstream. After the confluence of the Fen and Wei Rivers, varying impacts on the water quality of the mainstream were observed, either positive or negative. However, the water quality factors all increased at the final monitoring point compared with the initial point, after the confluence of the Wei River and Fen River.
During the monitoring period, the average water temperature across the sections was 25.86 °C, with the highest (26.5 °C) at Longmen and the lowest (25 °C) at downstream from the Fen River’s confluence. The distribution of water temperature was generally stable, with a slight decrease at the confluence points of the Fen and Wei Rivers, followed by an increase at the next monitoring point. The average pH was 7.5, ranging from 7.7 at 1.5 km downstream of the Wei River’s confluence to 7.3 at the Wei River’s confluence. The pH levels increased at the monitoring points after both confluences, with a relatively significant rise of 0.3, peaking after the Wei River’s confluence.
Regarding other parameters, COD and BOD5 exhibited similar trends along the measured section. Both parameters peaked at the monitoring points 5 km downstream from the Fen River’s entry to the Yellow River mainstream and 10 km downstream from the Wei River’s entry, with maximum concentrations of 24 and 4.6 mg/L, respectively. Initially, between the Longmen station and the Fen River’s confluence, both parameters showed an upward trend. After the confluence with the Fen River, the concentrations initially decreased at the next monitoring point (2 km downstream from the Fen River’s entry) before rising to their highest levels 5 km downstream. Subsequently, the concentrations declined and stabilized at around 15 mg/L for COD and 2.9 mg/L for BOD5, observed at the observation point 20 km downstream from the Fen River’s entry. The concentrations increased drastically and spiked again to their peak levels after the confluence with the Wei River. The average COD was 17 mg/L, with concentrations of 23 mg/L at the Fen River’s confluence and 13 mg/L at the Wei River’s confluence. The average BOD5 was 3.4 mg/L, with concentrations of 4.3 mg/L at the Fen River’s confluence and 2.8 mg/L at the Wei River’s confluence. The trend of variation in CODMn was similar from the beginning to the monitoring point 50 km downstream from the Fen River’s entry, after which, it gradually increased to 3.7 mg/L at the Wei River’s confluence. Unlike COD and BOD5, the concentration of CODMn decreased after the Wei River’s confluence and rose again in the last measurement interval. The average CODMn was 3.0 mg/L, with concentrations of 3.9 mg/L at the Fen River’s confluence and 3.7 mg/L at the Wei River’s confluence. The concentration of NH3-N decreased following the inflow from the Weihe River but rose again before the next monitoring point. In contrast, after the inflow from the Fen River, NH3-N levels continued to decline, reaching their lowest value of 0.163 mg/L at a point 5 km downstream of the Fen River’s entry into the Yellow River. This behavior was distinct from that of COD, BOD5, and CODMn, for which the concentration reached the highest levels. Between the point 5 km downstream of the Fen River’s entry and the Weihe River’s inflow area, NH3-N concentrations showed a rising trend. The average NH3-N was 0.42 mg/L, with concentrations of 0.56 mg/L at the Fen River’s confluence and 0.67 mg/L at the Wei River’s confluence. The concentration of TP also declined first after the Fen River’s confluence but dropped to the lowest at 0.053 mg/L at the point 20 km downstream from the Fen River’s entry. The confluence of the Wei River witnessed an increase to 0.117 mg/L at the point 4 km downstream from the Wei River’s entry, followed by an evident decrease within the last measured section. The average TP was 0.08 mg/L, with concentrations of 0.09 mg/L at the Fen River’s confluence and 0.12 mg/L at the Wei River’s confluence.

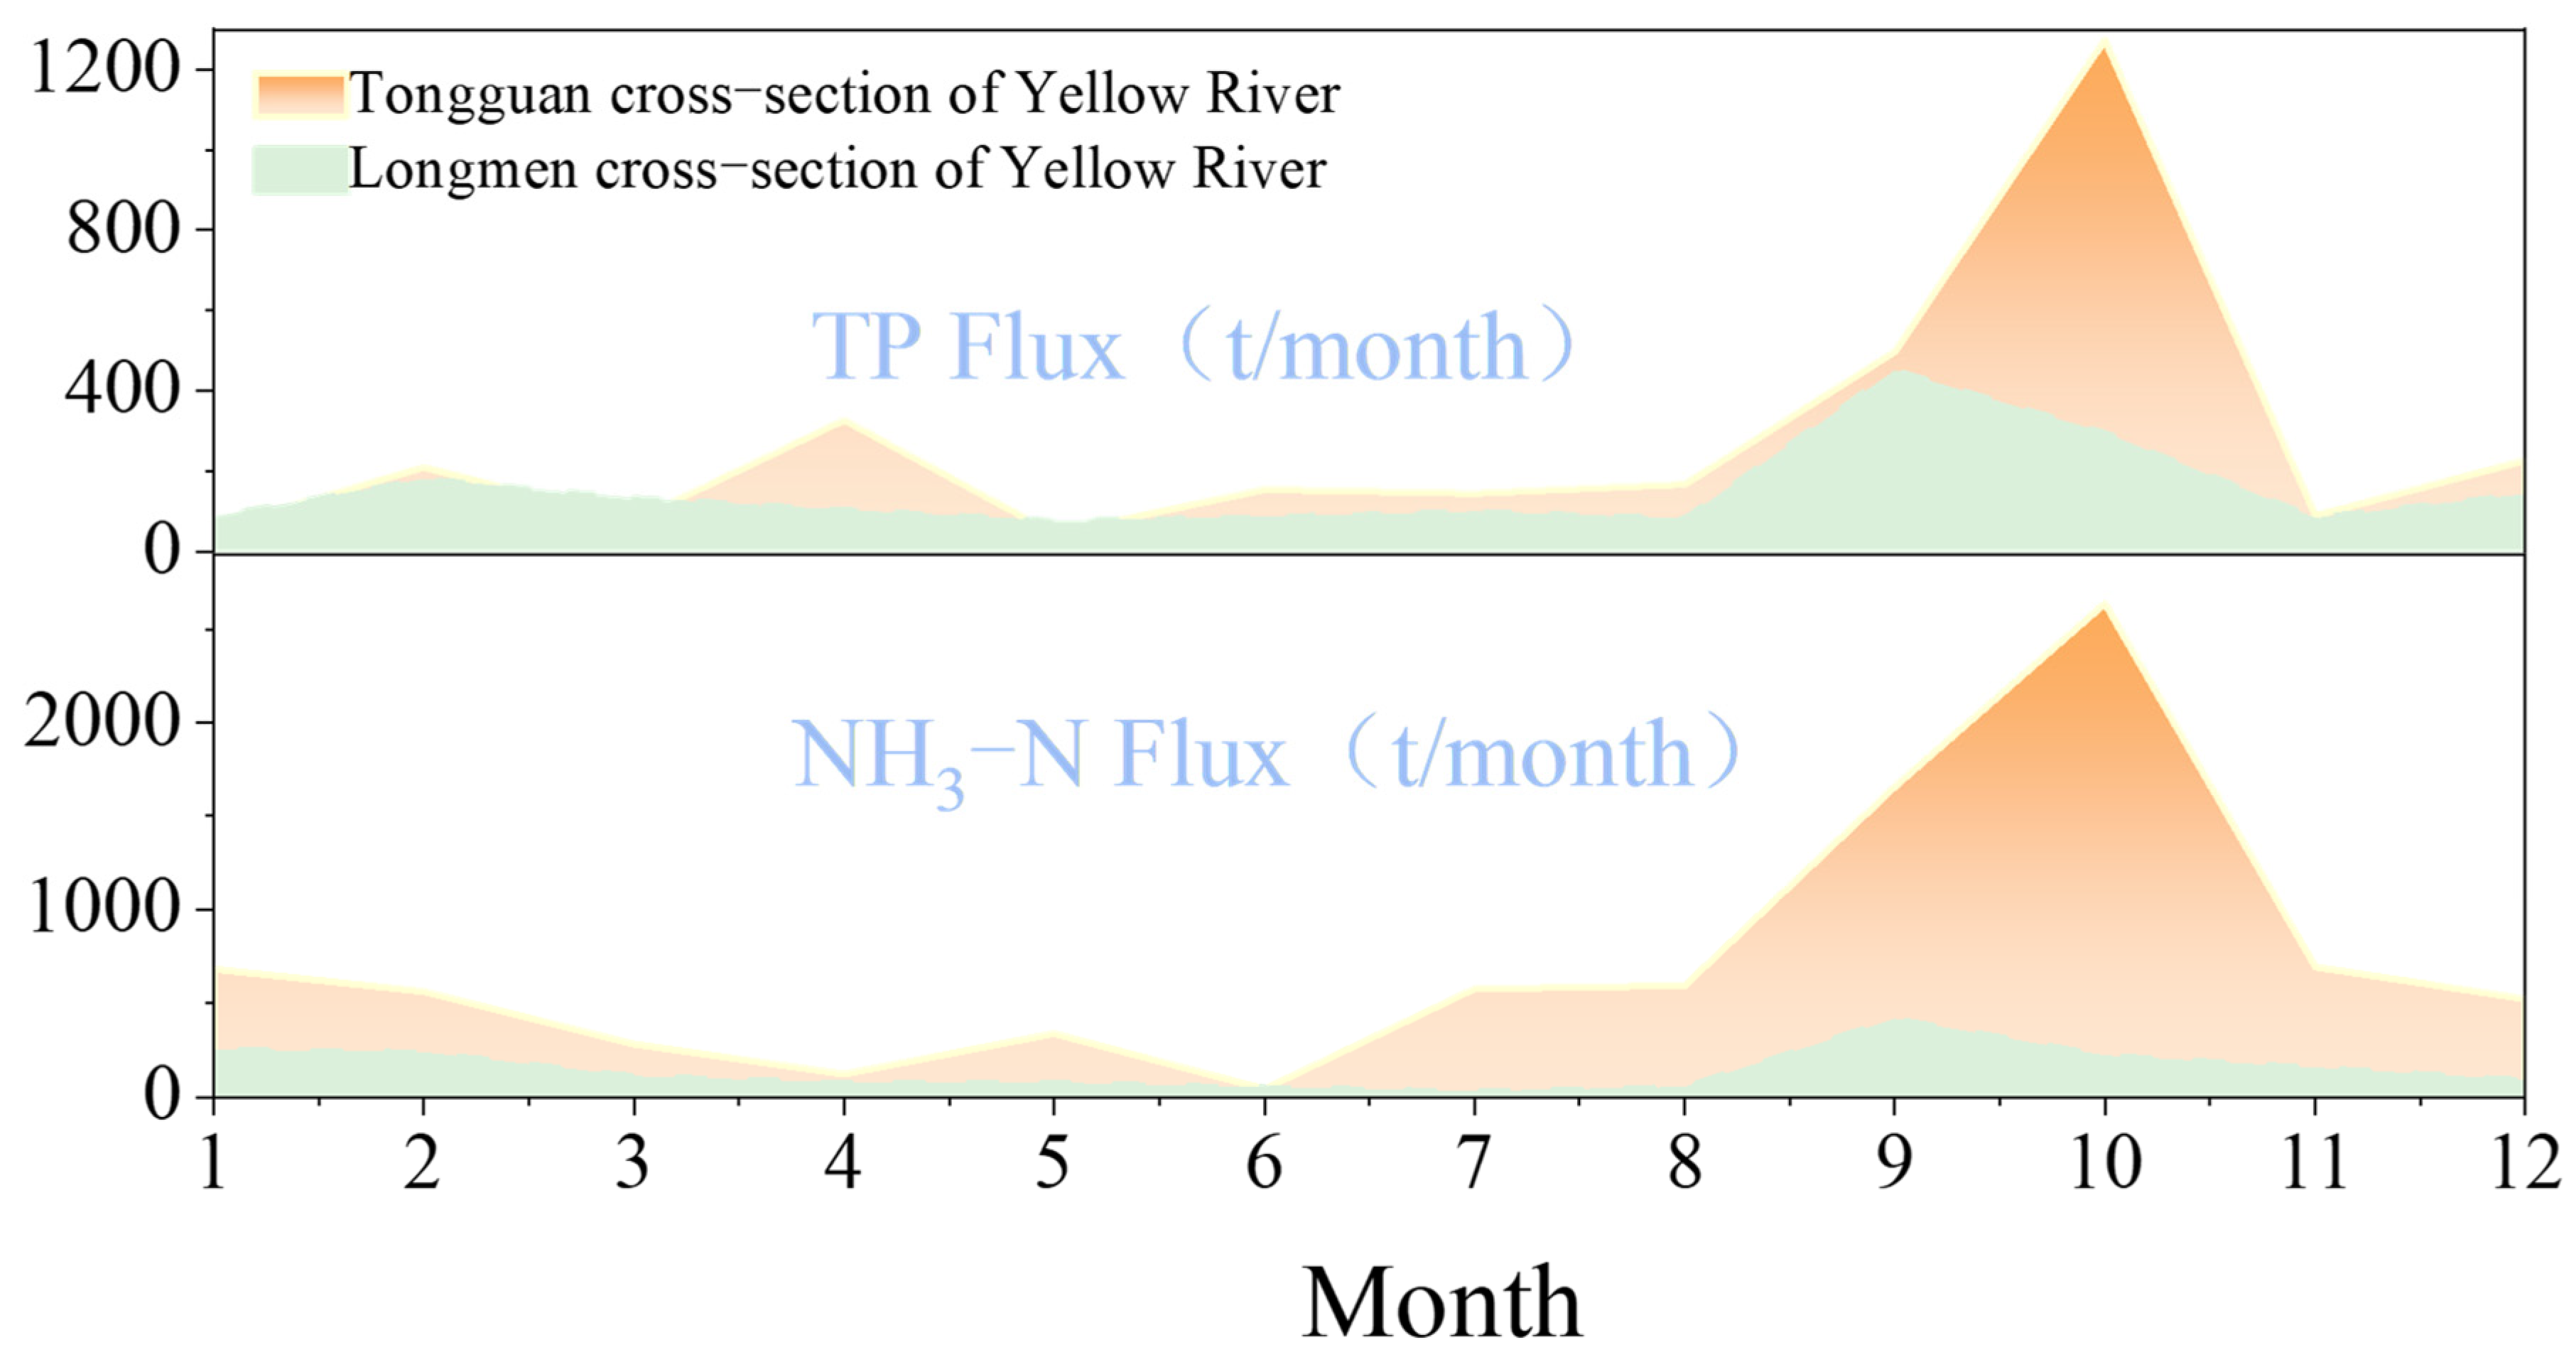
3.4. Changes in Pollutant Fluxes

Considering the overall transmission process of hydrological and water quality, the water quality and quantity fluxes constituted significant components of the total material flux of the river. In our study, the annual pollutant fluxes at the Longmen and Tongguan sections of the Yellow River mainstream and the confluence points of the Fen and Wei Rivers in 2021 were analyzed. Water quality fluxes were found to be positively correlated with runoff and pollutant concentrations at each cross-section. As shown in Figure 10, the annual NH3-N and TP fluxes at the Longmen section of the Yellow River mainstream were 1749.54 t/a and 1802.86 t/a, respectively. With the inflow from the Fen and Wei Rivers, the downstream Tongguan section recorded increased annual NH3-N and TP fluxes of 8718.65 t/a and 3262.75 t/a.
In 2021, both total phosphorus (TP) and ammonia nitrogen (NH3-N) exhibited similar patterns of monthly variation across all cross-sections. At the Longmen cross-section, TP and NH3-N remained relatively stable throughout the spring and early summer. However, starting in August, there was a noticeable increase, peaking in September at 449.67 tons per month and 414.59 tons per month, respectively. At the Tongguan cross-section, TP experienced a minor peak in April and a major peak in October, reaching 1273.39 tons. The minor peak for NH3-N was delayed by a month, occurring in May, with its major peak also occurring in October, reaching 2637.74 tons.
The Fen and Wei Rivers contributed significantly to the pollutant load of the mainstream. The NH3-N and TP fluxes at the Fen River’s Miao Qian section were 1004.95 t/a and 222.73 t/a, respectively, and at the Wei River’s Diao Qiao section, they were 5847.25 t/a and 2159.13 t/a, respectively. With the Tongguan section of the Yellow River mainstream as a reference, the annual NH3-N and TP inputs from the Fen River accounted for 11.5% and 6.8% of their totals in the Yellow River, while inputs from the Wei River accounted for 67.1% and 66.18%. The inflow of pollutants from the Fen and Wei Rivers increases the pollution risk of the mainstream.

4. Discussion

4.1. Temporal Variation in Runoff in the Xiao Bei Mainstream and Its Tributaries

The runoff in the entire mainstream and tributaries showed an overall decreasing trend, consistent with the results of many other studies [24,25]. The decline in the volume of runoff first became evident in 1986 (Figure 2). This observation also aligned with the findings of Wang et al., which identified 1985 as the turning point in the long-term reduction in runoff of the sections of Longmen–Tongguan [26]. The changes in runoff after the 1980s were identified to be dominated by human activities, which acted as the predominant influencing factor on the Yellow River’s quality [26,27,28,29]. Despite the decreases, the results indicated a uniform increase in runoff for all investigated river reaches from approximately 2018 to 2020. This drastic climbing trend was also observed at the Lijin station [30]. The recent years’ increase in water volume has been well-documented, with both government policy control and substantial investments playing a significant role in this achievement [31,32,33].
Upon comparison between the data measured from the mainstream hydrological stations and those from the tributaries, we observed that the runoff exhibited the trend of fluctuating high values followed by decreases. However, in contrast to the mainstream, which showed a turning point in 1986, the tributaries started their fluctuating decline much earlier, in around 1971 (Figure 4). This decline fluctuated and continued until stabilizing at lower values in 1986. Notably, there was a significant increase in runoff for all mainstreams and tributaries in around 2020.
The intra-annual variation in runoff based on the long-term monthly averages showed that the Fen River and Wei River tributaries followed the same pattern as those of the mainstream rivers. There was a slight increase in spring in around March to April and a peak during the summer months from July to October, thereby contributing seasonally to the Yellow River’s volume of runoff. This consistent seasonal variation aligned with the previous studies of Zhang et al. in the Xiao Bei mainstream and corresponded with the regional climate pattern, where the winters are cold and dry with minimal rainfall, and summers are warm and wet, characterized by frequent storms in the middle reaches [34]. In wet seasons with more precipitation, water quality tends to be more degraded, posing potential health risks to residents that require our attention [35]. However, the contribution ratio exhibited different trends throughout the year compared with the runoff, as shown in Figure 6. The Fen River made its lowest contribution in March, followed by the second lowest in April. For the remaining months, its contribution ratio stabilized at approximately 5%. Similarly, the Wei River’s contribution was minimal in March but peaked in May, despite the highest runoff occurring in September.

4.2. Factors of Water Quality and Pollutant Fluxes

Water quality was assessed using the single-factor evaluation method and classified against the national water quality standard GB3838-2002. By comparing each parameter’s concentration with the target standard level, the category of water quality was determined on the basis of the worst-performing factor. According to the water quality parameters measured at Tongguan, the specific measurements were as follows: DO, 6.75 mg/L, Class II; COD, 13 mg/L, Class I; BOD5, 2.7 mg/L, Class I; NH3-N, 0.671 mg/L, Class III; TP, 0.09 mg/L, Class II; and CODMn, 3.7 mg/L, Class II. On the basis of these parameters, the overall water quality in the Xiao Bei reach during the monitoring period was classified as Class III.
The confluence of the Wei and Fen Rivers with the mainstream significantly impacted the overall water quality of the Yellow River (Figure 9). According to the 2017 Report on the State of the Ecology and Environment in China, the water quality of these tributaries was classified as intermediately polluted [36]. In our study, the concentrations of the targeted water quality parameters increased following the merging of these tributaries. However, these parameters exhibited different responses, depending on the specific tributary. To gain a comprehensive understanding, further investigation into the water quality of the tributaries themselves is necessary. Figure 10 illustrates the increased total pollutant flux from upstream to downstream, indicating that the tributaries are likely to be the primary sources of pollutants. This suggested that focusing management efforts on these tributaries could be highly effective. Additionally, the seasonal patterns of fluctuation in the pollutants aligned with those of the overall runoff. Other studies have shown that the middle reaches of the Yellow River are influenced by multiple sources and can be significantly impacted by the variations observed in tributaries during the high-flow season, while manure and sewage waste are the largest contributors to the Yellow River Basin during the low-flow season [37]. The mean concentrations of total phosphorus were higher in the rainy season than in the dry season, underscoring the importance of incorporating the influence of seasonality to pollutant fluxes when developing water management strategies [38].

4.3. Agricultural Impacts and Policy Measures on Pollutant Loads in the Yellow River Basin

Agricultural activities in the Yellow River Basin, especially along the Xiao Bei mainstream, significantly affect water quality. Although overall pollutant emissions have decreased, the proportion of COD and NH3-N from agricultural sources has risen, largely due to extensive irrigation. Pollutants such as nitrogen and phosphorus from irrigated areas, particularly in the Fen–Wei Plain, flow into tributaries such as the Weihe and Fenhe Rivers, exacerbating pollution in the Xiao Bei mainstream.

4.3.1. Effectiveness of Policy on Pollutant Loads

While national policies aim to reduce fertilizer and pesticide use, regional differences in enforcement limit their impact. Ecological drainage systems and water management reforms remain uneven across provinces, contributing to inconsistent progress in reducing pollutants. The Yellow River Basin has a long history of agricultural activities and is one of China’s major agricultural regions, contributing about one-third of the country’s total grain production. Based on data from two national pollution source surveys, a temporal analysis of agricultural non-point source pollution in the Yellow River Basin indicates that, compared with 2006, the total pollutant emissions in 2017 had significantly decreased. However, the proportion of COD and NH3-N pollution from agricultural sources rose to 56% and 83%, respectively. In the Fen–Wei Plain, excess nitrogen from agricultural production increased from 1.12 million tons in 2006 to 1.37 million tons in 2014. Irrigated areas in the Yellow River Basin are typically equipped with comprehensive irrigation and drainage systems. Agricultural return flows, carrying nitrogen and phosphorus pollutants, enter natural downstream water bodies through drainage systems, impacting water quality. These pollutants are carried via the Weihe and Fenhe rivers, contributing to sustained increases in total nitrogen and phosphorus concentrations in the Xiao Bei mainstream.

4.3.2. Soil Salinization and Water Quality

Soil salinization in northern China exacerbates the degradation of water quality, particularly in regions such as the Yellow River Basin, where irrigation return flows are prevalent [6,39]. As these flows carry salts from agricultural lands into natural water bodies, the salinity of both surface and groundwater increases significantly. For example, in the Yellow River Delta, salt accumulation in the soil can reach up to 1.99–3.77 g/kg, resulting in high cation concentrations that further degrade the quality of soil and water [40]. The increased salinity poses a direct threat to freshwater ecosystems, complicating agricultural production and raising the costs of water treatment. In the Xiao Bei mainstream, this salinization results in worsened water conditions, requiring more extensive filtration processes and increasing the costs of treating potable water. Effective soil management practices, such as using superabsorbent polymers for improving the soil’s structure, are necessary to mitigate these impacts. The introduction of these technologies can reduce nutrient losses and adapt crops to saline soils, creating a more sustainable environment in the long term.

4.3.3. Dams and Water Quality

Dams, particularly the cascade dams constructed along the Yellow River, have significantly altered the river’s natural flow regime [15,41]. These dams trap vast amounts of sediments, especially in areas such as the Loess Plateau, where the Yellow River naturally carries a large sediment load, far exceeding that of other major rivers, such as the Yangtze River [42]. The retention of both sediment and water alters the nutrient dynamics and reduces the river’s capacity to naturally dilute pollutants [11,43,44,45,46]. This phenomenon is particularly notable in downstream sections, where pollutants accumulate in the Xiao Bei mainstream, increasing contaminant concentrations. The reduced flow not only traps harmful nutrients and chemical pollutants but also decreases the self-purification ability of the river, exacerbating water quality issues in densely populated areas.

5. Conclusions

This study revealed the spatiotemporal variations in runoff, the water’s environmental quality, and the characteristics of pollutant flux of the Xiao Bei mainstream and its tributaries in the middle reach of the Yellow River. It provided baseline data and analyzed trends to strengthen the understanding of the patterns and evolution of the rivers’ water quality, thus supporting and providing insights into the protection of the Yellow River’s water environment. Our findings have important implications for sustainable water management strategies, particularly in addressing the challenges posed by decreasing runoff and increasing pollutant loads from tributaries. The main findings from this study are summarized as follows.
(1) According to 73 years of long-term measured data (1951–2023), the runoff of the Xiao Bei mainstream exhibited significant interannual variability and an uneven intra-annual distribution, with a clear decreasing trend. After 1986, the runoff dropped sharply, with a 36% reduction at the Tongguan section and a 48.3% reduction during the flood season compared with 1951–1985. The sharp decline in runoff after 1986 coincided with major hydrological interventions such as the construction of dams and increased water withdrawals for agriculture and industry. This reduction in water flow not only affected the river’s capacity to naturally dilute pollutants but also has implications for maintaining ecological flows, exacerbating the region’s water scarcity issues.
(2) The long-term data indicated a decreasing trend in the runoff of the Wei and Fen River tributaries as well. The annual contribution ratios of the Wei and Fen Rivers’ runoff to the Yellow River mainstream were 19.75% (ranging from 10.04% to 31.17% monthly) and 3.59% (ranging from 1.65% to 4.58% monthly), respectively. The decreasing contributions of the tributaries are indicative of broader hydrological shifts in the region, which are likely influenced by changing precipitation patterns, land use changes, and water management policies. The significant contribution of the Wei River compared with the Fen River emphasizes the need for targeted management interventions in specific sub-basins.
(3) On-site monitoring of eight water quality parameters at 11 locations showed that the water quality of the Xiao Bei mainstream during the monitoring period (August) was classified as Class III overall. The concentrations of the water quality parameters at the confluence points of the Wei and Fen Rivers with the Yellow River were higher than those in the mainstream, with certain spatial fluctuations observed along the mainstream after the tributaries merged.
(4) Water quality fluxes were positively correlated with runoff and pollutant concentrations at each cross-section. The Fen and Wei Rivers contributed significantly to the pollutant load of the mainstream, with annual NH3-N and TP inputs from the Fen River accounting for 11.5% and 6.8% of the totals in 2021, respectively, and inputs from the Wei River accounting for 67.1% and 66.18%. The inflow of pollutants from the Fen and Wei Rivers increased the pollution risk of the mainstream.
In conclusion, the present study analyzed the long-term quality and quantity of water in the Xiao Bei Basin. It examined the contribution and impact of tributaries on the mainstream in terms of the volume and quality of water. The findings suggested that the reduction in runoff and the significant pollutant inputs from tributaries are the primary reasons for the situation of severe water pollution in the Xiao Bei mainstream of the Yellow River. These insights offer scientific evidence for developing effective management strategies for the water environment, emphasizing the role of tributaries as a crucial element in the overall management plan.

Author Contributions

Conceptualization, Z.Y., X.S. and L.Y.; methodology, Z.Y., X.S. and S.Y.; investigation, Z.Y., X.S. and Y.L.; writing—original draft preparation, Z.Y., X.S. and H.J.; writing—review and editing, L.Y. and S.Y. All authors have read and agreed to the published version of the manuscript.

Funding

This work was supported by the Outstanding Young Talents Science and Technology Foundation of Yellow River Conservancy Commission (Grant No. HQK-202320), the National Key Research and Development Program of China (Grant No. 2023YFC3206202), the Major Science and Technology Special Fund of Henan Province (Grant No. 201300311400), the Special Scientific Research Project of Yellow River Water Resources Protection Institute (Grant No. KYY-KYZX-2022-01), and the National Natural Science Foundation of China (Grant No. 51709126).

Data Availability Statement

The data presented in this study are available on request from the corresponding author. The data are not publicly available due to confidentiality and government regulations.

Conflicts of Interest

The authors declare no conflicts of interest.

References

  1. Xie, F.; Yu, M.; Yuan, Q.; Meng, Y.; Qie, Y.; Shang, Z.; Luan, F.; Zhang, D. Spatial Distribution, Pollution Assessment, and Source Identification of Heavy Metals in the Yellow River. J. Hazard Mater. 2022, 436, 129309. [Google Scholar] [CrossRef] [PubMed]
  2. Zhu, Z. International Water Resources Association The Yellow River Basin: Water Accounting, Water Accounts, and Current Issues. Water Int. 2004, 29, 2–10. [Google Scholar] [CrossRef]
  3. Wang, S.; Fu, B.; Liang, W.; Liu, Y.; Wang, Y. Driving Forces of Changes in the Water and Sediment Relationship in the Yellow River. Sci. Total Environ. 2017, 576, 453–461. [Google Scholar] [CrossRef] [PubMed]
  4. Wei, J.; Lei, Y.; Yao, H.; Ge, J.; Wu, S.; Liu, L. Estimation and Influencing Factors of Agricultural Water Efficiency in the Yellow River Basin, China. J. Clean Prod. 2021, 308, 127249. [Google Scholar] [CrossRef]
  5. Zhang, X.; Yu, W.; Zhang, T.; Shen, D. The Influencing Factors of Water Uses in the Yellow River Basin: A Physical, Production-Based, and Consumption-Based Water Footprint Analysis by the Random Forest Model. Water 2023, 15, 170. [Google Scholar] [CrossRef]
  6. Chen, Y.-P.; Fu, B.-J.; Zhao, Y.; Wang, K.-B.; Zhao, M.M.; Ma, J.-F.; Wu, J.H.; Xu, C.; Liu, W.-G.; Wang, H. Sustainable Development in the Yellow River Basin: Issues and Strategies. J. Clean Prod. 2020, 263, 121223. [Google Scholar] [CrossRef]
  7. Shen, Y.; Guo, Y.; Guo, Y.; Wu, L.; Shen, Y. Evaluating Water Resources Sustainability of Water-Scarcity Basin from a Scope of WEF-Nexus Decomposition: The Case of Yellow River Basin. In Environment, Development and Sustainability; Springer: Berlin/Heidelberg, Germany, 2024. [Google Scholar] [CrossRef]
  8. Feng, K.; Siu, Y.L.; Guan, D.; Hubacek, K. Assessing Regional Virtual Water Flows and Water Footprints in the Yellow River Basin, China: A Consumption Based Approach. Appl. Geogr. 2012, 32, 691–701. [Google Scholar] [CrossRef]
  9. Zhao, M.M.; Wang, S.-M.; Chen, Y.-P.; Wu, J.-H.; Xue, L.-G.; Fan, T.T. Pollution Status of the Yellow River Tributaries in Middle and Lower Reaches. Sci. Total Environ. 2020, 722, 137861. [Google Scholar] [CrossRef]
  10. Wu, S.; Hu, Y.H.; Zuo, D. Discussion on Parameter Choice for Managing Water Quality of the Drinking Water Source. Procedia Environ. Sci. 2011, 11, 1465–1468. [Google Scholar]
  11. Maavara, T.; Chen, Q.; Van Meter, K.; Brown, L.E.; Zhang, J.; Ni, J.; Zarfl, C. River Dam Impacts on Biogeochemical Cycling. Nat. Rev. Earth Environ. 2020, 1, 103–116. [Google Scholar] [CrossRef]
  12. Wang, W.; Li, S.L.; Zhong, J.; Wang, L.; Yang, H.; Xiao, H.; Liu, C.Q. CO2 emissions from Karst Cascade Hydropower Reservoirs: Mechanisms and Reservoir Effect. Environ. Res. Lett. 2021, 16, 044013. [Google Scholar] [CrossRef]
  13. Xu, Y.; Yu, S.; Liu, D.; Ma, J.; Chuo, M. The Impact of the Three Gorges Reservoir Operations on Hydraulic Characteristics in the Backwater Region: A Comprehensive 2D Modeling Study. Water 2024, 16, 2045. [Google Scholar] [CrossRef]
  14. Shi, W.; Wang, W.; Yu, S.; Liang, L.; Zhong, J.; Yi, Y.; Li, S.L. Influences of Hydrodynamics on Dissolved Inorganic Carbon in Deep Subtropical Reservoir: Insights from Hydrodynamic Model and Carbon Isotope Analysis. Water Res. 2024, 250, 121058. [Google Scholar] [CrossRef] [PubMed]
  15. Jin, W.; Chang, J.; Wang, Y.; Bai, T. Long-Term Water-Sediment Multi-Objectives Regulation of Cascade Reservoirs: A Case Study in the Upper Yellow River, China. J. Hydrol. 2019, 577, 123978. [Google Scholar] [CrossRef]
  16. Ouyang, W.; Hao, F.; Song, K.; Zhang, X. Cascade Dam-Induced Hydrological Disturbance and Environmental Impact in the Upper Stream of the Yellow River. Water Resour. Manag. 2011, 25, 913–927. [Google Scholar] [CrossRef]
  17. Mu, J.; Zhang, H.; Liu, S.M.; Wu, N.; Song, G.; Ding, S.; Zhang, X. Nutrient Dynamics in the Yellow River—A Case Study of Different Reservoir Regulation Operations. J. Hydrol. 2024, 629, 130563. [Google Scholar] [CrossRef]
  18. Chapra, S.C.; Camacho, L.A.; McBride, G.B. Impact of Global Warming on Dissolved Oxygen and Bod Assimilative Capacity of the World’s Rivers: Modeling Analysis. Water 2021, 13, 2408. [Google Scholar] [CrossRef]
  19. Wang, Y.; Tan, D.; Han, L.; Li, D. Review of climate change in the Yellow River Basin. J. Desert Res. 2021, 41, 235. [Google Scholar]
  20. Liu, S.; Qiu, Y.; Fu, R.; Liu, Y.; Suo, C. Identifying the Water Quality Variation Characteristics and Their Main Driving Factors from 2008 to 2020 in the Yellow River Basin, China. Environ. Sci. Pollut. Res. 2023, 30, 66753–66766. [Google Scholar] [CrossRef]
  21. Sun, X.; Zhou, Z.; Wang, Y. Water Resource Carrying Capacity and Obstacle Factors in the Yellow River Basin Based on the RBF Neural Network Model. Environ. Sci. Pollut. Res. 2023, 30, 22743–22759. [Google Scholar] [CrossRef]
  22. Wang, X.; Duan, L.; Zhang, T.; Cheng, W.; Jia, Q.; Li, J.; Li, M. Ecological Vulnerability of China’s Yellow River Basin: Evaluation and Socioeconomic Driving Factors. Environ. Sci. Pollut. Res. Int. 2023, 30, 115915–115928. [Google Scholar] [CrossRef] [PubMed]
  23. GB 3838-2002; Environmental Quality Standard for Surface Water. Ministry of Ecology and Environment: Beijing, China, 2002. Available online: https://english.mee.gov.cn/standards_reports/standards/water_environment/quality_standard/200710/t20071024_111792.htm (accessed on 7 September 2024).
  24. Wang, H.; Sun, F. Variability of Annual Sediment Load and Runoff in the Yellow River for the Last 100 Years (1919–2018). Sci. Total Environ. 2021, 758, 143715. [Google Scholar] [CrossRef] [PubMed]
  25. Shi, C.; Zhou, Y.; Fan, X.; Shao, W. A Study on the Annual Runoff Change and Its Relationship with Water and Soil Conservation Practices and Climate Change in the Middle Yellow River Basin. Catena 2013, 100, 31–41. [Google Scholar] [CrossRef]
  26. Wang, S.; Yan, M.; Yan, Y.; Shi, C.; He, L. Contributions of Climate Change and Human Activities to the Changes in Runoff Increment in Different Sections of the Yellow River. Quat. Int. 2012, 282, 66–77. [Google Scholar] [CrossRef]
  27. Jiang, L.; Zuo, Q.; Ma, J.; Zhang, Z. Evaluation and Prediction of the Level of High-Quality Development: A Case Study of the Yellow River Basin, China. Ecol. Indic. 2021, 129, 107994. [Google Scholar] [CrossRef]
  28. Wang, B.; Wang, H.; Jiao, X.; Huang, L.; Chen, H.; Guo, W. Runoff Change in the Yellow River Basin of China from 1960 to 2020 and Its Driving Factors. J. Arid. Land 2024, 16, 168–194. [Google Scholar] [CrossRef]
  29. Xu, J.; Jiang, X.; Sun, H.; Xu, H.; Zhong, X.; Liu, B.; Li, L. Driving Forces of Nature and Human Activities on Water and Sediment Changes in the Middle Reaches of the Yellow River in the Past 100 Years. J. Soils Sediments 2021, 21, 2450–2464. [Google Scholar] [CrossRef]
  30. Qin, H.; Shi, H.; Gai, Y.; Qiao, S.; Li, Q. Sensitivity Analysis of Runoff and Wind with Respect to Yellow River Estuary Salinity Plume Based on FVCOM. Water 2023, 15, 1378. [Google Scholar] [CrossRef]
  31. Zhou, Y.; Ma, J.; Zhang, Y.; Qin, B.; Jeppesen, E.; Shi, K.; Brookes, J.D.; Spencer, R.G.M.; Zhu, G.; Gao, G. Improving Water Quality in China: Environmental Investment Pays Dividends. Water Res. 2017, 118, 152–159. [Google Scholar] [CrossRef]
  32. Ministry of Ecology and Environment the People’s Republic of China. Action Plan for Prevention and Control of Water Pollution Printed and Distributed; Ministry of Ecology and Environment the People’s Republic of China: Beijing, China, 2015. [Google Scholar]
  33. Wang, Y.; Zhao, W.; Wang, S.; Feng, X.; Liu, Y. Yellow River Water Rebalanced by Human Regulation. Sci. Rep. 2019, 9, 9707. [Google Scholar] [CrossRef]
  34. Zhang, Q.; Jin, Z.; Zhang, F.; Xiao, J. Seasonal Variation in River Water Chemistry of the Middle Reaches of the Yellow River and Its Controlling Factors. J. Geochem. Explor. 2015, 156, 101–113. [Google Scholar] [CrossRef]
  35. Zhao, M.M.; Chen, Y.; Xue, L.; Fan, T.T.; Emaneghemi, B. Greater Health Risk in Wet Season than in Dry Season in the Yellow River of the Lanzhou Region. Sci. Total Environ. 2018, 644, 873–883. [Google Scholar] [CrossRef] [PubMed]
  36. Ministry of Ecology and Environment the People’s Republic of China. 2017 Report on the State of the Ecology and Environment in China; Ministry of Ecology and Environment the People’s Republic of China: Beijing, China, 2018. [Google Scholar]
  37. Yue, F.J.; Li, S.L.; Liu, C.Q.; Zhao, Z.Q.; Ding, H. Tracing Nitrate Sources with Dual Isotopes and Long Term Monitoring of Nitrogen Species in the Yellow River, China. Sci. Rep. 2017, 7, 8537. [Google Scholar] [CrossRef]
  38. Hu, N.; Sheng, Y.; Li, C.; Li, Z.; Liu, Q. The Reactivity of Dissolved and Suspended Particulate Phosphorus Pools Decreases with Distance Downstream in the Yellow River. Commun. Earth Environ. 2023, 4, 294. [Google Scholar] [CrossRef]
  39. Chen, G.; Wei, Z.; Liu, H. Study on Soil Desalination Process of Saline-Alkaline Grassland along the Yellow River in Western Inner Mongolia under Subsurface Drainage. Sustainability 2022, 14, 14494. [Google Scholar] [CrossRef]
  40. Zhang, Y.; Yang, P.; Liu, J.; Zhang, X.; Zhao, Y.; Zhang, Q.; Li, L. Sustainable Agricultural Water Management in the Yellow River Basin, China. Agric. Water Manag. 2023, 288, 108473. [Google Scholar] [CrossRef]
  41. Cai, X.; Rosegrant, M.W. Optional Water Development Strategies for the Yellow River Basin: Balancing Agricultural and Ecological Water Demands. Water Resour. Res. 2004, 40. [Google Scholar] [CrossRef]
  42. Wang, S.; Fu, B.; Piao, S.; Lü, Y.; Ciais, P.; Feng, X.; Wang, Y. Reduced Sediment Transport in the Yellow River Due to Anthropogenic Changes. Nat. Geosci. 2016, 9, 38–41. [Google Scholar] [CrossRef]
  43. Yu, S. Modeling Phosphorus Cycling in a Seasonally Stratified Reservoir (Fanshawe Reservoir, ON, Canada). Master Thesis, University of Waterloo, Waterloo, ON, Canada, 2020. Available online: http://hdl.handle.net/10012/16346 (accessed on 7 September 2024).
  44. Scott Winton, R.; Calamita, E.; Wehrli, B. Reviews and Syntheses: Dams, Water Quality and Tropical Reservoir Stratification. Biogeosciences 2019, 16, 1657–1671. [Google Scholar] [CrossRef]
  45. Maavara, T.; Parsons, C.T.; Ridenour, C.; Stojanovic, S.; Dürr, H.H.; Powley, H.R.; Van Cappellen, P. Global Phosphorus Retention by River Damming. Proc. Natl. Acad. Sci. USA 2015, 112, 15603–15608. [Google Scholar] [CrossRef]
  46. Kao, N.; Mohamed, M.; Sorichetti, R.J.; Niederkorn, A.; Van Cappellen, P.; Parsons, C.T. Phosphorus Retention and Transformation in a Dammed Reservoir of the Thames River, Ontario: Impacts on Phosphorus Load and Speciation. J. Great Lakes Res. 2022, 48, 84–96. [Google Scholar] [CrossRef]
Figure 1. Yellow River (left) and map of the study area (right). The mainstream, tributaries, and basin area of the Yellow River are shown on the left. The investigated Xiao Bei mainstream, with the Wei River and Fen River tributaries and the proximal hydrologic and water quality stations are shown on the right.
Water 16 02616 g001
Figure 2. Trends and variations in monthly and annual runoff at Longmen and Tongguan hydrological stations from 1951 to 2023. (a1) Trend of monthly average runoff at Longmen hydrological station. (a2) Differences in runoff from the annual mean at Longmen hydrological station. (b1) Trend of monthly average runoff at Tongguan hydrological station. (b2) Differences in runoff from the annual mean at Tongguan hydrological station.
Water 16 02616 g002
Figure 3. Intra-annual distribution of long-term average runoff for the Xiao Bei mainstream. (a) Graphs of the monthly distribution of density with histograms and rug plots for the Longmen (blue) and Tongguan (orange) stations over 73 years. The smooth curves represent the probability density functions of the runoff data, providing a continuous view of the data’s distribution. The histograms illustrate the frequency of data points within specific intervals, while the rug plots show individual data points along the x-axis. (b) Line plot showing the measured intra-annual average runoff data for Longmen and Tongguan stations.
Water 16 02616 g003
Figure 4. Trends and variations in monthly and annual runoff at Huaxian and Hejin hydrological stations from 1951 to 2023. (a1) Trend of monthly average runoff at Huaxian hydrological station. (a2) Differences in runoff from the annual mean at Huaxian hydrological station. (b1) Trend of monthly average runoff at Hejin hydrological station. (b2) Differences in runoff from the annual mean at Hejin hydrological station.
Water 16 02616 g004
Figure 5. Intra-annual distribution of long-term average runoff from the Wei River (Huaxian hydrological station) and Fen River (Hejin hydrological station). (a) Graphs of the monthly distribution of density with histograms and rug plots for Huaxian (green) and Hejin (purple) stations over 73 years. The smooth curves represent the probability density functions of the runoff data, providing a continuous view of the data’s distribution. The histograms illustrate the frequency of data points within specific intervals, while the rug plots show individual data points along the x-axis. (b) Line plot showing the measured intra-annual average runoff data for Huaxian and Hejin stations.
Water 16 02616 g005
Figure 6. Comparison of average monthly runoff between the tributaries and mainstream of the Yellow River. (a) Contribution of the Fen River to the Yellow River (b) Contribution of the Wei River to the Yellow River.
Water 16 02616 g006
Figure 7. Characterization of the concentrations of factors for monitoring water quality in the Xiao Bei mainstream: Green area display the data distribution and dark area represents the inter quartile range, which spans from the 25th to the 75th percentile of the data.
Water 16 02616 g007
Figure 8. Comparison of water quality factors in the mainstream and tributaries of the Xiao Bei mainstream.
Water 16 02616 g008
Figure 9. Changes in the monitored values of water quality factors over 11 sampling points along the studied reach. (a) Temperature, (b) pH, (c) chemical oxygen demand (COD), (d) ammonia nitrogen (NH3-N), (e) total phosphorus (TP), (f) permanganate index (CODMn), (g) 5-day biochemical oxygen demand (BOD5).
Water 16 02616 g009
Figure 10. Monthly changes in TP and NH3-N fluxes in the Xiao Bei mainstream in 2021.
Water 16 02616 g010
Table 1. Monitoring points of the Xiao Bei mainstream’s water quality.
No.Monitoring PointLatitude and LongitudeRelative Distance
1Longmen110.60867786, 35.65471586−37 km
2Fen River entry to Yellow River, 0 km110.46890259, 35.342819900 km
3Fen River entry to Yellow River, downstream 2 km110.45306683, 35.332492392 km
4Fen River entry to Yellow River, downstream 5 km110.44521332, 35.304969255 km
5Fen River entry to Yellow River, downstream 20 km110.37466049, 35.1351416720 km
6Fen River entry to Yellow River, downstream 50 km110.32299042, 35.0419435450 km
7Fen River entry to Yellow River, downstream 100 km110.27518272, 34.61943546100 km
8Wei River entry to Yellow River section, 0 km110.28792858, 34.61049980190 km
9Wei River entry to Yellow River, downstream 1.5 km110.30397892, 34.60940485191.5 km
10Wei River entry to Yellow River, downstream 4 km110.33073664, 34.60912228194 km
11Wei River entry to Yellow River, downstream 10 km110.41276932, 34.58863340200 km
Disclaimer/Publisher’s Note: The statements, opinions and data contained in all publications are solely those of the individual author(s) and contributor(s) and not of MDPI and/or the editor(s). MDPI and/or the editor(s) disclaim responsibility for any injury to people or property resulting from any ideas, methods, instructions or products referred to in the content.

