Article

Stability Study and Strengthening Strategy of Spiral Case-Encased Concrete Structure of Pumped Storage Power Station

1
Department of Energy and Power Engineering, Tsinghua University, Beijing 100190, China
2
State Grid Xinyuan Shandong Weifang Pumped Storage Co., Ltd., Weifang 262600, China
*
Author to whom correspondence should be addressed.
Water 2024, 16(18), 2687; https://doi.org/10.3390/w16182687
Submission received: 21 August 2024 / Revised: 13 September 2024 / Accepted: 20 September 2024 / Published: 21 September 2024
(This article belongs to the Special Issue Hydrodynamic Science Experiments and Simulations)

Abstract

:
With the development of global hydropower, the scale of hydropower stations is increasing, and the operating conditions are becoming more complex, so the stable operation of hydropower stations is very important. The vibration of the turbine unit will cause resonance in the powerhouse, and the structural stability of the powerhouse will be affected. Many scholars pay attention to the stability of the turbine unit operation, and there are few studies on the powerhouse of the hydropower station. Therefore, this paper relies on the Weifang Hydropower Station project to study key issues such as the tensile strength of concrete and how to arrange steel bars to increase the structural stability by changing the material properties through FEA. Three schemes are designed to evaluate the safety of the powerhouse structure when the turbine unit is running through the safety factor. Our findings indicate that the stress variation patterns observed on the inner surface of the powerhouse remain consistent across different operating scenarios. Notably, along the spiral line of the worm section, we observed that the stress levels on the vertical loop line decrease gradually with increasing distance from the inlet. Conversely, stress concentrations arise near the inlet and the tongue. Additionally, it has been noted that the likelihood of concrete cracking increases significantly at the tongue region.

1. Introduction

With the development of the global hydropower industry, hydropower is increasingly recognized for its critical strategic importance. As international energy trends evolve, there is a growing emphasis on maximizing the potential of renewable, clean energy sources like hydropower. To optimize energy efficiency, the scale of hydropower stations is expanding, resulting in these facilities taking on more complex roles, such as peak and frequency modulation tasks [1]. This increased complexity brings about more challenging operating conditions, making the stable operation of hydropower stations essential [2]. Vibrations from turbine units can induce resonance within the powerhouse, which in turn compromises its structural stability [3]. Consequently, ensuring the structural integrity of these facilities under such conditions is of paramount importance.
Many scholars, both domestically and internationally, have studied the pressure fluctuation characteristics and internal flow losses of pump-turbine units during operation. Some researchers have calculated the fluid–solid interactions of pump-turbines by establishing one-dimensional models; however, there has been limited investigation into how the operation of turbine units affects plant structures. Liang [4] systematically analyzed the pressure fluctuation and rotating stall characteristics in the vaneless space of a pump-turbine operating in the pump mode. The entropy production theory was introduced to determine the energy loss characteristics of the whole passage pump-turbine. Yan [5,6,7,8,9] investigated the influences of external parameter variation, pressure pulsation, and internal flow field and vortex evolution in pump-turbines. Zantei [10,11,12,13] deeply explored the influence of blade stagger angle on the RPT instability behavior. Numerical simulation results showed that the hydrodynamic instability and the stagger angle of the rotor blades are closely related. Lian [14,15] established a one-dimensional (1D) numerical model for simulating the fluid–structure interaction (FSI) behavior in pipelines and discussed the pressure fluctuation and axial and radial vibration magnitude distributions along the pipeline. Liu [16] simulated extreme load rejection cases, where two pump-turbines undergo load rejection simultaneously in a prototype pumped storage system, by a one-dimensional and three-dimensional (1D–3D) coupled computational fluid dynamics (CFD) method. Khalfaoui [17] investigated the dynamic fluid and structural behaviors of a low-head pump-turbine under part-load and deep part-load conditions.
Regarding the study of powerhouses, it mainly focuses on structural design and material proportioning. Zeng [18] assessed the influence of floor slabs on the progressive collapse response of 3D prestressed concrete frames and found that floor slabs enhance the anti-collapse capacity of 3D frames. Gao [19] experimentally investigated four groups of concrete-filled circular steel tube K-joints to understand their performance for application in lattice wind turbine towers. Sun [20,21,22,23] proposed a multi-factor assessment method for concrete structural damage grades based on evidence theory and particle swarm optimization, overcoming subjectivity and irrationality in the previous assessment. Jin [24] proposed a hexagonal concrete-filled double skin steel tube (CFDST) transition piece to avoid the complicated construction and concrete cracking problems of the traditional reinforced concrete type of transition piece. Jin [25] improved the finite element model, analyzed the nature of the axial stress distribution of LHR-CFDST and its working mechanism, and established a peak axial compression bearing capacity prediction formula. Velarde [26,27,28,29] found that the material partial safety factors recommended by the DNV offshore concrete standard can be reduced without compromising structural safety, thereby further reducing the cost of offshore wind energy.
Based on the Weifang Hydropower Station project, this paper employs a three-dimensional modeling fluid–solid coupling method to investigate the static stress characteristics of the powerhouse under different operating conditions. It examines critical issues such as the tensile strength of concrete and the optimal arrangement of steel bars to enhance structural stability. Three schemes are proposed to evaluate the safety of the powerhouse structure during the operation of the hydropower unit through safety factor assessment. Compared with one-dimensional model calculations, this approach provides more accurate results. The paper also conducts a systematic study on the problem of water-induced vibration during the operation of pumped-storage units, offering valuable insights for practical hydropower station construction.

2. Materials and Methods

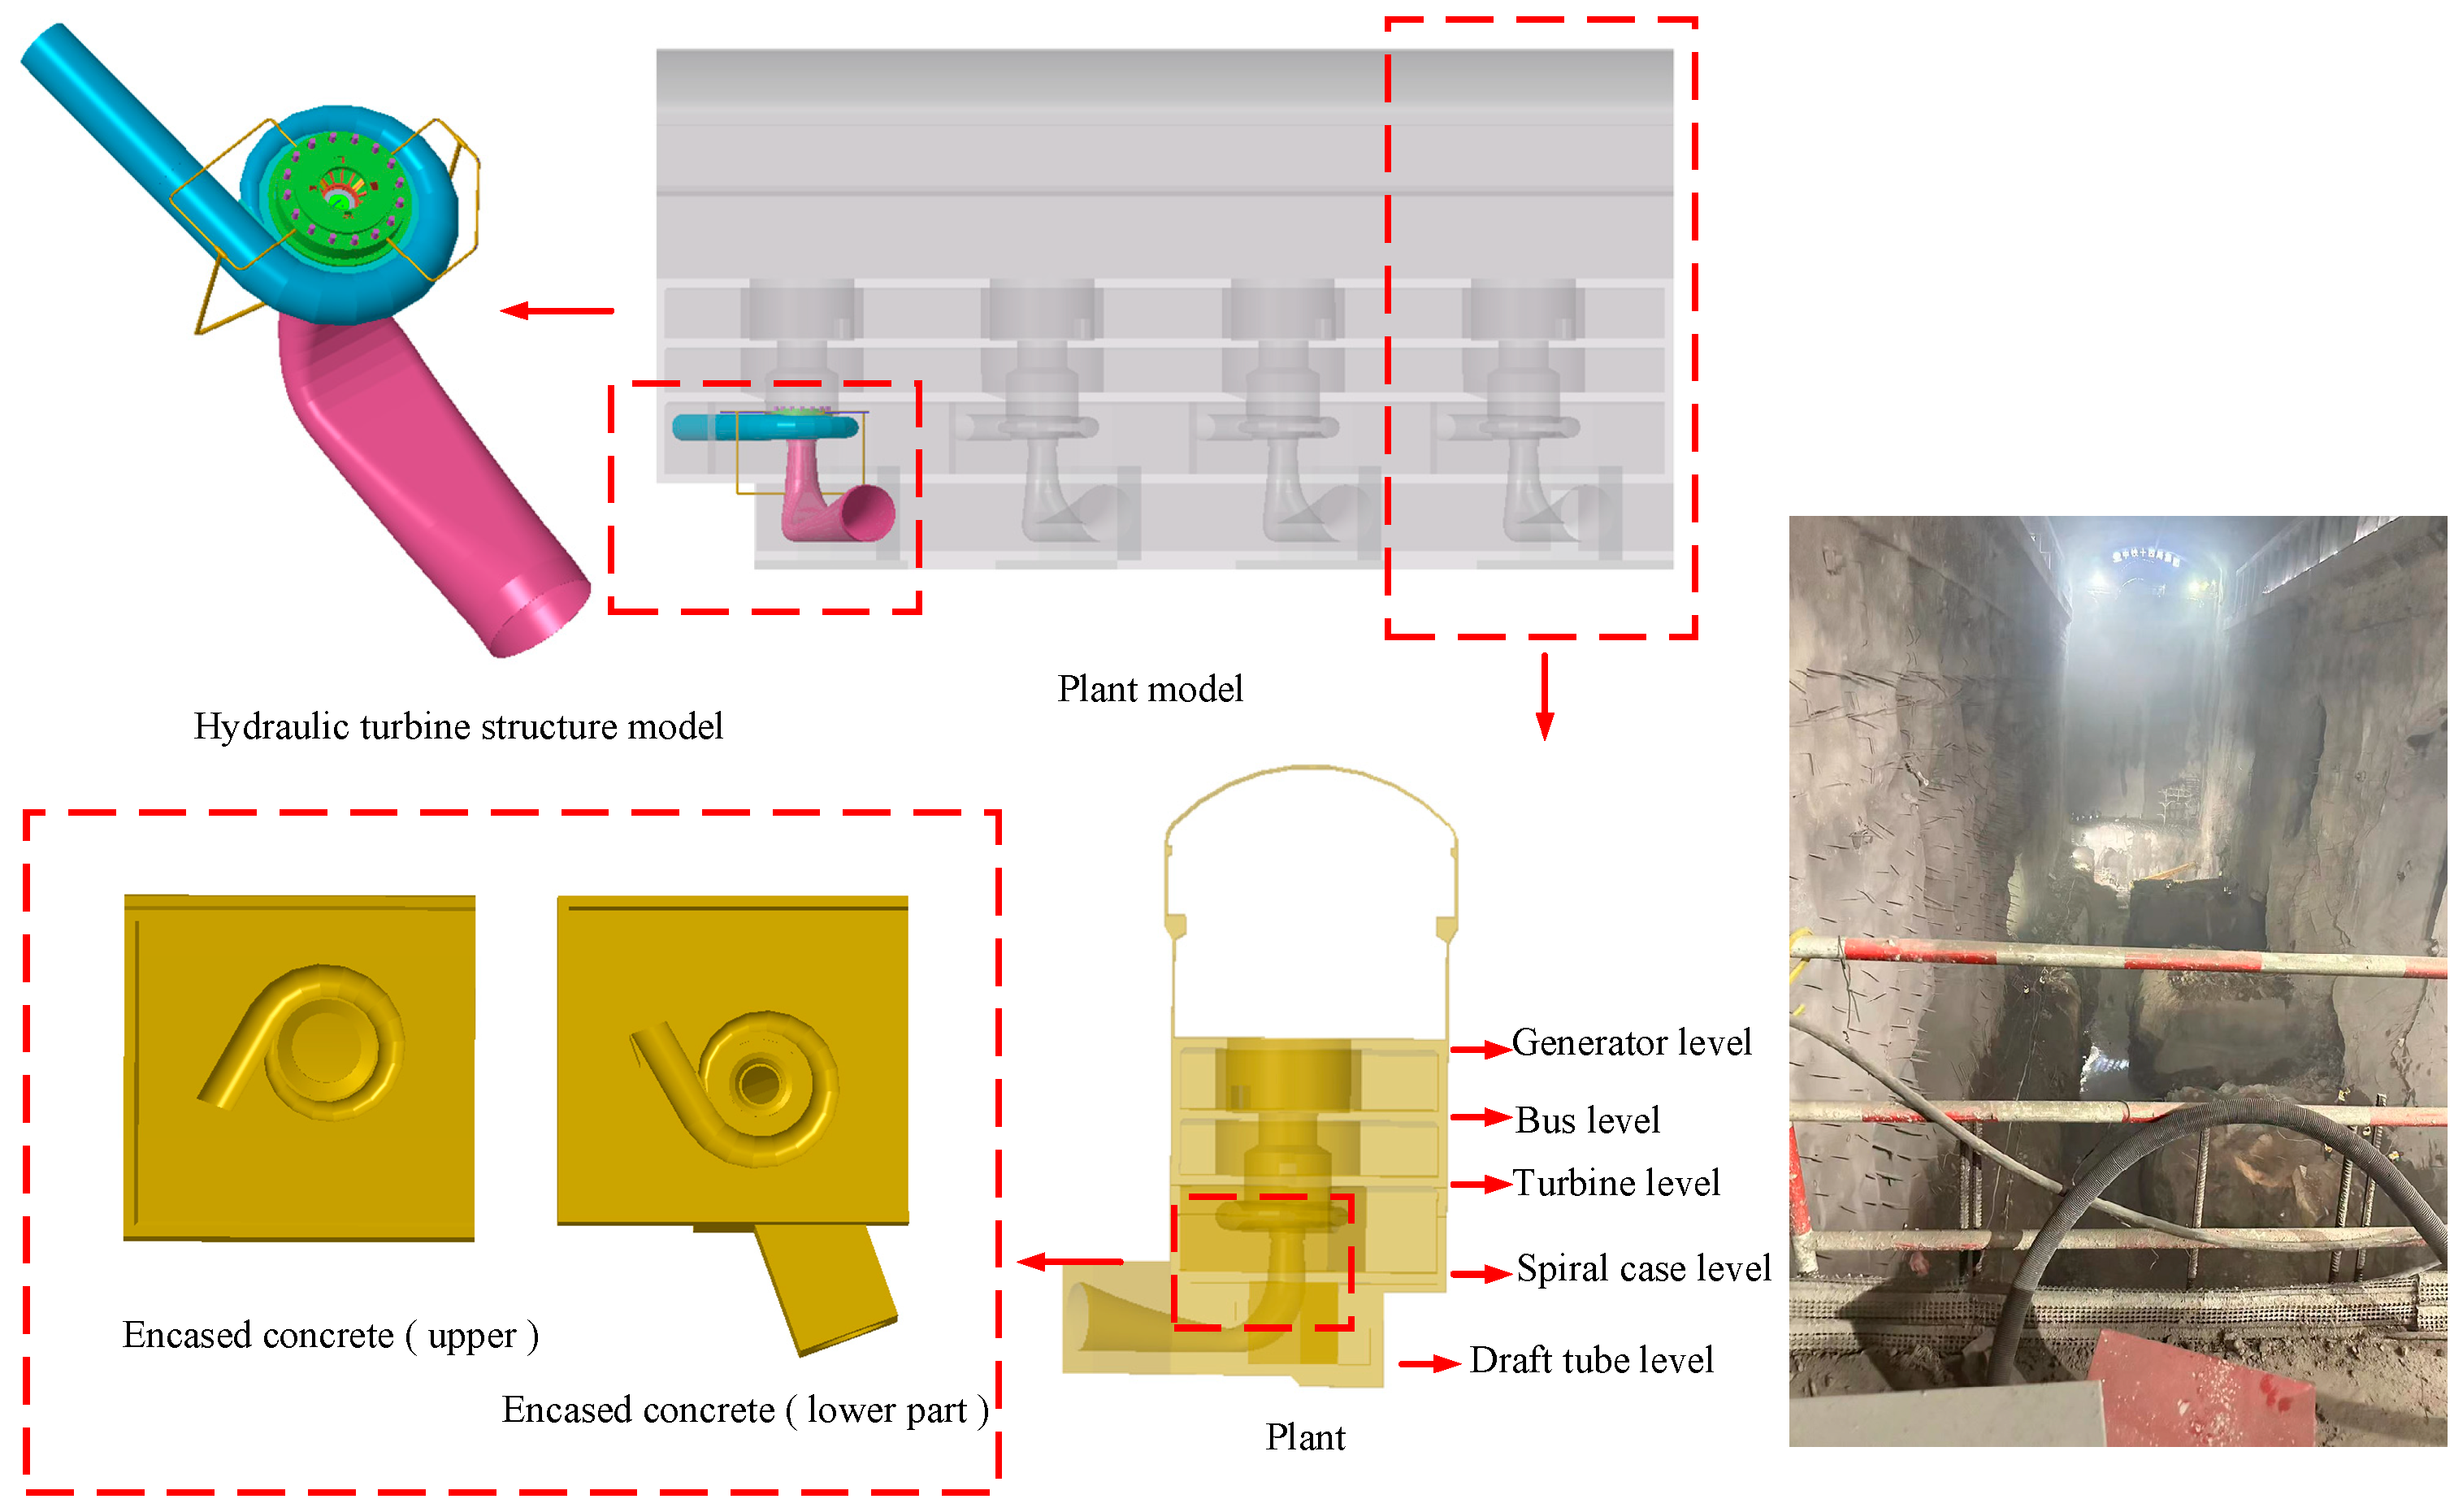
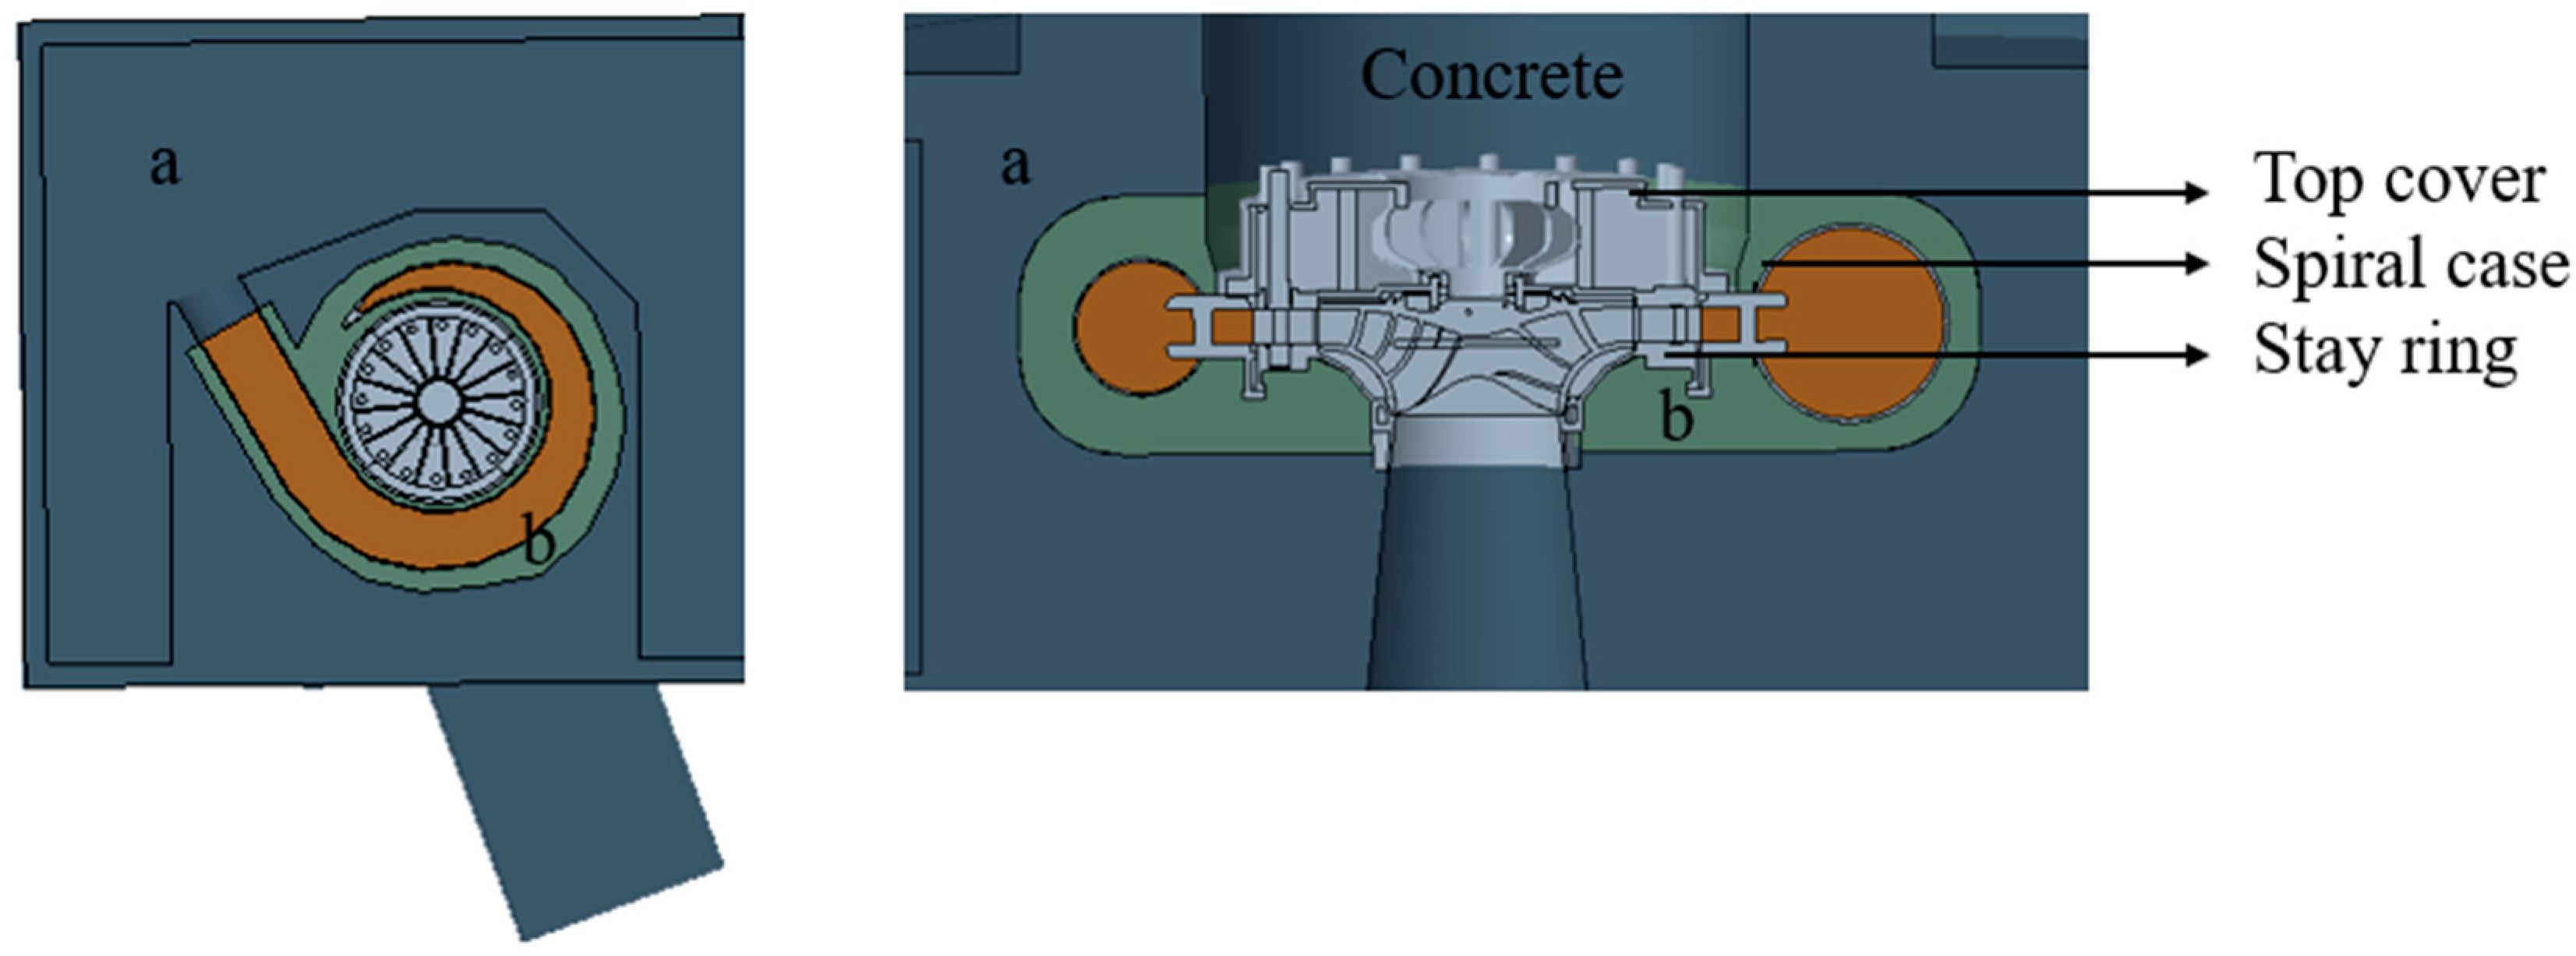
2.1. Research Object

Based on the field drawings provided by the Weifang Pumped Storage Project, a comprehensive three-dimensional model of the plant and the units was developed, ensuring consistency with the prototype structure. The plant comprises four turbine units, with the structural models of both the plant and the units depicted in Figure 1. Table 1 presents the fundamental parameters of the prototype unit, which features a vertical shaft, single-stage, mixed-flow reversible pump-turbine. The four units are housed within the factory building, where intentional gaps have been incorporated to mitigate vibration impacts. The main engine room of the factory building is organized across five levels: the generator level, bus level, turbine level, spiral case level, and draft tube level.
This paper examines the effects of stress and vibration on the plant during the operation of a single unit. The factory building is constructed from concrete, which primarily provides compressive strength while exhibiting relatively weak tensile strength. Consequently, the project primarily relies on reinforcing bars (rebar) to provide the necessary tensile strength. By strategically arranging rebar connections and creating interfaces between the rebar and concrete around the volute, the overall tensile strength of the plant is enhanced. Table 1 presents the main characteristic parameters of a vertical shaft single-stage mixed-flow reversible pump-turbine.

2.2. High-Density Steel and Concrete Ratio

The model uses three-stage steel HRB400, diameter 28 mm, yield strength fyk = 400 N/mm2, ultimate strength fstk = 540 N/mm2, elastic modulus ES = 200,000 N/mm2. By removing the concrete around the volute, the plant’s concrete structure is divided into two sections: a and b. As illustrated in Figure 1, section b represents the concrete surrounding the volute, where the tensile strength determined by the formula is applied. This paper uses Creo7.0 software for modeling and assembly. The final model of the powerhouse and the unit is shown in Figure 2. The finite element analysis is carried out by the commercial software ANSYS2022. Firstly, the flow field results are obtained by using CFX2022 software. The flow field model adopts the SST model [30]. The stress and deformation of concrete and volute are calculated through fluid–solid coupling.
Yield strength indicates the stress level at which the material undergoes permanent deformation, whereas tensile strength reflects the maximum stress the material can endure before fracturing. Yield strength is useful for assessing the safe working load of the material, while tensile strength indicates its ultimate fracture point.
The outer section of the spiral casing is divided into three layers of steel bars. The schematic representation is illustrated in Figure 3, where Z1 denotes the number of outermost steel bars, Z2 signifies the number of middle-layer steel bars, and Z3 indicates the number of inner-layer steel bars. The distance from the inner layer to the volute surface is 50 mm, while the middle layer is positioned 75 mm from the inner layer, and the outer layer is set 100 mm away from the middle layer. Sc represents the cross-sectional area of segment b. Using the tensile strength calculation formula for steel bars, we can determine the maximum tensile force that the steel bars arranged around the volute can endure, which is approximately equivalent to the maximum tensile force that the concrete in section b can withstand. The volute is considered to be formed by the spiral configuration of each section, allowing for the calculation of both the tensile strength and yield strength of the concrete in section b for each individual segment.
Steel area S r = π r 2 , where r is the radius of the steel bar.
Total tensile strength: F y k = i = 1 3 Z i f y k S r S c N/mm2.
Total tensile strength: F stk = i = 1 3 Z i f s t k S r S c N/mm2.
Elastic modulus: E s = i = 1 3 Z i E s S r S c N/mm2.

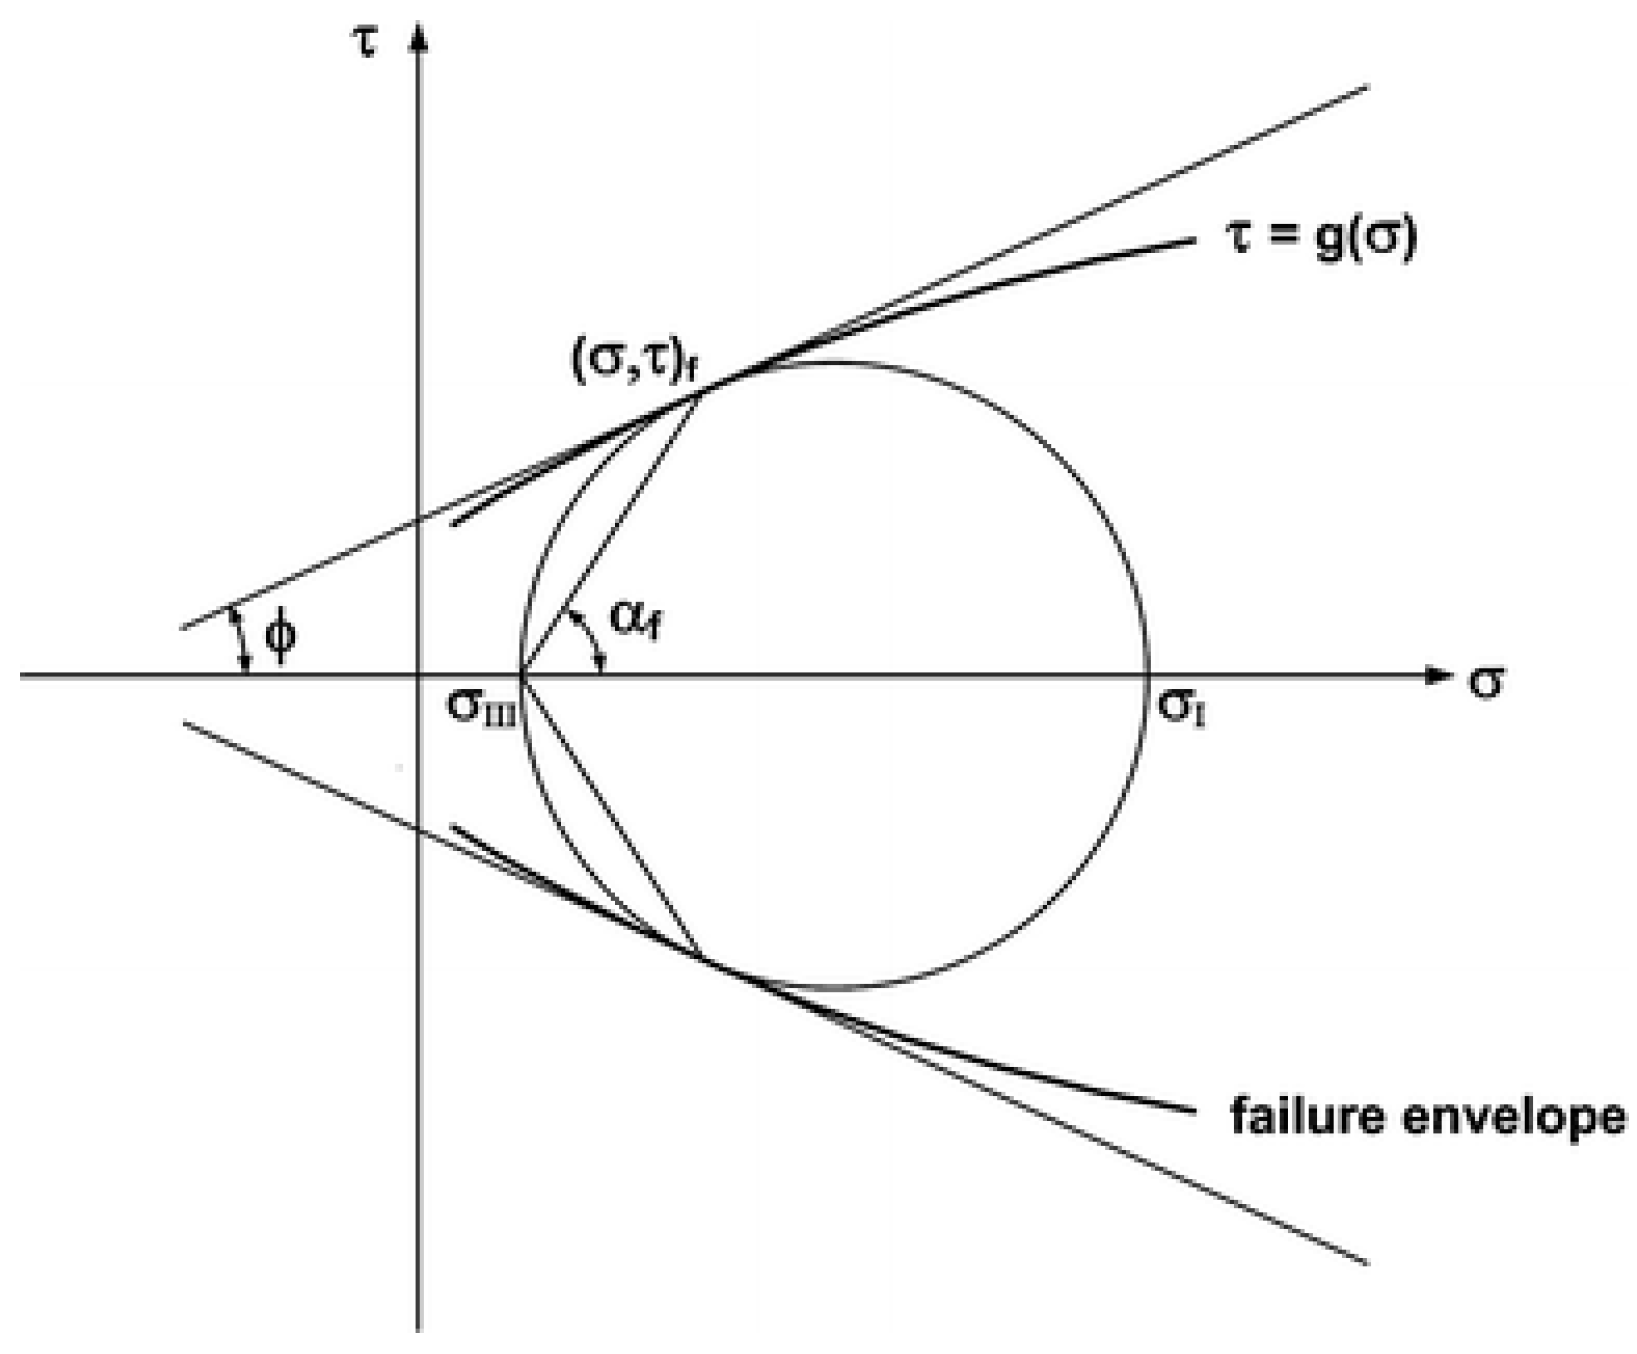
2.3. Mohr–Coulomb Failure Criterion

Mohr–Coulomb Theory is a mathematical model that describes how materials such as rubble piles or concrete respond to shear stress and normal stress. This theory, illustrated by the yield surface, is applicable to many classical engineering materials, which often follow its principles within a portion of their shear failure envelope. The model incorporates the concept of linear elasticity, as outlined by Hooke’s Law in our discussion on linear elastic material Models. Additionally, it introduces perfect plasticity based on the Mohr–Coulomb failure criterion [31]. The Mohr–Coulomb approach is particularly useful for analyzing brittle materials, as it helps determine their cohesion and internal friction angle. The Mohr–Coulomb criterion can be written as follows:
| τ | = C + σ tan ϕ
From Mohr’s circle showed in the Figure 4, τ = τ m cos ϕ , σ = σ m + τ m sin ϕ , τ m = ( σ I σ I I I ) 2 , and σ m = ( σ I + σ I I I ) 2 , where τ is the shear stress, σ is the normal stress. Moreover, the two material constants included in the criteria are c and ϕ , where c is the cohesion of the material and ϕ is the angle of internal friction with coefficient of internal friction μ = tan ϕ . In the Mohr diagram, this criterion is represented by a straight line inclined to the σ axis by the angle ϕ . By plotting a Mohr circle tangent to the line and applying trigonometric relations, the alternative in terms of principal stresses is obtained.
( σ I σ I I I ) = ( σ I + σ I I I ) sin ϕ + 2 S 0 cos ϕ
Mohr’s failure criteria may also be expressed as follows:
τ m = f ( σ m )

3. Results and Discussion

During transitions and pressure fluctuations within the flow channel, resonance between the plant and the unit can easily occur, increasing the risk of fatigue and resonance-related damage. The safe and stable operation of the turbine transition process is crucial for the stability of the entire power grid. Consequently, fluid–solid coupling analyses are performed under various conditions: maximum head load rejection, maximum head pump working conditions, and the turbine’s rated working conditions. These analyses compare and evaluate the impact of turbine vibrations on the plant under both extreme and standard working conditions to ensure stable unit operation.
This section begins with an analysis of stress changes in the contact wall between the concrete and the volute across the three working conditions, as well as the effect of unit operation on the plant in the absence of steel reinforcement. Due to inherent limitations in concrete material properties, it is necessary to enhance the concrete’s tensile strength by increasing reinforcement. When analyzing the load rejection condition, the safety of the concrete is assessed using safety factors under three different reinforcement schemes.

3.1. Stress Distribution of Concrete

The peripheral concrete surrounding the volute has been cut, and the stress distribution on the inner surface of the concrete across eight surfaces has been extracted. Figure 5 illustrates the vertical section distribution of the concrete in area B. Figure 6 shows the vertical section stress distribution of concrete in area B under load rejection conditions. Specifically, Figure 6a presents the stress values along eight ring lines on the contact surface of the concrete under these conditions, while Figure 6b provides a stress distribution map for the same ring lines. The color bar ranges from 0 to 1, indicating stress from small to large, with blue representing the smallest stress and red representing the largest stress.
From Figure 6, it is observed that the maximum stress is primarily concentrated around the 0.5 span mark. This is evident from both the curve and the cloud diagram, with the maximum stress reaching approximately 4.6 MPa. Generally, the stress decreases symmetrically from the 0.5 span towards both ends, with the stress near the seat ring interface being the lowest. Stress values for lines 5 to 7 are slightly lower than those for lines 1 to 3, while the stress for line 8 is higher than that for line 7 due to its proximity to the volute tongue section, which increases the stress on the inner surface of the concrete.
Figure 7 shows the stress distribution on the vertical section of concrete area B under the maximum head pumping condition. Figure 8 displays the stress distribution under the turbine’s rated working condition. The stress variation on the inner surface is consistent across different working conditions. Along the spiral line of the worm joint, the stress on the vertical loop is smaller away from the inlet and larger near the inlet and the tongue. Although the overall trend of the curves remains similar across different working conditions, the stress decreases with changes in these conditions. Under the most extreme load rejection condition, the stress on the inner surface is the highest, followed by the maximum head pumping condition. When the turbine operates under rated conditions, the stress on the inner surface of the concrete is lower, with a maximum value of approximately 4.1 MPa.
To better observe the changes in stress on the inner surface of the concrete, the volute is analyzed along the symmetrical sections on both sides of the central horizontal plane. The section distribution is illustrated in Figure 9a, while Figure 9b shows the stress extracted from the curve of the inner surface of the concrete, extending from the inlet to the end of the tongue. Upon examining Figure 10, it is observed that under load rejection conditions, the stress primarily fluctuates around 4 MPa, not exceeding 5 MPa. Near the first span, the stress reaches its maximum, indicating that due to the influence of the local structure on the inner surface of the concrete, the stress is highest near the tongue, reaching 8.3 MPa. Figure 11 and Figure 12 depict the changes in stress across the horizontal section of the inner surface of the concrete under both the maximum head pumping condition and the rated condition of the turbine. It is evident that the trends across the three working conditions are consistent, with the pattern of stress reduction mirroring that of the vertical section. As the working conditions stabilize, the stress values decrease, with the maximum stress occurring near the tongue.

3.2. Structure without Reinforcement Arrangement

There is no steel bar arrangement outside the volute, and the bearing pressure and tensile strength are borne by the concrete. The concrete properties in the a and b regions are consistent, and the concrete and unit structural parameters are as shown in Table 2. Observe the influence of turbine operation on concrete under load rejection conditions.
Standard engineering regulations typically require a safety factor of ≥1.5. Figure 13 illustrates that in the absence of steel reinforcement, the concrete exhibits extensive cracking. Figure 13b–d provide a comprehensive view of the cracking on the inner surface of the concrete. Along the spiral line of the horizontal volute, cracking initiates on both the upper and lower sides of the volute. Notably, the inner surface of the inlet section shows significant cracking, which increases the risk of circumferential fractures.

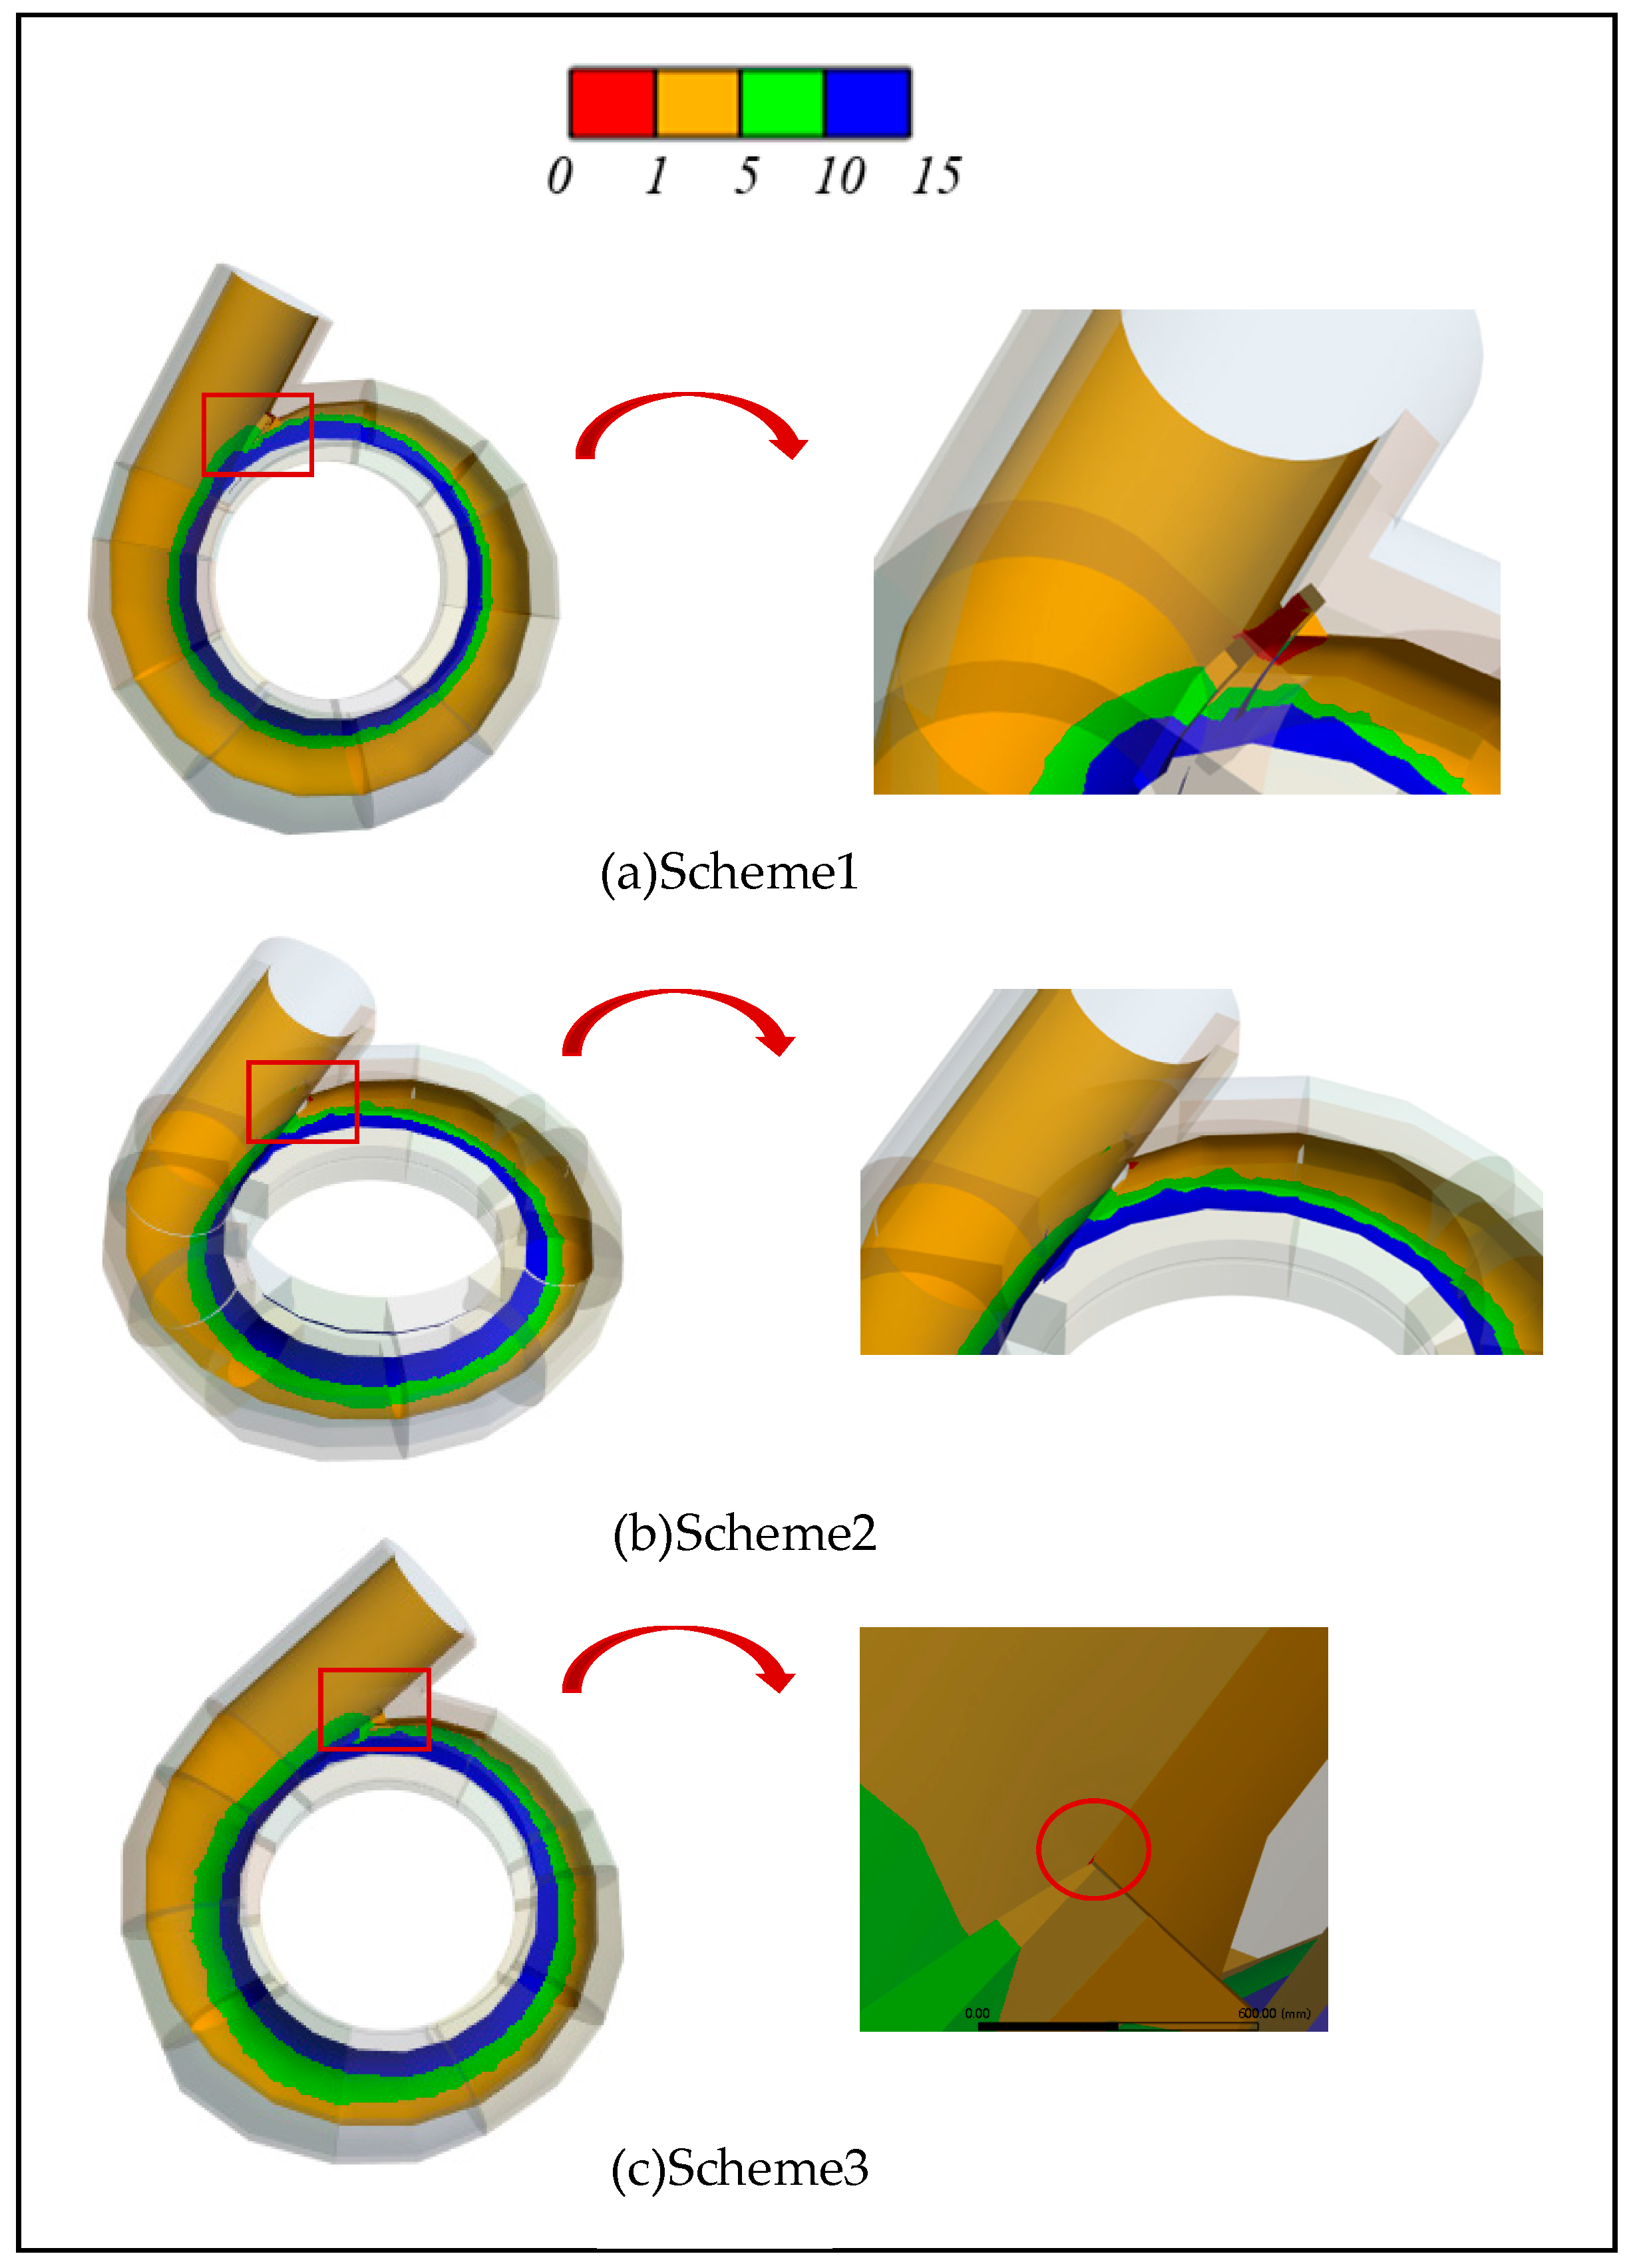
3.3. The Influence of Steel Bar Arrangement Structure on Concrete

Since stress is highest under load rejection conditions, ensuring safe and stable operation during these conditions is crucial for the reliable performance of other operating conditions. Three steel reinforcement configurations, as detailed in Table 3, were designed and analyzed to assess concrete cracking under load rejection conditions for different tensile strengths. By applying the aforementioned calculation formulas, three layers of steel reinforcement were added around the volute to enhance the concrete’s tensile strength.
Figure 14 shows the deformation of concrete and the spiral case under the three schemes, the color bar ranges from 0 to 1, indicating the deformation from small to large, with blue representing the smallest deformation and red representing the largest deformation. The results show that with the increase in tensile strength and elastic modulus, the deformation of both the spiral case and the concrete decreases significantly. The maximum deformation of concrete and the spiral case occurs at the same location, which is on the side of the spiral case inlet close to the top cover. Figure 15 shows the stress variation of concrete and the spiral case under the three schemes, the color bar ranges from 0 to 1, indicating stress from small to large, with blue representing the smallest stress and red representing the largest stress. It can be seen that the stress of the spiral case decreases with the increase in tensile strength and elastic modulus, while the stress of concrete increases with the increase in tensile strength and elastic modulus. This is because with the change in concrete properties, adding steel bars to concrete will significantly improve the bearing capacity, and the tensile stress of concrete is significantly enhanced. The concrete bears more load, which leads to an increase in stress.
In order to further understand the influence of concrete property changes on concrete deformation, the deformation changes of a point on the inner surface of concrete in three directions are analyzed by taking points. Figure 16 is a schematic diagram of the point analysis, and Table 4 provides the deformation of the point in the three directions under the three schemes. The analysis results show that the deformation of scheme 1 is larger in the three directions. When the amount of steel bars is increased to a certain extent, the deformation of concrete decreases. The deformation in the x direction is the largest, and that in the z direction is the smallest for the three schemes. Along the X and Y directions, the deformation of the point decreases with the increase in the number of steel bars; however, along the Z direction, the deformation of the point increases with the increase in the number of steel bars. This indicates that the concrete at this point is subjected to reduced compression, while the increased deformation of concrete in the Z direction leads to an increase in tensile stress.
Figure 17a illustrates the arrangement of steel reinforcement in a multi-layer configuration, where 19 steel bars are positioned in the inner layer, 22 in the middle layer, and 30 in the outermost layer. This configuration leads to a tensile strength of 9.11 MPa, with the maximum stress localized at the tongue. Notably, the safety factor surrounding the volute remains greater than 1 and less than 5, indicating that it predominantly meets the engineering requirements. However, there is a visible occurrence of localized cracking at the tongue.
Transitioning to Figure 17b, we observe an alternative arrangement where 30 steel bars are allocated to the inner layer, 40 to the middle layer, and 50 to the outermost layer. This configuration yields a heightened tensile strength of 13.20 MPa, coinciding with a reduction in the size of the cracking area at the tongue.
Further increasing the reinforcement, as depicted in Figure 17c, involves arranging 42 steel bars in the inner layer, 52 in the middle layer, and 62 in the outermost layer. Under this setup, the tensile strength rises to 16.19 MPa, resulting in only minimal cracking at the tongue. Based on these calculations, it is advisable to take into account both the operational safety and economic considerations of the unit. Therefore, under the framework of scheme 2, it is recommended to locally enhance the reinforcement at the tongue. This targeted approach aims to mitigate the risk of cracking and to bolster the overall stability of the plant structure.

4. Conclusions

1.
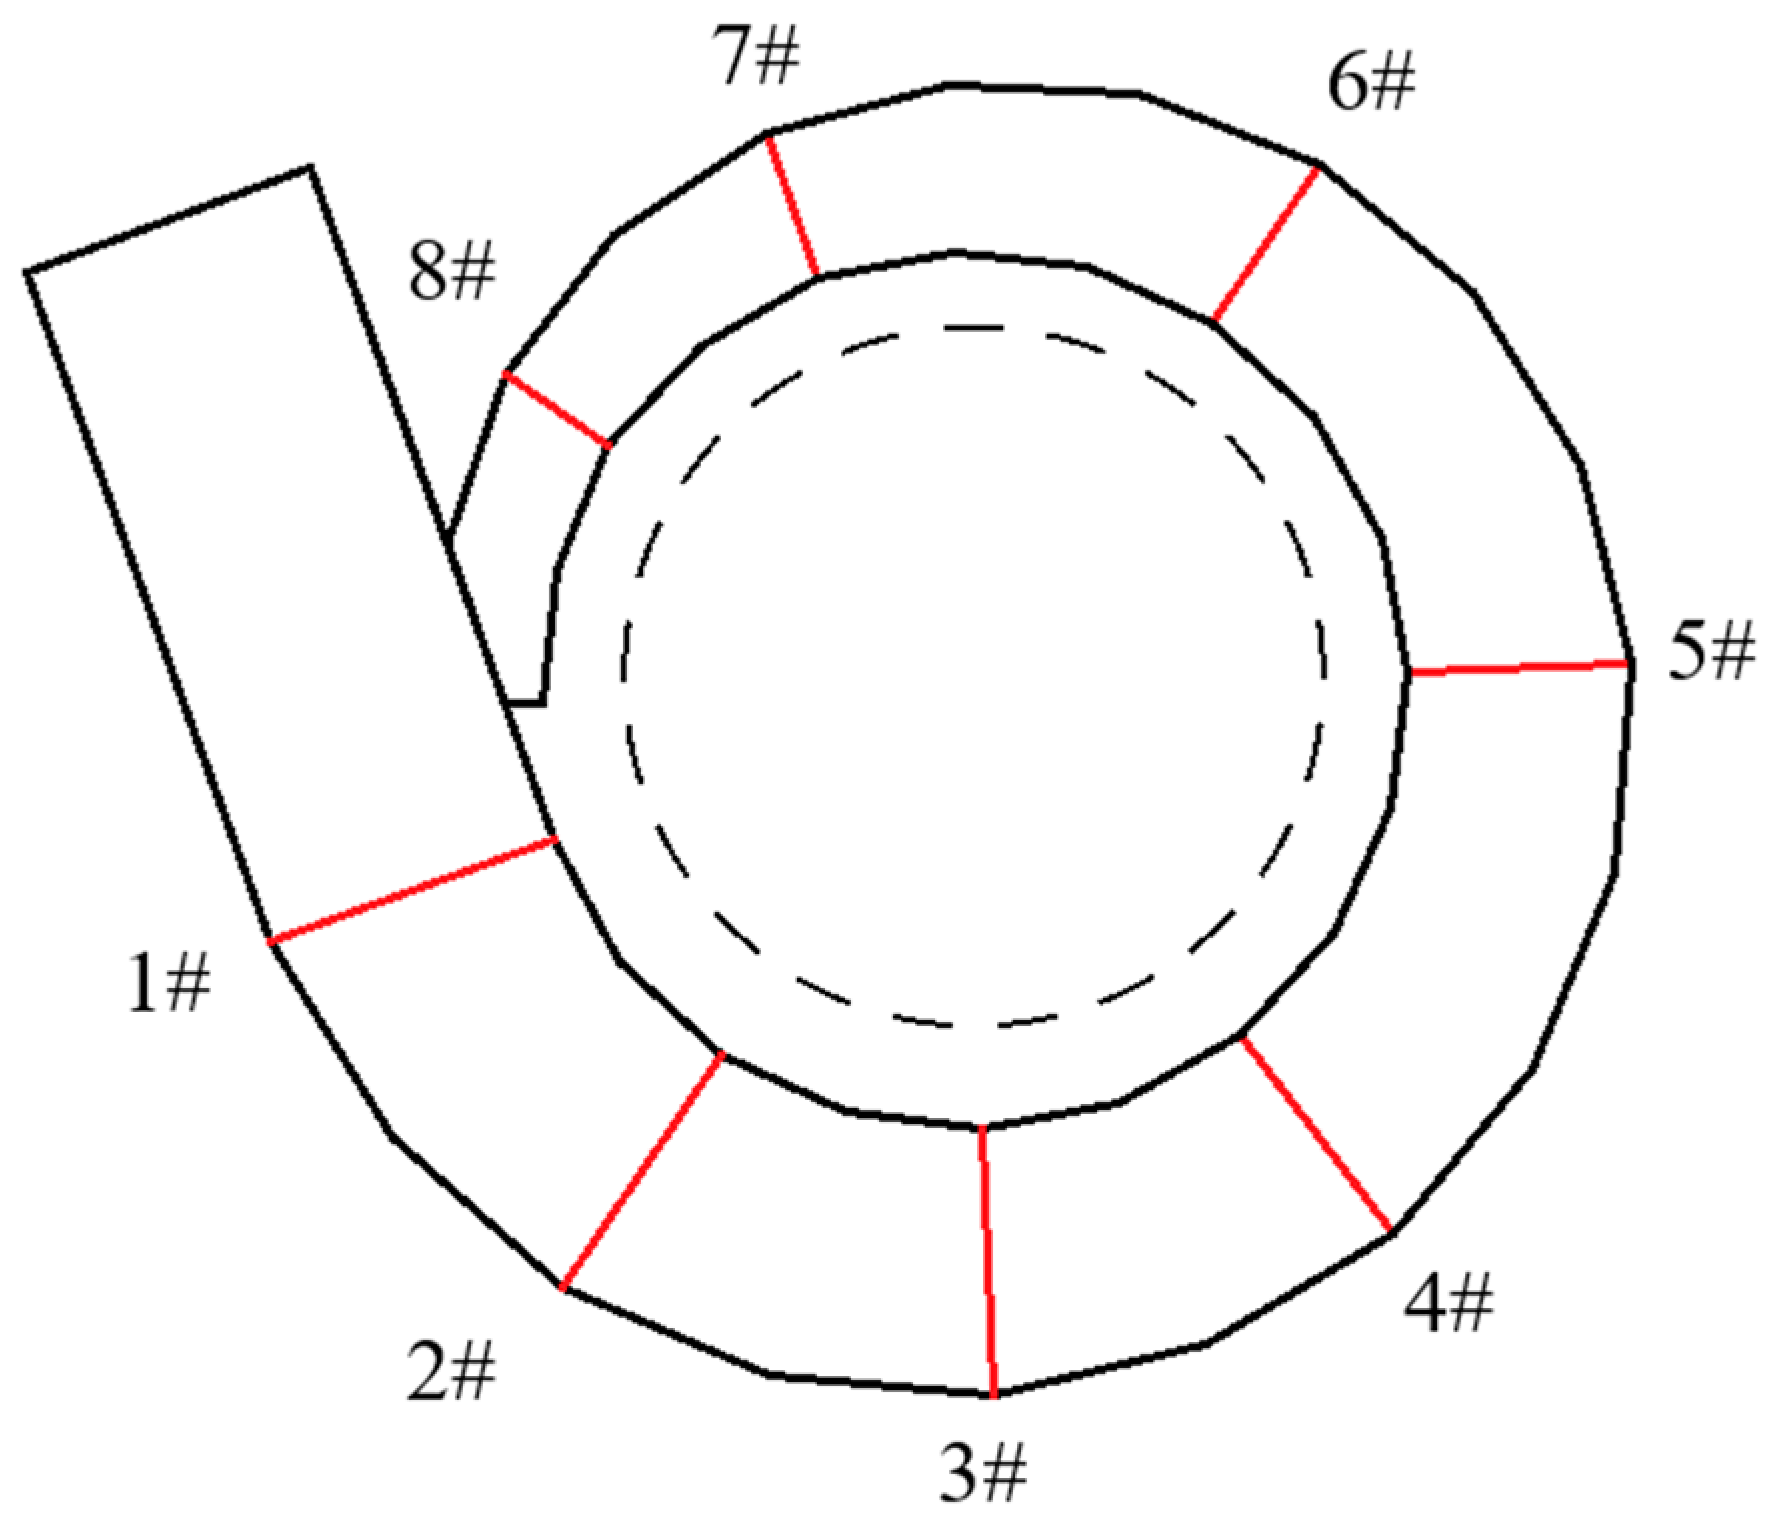
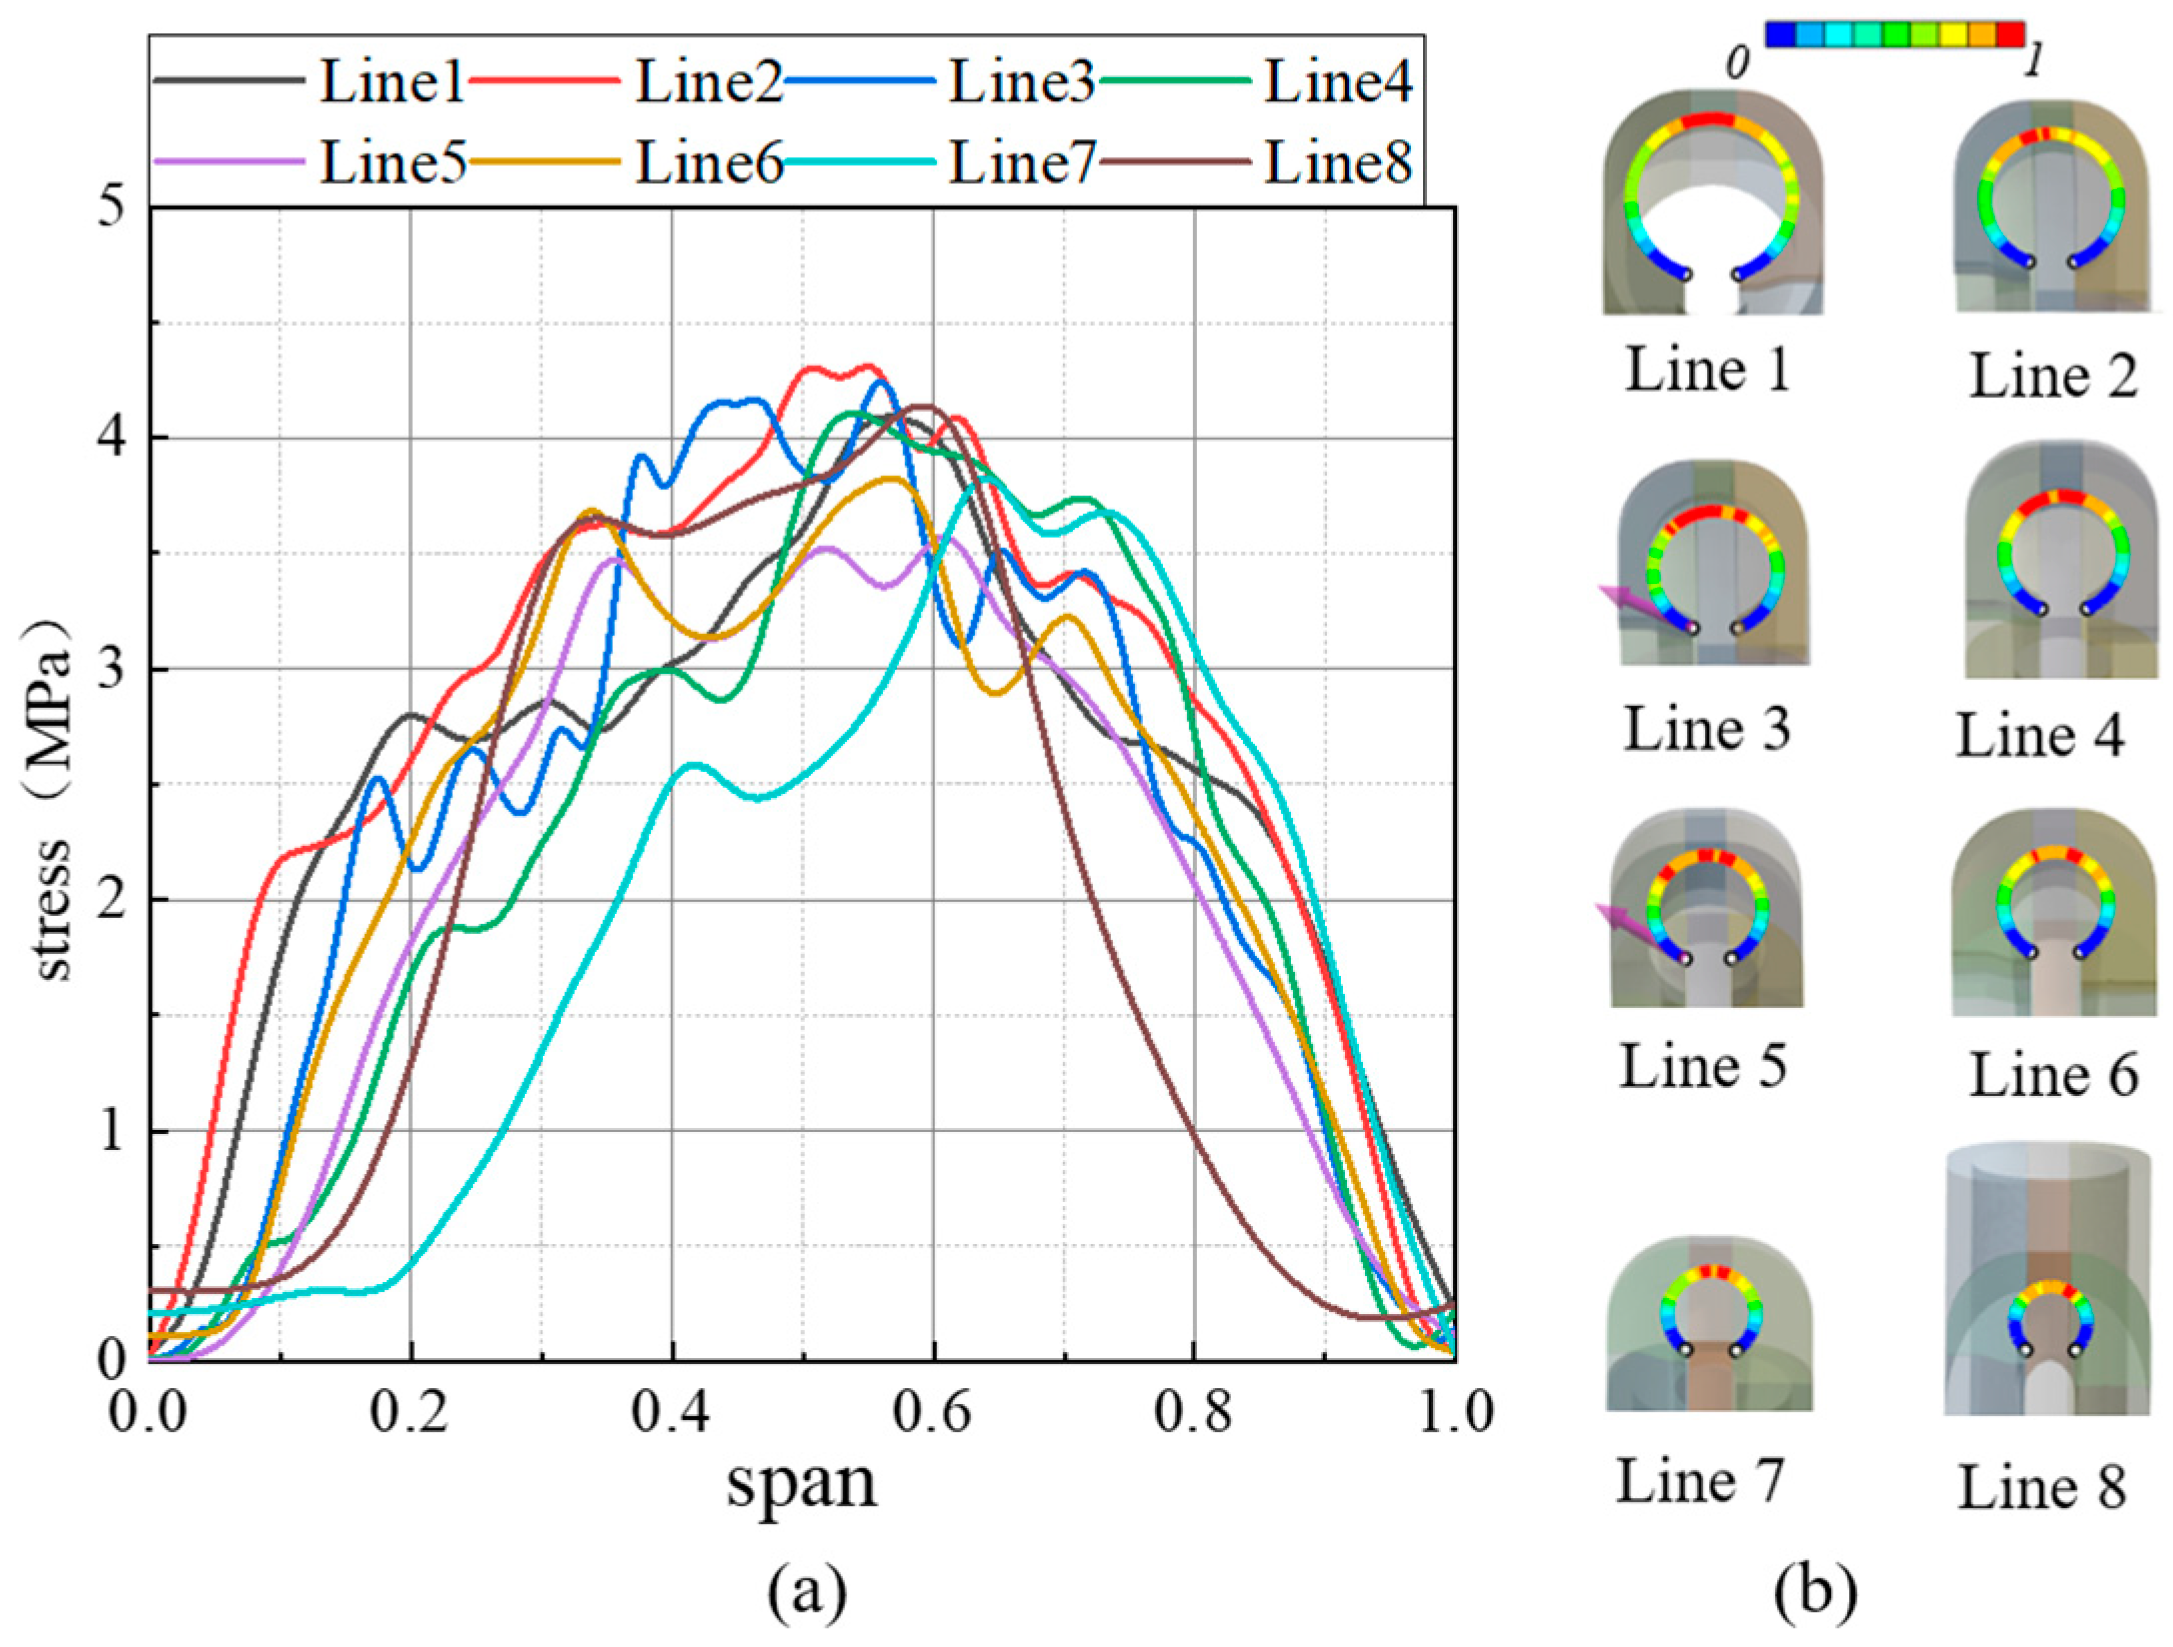
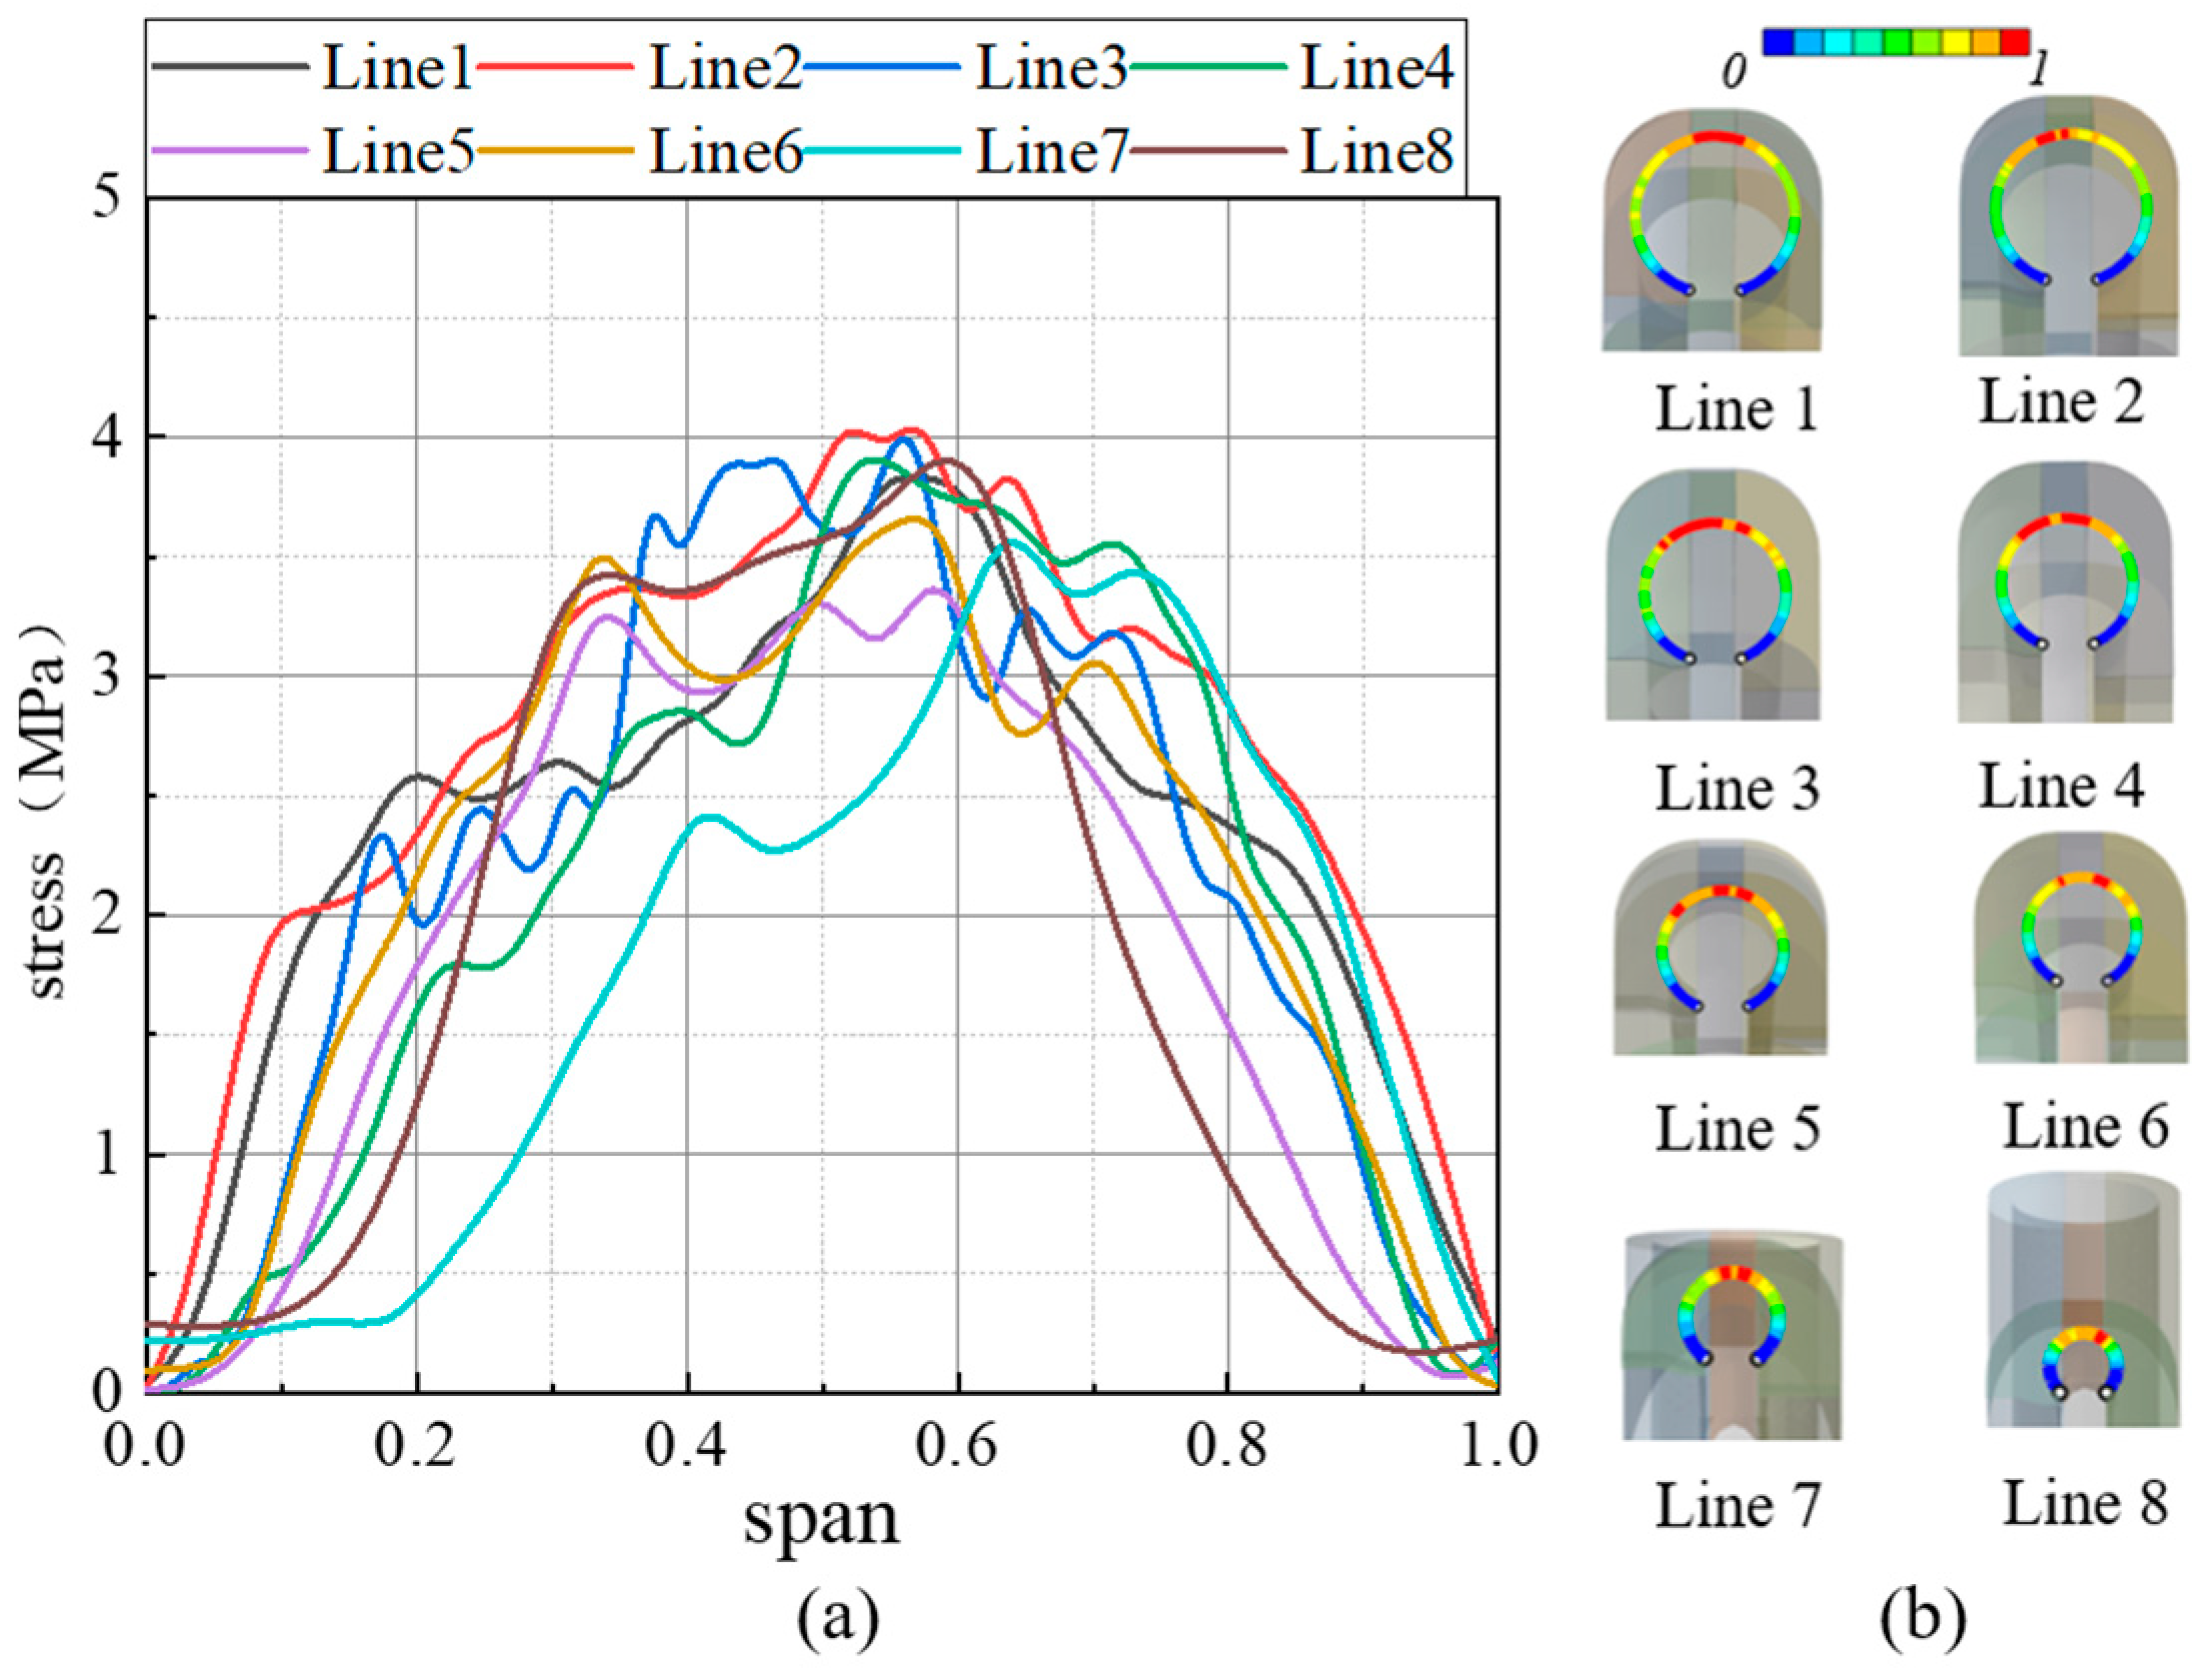
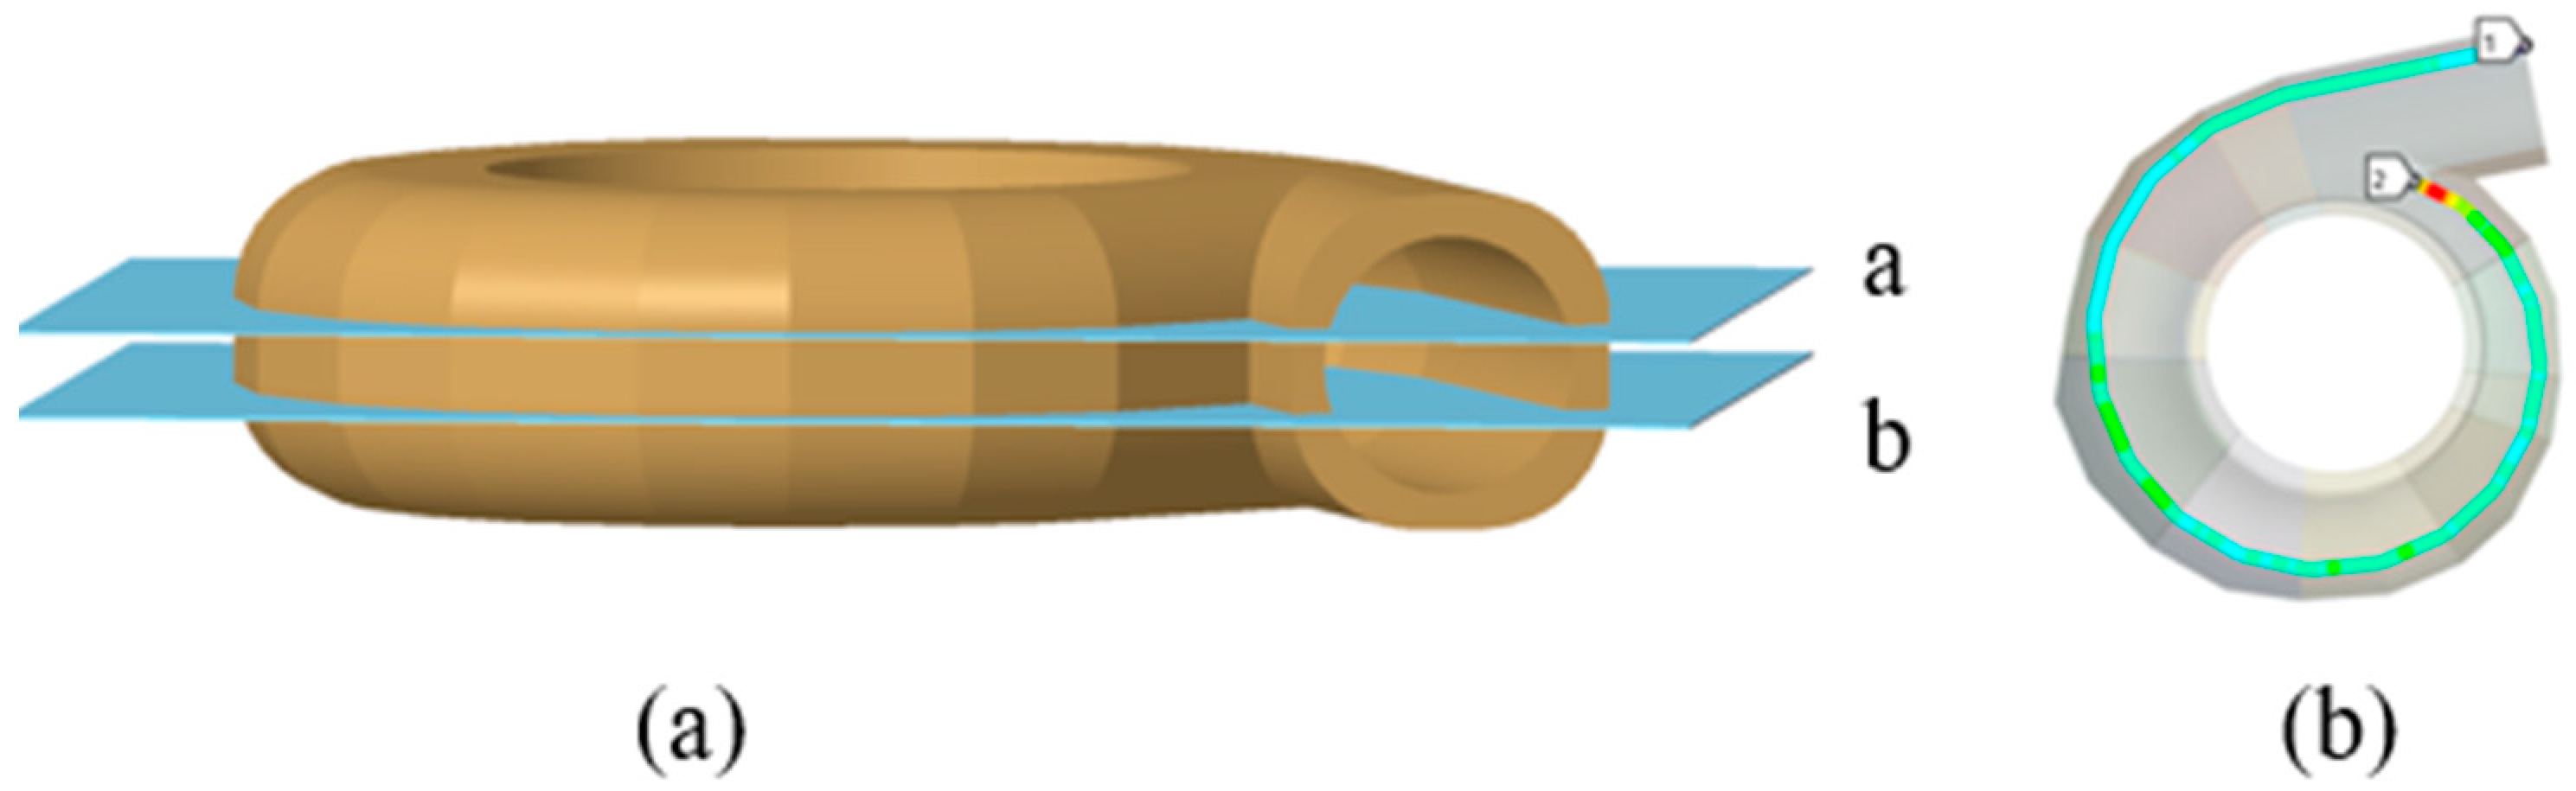
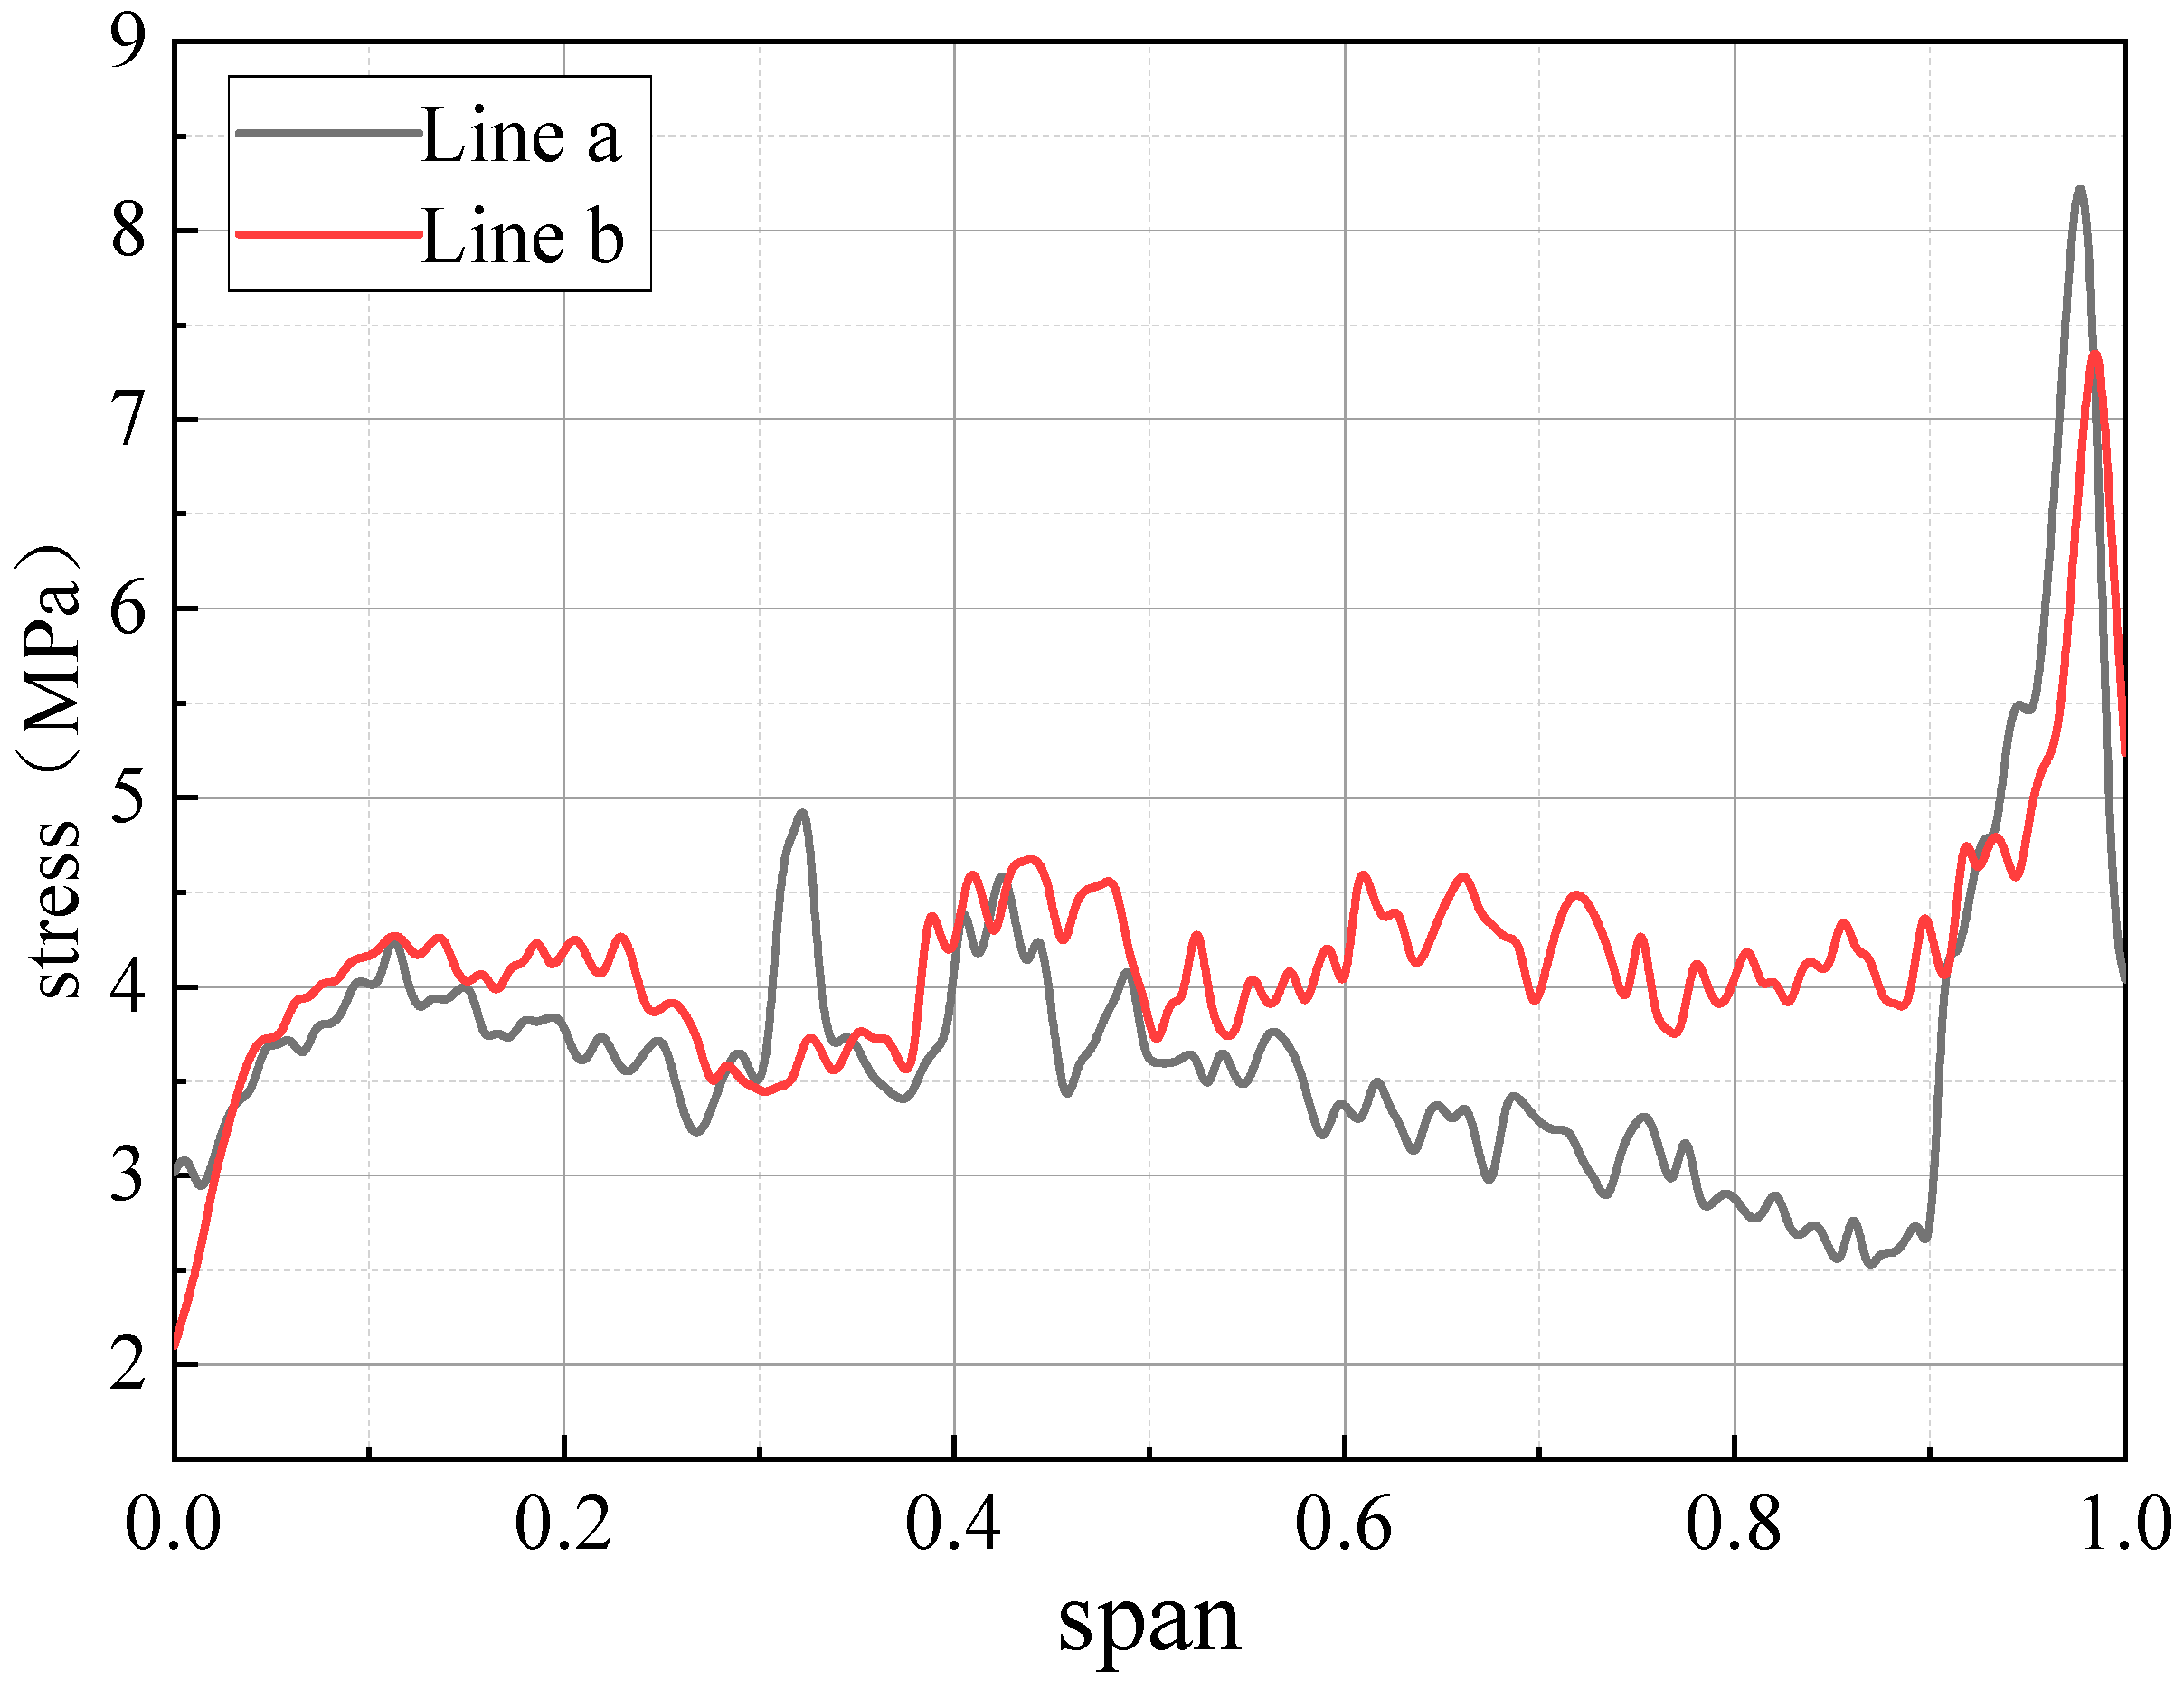
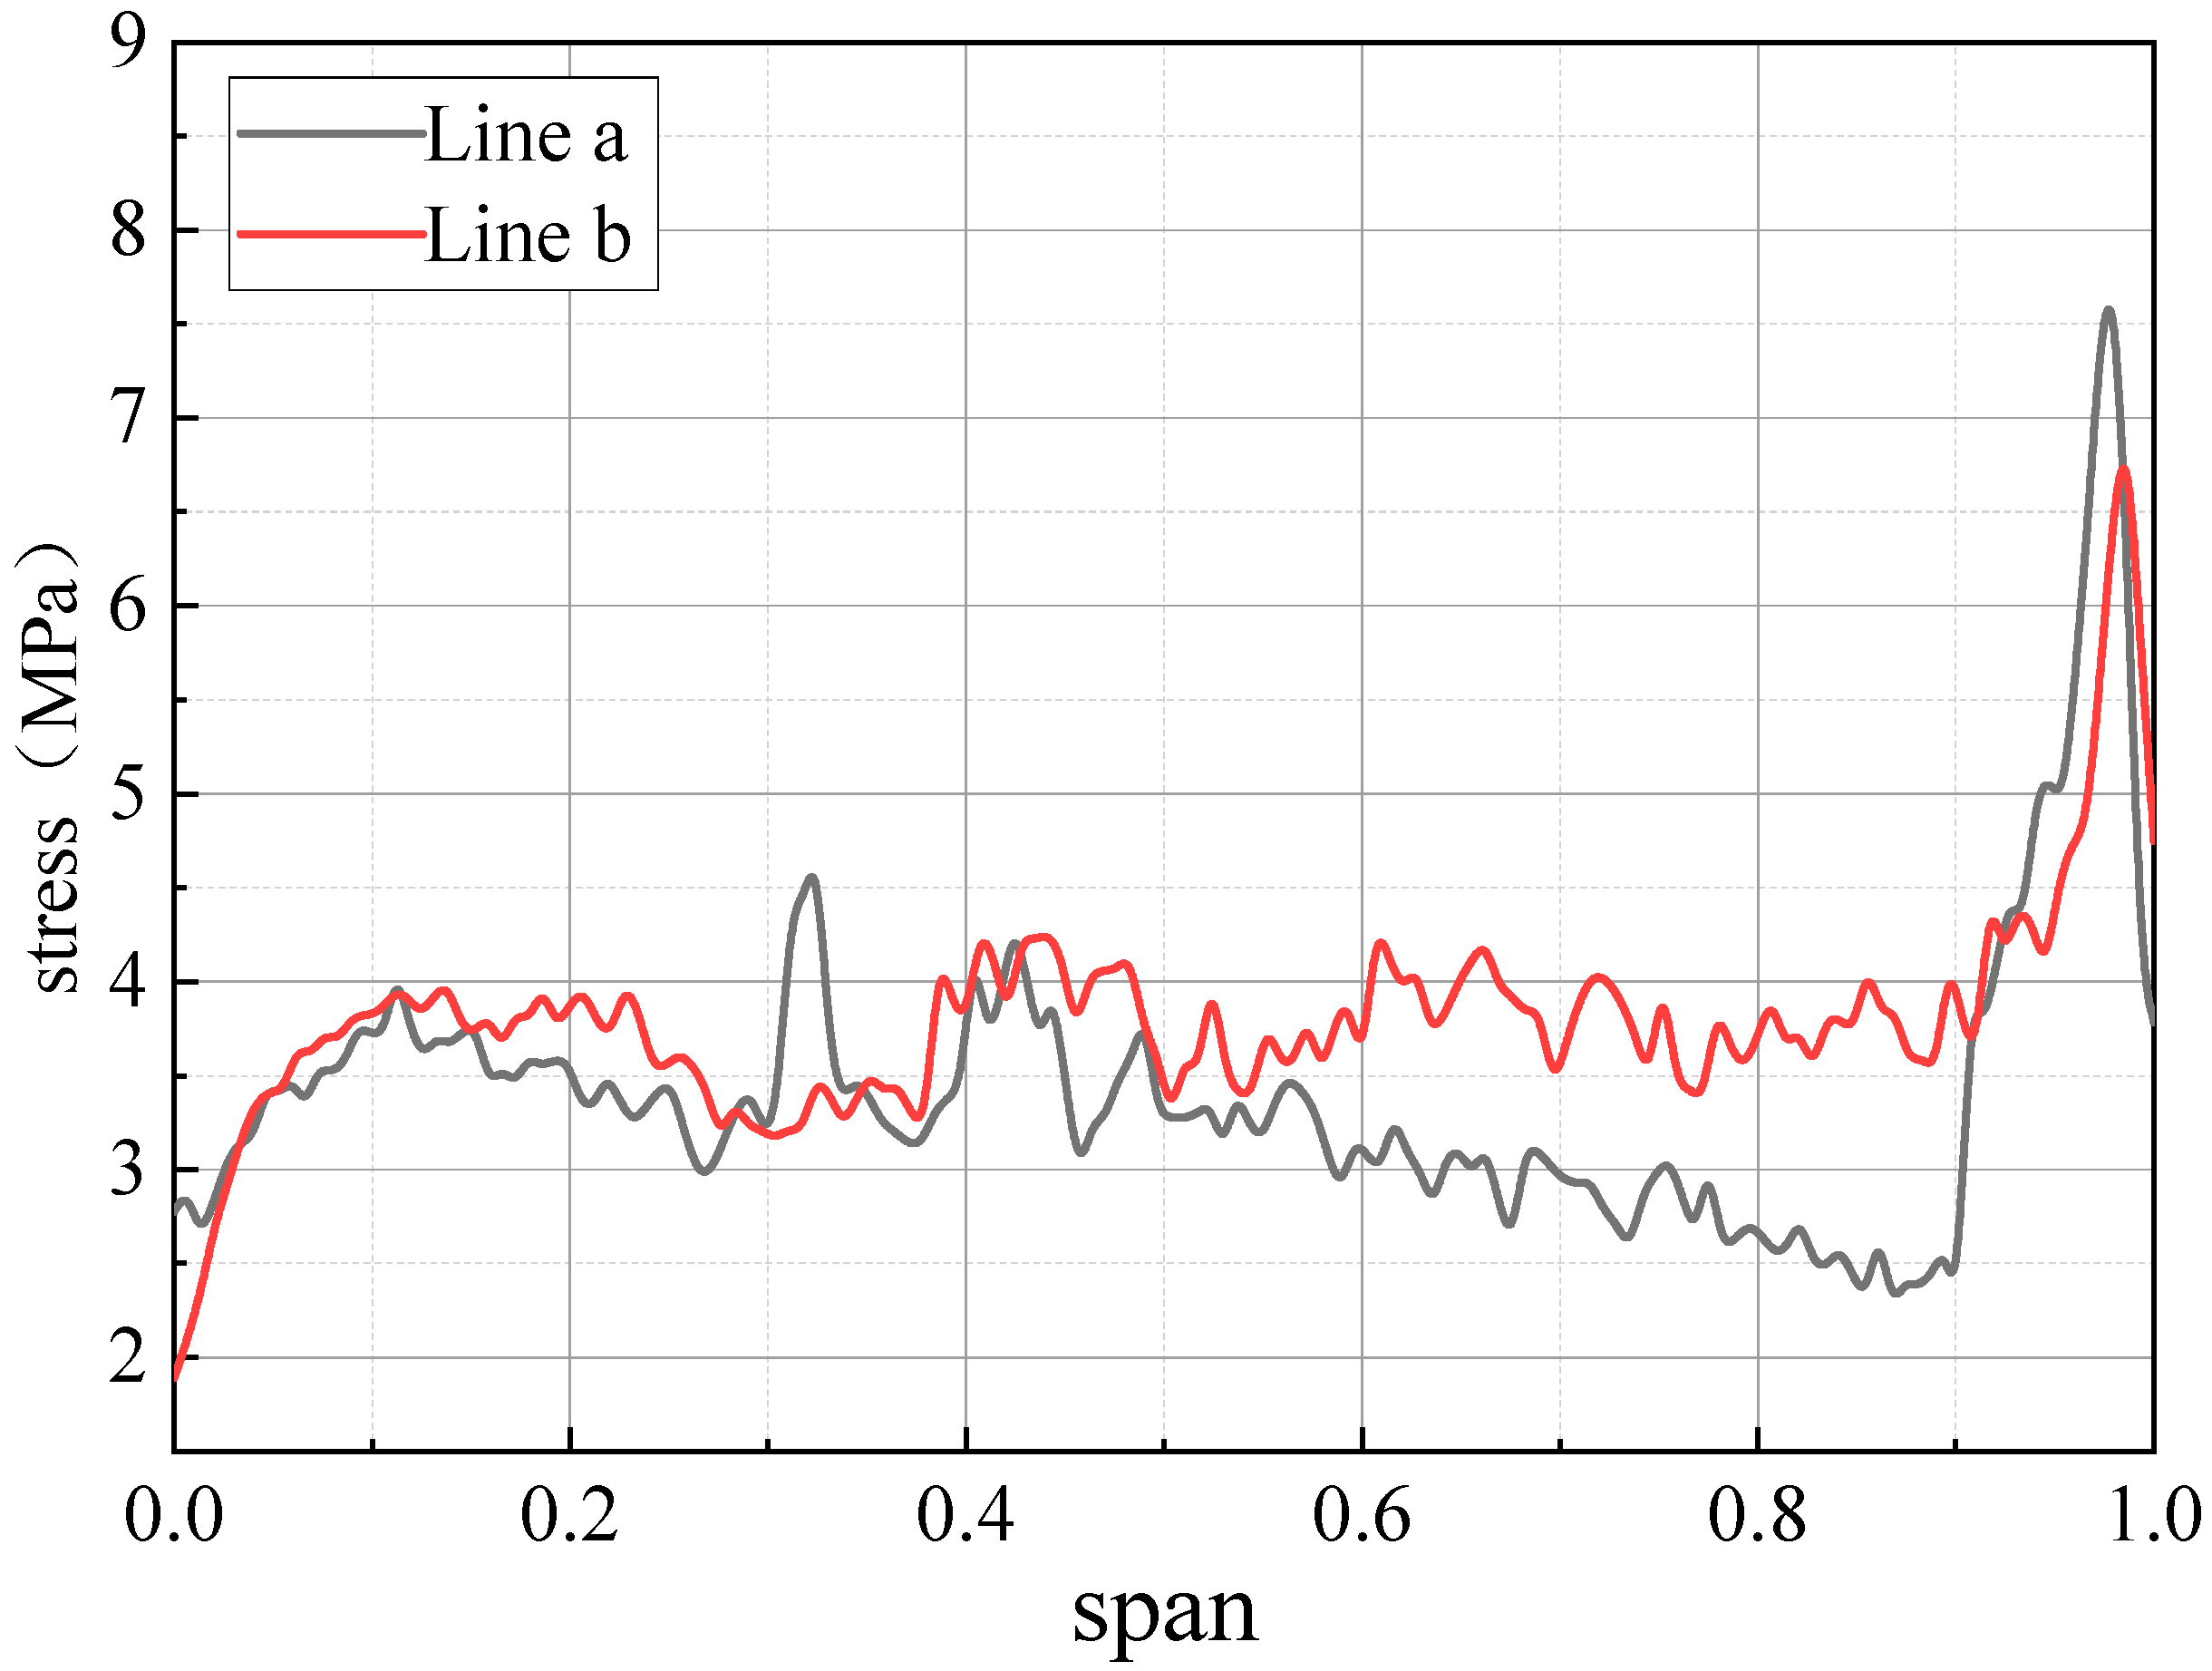
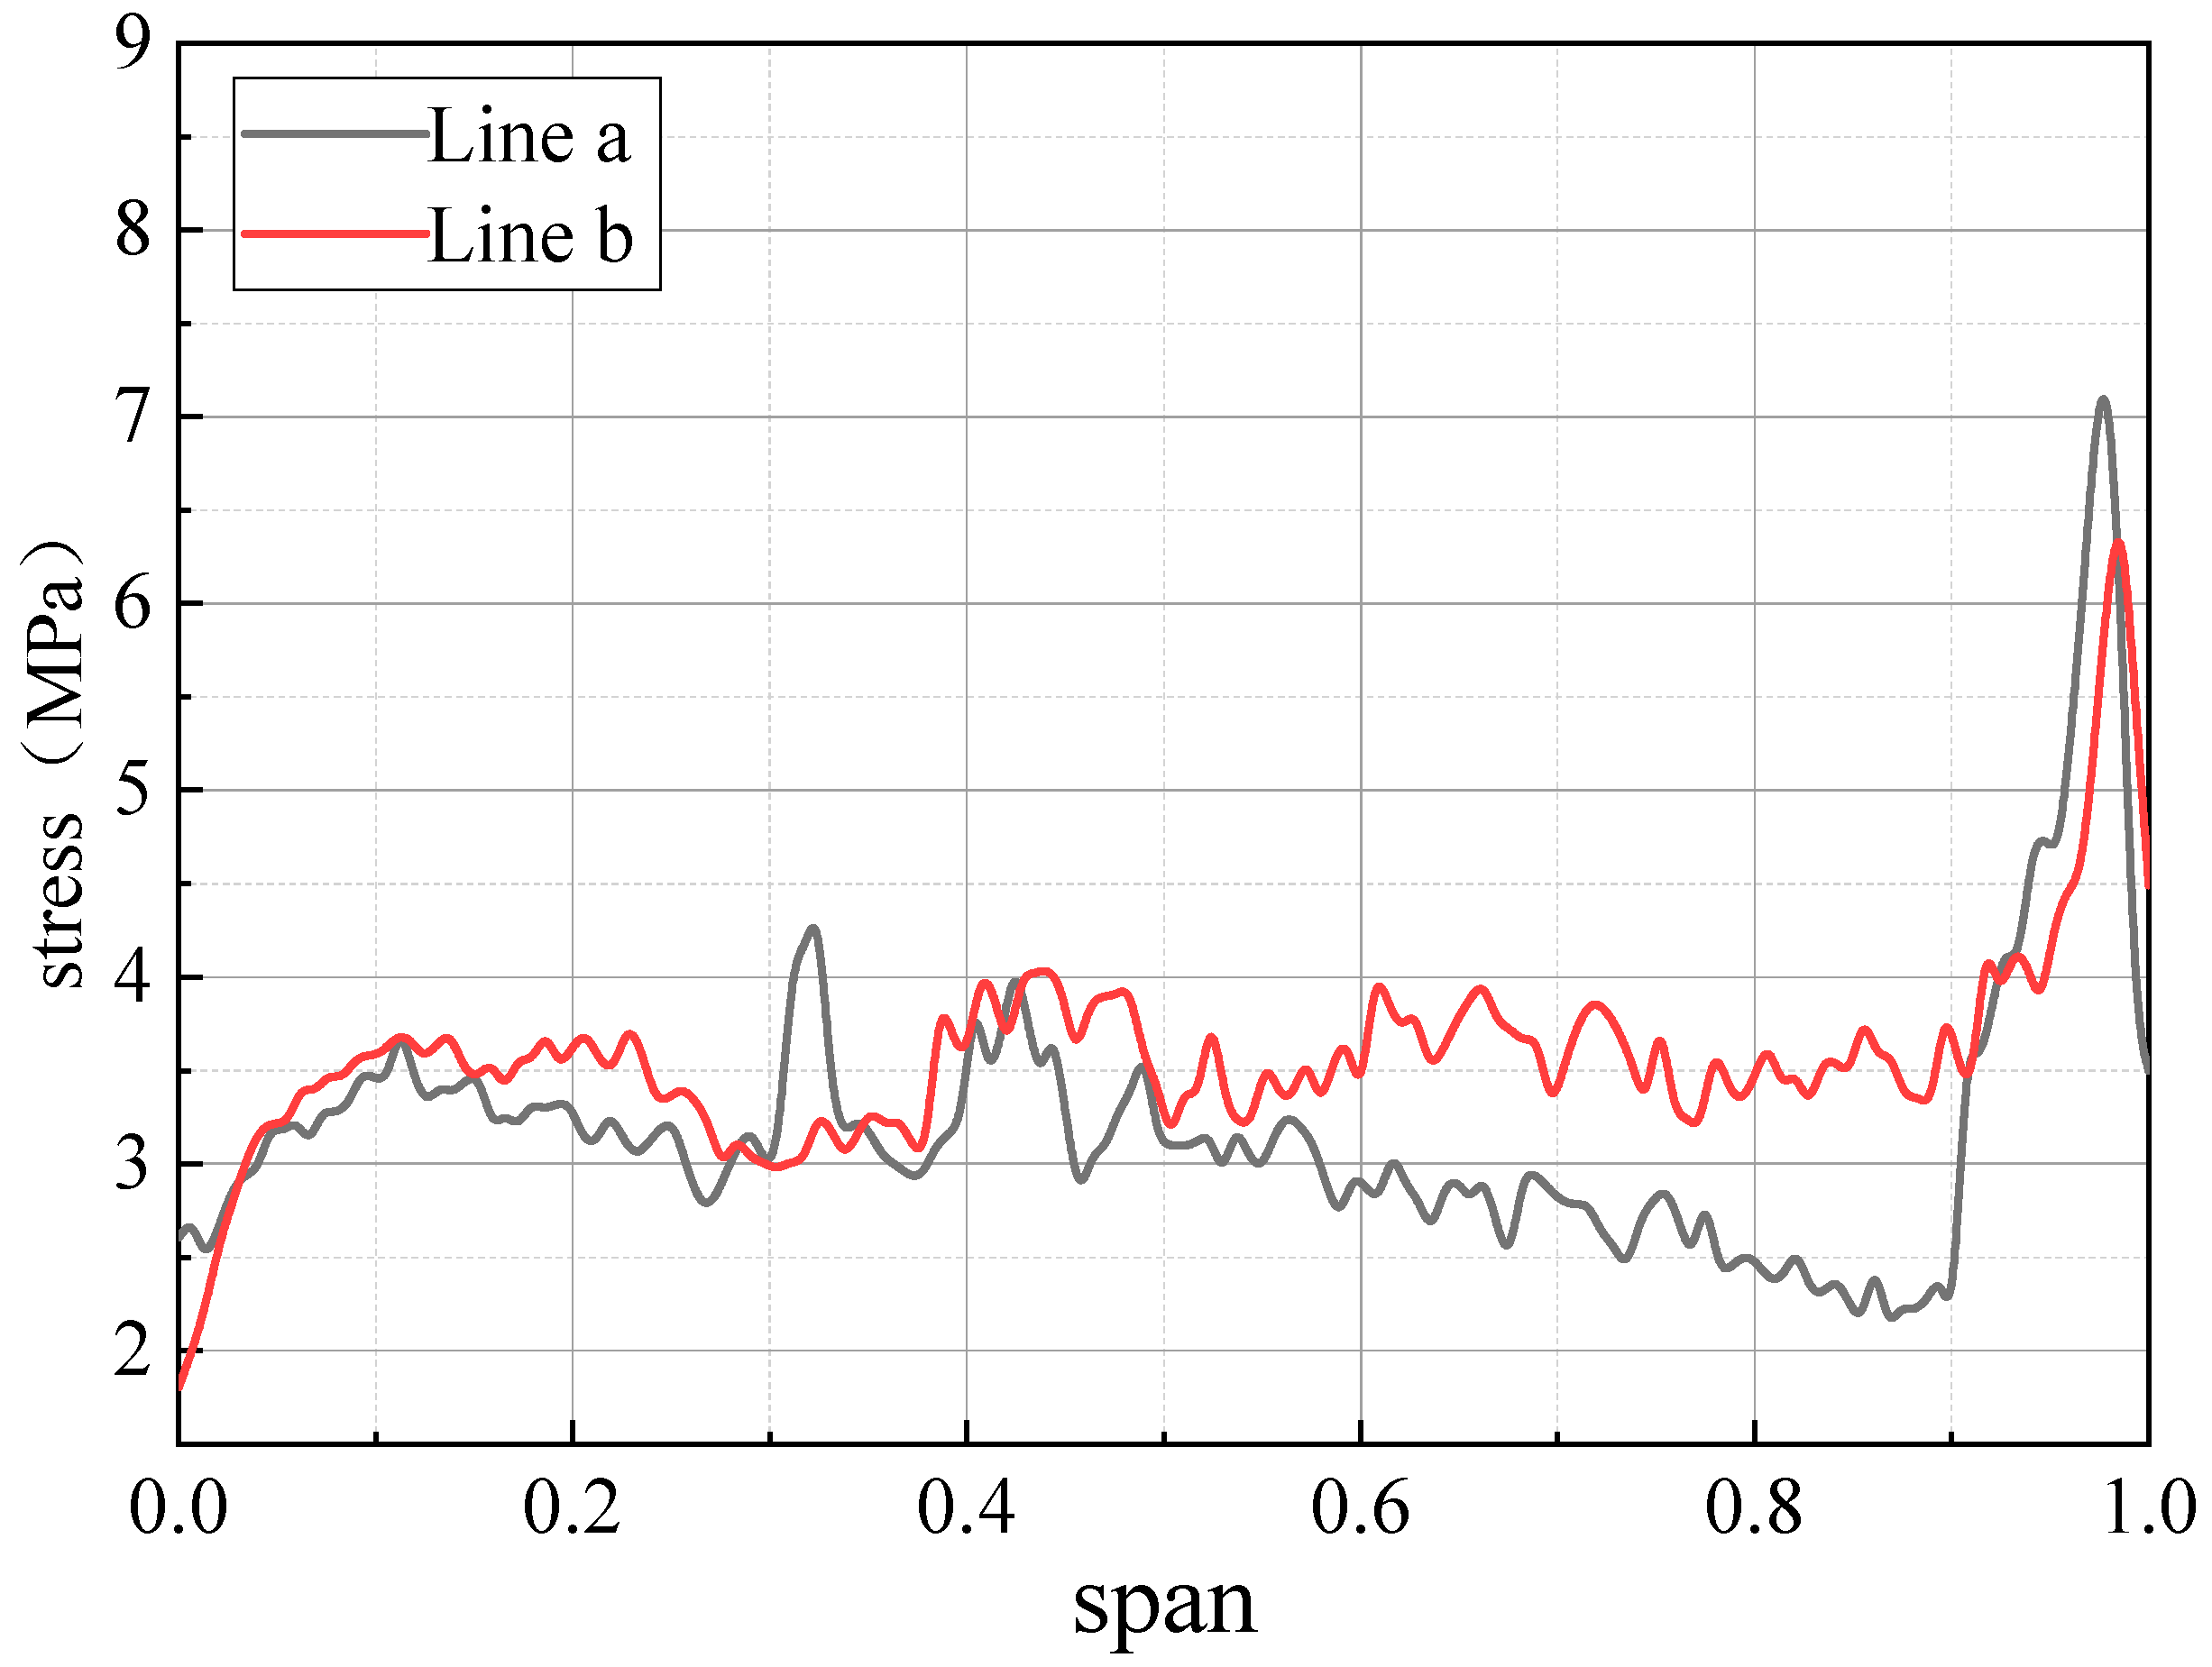
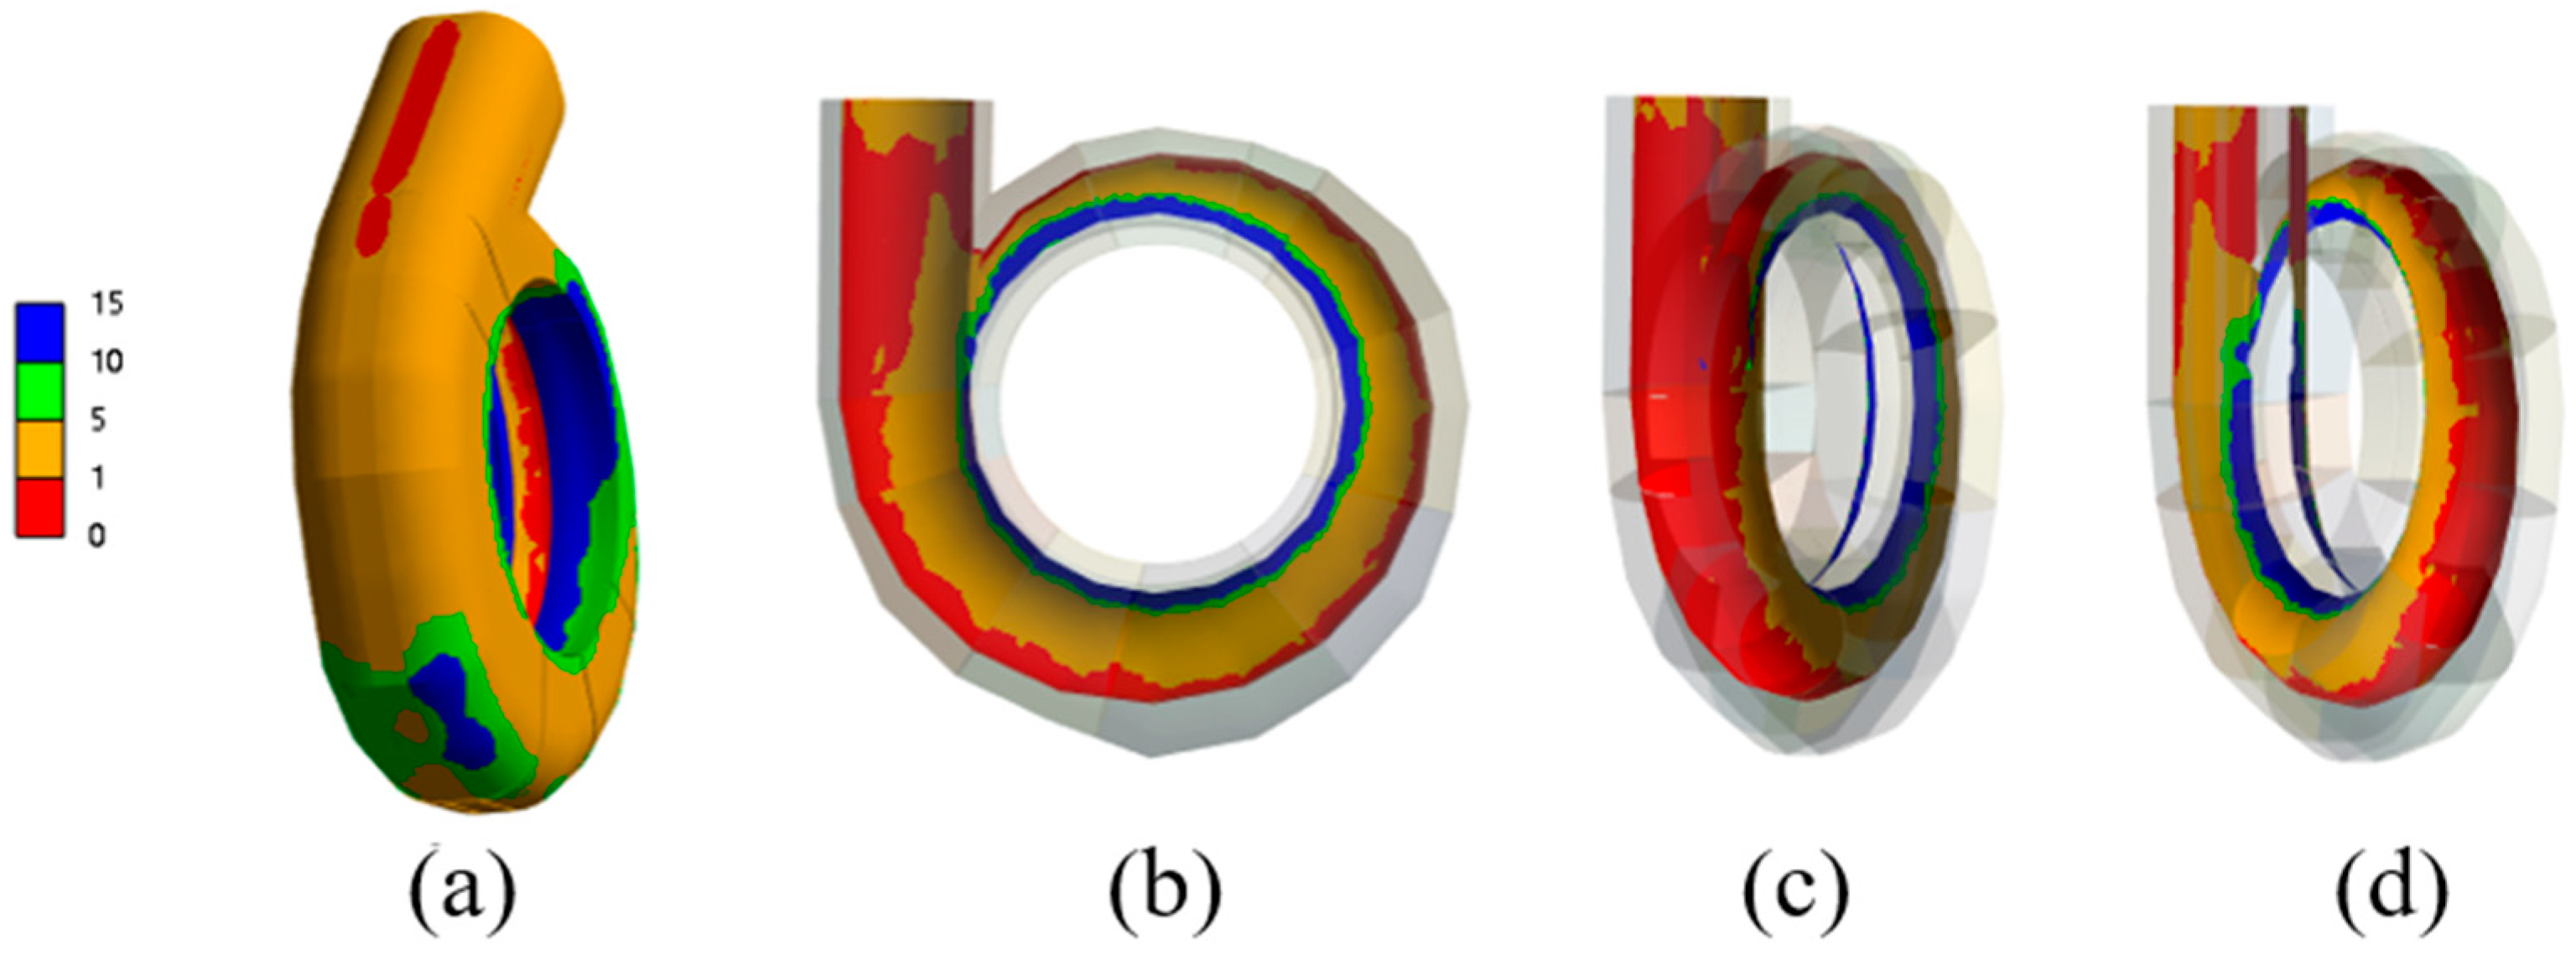
In the vertical direction, the maximum stress of the concrete inner surface decreases from 0.5 span to both sides. In the horizontal direction, the maximum stress of the concrete inner surface is concentrated at the volute inlet and the tongue. Along the spiral line, the stress of the volute section away from the inlet is small. Under the condition of throwing off the load, the stress fluctuates mainly around 4 MPa along the spiral line, not exceeding 5 MPa. The stress is the largest near the tongue, reaching 8.3 MPa.
2.
The variation law of inner surface stress under different working conditions is consistent, and the stress depends on the stability of the operating conditions of the turbine unit.
3.
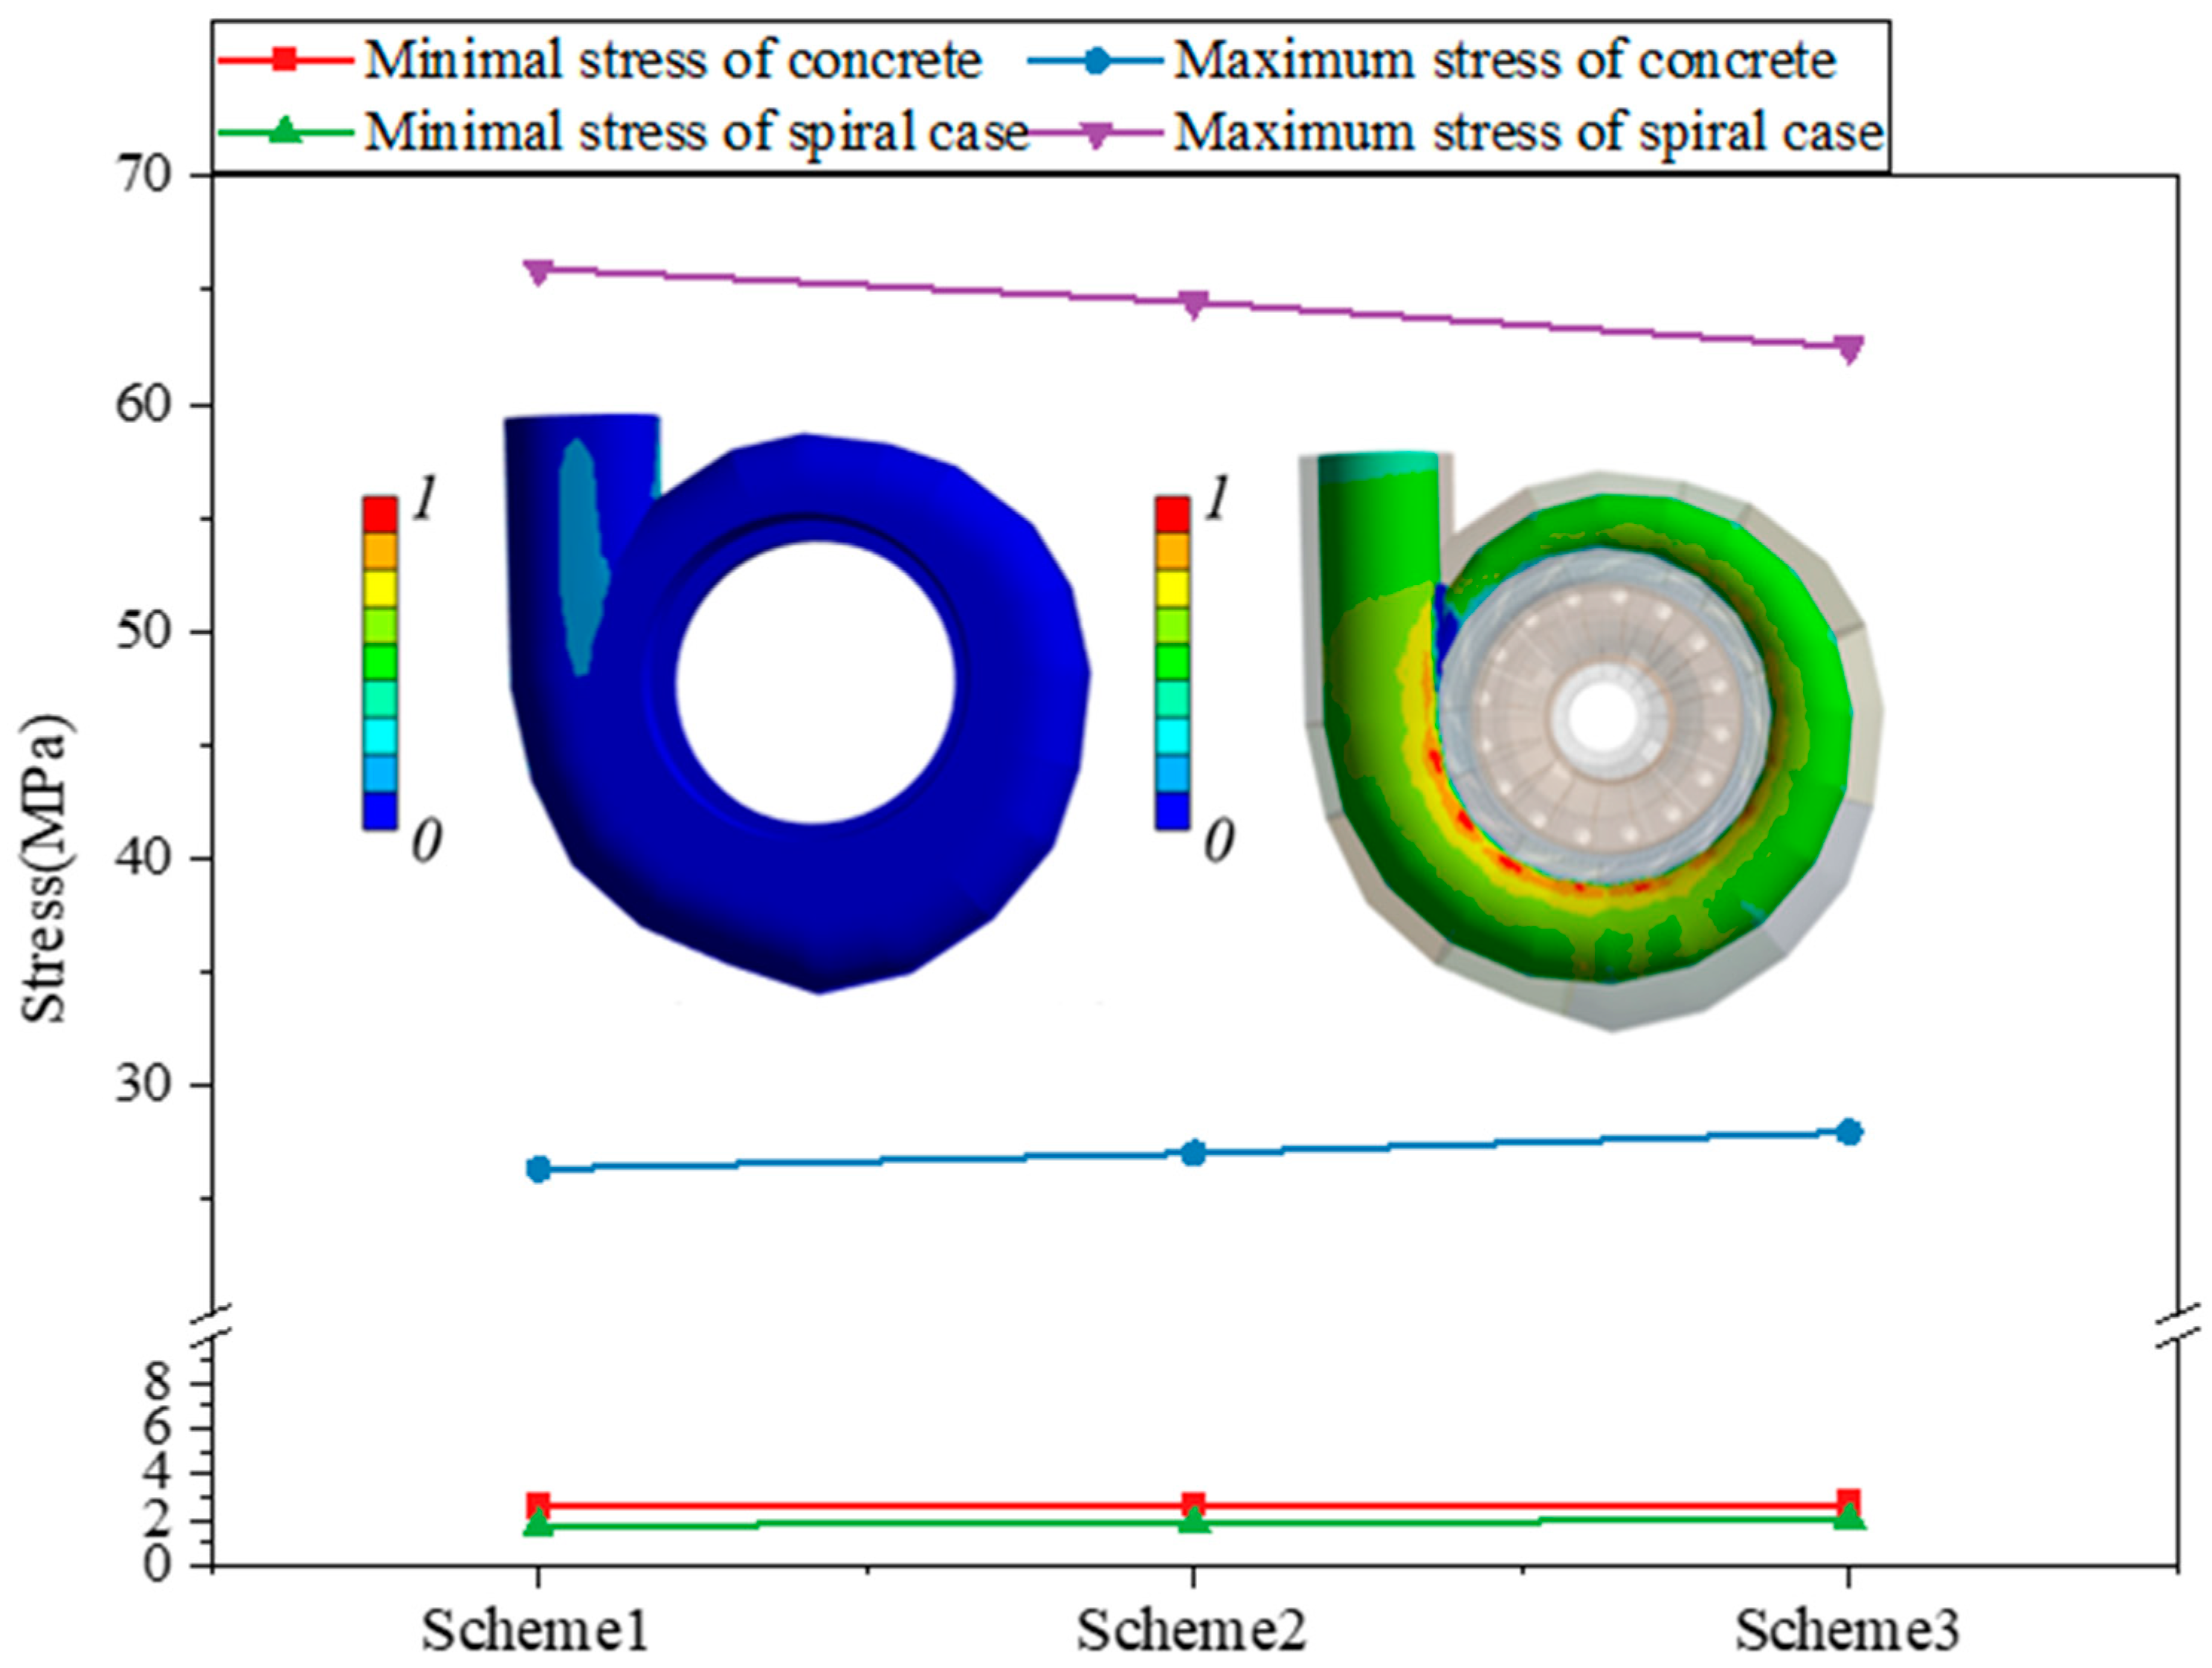
With the increase in tensile strength and elastic modulus, the point analysis of the inner surface of concrete shows that the compression of concrete decreases, and the increase of deformation in the Z direction leads to the increase in tensile stress.
4.
The concrete cracking is easy to occur at the tongue, and the local reinforcement can be arranged to strengthen the tensile strength of the concrete and increase the stability of the plant structure.

Author Contributions

Conceptualization, Y.Z. and Y.L.; methodology, Z.W.; software, Y.Z.; validation, X.L. and H.D.; formal analysis, Y.Z.; data curation, C.S.; writing—original draft preparation, Y.Z.; writing—review and editing, Y.Z.; visualization, X.L.; supervision, Z.W.; project administration, Y.Z.; funding acquisition, Z.W. All authors have read and agreed to the published version of the manuscript.

Funding

This study was supported by the Science and Technology Project of State Grid Xinyuan Group Company Limited (Contract No. SGXYKJ-2023-117), the Joint Open Research Fund Program of State Key Laboratory of Hydroscience and Engineering and Tsinehua—Ningxia Yinchuan Joint lnstitute of lnternet of Waters on Digital Water Governance (sklhse-2024-low07), and the Natural Science Foundation of Jiangsu Province (BK20210771).

Data Availability Statement

The raw data supporting the conclusions of this article will be made available by the authors on request.

Conflicts of Interest

Authors Xiji Li, Haiyang Dong and Chuanzhen Sun were employed by the company State Grid Xinyuan Shandong Weifang Pumped Storage Co., Ltd. The remaining authors declare that the research was conducted in the absence of any commercial or financial relationships that could be construed as a potential conflict of interest.

References

  1. Trivedi, C.; Gandhi, B.; Michel, C.J. Effect of transients on Francis turbine runner life: A review. J. Hydraul. Res. 2013, 51, 121–132. [Google Scholar] [CrossRef]
  2. Li, D.; Zhu, Y.; Lin, S.; Gong, R.; Wang, H.; Luo, X. Cavitation effects on pressure fluctuation in pump-turbine hump region. J. Energy Storage 2022, 47, 103936. [Google Scholar] [CrossRef]
  3. Fu, X.; Li, D.; Wang, H.; Zhang, G.; Li, Z.; Wei, X. Dynamic instability of a pump-turbine in load rejection transient process. Sci. China Technol. Sci. 2018, 61, 1765–1775. [Google Scholar] [CrossRef]
  4. Liang, A.; Li, H.; Zhang, W.; Yao, Z.; Zhu, B.; Wang, F. Study on pressure fluctuation and rotating stall characteristics in the vaneless space of a pump-turbine in pump mode. J. Energy Storage 2024, 94, 112385. [Google Scholar] [CrossRef]
  5. Yan, X.; Zhang, F.; Zheng, Y.; Kan, K.; Rossi, M. Numerical investigation of hydraulic instability of pump-turbines in fast pump-to-turbine transition. J. Energy Storage 2024, 96, 112731. [Google Scholar] [CrossRef]
  6. Yan, X.; Kan, K.; Zheng, Y.; Xu, Z.; Rossi, M.; Xu, L.; Chen, H. The vortex dynamics characteristics in a pump-turbine: A rigid vorticity analysis while varying guide vane openings in turbine mode. Energy 2024, 289, 130086. [Google Scholar] [CrossRef]
  7. Yan, X.; Kan, K.; Zheng, Y.; Chen, H.; Binama, M. Entropy Production Evaluation within a Prototype Pump-Turbine Operated in Pump Mode for a Wide Range of Flow Conditions. Processes 2022, 10, 2058. [Google Scholar] [CrossRef]
  8. Yan, X.T.; Kan, K.; Zheng, Y.; Chen, H.X. Spatial distribution of rigid vorticity in pump turbine under turbine mode with different heads. J. Phys. Conf. Ser. 2024, 2707, 012058. [Google Scholar] [CrossRef]
  9. Yan, X.T.; Kan, K.; Zheng, Y.; Chen, H.X. Spatial distribution of rigid vorticity in pump-turbine under turbine mode with different guide vane openings. J. Phys. Conf. Ser. 2024, 2752, 012065. [Google Scholar] [CrossRef]
  10. Zanetti, G.; Cavazzini, G.; Santolin, A.; Nascimben, F. Enhancing operational stability of a reversible pump-turbine through blade lean design. J. Energy Storage 2024, 92, 112218. [Google Scholar] [CrossRef]
  11. Zanetti, G.; Cavazzini, G.; Santolin, A. Effect of the von Karman Shedding Frequency on the Hydrodynamics of a Francis Turbine Operating at Nominal Load. Int. J. Turbomach. Propuls. Power 2023, 8, 27. [Google Scholar] [CrossRef]
  12. Zanetti, G.; Siviero, M.; Cavazzini, G.; Santolin, A. Application of the 3D Inverse Design Method in Reversible Pump Turbines and Francis Turbines. Water 2023, 15, 2271. [Google Scholar] [CrossRef]
  13. Zanetti, G.; Cavazzini, G.; Santolin, A. Three-dimensional evolution of the flow unsteadiness in the S-shape of pump-turbines and its correlation with the runner geometry. J. Energy Storage 2023, 57, 106176. [Google Scholar] [CrossRef]
  14. Lian, J.; Yang, X.; Wang, H. Propagation characteristics analysis of high-frequency vibration in pumped storage power station based on a 1D fluid-solid coupling model. J. Energy Storage 2023, 68, 107869. [Google Scholar] [CrossRef]
  15. Lian, J.; Xiao, T.; Liu, D.; Ye, F.; Xiong, D. The offshore prefabrication and semi-wet towing of a bucket foundation for offshore wind turbines. Ocean Eng. 2023, 285, 115354. [Google Scholar] [CrossRef]
  16. Liu, D.; Zhang, X.; Yang, Z.; Liu, K.; Cheng, Y. Evaluating the pressure fluctuations during load rejection of two pump-turbines in a prototype pumped-storage system by using 1D-3D coupled simulation. Renew. Energy 2021, 171, 1276–1289. [Google Scholar] [CrossRef]
  17. Khalfaoui, K.; Zorn, M.; Ségoufin, C.; André, F.; Kerner, J.; Riedelbauch, S. Dynamic stress prediction for a Pump-Turbine in Low-Load Conditions: Experimental validation and phenomenological analysis. Eng. Fail. Anal. 2024, 162, 108428. [Google Scholar] [CrossRef]
  18. Zeng, Y. Dynamic progressive collapse response of 3D monolithic precast concrete frame structures considering slab effects. Structures 2024, 60, 105928. [Google Scholar] [CrossRef]
  19. Gao, C.; Wang, J.; Wang, Y.; Wei, W. Behaviour of concrete-filled circular steel tubular K-joints in wind turbine towers. J. Constr. Steel Res. 2024, 218, 108694. [Google Scholar] [CrossRef]
  20. Sun, B.; Guo, T. Multiple factors-based damage level assessment method of concrete structures based on evidential reasoning and particle swarm optimization. Eng. Struct. 2024, 316, 118626. [Google Scholar] [CrossRef]
  21. Sun, B.; Du, S. Kernel extreme learning machine and finite element method fusion fire damage prediction of concrete structures. Structures 2024, 68, 107172. [Google Scholar] [CrossRef]
  22. Sun, B.; Guo, T. Mechanism-driven and data-driven fusion prediction of seismic damage evolution of concrete structures based on cooperative multi-particle swarm optimization. Eng. Appl. Artif. Intell. 2024, 133, 108659. [Google Scholar] [CrossRef]
  23. Sun, B.; Li, Y.; Guo, T. A particle swarm optimization and prior knowledge fusion seismic damage prediction of concrete structures. Appl. Soft Comput. 2024, 157, 111552. [Google Scholar] [CrossRef]
  24. Jin, K.-Y.; Zhou, X.-H.; Ren, W.; Wang, Y.-H.; Luo, W. Research on hexagonal concrete-filled steel tubular transition pieces for wind turbine hybrid towers under axial compression. Thin-Walled Struct. 2024, 200, 111956. [Google Scholar] [CrossRef]
  25. Jin, K.-Y.; Zhou, X.-H.; Ren, W.; Wang, Y.-H.; Li, R.-F. Axial compressive behavior of concrete-filled double skin steel tubular columns with different stiffening constructions for wind turbine towers. Structures 2024, 63, 106390. [Google Scholar] [CrossRef]
  26. Velarde, J.; Mankar, A.; Kramhøft, C.; Sørensen, J.D. Probabilistic calibration of fatigue safety factors for offshore wind turbine concrete structures. Eng. Struct. 2020, 222, 111090. [Google Scholar] [CrossRef]
  27. Velarde, J.; Kramhøft, C.; Sørensen, J.D.; Zorzi, G. Fatigue reliability of large monopiles for offshore wind turbines. Int. J. Fatigue 2020, 134, 105487. [Google Scholar] [CrossRef]
  28. Velarde, J.; Bachynski, E.E. Design and fatigue analysis of monopile foundations to support the DTU 10 MW offshore wind turbine. Energy Procedia 2017, 137, 3–13. [Google Scholar] [CrossRef]
  29. Velarde, J.; Kramhøft, C.; Mankar, A.; Sørensen, J.D. Uncertainty Modeling and Fatigue Reliability Assessment of Offshore Wind Turbine Concrete Structures. Int. J. Offshore Polar Eng. 2019, 29, 165–171. [Google Scholar] [CrossRef]
  30. Hu, L.; Liang, A.; Li, H.; Zhang, W.; Zhu, B. Impact of rotor–stator axial spacing on the gas–liquid–solid flow characteristics of a multiphase rotodynamic pump based on the Euler multi-fluid model. Phys. Fluids 2024, 36, 063314. [Google Scholar] [CrossRef]
  31. Surkutwar, Y.; Sandu, C.; Untaroiu, C. Review of modeling methods of compressed snow-tire interaction. J. Terramech. 2023, 105, 27–40. [Google Scholar] [CrossRef]
Figure 1. Plant and unit structure model diagram.
Water 16 02687 g001
Figure 2. Plant unit final assembly model diagram.
Water 16 02687 g002
Figure 3. Steel bar layout diagram.
Water 16 02687 g003
Figure 4. Mohr diagram and failure envelopes.
Water 16 02687 g004
Figure 5. Vertical section of concrete b area.
Water 16 02687 g005
Figure 6. Stress distribution of vertical section in concrete b area (load rejection condition).
Water 16 02687 g006
Figure 7. Stress distribution of vertical section in concrete b area (maximum head pumping condition under pump condition).
Water 16 02687 g007
Figure 8. Stress distribution of vertical section in concrete b area (rated condition of turbine).
Water 16 02687 g008
Figure 9. Horizontal section of concrete b area. The section distribution is illustrated in (a), while (b) shows the stress ex-tracted from the curve of the inner surface of the concrete, extending from the inlet to the end of the tongue. The volute is analyzed along the symmetrical sections on both sides of the central hori-zontal plane.
Water 16 02687 g009
Figure 10. Horizontal section of concrete b area (load rejection condition).
Water 16 02687 g010
Figure 11. Horizontal section of concrete b area (maximum head pumping condition of pump condition).
Water 16 02687 g011
Figure 12. Horizontal section of concrete b area (rated condition of turbine).
Water 16 02687 g012
Figure 13. Fatigue analysis of concrete zone B without reinforcement under different perspectives. (ad) provide a comprehensive view of the cracking on the inner surface of the concrete.
Water 16 02687 g013
Figure 14. The deformation of concrete and volute in three schemes.
Water 16 02687 g014
Figure 15. Three schemes of the concrete and volute stress diagram.
Water 16 02687 g015
Figure 16. Concrete point analysis diagram.
Water 16 02687 g016
Figure 17. Three schemes of safety factor distribution of the concrete b area.
Water 16 02687 g017
Table 1. Main characteristic parameters of vertical shaft single-stage mixed flow reversible pump-turbine.
ParameterValue
Rated flow rate, m3/s105.8
Rated head, m326
Rated speed, rpm333.3
Rated output of the turbine, MW306
Diameter of the high-pressure side of the runner, m4.81
Number of stay vanes, piece15
Number of active guide vanes, piece16
Number of runner blades (long + short), piece5 + 5
Table 2. Structural parameters.
MaterialDensity ρ /(kg/m3)Strength Limit U T S /MPa
Concrete26903.2
Spiral case (HD610F) 610
Table 3. Parameters of three schemes.
Z1Z2Z3FstkEs
Scheme 11922309.1130,370
Scheme 230405013.2032,190
Scheme 342526216.1934,812
Table 4. The deformation in three directions under three schemes.
Deformation—X (mm)Deformation—Y (mm)Deformation—Z (mm)
Scheme 10.131430.0309710.01294
Scheme 20.125090.0296970.013171
Scheme 30.11690.0280420.013387
Disclaimer/Publisher’s Note: The statements, opinions and data contained in all publications are solely those of the individual author(s) and contributor(s) and not of MDPI and/or the editor(s). MDPI and/or the editor(s) disclaim responsibility for any injury to people or property resulting from any ideas, methods, instructions or products referred to in the content.

