Abstract
Groundwater salinization poses a critical threat to sustainable development in arid and semi-arid rurbanizing regions, exemplified by Kerman Province, Iran. This region experiences groundwater ecosystem degradation as a result of the rapid conversion of rural agricultural land to urban areas under chronic drought conditions. This study aims to enhance Groundwater Pollution Risk (GwPR) mapping by integrating the DRASTIC index with machine learning (ML) models, including Random Forest (RF), Boosted Regression Trees (BRT), Generalized Linear Model (GLM), Support Vector Machine (SVM), and Multivariate Adaptive Regression Splines (MARS), alongside hydrogeochemical investigations, to promote sustainable water management in Kerman Province. The RF model achieved the highest accuracy with an Area Under the Curve (AUC) of 0.995 in predicting GwPR, outperforming BRT (0.988), SVM (0.977), MARS (0.951), and GLM (0.887). The RF-based map identified new high-vulnerability zones in the northeast and northwest and showed an expanded moderate vulnerability zone, covering 48.46% of the study area. Analysis revealed exceedances of WHO standards for total hardness (TH), sodium, sulfates, chlorides, and electrical conductivity (EC) in these high-vulnerability areas, indicating contamination from mineralized aquifers and unsustainable agricultural practices. The findings underscore the RF model’s effectiveness in groundwater prediction and highlight the need for stricter monitoring and management, including regulating groundwater extraction and improving water use efficiency in riverine aquifers.
1. Introduction
Groundwater, constituting roughly half of the world’s potable and agricultural water resources, is indispensable to global freshwater availability [1,2]. Groundwater resources thus play a crucial role in the Earth’s biogeochemical cycles, especially in arid and semi-arid regions [3,4]. As global populations expand, the imperative for water security intensifies, prompting widespread efforts in developing nations to identify and assess critical groundwater reserves [5,6,7,8]. Despite these efforts, groundwater resources remain vulnerable to salinization, driven by population growth, increasing urban water consumption, and the intensifying impacts of global climate change [9,10].
Several studies have investigated the presence of chemical pollutants in groundwater [11], highlighting the substantial impact of human activities on water quality, particularly in rurbanizing landscapes [12]. Developing countries are increasingly confronted with challenges related to illegal drilling, a consequence of rapid rurbanization [13,14]. Rurbanization refers to the process by which rural areas, especially in developing regions across Asia, Africa, and Latin America, undergo profound economic and social transformations [15]. These changes often involve the introduction of urban infrastructure, services, and amenities—such as improved transportation, healthcare, education, and communication networks—while retaining aspects of rural life and cultural traditions. Regrettably, unplanned industrialization exacerbates pressure on water resources, thereby diminishing sustainability considerations [16]. Additionally, population growth has driven unplanned urbanization, posing significant risks to both the quantity and quality of groundwater, particularly in arid and semi-arid regions where the impacts of climate change are unpredictable [17,18]. These stressors pose serious concerns for the integrity of ecosystems, striking a balance between current demands and preserving the resource for future generations [14,15]. This is particularly critical in water-scarce regions like Iran [12], balancing current needs with the preservation of water resources for future generations [5,19]. Consequently, ensuring a sustainable supply and efficient utilization of agricultural water resources is vital for maintaining food security and achieving sustainable economic and social development.
To this end, GwPR assessment is a key component of global water resource management, mitigating the adverse effects of aquifer salinization [20,21]. However, accurately assessing GwPR necessitates examining the complex interactions between natural geomorphological and hydrogeological factors, along with anthropogenic influences [22,23]. This assessment can enhance not only human health but also economic growth, social progress, and environmental conservation. Various methods have been employed globally to assess groundwater pollution and vulnerability, including interpolation hydrogeochemical analysis [8,23,24], index methods [25,26], and geophysical investigations [27]. Indeed, the DRASTIC index (Depth to groundwater, net Recharge, Aquifer media, Soil media, Topography, the Impact of the vadose zone, and the hydraulic Conductivity of the aquifer) has become a widely adopted method for assessing groundwater vulnerability to various contaminations, particularly in urbanized riverine areas [28,29]. The seven key parameters are usually assigned scores and weights through multi-criteria decision analysis (MCDA) based on expert judgment to assess groundwater vulnerability, ultimately resulting in an overall vulnerability index. Compared to traditional methods like geological surveys and drilling, the DRASTIC-based MCDA index offers greater efficiency and provides valuable information for regional water management strategies focused on sustainability [1,12]. However, these approaches encounter challenges due to the extensive calculations required, as well as their limitations in applicability, which can be subjective and time-consuming [30].
ML techniques have become a powerful asset in enhancing DRASTIC-based GwPR prediction models, as they can effectively capture non-linear interactions between influencing determinants and susceptibility standards [30,31,32]. When integrated with optimization ML algorithms, GwPR mapping significantly improves the precision of vulnerability assessments, thereby advancing groundwater management strategies [33,34]. Models such as RF, BRT, GLM, SVM, and MARS can effectively model complex information and generate valuable insights for decision-making [33,35], offering significant improvements in vulnerability analysis, especially when combined with the DRASTIC index. Ultimately, integrating the DRASTIC index with ML models offers the capability to effectively analyze complex, multidimensional, and large-scale groundwater pollution datasets [31]. This integration requires a more comprehensive analysis of the intrinsic characteristics of the hydrological system [29,32,36]. In this regard, remote sensing provides detailed information on land attributes (geology, rainfall, land use), enhancing management decisions for resource preservation and utilization [37,38,39]. In recent years, Geographic Information Systems (GIS) also facilitates the visualization and spatial analysis of groundwater data, enabling informed decision-making for sustainable water management [23,24,25,26,27,28,29,30,31,32,33,34,35,36,37,38,39,40,41,42]. These advanced technologies not only empower sustainable resource utilization but also enable more accurate prediction for effective protection and management [7,22].
Recently, ML techniques have been effectively employed to predict GwPR using DRASTIC models across diverse environmental conditions [29,30,31,32,33,34,43,44,45]. Nonetheless, their application in evaluating DRASTIC-based GwPR prediction models remains limited, particularly in rapidly rurbanizing riverine environments, where a standardized framework has yet to be developed. This study aims to address these gaps by proposing an integrated DRASTIC-based ML framework to pinpoint areas vulnerable to groundwater contamination, enhancing geographical analyses within the fields of hydrogeology. By utilizing the DRASTIC factors as inputs for different ML models, including RF, BRT, GLM, SVM, and MARS, it is possible to simulate pollution patterns resulting from various human activities and environmental changes affecting groundwater resources. This methodology offers a valuable tool for water resource managers and researchers, facilitating the identification of critical areas and contributing to achieving Sustainable Development Goals (SDGs) and protecting the environment and human health in these stressful regions [16,25].
Iran’s reliance on groundwater for approximately 65% of its water consumption, highlighting the urgent need for effective management of these resources. Addressing water supply issues requires a focus on aquifer exploration and sustainable use in similar countries [43]. However, managing groundwater resources poses a complex challenge due to the interplay of social and ecological factors [35]. For instance, the northern provinces demonstrated relatively lower salinity levels compared to the central and southern regions, which exhibited the highest vulnerability [46]. This heightened susceptibility in the central regions was primarily attributed to inadequate rainfall, excessive groundwater extraction, and saltwater intrusion from Salt Lake, collectively contributing to significant groundwater degradation. In Kerman Province, situated in southern Iran, rapid population growth and urbanization, along with a heavy reliance on agriculture, create significant water demands across various sectors [47]. This study aims to develop robust methodology for assessing GwPR vulnerability, bridging the gap between urban planners and water management organizations in Kerman Province.
This research evaluates ML algorithms against traditional DRASTIC methods for assessing groundwater salinization and aims to enhance the accuracy of GwPR assessments in rurbanizing riverine regions. It also investigates pollution levels in both urban and rural groundwater sources to assess potential risks to human health, considering the maximum allowable concentrations specified in groundwater quality standards. The objectives are as follows: (1) modeling the basic DRASTIC vulnerability index in both urban and rural areas of Kerman Province; (2) improving ML-based DRASTIC vulnerability maps to establish a sustainable management framework through GwPR vulnerability maps; and (3) mapping the spatial distribution of groundwater physico-chemical properties to further evaluate the aquifer conditions, particularly in vulnerable regions identified by the ML-based DRASTIC maps, providing valuable insights for promoting sustainable agricultural practices. Ultimately, this approach can be adapted to other urbanized riverine areas with similar hydrogeological and socio-economic conditions, making it a valuable tool for enhancing the precision of groundwater vulnerability.
2. Materials and Methods
2.1. Study Area
Kerman Province, with an area of 182,726 square kilometers, constitutes over 11.15% of Iran’s total area. It is located between latitudes 26.00° N and 31.00° N and longitudes 54.00° E and 59.00° E (Figure 1). Geomorphologically, the province is situated at the convergence of the high Zagros and Central Mountain ranges with the low desert regions in the southeast of Iran’s Great Central Desert. This unique confluence of diverse landscapes results in environmental characteristics that are rare elsewhere on the Iranian plateau. Kerman Province is geographically divided into two main regions: desert and temperate foothills, and its climate is classified as semi-arid desert [48].
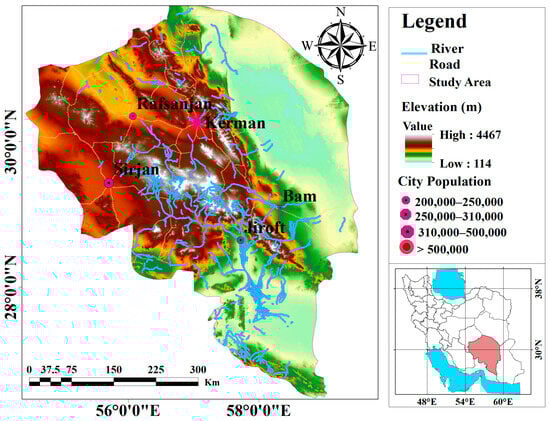
Figure 1.
Location of the study region in Kerman Province highlighted by the red polygon in southern Iran.
Kerman Province is characterized by arid and semi-arid climatic conditions [47]. The region struggles with significant water scarcity, challenging agricultural conditions, and a high dependence on subsistence farming, which leads to considerable social and economic difficulties [46]. The area contends with ongoing issues such as decreased precipitation, frequent droughts, and the overuse of groundwater resources. Falling groundwater levels result in various negative effects, including reduced well water supply, deeper well drilling, declining water quality, and increased pumping costs [49]. These issues collectively diminish overall water availability and negatively affect agricultural productivity. Given that the regional economy is heavily dependent on agriculture, any decline in groundwater quality or quantity directly impacts the livelihoods of local farmers [50].
2.2. Datasets
Various data were collected from multiple sources, including geomorphological maps, geological maps, remote sensing images, and other infrastructure data. This data collection process was crucial for identifying potential groundwater vulnerability zones and ensuring the reliability and effectiveness of future analyses and decision-making processes. The Digital Elevation Model (DEM) was derived from Advanced Spaceborne Thermal Emission and Reflection Radiometer (ASTER) satellite images, chosen for their precision in groundwater resource management and environmental modeling [38]. Archived soil maps provided essential information on soil types influencing groundwater recharge and storage, while hydrological data, including stream networks, drainage patterns, and precipitation, were gathered to evaluate the hydrological system and water availability.
In this study, groundwater quality was assessed in Kerman Province. A total of 250 groundwater samples were collected from various locations across the counties of Kerman, Rafsanjan, Sirjan, Jiroft, and Bam. The sampling locations were selected in a way that captured the geographical diversity and environmental conditions of the area (refer to Figure 2), providing a comprehensive assessment of water quality across the province. Sampling was carried out between September 2016 and February 2017 during the post-monsoon season. This systematic approach allowed for both temporal and spatial analyses, enhancing the strength and comprehensiveness of the dataset. To ensure accurate data representation, sampling was particularly focused in areas with higher population density, aiming to reflect the actual groundwater conditions in more densely populated regions. Additionally, to avoid sampling stagnant water, the water samples were collected after 5 to 10 min of continuous pumping from drilled and tube wells. For sample preservation, high-quality polyethylene bottles were used for sample storage, ensuring appropriate sample size for representativeness. After filtration, the samples were stored at 3–5 °C to preserve water quality and minimize microbial activity. The analysis included measurements of cation concentrations (Mg2+, Ca2+, Na+), anion concentrations (SO42−, HCO3−, Cl−), Total Dissolved Solids (TDS), and TH. TDS, pH, and Electrical Conductivity (EC) were measured using a portable multiparameter instrument. TH, representing the total concentration of calcium and magnesium ions, was also included to assess water hardness.

Figure 2.
Location of sampling points in in Kerman Province, highlighted by the red polygon in southern Iran.
2.3. Methodology
This study highlights the importance of groundwater contamination assessment in rural–urban development. The methodology, detailed in Figure 3, comprises several key stages. First, an inverse distance weighting (IDW) method was employed to generate a map of conditional factors influencing groundwater vulnerability within ArcGIS V10.8 software. The ASTER-DEM was employed to extract topographic features using ArcMap V 10.8 software. Next, groundwater quality analysis was conducted, considering parameters such as TH. Subsequently, the DRASTIC model was implemented using GIS to create a groundwater vulnerability map. This model integrates variables like depth to the water table (D), net recharge (R), aquifer media (A), soil media (S), topography (T), vadose zone impact (I), and hydraulic conductivity (C). To enhance the capabilities of the DRASTIC approach, various ML algorithms were utilized through the SDM package in R software V 4.3.2. These algorithms included RF, BRT, GLM, SVM, and MARS. The effectiveness of the GwPR models was evaluated using training and validation datasets based on TDS measurements. Receiver Operating Characteristic (ROC) curves were employed to assess model performance.
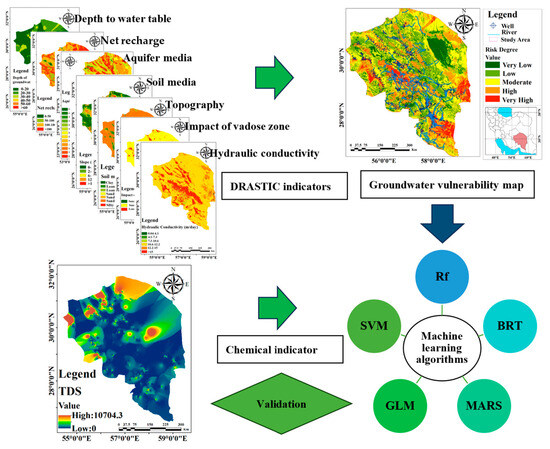
Figure 3.
General procedure followed in the research.
2.3.1. Implementing the Basic DRASTIC Model
Index-based methods for assessing groundwater vulnerability, such as the DRASTIC model, are effective tools due to their minimal data requirements and adaptable spatial scales [28]. The DRASTIC index evaluates groundwater vulnerability by examining the risks of surface pollution infiltration and subsequent aquifer contamination, incorporating eight factors that encompass hydrological and geological parameters, each weighted according to its significance. The DRASTIC parameters were rated on a scale of 1 to 10 based on available literature [25,26,27,28], and weights from 1 to 5 were assigned to each parameter (Table 1). Due to limitations in data availability regarding groundwater recharge sources, this study employed slope, precipitation, and soil permeability as indirect indicators of net recharge, representing the contribution of surface water infiltration. The slope was also used to characterize topographic features. Depth to the water table, a critical parameter in the DRASTIC model, signifies the distance a contaminant must travel through the unsaturated zone to reach the aquifer. The IDW technique was employed to generate a comprehensive depth-to-water table map, subsequently reclassified into vulnerability rankings (1–9). Recharge, representing the annual volume of infiltrated water per unit area, was assessed using interpolated rainfall data and other relevant factors. The recharge values were then reclassified into vulnerability rankings (1–8). Aquifer media and soil media parameters were derived from geological and soil maps, with rankings assigned based on properties like porosity and permeability. The slope was used to represent topography and its influence on infiltration. The vadose zone, the unsaturated zone between the ground surface and the aquifer, was evaluated by analyzing geological formations. Hydraulic conductivity, reflecting the ability of porous materials to transmit water, was categorized into vulnerability levels (1–9). These criteria were used to determine groundwater susceptibility to contamination, with higher rankings indicating greater vulnerability (see Table 1). Finally, the basic DRASTIC vulnerability index was calculated by multiplying each parameter’s rating by its weight, as shown in Equation (1) and explained in the literature [32].
DRASTIC Index (DI) = DrDw + RrRw + ArAw + SrSw + TrTw + Ir Iw + CrCw

Table 1.
DRASTIC: parameter classification, range, evaluation, and weighting based on Aller et al. [28].
The DRASTIC index (DI) equation is designed to assess groundwater vulnerability using seven key hydrogeological parameters: Depth to groundwater (D), net Recharge (R), Aquifer media (A), Soil media (S), Topography (T), Impact of the vadose zone (I), and hydraulic Conductivity (C).
In the DRASTIC method, w represents the specific parameter weight, while r denotes the parameter’s rating. These values for specific parameters are detailed in Table 1, reflecting their comparative importance through assigned ratings and weights. The DRASTIC index is calculated by multiplying the rating and weight of each parameter and then summing them. This index helps to identify and prioritize areas that are susceptible to contamination, highlighting the influence of these hydrogeological factors on groundwater vulnerability. The derived index was classified into five discrete categories, spanning from very low to very high, employing the natural breaks method to visualize the fundamental risk of contamination.
2.3.2. Implementation of Machine Learning-Based DRASTIC Models
This study explores the application of ML algorithms for groundwater vulnerability assessment, offering an alternative approach to the traditional DRASTIC model. ML is a subfield of artificial intelligence that focuses on building predictive models from data [51]. Five different ML algorithms—RF, BRT, GLM, SVM, and MARS—were employed to classify groundwater pollution vulnerability.
The database for the ML step to predict DRASTIC-based GwPR includes the following: a provision of 250 observation wells to record TDS levels and seven DRASTIC data layers (Figure 3). The homogenization step has become a standard process to build both suitability and susceptibility models [22]. Hence, all the input factors were converted to raster layers of 100 m spatial resolution, considering the extent of the study area. For instance, the A, S, and I vector layers were converted to raster layers using the rasterize features function in ArcMap software. According to the World Health Organization (WHO) guideline, which sets the threshold for TDS at 1000 mg/L, water samples with TDS levels below this limit were classified as non-vulnerable (0), indicating lower susceptibility to pollution. In contrast, samples exceeding 1000 mg/L were categorized as highly vulnerable (1), signifying greater susceptibility to contamination. The pixel values of predictor variables were extracted against the 250 well locations of TDS measurements using ArcMap to serve as inventory data for the ML models. The inventory data were partitioned into two subsets: a training set consisting of 70% of the data and a test set comprising 30%. Data standardization is urgently needed to avoid different scales of data types (i.e., nominal, interval, and ratio) during the integration process [31]. For this reason, all parameters were normalized to a common scale from 0 to 1. This step reduces bias and improves the performance of ML models, ensuring that the impact of each factor on vulnerability assessment was correctly weighted. Subsequently, the ML models were executed using the SDM package in RStudio. The model’s performances were determined based on accuracy criteria of ROC using the test dataset (30% of the inventory data).
Finally, the ML-based GwPR maps were predicted using the resulting ML models based on the DRASTIC layers for the whole study area. Therefore, all DRASTIC raster layers were transformed into ASCII format in the ArcMap and subsequently imported into R. These data were normalized and stacked using the relevant codes in RStudio. The final DRASTIC-based GwPR vulnerability—ranging from 0 to 1 map—was categorized using ArcMap into five distinct classes, ranging from very low to very high, utilizing the natural breaks method. Here’s a brief overview of each algorithm:
Support Vector Machine (SVM): SVM excels at classification tasks with high-dimensional data, making it suitable for environmental and social data analysis [52]. It identifies complex, non-linear patterns by transforming data into a higher-dimensional space to find a hyperplane that best separates the data points [53].
Random Forest (RF): RF is known for its stability and performance in prediction tasks, particularly with environmental and social data. It utilizes multiple decision trees to manage complex spatial data for both classification and regression while avoiding overfitting [45]. The final model is an ensemble of these decision trees, leading to a robust prediction. Optimizing parameters such as the number of trees, feature selection, and kernel type is crucial for enhancing performance and prediction accuracy [54].
Generalized Linear Model (GLM): Implemented using the SDM package in R 4.2.2, GLM extends linear regression to oversee both linear and non-linear relationships for regression analysis. Despite its simplicity, GLM is widely used in environmental prediction [55] and has shown superior performance compared to other techniques [19]. GLM employs multivariate regression to model conditional factors as functions of contaminant presence/absence. Unlike linear regression, GLM does not require the assumption of normality for the data, making it a valuable tool for contamination risk assessment. Its ability to identify relationships between variables makes it suitable for spatial modeling and generating optimal regression models for various events.
Boosted Regression Trees (BRT): BRT combines decision trees with boosting techniques, a data mining and ML approach for regression and classification problems [55]. By integrating multiple fitting models, BRT aims to improve overall effectiveness and prediction accuracy [56].
Table 2 provides a summary of the employed ML methods in this study, including parameters, units, and resolutions. This table enhances clarity and reproducibility of results, offering an overview of the settings and methods employed.
Table 2.
Summary of Machine Learning Methods and Parameters.
2.3.3. Models Validation
Validation is one of the key steps in evaluating the quality and accuracy of model prediction [30,31,32,33]. This study evaluated the performance of ML models for predicting GwPR vulnerability using the ML-based DRASTIC models. The effectiveness of the classification models was subsequently assessed using ROC curves and the AUC metric. The ROC curve was prepared by overlaying the test dataset and the five maps obtained through R software. ROC curves visualized the models’ ability to distinguish between contaminated and uncontaminated sites, while AUC quantified their classification accuracy. The models showed varying levels of success, with AUC values indicating potential for groundwater vulnerability prediction. The models were validated to ensure a more robust performance evaluation. The area under the ROC (AUROC) curve serves as a summary statistic that allows for a straightforward comparison of model performance, with higher AUC values reflecting better discriminative power. Previous studies [53,54,55,56] indicate that AUC values range from 0.5 to 1, with values approaching 1 signifying greater model accuracy. AUC values are classified into categories based on their range: 0.5 to 0.6 is considered poor, 0.6 to 0.7 is moderate, 0.7 to 0.8 is good, 0.8 to 0.9 is very good, and 0.9 to 1 is excellent, representing varying levels of predictive capability.
2.3.4. Mapping Spatial Variations of Groundwater Physico-Chemical Properties
Hydrogeochemical investigation is paramount for classifying groundwater quality, using specific measurements such as sulfate (SO42−), bicarbonate (HCO3−), and chloride (Cl−), cations like sodium (Na+), calcium (Ca2+), and magnesium (Mg2+), along with pH, TH, TDS, and EC. These specific parameters were selected due to their well-established impact on groundwater contamination [8]. Analyzing groundwater hydrochemical parameters offers valuable insights into hydrogeological conditions, particularly in vulnerable regions, helping decision-makers formulate effective solutions and mitigation strategies for various applications [23]. The hydrogeochemical data collected were compiled into a geodatabase within ArcGIS software. Sample locations were georeferenced and converted into shapefiles. Key stages in this process included mapping and spatial data analysis. To comprehensively understand the spatial variation in groundwater hydrochemistry and quality, spatial distribution maps for each parameter were created using the IDW technique. This method estimates values at unsampled locations by applying a weighted linear combination of known points, where weights are inversely related to the distance between points. Understanding the spatial distribution of these parameters is essential for evaluating groundwater quality and pinpointing potential pollution sources within the study area. This approach is effective for generating distribution maps and analyzing spatial data, particularly for estimating values at locations with no direct data by utilizing sampled data.
Consequently, the physicochemical properties of groundwater samples (detailed in Table 3) were compared to the WHO drinking water quality standards [57]. These steps aid in a comprehensive and precise analysis of groundwater quality, identifying influential factors, and enhancing the accuracy and effectiveness of models for water resource management. Results interpretation includes pattern analysis, comparison with water quality standards, and providing management recommendations and suggestions for future research. For instance, certain parameters, including TH, EC, Na+, Cl−, TDS, and pH, exceeded the recommended WHO thresholds, raising concerns about the potability of the water. TH values from 250 groundwater wells exhibited a uniform spatial distribution and were visualized using the IDW function in ArcGIS software. Conversely, all other measured parameters fell within acceptable limits.
Table 3.
Characteristics of groundwater samples in terms of physicochemical parameters in Kerman Province: comparison with WHO standards [57].
3. Results
3.1. Basic DRASTIC Vulnerability Index
This study employed the basic DRASTIC model within ArcGIS software to generate a baseline groundwater vulnerability map. Seven thematic layers for each DRASTIC parameter were scored and weighted, which will be subsequently described.
The D factor plays a crucial role in groundwater pollution [28]. Groundwater depth shows values ranging from 0 to over 60 m. The highest depths are found predominantly in the central region (Figure 4a). To account for these spatial variations, the A factor was classified into six distinct categories, with ratings of 1 and 9 assigned accordingly. The N factor represents the volume of surface water, originating from both rainfall and artificial sources, per unit area of the study area [28]. The recharge rate varied from 0 to 180 mm/day, as shown in Figure 4b. This layer was categorized into four classes, which is consistent with the DRASTIC rating regulation (31–32). The aquifer media parameter characterizes the properties of aquifer materials that influence pollutant attenuation [27]. The region is mainly composed of sandy desert, though the middle area contains clay, saline, and mudflat regions (Figure 4c). The aquifer media was classified into thirteen categories and ranked from 1 to 9. Sandstone and conglomerate received higher rankings due to their very coarse, porous nature, which offers superior drainage and transmission characteristics [22]. Soil acts as the surface layer where weathering occurs and regulates water infiltration as well as the vertical movement of pollutants into the vadose zone. Silty loam soils (Figure 4d), characterized by their excellent drainage properties, allow substantial water flow and consequently are highly rated in terms of pollutant transfer. In contrast, clay soils hinder water flow and are less likely to contribute to groundwater contamination [25], resulting in a lower rating for these soils. The T factor plays a crucial role in assessing the infiltration of surface pollutants into groundwater resources. A lower slope facilitates increased infiltration in the southern and northwestern regions, leading to a higher potential for pollutants to migrate into the aquifer (Figure 4e). Guided by geological and soil maps, the vadose zone was identified as the subsurface region between the Earth’s surface and the aquifer, encompassing unsaturated material above the water table [28]. A scoring system ranging from 3 to 9 was applied to each hydrogeological unit (Figure 4f). Aquifer media with high hydraulic conductivity (>15.4 m/day) are classified as more susceptible to groundwater pollution, receiving a rating of 9 (Figure 4g).
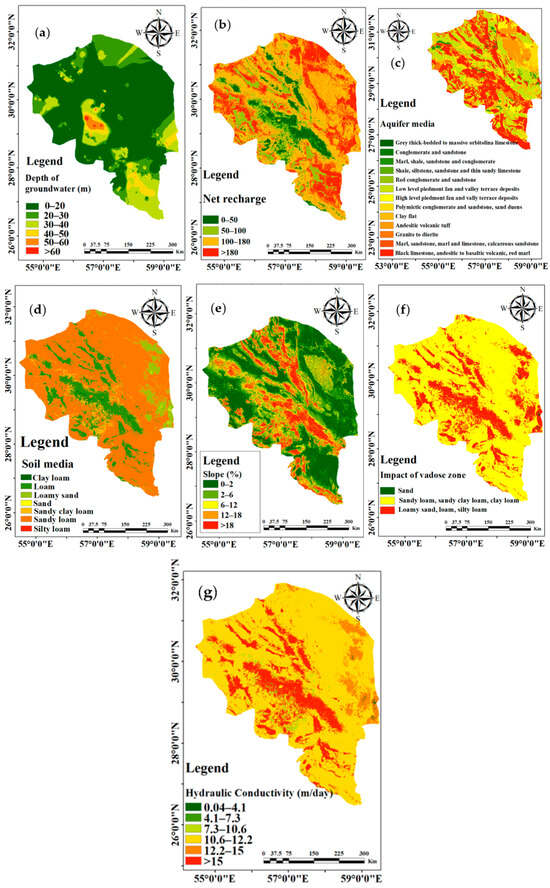
Figure 4.
The spatial arrangement of parameters indicating groundwater vulnerability and the creation of maps illustrating the factors influencing groundwater vulnerability: (a) depth to water table, (b) net recharge, (c) aquifer media, (d) slope, (e) soil media, (f) impact of vadose zone, and (g) hydraulic conductivity.
Figure 5 presents a groundwater vulnerability map categorized based on DRASTIC index values. As shown in Table 4, the DRASTIC model feature values range from 0 to 170, reflecting the varying degrees of vulnerability within the study area. These values, expressed on a Likert scale, range from very low to very high vulnerability. The DRASTIC index exhibited approximately 8.03%, 27.18%, 31.92%, 22.48%, and 10.36% of the area that are categorized as very low, low, moderate, high, and very high vulnerability zones to pollution risks, respectively (Figure 5 and Table 4). The map reveals areas of high vulnerability concentrated in the central, southern, and eastern regions of the study area. Conversely, the northwestern region exhibits low vulnerability.

Figure 5.
Groundwater vulnerability map based on DRASTIC index in Kerman Province, highlighted by the red polygon in southern Iran.
Table 4.
Classification of vulnerability levels for the DRASTIC method.
3.2. GwPR Vulnerability Assessment Using ML-Based DRASTIC Models
This study utilized ML-based models to address the limitations of the traditional DRASTIC framework and to predict the vulnerability of the Kerman aquifer, supporting sustainable groundwater management practices across both urban and rural areas of the province. The approach integrates ML-enhanced DRASTIC models with spatial data and components of groundwater sustainability management strategies (GSMS). Various ML algorithms, including RF, BRT, GLM, SVM, and MARS, were employed alongside spatial data, hydrogeological, and geoenvironmental control factors. The implemented ML models utilized seven conditioning parameters and TDS for calibration and validation. The GwPR maps produced by the models were categorized into five classes according to the probability ranges: very low, low, medium, high, and very high. Lower values represent lower vulnerability, while higher values indicate greater vulnerability (Figure 6).
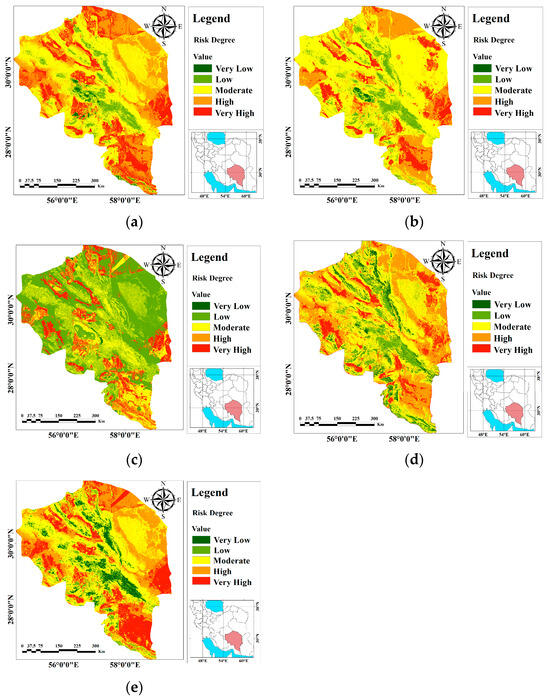
Figure 6.
GwPR maps of the Kerman Province, highlighted by the red polygon in southern Iran, using (a) RF, (b) MARS, (c) SVM, (d) GLM, and (e) BRT.
Table 5 presents a comparison between five machine learning models (RF, MARS, SVM, GLM, and BRT) based on different vulnerability classes. For each class (very low, low, moderate, high, and very high), the index range and areas in square kilometers and percentage of the total area are specified. According to this table, each machine learning model provides different results in the distribution of groundwater vulnerability. The spatial distribution of the most vulnerable zones in the standalone ML-based DRASTIC maps generally corresponds reasonably; differences are observed in the distribution of low and very low vulnerability classes in the GwPR-based SVM map.
Table 5.
Classification of vulnerability levels for the RF model.
Accordingly, it is paramount to assess the precision of these modeling predictions. As shown in Figure 7, model accuracy was assessed using the AUROC. The GwPR-based RF model emerged as the most effective technique for predicting groundwater levels based on its AUROC curve value of 0.995 (Figure 7). This performance surpassed other models, including BRT (0.988), SVM (0.977), MARS (0.951), and GLM (0.887). The ML models significantly enhance the overall predictability of the data, making them justifiable for use.
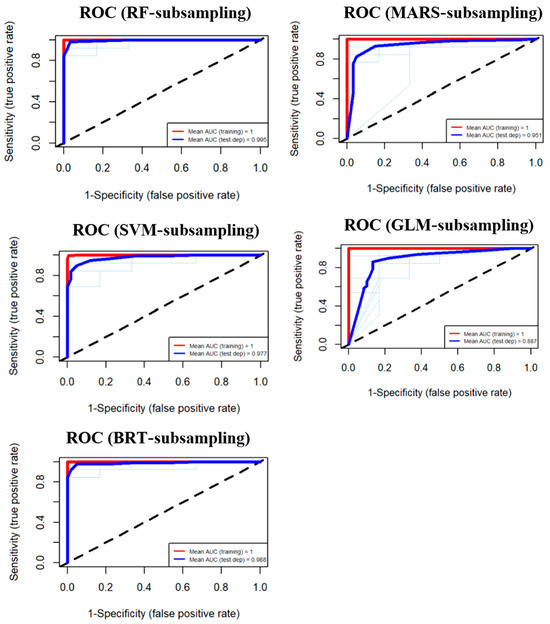
Figure 7.
The validation outcomes of the suggested frameworks by the ROC curves for RF, MARS, SVM, GLM, and BRT.
The resulting RF map shows that about 19.56%, 28.90%, 44.43%, 6.15%, and 0.94% of the study areas are under very high, high, moderate, low, and very low susceptible zones, respectively (Figure 6a and Table 5).
The resulting MARS map indicates that approximately 12.74%, 19.08%, 58.98%, 8.81%, and 0.38% of the study area fall under very high, high, medium, low, and very low sensitivity zones, respectively (Figure 6b and Table 5). The MARS index based on GwPR (Figure 6b) shows that very high vulnerability areas are mainly found in the southern and western regions. The MARS model has the largest area for medium vulnerabilities.
The resulting SVM map shows that approximately 14.84%, 3.69%, 28.86%, 52.18%, and 0.43% of the study area fell under very high, high, medium, low, and very low sensitivity zones, respectively (Figure 6c and Table 5). The SVM model provides a large area for the “low” class. The SVM index based on GwPR (Figure 6c) shows that the largest area for low vulnerabilities is in the central part of the study area.
The resulting GLM map shows that approximately 39.95%, 45.99%, 6.32%, 7.44%, and 0.29% of the study area fall under very high, high, medium, low, and very low sensitivity zones, respectively (Figure 6d and Table 5). The GLM provides a large area for the “high” class. The GLM index based on GwPR (Figure 6d) shows that the largest area for high vulnerabilities is mainly in the eastern and southern parts of the study area.
The resulting BRT map shows that approximately 21.69%, 23.77%, 44.56%, 1.92%, and 8.06% of the study area fall under very high, high, medium, low, and very low sensitivity zones, respectively (Figure 6e and Table 5). The BRT index based on GwPR (Figure 6e) shows that the BRT model predicts the largest area for the “medium” class, which is mainly in the central part of the study area.
Clearly, the RF model provides extensive predictions for moderate and high vulnerability classes, and it particularly shows the largest area in the “Moderate” class compared to the other models. This model has a greater focus on moderate and high vulnerabilities, which can be beneficial for management and policy analysis of groundwater resources. Undoubtedly, the RF model based on GwPR is considered the most accurate and comprehensive for assessing pollution risks in rural riverine areas. The GwPR-based RF index (Figure 6a) exhibited that the very high-vulnerability zone is mostly observed in the southern and eastern regions, with localized occurrences in the middle part. The high vulnerability zone is prominently evident in the northeastern and northwestern regions, contrasting with the basic DRASTIC.
Differences between the models arise from algorithmic and predictive method variations. In policy and resource management analyses, attention to these differences can improve decision-making and optimal resource allocation. The RF model is recognized for its good balance in predicting various vulnerabilities, including medium and high vulnerabilities. Other models, such as SVM and MARS, have their own strengths and weaknesses, especially in predicting low (SVM) and medium (MARS) vulnerabilities. GLM and BRT models focus on high (GLM) and medium (BRT) vulnerabilities, respectively.
Future research is recommended to systematically use the ordered weighted average (OWA) method for combining results from different models and employing various scenarios [58] to enhance the accuracy and comprehensiveness of analyses in natural resource management, especially water resources. This method provides a precise and comprehensive risk assessment by combining results from different models, and using various scenarios increases analysis accuracy and improves management. Employing this approach helps decision-makers weigh different models based on management needs and risk tolerance and select the best option. For example, in an optimistic scenario, BRT and SVM models predict the largest areas in the very low and low classes. These models are suitable for managing low-risk resources. In a pessimistic scenario, GLM and BRT models show significant areas in the “high” class. These models are more suitable for identifying high-risk areas that require more intensive management. Ultimately, the RF model, with its balanced distribution across different classes, could be selected as an optimal option in situations requiring combined risk management.
Consistent with previous research by [49], areas characterized by high drainage density, low slopes, and dominant urban or agricultural land use are expected to exhibit the highest vulnerability to pollution. The ML models demonstrated exceptional predictive accuracy, consequently improving groundwater resource management. These models offer valuable tools for groundwater resource assessment and management for the first time in this study for Kerman Province. The evaluation of ML model precision underscores the potential advantages of integrating these models with groundwater sustainability management strategies. This integration can optimize groundwater allocation and conservation practices, ultimately leading to environmental protection.
3.3. Groundwater Physicochemical Characteristics
This section focuses on evaluating the quality and appropriateness of groundwater for agricultural purposes, as well as the impact of the specified chemical parameters on human health. Analysis of groundwater quality parameters in the designated region revealed concerning deviations from WHO standards [57], indicating potential water quality degradation. Key factors influencing agricultural water quality include EC, Na+, magnesium hardness (MH), and potential salinity. Figure 8 visually depicts the spatial variations in water sample concentrations across the study area.
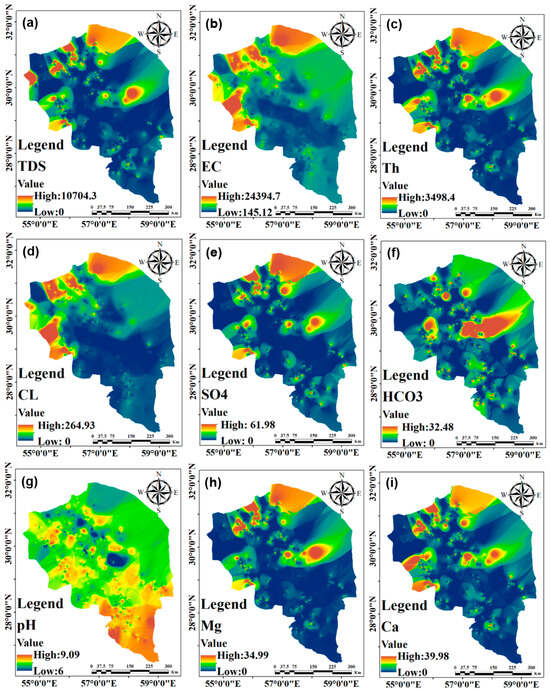
Figure 8.
The spatial variability of (a) TDS, (b) EC, (c) Th, (d) CL−, (e) SO42−, (f) HCO3−, (g) pH, (h) Mg2+, and (i) Ca2+ concentrations in the water samples collected from the research site.
TDS refers to the aggregate of dissolved substances in water, and elevated levels can adversely impact water quality, resulting in complications for both agricultural and potable water uses (Figure 8a). TDS and EC are critical parameters that influence human health, as they reflect the concentration of dissolved ions present in water. The average EC was approximately 398.5 µS/cm, which is below the WHO standard of 500 µS/cm. High EC values point towards the presence of dissolved ions like chlorine and sodium, possibly originating from agricultural wastewater infiltration [6], particularly in the northern, northeastern, and western parts (Figure 8b). This observation reflects the concentration of dissolved solutes in water, especially in the highly vulnerable zones identified in the GwPR-based RF map, which can lead to complications for both plants and drinking water [57]. TDS also exceeded drinking water standards, signifying a high concentration of soluble chemical compounds. These findings highlight the critical need for robust groundwater quality monitoring and management strategies in the region. TH ranged from 0 to 3498.4 mg/L with an average of 308.63 mg/L, exceeding recommended levels. Groundwater in Kerman Province is thus classified as hard due to an average TH greater than 100 mg/L (Figure 8c). Chloride concentrations range from 0 to 264.93 mg/L, and sulfate concentrations range from 0 to 61.98 mg/L. Unforgettably, SO42− and Cl− were detected as potential pollutants, particularly in the northeastern and western parts of highly vulnerable zones on the GwPR-based RF map (Figure 6a and Figure 8d,e). HCO3− plays a role in pH regulation and enhances soil structure, proving beneficial in agriculture; however, imbalances in its concentration can hinder plant growth [16]. HCO3− presence suggests an interaction between rainwater and limestone aquifers in the middle parts (Figure 8f). Measured pH values ranged from 0 to 9.09, indicating alkaline conditions, particularly in the southern parts (Figure 8g). Mg2+ is a crucial element for chlorophyll synthesis and the overall growth of plants, making it valuable in agricultural practices. While Ca2+ is vital for both plant development and human health, contributing to agricultural productivity by enhancing soil structure and facilitating mineral absorption. Calcium and magnesium concentrations range from 0 to 39.98 mg/L and from 0 to 34.99 mg/L, respectively, indicating significant levels of these ions, which can impact water quality in northern and western parts (Figure 8h,i). Moreover, excessive intake of Ca2+ poses significant risks, particularly for individuals with kidney issues. In industrial settings, the equilibrium between Ca2+ and Mg2+ ions is generally preserved in the majority of water sources; however, an overabundance of Mg2+ can negatively impact soil structure, especially in environments characterized by high sodium levels and salinity. Studies indicate that elevated concentrations of Ca2+ and Mg2+ in water may heighten the risk of cardiovascular diseases [34]. Therefore, effective water management practices are critical to mitigate human impacts and safeguard freshwater resources in rurbanizing riverine environments, particularly in areas classified as highly or very highly vulnerable [50,51]. Conversely, areas with low vulnerability present opportunities for implementing sustainable water resource management strategies.
TDS refers to the aggregate of dissolved substances in water, and elevated levels can adversely impact water quality, resulting in complications for both agricultural and potable water uses (Figure 8a). TDS and EC are critical parameters that influence human health, as they reflect the concentration of dissolved ions present in water. The average EC was approximately 398.5 µS/cm, which is below the WHO standard of 500 µS/cm. High EC values point towards the presence of dissolved ions like chlorine and sodium, possibly originating from agricultural wastewater infiltration [6], particularly in the northern, northeastern, and western parts (Figure 8b). This observation reflects the concentration of dissolved solutes in water, especially in the highly vulnerable zones identified in the GwPR-based RF map, which can lead to complications for both plants and drinking water [57]. TDS also exceeded drinking water standards, signifying a high concentration of soluble chemical compounds. These findings highlight the critical need for robust groundwater quality monitoring and management strategies in the region. TH ranged from 0 to 3498.4 mg/L with an average of 308.63 mg/L, exceeding recommended levels. Groundwater in Kerman Province is thus classified as hard due to an average TH greater than 100 mg/L (Figure 8c). Chloride concentrations range from 0 to 264.93 mg/L, and sulfate concentrations range from 0 to 61.98 mg/L. Unforgettably, SO42− and Cl− were detected as potential pollutants, particularly in the northeastern and western parts of highly vulnerable zones on the GwPR-based RF map (Figure 6a and Figure 8d,e). HCO3− plays a role in pH regulation and enhances soil structure, proving beneficial in agriculture; however, imbalances in its concentration can hinder plant growth [16]. HCO3− presence suggests an interaction between rainwater and limestone aquifers in the middle parts (Figure 8f). Measured pH values ranged from 0 to 9.09, indicating alkaline conditions, particularly in the southern parts (Figure 8g). Mg2+ is a crucial element for chlorophyll synthesis and the overall growth of plants, making it valuable in agricultural practices. While Ca2+ is vital for both plant development and human health, contributing to agricultural productivity by enhancing soil structure and facilitating mineral absorption. Calcium and magnesium concentrations range from 0 to 39.98 mg/L and from 0 to 34.99 mg/L, respectively, indicating significant levels of these ions, which can impact water quality in northern and western parts (Figure 8h,i). Moreover, excessive intake of Ca2+ poses significant risks, particularly for individuals with kidney issues. In industrial settings, the equilibrium between Ca2+ and Mg2+ ions is generally preserved in the majority of water sources; however, an overabundance of Mg2+ can negatively impact soil structure, especially in environments characterized by high sodium levels and salinity. Studies indicate that elevated concentrations of Ca2+ and Mg2+ in water may heighten the risk of cardiovascular diseases [34]. Therefore, effective water management practices are critical to mitigate human impacts and safeguard freshwater resources in rurbanizing riverine environments, particularly in areas classified as highly or very highly vulnerable [50,51]. Conversely, areas with low vulnerability present opportunities for implementing sustainable water resource management strategies.
4. Discussion
Groundwater salinization emerges as the most significant negative impact of rapid rurbanization on rural areas, accompanied by challenges such as soil contamination, natural resource depletion, and land degradation [1,21,59,60,61,62,63,64]. With growing population and industrialization, the demand for fresh water has surged, making it a critical resource for both human and industrial progress [65]. In Kerman Province, groundwater quality has been compromised primarily due to human and industrial activities, posing serious environmental and health risks. Contaminated water is linked to infectious diseases such as cholera, diarrhea, hepatitis A, typhoid, and polio. Furthermore, the lack of access to clean water and sanitation exacerbates these preventable health threats [66]. This study underscores the issue of poor groundwater quality resulting from excessive agricultural exploitation and urban sewage infiltration, advocating for initiative-taking measures such as annual groundwater quality monitoring and regulated extraction practices.
A notable research gap exists in rurbanizing riverine regions, specifically concerning the assessment of groundwater vulnerability for irrigation purposes. While considerable attention is given to water quality for drinking and sanitation [49,50], research focused on DRASTIC-based GwPR prediction models remains limited, particularly in rapidly rurbanizing riverine. Cross-validation metrics, including ROC curves and AUC values, confirm the model’s accuracy for effective groundwater management to ensure long-term freshwater availability. Results indicated that the RF model outperforms other methods in groundwater pollution modeling, offering high precision, low bias, and strong variance stability. This aligns with the findings of Sajedi-Hosseini et al. [30], Motlagh et al. [32], and Khan et al. [33], who highlight the superior accuracy of ML models in groundwater modeling. For example, Gharechaee et al. [67] utilized statistical techniques combined with ML, including the RF model and Fuzzy Analytic Hierarchy Process (FAHP), to improve groundwater salinity hazard mapping in the Bakhtegan basin. Despite these advances, the application of these methods in the current study area is novel, making this research a pioneering effort in enhancing accurate groundwater predictions. It is important to note the total distribution of the estimated GwPR reveals that between-model variance significantly impacts the spatial distribution of the overall variance. Future research should endeavor to quantify the inherent uncertainty within the DRASTIC method by utilizing the Bayesian model averaging (BMA) approach, as suggested in the framework proposed by [58].
Regarding hydrochemical investigation, human activities, especially mining, play a major role in groundwater pollution in Kerman Province. Hydrogeochemical processes revealed that calcium and magnesium are the predominant cations, while bicarbonates, chlorides, and sulfates are the primary anions. These findings are consistent with the results of the Kerman Province land use planning studies [59], which indicate that groundwater quality in many areas of Kerman Province is poor. In particular, in the western parts of the province, a decrease in pH has led to the dissolution of heavy metals and contamination of water, while in other areas, an increase in pH and salinity has been observed. The rise in chloride and sodium ions has also caused issues such as soil salinization and hardening. TDS and EC, which are associated with increased salinity and pollution, have risen in many plains of the province, posing a serious threat to water quality, soil health, and agriculture. TDS (0–1074 mg/L) is typically high in Kerman, reflecting significant levels of salts and minerals in groundwater, which can affect water quality and its use in agriculture and industry. Consumption of water with high TDS and EC levels poses risks, particularly for individuals with kidney and cardiovascular conditions [34]. Overall, these parameters indicate substantial mineral content in Kerman’s groundwater, impacting water quality and its applications. This situation requires urgent attention to water and soil resource management. The chemical quality of groundwater can reflect its origin, history, and the materials it has been in contact with. This quality is influenced by geological processes and chemical reactions below the surface and plays a crucial role in determining the suitability of water for consumption [49]. Reasons for the discrepancy between water quality parameters in Kerman Province (especially TDS, which is an important indicator for water quality assessment) and the limits defined by the WHO include:
- Geographical, Geological, and Climatic Characteristics: The unique geographical and climatic conditions of Kerman Province, such as water scarcity and the dispersion of water sources, can significantly impact water quality. Additionally, groundwater quality variations in Kerman Province are heavily influenced by geological conditions. Numerous factors, including surface water levels, soil properties, topography, hydrogeomorphology, drainage patterns, land use, and climate conditions, determine the composition and quality of groundwater [50].
- Human and Industrial Activities: Human activities such as agriculture, industry, power generation, use of chemicals, urban solid waste production, and the use of pesticides and insecticides in the region may increase TDS levels and other chemical parameters that do not conform to WHO standards, leading to groundwater quality deterioration and contamination. These concentrations are influenced by environmental conditions such as temperature, turbidity, pH, and EC. The increase in these toxic metals, without noticeable changes in the color, taste, and smell of the water, can degrade water quality and pose a threat to the environment and consumers.
- Water Resource Management: Managerial challenges and limitations in providing and controlling water quality in Kerman Province may cause deviations from international standards. Water resource management in this region, due to the arid and semi-arid climate, excessive groundwater extraction, particularly in agriculture, low rainfall, and declining groundwater levels, faces serious challenges in the development of modern water treatment technologies. Moreover, climate change and population growth have placed additional pressure on water resources. Addressing these challenges requires raising public awareness, appropriate policymaking, the use of modern technologies, and sustainable groundwater management strategies [11,17].
In Kerman, the rurbanization process, characterized by the integration of urban and rural areas, has fostered economic development in rural regions. However, this transformation presents significant environmental challenges primarily stemming from socio-economic–ecological conflicts and the emergence of complex land use patterns. These factors contribute to various environmental problems, with water pollution being a major concern. Similar findings were reported by Sadeghi-Jahani et al. [35], who developed process-based methods to evaluate groundwater sustainability and analyze sustainable development interactions within Iran’s Tashk–Bakhtegan–Maharlo basin from 2003 to 2018. Their research demonstrated that persistent droughts, increased irrigation, uneven development across sub-watersheds, and excessive groundwater extraction have led to unsustainable conditions. The results of this study demonstrated that groundwater quality in Kerman Province has deteriorated, primarily due to agricultural activities, rock–water interactions, and natural processes. The situation is further exacerbated by industrial and agricultural activities, highlighting the urgent need for immediate interventions to manage and improve the quality of rural ecosystems. It is crucial to implement rigorous regulations and management strategies to sustain optimal water quality for both agricultural use and human health, thereby mitigating potential health and environmental issues [24]. Consequently, there is an urgent need for strategies that support sustainable development in rural areas while addressing the challenges associated with rapid urban expansion. Sustainable groundwater management strategies encompass several key approaches essential for effective decision-making and the preservation of groundwater resources [62]. Yang et al. [60] recommend the GSMS strategy, which employs AI algorithms like decision trees and support vector machines to enhance groundwater management and protection. These strategies include vulnerability assessment, responsible extraction practices, precise pollutant control measures, stringent disposal regulations, and centralized extraction planning. Implementing these strategies is crucial for mitigating the impacts of declining groundwater levels and ensuring continued access to high-quality groundwater. These actions can prevent environmental degradation, promote equitable access to water resources, enhance local economies, and reduce social and economic disparities.
Research exploring the correlation between groundwater resources and poverty reduction in semi-arid and rural areas, such as the study by [61], demonstrates that improving agricultural productivity in these regions can significantly advance socio-economic conditions and support sustainable development. Effective groundwater resource planning and management are imperative in addressing the challenges posed by climate change and human activities. For the effective management of water resources in Kerman Province, integrated approaches are essential. These approaches include modifying water consumption patterns, managing groundwater resources, protecting arid environments, and controlling water pollution. Furthermore, collaboration among stakeholders, including local communities and policymakers, is crucial for preventing water crises and ensuring water security. These challenges necessitate more effective actions from managers and policymakers in water resource management, considering both environmental conditions and human factors. Vulnerability maps of groundwater resources, created using the aforementioned methods and accounting for the impacts of urbanization, provide valuable information for evidence-based decision-making in water resource management. These maps identify areas most vulnerable to pollutants, highlighting regions that require focused pollution management and control efforts.
Finally, this study emphasizes the importance of combining remote sensing, geospatial data [66,68], and ML models [69,70] to identify and map groundwater potential in rurbanizing riverine areas. These techniques provide crucial insights for sustainable water management and poverty alleviation strategies in rural regions. For instance, spatial geological and hydrogeological data obtained from this analysis can be effectively utilized for long-term monitoring and planning, improving urban development and safeguarding water resources in Kerman’s urban areas. The findings can guide officials and decision-makers in focusing on the preservation and management of these resources and in developing more effective management plans. Future research could benefit from incorporating advanced techniques such as fuzzy logic, multi-criteria decision-making (MCDM), and socio-economic data alongside ML and GIS analysis. Employing methods like DRASTIC-L could further refine the identification of vulnerable areas and enhance management strategies for groundwater preservation. Research by Jesiya and Gopinath [71] has highlighted the vadose zone as a critical factor in pollutant protection, suggesting that incorporating this aspect could improve groundwater quality assessments and optimize water management strategies. Additionally, examining the impact of land use [72] on GwPR through the DRASTIC-based ML algorithms is highly recommended.
5. Conclusions
Groundwater salinization poses a significant challenge to sustainable rurban development in arid and semi-arid riverine regions. Accurate mapping of GwPR is crucial for effective water management in areas experiencing severe groundwater degradation due to rapid urbanization and chronic drought, such as Kerman Province (Iran). This study addresses this issue by integrating the DRASTIC index with five ML models—RF, BRT, GLM, SVM, and MARS—alongside hydrogeochemical analysis. Initially, eight DRASTIC factors were combined to produce a baseline vulnerability assessment. This preliminary index categorized approximately 8.03%, 27.18%, 31.92%, 22.48%, and 10.36% of the area into very low, low, moderate, high, and very high vulnerability zones, respectively. Among the ML models, the RF model achieved the highest prediction accuracy at 99.5%, followed by BRT at 98.8% and SVM at 97.7%. The RF-based map indicated that approximately 19.56%, 28.90%, 44.43%, 6.15%, and 0.94% of the study area fell into very high, high, moderate, low, and very low susceptibility zones, respectively. The RF model identified new high-vulnerability areas in the northeast and northwest and expanded the moderate vulnerability zone. Notably, parameters such as TH, EC, sodium (Na+), chloride (Cl−), TDS, and pH exceeded WHO thresholds in high-vulnerability zones, raising concerns about water potability and necessitating immediate action to mitigate health risks from contaminated water. Effective groundwater management in Kerman requires coordinated efforts to regulate extraction, improve water use efficiency, and restore resource balance. Sustainable resource management should involve precise planning that integrates environmental factors, climatic constraints, and land use practices. Future research should explore advanced hybrid ML methods for higher accuracy and consistency and integrate modeling methods with system dynamics approaches to provide comprehensive insights for sustainable groundwater management. These findings contribute a valuable ML-based DRASTIC index to address salinization issues in stressed aquifers within the Middle East and North Africa (MENA) region, highlighting the urgent need to address groundwater contamination in rapidly urbanizing and rurbanizing areas.
Author Contributions
Conceptualization, M.T. and Z.K.M.; methodology, M.T., Z.K.M. and M.H.S.; validation, Z.K.M., M.H.S. and Y.M.Y.; formal analysis, Z.K.M.; investigation, M.T., Z.K.M. and M.H.S.; resources, M.T., Z.K.M. and M.H.S.; data curation, M.T. and Z.K.M.; writing—original draft preparation, M.T., Z.K.M. and M.H.S.; writing—review and editing, I.M.I. and Y.M.Y.; visualization, Z.K.M. and Y.M.Y.; supervision, M.T. and M.H.S.; project administration, I.M.I. and Y.M.Y.; funding acquisition, I.M.I. and Y.M.Y. All authors have read and agreed to the published version of the manuscript.
Funding
This research received no external funding.
Data Availability Statement
The data presented in this study are available upon reasonable request from the first author.
Acknowledgments
The authors would like to express their sincere gratitude to Tarbiat Modares University, Tehran, Iran, and the Iranian National Institute for Oceanography and Atmospheric Science (INIOAS) for their invaluable support to this research.
Conflicts of Interest
The authors declare no conflicts of interest.
References
- Dandapat, K.; Chatterjee, U.; Das, S.; Patra, A.; Manna, H.; Ghosh, A.; Chandra Pal, S.; Md. Islam, A.R.; Costache, R.; Alam, E.; et al. Assessment of groundwater potential zones in data-scarce regions using GIS-based multicriteria decision-making approach. Geocarto Int. 2024, 39, 2311202. [Google Scholar] [CrossRef]
- Ibraheem, I.M.; El-Qady, G. Hydrogeophysical Investigations at El-Nubariya-Wadi El-Natrun Area, West Nile Delta, Egypt. In Groundwater in the Nile Delta; Negm, A., Ed.; The Handbook of Environmental Chemistry; Springer: Cham, Switzerland, 2019; Volume 73, pp. 235–271. [Google Scholar]
- Singh, C.; Chandra Swain, K.; Pradhan, B.; Kumar Rusia, D.; Moghimi, A.; Ranjgar, B. Mapping groundwater potential zone in the subarnarekha basin, India, using a novel hybrid multi-criteria approach in Google earth Engine. Heliyon 2024, 10, E24308. [Google Scholar] [CrossRef] [PubMed]
- Haggag, M.; Ghazala, H.H.; Ibraheem, I.M. Evaluation of the Groundwater Resources in the Nile Valley, Egypt. In Sustainability of Groundwater in the Nile Valley, Egypt; Negm, A.M., El-Rawy, M., Eds.; Earth and Environmental Sciences Library; Springer: Cham, Switzerland, 2022; pp. 11–36. [Google Scholar]
- Rezaei, A.; Sayadi, M.H.; Zadeh, R.J.; Mousazadeh, H. Assessing the hydrogeochemical processes through classical integration of groundwater parameters in the Birjand plain in eastern Iran. Groundw. Sustain. Dev. 2021, 15, 100684. [Google Scholar] [CrossRef]
- Youssef, Y.M.; Gemail, K.S.; Atia, H.M.; Mahdy, M. Insight into land cover dynamics and water challenges under anthropogenic and climatic changes in the eastern Nile Delta: Inference from remote sensing and GIS data. Sci. Total Environ. 2024, 913, 169690. [Google Scholar] [CrossRef] [PubMed]
- Ikirri, M.; Boutaleb, S.; Ibraheem, I.M.; Abioui, M.; Echogdali, F.Z.; Abdelrahman, K.; Id-Belqas, M.; Abu-Alam, T.; El Ayady, H.; Essoussi, S.; et al. Delineation of Groundwater Potential Area using an AHP, Remote Sensing, and GIS Techniques in the Ifni Basin, Western Anti-Atlas, Morocco. Water 2023, 15, 1436. [Google Scholar] [CrossRef]
- Othman, A.; Ghazala, H.; Ibraheem, I.M. Hydrochemical Analysis of Groundwater in the Area Northwest of El-Sadat City, West Nile Delta, Egypt. In Sustainability of Groundwater in the Nile Valley, Egypt; Negm, A.M., El-Rawy, M., Eds.; Earth and Environmental Sciences Library; Springer: Cham, Switzerland, 2022; pp. 141–178. [Google Scholar]
- El-Rawy, M.; Fathi, H.; Wahba, M.; Negm, A. An Overview of Water Resource Challenges and Managed Aquifer Recharge (MAR) in the MENA Region. In Managed Aquifer Recharge in MENA Countries; El-Rawy, M., Negm, A., Eds.; Earth and Environmental Sciences Library; Springer: Cham, Switzerland, 2024. [Google Scholar] [CrossRef]
- Othman, A.A.; Beshr, A.M.; Abd El-Gawad, A.M.S.; Ibraheem, I.M. Hydrogeophysical investigation using remote sensing and geoelectrical data in southeast Hiw, Qena, Egypt. Geocarto Int. 2022, 37, 14241–14260. [Google Scholar] [CrossRef]
- An, Y.; Li, Q.; Zhang, L. Managing Agricultural Water Use in a Changing Climate in China. Sustain. Prod. Consum. 2022, 33, 978–990. [Google Scholar] [CrossRef]
- Alipour, E.; Aghapour, A.A.; Bahrami Asl, F. Concentration, spatial distribution, and non-carcinogenic risk assessment of arsenic, cadmium, chromium, and lead in drinking water in rural areas of eight cities of West Azerbaijan province, Iran. Environ. Sci. Pollut. Res. 2024, 31, 20222–20233. [Google Scholar] [CrossRef]
- Orîndaru, A.; Constantinescu, M.; Țuclea, C.-E.; Căescu, Ș.-C.; Florescu, M.S.; Dumitru, I. Rurbanization—Making the City Greener: Young Citizen Implication and Future Actions. Sustainability 2020, 12, 7175. [Google Scholar] [CrossRef]
- Barros, J.L.; Tavares, A.O.; Monteiro, M.; Santos, P.P. Peri-Urbanization and Rurbanization in Leiria City: The Importance of a Planning Framework. Sustainability 2018, 10, 2501. [Google Scholar] [CrossRef]
- Hoffmann, E.M.; Schareika, N.; Dittrich, C.; Schlecht, E.; Sauer, D.; Buerkert, A. Rurbanity: A concept for the interdisciplinary study of rural–urban transformation. Sustain. Sci. 2023, 18, 1739–1753. [Google Scholar] [CrossRef] [PubMed]
- Saha, R.; Sowmya Chiravuri, S.; Chandra Das, I.; Kandrika, S.; Kumar Kumranchat, V.; Chauhan, P.; Laxmi Chitikela, V. Urban aquifer health assessment and its management for sustainable water supply: An innovative approach using machine learning techniques. Groundw. Sustain. Dev. 2024, 25, 101130. [Google Scholar] [CrossRef]
- Dao, P.U.; Heuzard, A.G.; Le, T.X.H.; Zhao, J.; Yin, R.; Shang, C.; Fan, C. The impacts of climate change on groundwater quality: A review. Sci. Total Environ. 2024, 912, 169241. [Google Scholar] [CrossRef] [PubMed]
- Santos, R.S.S.; Filho, M.S.C.; Marques, I.M.; Gomes de Oliveira, A.; Cordeiro de Oliveira, O.M.; Thiago Andrade Moreira, Í. Groundwater Contamination in a Rural Municipality of Northeastern Brazil: Application of Geostatistics, Geoprocessing, and Geochemistry Techniques. Water Air Soil Pollut. 2024, 235, 179. [Google Scholar] [CrossRef]
- Mallik, S.; Mishra, U.; Paul, N. Groundwater suitability analysis for drinking using GIS based fuzzy logic. Ecol. Indic. 2021, 121, 107179. [Google Scholar] [CrossRef]
- Faruki Fahim, A.K.; Kamal, A.S.M.M.; Shahid, S. Modeling spatial groundwater level patterns of Bangladesh using physio-climatic variables and machine learning algorithms. Groundw. Sustain. Dev. 2024, 25, 101142. [Google Scholar] [CrossRef]
- Mundetia, N.; Sharma, D.; Sharma, A. Groundwater sustainability assessment under climate change scenarios using integrated modelling approach and multi-criteria decision method. Ecol. Model. 2024, 487, 110544. [Google Scholar] [CrossRef]
- Youssef, Y.M.; Gemail, K.S.; Sugita, M.; AlBarqawy, M.; Teama, M.A.; Koch, M.; Saada, S.A. Natural and Anthropogenic Coastal Environmental Hazards: An Integrated Remote Sensing, GIS, and Geophysical-based Approach. Surv. Geophys. 2021, 42, 1109–1141. [Google Scholar] [CrossRef]
- Subba Rao, N.; Das, R.; Sahoo, H.K.; Gugulothu, S. Hydrochemical characterization and water quality perspectives for groundwater management for urban development. Groundw. Sustain. Dev. 2024, 24, 101071. [Google Scholar] [CrossRef]
- Kumar, R.; Kumari, A.; Kumar, R.; Sulaiman, M.A.; Zafar, M.M.; Singh, A.; Prabhakar, R.; Pippal, P.S. Assessing the geochemical processes controlling groundwater quality and their possible effect on human health in Patna, Bihar. Environ. Sci. Pollut. Res. 2023, 30, 107138–107157. [Google Scholar] [CrossRef]
- Arafa, N.A.; Salem, Z.E.-S.; Ghorab, M.A.; Soliman, S.A.; Abdeldayem, A.L.; Moustafa, Y.M.; Ghazala, H.H. Evaluation of Groundwater Sensitivity to Pollution Using GIS-Based Modified Drastic-LU Model for Sustainable Development in the Nile Delta Region. Sustainability 2022, 14, 14699. [Google Scholar] [CrossRef]
- Salem, Z.E.; Sefelnasr, A.M.; Hasan, S.S. Assessment of groundwater vulnerability for pollution using Drastic Index, young alluvial plain, Western Nile Delta, Egypt. Arab. J. Geosci. 2019, 12, 727. [Google Scholar] [CrossRef]
- Gemail Kh El Alfy, M.; Ghoneim, M.F.; Shishtawy, A.M.; Abd El-Bary, M. Comparison of Drastic and DC resistivity modeling for assessing aquifer vulnerability in the central Nile Delta, Egypt. Environ. Earth Sci. 2017, 76, 350. [Google Scholar] [CrossRef]
- Aller, L.; Bennet, T.; Leher, J.H.; Petty, R.J.; Hackett, G. Drastic: A standardized system for evaluating groundwater pollution potential using hydro-geological settings. J. Geol. Soc. India 1987, 29, 23–37. [Google Scholar]
- Taghavi, N.; Niven, R.K.; Paull, D.J.; Kramer, M. Groundwater vulnerability assessment: A review including new statistical and hybrid methods. Sci. Total Environ. 2022, 822, 153486. [Google Scholar] [CrossRef]
- Sajedi-Hosseini, F.; Malekian, A.; Choubin, B.; Rahmati, O.; Cipullo, S.; Coulon, F.; Pradhan, B. A novel machine learning-based approach for the risk assessment of nitrate groundwater contamination. Sci. Total Environ. 2018, 644, 954–962. [Google Scholar] [CrossRef]
- Ijlil, S.; Essahlaoui, A.; Mohajane, M.; Essahlaoui, N.; Mili, E.M.; Van Rompaey, A. Machine Learning Algorithms for Modeling and Mapping of Groundwater Pollution Risk: A Study to Reach Water Security and Sustainable Development (Sdg) Goals in a Mediterranean Aquifer System. Remote Sens. 2022, 14, 2379. [Google Scholar] [CrossRef]
- Motlagh, Z.K.; Derakhshani, R.; Sayadi, M.H. Groundwater vulnerability assessment in central Iran: Integration of GIS-based DRASTIC model and a machine learning approach. Groundw. Sustain. Dev. 2023, 23, 101037. [Google Scholar]
- Khan, Z.; Mohsin, M.; Ali, S.A.; Vashishtha, D.; Husain, M.; Parveen, A.; Shamim, S.K.; Parvin, F.; Anjum, R.; Jawaid, S.; et al. Comparing the Performance of Machine Learning Algorithms for Groundwater Mapping in Delhi. J. Indian Soc. Remote Sens. 2024, 52, 17–39. [Google Scholar] [CrossRef]
- Rokhshad, A.M.; Khashei Siuki, A.; Yaghoobzadeh, M. Evaluation of a machine-based learning method to estimate the rate of nitrate penetration and groundwater contamination. Arab. J. Geosci. 2021, 14, 40. [Google Scholar] [CrossRef]
- Sadeghi-Jahani, H.; Ketabchi, H.; Shafizadeh-Moghadam, H. Spatiotemporal assessment of sustainable groundwater management using process-based and remote sensing indices: A novel approach. Sci. Total Environ. 2024, 918, 170828. [Google Scholar] [CrossRef] [PubMed]
- Chamanehpour, E.; Sayadi, M.H.; Yousefi, E. The potential evaluation of groundwater pollution is based on the intrinsic and the specific vulnerability index. Groundw. Sustain. Dev. 2020, 10, 100313. [Google Scholar] [CrossRef]
- Youssef, Y.M.; Gemail, K.S.; Sugita, M.; Saada, S.A.; Teama, M.A.; AlBarqawy, M.; Abdelaziz, E.; Fares, K. Multi-temporal analysis of Coastal Urbanization and Land Cover Changes in Suez City, Egypt Using Remote Sensing and GIS. Front. Sci. Res. Technol. 2022, 4, 2682–2962. [Google Scholar] [CrossRef]
- Embaby, A.; Youssef, Y.M.; Abu El-Magd, S.A. Delineation of lineaments for groundwater prospecting in hard rocks: Inferences from remote sensing and geophysical data. Environ. Earth Sci. 2024, 83, 62. [Google Scholar] [CrossRef]
- Khalil, M.M.E.; Khodary, S.M.; Youssef, Y.M.; Alsubaie, M.S.; Sallam, A. Geo-Environmental Hazard Assessment of Archaeological Sites and Archaeological Domes—Fatimid Tombs—Aswan, Egypt. Buildings 2022, 12, 2175. [Google Scholar] [CrossRef]
- Hayeri Yazdi, S.; Robati, M.; Samani, S.; Zamani Hargalani, F. Assessing the sustainability of groundwater quality for irrigation purposes using a fuzzy logic approach. Environ. Sustain. Ind. 2024, 22, 100342. [Google Scholar] [CrossRef]
- Hosseini, S.M.; Parizi, E.; Ataie-Ashtiani, B.; Simmons, C.T. Assessment of sustainable groundwater resources management using integrated environmental index: Case studies across Iran. Sci. Total Environ. 2019, 676, 792–810. [Google Scholar] [CrossRef]
- Noori, A.; Bonakdari, H.; Hassaninia, M.; Morovati, K.; Khorshidi, I.; Noori, A.; Gharabaghi, B. A reliable GIS-based FAHP-FTOPSIS model to prioritize urban water supply management scenarios: A case study in semi-arid climate. Sustain. Cities Soc. 2022, 81, 103846. [Google Scholar] [CrossRef]
- Arabameri, A.; Rezaei, K.; Cerda, A.; Lombardo, L.; Rodrigo-Comino, J. GIS-based groundwater potential mapping in Shahroud Plain, Iran. A comparison among statistical (bivariate and multivariate), data mining and MCDM approaches. Sci. Total Environ. 2019, 658, 160–177. [Google Scholar] [CrossRef]
- Anjum, R.; Ali, S.A.; Siddiqui, M.A. Assessing the Impact of Land Cover on Groundwater Quality in a Smart City Using GIS and Machine Learning Algorithms. Water Air Soil Pollut. 2023, 234, 182. [Google Scholar] [CrossRef]
- Liao, H.; He, Y.; Wu, X.; Wu, Z.; Bausys, R. Reimagining multi-criterion decision making by data-driven methods based on machine learning: A literature review. Inf. Fusion 2023, 100, 101970. [Google Scholar] [CrossRef]
- Mohammadi Arasteh, S.; Shoaei, S.M. A comprehensive review of the salinity assessment in groundwater resources of Iran. Acta Geophys. 2024, 72, 385–403. [Google Scholar] [CrossRef]
- Hosseininia, M.; Hassanzadeh, R. Groundwater quality assessment for domestic and agricultural purposes using GIS, hydrochemical facies and water quality indices: Case study of Rafsanjan plain, Kerman province, Iran. Appl. Water Sci. 2023, 13, 84. [Google Scholar] [CrossRef]
- Statistical Yearbook of Kerman Province. Iran Statistics Center. Tehran. Iran. 2016. Available online: https://www.amar.org.ir/en/ (accessed on 20 June 2024). (In Persian).
- Nilzad, M.; Moradi, H.; Jalili, K. Estimation of temporal and spatial variations of the level of the aquifers in Bisotun plain of Kermanshah province with geostatistical methods. Irrig. Water Eng. 2018, 8, 79–92. (In Persian) [Google Scholar]
- Malakootian, M.; Nozari, M. GIS-based Drastic and composite Drastic indices for assessing groundwater vulnerability in the Baghin aquifer, Kerman, Iran. Nat. Hazards Earth Syst. Sci. 2020, 20, 2351–2363. [Google Scholar] [CrossRef]
- Huang, P.; Hou, M.; Sun, T.; Xu, H.; Ma, C.; Zhou, A. Sustainable groundwater management in coastal cities: Insights from groundwater potential and vulnerability using ensemble learning and knowledge-driven models. J. Clean. Prod. 2024, 442, 141152. [Google Scholar] [CrossRef]
- Vapnik, V.N. The Nature of Statistical Learning Theory; Springer: New York, NY, USA, 1995; pp. 291–299. [Google Scholar] [CrossRef]
- Yu, P.; Chen, S.; Chang, I. Support vector regression for real-time flood stage forecasting. J. Hydrol. 2006, 328, 704–716. [Google Scholar] [CrossRef]
- Breiman, L. Random forests. Mach. Learn. 2001, 45, 5–32. [Google Scholar] [CrossRef]
- Jorda, H.; Bechtold, M.; Jarvis, N.; Koestel, J. Using boosted regression trees to explore key factors controlling saturated and near-saturated hydraulic conductivity. Eur. J. Soil Sci. 2015, 66, 744–756. [Google Scholar] [CrossRef]
- Sutton, C.D. 11—Classification and Regression Trees, Bagging, and Boosting. In Handbook of Statistics; Rao, C.R., Wegman, E.J., Solka, J.L., Eds.; Elsevier: Amsterdam, The Netherlands, 2005; Volume 24, pp. 303–329. [Google Scholar] [CrossRef]
- Cotruvo, J.A. 2017 WHO Guidelines for Drinking Water Quality: First Addendum to the Fourth Edition. J. Am. Water Works Assoc. 2017, 109, 44–51. [Google Scholar] [CrossRef]
- Gharekhani, M.; Nadiri, A.A.; Khatibi, R.; Sadeghfam, S.; Moghaddam, A.A. A study of uncertainties in groundwater vulnerability modelling using Bayesian model averaging (BMA). J. Environ. Manag. 2022, 303, 114168. [Google Scholar] [CrossRef] [PubMed]
- Nouri, M.; Homaee, M.; Pereira, L.S.; Bybordi, M. Water management dilemma in the agricultural sector of Iran: A review focusing on water governance. Agric. Water Manag. 2023, 288, 108480. [Google Scholar] [CrossRef]
- Yang, X.; Du, J.; Jia, C.; Yang, T.; Shao, S. Groundwater pollution risk, health effects and sustainable management of halocarbons in typical industrial parks. Environ. Res. 2024, 250, 118422. [Google Scholar] [CrossRef] [PubMed]
- Gambo, J.; Aliaa binti Roslan, S.N.; Zulhaidi Mohd Shafrib, H.; Norasma Che Ya, N.; Ahmed Yusuf, Y. Unveiling groundwater potential zones as catalyst for multidimensional poverty reduction using analytical hierarchical process and geospatial decision support systems (S-DSS) approach in the semiarid region, Jigawa, Nigeria. Groundw. Sustain. Dev. 2024, 24, 101038. [Google Scholar] [CrossRef]
- Motlagh, Z.K.; Sayadi, M.H. Siting MSW landfills using MCE methodology in GIS environment (Case study: Birjand plain, Iran). Waste Manag. 2015, 46, 322–337. [Google Scholar] [CrossRef]
- Arnous, M.O.; El-Rayes, A.E.; Green, D.R. Hydrosalinity and environmental land degradation assessment of the East Nile Delta region, Egypt. J. Coast. Conserv. 2015, 19, 491–513. [Google Scholar] [CrossRef]
- Alhamd, A.; Ibrahim, M. Unveiling soil and groundwater salinity dynamics and its impact on date palm yield in Southern Basrah, Iraq. Dysona Appl. Sci. 2024, 5, 25–32. [Google Scholar] [CrossRef]
- Khalil, M.M.; Aboueldahab, S.M.; Abdel-Raheem, K.H.M.; Ahmed, M.; Ahmed, M.S.; Abdelhady, A.A. Mixed agricultural, industrial, and domestic drainage water discharge poses a massive strain on freshwater ecosystems: A case from the Nile River in Upper Egypt. Environ. Sci. Pollut. Res. 2023, 30, 122642–122662. [Google Scholar] [CrossRef]
- Arefin, R.; Rahman, A.T.M.S.; Das, J.; Jahan, C.S.; Mazumder, Q.H.; Gomaa, E.; Abd El Aal, A.K.; Radwan, A.E.; Youssef, Y.M. Megacity solid waste disposal suitability mapping in Dhaka, Bangladesh: An integrated approach using remote sensing, GIS and statistics. Environ. Monit. Assess. 2024, 196, 910. [Google Scholar] [CrossRef]
- Gharechaee, H.; Nazari Samani, A.; Khalighi Sigaroodi, S.; Sadeghi, S.M.M.; Sharifitabesh, S.; Mousavi, M.S.; Marcu, M.V.; Hubbart, J.A. Introducing a novel approach for assessment of groundwater salinity hazard, vulnerability, and risk in a semiarid region. Ecol. Inform. 2024, 81, 102647. [Google Scholar] [CrossRef]
- Issaoui, W.; Nasr, I.H.; Alexakis, D.D.; Bejaoui, W.; Ibraheem, I.M.; Ezzine, A.; Ben Othman, D.; Inoubli, M.H. Geometric Characterization of the Mateur Plain in Northern Tunisia Using Vertical Electrical Sounding and Remote Sensing Techniques. ISPRS Int. J. Geo-Inf. 2024, 13, 333. [Google Scholar] [CrossRef]
- Mosavi, A.; Sajedi Hosseini, F.; Choubin, B.; Taromideh, F.; Ghodsi, M.; Nazari, B.; Dineva, A.A. Susceptibility mapping of groundwater salinity using machine learning models. Environ. Sci. Pollut. Res. 2021, 28, 10804–10817. [Google Scholar] [CrossRef] [PubMed]
- Eid, M.H.; Shebl, A.; Eissa, M.; Mohamed, E.A.; Fahil, A.S.; Ramadan, H.S.; Abukhadra, R.M.; El-Sherbeeny, A.M.; Szűcs, P.; Kovacs, A. Comprehensive approach integrating remote sensing, machine learning, and physicochemical parameters to detecthydrodynamic conditions and groundwater quality deterioration in non-rechargeable aquifer systems. Heliyon 2024, 10, e32992. [Google Scholar] [CrossRef] [PubMed]
- Jesiya, N.P.; Gopinath, G.A. Customized FuzzyAHP—GIS based DRASTIC-L model for intrinsic groundwater vulnerability assessment of urban and peri urban phreatic aquifer clusters. Groundw. Sustain. Dev. 2019, 8, 654–666. [Google Scholar] [CrossRef]
- Motlagh, Z.K.; Lotfi, A.; Pourmanafi, S.; Ahmadizadeh, S.; Soffianian, A. Spatial modeling of land-use change in a rapidly urbanizing landscape in central Iran: Integration of remote sensing, CA-Markov, and landscape metrics. Environ. Monit. Assess. 2020, 192, 695. [Google Scholar] [CrossRef]
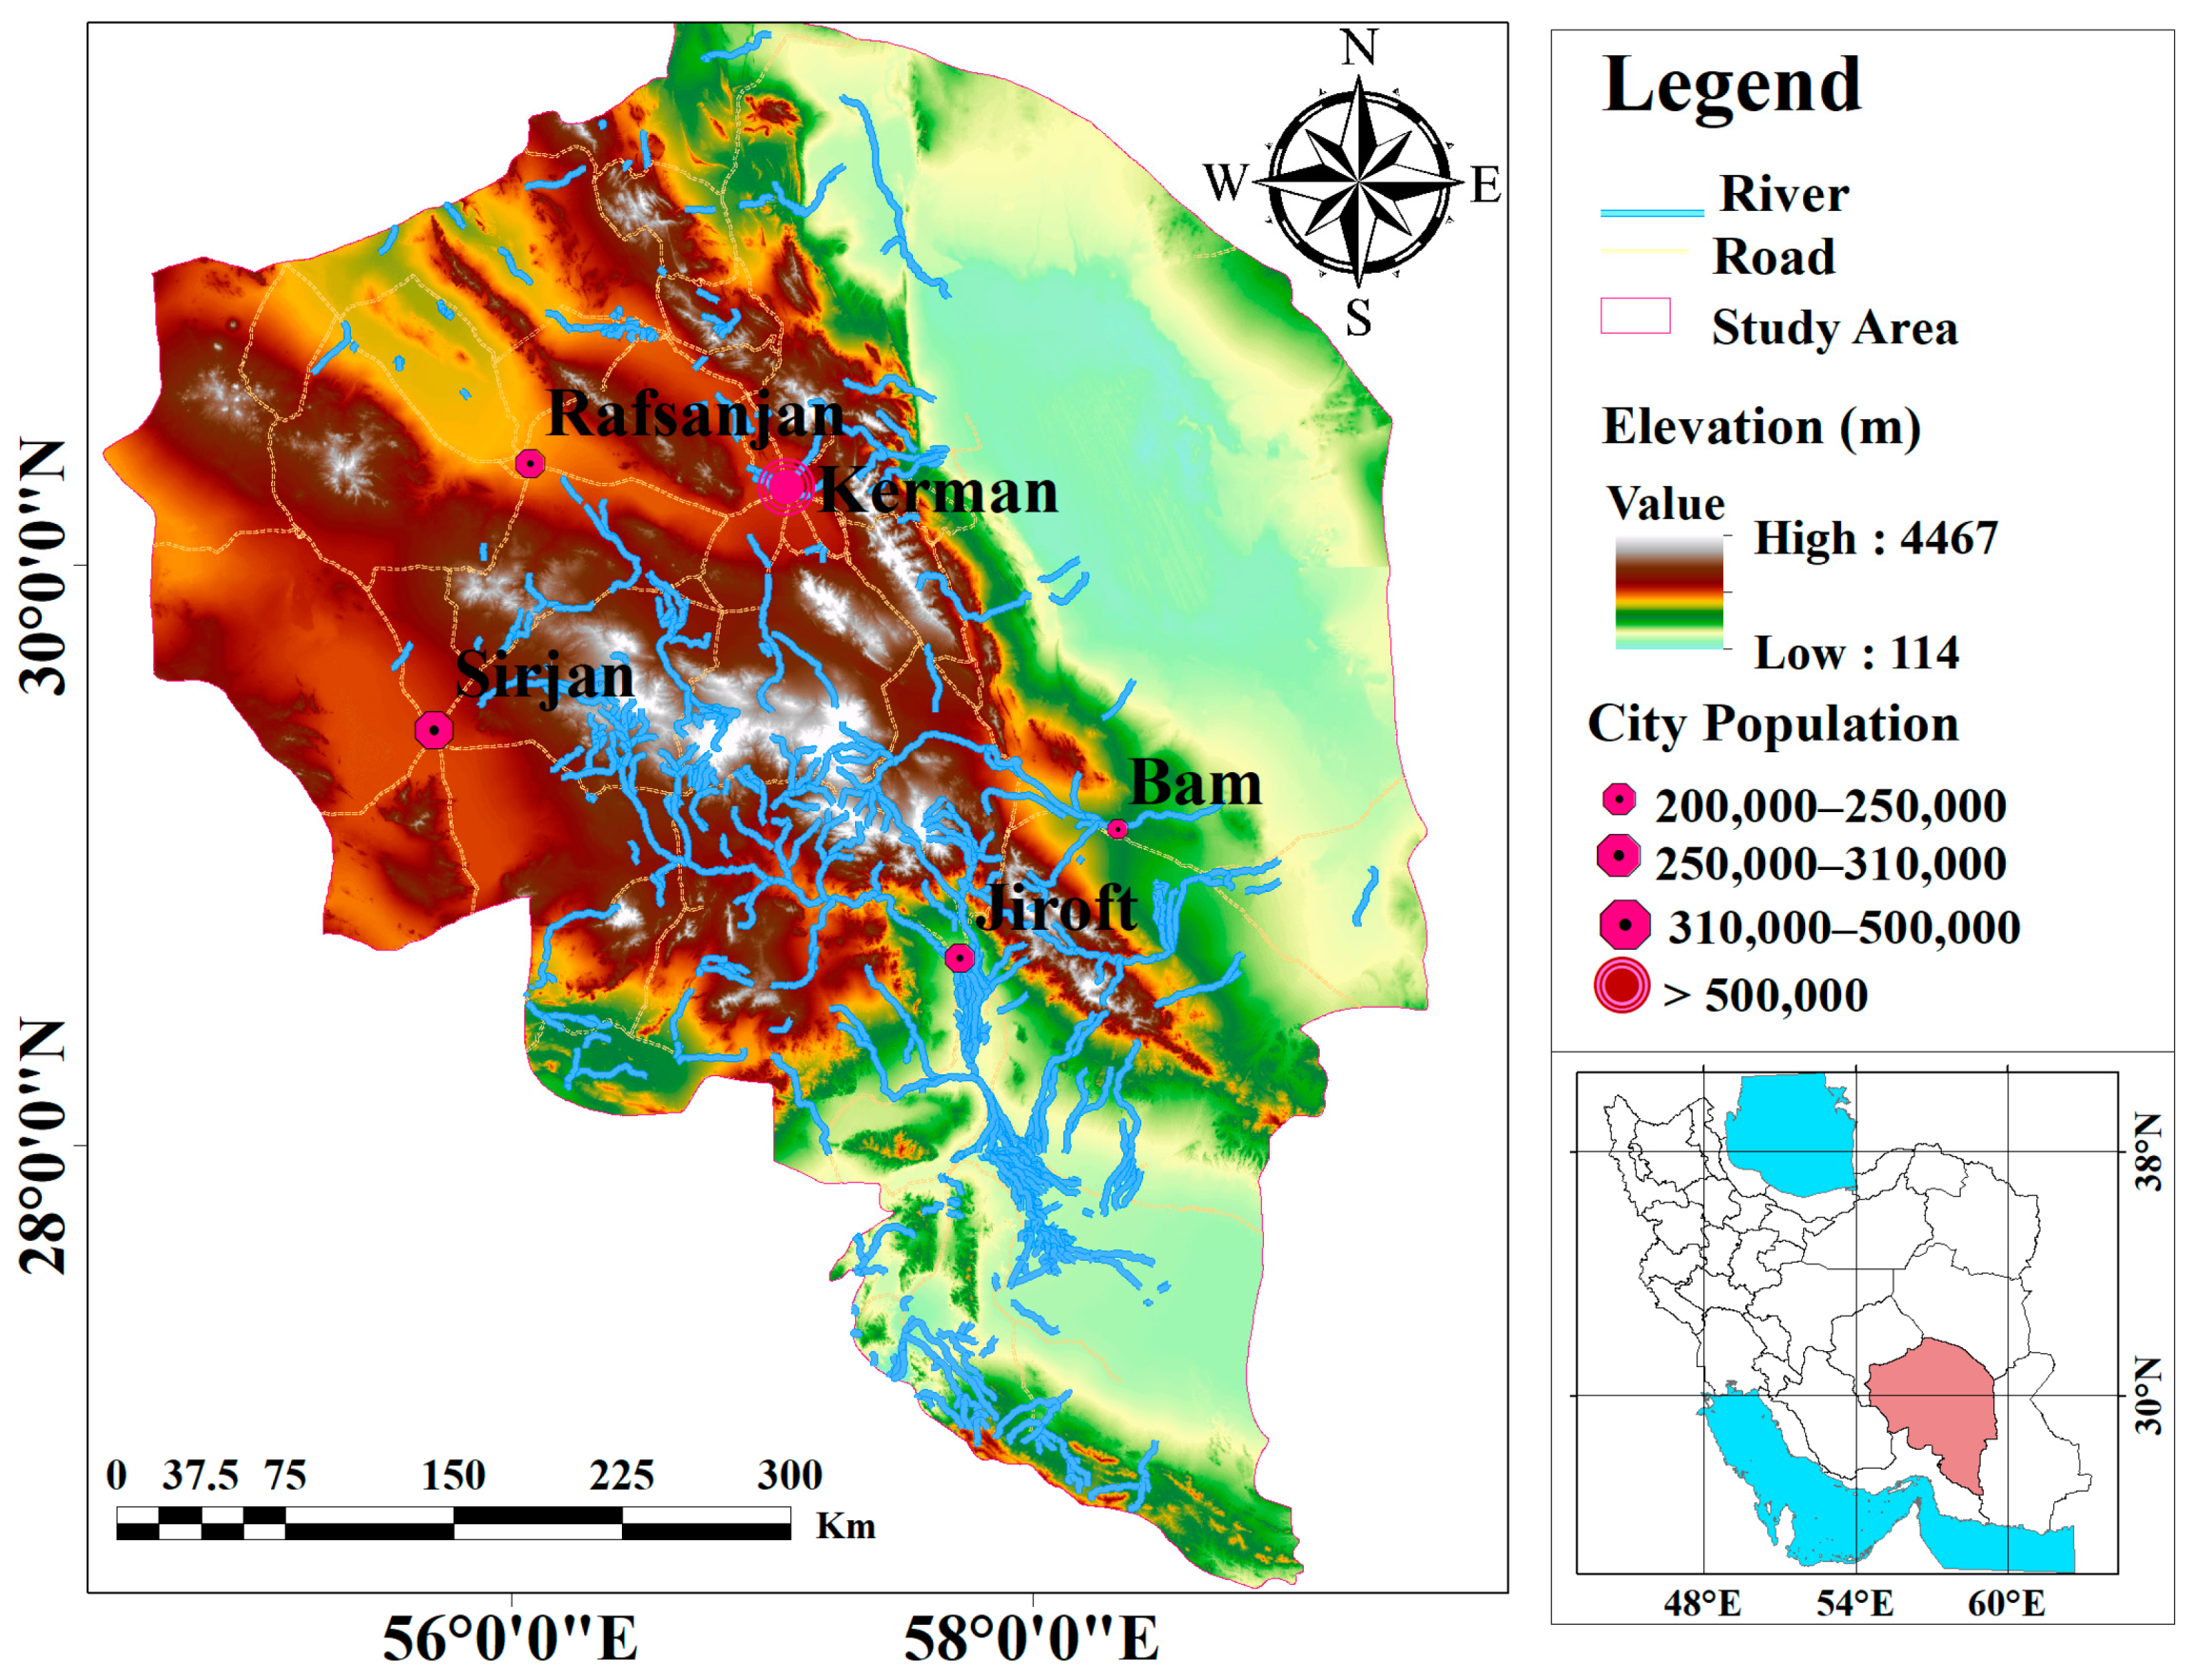
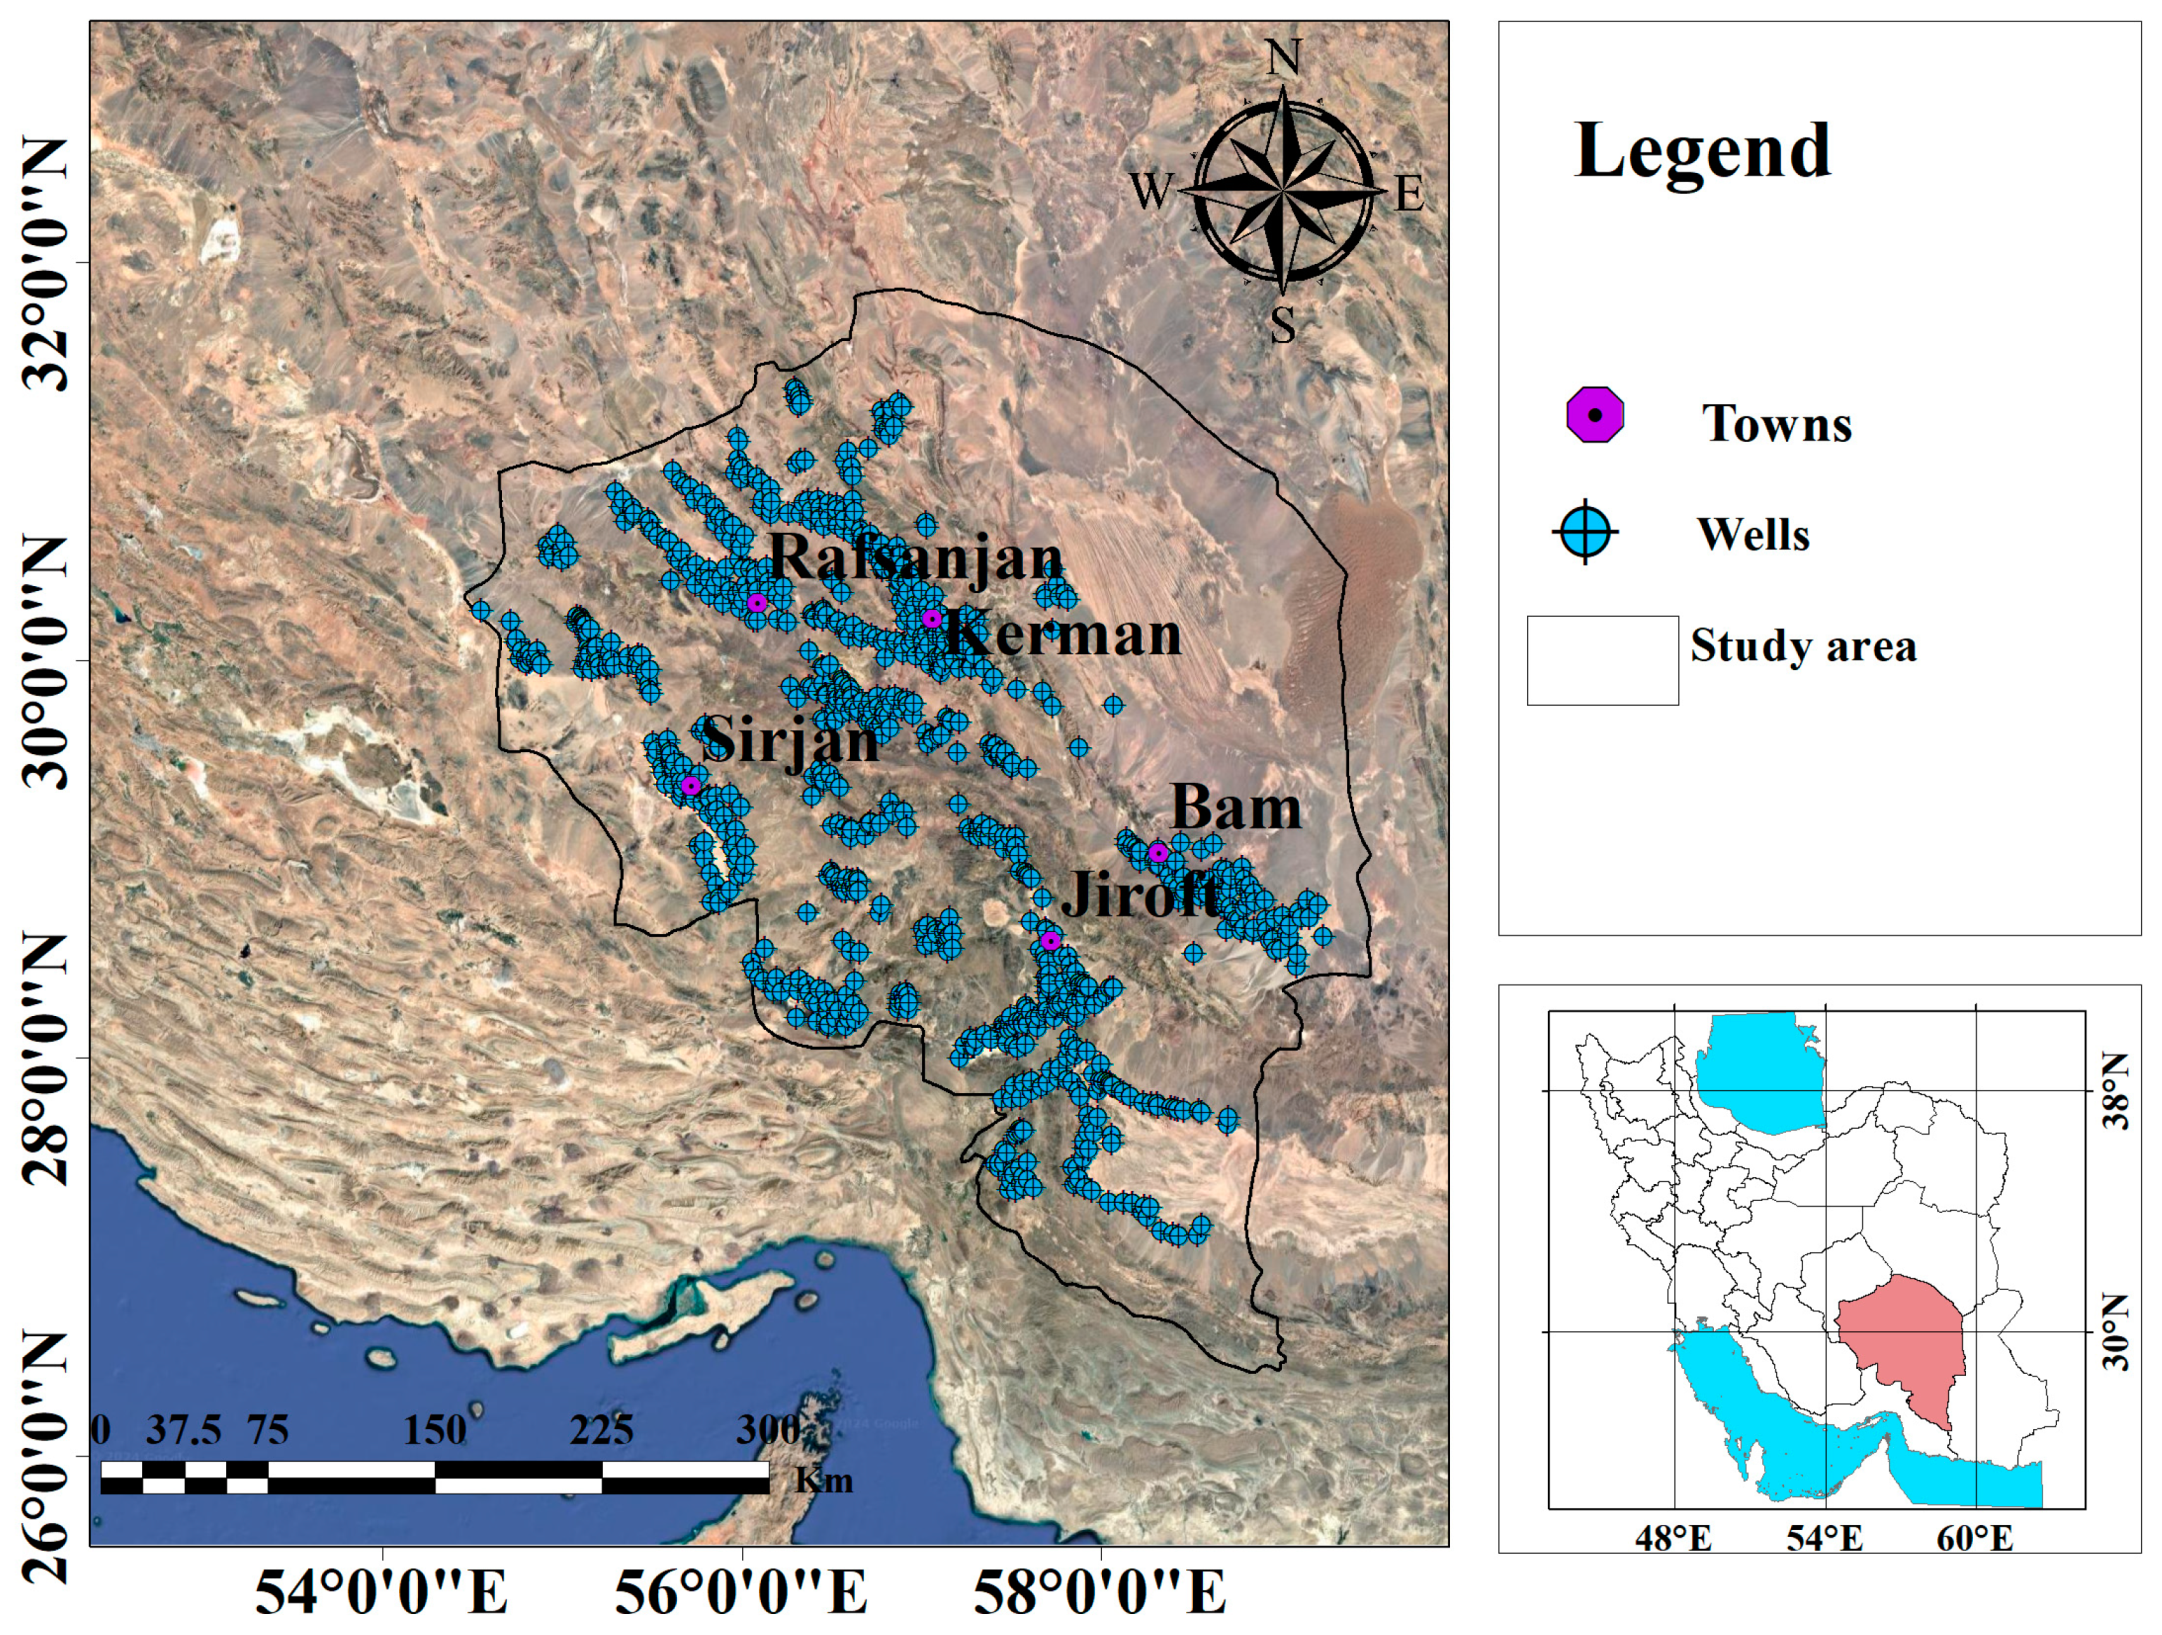

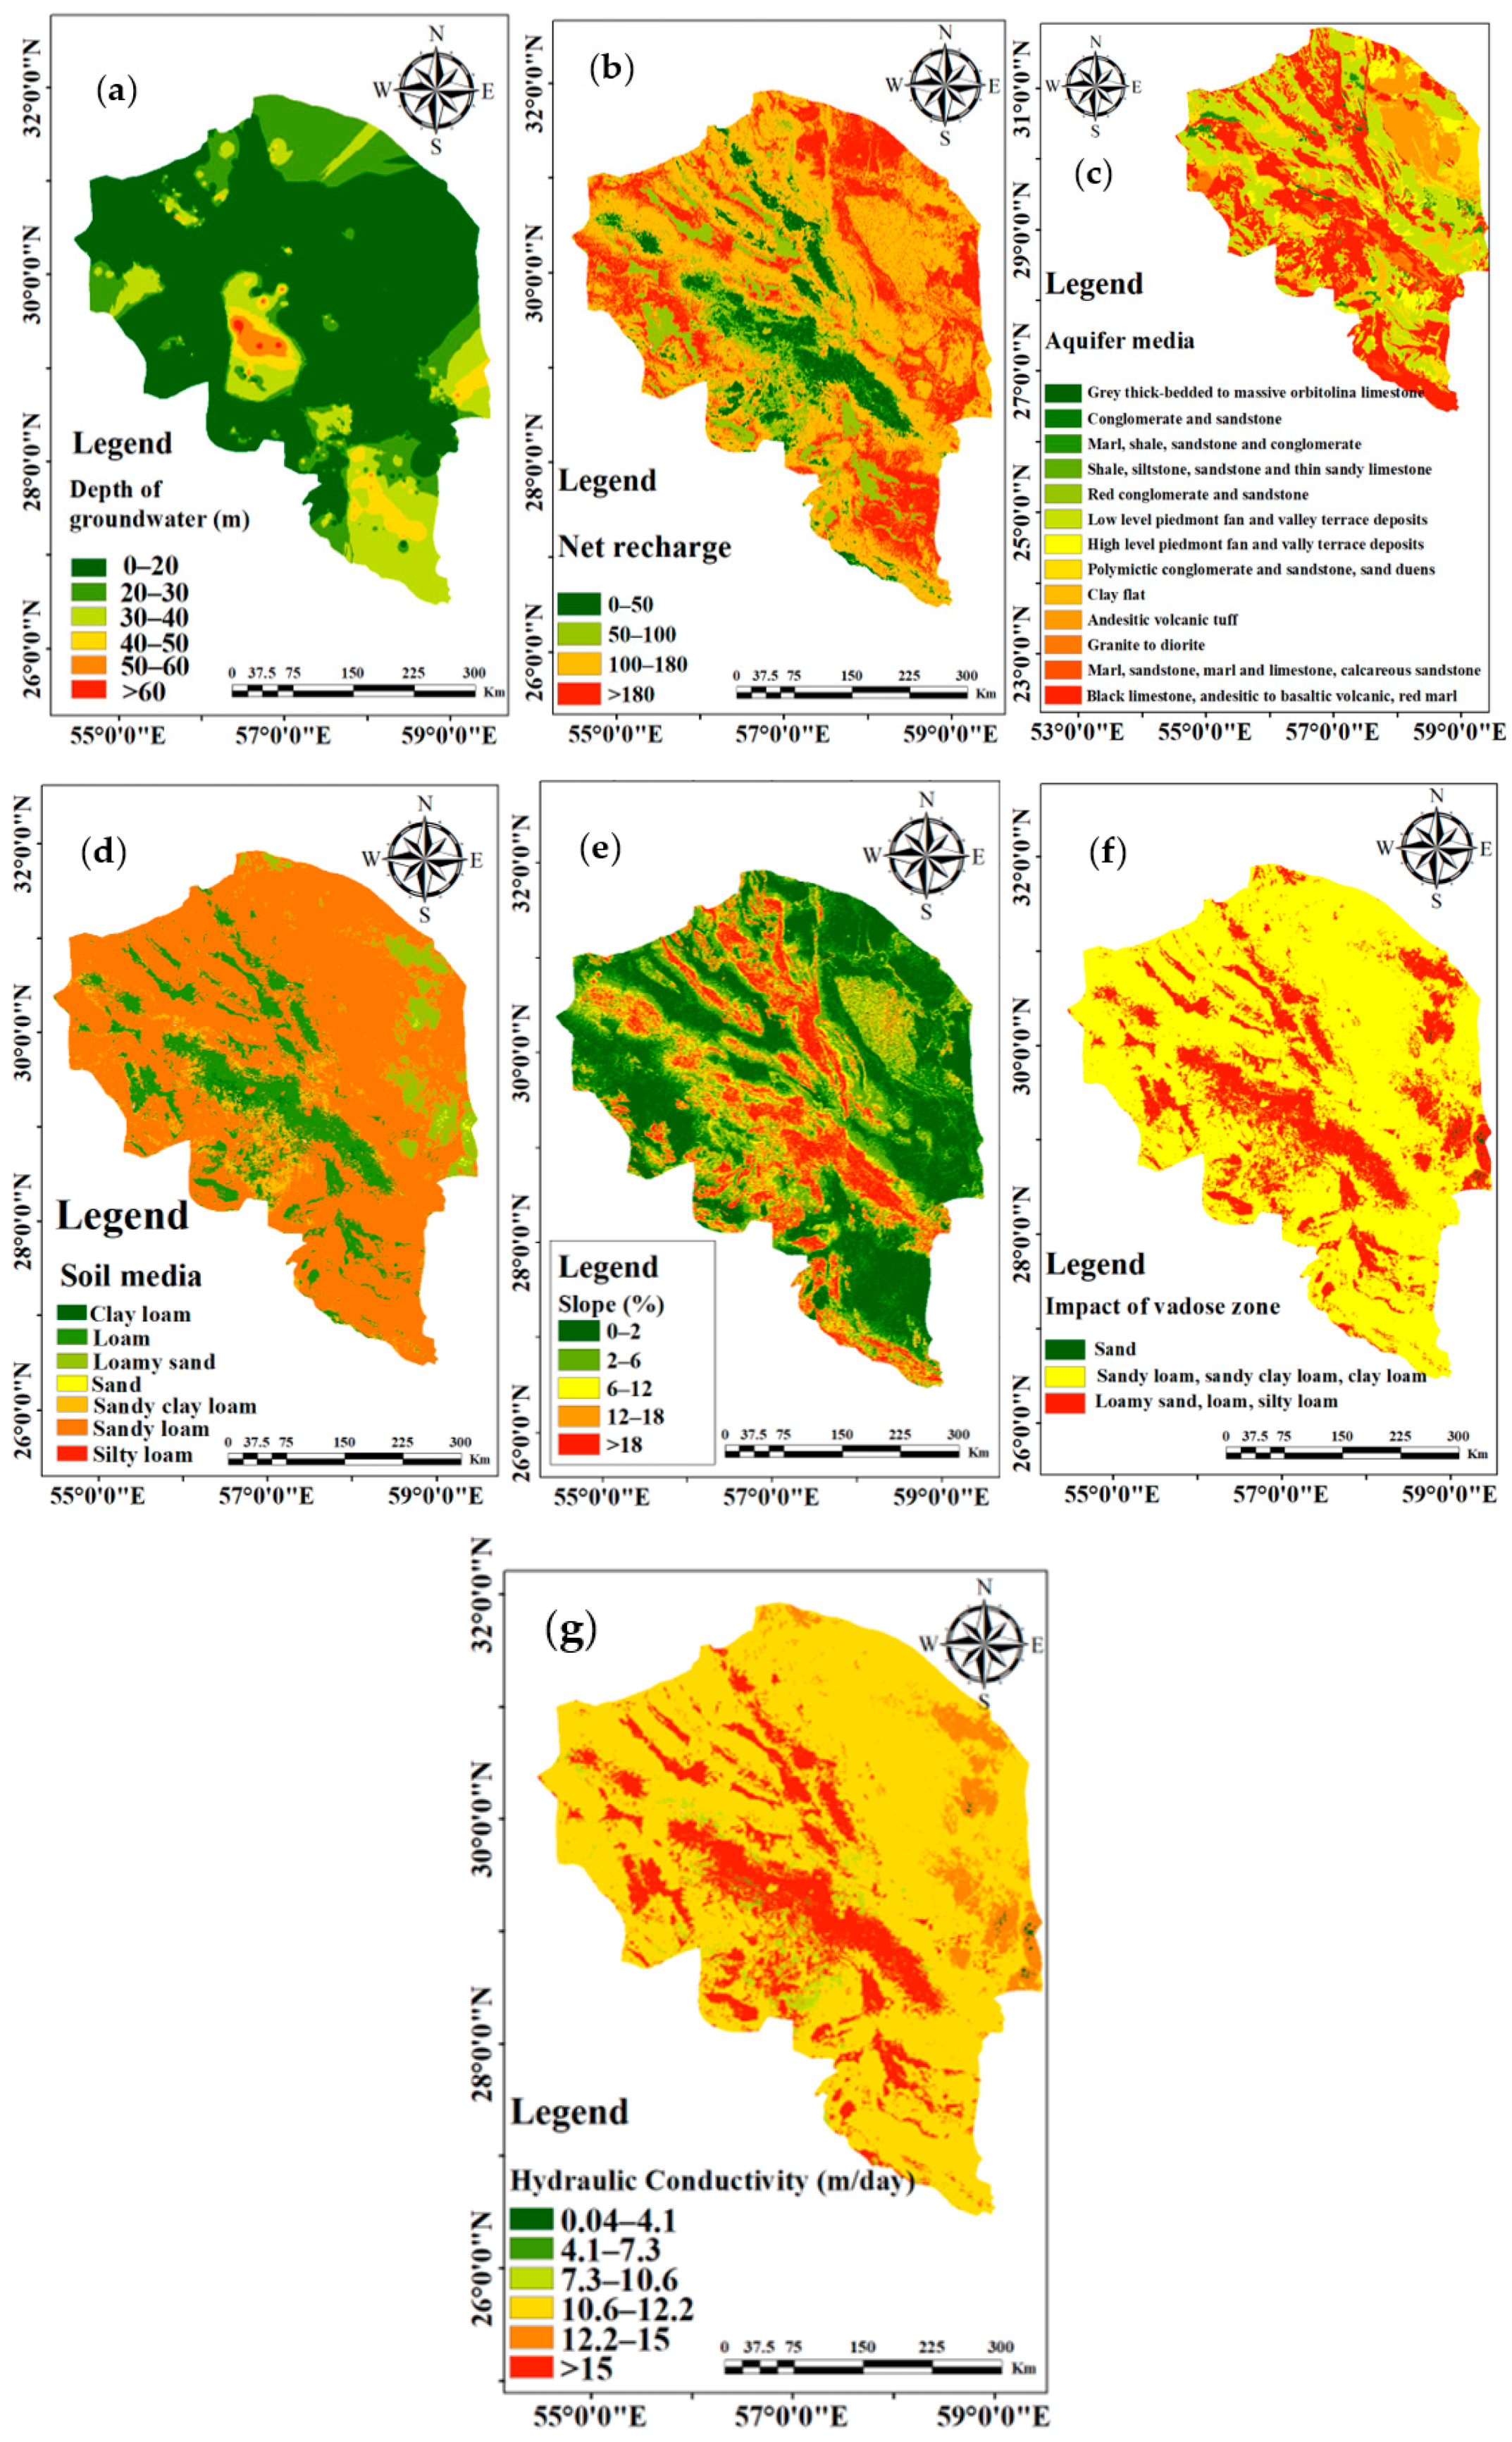
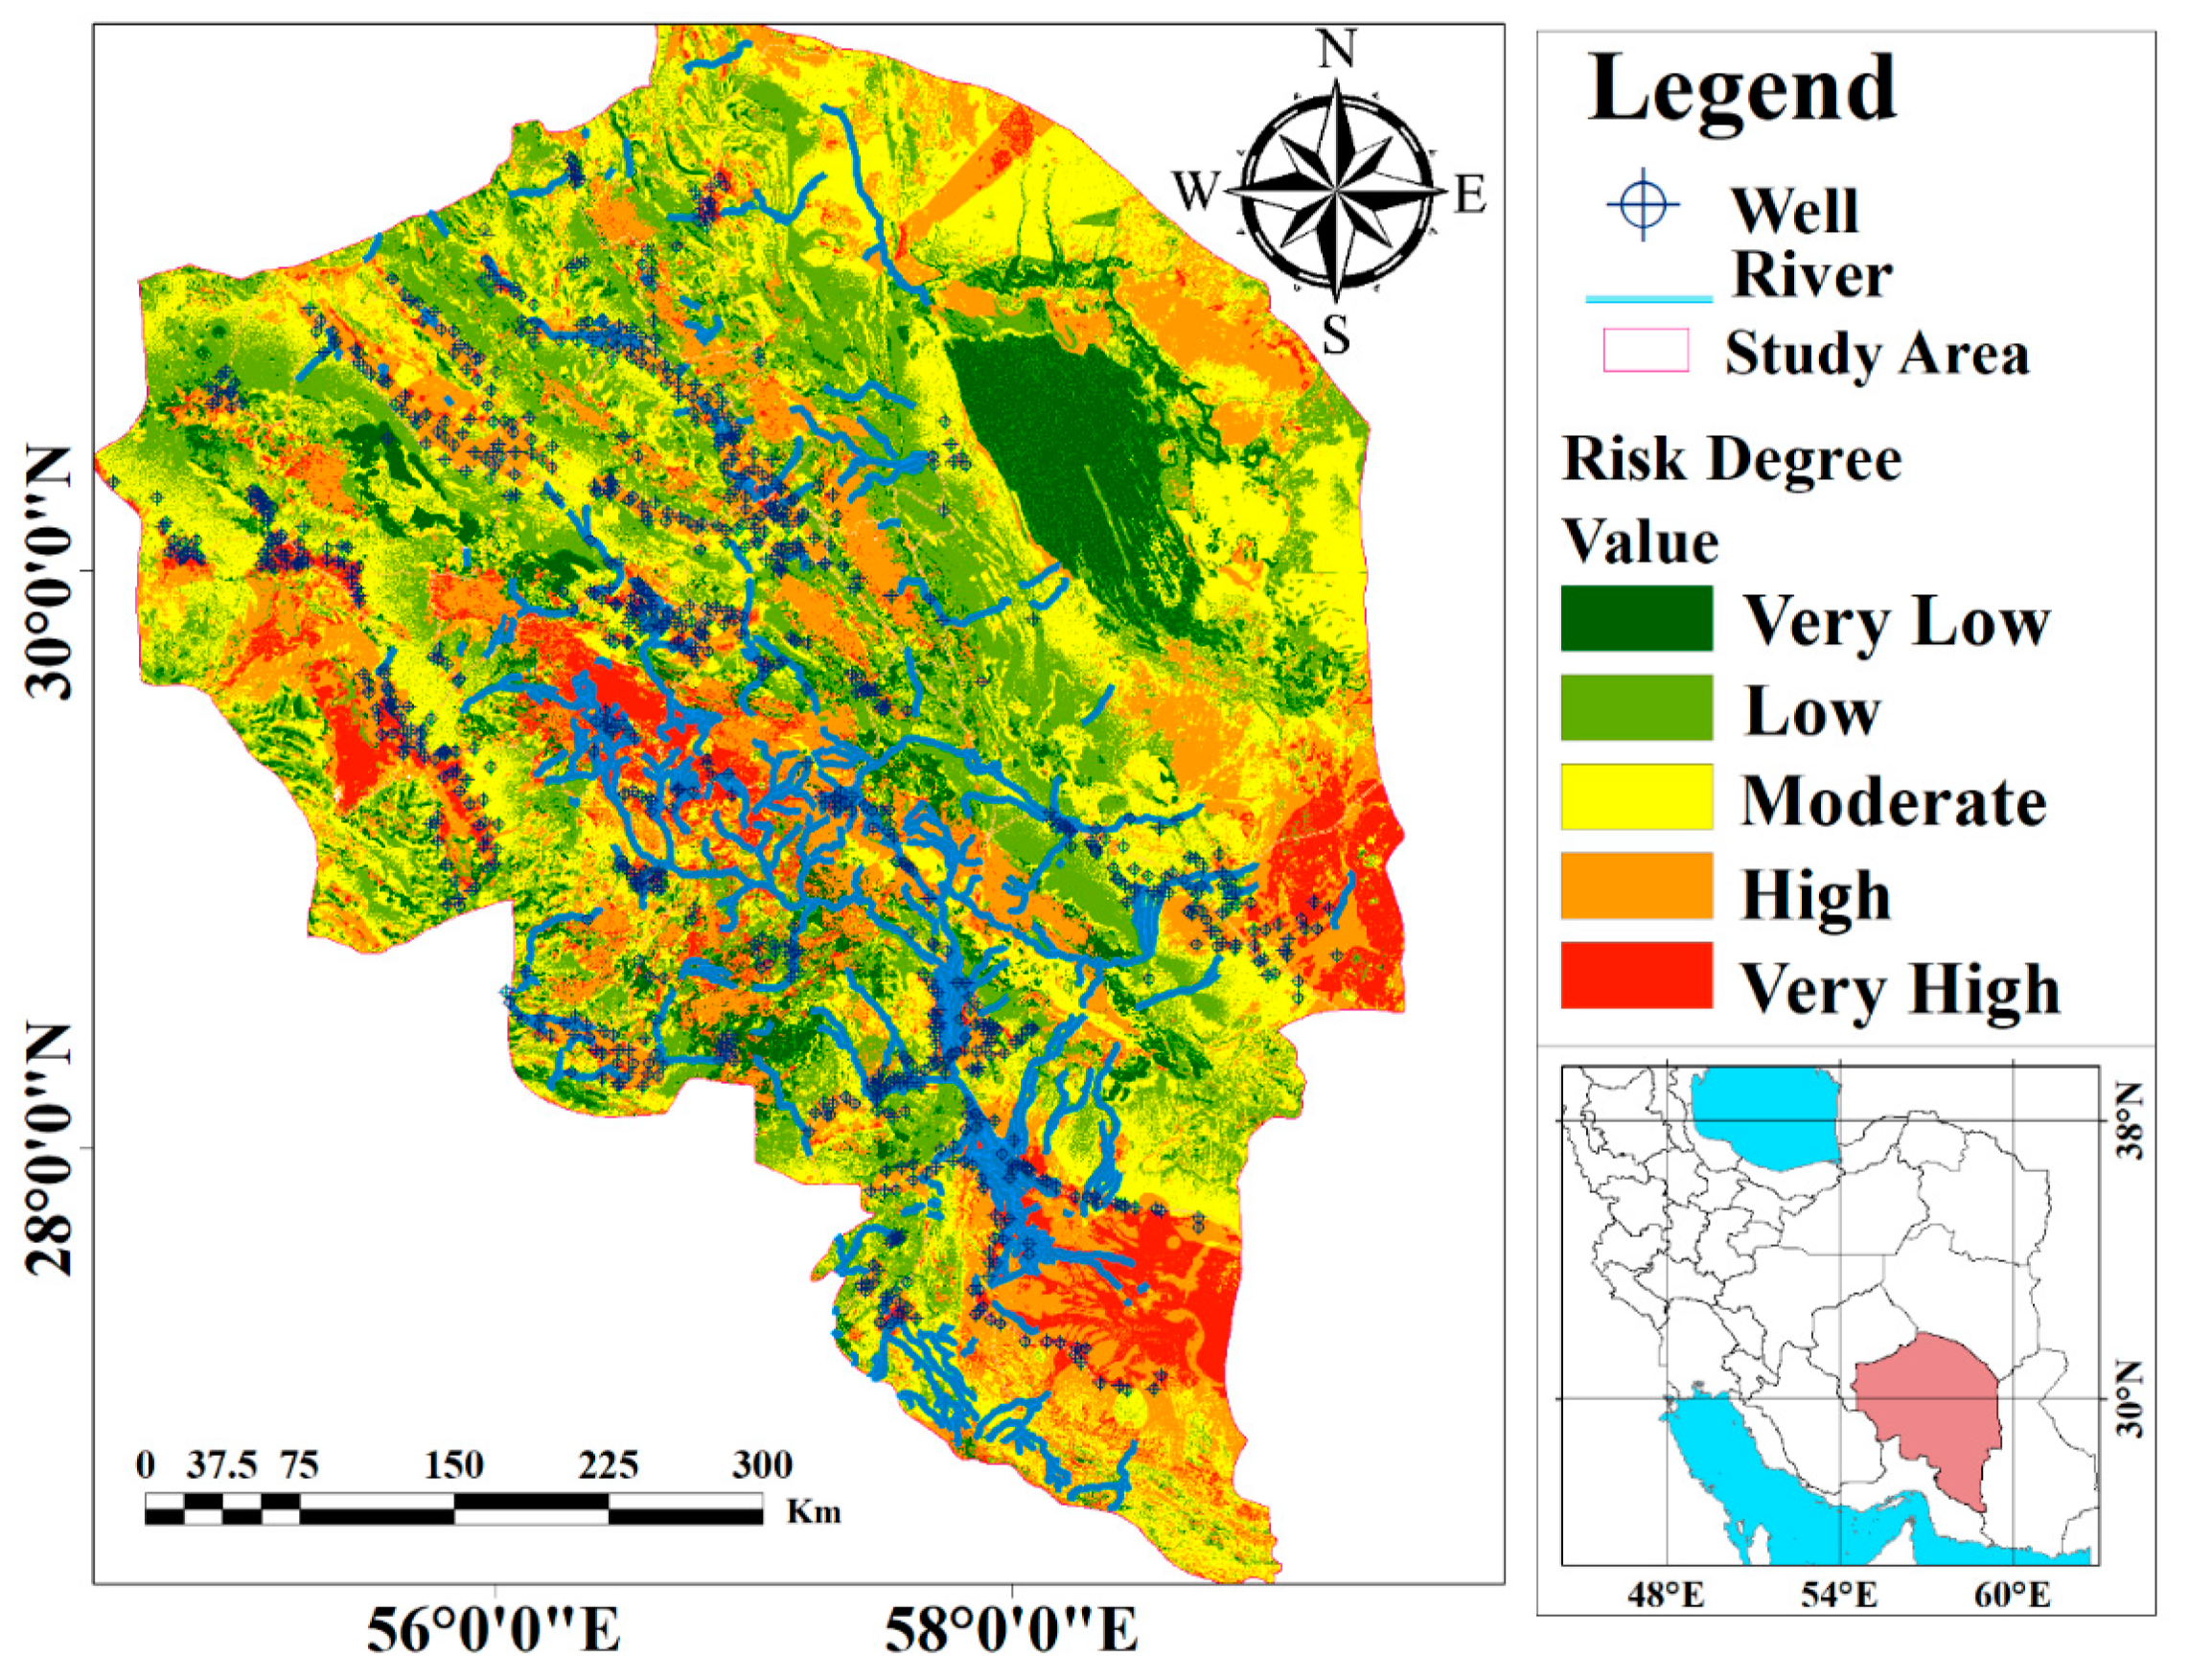
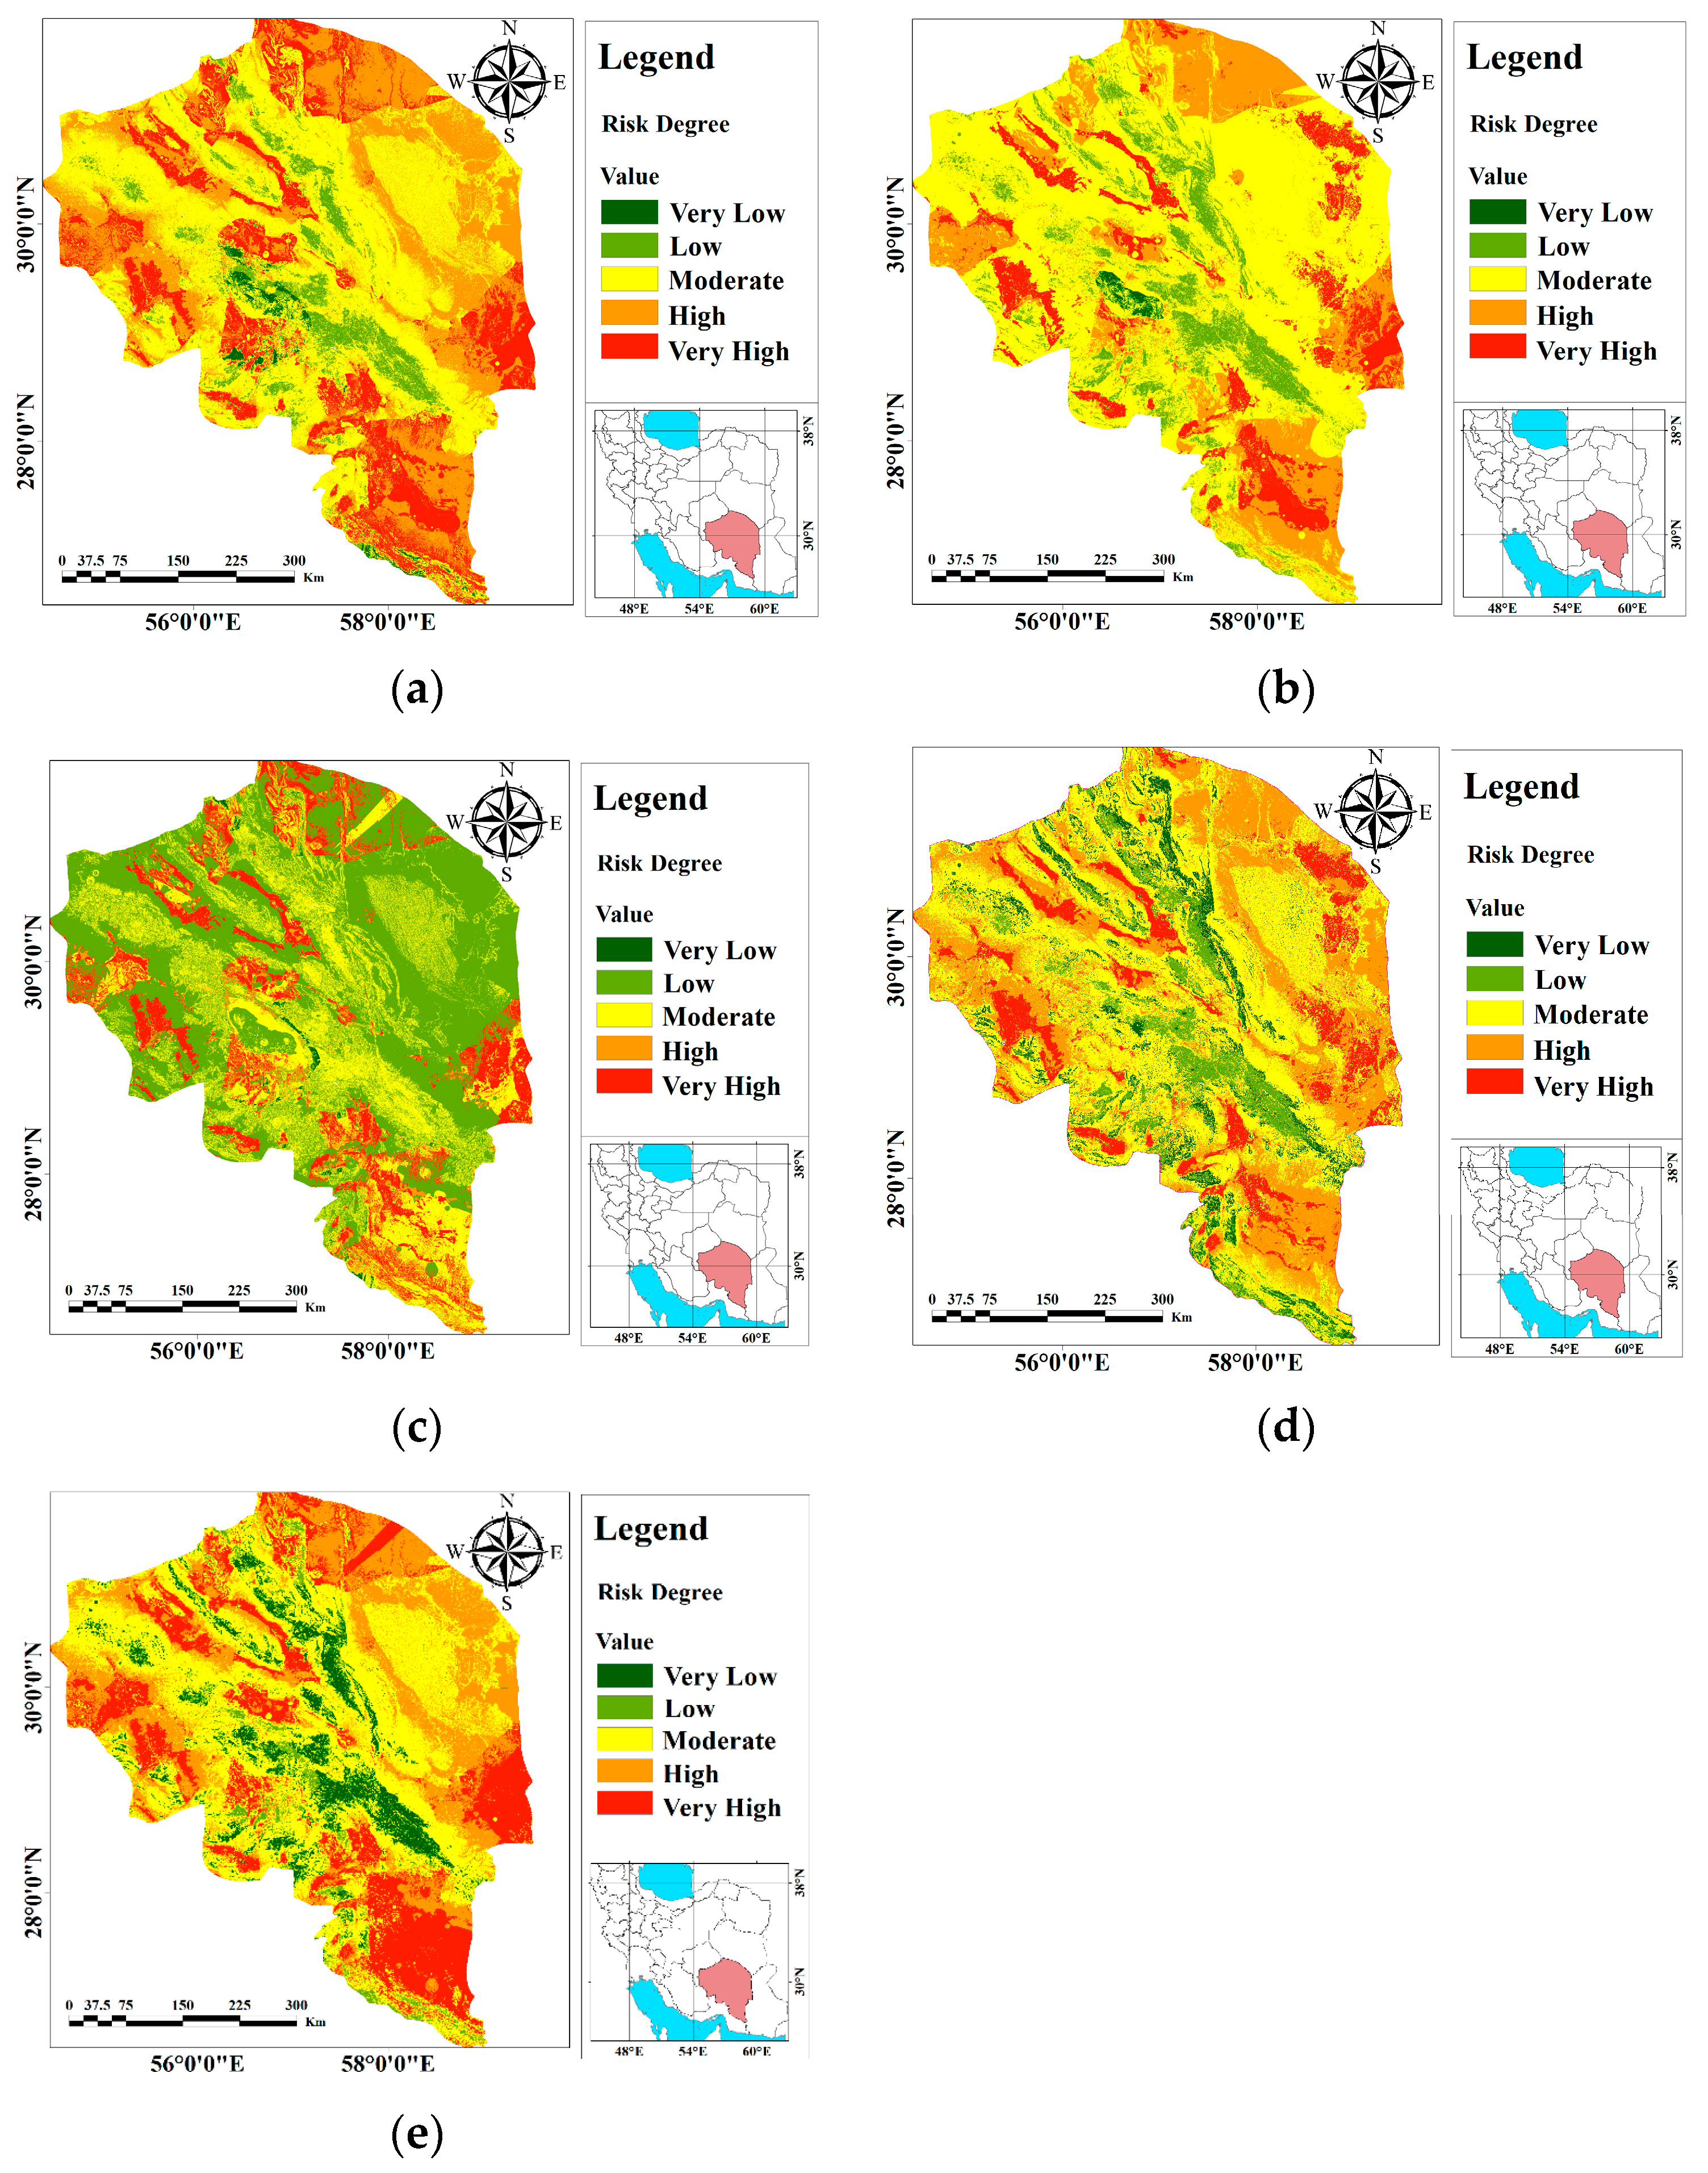
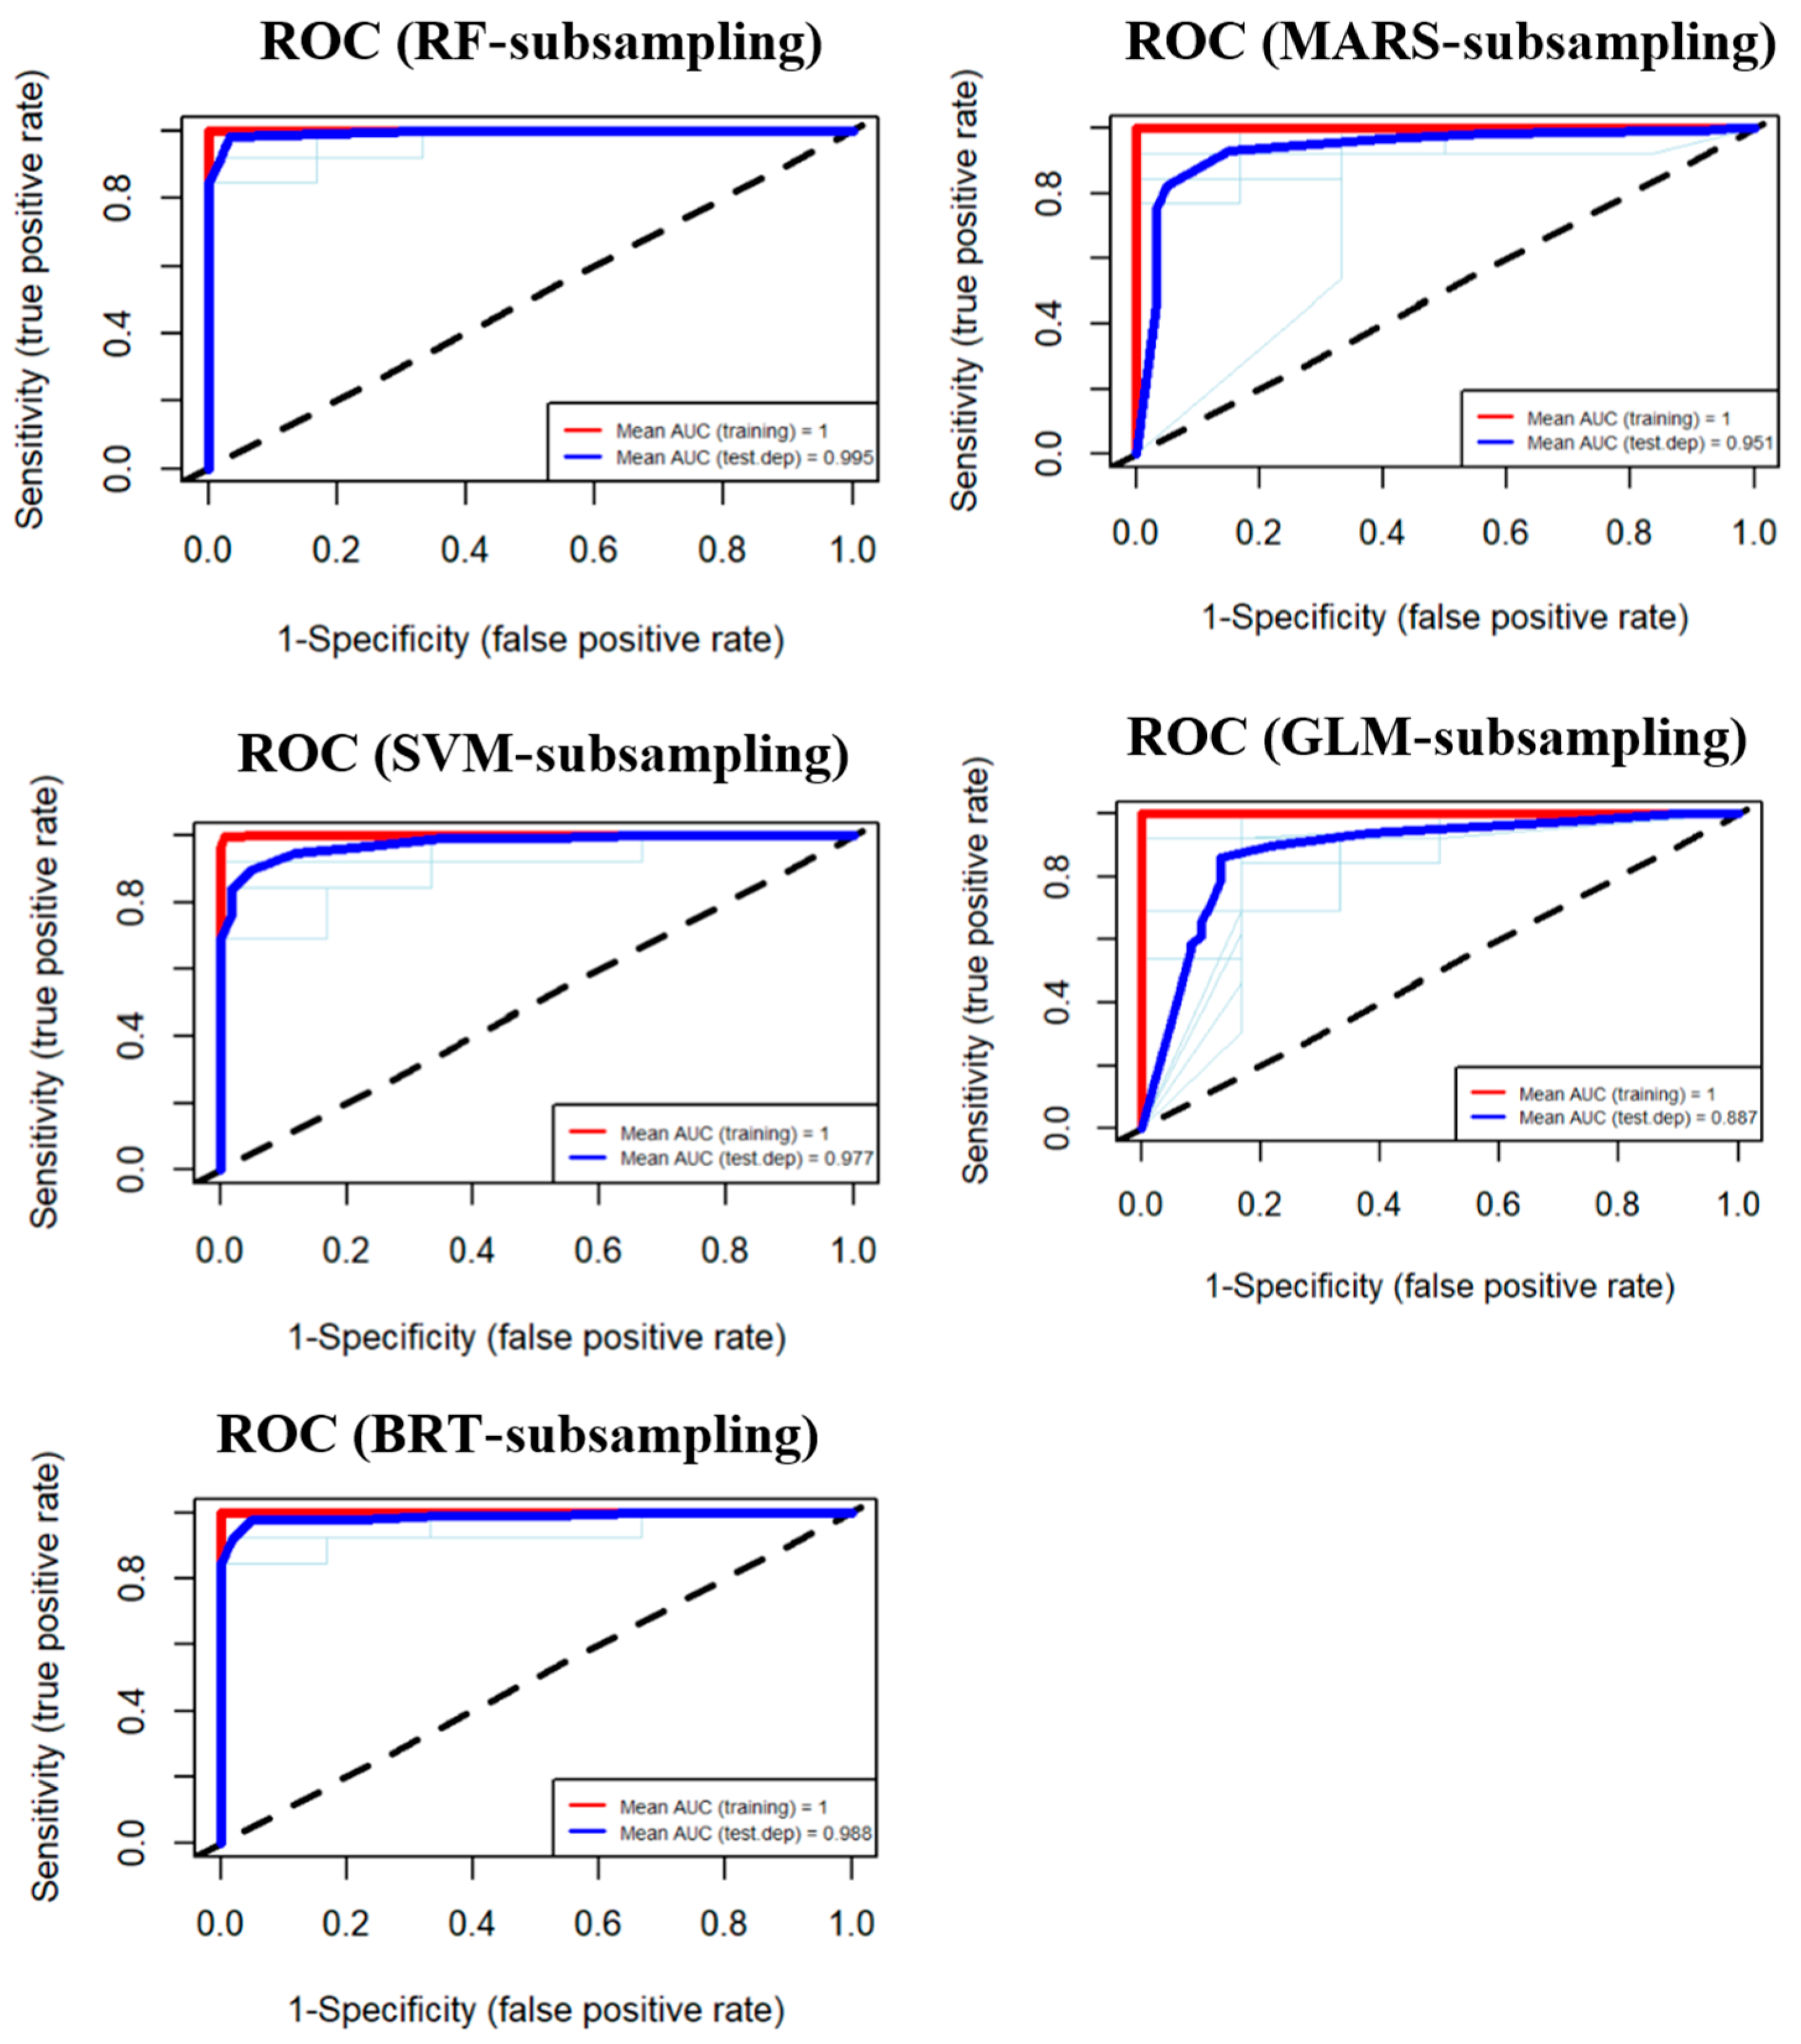
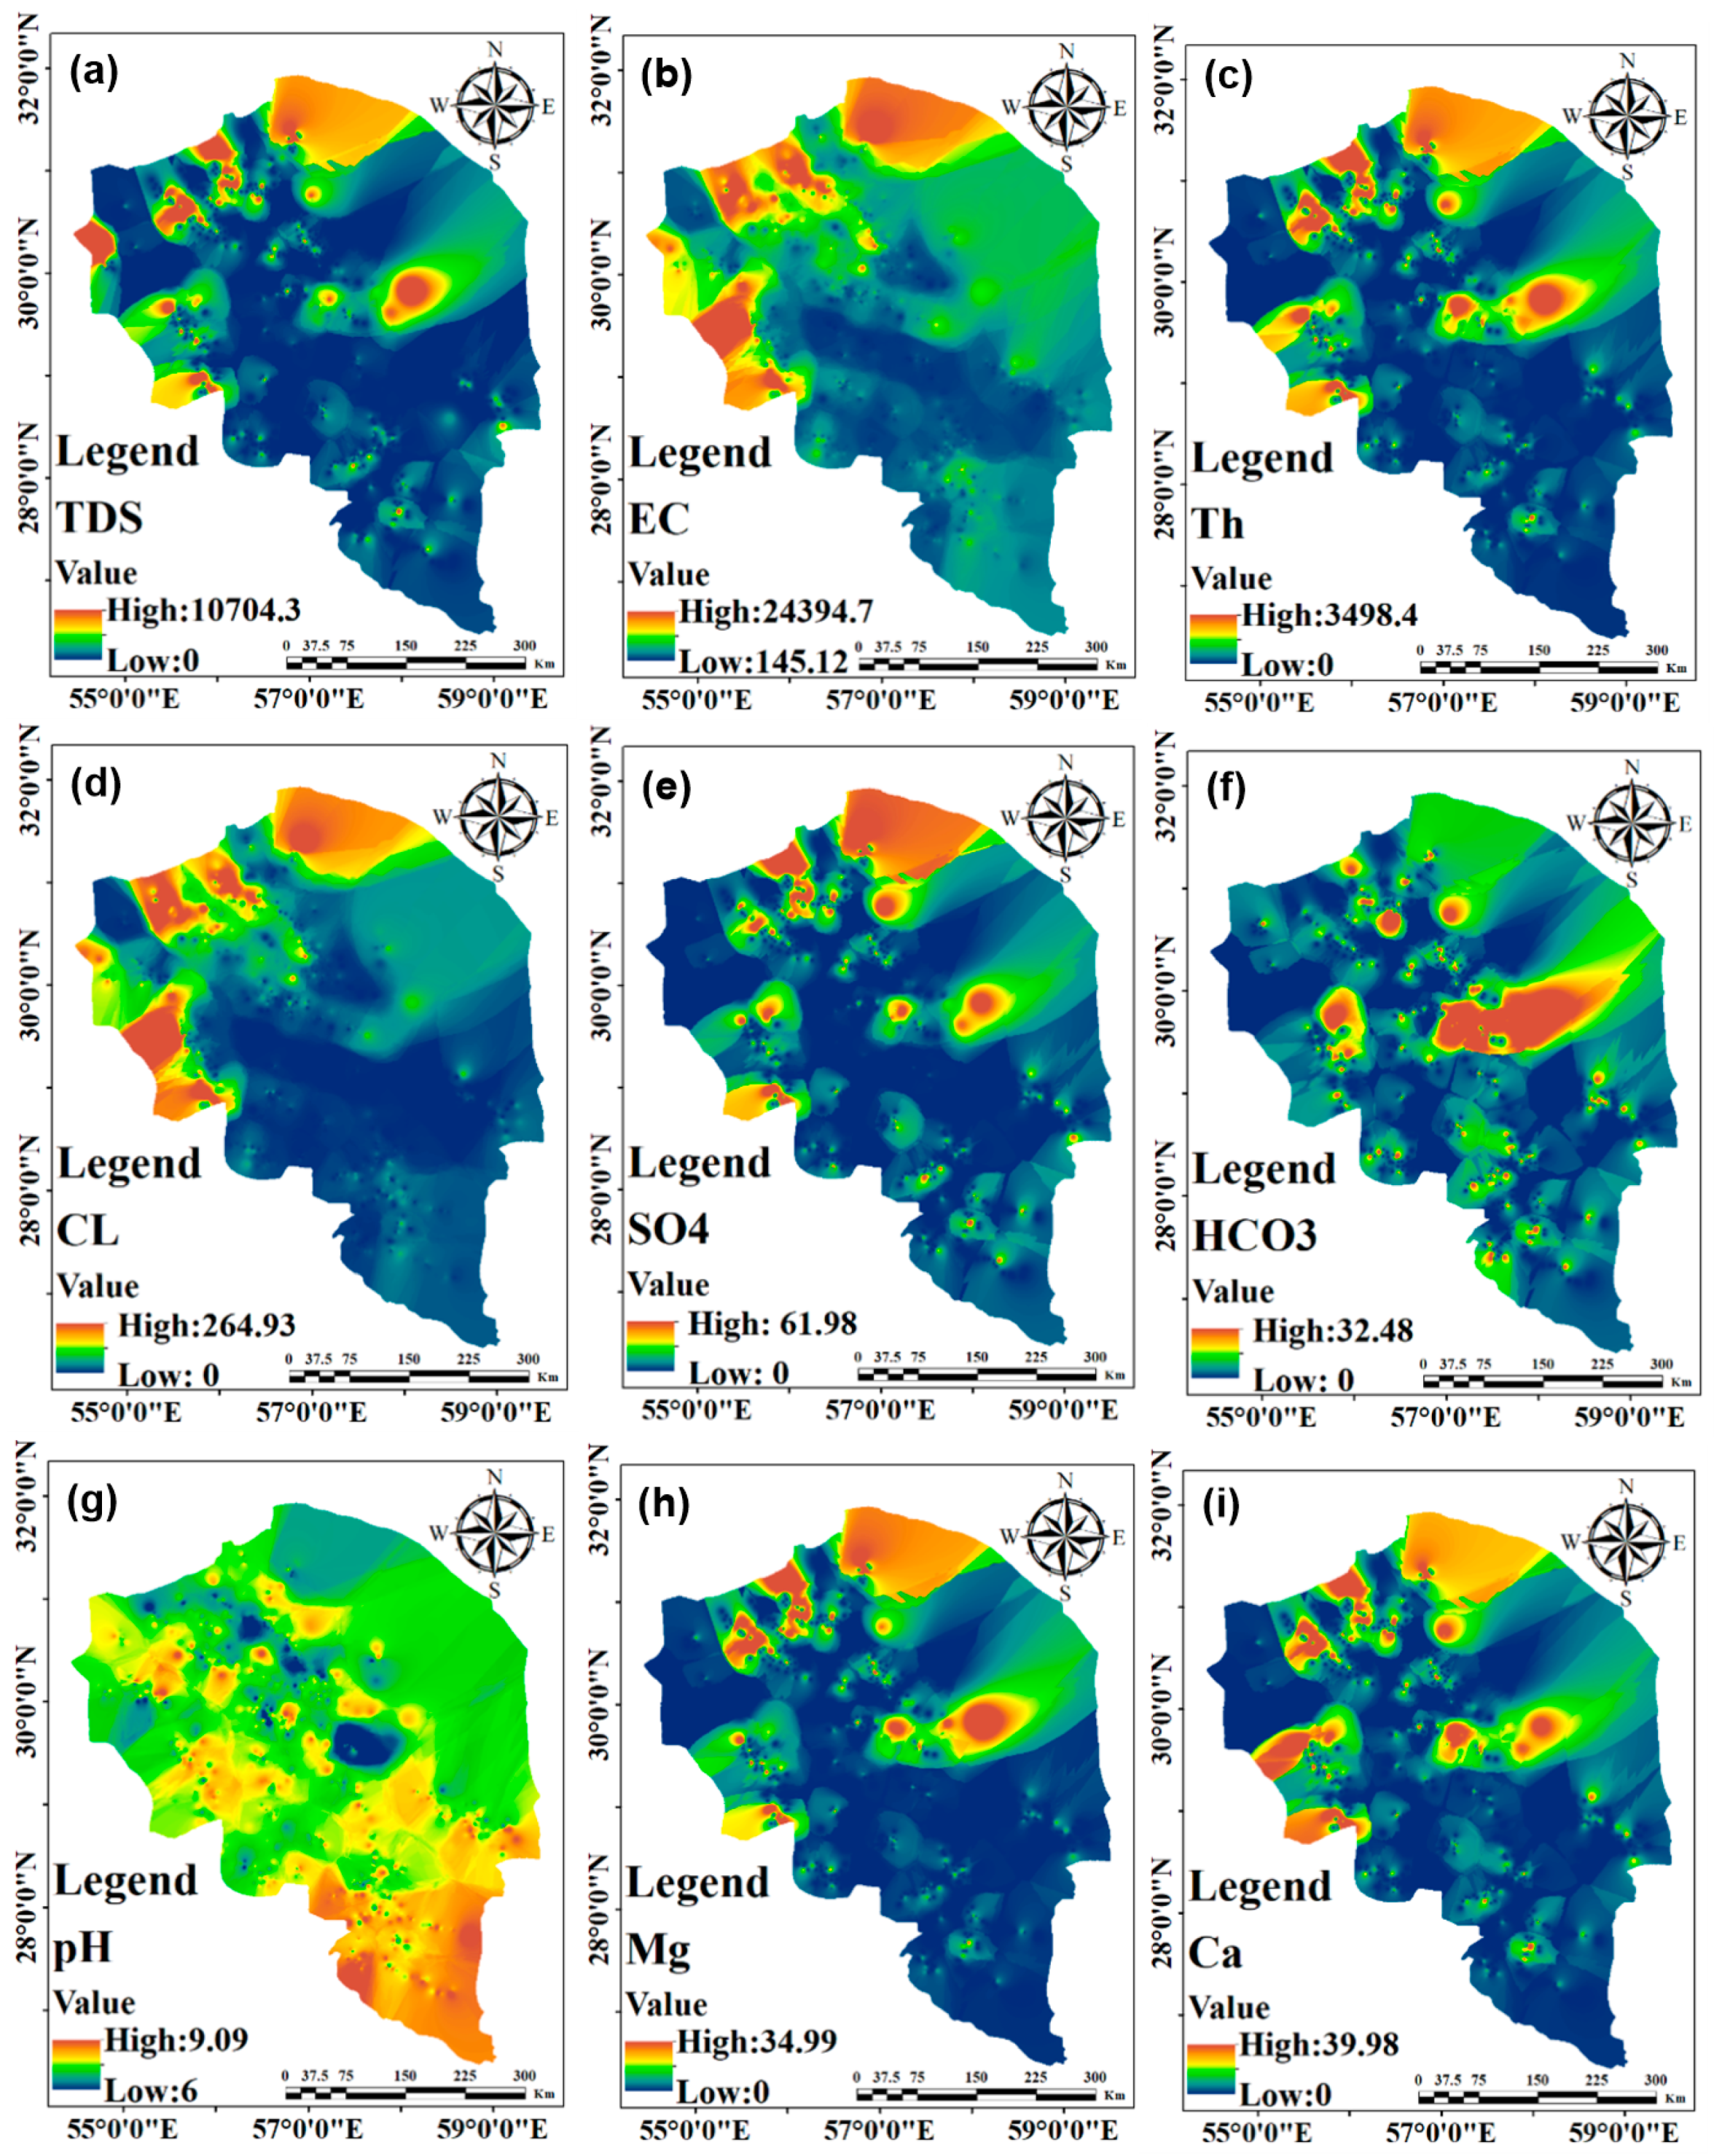
Disclaimer/Publisher’s Note: The statements, opinions and data contained in all publications are solely those of the individual author(s) and contributor(s) and not of MDPI and/or the editor(s). MDPI and/or the editor(s) disclaim responsibility for any injury to people or property resulting from any ideas, methods, instructions or products referred to in the content. |
© 2024 by the authors. Licensee MDPI, Basel, Switzerland. This article is an open access article distributed under the terms and conditions of the Creative Commons Attribution (CC BY) license (https://creativecommons.org/licenses/by/4.0/).