Abstract
This study investigated the effect of light intensity on the growth and nutrient uptake of Chlorella sorokiniana cultivated in nitrogen-rich anaerobic digestion wastewater. Three light intensities (20, 68, and 162 µmol m⁻2 s⁻1) were applied over a 30-day period with a 16:8 h light–dark photoperiod. The goal was to understand how light affects biomass productivity, nutrient assimilation, and biochemical composition under varying nitrogen concentrations originating from biogas plant digestate, up to 5 g L⁻1. The results showed that higher light intensities significantly boosted biomass production, achieving a five-fold increase at 162 µmol m⁻2 s⁻1 compared to 20 µmol m⁻2 s⁻1. Nutrient uptake followed a similar pattern, with 94% of ammonium nitrogen removed in 7 days under high light, compared to 55% after 30 days under low light. Phosphorus content was also completely removed after 7 days under light intensities of 68 and 162 µmol m⁻2 s⁻1. Additionally, elevated light intensity led to increased lipid accumulation (from 29.7% to 34%) and reduced protein content (from 30.9% to 26.1%), with carbohydrate content not being affected by light intensity. These findings highlight light intensity as a critical factor for optimizing microalgae cultivation in nitrogen-rich biogas digestate, promoting both effective nutrient removal and biomass production for potential bioenergy applications.
1. Introduction
Microalgae represent an untapped natural resource with over 25,000 species, of which only 15 are currently used in various commercial applications [1]. They are microscopic organisms found in both seawater and freshwater, classified as either eukaryotic or prokaryotic microorganisms [2]. Different microalgal species have distinct characteristics and are cultivated under a wide range of environmental factors [3], exhibiting the ability to adapt to particularly harsh conditions [4]. Microalgae can utilize one or more of three metabolic growth modes—photoautotrophy, heterotrophy, and mixotrophy—depending on the availability of light and carbon sources. In each metabolic growth pathway, microalgae can accumulate large amounts of nutrients assimilated from the growth medium [2], producing a wide variety of different products [5], with lipids, carbohydrates, and proteins as the main components [6]. Microalgae are referred to as the green gold of nature [7], as they can provide significant amounts of high-value compounds [8,9]. Depending on the species, available nutrients, and growth conditions, they can produce different types of bioactive molecules with various properties, including compounds with antioxidant, anti-inflammatory, antimicrobial, antiviral, anticancer, and antiallergic properties [4]. Furthermore, microalgae are gaining interest as a feedstock for biodiesel production, as several species combine high biomass productivity and the ability to accumulate large amounts of lipids [10].
Despite their simplicity and wide distribution, microalgae require favorable conditions to grow and produce the desired compounds. Specific ecological factors such as temperature, carbon dioxide (CO2), dissolved oxygen concentration, light intensity, pH, salinity, and the availability of nutrients might become limiting factors affecting growth rates and the chemical composition of their biomass [6,11,12]. Light is the primary source of energy for these photosynthetic microorganisms and is the most important environmental factor influencing photosynthesis, microalgal cell growth, and metabolic activity [6,10]. Even under adverse conditions such as nutrient deprivation, microalgae are still capable of photosynthesizing and accumulating triacylglycerols as a survival strategy to withstand extreme environments [13].
The importance of light for microalgae growth is reflected in two key parameters: intensity and wavelength of light [14]. In terms of wavelength, only photosynthetically active radiation (400 to 700 nm) is used by microalgae for photosynthesis, regardless of the light source [6]. On the other hand, the optimal light intensity (LI) required for optimal growth and composition varies between species [3]. Insufficient light availability limits microalgal growth [15], while excessive light, beyond saturation levels, may lead to photoinhibition, reducing biomass productivity [6,10,16]. Ghosh et al. [17] noted that natural sunlight often exceeds the optimal light intensity. For many microalgae species, photosynthesis saturates at irradiances between 100 and 500 µmol m⁻2 s⁻1, though the highest biomass productivity is typically achieved at steady irradiance levels ranging from 50 to 100 µmol m⁻2 s⁻1 [6]. In previous studies, Chlorellaceae species showed optimal growth at a high LI (400 μmol photons) [3], but for Chlorella vulgaris, Daliry et al. [14] reported a decline in biomass productivity when LI increased from low (5000 lx) to high (7000 lx). However, Metsoviti et al. [18] observed a different trend, where increasing LI from 70 to 140 µmol m⁻2 s⁻1 led to a simultaneous increase in growth rate for the same species. Higher optimal Lis, ranging between 150 and 300 µmol m−2 s−1, have been reported for Desmodesmus sp. and Scenedesmus obliquus [19]. Ghosh et al. [17] studied the effect of LIs of 135, 162, and 189 µmol m−2 s−1 on C. sorokiniana, finding that LI increasing above 135 µmol m−2 s−1 decreased growth rates, with the lowest biomass productivity observed at 189 µmol m−2 s−1. A similar study showed optimum growth at 104 µmol m⁻2 s⁻1, with higher intensities leading to reduced productivity [20]. These varying results suggest that light intensity has different effects on microalgal species, making it essential to determine optimal light parameters under well-defined conditions for each species and nutrient type [10].
In addition to growth, light intensity also affects the chemical composition of microalgae [6,19,21,22]. However, there is no consensus on the effect of light on lipid and macronutrient content [16]. Increased LI may promote lipid production in some, have no effect in others, or even reduce lipid content in certain cases [6]. Each microalgal species responds differently to varying LIs [10,21]. Binnal and Badu [16] concluded that the impact of LI on the lipid content of microalgae depends on the species’ ability to capture carbon under high LI [16]. Under adverse conditions like high LI, some species change their metabolism by accumulating excess energy into energy-rich products such as lipids or carbohydrates [10]. The initial hypothesis was that lipid and carbohydrate pathways compete for a common carbon precursor, suggesting that inhibiting starch synthesis could increase lipid production [19]. However, recent results showed that a higher lipid content is associated with a lower protein content in biomass [6], suggesting that lipid synthesis may rely on protein degradation or inhibited protein synthesis [19]. Therefore, this study aimed to investigate the effect of light intensity on the production of all three macronutrients from C. sorokiniana biomass, a topic that has been underexplored in the literature.
The mixotrophic mode of cultivation, combining inorganic and organic carbon sources, has been shown to maximize species productivity. Common mixotrophic culture modes include the use of acetic acid, glycerol, and glucose as organic carbon sources, while inorganic nitrogen sources include urea and ammonium chloride. To reduce production costs, alternative nutrient media, such as nitrogen-rich wastewater, are being explored [17]. Anaerobic digestion effluents (ADEs), characterized by high ammonia nitrogen contents, require further treatment before discharge to prevent water pollution of receivers. Conventional nitrification–denitrification processes are efficient for ammonia nitrogen removal but are energy-intensive, requiring aeration and external organic carbon sources. Microalgal culture offers a cost-effective alternative for ammonia nitrogen removal [23]. The cultivation of microalgae in wastewater may bring additional benefits: the needs of microalgae for carbon and other minerals can be satisfied by the effluents’ nutrients [6,24,25,26], reducing simultaneously the concentration of organic and inorganic compounds in wastewater [6,24,26]. Therefore, utilization of microalgae in wastewater treatment has become an environmentally friendly decontamination process [1]. C sorokiniana is a particularly attractive strain, as it can grow in the alkaline conditions and high N-NH4 concentrations of the digestate [27] with a high growth rate [28]. However, effluents may contain various compounds that could affect microalgal growth patterns and composition, making it challenging to predict the effect of light intensity on the species.
To optimize microalgae production, it is important to thoroughly study the effect of light intensity on the chemical composition of biomass, as little is known about how light intensity influences the biochemical composition of microalgae beyond its impact on lipid production [19]. The aim of this work was to examine the effect of light intensity on the growth rate and macronutrient composition of C. sorokiniana biomass, using anaerobic digestion effluent as a nutrient source. This study sought to determine C. sorokiniana production rates under different light intensities, investigate nutrient assimilation rates, and assess how light intensity affects protein, lipid, and carbohydrate concentrations in the biomass. This comprehensive approach is necessary, as the simultaneous study of all macronutrients has been underexplored in the literature.
2. Materials and Methods
2.1. Algae Strains’ Cultivation
The green microalga C. sorokiniana was obtained from the algae culture of the International Hellenic University in Sindos, Greece, and had been isolated from anaerobic digestion effluent [29]. The cells were cultivated within 2 L Erlenmeyer flasks with a final liquid volume of 1.5 L, maintaining a constant incubation temperature (25 ± 1 °C). A nutrient substrate of BG-11 medium was used, containing (in g L−1): NaNO3 1.5, K2HPO4·3H2O 0.04, MgSO4·7H2O 0.075, CaCl2·2H2O 0.036, citric acid 0.006, ammonium ferric citrate 0.006, Na2EDTA 0.001, Na2CO3 0.02, and trace elements (in mg L−1): H3BO3 2.86, MnCl2 ·4H2O 1.81, ZnCl2 0.222, Na2MoO4·2H2O 0.391, CoCl·6H2O 0.05 and CuSO4·5H2O 0.079. All BG-11 nutrients and the Erlenmeyer flasks were sterilized at 121 °C for 20 min to prevent contamination. Ammonium ferric citrate and trace elements were sterilized using a filter (Whatman PTFE syringe filters (Whatman Inc., Piscataway, NJ, USA), pore size 0.2 m). Aeration of the Erlenmeyer flasks was performed using compressed air at a flow rate of 1 L per minute (LPM) with the air filtered using Whatman PTFE syringe filters (pore size 0.2 m) before being introduced into the culture. Lighting in the incubation room was uniform on both sides of the flasks, provided from LED lamps (6.000 K, 7.2 W m−1) that emitted cool white light at an intensity of 20 µmol m−2 s−1, with a light:dark cycle of 16:8 h, respectively, [3,14,29] a condition reported to lead to higher biomass productivity [14]. Light intensity was measured using a PAR Photon Flux Sensor (QSO-E, Apogee Instruments Inc., Logan, UT, USA) connected to a voltage meter (Model 177 True-RMS Digital Multimeter, Fluke, Everett, WA, USA). The mother cultures were re-cultivated every 15 days in new flasks by inoculating pre-cultures in BG-11 nutrient substrate at a volume ratio of approximately 1:10. Regular maintenance and re-culturing of the mother cultures at a specific frequency ensured that all main cultures were inoculated with cell populations in similar physiological and metabolic states.
2.2. Anaerobic Digestion Effluent Collection and Processing
The anaerobic digestion effluent (ADE) used in this study was collected from a 1 MWel biogas plant in Thessaloniki, Greece, which processes waste and residues from local animal husbandries. Chemical analysis of the anaerobic digestion effluent was conducted to assess its suitability for microalgae cultivation based on its nutrient content (Table 1). To remove suspended particles and reduce turbidity, the ADE was first centrifuged at 5000 rpm for 15 min followed by filtration of the supernatant (Whatman Inc., Clifton, NJ, USA, 150 mm, Grade 1, pore size 11 m). The filtrate was hyperfiltrated with a hydrophilic flat sheet A4 microfiltration membrane, with a 0.4 μm pore diameter, type H-203 (Kubota, Osaka, Japan) to remove viruses and pathogenic bacteria that may be present in the raw effluent and could negatively affect microalgal growth. Finally, the digestate stock sample was stored at −18 °C to prevent any changes in its composition.

Table 1.
Chemical composition of raw ADE.
2.3. Microalga Cultivation
The microalga was cultured in ADE after dilution with sterile water at a volume ratio of approximately 1:10, to reduce the high ammonia nitrogen concentration of the sample to one non-toxic for the cells [30,31]. Potassium dihygrogen phosphate (KH2PO4) was added, to produce a N:P ratio of about 10:1, representing an appropriate N:P ratio for microalgal growth [32,33]. The cultivation experiment was carried out in 2 L Erlenmeyer flasks. An inoculum (8% of seed flask culture) of exponentially growing cells was used for inoculation, with the final culture volume providing an initial optical density (OD600nm) of approximately 0.35. Each flask was supplied with 1 LPM of ambient air and 0.033 LPM of CO2 (99.99% purity), both passed through 0.2 µm Whatman PTFE syringe filters. Air and CO2 flow rates were adjusted using precision flowmeters (EK-2LR, Kytola Instruments, Lahti, Finland, and 3845G-HVR, Omega Engineering, Norwalk, CT, USA). The flasks were placed in a temperature-controlled room (25 ± 1 °C), under uniform illumination with cool white LED strips (6000 K, 7.2 W m−1) and a light: dark cycle of 16:8 h. Photosynthetic photon flux density (PPFD) was adjusted to 20, 68, and 162 µmol m−2 s−1 using an LED dimmer. Cultivation under each different light condition was performed in duplicate, with samples for analysis taken in triplicate from each treatment. Diluted substrate containing KH2PO4 at the predetermined N:P ratios was added each time the aqueous phase N-NH4 concentration reduced below 40 mg L−1, a threshold below which the ability of microalgae to effectively remove phosphorus from the effluent and accumulate it in microalgal biomass is significantly reduced [34].
2.4. Microalgae Pre-Treatment for Composition Analysis
Microalgal biomass samples obtained from cultivation flasks were centrifuged at 5000 rpm (Hermle Z326K, Hermle Labortechnik, Wehingen, Germany) for 10 min, and the supernatant liquid was decanted to concentrate the biomass. The raw microalgal biomass paste was frozen and introduced directly into a lyophilizer (GAMMA 1–20 LMC, Martin Christ GmbH, Osterode am Harz, Germany). Freeze-drying of cells was carried out at 0.010 bar and −78 °C for 48 h, and the dried biomass was then stored at −18 °C.
2.5. Analytical Measurements
2.5.1. Growth Determination and Nutrient Analysis
The growth of microalgal biomass was indirectly estimated by measuring the concentration of photosynthetic compounds in the suspension. To determine the wavelength with maximum absorption (λmax), a scan was performed in the range of 580 to 750 nm. It was observed that λmax varied depending on the growth stage, as confirmed in previous studies [35]. To ensure comparability, the optical density of the sample was measured at 600 nm, following the methods of Psachoulia et al. [29] and Kamyab et al. [36], using a UV-Vis spectrophotometer (DR 3900, HACH, Loveland, CO, USA). Additionally, the biomass concentration was measured directly as dry cell weight (DCW), by filtering 15 mL of culture sample through a pre-weighted glass microfiber filter (Whatman 934-AH, Piscataway, NJ, USA, pore size 1.2 m), which was then dried at 60 °C for 24 h and weighed using a high-precision micro-balance (XP 105, Mettler Toledo, Greifensee, Switzerland) [29,37]. The dry cell weight of biomass was calculated by Equation (1).
where DCW is the cell concentration, W1 is the weight of the dry cell and the dry hollow fiber membrane (g), W0 is the weight of the dry hollow fiber membrane (g), and V is the total volume of the hollow fiber membrane.
2.5.2. Nutrient Analysis
Concentrations of ammonium nitrogen (N-NH4), soluble phosphorus (P-PO4), and chemical oxygen demand (COD) were determined in the liquid phase of filtrate samples using standard HACH cuvette tests in a UV-Vis spectrophotometer (DR 3900, HACH, Loveland, CO, USA).
2.5.3. Lipid Determination
Approximately 0.2 g of lyophilized microalgal biomass was used for the lipid extraction process following the extraction protocol of Bligh and Dyer [38]. Briefly, 2 mL of methanol, 1 mL of chloroform, and 0.8 mL distilled water (2:1:0.8 v:v) were added in the dried biomass sample, and the mixture was subjected to sonication at a constant frequency of 20 kHz and the power density of 400 W L−1 (Sonopuls UW 3400, Bandelin, Berlin, Germany) for 30 min. Subsequently, the solution was centrifuged at 5000 rpm for 10 min and the solvent was collected. The procedure was repeated two more times to ensure complete lipid extraction [29,39]. Volumes of 3 mL of chloroform and 3 mL of distilled water (2.2:1.8 v:v) were added to the recovered solvent, followed by centrifugation under the same conditions to ensure the formation of two phases. After complete separation of the two phases, the upper phase was removed and the lower phase containing the extracted lipids was collected. This phase was dried overnight at 60 °C and weighed on a high-precision micro-balance (XP 105, Mettler Toledo, Greifensee, Switzerland).
2.5.4. Protein Determination
Proteins were extracted from approximately 0.2 g of lyophilized microalgal biomass, after being re-dispersed in 100 mL distilled water. Cell disruption was performed by sonication at a constant frequency of 20 kHz and the power density of 400W L−1 for 30 min followed by centrifugation at 10,000 rpm for 10 min at room temperature, and the supernatant was analyzed for its protein content using the Lowry method [40]. Specifically, 5 mL of Lowry’s modified reagent was added to 1 mL of sample, and the mixture was stirred and incubated for 10 min. After incubation, 0.5 mL of Folin–Ciocalteu reagent (1N) was added, followed by immediate stirring and incubation for 30 min. The blue color solution formed was measured at 750 nm using a UV-Vis spectrophotometer (DR 3900, HACH, Loveland, CO, USA). A calibration curve was prepared using standard bovine albumin aqueous solution, in a concentration range from 0 to 1500 μg mL−1.
2.5.5. Carbohydrate Determination
Samples obtained after centrifugation of dried biomass–water mixtures, obtained using the method applied for protein determination, were also used for the analysis of carbohydrates by the phenol-sulfate method. Specifically, the content of neutral monomers was quantified as glucose equivalents by the treatment of the unknown samples with 1 mL of 1% (w:v) phenol solution and 5 mL of 96% (w:w) H2SO4 and measurement of the absorbance at 483 nm with a UV-Vis spectrophotometer [41]. D-glucose solutions of known concentrations were used as reference standards for the development of the glucose concentration–absorbance calibration curve.
2.5.6. Statistical Analysis
All measurements were carried out in triplicate from each treatment, and the data were expressed as the mean value ± standard deviation (SD). The results were analyzed using a computer program Minitab (Minitab LLC 21.4.2, State College, PA, USA). Analysis of variance (ANOVA) with Tukey’s post hoc HSD was performed at a statistical significance of p ≤ 0.05.
3. Results
3.1. Effect of Light Intensity on Chlorella sorokiniana Growth
Light is the primary energy source for photosynthetic organisms and a crucial environmental factor that directly affects the photosynthetic rate, microalgal cell growth, and their biochemical composition. [6,10,22]. As such, optimizing light is essential for maximizing biomass productivity [6]. However, the optimal light requirements vary depending on the microalgae species [21], and several additional parameters, such as temperature or nutrient supply type, should be considered simultaneously when selecting the appropriate light intensity [3,6]. Studies have examined a broad range of light intensities, from 300 to 250,000 lx, to understand the corresponding growth patterns of various species [42]. It has been observed that excess light beyond a certain saturation point can disrupt the photosynthetic process due to photoinhibition, reducing biomass production [6,10,16].
In this study, three light intensities were applied in a 30-day experiment to simulate various real-world light conditions and assess their effect on the growth rate of C. sorokiniana. The range of LI was from 20 to 162 µmol m−2 s−1, which falls within the commonly reported values for Chlorella in the international literature [3,11]. This range also includes LI values that have been found by other researchers to induce photoinhibition [20]. The lowest PPFD value, 20 µmol m−2 s−1, corresponds to light typically experienced on a cloudy day, while higher values, 68 and 162 µmol m−2 s−1, represent light intensities characteristic of typical daylight.
Under these conditions, the growth of C. sorokiniana cells is presented in Figure 1a,b as a function of OD600 and DCW, respectively. Biomass concentration increased almost linearly with light intensity. By the 30th day of cultivation, the highest biomass content was measured at the highest PPFD of 162 µmol m−2 s−1, with OD600 reaching 11.7 and DCW at 3.5 g L−1. For the culture exposed to 68 µmol m−2 s−1, biomass content was about 25% lower (OD600 = 9.5, DCW = 2.9 g L−1). At the lowest light intensity, biomass content was significantly lower (OD600 = 2.31, DCW = 0.7 g L−1), corresponding to about a five times lower concentration compared to the optimal condition. Despite these differences, the biomass growth rate followed a similar pattern: the average biomass productivity levels per day were 23, 94, and 123 mg L−1 d−1, at low, medium, and high light intensities, respectively. A near constant growth rate was observed after the second day of cultivation for all cases.
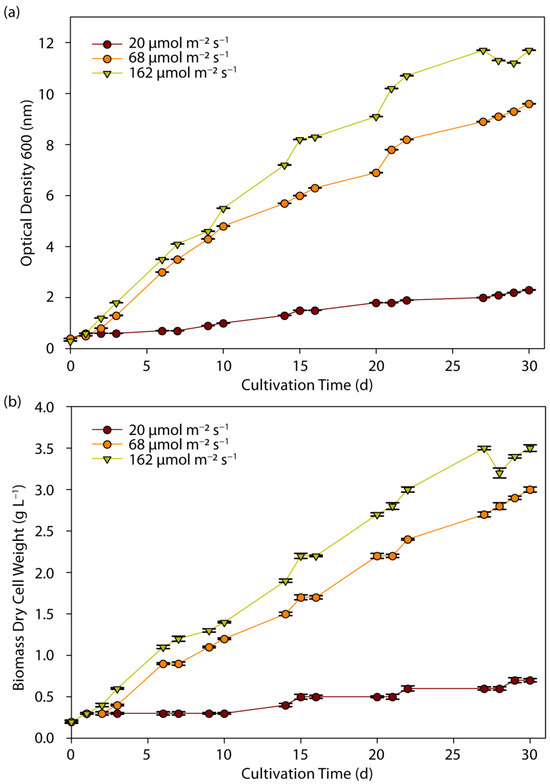
Figure 1.
Effect of light intensity on growth, measured by (a) optical density (OD600 nm) and (b) dry cell weight (DCW) of C. sorokiniana as a function of cultivation time.
In similar studies, C. sorokiniana exhibited a higher growth rate at an LI of 65 µmol m−2 s−1, which were 1.5 and 3 times higher than at LIs of 39 µmol m−2 s−1 and 13 µmol m−2 s−1, while no photoinhibition effects were observed in the LI range [39,43]. During the examination of C. sorokiniana growth in a wide LI range, from 30 to 200 µmol m−2 s−1, Gao et al. found that the optimum value for the achievement of high biomass productivity was 100 µmol m−2 s−1, representing a saturation point, above which excess light resulted in a decrease in biomass productivity [20]. Moreover, an increase in LI to 200 µmol m−2 s−1 resulted in a decrease in biomass productivity below the level achieved by an LI equal to 30 µmol m−2 s−1 [20]. In a similar range of LI, from 80 to 190 µmol m−2 s−1, productivity of microalgal biomass presented a peak at 135 µmol m−2 s−1, with a reduction in biomass production occurring above this level [17]. However, Yun et al. (2020) showed that C. sorokiniana KNUA114 and KNUA122 have a wide range of tolerance throughout the tested light intensity, with an absence of photoinhibition even at a LI of around 600 µmol m−2 s−1 [3]. Chlorella protothecoides showed a similar behavior to C. sorokiniana, with an increase in LI leading to more than double the biomass content [16]. The increase in light intensity from 50 to 150 µmol m−2 s−1 had beneficial effects on the biomass productivity of microalgae species C. vulgaris, Ettlia pseudoalveolaris, Desmodesmus sp. as well as S. obliquus, although a similar significant increase was not observed in C. vulgaris and S. obliquus cultures in the LI range of 150 to 300 µmol m−2 s−1 [19].
3.2. Effect of Light Intensity in the Macronutrient Concentration of Biomass
Microalgae cultivated under different light conditions exhibit significant changes in their chemical composition [20,21,22]. Lipids, the main macronutrient, show substantial concentration variations in response to environmental conditions. Additionally, microalgae also contain carbohydrates and proteins, and changes in one of these macronutrients are often associated with alterations in the others [19]. Current results show that under increasing light intensity, lipid accumulation in biomass intensifies [10,16]; it seems that in their effort to survive under the adverse conditions of high light intensity, cells change their metabolism, accumulating excess energy in energy-rich products such as fatty acids [6,10]. However, a clear consensus has not been achieved on the effect of irradiation to lipid formation, and light may have different effects in microalgal species [16]. In recent studies, a high light intensity reduced lipid contents in several microalgae, including marine strains of Chlorella, despite a biomass increase, possibly due to the utilization of excess light for cell division rather than being stored as lipids [19].
As cultivation progresses, the composition of certain macronutrients in the biomass changes [44]. To monitor these variations, macronutrient levels were measured on all days except the first, last, and fifteenth days of cultivation. The composition of C sorokiniana cells in different macronutrient fractions, under various light intensities, is presented in Table 2 as a function of cultivation time. The lipid content of inoculated biomass at the start of the experiment was 29.7%, and it increased after 30 days to about 33% and 34% at a PPFDs of 68 and 162 µmol m−2 s−1, respectively, while a slight decrease was observed at the low light irradiation of 28% approximately.
Table 2.
Effect of light intensity on macronutrient content of C. sorokiniana culture as a function of cultivation time, under three photosynthetic photon flux density (PPFD) conditions: (22, 68 and 162 µmol m−2 s−1).
Lipids content changes were followed by a corresponding change in protein content in a reverse order: in the high PPFD conditions, proteins decreased from 30.9% to 27.3% and 26.1%, respectively, while at a low PPFD, proteins increased to 33.9%. Nevertheless, the carbohydrate content remained almost constant over time, varying from 27 to 29% during the whole cultivation run. Similar results were observed for Desmodesmus sp. and S. obliquus, with an increase in lipid content and a corresponding reduction in proteins, while the carbohydrate content was almost stable [19]. These results can be attributed to microalgal lipid synthesis mainly based on protein degradation or inhibition of protein synthesis [6]. Moreover, the increase in lipid content without a concomitant increase in carbohydrate content suggests that these macronutrients are probably competing for a common carbon precursor, precluding starch synthesis for lipid production [19]. A similar increase in lipid permeability has been reported by switching light intensity from low to high values for several species such as Mychonastes homosphaera, Raphidocelis subcapitata, Scenedesmus sp. [21], Botryococcus braunii, E. pseudoalveolaris, Desmodesmus sp. [10], S. obliquus [22], and C. vulgaris [45]. Nevertheless, inconsistent results have been reported for C sorokiniana since low light levels may lead to lipid accumulation, while by increasing light irradiation, a significant decrease has been observed in lipid content [39]. However, in another study, at a wide range of LI, from 30 to 200 µmol m−2 s−1, the lipid content presented a statistically significant increase from 25.10% to 29.04% [20].
3.3. Effect of Light Intensity on the Nutrients’ Removal
Microalgae have shown a high potential for bioremediation of effluents, making microalgae cultivation in wastewater a promising alternative for energy conservation, environmental sustainability, and carbon neutrality as well as resource recovery [1]. High removal rates of phosphorus and nitrogen can be achieved in a microalgae wastewater treatment, reaching up to 75% efficiency [7,46,47]. Microalgae show a considerable preference for ammonium nitrogen assimilation, as less energy is required for its uptake [48]. Other nitrogen sources are converted to ammonium inside the cells before being assimilated into biomass, requiring additional energy [20].
The reduction in N-NH4 content from ADE through binding by C. sorokiniana cells is shown in Figure 2 as a function of cultivation time, under the three conditions of PPFD. Cultivation took place using a certain volume of diluted digestate. As soon as the N-NH4 content in the aqueous phase was reduced below a certain concentration, the addition of new substrate volume took place to reach initial nitrogen concentrations, aiming to extend the cultivation time and receive reliable results. The correlation of N-NH4 concentration with time was significantly affected by light intensity. At the low PPFD, a continuous reduction in N-NH4 concentration was measured. However, it was never reached below the lowest N-NH4 concentration value that it was set as a limit for a new substrate addition, and the final N-NH4 concentration was measured at 33.9 mg L−1 after 30 days. At the higher PPFD, however, N-NH4 assimilation was high, resulting in nitrogen depletion after almost 7 days of cultivation: N-NH4 reached about 4.6 mg L−1 after one week, corresponding to a 94.2% reduction, while similar results were observed at the medium light intensity, resulting in an N-NH4 reduction of about 77.1%. A similar pattern was revealed after the addition of new substrate volume, and after 8 days of cultivation, the N-NH4 content reduced by 49.7 and 91.9% at a PPFD of 68 and 162 µmol m−2 s−1, respectively. The same trend was observed as well in the third recharge period, resulting in a final aqueous phase with 38.9 and 6.34 mg L−1 N-NH4 contents at PPFDs of 68 and 162 µmol m−2 s−1, respectively. Similar results were calculated by using the ammonia nitrogen removal rate, estimated from the slope of the corresponding curves: the averages for ammonia nitrogen removal were equal to 2.1, 5.6, and 8.5 mg L−1 d−1, at low, medium, and high light intensities, respectively.
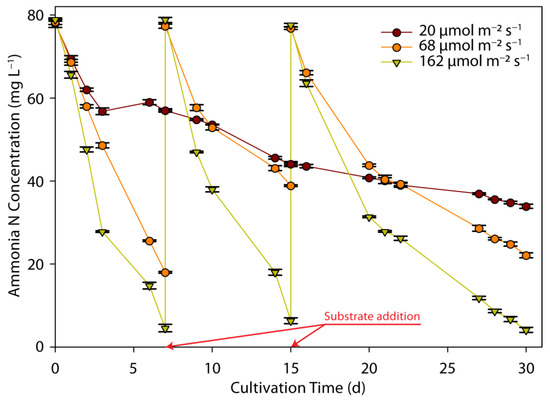
Figure 2.
Effect of light intensity on ammonia nitrogen removal by C. sorokiniana as a function of cultivation time and light intensity.
The importance of LI for nitrogen uptake has been justified by several studies. The cultivation of C. sorokiniana was examined using agricultural wastewater, and the effect of LI and the photoperiod were studied on N-NH4 and P-PO4 removal rates, showing that only light intensity had a significant effect [49]. Specifically, a low removal rate of 77% was measured at an LI of 60 µmol m−2 s−1, which was significantly lower than the complete removal achieved at an LI of 200 µmol m−2 s−1 [49]. In another study investigating a wide range of LIs (30 to 200 µmol m−2 s−1) and the relationship with N-NH4 assimilation, it was found that although there was higher N-NH4 and total nitrogen removal at certain high LIs, the difference did not appear to be statistically significant [20]. Unexpectedly, a threshold was observed, and above it, the rates of N-NH4 and total nitrogen fixation were decreased [20].
The reduction in P-PO4 from ADE is shown in Figure 3 as a function of time. Efficient P-PO4 removal was observed at medium and high PPFDs (68 and 162 µmol m−2 s−1), following a similar profile, indicating that phosphorous assimilation was not really affected by light irradiation. The phosphorous content was completely removed after 7 days of cultivation, and a similar trend observed after the addition of new substrate- KH2PO4, in the following periods. However, phosphorous reduction followed a different pattern at the low PPFD, corresponding to about 34.9% removal over the entire cultivation period of 30 days, resulting in an effluent with 3.13 mg L−1 phosphorous. The average phosphorus removal rates were estimated as 0.3, 0.9, and 1.1 mg L−1 d−1, at low, medium, and high light intensities, respectively. It must be underlined that the highest rates of phosphorus assimilation, via active transport, were observed during periods of phosphorus abundance. This is a known phenomenon, phosphorous luxury uptake, i.e., the uptake and storage of phosphorus at levels higher than those required for cell growth; it represents a specific condition stimulated at phosphorus concentrations above 5 mg L−1, where excess phosphorous is adsorbed and stored by the cells for subsequent use when the external concentration of phosphorus is becoming limited for their growth [6,34].
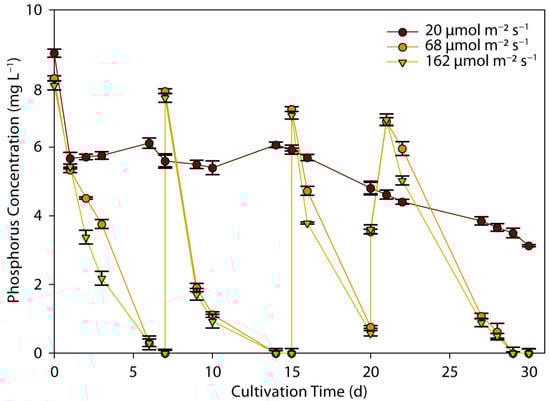
Figure 3.
Effect of light intensity on phosphorus removal by C. sorokiniana as a function of cultivation time and light intensity.
A similar trend as a function of light intensity was observed for COD (chemical oxygen demand). Effective COD removal was noted at medium and high PPFD levels (68 and 162 μmol m⁻2 s⁻1), following almost identical profiles, indicating that phosphorus assimilation was not significantly affected by light intensity. After 7 days of cultivation, 73%, 71%, and 54% of COD were removed at PPFD levels of 162, 68, and 20 μmol m⁻2 s⁻1, respectively. A similar trend was observed after the addition of a new substrate (KH2PO4) in subsequent periods, with COD removal reaching 92%, 90%, and 77% by the end of the experiment at PPFD levels of 162, 68, and 20 μmol m⁻2 s⁻1, respectively.
Light intensity has been proven to be an important factor in phosphorus uptake in other studies. An increase in phosphorus removal from 23% to 100% was observed as LI was increased from 60 µmol m−2 s−1 to 200 µmol m−2 s−1 [49]. Similar results were obtained in a study investigating the relationship between light intensity and P-PO4 assimilation over a wide range of LIs, and it was concluded that light is beneficial for phosphorous assimilation by microalgal biomass, improving the culture growth efficiency of C. sorokiniana [20]. A similar relationship between LI and phosphorous assimilation was found for C. vulgaris, Desmodesmus sp., and S. obliquus, showing a higher rate of assimilation by increasing LIs from 50 to 150 µmol m−2 s−1, although a similar observation was not made for E. pseudoalveolaris [19].
Phosphorus uptake is an energy-intensive process, and microalgae receive the required energy from the light source; therefore, a higher phosphorous uptake rate is expected at increased LI conditions [34]. Nevertheless, since higher LI favor biomass growth, rapid phosphorus accumulation is simultaneously associated with increased consumption by the biomass. At a low LI, phosphorous accumulation is still low, but biomass growth is even lower than at a high LI and, therefore, it is expected that cells retain more phosphorus at a low LI [50].
The assimilation rate of N-NH4 and P-PO4 per biomass weight in mg of nutrients per g of cells as a function of time is presented in Figure 4. As can be observed in Figure 1, light intensity affects biomass growth, and therefore, a more consistent conclusion can be obtained by considering the corresponding biomass concentration in nutrients’ assimilation rate [48]. Increased assimilation rates of N-NH4 and P-PO4 were observed in the first days of experiments, due to an excess nutrient substrate content and low biomass content. However, upon a biomass increase, a large number of cells were produced and the assimilation rate per weight unit decreased significantly with time, demonstrating that the relationship between light intensity and nutrient assimilation was mainly attributed to the effect of light on biomass productivity rather than to a change in the cell metabolism. A similar conclusion was reached by Delgadillo-Mirquez et al., who reported that the effect of microalgae on nutrient assimilation was primarily related to biomass productivity rather than to light availability [48]. Nevertheless, as shown in Figure 4, nutrient assimilation per dry biomass weight followed a similar trend for all lighting conditions, revealing, therefore, that light intensity did not significantly change the pathway of nutrients that were bonded by cells.
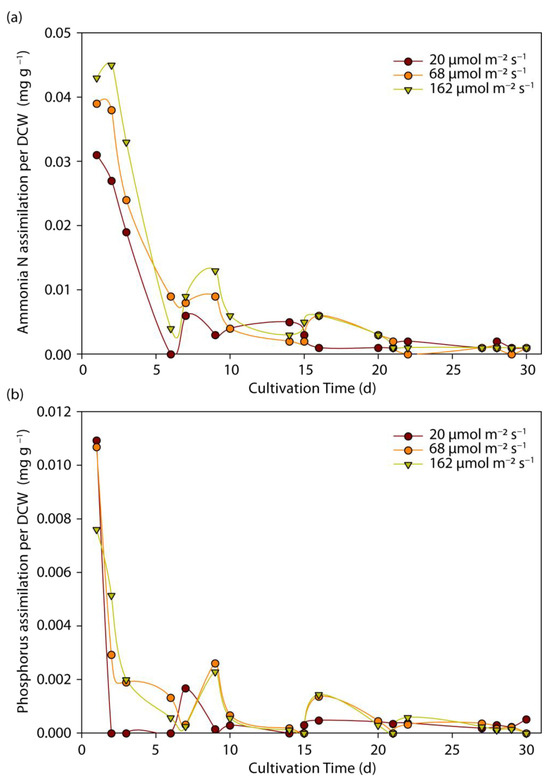
Figure 4.
Effect of light intensity on (a) N-NH4; and (b) P-PO4 removal per dry cell weight (DCW) biomass as a function of cultivation time and light intensity.
4. Conclusions
The primary aim of this study was to examine the effect of light intensity on C. sorokiniana, cultivated in a biogas plant effluent, as an effort to identify the optimum conditions for high biomass growth, maximum nutrient removal from the aqueous phase, and production of cells with a specified composition. The key conclusions drawn from the results were the following: (1) The optimal PPFD for high growth and production of C. sorokiniana biomass was 162 µmol m−2 s−1, followed by 68 µmol m−2 s−1. Insufficient light was found to limit microalgal growth, but no photoinhibition was observed under the high light intensity tested, which could have reduced the growth rate. (2) The chemical composition of C. sorokiniana biomass changed with varying light conditions. Specifically, a higher light intensity led to an increased lipid content and decreased protein content, while a low light intensity resulted in a higher protein and lower lipid content. Carbohydrate concentration changes were not considered significant. The effect on carbohydrate concentration was not considered significant. (3) Light intensity affected the rate of nutrient assimilation of anaerobic digestion effluent (ADE). More efficient ammonium nitrogen removal was observed at higher light intensities, with a direct relationship between removal rate and light intensity. Similarly, the removal of phosphorous was more efficient at higher light intensities, without a difference between the two high intensity levels. (4) The effect of light intensity on the assimilation of ADE nutrients was due to the relationship between light conditions and biomass productivity. These findings support the potential for enhanced biomass production in large-scale microalgal cultures using ADE with an appropriate chemical composition as the nutrient substrate.
Author Contributions
Conceptualization, P.S.; methodology, T.L.P. and P.S.; validation, S.D.K.; formal analysis, S.D.K.; investigation, T.L.P.; resources, P.S.; data curation, T.L.P. and C.M.; writing—original draft preparation, T.L.P. and C.M.; writing—review and editing, T.L.P., S.D.K. and P.S.; visualization, S.D.K. and P.S.; supervision, P.S.; project administration, P.S.; funding acquisition, P.S. All authors have read and agreed to the published version of the manuscript.
Funding
This research was mainly funded by the European Union’s Horizon under “Accelerating the sustainable production of advanced biofuels and RFNBOs-from feedstock to end-use” project (Project Code 81053), which is funded by the European Climate Infrastructure and Environment Executive Agency (CINEA) under the program number 101118286 and the project acronym FUELPHORIA of the HORIZON-CL5-2022-D3-02 project, funded by the European Union. The views and opinions expressed are, however, those of the authors only and do not necessarily reflect those of the European Union or CINEA. Neither the European Union nor CINEA can be held responsible for them.
Data Availability Statement
Data available on request due to restrictions of privacy.
Conflicts of Interest
The authors declare no conflicts of interest.
References
- Martinez-Porchas, M.; Martinez-Cordova, L.R.; Lopez-Elias, J.A.; Porchas-Cornejo, M.A. Bioremediation of aquaculture effluents. In Microbial Biodegradation and Bioremediation: Techniques and Case Studies for Environmental Pollution, 2nd ed.; Das, S., Dash, H.R., Eds.; Elsevier: Amsterdam, The Netherlands, 2021; pp. 539–553. [Google Scholar]
- Vale, A.M.; Ferreira, A.; Pires, C.M.J.; Goncalves, L.A. CO2 Capture Using Microalge. In Advances in Carbon Capture: Methods, Technology and Applications; Rahimpour, M.R., Farsi, M., Makarem, M.A., Eds.; Woodhead Publishing: Cambridge, UK, 2020; pp. 308–405. [Google Scholar]
- Yun, H.S.; Kim, Y.S.; Yoon, H.S. Characterization of Chlorella sorokiniana and Chlorella vulgaris fatty acid components under a wide range of light intensity and growth temperature for their use as biological resources. Heliyon 2020, 6, e04447. [Google Scholar] [CrossRef] [PubMed]
- Khavari, F.; Saidijam, M.; Taheri, M.; Nouri, F. Microalgae: Therapeutic potentials and applications. Mol. Biol. Rep. 2021, 48, 4757–4765. [Google Scholar] [CrossRef] [PubMed]
- Sun, X.M.; Ren, L.J.; Zhao, Q.Y.; Ji, X.J.; Huang, H. Microalgae for the production of lipid and carotenoids: A review with focus on stress regulation and adaptation. Biotechnol. Biofuels 2018, 11, 272. [Google Scholar] [CrossRef]
- Chowdury, K.H.; Nahar, N.; Deb, U.K. The growth factors involved in microalgae cultivation for biofuel production: A review. Comput. Water Energy Environ. Eng. 2020, 9, 185–215. [Google Scholar] [CrossRef]
- Goh, P.S.; Ahmad, N.A.; Lim, J.W.; Liang, Y.Y.; Kang, H.S.; Ismail, A.F.; Arthanareeswaran, G. Microalgae-Enabled Wastewater Remediation and Nutrient Recovery through Membrane Photobioreactors: Recent Achievements and Future Perspective. Membranes 2022, 12, 1094. [Google Scholar] [CrossRef] [PubMed]
- Obaideen, K.; Shehata, N.; Sayed, E.T.; Abdelkareem, M.A.; Mahmoud, M.S.; Olabi, A.G. The role of wastewater treatment in achieving sustainable development goals (SDGs) and sustainability guideline. Energy Nexus 2022, 7, 100112. [Google Scholar] [CrossRef]
- Abdel-Karim, O.H.; Gheda, S.F.; Ismail, G.A.; Abo-Shady, A.M. Phytochemical Screening and antioxidant activity of Chlorella vulgaris. Delta J. Sci. 2020, 41, 79–91. [Google Scholar] [CrossRef]
- Krzemińska, I.; Piasecka, A.; Nosalewicz, A.; Simionato, D.; Wawrzykowski, J. Alterations of the lipid content and fatty acid profile of Chlorella protothecoides under different light intensities. Bioresour. Technol. 2015, 196, 72–77. [Google Scholar] [CrossRef]
- Matabanchoy-Mesias, Y.; Rodríguez-Caicedo, Y.A.; Imués-Figueroa, M.A. Population growth of Chlorella sp. in three types of tubular photobioreactors, under laboratory conditions. Aquac. Aquar. Conserv. Legis. 2020, 13, 2094–2106. [Google Scholar]
- Kuo, C.M.; Sun, Y.L.; Lin, C.H.; Lin, C.H.; Wu, H.T.; Lin, C.S. Cultivation and biorefinery of microalgae (Chlorella sp.) for producing biofuels and other byproducts: A review. Sustainability 2021, 13, 13480. [Google Scholar] [CrossRef]
- Narala, R.R.; Garg, S.; Sharma, K.K.; Thomas-Hall, S.R.; Deme, M.; Li, Y.; Schenk, P.M. Comparison of microalgae cultivation in photobioreactor, open raceway pond, and a two-stage hybrid system. Front. Energy Res. 2016, 4, 29. [Google Scholar] [CrossRef]
- Daliry, S.; Hallajisani, A.; Mohammadi Roshandeh, J.; Nouri, H.; Golzary, A. Investigation of optimal condition for Chlorella vulgaris microalgae growth. Glob. J. Environ. Sci. Manag. 2017, 3, 217–230. [Google Scholar] [CrossRef]
- Lakaniemi, A.M.; Tuovinen, O.H.; Puhakka, J.A. Anaerobic conversion of microalgal biomass to sustainable energy carriers–a review. Bioresour. Technol. 2013, 135, 222–231. [Google Scholar] [CrossRef] [PubMed]
- Binnal, P.; Babu, P.N. Statistical optimization of parameters affecting lipid productivity of microalga Chlorella protothecoides cultivated in photobioreactor under nitrogen starvation. S. Afr. J. Chem. Eng. 2017, 23, 26–37. [Google Scholar] [CrossRef]
- Ghosh, G.; Daile, S.B.; Chakraborty, S.; Atta, A. Influence of super-optimal light intensity on the acetic acid uptake and microalgal growth in mixotrophic culture of Chlorella sorokiniana in bubble-column photobioreactors. Bioresour. Technol. 2024, 393, 130152. [Google Scholar] [CrossRef]
- Metsoviti, M.N.; Papapolymerou, G.; Karapanagiotidis, I.T.; Katsoulas, N. Effect of light intensity and quality on growth rate and composition of Chlorella vulgaris. Plants 2020, 9, 31. [Google Scholar] [CrossRef]
- Nzayisenga, J.C.; Farge, X.; Groll, S.L.; Sellstedt, A. Effects of light intensity on growth and lipid production in microalgae grown in wastewater. Biotechnol. Biofuels 2020, 13, 4. [Google Scholar] [CrossRef] [PubMed]
- Gao, K.; Xue, C.; Yang, M.; Li, L.; Qian, P.; Gao, Z.; Gao, Z.; Deng, X. Optimization of light intensity and photoperiod for growing Chlorella sorokiniana on cooking cocoon wastewater in a bubble-column bioreactor. Algal Res. 2022, 62, 102612. [Google Scholar] [CrossRef]
- Minhas, A.K.; Hodgson, P.; Barrow, C.J.; Adholeya, A. A review on the assessment of stress conditions for simultaneous production of microalgal lipids and carotenoids. Front. Microbiol. 2016, 7, 183978. [Google Scholar] [CrossRef] [PubMed]
- Cheng, D.; He, Q. Assessment of environmental stresses for enhanced microalgal biofuel production–An overview. Front. Energy Res. 2014, 2, 26. [Google Scholar] [CrossRef]
- Yu, H.; Kim, J.; Rhee, C.; Shin, J.; Shin, S.G.; Lee, C. Effects of different pH control strategies on microalgae cultivation and nutrient removal from anaerobic digestion effluent. Microorganisms 2022, 10, 357. [Google Scholar] [CrossRef] [PubMed]
- Ummalyma, S.B.; Sirohi, R.; Udayan, A.; Yadav, P.; Raj, A.; Sim, S.J.; Pandey, A. Sustainable microalgal biomass production in food industry wastewater for low-cost biorefinery products: A review. Phytochem. Rev. 2023, 22, 969–991. [Google Scholar] [CrossRef] [PubMed]
- Gururani, P.; Bhatnagar, P.; Kumar, V.; Vlaskin, M.S.; Grigorenko, A.V. Algal Consortiums: A Novel and Integrated Approach for Wastewater Treatment. Water 2022, 14, 3784. [Google Scholar] [CrossRef]
- Dębowski, M.; Zieliński, M.; Kazimierowicz, J.; Kujawska, N.; Talbierz, S. Microalgae cultivation technologies as an opportunity for bioenergetic system development advantages and limitations. Sustainability 2020, 12, 9980. [Google Scholar] [CrossRef]
- Zhu, C.; Zhai, X.; Xi, Y.; Wang, J.; Kong, F.; Zhao, Y.; Chi, Z. Efficient CO2 capture from the air for high microalgal biomass production by a bicarbonate Pool. J. CO2 Util. 2020, 37, 320–327. [Google Scholar] [CrossRef]
- Yu, X.; Dong, T.; Zheng, Y.; Miao, C.; Chen, S. Investigations on cell disruption of oleaginous microorganisms: Hydrochloric acid digestion is an effective method for lipid extraction. Eur. J. Lipid Sci. Technol. 2015, 117, 730–737. [Google Scholar] [CrossRef]
- Psachoulia, P.; Schortsianiti, S.N.; Lortou, U.; Gkelis, S.; Chatzidoukas, C.; Samaras, P. Assessment of nutrients recovery capacity and biomass growth of four microalgae species in anaerobic digestion effluent. Water 2022, 14, 221. [Google Scholar] [CrossRef]
- Nguyen, L.N.; Aditya, L.; Vu, H.P.; Johir, A.H.; Bennar, L.; Ralph, P.; Nghiem, L.D. Nutrient removal by algae-based wastewater treatment. Curr. Pollut. Rep. 2022, 8, 369–383. [Google Scholar] [CrossRef]
- Acién Fernández, F.G.; Gómez-Serrano, C.; Fernández-Sevilla, J.M. Recovery of nutrients from wastewaters using microalgae. Front. Sustain. Food Syst. 2018, 2, 59. [Google Scholar] [CrossRef]
- Qian, W.; Yang, Y.; Chou, S.; Ge, S.; Li, P.; Wang, X.; Zhung, L.; Zhang, J. Effect of N/P ratio on attached microalgae growth and the differentiated metabolism along the depth of biofilm. Environ. Res. 2024, 240, 117428. [Google Scholar] [CrossRef]
- Ummalyma Choi, H.J.; Lee, S.M. Effect of the N/P ratio on biomass productivity and nutrient removal from municipal wastewater. Bioprocess Biosyst. Eng. 2015, 38, 761–766. [Google Scholar] [CrossRef] [PubMed]
- Brown, N.; Shilton, A. Luxury uptake of phosphorus by microalgae in waste stabilisation ponds: Current understanding and future direction. Rev. Environ. Sci. Biotechnol. 2014, 13, 321–328. [Google Scholar] [CrossRef]
- Lu, L.; Yang, G.; Zhu, B.; Pan, K. A comparative study on three quantitating methods of microalgal biomass. Indian J. Geo Mar. Sci. 2017, 46, 2265–2272. [Google Scholar]
- Kamyab, H.; Chelliapan, S.; Lee, C.T.; Khademi, T.; Kumar, A.; Yadav, K.K.; Ebrahimi, S.S. Improved production of lipid contents by cultivating Chlorella pyrenoidosa in heterogeneous organic substrates. Clean Technol. Environ. 2019, 21, 1969–1978. [Google Scholar] [CrossRef]
- Al-Ameri, M.; Al-Zuhair, S. Using switchable solvents for enhanced, simultaneous microalgae oil extraction-reaction for biodiesel production. Biochem. Eng. J. 2019, 141, 217–224. [Google Scholar] [CrossRef]
- Bligh, E.G.; Dyer, W.J. A rapid method of total lipid extraction and purification. Can. J. Biochem. Physiol. 1959, 37, 911–917. [Google Scholar] [CrossRef]
- Montoya-Vallejo, C.; Guzmán Duque, F.L.; Quintero Díaz, J.C. Biomass and lipid production by the native green microalgae Chlorella sorokiniana in response to nutrients, light intensity, and carbon dioxide: Experimental and modeling approach. Front. Bioeng. Biotechnol. 2023, 11, 1149762. [Google Scholar] [CrossRef] [PubMed]
- Lowry, O.H.; Rosebrough, N.J.; Farr, A.L.; Randall, R.J. Protein measurement with the Folin phenol reagent. J. Biol. Chem. 1951, 193, 265–275. [Google Scholar] [CrossRef]
- DuBois, M.; Gilles, K.A.; Hamilton, J.K.; Rebers, P.T.; Smith, F. Colorimetricmethod for determination of sugars and related substances. Anal. Chem. 1956, 28, 350–356. [Google Scholar] [CrossRef]
- Maltsev, Y.; Maltseva, K.; Kulikovskiy, M.; Maltseva, S. Influence of light conditions on microalgae growth and content of lipids, carotenoids, and fatty acid composition. Biology 2021, 10, 1060. [Google Scholar] [CrossRef]
- Safaee, M.; Abdolalian, S.; Moghaddam, S.Y. Optimization of chlorella sorokiniana growth via response surface methodology. In Proceedings of the Third International Conference on New Research and Achievements in Science, Engineering and Technologies, Berlin, Germany, 6 January 2024. [Google Scholar]
- Ortíz-Sánchez, E.; Guillén-Garcés, R.A.; Morales-Arrieta, S.; Ugochukwu Okoye, P.; Olvera-Vargas, H.; Sebastian, P.J.; Arias, D.M. Cultivation of carbohydrate-rich microalgae with great settling properties using cooling tower wastewater. Environ. Sci. Pollut. Res. 2024, 31, 38999–39014. [Google Scholar] [CrossRef] [PubMed]
- Ali, H.E.A.; El-fayoumy, E.A.; Rasmy, W.E.; Soliman, R.M.; Abdullah, M.A. Two-stage cultivation of Chlorella vulgaris using light and salt stress conditions for simultaneous production of lipid, carotenoids, and antioxidants. J. Appl. Phycol. 2021, 33, 227–239. [Google Scholar] [CrossRef]
- Li, S.; Zhao, S.; Yan, S.; Qiu, Y.; Song, C.; Li, Y.; Kitamura, Y. Food processing wastewater purification by microalgae cultivation associated with high value-added compounds production—A review. Chin. J. Chem. Eng. 2019, 27, 2845–2856. [Google Scholar] [CrossRef]
- Wu, Q.; Guo, L.; Li, X.; Wang, Y. Effect of phosphorus concentration and light/dark condition on phosphorus uptake and distribution with microalgae. Bioresour. Technol. 2021, 340, 125745. [Google Scholar] [CrossRef] [PubMed]
- Delgadillo-Mirquez, L.; Lopes, F.; Taidi, B.; Pareau, D. Nitrogen and phosphate removal from wastewater with a mixed microalgae and bacteria culture. Biotechnol. Rep. 2016, 11, 18–26. [Google Scholar] [CrossRef] [PubMed]
- Khalid, A.A.H.; Yaakob, Z.; Abdullah, S.R.S.; Takriff, M.S. Analysis of the elemental composition and uptake mechanism of Chlorella sorokiniana for nutrient removal in agricultural wastewater under optimized response surface methodology (RSM) conditions. J. Clean. Prod. 2019, 210, 673–686. [Google Scholar] [CrossRef]
- Powell, N.; Shilton, A.; Chisti, Y.; Pratt, S. Towards luxury uptake process via microalgae: Defining the polyphosphate dynamics. Water Res. 2009, 43, 4207–4213. [Google Scholar] [CrossRef]
Disclaimer/Publisher’s Note: The statements, opinions and data contained in all publications are solely those of the individual author(s) and contributor(s) and not of MDPI and/or the editor(s). MDPI and/or the editor(s) disclaim responsibility for any injury to people or property resulting from any ideas, methods, instructions or products referred to in the content. |
© 2024 by the authors. Licensee MDPI, Basel, Switzerland. This article is an open access article distributed under the terms and conditions of the Creative Commons Attribution (CC BY) license (https://creativecommons.org/licenses/by/4.0/).