Article

Biodiversity and Soil Reinforcement Effect of Vegetation Buffer Zones: A Case Study of the Tongnan Section of the Fujiang River Basin

1
Postdoctoral Workstation Chongqing Bureau of Geology and Minerals Exploration, Chongqing 401121, China
2
Geology No. 107 Team, Chongqing Bureau of Geology and Minerals Exploration, Chongqing 401120, China
3
School of Grassland Science, Beijing Forestry University, Beijing 100083, China
4
Three-Gorges Reservoir Area (Chongqing) Forest Ecosystem Research Station, School of Soil and Water Conservation, Beijing Forestry University, Beijing 100083, China
5
Chongqing Jinyun Mountain Three Gorges Reservoir Area Forest Ecosystem Positioning Observation and Research Station, School of Soil and Water Conservation, Beijing Forestry University, Beijing 100083, China
6
Chongqing No. 107 Municipal Construction Engineering Co., Ltd., Chongqing 401120, China
*
Authors to whom correspondence should be addressed.
Water 2024, 16(19), 2847; https://doi.org/10.3390/w16192847
Submission received: 10 September 2024 / Revised: 30 September 2024 / Accepted: 2 October 2024 / Published: 7 October 2024

Abstract

:
The riparian vegetation buffer zone is an important component of riverbank ecosystems, playing a crucial role in soil consolidation and slope protection. In this study, the riparian vegetation buffer zones in the Tongnan section of the Fujiang River Basin were selected as the research object. Surveys and experiments were conducted to assess the species composition and the soil and water conservation effectiveness of the riparian vegetation buffer zone. There are a total of 35 species, mainly comprising angiosperms and ferns. The dominant species include Cynodon dactylon, Setaria viridis, Phragmites australis, Erigeron canadensis, and Melilotus officinalis. The Patrick richness index (R) and Shannon–Wiener diversity index (H) are more significantly influenced by the types of land use in the surrounding area, whereas the impact on the Simpson diversity index (D) and Pielou uniformity index (E) is comparatively less pronounced. When the root diameter is less than 0.2 mm, the tensile strength of Cynodon dactylon roots is the highest. For root diameters larger than 0.2 mm, Melilotus officinalis roots exhibit the highest tensile strength. The presence of plant root systems significantly reduces erosion, delaying the time to reach maximum erosion depth by 1–4 min, decreasing erosion depth by 9–38 mm, and reducing the total amount of erosion by 20.17–58.90%. The anti-scouribility effect of Cynodon dactylon is significantly better than that of Setaria viridis. The root system notably enhances soil shear strength, delaying the shear peak by 0.26–4.8 cm, increasing the shear peak by 4.76–11.37 kPa, and raising energy consumption by 23.76–46.11%. Phragmites australis has the best resistance to shear, followed by Erigeron canadensis, with Melilotus officinalis being the least resistant. Therefore, to balance the anti-scouribility effect and shear resistance of plant roots, it is recommended to use a combination of Cynodon dactylon and Phragmites australis for shallow-rooted and deep-rooted planting. This approach enhances the water and soil conservation capacity of riverbanks.

1. Introduction

The vegetation buffer zone is a transitional area made up of vegetation located between water bodies and land. This zone forms a dynamic and interconnected ecosystem that includes plants, animals, and microorganisms, making it one of the most complex ecosystems on Earth [1,2]. The vegetation buffer zone acts as a filter, intercepting and filtering out sediments, organic matter, pesticides, and agricultural pollutants that might enter rivers or reservoirs. This filtration helps achieve various goals, including soil and water conservation, flood control and embankment stabilization, water source conservation, flood storage and drought prevention, sediment accumulation and land formation, as well as maintaining biodiversity and ecosystem integrity [3,4,5,6].
The utilizing of vegetation buffer zones can be traced back to Europe in the 15th and 16th centuries. After continuous development, standardized designs and application standards for buffer zones appeared in the United States in the 1930s. It was not until the late 1970s that the definition of vegetation buffer zones was first proposed, and people gradually started to understand, manage, and protect them. Subsequently, buffer zones were applied in the prevention and control of agricultural non-point source pollution in the United States, becoming an effective ecological engineering measure to intercept surface pollutants [7]. Canada incorporated vegetation buffer zones into relevant environmental planning and soil and water management measures, while many European countries conducted related research and promoted the use of buffer zones as a water purification measure [8]. In the 1990s, countries such as Denmark, Costa Rica, the United States, and Brazil required the establishment of vegetation buffer zones on both sides of rivers through legislation and other means [9,10]. Research on vegetation buffer zones in China started relatively late, and before the 1990s, it was considered as part of wetland research. After introducing research findings from abroad, studies on vegetation buffer zones in China began [11].
Currently, research on vegetation buffer zones primarily focuses on soil and water conservation, pollutant reduction, and biodiversity protection [12,13,14,15]. These buffer zones enhance the soil and water conservation capacity of slopes and have proven to be an effective measure for slope management [16]. The reinforcement provided by plant roots includes both the anchoring effect of vertical roots and the stabilizing effect of horizontal roots [16]. The effectiveness of plant roots in reinforcing soil largely depends on the morphological characteristics of the roots, their tensile strength, and the interaction between the roots and soil [17]. Regarding erosion resistance, Xu et al. [18] indicated that the root-soil composite of Miscanthus sacchariflorus exhibits strong anti-scouribility during both the early growth and vigorous growth stages in the Three Gorges Reservoir area. Chen et al. [19] showed that dominant herbaceous plants along the lower reaches of the Puyang River can enhance soil anti-scouribility, with Phragmites australis and Phragmites australis being particularly effective. In terms of shear resistance, Shen et al. [20] found that the root–soil composite of Kobresia pygmaea and Stipa purpurea in the source area of the Yellow River has the highest cohesion. Hao et al. [21] determined through vegetation investigation and model calculation that Artemisia sieversiana, Alopecurus aequalis, and Leonurus japonicus had the best soil reinforcement effect in the Haizhou mine soil. Previous studies have mainly focused on the erosion or shear resistance of plant roots and have not fully explored the soil and water conservation effects of multiple plant configurations.
The Tongnan section of the Fu River Basin features flat terrain and concentrated rainfall during the rainy season. The soil structure in this area is loose, leading to severe soil erosion in some places. Riparian vegetation buffer zones can effectively mitigate soil erosion. However, there is a lack of research on the soil and water conservation capacity of vegetation along the Fu River. Previous studies have predominantly focused on individual properties such as root tensile strength, soil erosion resistance, and shear strength without fully exploring the comprehensive soil and water conservation effects of multiple plant configurations. This study aims to address this gap by employing plot surveys, anti-scouribility tests, direct shear tests, and other methods to identify the dominant species and their soil stabilization and slope protection effects within the vegetation buffer zones along the riverbanks. The findings of this study are expected to provide a theoretical basis for the selection of species for the protection of soil and water resources along riverbanks. The Tongnan section of the Fujiang River Basin is a typical shallow, hilly river basin, and the research results can support ecological protection and restoration in shallow, hilly river basins in the southwestern region of China.

2. Materials and Methods
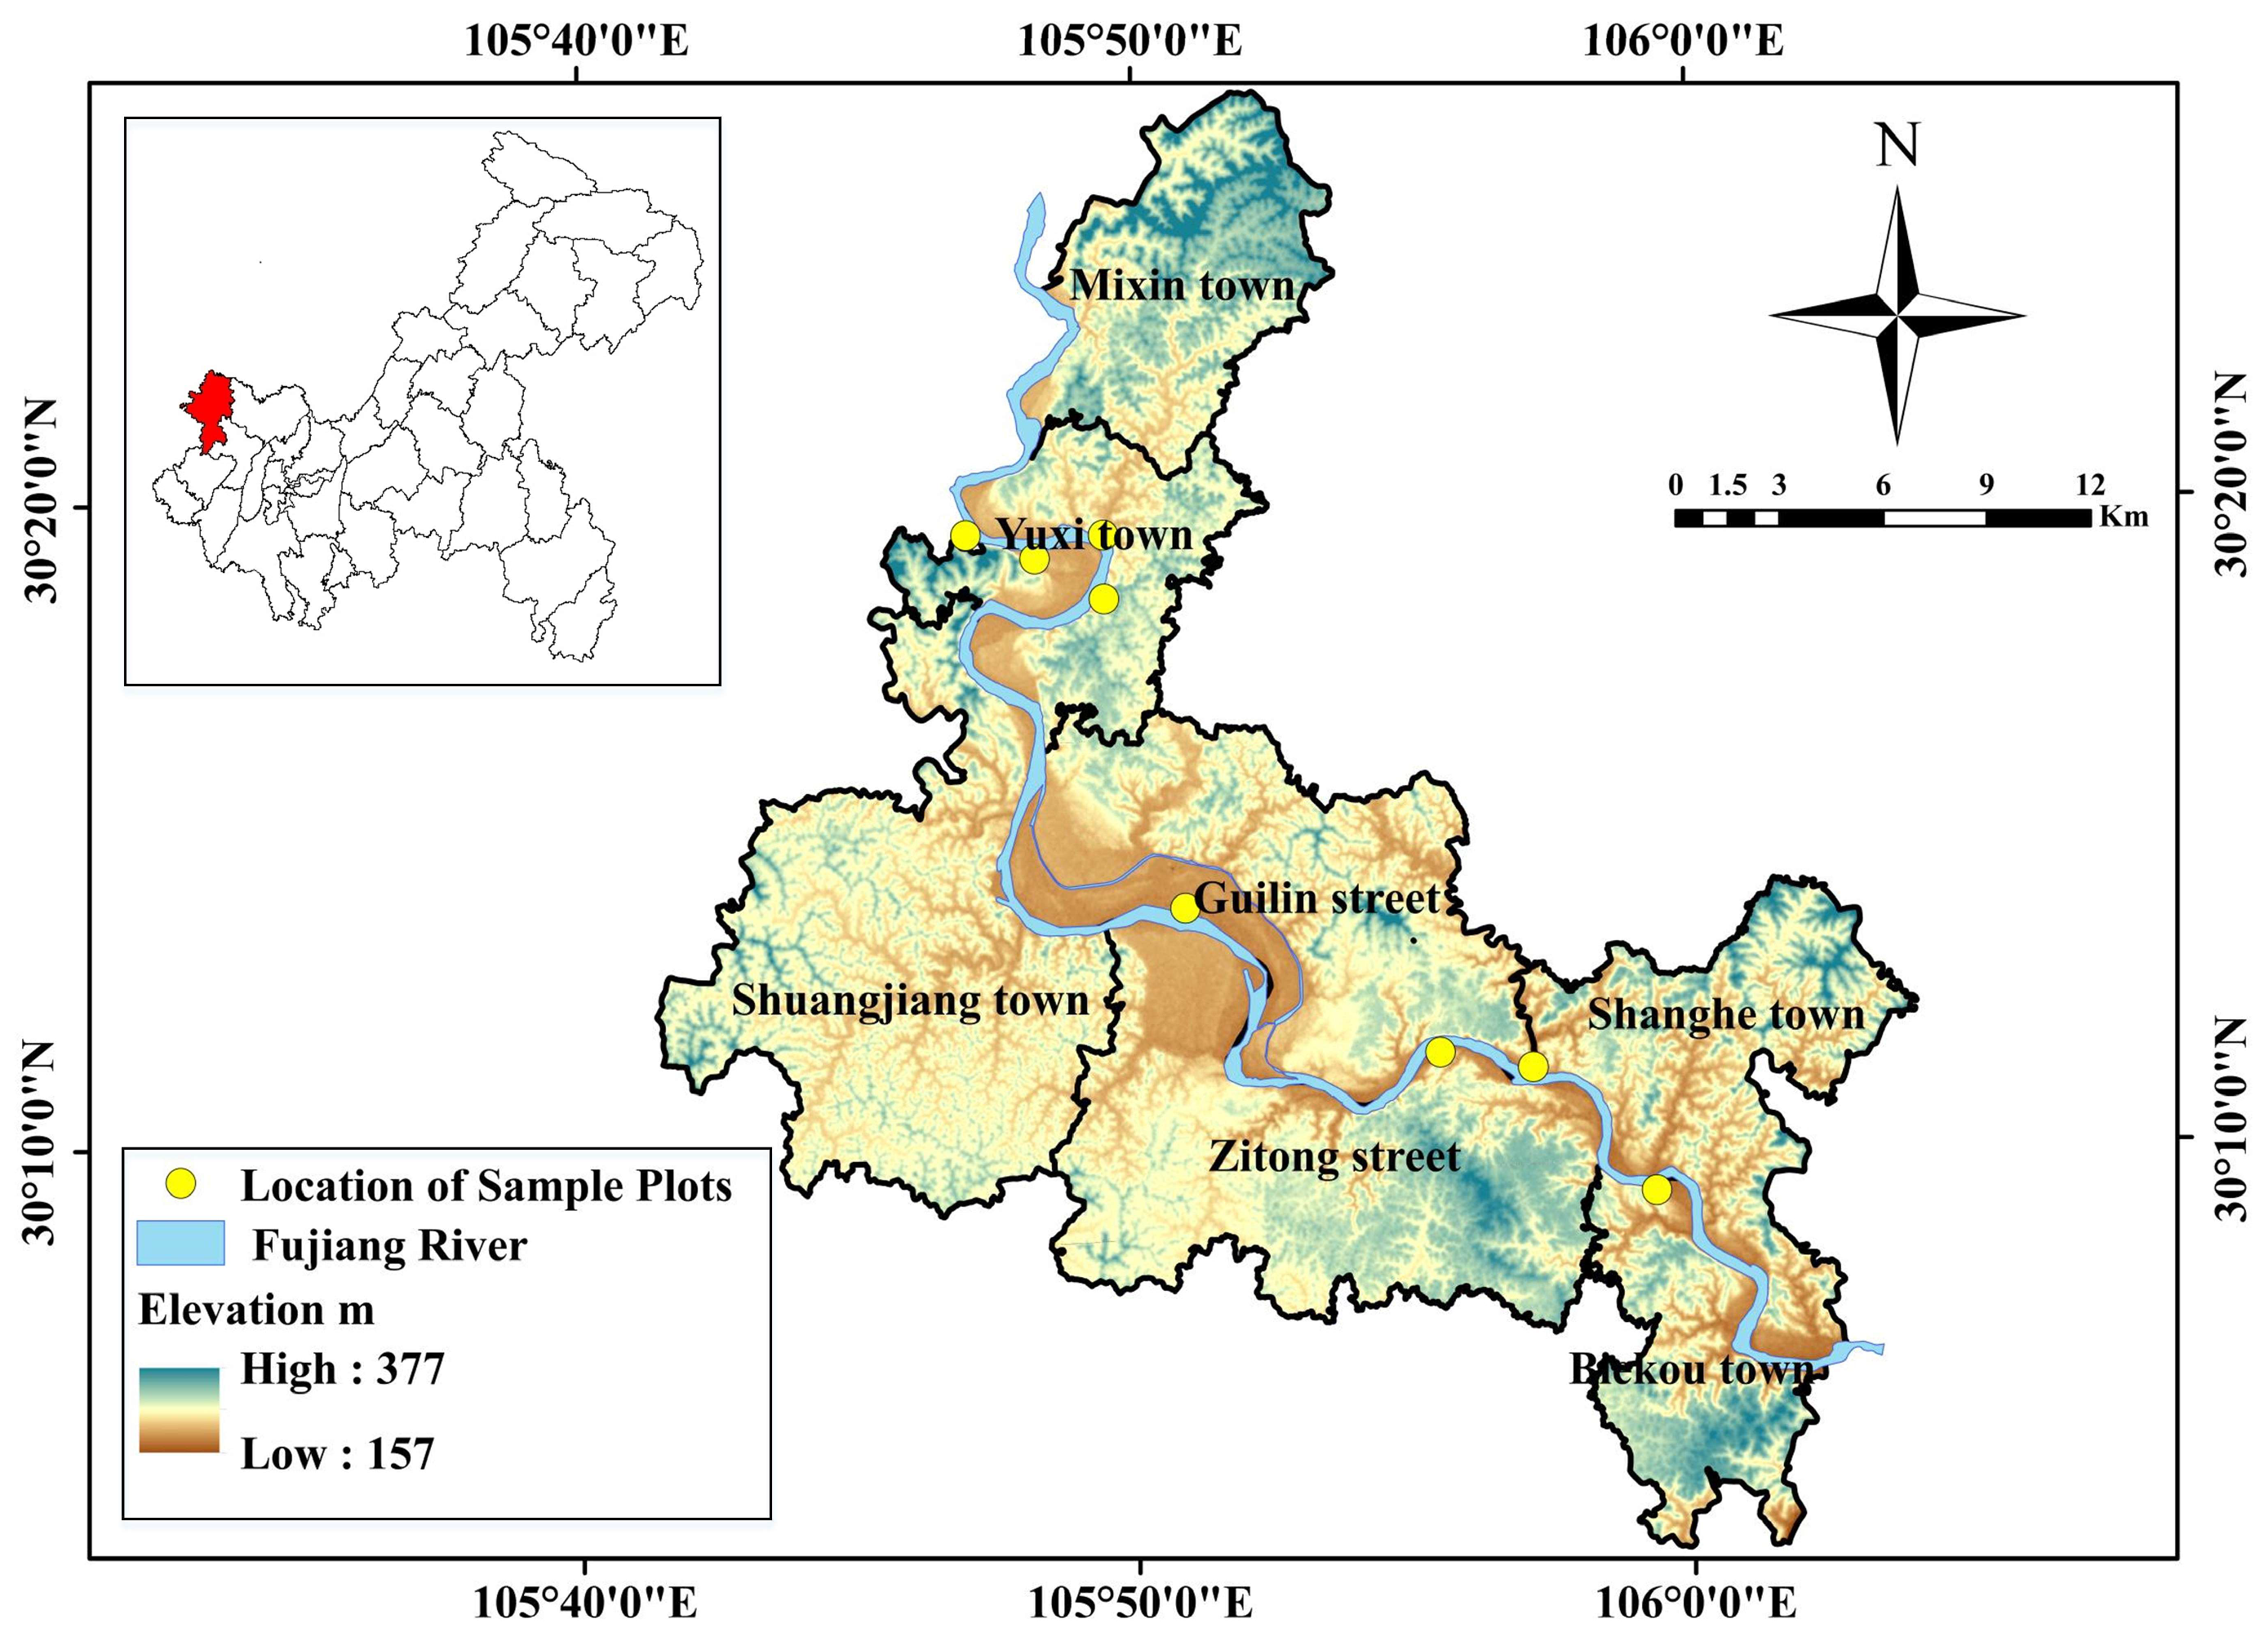
2.1. Study Area

The Tongnan section of the Fu River Basin is located in the northwest of Chongqing and belongs to the Jialing River system of the Yangtze River Basin (Figure 1). It traverses the northern part of Tongnan District from northwest to southeast. The study area has a subtropical monsoon climate with abundant water and heat resources. It has a mild winter and hot summer, a short spring and autumn, and is often foggy with little frost. The annual average temperature ranges from 13.8 to 18.8 °C, and the annual average rainfall ranges from 1000 to 1400 mm. The Fu River and its tributaries create a clear grid or branched water system. The terrain consists mainly of gentle hills and river terraces. The soil types are mainly alluvial soils, followed by yellow earths, paddy soil, and purplish soil. The study area belongs to the subtropical evergreen broad-leaved forest zone; the primary tree species are Cupressus funebris and Bambusoideae, with a single tree species and simple structure. The vegetation on the river terraces is dominated by herbaceous plants, with some areas featuring extensive stands of Bambusoideae and Eucalyptus.

2.2. Field Quadrat Survey Sampling and Biodiversity Analysis

Eight different plant communities along the river were selected for a quadrat survey (sample plot information is shown in Table 1). Five plots were established for each community, with each quadrat measuring 1 m × 1 m (as shown in Figure 2). The plant species and their quantities within each quadrat were counted using visual estimation, and plant samples were collected.
The importance value is used as a comprehensive indicator for each plant species in the plot survey. If the importance values of sample plots exceed 15%, it is considered as a dominant species [22]. Species richness and species diversity reflect the organizational characteristics of the plant community. In this study, Patrick richness index, Simpson diversity index, Pielou uniformity index, and Shannon–Wiener diversity index were used as indicators of community diversity. The formulas are as follows:
Relative height = (Height of a specific species/Sum of heights of all species) × 100%
Relative coverage = (Coverage of a specific species/Sum of coverages of all species) × 100%
Patrick richness index: Rp = S
where S is the number of species appearing in the quadrat.
Simpson   diversity   index :   D s = 1 i = 1 s n i ( n i 1 ) / N ( N 1 )
where S is the number of species; N is the sum of the individual numbers of all species in the community; ni is the number of individuals of the i-th species;
Shannon Wiener   diversity   index :   H = i = 1 S P i ln P i
where C is the constants, generally set to C = 1; Pi is the probability of species i.
Pielou   uniformity   index :   E = H / ln S

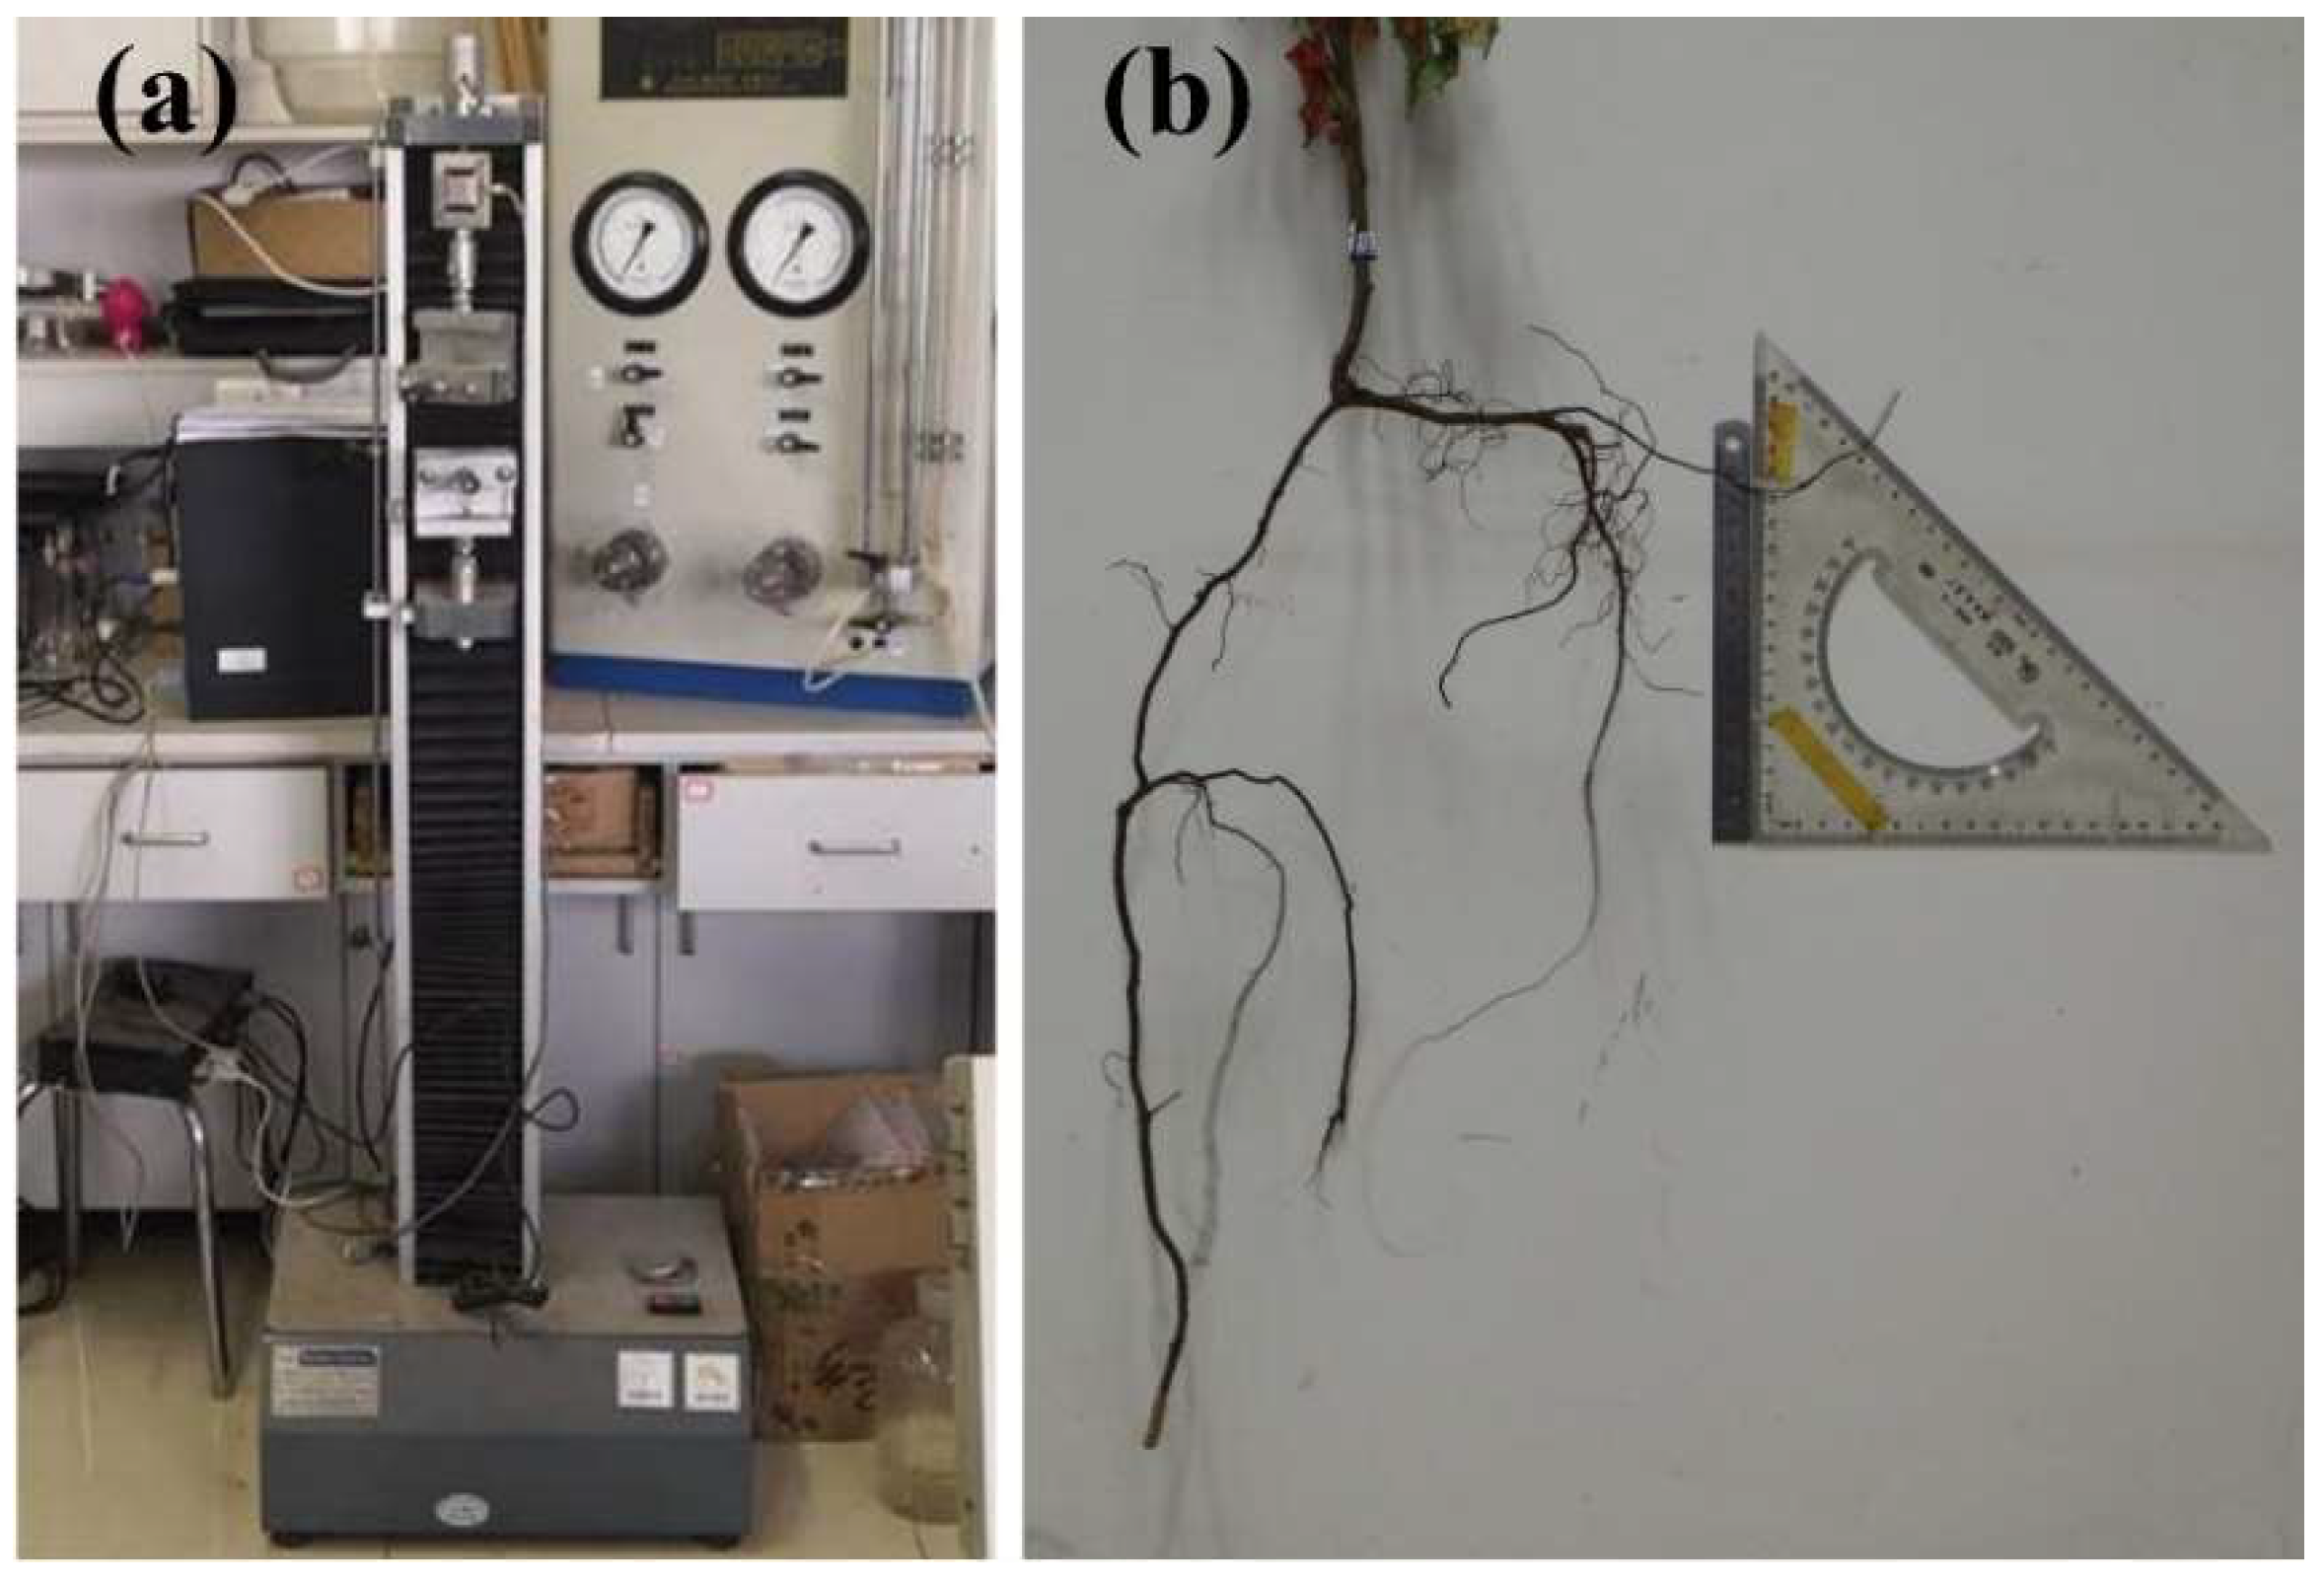
2.3. Determination of Root Mechanics and Morphological Characteristics

We first measured the morphological characteristics of the root using tools such as a ruler, protractor, vernier caliper, and balance. The formula for calculating the root surface area ratio is as follows:
R A R = π D 2 4 A = A r A
where RAR is the root area ratio, %; D is root diameter, mm; Ar is the total area of the roots, mm2; and A is the reference area mm2.
Root tensile strength was measured by an S9M Universal Mechanical Testing Machine [23] (Figure 3). According to previous research [24,25], the formula of root ultimate tensile strength is as follows:
T r = 4 F m a x π D 2 = a D b
where Tr is root tensile strength, MPa; Fmax is the maximum tensile force, N; a and b are constants.

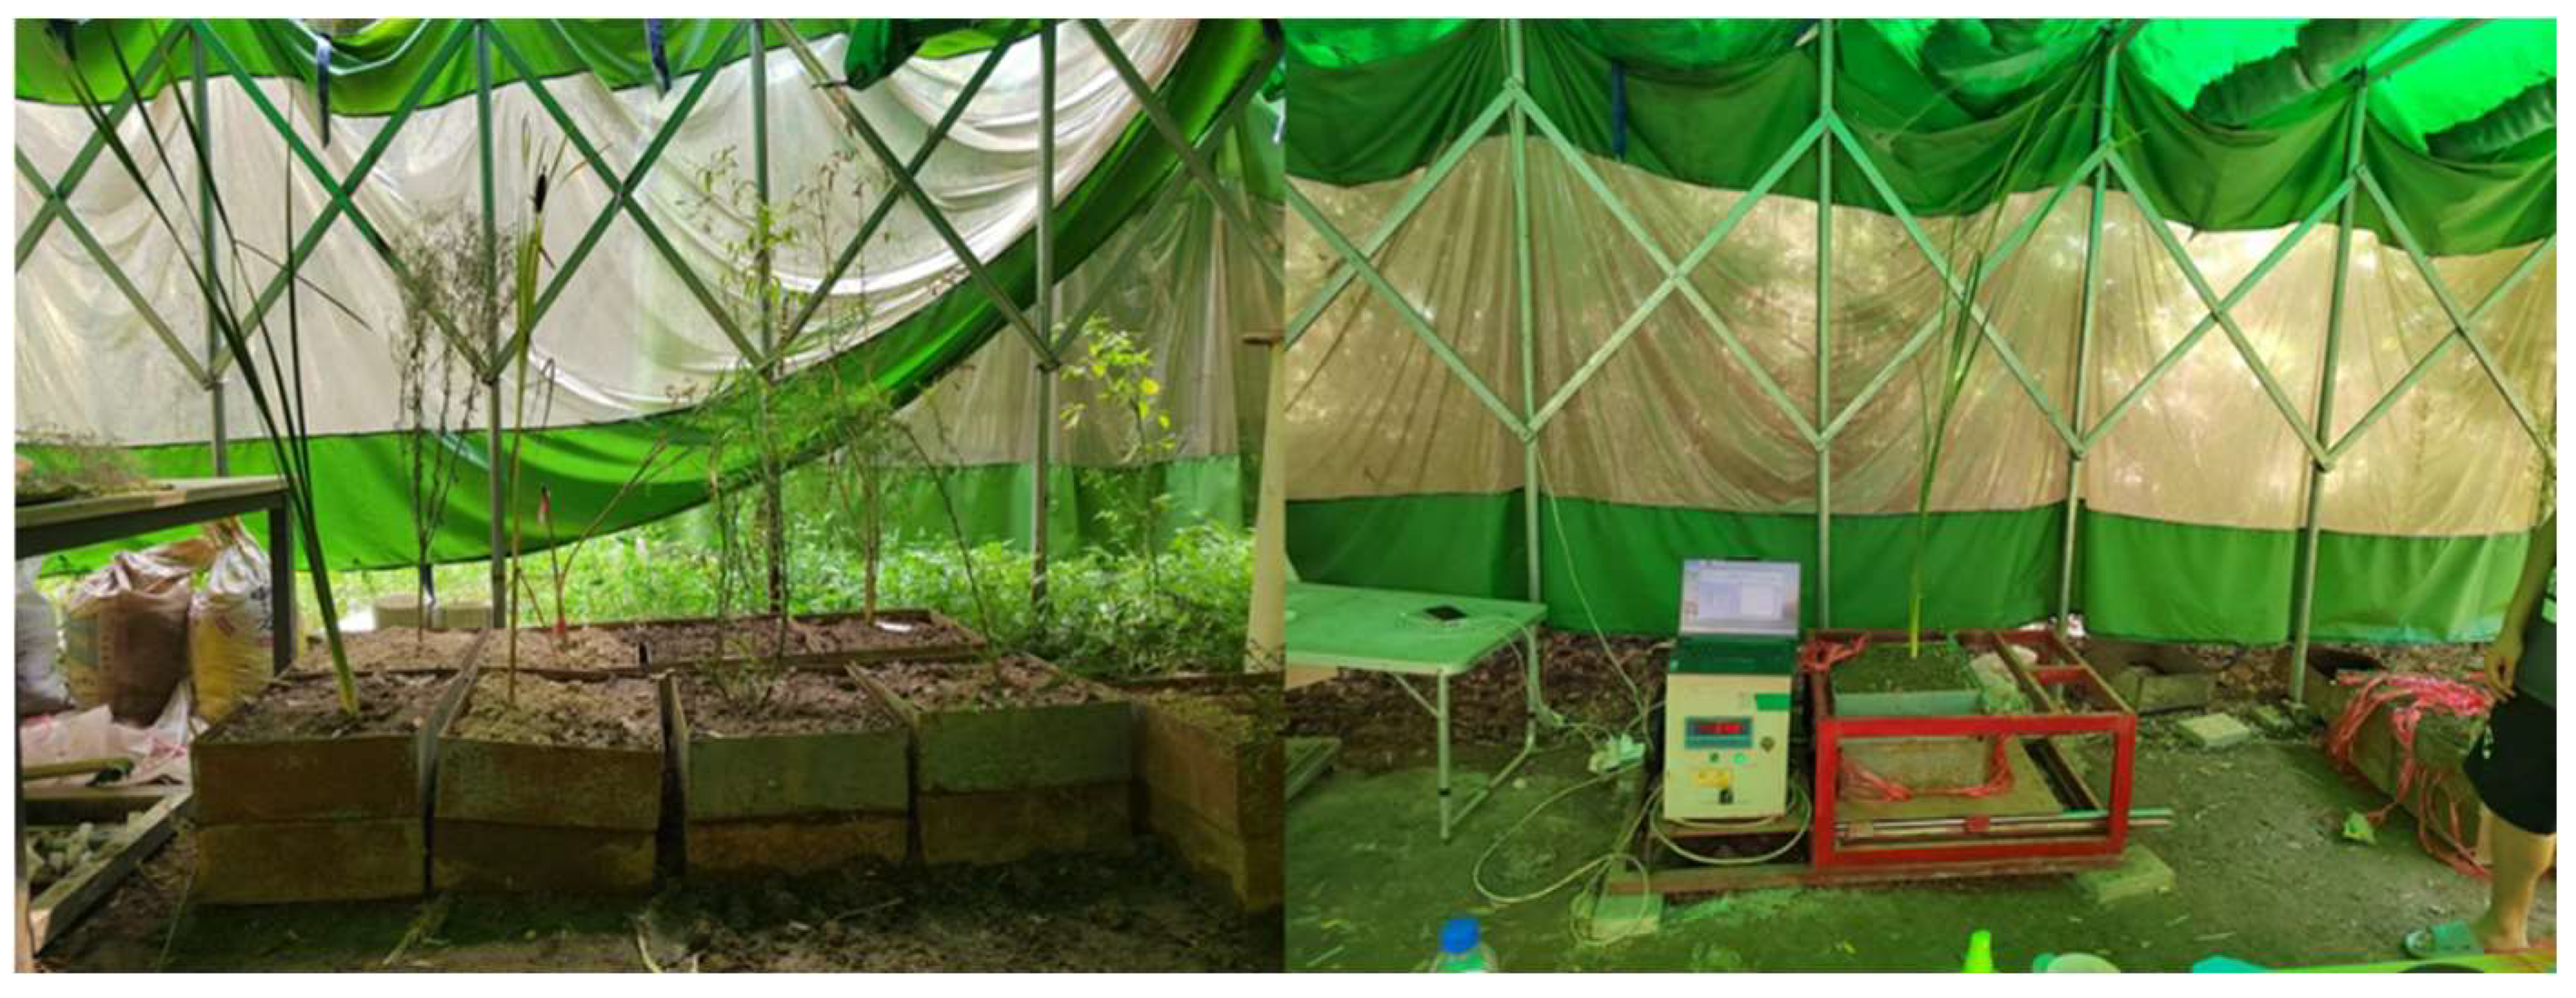
2.4. Measuring Soil Anti-Scouribility

In order to test the influence of root networks on soil anti-scouribility, 15 underwater jet tests were conducted on plots with different vegetation cover of Cynodon dactylon and Setaria viridis at the riverbank (the test equipment refer to Hanson and Simon [26]).
Prior to each test, the above-ground biomass was removed, and the spraying device was placed on the soil surface with grass stems kept approximately 1 cm above the ground to distinguish different root density penetration areas for the experiment. The tests were conducted under a water head of 1.8 m until no further vertical scouring occurred, usually within 10 to 15 min. Scour depth was measured every minute [27]. After each test, the volume and depth of the scour holes were measured, and the exposed roots in the scour holes were collected for laboratory analysis of root morphology (Figure 4).

2.5. Large Box Shear Test

We chose species with well-developed roots and planted them in a shear box that measures 0.4 m in length, width, and height (as shown in Figure 5). The shear box is divided into upper and lower sections, with a large number of drainage holes uniformly distributed at the bottom of the lower section. During planting, soil was layered to maintain the original root shape in the soil, ensuring the roots were distributed near the shear plane. Different species (Melilotus officinalis, Erigeron canadensis, and Phragmites australis) were used as treatments, with bare soil serving as the control group. After 2 months of plant growth, a custom, large-scale, strain-controlled shear apparatus was used to conduct the shear test. Stress–strain curves of different root–soil composites were obtained using stress sensors and a data acquisition unit. The energy consumed by various root–soil composites and the bare soil during the shearing process was calculated using an energy model.
The energy model was proposed by Ekanayake and Phillips [28] to simplify the complex soil–root interactions during shear failure based on the principle of energy conservation. Assumptions in the energy model are as follows: The stress–strain curve of the bare soil reaches a peak shear stress followed by a rapid decrease, while the stress–strain curve of the root–soil composite shows a slow decrease after reaching the peak shear stress. The energy consumed during the direct shear test at each time point is the product of shear force and shear displacement, summed over all time points. The area difference between the curves representing the root–soil composite and bare soil represents the energy difference generated by the presence of roots, indicating the reinforcing effect of roots on soil.
The expression for the enhanced shear strength of soil due to plant roots is given by the following equation:
E ( x p ) = 0 x p F ( x ) d x
where F(x) represents the stress–strain curve, and xP represents the shear displacement at the peak stress.

3. Result

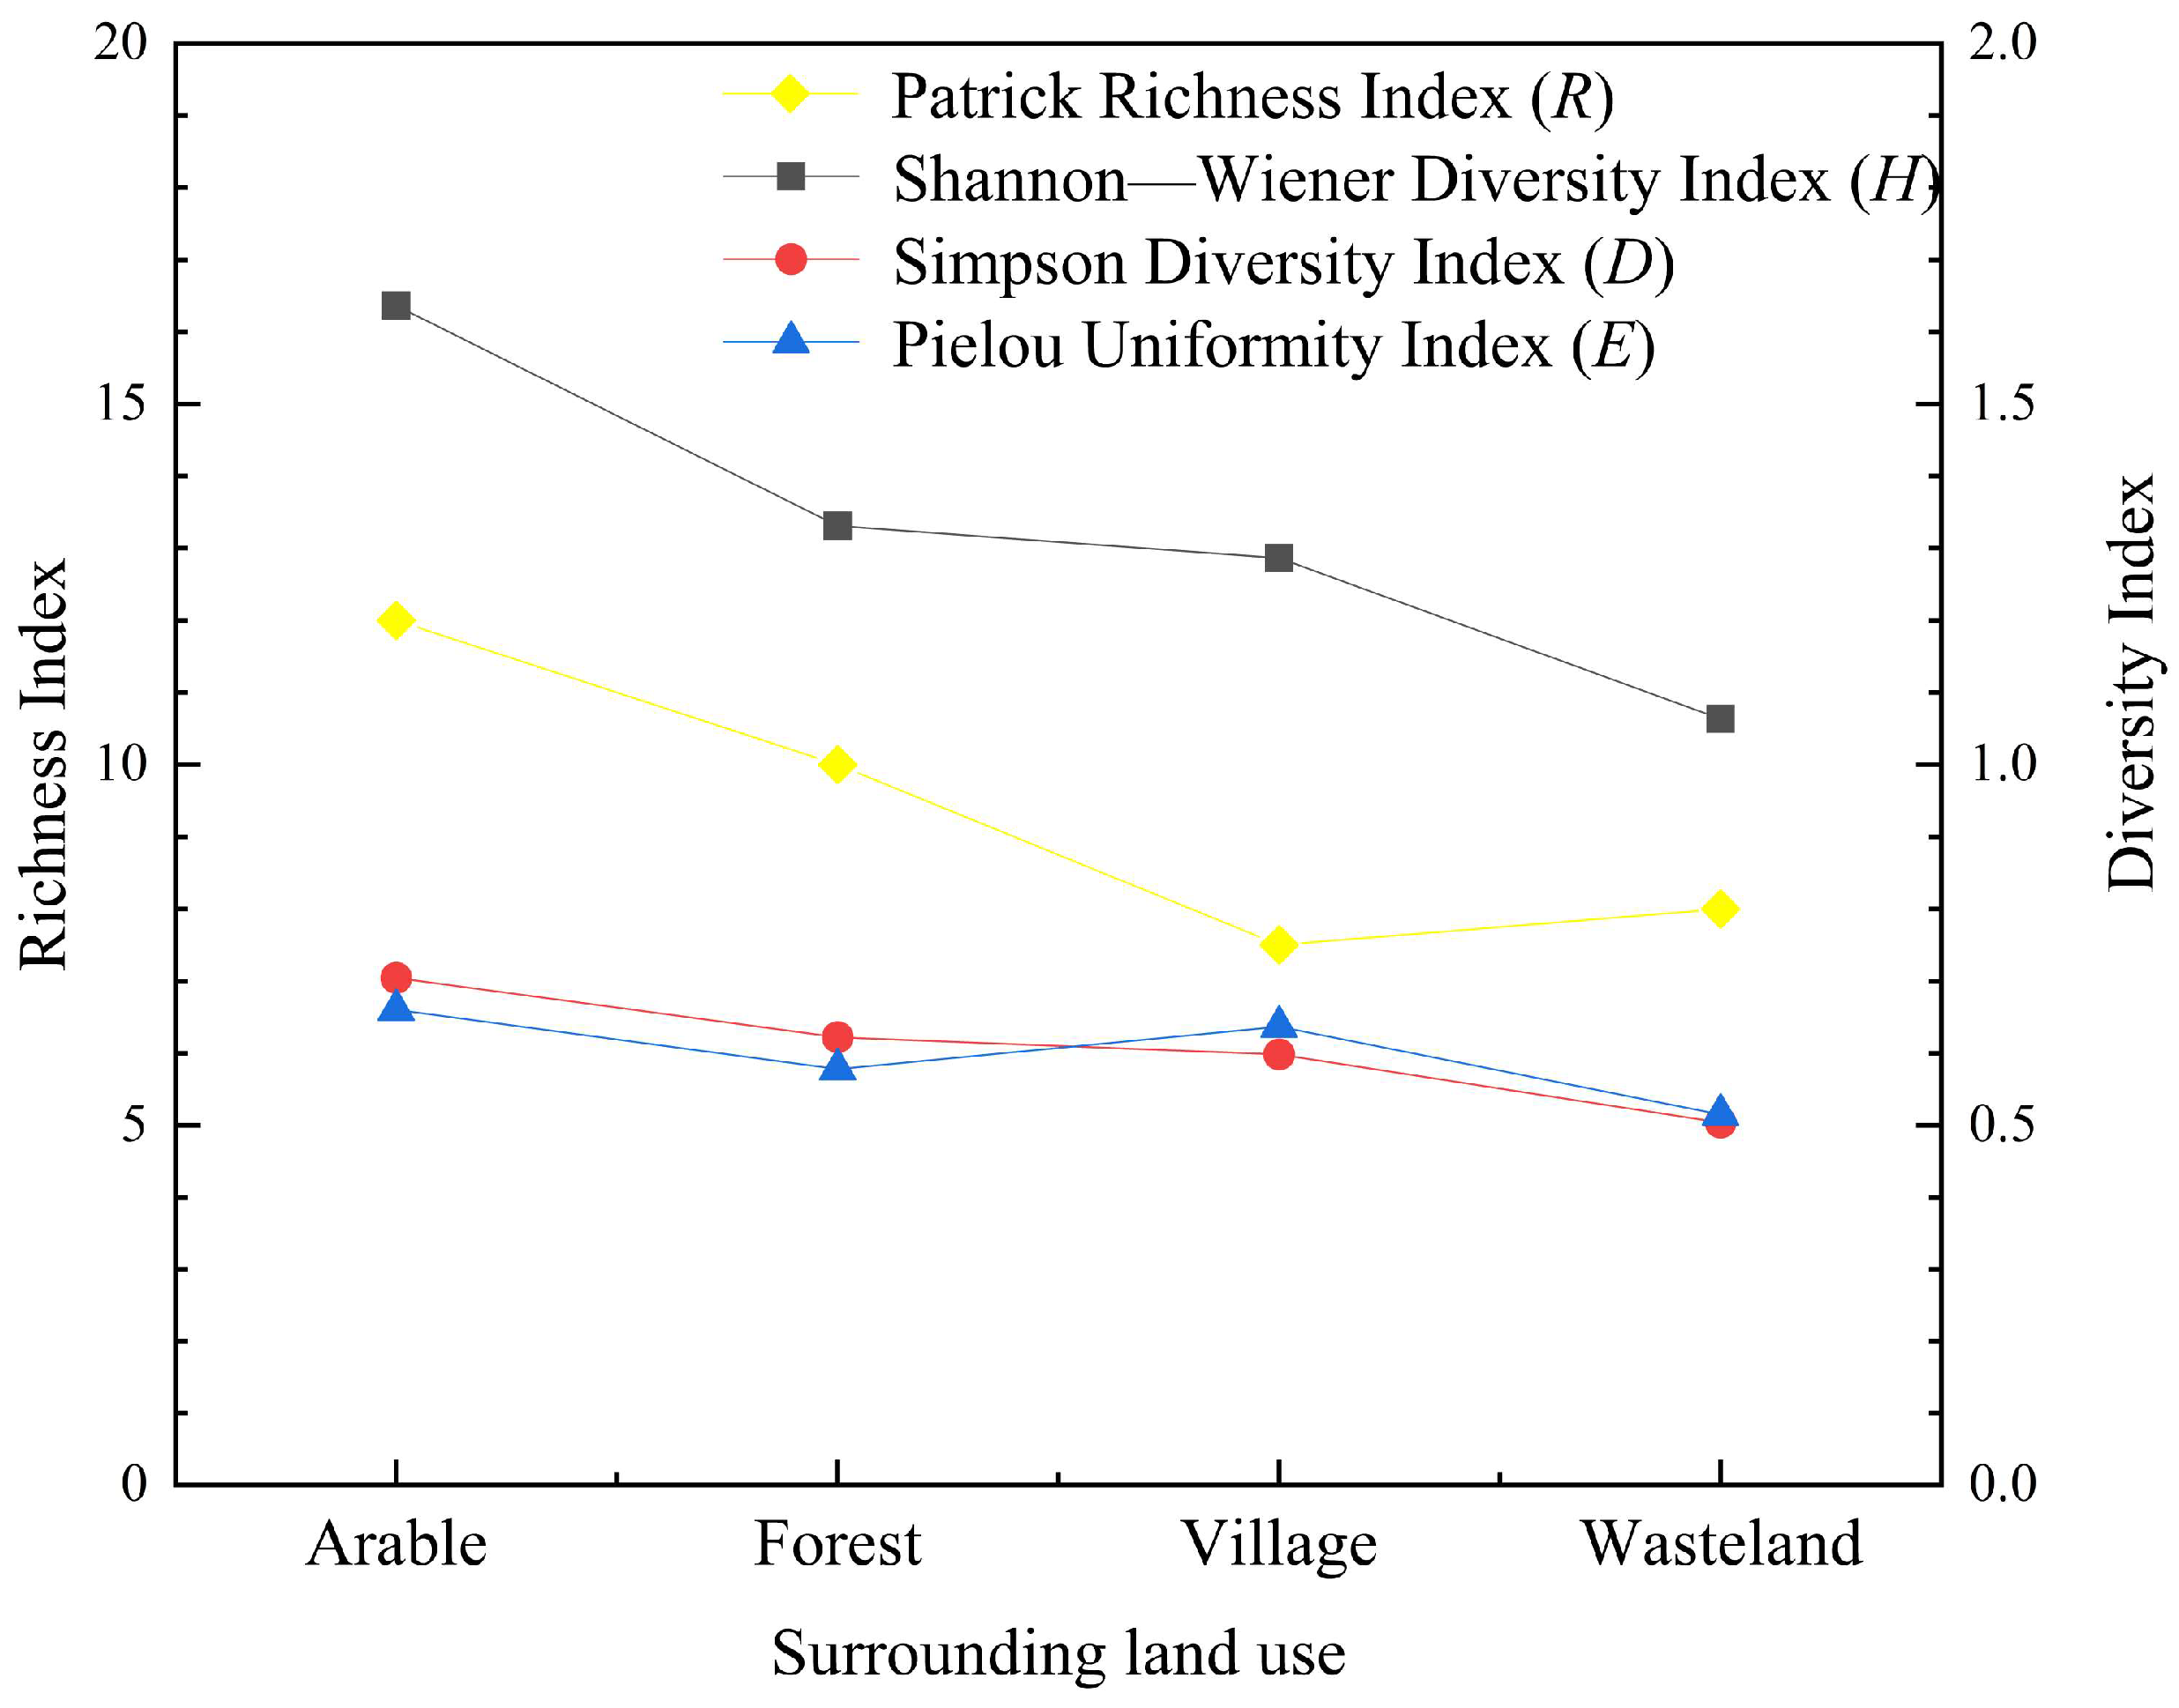
3.1. Species Composition and Biodiversity Analysis of Vegetation Buffer Zones

The field survey results indicated that along the river, there are 2 classes, 3 orders, 16 families, 19 genera, and 35 species of plants, including 33 angiosperms and 2 pteridophytes (Table 2). Photos of some plant samples are shown in Figure 6. Among them, angiosperms dominate the composition of riverbank vegetation, including 17 families such as Asteraceae, Poaceae, Poaceae, Amaranthaceae, Polygonaceae, Lamiaceae, Fabaceae, Rosaceae, Cannabaceae, Apocynaceae, Boraginaceae, Brassicaceae, Loganiaceae, Asparagaceae, Onagraceae, Solanaceae, and Araceae, with two Pteridophytas families, including Pteridaceae and Equisetaceae. The dominant species in each community with a relative importance value of 15% or above are considered as dominant species, totaling five species, namely Cynodon dactylon, Setaria viridis, Melilotus officinalis, Erigeron Canadensis, and Phragmites australis (main species and their importance values shown in the sample plots, Table 3).
The R, D, H, and E of the eight plant communities are shown in Figure 7. The D of plant communities ranges from 0.497 to 0.731, with the highest D value found in Zhongba (0.731) and the lowest in Lujiaba (0.497). The H of communities ranges from 1.062 to 1.652, with the highest H value in Yuxingba (1.652) and the lowest in Zhangjiawan (1.062). The E of communities ranges from 0.485 to 0.708, with the highest E value in Yuxi Town (0.708) and the lowest in Yinglong Street (0.485). The R of communities ranges from 7 to 13, with the highest R value found in Yuxingba (13) and the lowest in Zhangjiawan and Lujiaba (7). The trends in Simpson dominance index, Shannon–Wiener diversity index, and Pielou evenness index tended to be similar.
From the perspective of land-use types surrounding the plots, R and H are more significantly influenced by the types of land use in the surrounding area, whereas the impact on D and E is comparatively less pronounced (Figure 8). For R, arable land is the highest, followed by forests and villages, with wasteland being the lowest. For H, arable land is again the highest, followed by forests and villages, with wasteland being the least abundant. There is not much difference in D and E among different land-use types.

3.2. Mechanical and Morphological Characteristics of Root

Selected five dominant plant species, including Cynodon dactylon, Setaria viridis, Melilotus officinalis, Erigeron canadensis, and Phragmites australis, were analyzed for their root morphological characteristics. Cynodon dactylon and Setaria viridis have shallow root systems, with a distribution depth of 0–10 cm, consisting mainly of horizontal and vertical roots. Conversely, the roots of Melilotus officinalis, Erigeron canadensis, and Phragmites australis grow deeper, with a distribution depth of 0–25 cm, 0–20 cm, and 0–20 cm, respectively. Erigeron canadensis and Phragmites australis both have strong taproots, with roots growing vertically or horizontally, while Melilotus officinalis lacks a clear taproot and has widely extending roots.
The root diameter distribution illustrated in Figure 9. Cynodon dactylon mainly consists of fine roots with a diameter of 0–1 mm; Setaria viridis has a taproot diameter between 1–2 mm and lateral root diameter of 0–1 mm; Melilotus officinalis exhibits a relatively wide root diameter distribution, ranging from 0–3 mm; Erigeron canadensis has a taproot diameter between 2–3 mm and lateral root diameter of 0–2 mm; Phragmites australis has a taproot diameter of 2–3 mm, with lateral roots distributed around the taproot in sections, with diameters ranging from 1–2 mm.
After selecting five dominant plant species, including Cynodon dactylon, Setaria viridis, Melilotus officinalis, Erigeron canadensis, and Phragmites australis, for tensile strength test, the results indicated that the root tensile strength of these five plant species decreases with the increase of root diameter, showing a negative power exponent relationship (Table 4, Figure 10).
Due to the different root diameter ranges of different plants, there is a large difference in tensile strength. The roots diameter of Cynodon dactylon ranges from 0.05 to 1.47 mm, with a tensile strength range of 6.46–165.23 Mpa; the roots diameter of Setaria viridis ranges from 0.16 to 1.2 mm, with a tensile strength range of 32.69–101.64 Mpa; the roots diameter of Melilotus officinalis ranges from 0.22 to 2.95 mm, with a tensile strength range of 7.10–126.45 Mpa; the roots diameter of Erigeron canadensis ranges from 0.15 to 3.08 mm, with a tensile strength range of 9.94–72.25 Mpa; the roots diameter of Phragmites australis ranges from 0.26 to 2.34 mm, with a tensile strength range of 10.15–85.26 Mpa. Overall, when the diameter is less than 0.2 mm, the root tensile strength of Cynodon dactylon is the highest, and when the diameter is greater than 0.2 mm, the root tensile strength of Melilotus officinalis is the highest.

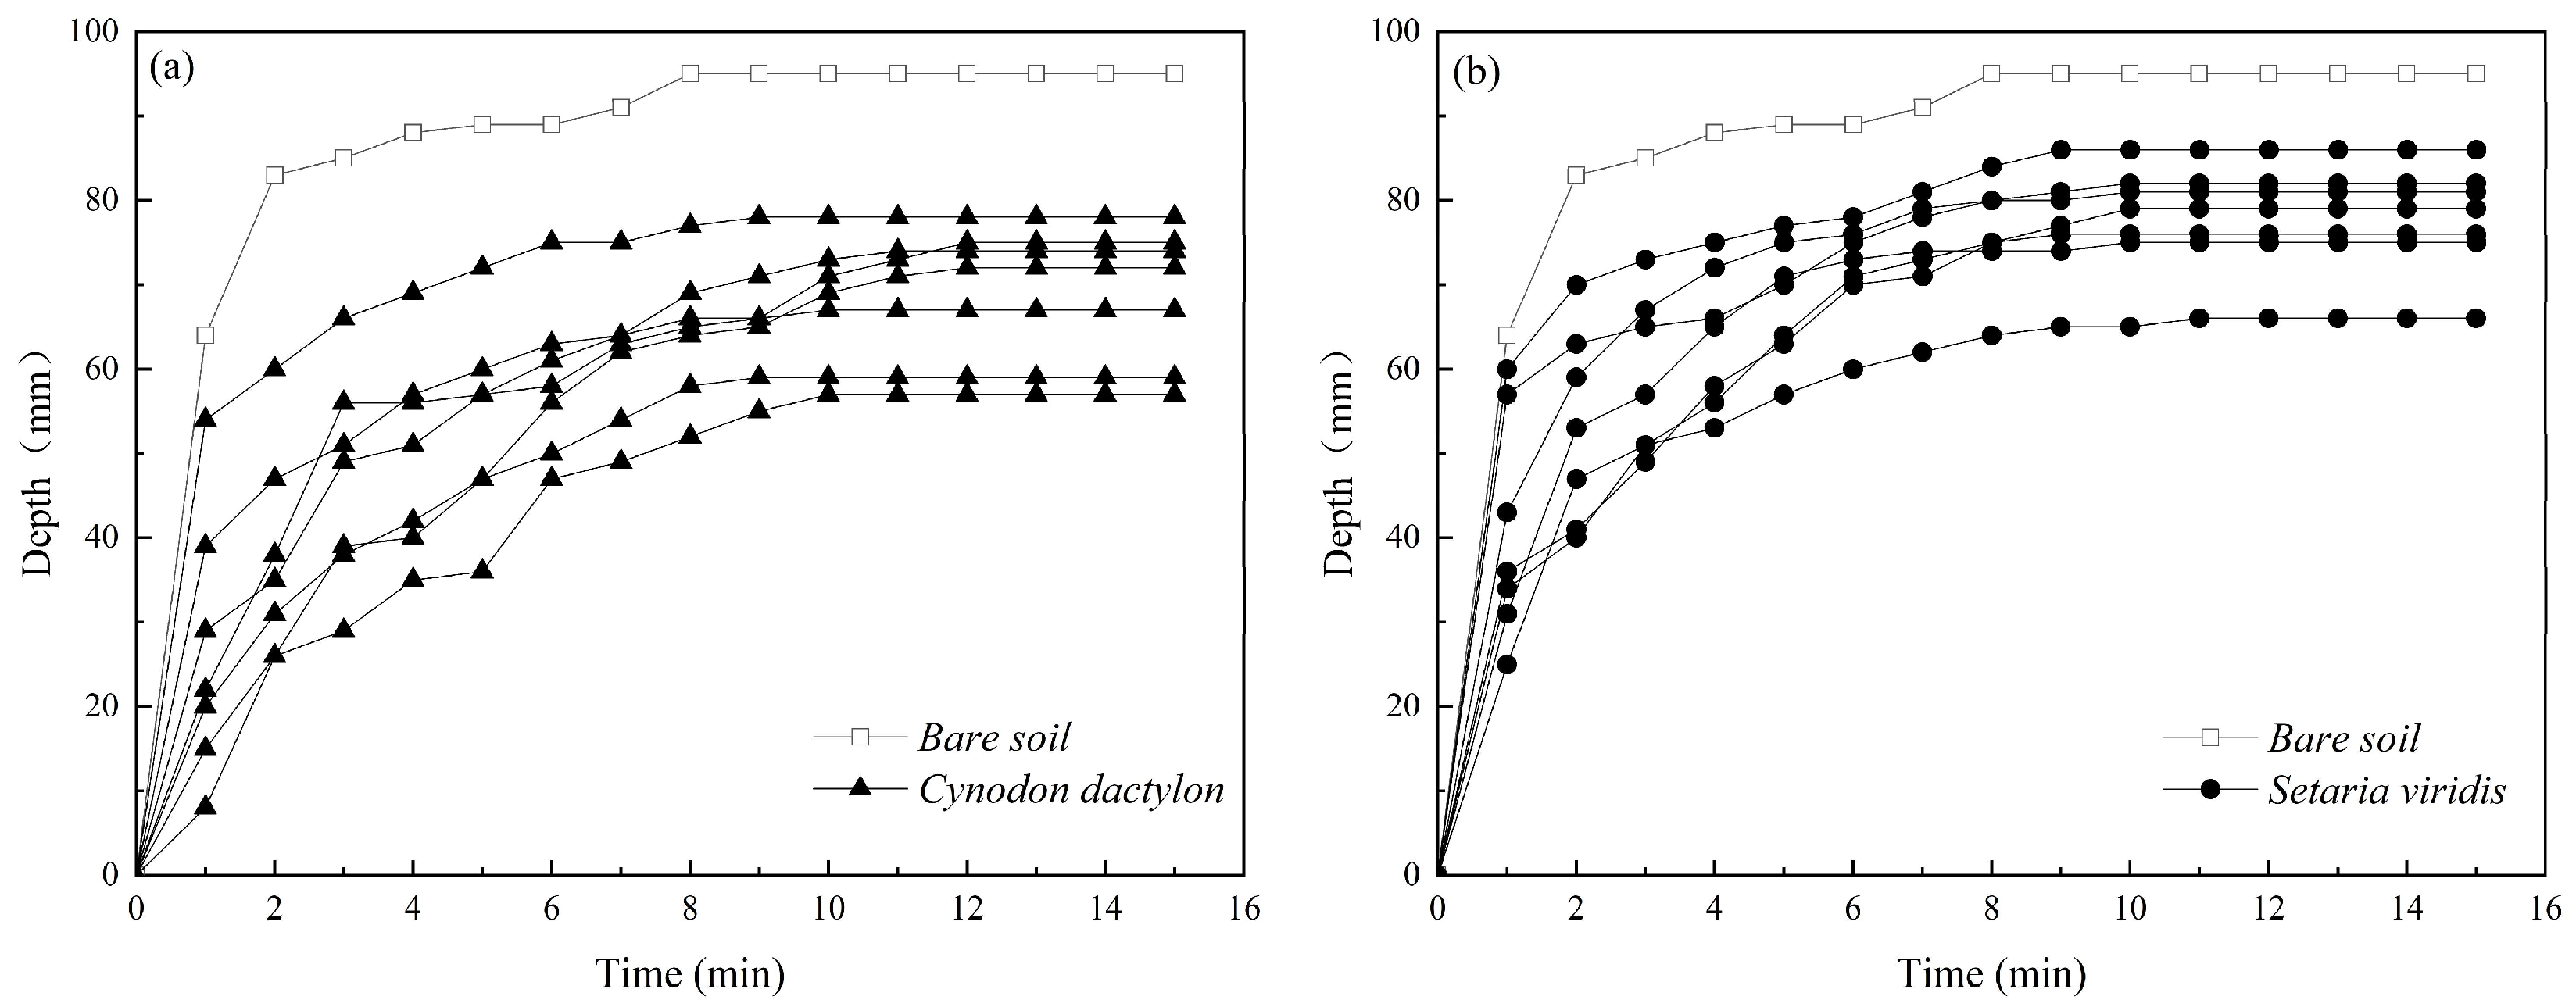
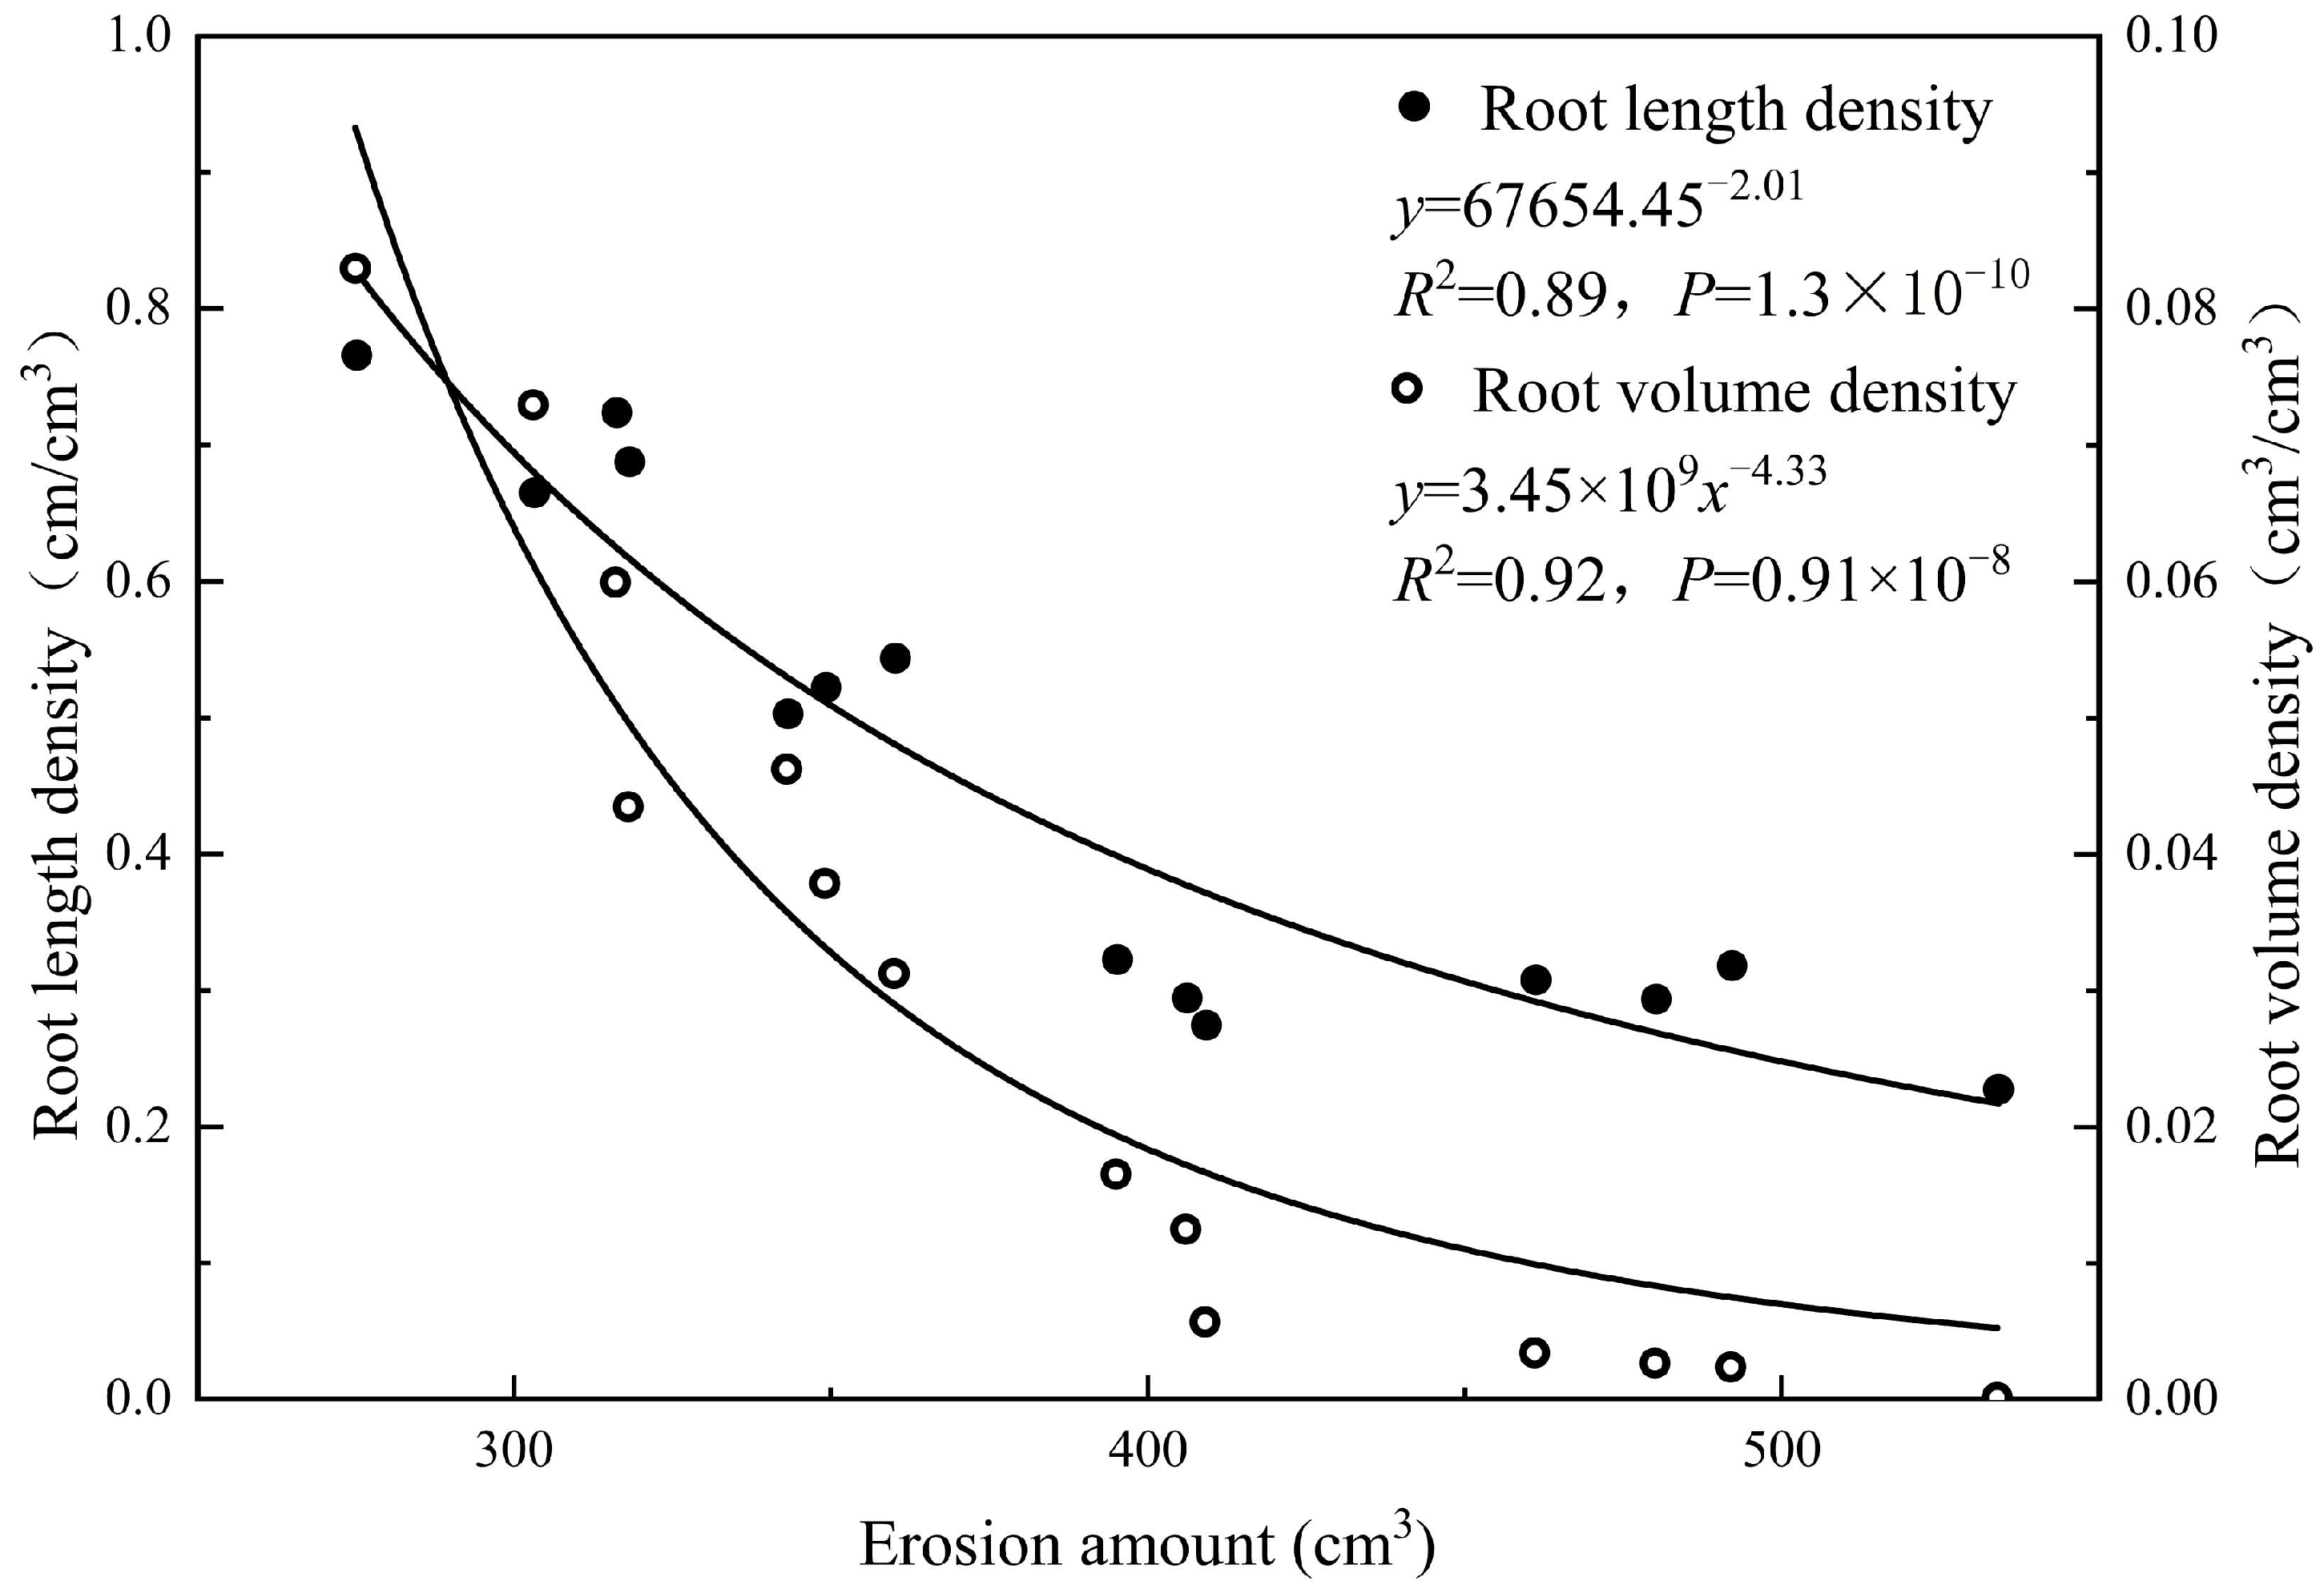
3.3. Hydraulic Effects of Roots on Scour

In this study, dominant shallow-rooted plants including Cynodon dactylon and Setaria viridis were selected for soil anti-scouribility tests, and a blank control (bare soil) was set up. The change of erosion depth over time is shown in Figure 11. In the experiment with bare soil samples, the scour hole showed a symmetrical shape, and the corresponding scour depth over time produced a relatively smooth curve. The scour depth gradually increased over time, and after 8 min, it stabilized at 95 mm. In the experiments with Cynodon dactylon and Setaria viridis, the scour hole had an irregular shape, and the corresponding scour depth over time produced a line graph with many inflection points. The scour depth gradually increased over time, and for the Cynodon dactylon samples, it stabilized after 9–12 min, ranging from 57–78 mm. For the Setaria viridis samples, the scour depth stabilized after 9–11 min, also ranging from 57–78 mm. Compared to the samples without roots, the stabilization time of the scour depth in samples with roots was delayed by 1–4 min, and the scour depth was reduced by 9–38 mm. The presence of plant roots significantly buffered the process of water flow scouring and reduced the scour depth.
The relationship between erosion mount and root biomass parameter is shown in Figure 12. The underground biomass length density of Cynodon dactylon ranges from 0.50 to 0.77 cm/cm3, and the underground biomass volume density ranges from 3.13 × 10⁻² to 8.30 × 10⁻² cm3/cm3. The underground biomass length density of Setaria viridis ranges from 0.23 to 0.32 cm/cm3, and the underground biomass volume density ranges from 1.32 × 10⁻⁴ to 1.66 × 10⁻² cm3/cm3. The length and volume density of underground biomass of Cynodon dactylon are much greater than those of Setaria viridis, with the length density being 2.17–2.41 times higher and the volume density being 5–234.84 times higher. The significant difference in length and volume density is due to the presence of a large number of underground stems in addition to the root system of Cynodon dactylon, and these stems have a larger diameter. To investigate the influence of root length and volume on soil anti-scouribility, the relationship between root length density, root volume density, and erosion amount was analyzed. The results indicated that erosion amount exhibit a nonlinear decreasing trend, with root length density and root volume density increasing.

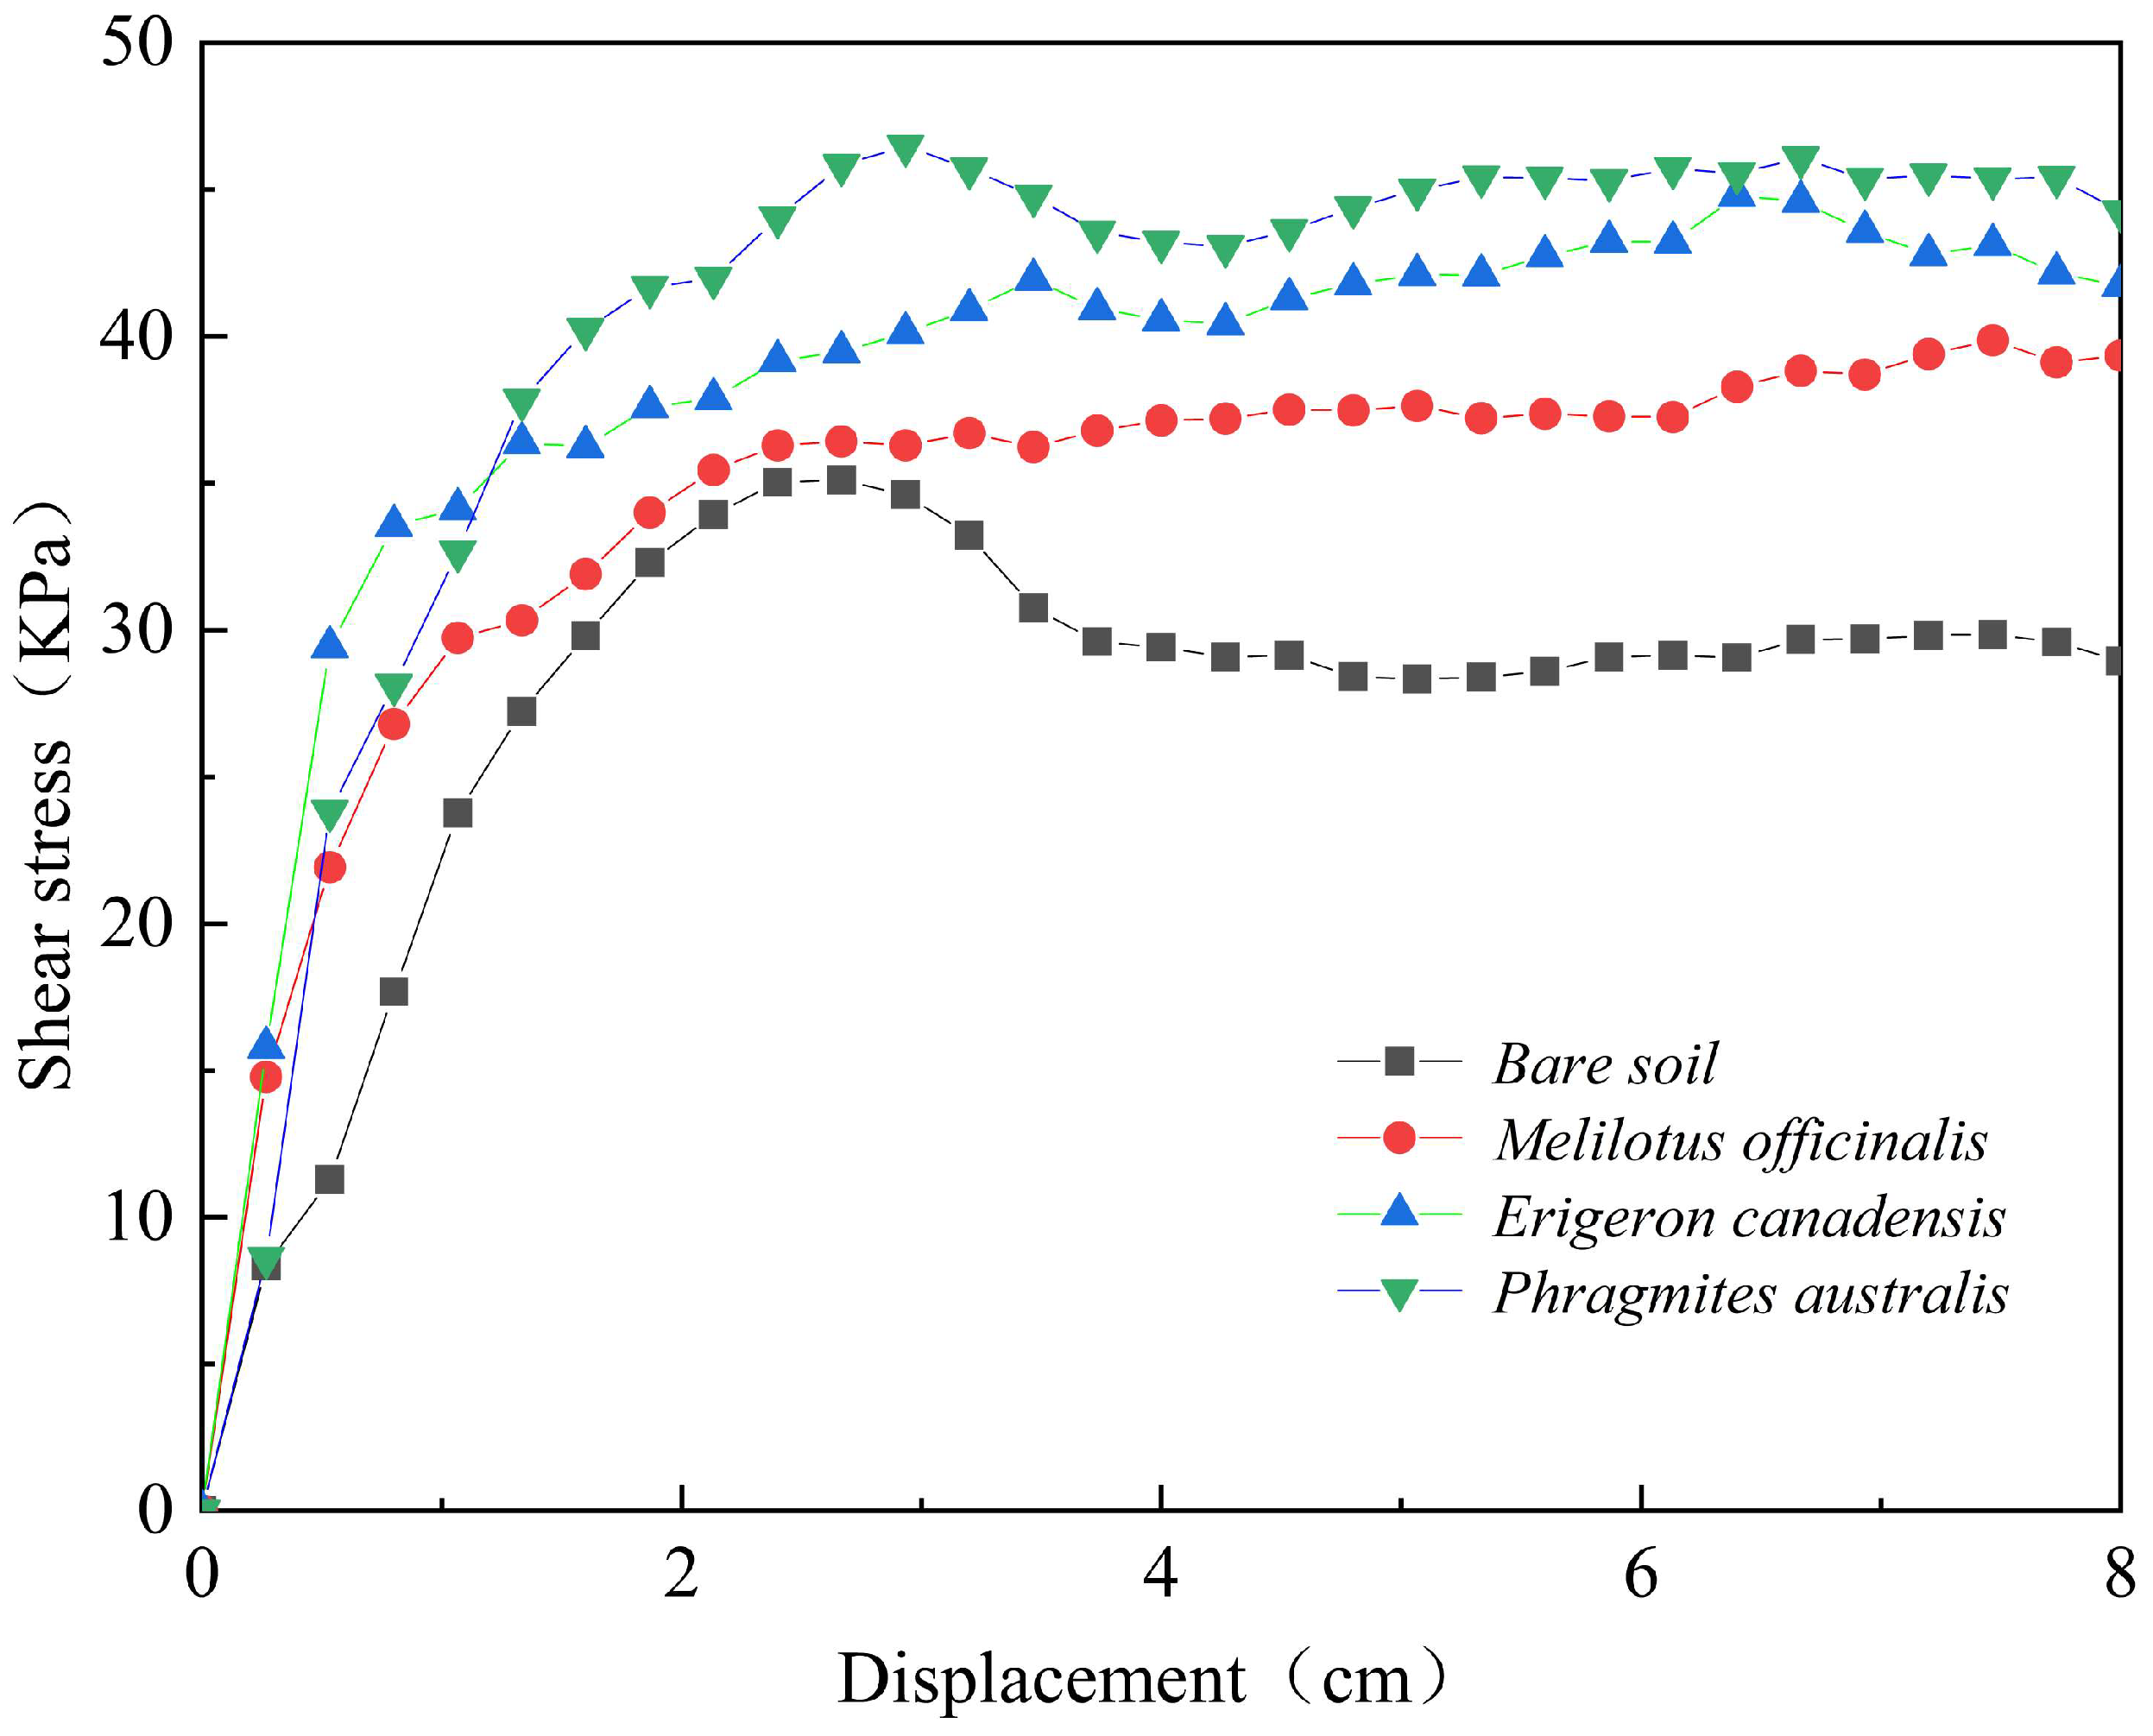
3.4. Shear Characteristics of Root–Soil Composites

In this study, dominant deep-rooted plants, including Melilotus officinalis, Erigeron canadensis, and Phragmites australis, were selected for large-box direct shear tests, with a blank control (bare soil) set up for comparison. The relationship between shear stress and displacement is shown in Figure 13. During the shear process, the shear stress of the bare soil increased rapidly with shear displacement, reaching a peak value of 35.11 kPa at 2.67 cm, then gradually decreased to a stable value between 28.34 and 29.84 kPa. For the Melilotus officinalis root–soil composite, the shear stress also increased rapidly with shear displacement, but the growth rate slowed after reaching 2.40 cm of displacement. The peak shear stress was reached at 7.47 cm, with a value of 39.87 kPa. For the Erigeron canadensis root–soil composite, the shear stress increased rapidly with the increase of shear displacement, but the growth rate slowed down after reaching a displacement of 0.8 cm. The peak shear stress value was reached at 6.40 cm, measuring 45.55 kPa. Regarding the Phragmites australis root–soil composite, the shear stress also increased rapidly with shear displacement, reaching a peak value of 46.48 kPa at 2.93 cm, and then stabilized between 44.24 and 45.70 kPa. In comparison to bare soil, the presence of roots significantly enhanced the soil’s shear resistance. This delay in shear peak displacement ranged from 0.26 to 4.8 cm, and the shear peak value increased by 4.76 to 11.37 kPa. Among all the deep-rooted plants, Phragmites australis had the most substantial strengthening effect due to their strong taproot, thus playing a vital role in resisting shear failure.
The root parameters and energy consumption are shown in Table 5: 323.51 J for the bare soil, 400.36 J for Melilotus officinalis, 450.37 J for Erigeron canadensis, and 472.66 J for Phragmites australis. The presence of plant roots effectively enhances the shear strength of soil but also increases the energy consumption during the shear process by 23.76–46.11%. The root biomass of Melilotus officinalis was 1.43 cm3, with a root area ratio of 6.67 × 10⁻³; the root biomass of Erigeron canadensis was 2.25 cm3, with a root area ratio of 3.91 × 10⁻³; and the root biomass of Phragmites australis was 1.41 cm3, with a root area ratio of 4.71 × 10⁻³. Among them, Phragmites australis consumed the most energy, Erigeron canadensis had the largest root biomass, and Melilotus officinalis had the highest root tensile strength and root area ratio. The energy consumption was positively correlated with the peak shear value, whereas the correlation between root biomass, root area ratio, root tensile strength, and peak shear value was not significant. This indicates that the morphological characteristics of the roots also significantly impact soil shear resistance. The strong taproots and segmented fine root distribution of Phragmites australis enhance the connection with the soil on both sides of the shear plane, achieving a better reinforcement effect.

4. Discussion

Biodiversity directly impacts the stability and sustainability of ecosystems and is fundamental for human survival. It provides both a basic environment and abundant resources [29]. Human activities, such as land use and its changes, are the main factors affecting biodiversity [30,31]. The results of this study show that the H, D, and E of the Lujiaba, Zhangjiawan, and Yinglong Street plots are lower than those of other plots, primarily due to heavy human interference. Zhangjiawan has multiple temporary roads and accumulated construction waste, while Yinglong Street has livestock grazing, leading to a decline in biodiversity. The Lujiaba plot is adjacent to farmland with a relatively narrow vegetation buffer zone, affected by both sample size and human interference. Regarding surrounding land-use types, there are significant differences in R and H under different land-use types, whereas the differences in D and E are not significant.
The study found that the five types of root systems exhibit a negative power law relationship with both diameter and tensile strength. This aligns with the findings of Saifuddin [32] and Fan [33], indicating that under the same root area, the reinforcement effect of fine roots is better than that of coarse roots [34,35]. The variation in root tensile strength with diameter may be related to the composition or structure of the roots. Zhu et al. [36] suggested that the tensile strength characteristics of roots within different diameter ranges are related to the content of cellulose and lignin, while Baets [34] posited that the variation in root tensile strength may be associated with the root bark.
Plant root systems can improve soil texture, increase soil aggregates and organic matter, and enhance soil anti-scouribility through network interconnection, root–soil adhesion, and biochemical interactions [37,38]. The results of this study show that as root volume density and root length density increase, soil erosion decreases. The underground biomass of the Cynodon dactylon is much greater than that of the Setaria viridis and also exhibits better anti-scouribility. There is a significant positive correlation between root length density, root volume density, and soil anti-scouribility, which is consistent with the findings of others [27,39,40,41]. The root system, formed by interweaving and entanglement in the soil during plant growth, affects the mechanical properties of the soil [42], reduces soil splashing and erosion [43,44], and to some extent improves soil anti-scouribility.
Plant roots can significantly impact the mechanical properties of the soil through their density, branching, length, volume, and tilt direction [45,46]. The presence of root systems significantly enhances the soil’s shear strength, with Phragmites australis consuming the most energy during shearing. Although the root system of the Melilotus officinalis has the best tensile characteristics, it has a higher horizontal quantity. The vertical and inclined roots can better connect the soil above and below the shearing surface, and they have a better strengthening effect on the soil’s shear resistance compared to horizontal roots [23]. The root biomass of the Erigeron canadensis is the highest, but its tensile characteristics are the worst. The study results indicate that the reinforcement effect of root systems on soils is a combined result of both tensile characteristics and morphological features. Numerous studies have shown that the influence of root systems on soil shear strength mainly comes from the tensile strength of individual roots and the friction between roots and soil [47,48,49], which is consistent with the results of this study.

5. Conclusions

Research on the biodiversity and soil reinforcement effect of vegetation buffer zones shows that human disturbance is a significant factor affecting biodiversity. The type of surrounding land use has a greater impact on Patrick richness index and Shannon–Wiener diversity index than on Simpson diversity index and Pielou uniformity index. The presence of plant roots can effectively enhance soil anti-scouribility and shear strength. Cynodon dactylon and Setaria viridis can reduce soil erosion depth by 9–38 mm and erosion volume by 20.17–58.90%. Melilotus officinalis, Erigeron canadensis, and Phragmites australis can increase the soil’s shear peak value by 4.76–11.37 kPa and energy consumption by 23.76–46.11%. To achieve both the anti-scouribility and shear resistance effects of plant roots, it is recommended to pair shallow-rooted Cynodon dactylon with deep-rooted Phragmites australis to enhance riverbank soil and water conservation.

Author Contributions

X.W. contributed to the conception and design of the research, performed the experiments, analyzed and interpreted the data, and drafted the manuscript; D.L., Z.C., J.T., Y.W. (Yunqi Wang) and Y.W. (Yanlei Wang) contributed to the conception and design of the research and critically revised the manuscript for important intellectual content; S.H., T.L., Z.Q., and Y.H. performed the experiments and analyzed the data. All authors have read and agreed to the published version of the manuscript.

Funding

This study was supported by the Chongqing Natural Science Foundation General Program (CSTB2024NSCQ-MSX1037).

Data Availability Statement

Data are contained within the article.

Acknowledgments

The help from my senior and junior fellow apprentice during quadrat surveys and shear stress tests is appreciated.

Conflicts of Interest

Author Yue Hu was employed by the company Chongqing Construction Engineering Group Co., Ltd. The remaining authors declare that the research was conducted in the absence of any commercial or financial relationships that could be construed as a potential conflict of interest.

References

  1. Naiman, R.J.; Decamps, H. The ecology of interface: Riparian zones. Annu. Rev. Ecol. Syst. 1997, 28, 621–658. [Google Scholar] [CrossRef]
  2. Guo, E.; Sun, R.; Chen, L. Main ecological service functions in riparian vegetation buffer zone: Research progress and prospects. Chin. J. Ecol. 2011, 30, 1830–1837. [Google Scholar]
  3. United States. Environmental Protection Agency. Office of Water. Guidance specifying management measures for sources of nonpoint pollution in coastal waters: Issued under the authority of Section 6217(g) of the Coastal Zone Act Reauthorization Amendments of 1990. Afr. J. Reprod. Health 2007, 11, 182–196. [Google Scholar]
  4. Nilsson, C.; Berggrea, K. Alterations of riparian ecosystems caused by river regulation. Bioscience 2000, 50, 783–793. [Google Scholar] [CrossRef]
  5. Narumalan, S.; Zhou, Y.; Jensen, J.R. Application of remote sensing and geographic information systems to the delineation and analysis of riparian buffer zones. Aquat. Bot. 1997, 58, 393–409. [Google Scholar] [CrossRef]
  6. Phillips, J.D. An evaluation of the factors determining the effectiveness of water quality buffer zones. J. Hydrol. 1989, 107, 133–145. [Google Scholar] [CrossRef]
  7. Dillaha, T.A.; Reneau, R.B.; Mostaghimi, S.; Lee, D. Vegetative Filter Strips for Agricultural Nonpoint Source Pollution Control. Trans. Am. Soc. Agric. Eng. 1989, 32, 513–519. [Google Scholar] [CrossRef]
  8. Sabater, S.; Butturini, A.; Clement, J.C.; Burt, T.; Dowrick, D.; Hefting, M.; Matre, V.; Pinay, G.; Postolache, C.; Rzepecki, M. Nitrogen removal by riparian buffers along a European climatic gradient: Patterns and factors of variation. Ecosystems 2003, 6, 20–30. [Google Scholar] [CrossRef]
  9. Hilary, B.; Chris, B.; North, B.E.; Maria, A.Z.A.; Andrew, W. Riparian buffer length is more influential than width on river water quality: A case study in southern Costa Rica. J. Environ. Manag. 2021, 286, 112132. [Google Scholar]
  10. Aguiar, T.R.; Rasera, K.; Parron, L.M.; Brito, A.G.; Ferreira, M.T. Nutrient removal effectiveness by riparian buffer zones in rural temperate watersheds: The impact of no-till crops practices. Agric. Water Manag. 2015, 149, 74–80. [Google Scholar] [CrossRef]
  11. China Wetland Vegetation Committee. Wetland Vegetation in China; Science Press: Beijing, China, 1999. [Google Scholar]
  12. Yang, F.; Wang, Y.; Chan, Z. Review of environmental conditions in the water level fluctuation zone: Perspectives on riparian vegetation engineering in the Three Gorges Reservoir. Aquat. Ecosyst. Health Manag. 2015, 18, 240–249. [Google Scholar] [CrossRef]
  13. Gu, L.; Gao, J.; Wang, Y.; Qian, B.; Wang, Y. Soil bioengineering-a new Technique to Generate Riverbank Restoration. Adv. Mater. Res. 2012, 518–523, 1795–1799. [Google Scholar] [CrossRef]
  14. Rey, F. Effectiveness of vegetation barriers for marly sediment trapping. Earth Surf. Process. Landf. 2010, 29, 1161–1169. [Google Scholar] [CrossRef]
  15. Mankin, K.R.; Ngandu, D.M.; Barden, C.J.; Hutchinson, S.L.; Geyer, W.A. Grassshrub riparian buffer removal of sediment, phosphorus, and nitrogen from simulated runoff. JAWRA J. Am. Water Resour. Assoc. 2010, 43, 1108–1116. [Google Scholar] [CrossRef]
  16. Norris, J.E.; Stokes, A.; Mickovski, S.B.; Cammeraat, E.; Achim, A. Slope Stability and Erosion Control: Ecotechnological Solutions; Springer: Dordrecht, The Netherlands, 2008. [Google Scholar]
  17. Ji, X.; Xia, G.; Zhang, H. Effects of Amorpha Fruticosa Root System on Slope Soil and Water Conservation. Hubei For. Sci. Technol. 2016, 45, 16–19. [Google Scholar]
  18. Xu, W. Anti-Scourability of the Herbaceous Root-Soil System in the Riparian Zone of the Three Gorges Reservoir, China; Chongqing Normal University: Chongqing, China, 2019. [Google Scholar]
  19. Cheng, H.; Yu, Y.; Tang, X.; Zhou, Z.; Zhao, Y. Effect of the Root Systems of Herbaceous Plant on Soil Anti-scourbility in the Riparian Area of Lower Reaches of Puyang River. Res. Soil Water Conserv. 2017, 24, 60–63+69. [Google Scholar]
  20. Shen, Z.; Li, G.; Liu, C.; Yu, D.; Hu, X.; Li, X. Study on the Root Mechanical Properties and Shear Strength of Root-Soil Composites for Four Plant Species in the Yellow River Source Region. Soil Water Conserv. China 2021, 7, 49–52. [Google Scholar]
  21. Hao, G.; Liu, X.; Zhang, Q.; Xiang, L.; Yu, B. Optimum Selection of Soil-Reinforced Herbaceous Plants Considering Plant Growth and Distribution Characteristics. J. Soil Sci. Plant Nutr. 2022, 22, 1743–1757. [Google Scholar] [CrossRef]
  22. Li, H.; Qin, H.; Zhang, H.; Li, J.; Liu, Y. Characteristics of Plant Communities in Different Herbaceous Layers of Plantation Forests in Pingshuo Coal Mine Reclamation Area. J. Shanxi Univ. (Nat. Sci. Ed.) 2023, 1–11. Available online: http://kns.cnki.net/kcms/detail/14.1105.n.20231016.0945.003.html (accessed on 1 October 2024).
  23. Li, Y.; Wang, Y.; Wang, Y.; Ma, C. Effects of Vitex negundo roo t properties on soil resistance caused by pull-out forces at different positions around the stem. Catena 2017, 158, 148–160. [Google Scholar] [CrossRef]
  24. Fan, C.C. A displacement-based model for estimating the shear resistance of root-permeated soils. Plant Soil 2012, 355, 103–119. [Google Scholar] [CrossRef]
  25. Preti, F.; Giadrossich, F. Root reinforcement and slope bioengineering stabilization by Spanish Broom (Spartium junceum L.). Hydrol. Earth Syst. Sci. Discuss 2009, 6, 1713–1726. [Google Scholar] [CrossRef]
  26. Hanson, G.J.; Simon, A. Erodibility of cohesive streambeds in the loess area of the midwestern USA. Hydrol. Process. 2001, 15, 23–38. [Google Scholar] [CrossRef]
  27. Pollen-Bankhend, N.; Simon, A. Hydrologic and hydraulic effects of riparian root networks on streambank stability: Is mechanical root-reinforcement the whole story? Geomorphology 2010, 116, 353–362. [Google Scholar] [CrossRef]
  28. Ekanayake, J.C.; Phillips, C.J. A method for stability analysis of vegetated hillslopes: An energy approach. Can. Geotech. J. 1999, 36, 1172–1184. [Google Scholar] [CrossRef]
  29. Wu, J.; Lv, J. Effects of land use change on the biodiversity. Ecol. Environ. 2008, 17, 1276–1281. [Google Scholar]
  30. Falcucci, A.; Maiorano, L.; Boitani, L. Changes in land-use/land-cover patterns in Italy and their implications for biodiversity conservation. Landsc. Ecol. 2007, 22, 617–631. [Google Scholar] [CrossRef]
  31. Marques, A.; Martins, I.S.; Kastner, T.; Plutzar, C.; Theurl, M.C.; Eisenmenger, N.; Huijbregts, M.A.J.; Wood, R.; Stadler, K.; Bruckner, M.; et al. Increasing impacts of land use on biodiversity and carbon sequestration driven by population and economic growth. Nat. Ecol. Evol. 2019, 3, 628–637. [Google Scholar]
  32. Fan, C.C.; Tsai, M.H. Spatial distribution of plant root forces in root-permeated soils subject to shear. Soil Tillage Res. 2016, 156, 1–15. [Google Scholar] [CrossRef]
  33. Saifuddin, M.; Osman, N. Evaluation of hydro-mechanical properties and root architecture of plants for soil reinforcement. Curr. Sci. A Fortn. J. Res. 2014, 107, 845–852. [Google Scholar]
  34. Adhikari, A.R.; Gautam, M.R.; Yu, Z.; Imada, S.; Acharya, K. Estimation of root cohesion for desert shrub species in the Lower Colorado riparian ecosystem and its potential for streambank stabilization. Ecol. Eng. 2013, 51, 33–44. [Google Scholar] [CrossRef]
  35. De Baets, S.; Poesen, J.; Reubens, B.; Wemans, K.; Baerdemaeker, J.D.; Muys, B. Root tensile strength and root distribution of typical Mediterranean plant species and their contribution to soil shear strength. Plant Soil 2008, 305, 207–226. [Google Scholar] [CrossRef]
  36. Zhu, J.; Wang, Y.; Wang, Y.; Zhang, H.; Li, Y.; Liu, Y. An analysis on soil physical enhancement effects of root system of pinus tabulae formis and acer truncatum based on two models. Bull. Soil Water Conserv. 2015, 35, 277–282. [Google Scholar]
  37. Liu, G. Study on soil anti-scourability and its mechanism of grassland on Loess Plateau. J. Soil Eros. Soil Water Conserv. 1998, 4, 94–97. [Google Scholar]
  38. Hudek, C.; Stanchi, S.; D’Amico, M.; Freppaz, M. Quantifying the contribution of the root system of alpine vegetation in the soil aggregate stability of moraine. Int. Soil Water Conserv. Res. 2017, 5, 36–42. [Google Scholar] [CrossRef]
  39. Gyssels, G.; Poesen, J. The importance of plant root characteristics in controlling concentrated flow erosion rates. Earth Surf. Process Landf. 2003, 28, 371–384. [Google Scholar] [CrossRef]
  40. De Baets, S.; Poesen, J.; Gyssels, G.; Knapen, A. Effects of grass roots on the erodibility of topsoils during concentrated flow. Geomorphology 2006, 76, 54–67. [Google Scholar] [CrossRef]
  41. Wu, W.; Zheng, S.; Lu, Z.; Zhang, T. Effect of Plant Roots on Penetrability and Anti-Scouri-bility of Red Soil Derived from Granite. Pedosphere 2000, 10, 183–188. [Google Scholar]
  42. Angela, G. Plants as river system engineers. Earth Surf. Process. Landf. 2014, 39, 4–25. [Google Scholar]
  43. Ding, P. The impact of root density on soil erosion and erosiveness under simulated rainfall. Hydro Sci. Cold Zone Eng. 2022, 5, 40–44. [Google Scholar]
  44. Zhang, Z. Effect of Salix Psammophyla Roots on Soil Anti-Erosion and Its Mechanisms in the Water-Wind Erosion Crisscross Region on the Loess Plateau; Northwest A&F University: Xianyang, China, 2018. [Google Scholar]
  45. Li, Z.; Ouyang, M.; Xiao, H.; Wang, J.; Li, T.; Liu, S. Improvement of slope soil consolidation capacity of plant root system based on regulation of root architecture. Rock Soil Mech. 2021, 42, 3271–3280+3290. [Google Scholar]
  46. Zhang, Y.; Li, C.; Han, S.J.; Chen, X. Root architecture of main tree species and the effects on soil reinforcement in typical black soil region. Chin. J. Appl. Ecol. 2021, 32, 1726–1734. [Google Scholar]
  47. Forster, M.; Ugarte, C.; Lamande, M.; Faucon, M.P. Root traits of crop species contributing to soil shear strength. Geoderma 2022, 409, 115642. [Google Scholar] [CrossRef]
  48. Giadrossich, F.; Schwarz, M.; Cohen, D.; Pret, F.; Or, D. Mechanical interactions between neighbouring roots during pullout tests. Plant Soil 2013, 367, 391–406. [Google Scholar] [CrossRef]
  49. Leung, F.T.Y.; Yan, W.M.; Hau, B.C.H.; Tham, L.G. Root systems of native shrubs and trees in Hong Kong and their effects on enhancing slope stability. Catena 2015, 125, 102–110. [Google Scholar] [CrossRef]
Figure 1. Location of sample plots.
Water 16 02847 g001
Figure 2. The photo of plot survey.
Water 16 02847 g002
Figure 3. Determination of root mechanical properties and morphological characteristics: (a) universal testing machine and (b) root morphology measurement.
Water 16 02847 g003
Figure 4. The erosion hole formed after erosion: (a) bare soil and (b) roots.
Water 16 02847 g004
Figure 5. Photos of root–soil composite samples and direct shear tests.
Water 16 02847 g005
Figure 6. Photos of some plant samples.
Water 16 02847 g006
Figure 7. Biodiversity Analysis of communities.
Water 16 02847 g007
Figure 8. Biodiversity analysis of different surrounding land sue.
Water 16 02847 g008
Figure 9. Root diameter distribution.
Water 16 02847 g009
Figure 10. The tensile strength of roots.
Water 16 02847 g010
Figure 11. The change of erosion depth over time. (a) Cynodon dactylon; (b) Setaria viridis.
Water 16 02847 g011
Figure 12. The relationship between erosion mount and root biomass parameter.
Water 16 02847 g012
Figure 13. Relationship between shear stress and displacement.
Water 16 02847 g013
Table 1. The Basic Situation of Sample Plots.
No.Name of Sample PlotsGeographical PositionElevation (m)Site TypeSoil TypeSurrounding Land Use
1Lujiaba105.941, 30.155231.27Soft slopeLoamArable
2Yuxingba105.899, 30.187231.60Soft slopeLoamWasteland
3Zhangjiawan105.871, 30.190231.10Soft slopeLoamVillage
4Zhongba105.798, 30.228238.87Soft slopeSandyArable
5Caojiagou105.774, 30.314261.85Soft slopeLoamForest
6Yuxi Town105.774, 30.324247.81Soft slopeSandyVillage
7Yinglong Street105.751, 30.321250.44Soft slopeSandyWasteland
8Hujiawan105.734, 30.326254.48Soft slopeSandyForest
Table 2. Vegetation List (Herbaceous) of the Riparian Buffer Zone along the Fu River.
No. PhylumClassOrderFamilyGenusSpecies
1AngiospermaePteridophytaAsteralesAsteraceaeErigeronErigeron canadensis L.
2AngiospermaePteridophytaAsteralesAsteraceaeErigeronErigeron annuus (L.) Pers.
3AngiospermaePteridophytaAsteralesAsteraceaeArtemisiaArtemisia selengensis Turcz. ex Besser
4AngiospermaePteridophytaAsteralesAsteraceaeArtemisiaArtemisia annua L.
5AngiospermaePteridophytaAsteralesAsteraceaeArtemisiaArtemisia indica Willd.
6AngiospermaePteridophytaAsteralesAsteraceaeArtemisiaArtemisia argyi H. Lév. & Vaniot
7AngiospermaePteridophytaAsteralesAsteraceaeLactucaLactuca serriola L.
8AngiospermaePteridophytaAsteralesAsteraceaeSymphyotrichumSymphyotrichum subulatum (Michx.) G. L. Nesom
9AngiospermaePteridophytaAsteralesAsteraceaeXanthiumXanthium strumarium L.
10AngiospermaePteridophytaAsteralesAsteraceaeCarpesiumCarpesium abrotanoides L.
11AngiospermaePteridophytaPoalesPoaceaeCynodonSetaria viridis (L.) P. Beauv.
12AngiospermaePteridophytaPoalesPoaceaeCynodonCynodon dactylon (L.) Persoon
13AngiospermaePteridophytaPoalesPoaceaePhragmitesPhragmites australis (Cav.) Trin. ex Steud
14AngiospermaePteridophytaPoalesTyphaceaeTyphaTypha orientalis C. Presl
15AngiospermaePteridophytaCaryophyllalesAmaranthaceaeChenopodiumChenopodium album L.
16AngiospermaePteridophytaCaryophyllalesAmaranthaceaeDysphaniaDysphania ambrosioides (L.) Mosyakin & Clemants
17AngiospermaePteridophytaCaryophyllalesAmaranthaceaeAlternantheraAlternanthera sessilis (L.) R. Br. ex DC.
18AngiospermaePteridophytaCaryophyllalesPolygonaceaeRumexRumex crispus L.
19AngiospermaePteridophytaLamialesLamiaceaeClinopodiumClinopodium chinense (Benth.) Kuntze
20AngiospermaePteridophytaLamialesLamiaceaeClinopodiumClinopodium polycephalum (Vaniot) C. Y. Wu & S. J. Hsuan ex P. S. Hsu
21AngiospermaePteridophytaLamialesLamiaceaeLeonurusLeonurus japonicus Houtt.
22AngiospermaePteridophytaFabalesFabaceaeMelilotusMelilotus officinalis (L.) Pall.
23AngiospermaePteridophytaFabalesFabaceaeGlycineGlycine soja Siebold & Zucc.
24AngiospermaePteridophytaRosalesRosaceaeDuchesneaDuchesnea indica (Andr.) Focke
25AngiospermaePteridophytaRosalesCannabaceaeHumulusHumulus scandens (Lour.) Merr.
26AngiospermaePteridophytaGentianalesApocynaceaeCynanchumCynanchum auriculatum Royle ex Wight
27AngiospermaePteridophytaBoraginalesBoraginaceaeCynoglossumCynoglossum furcatum Wall. in Roxb.
28AngiospermaePteridophytaBoraginalesBrassicaceaeRaphanusRaphanus raphanistrum L.
29AngiospermaePteridophytaContortaeLoganiaceaeBuddlejaBuddleja asiatica Lour.
30AngiospermaePteridophytaAsparagalesAsparagaceaeAnemarrhenaAnemarrhena asphodeloides Bunge
31AngiospermaePteridophytaMyrtalesOnagraceaeOenotheraOenothera rosea L’Hér. ex Aiton
32AngiospermaePteridophytaSolanalesSolanaceaeSolanumSolanum americanum Mill.
33AngiospermaePteridophytaAcoralesAraceaeAcorusAcorus calamus L.
34PteridophytaFilicopsidaPolypodialesPteridaceaePterisPteriscretica L. var.nervosa (Thunb.) Ching et S. H. Wu
35PteridophytaEquisetopsidaEquisetalesEquisetaceaeEquisetumEquisetum arvense L.
Table 3. Main Species and Important Value in Sample Plots.
No. Sample PlotsMain Species and Important Value
1LujiabaCynodon dactylon (54.8%), Raphanus raphanistrum (14.7%), Erigeron canadensis (9.9%), Melilotus officinalis (8.7%)
2YuxingbaCynodon dactylon (42.9%), Phragmites australis (16.6%), Duchesnea indica (10.0%), Melilotus officinalis (6.2%)
3ZhangjiawanCynodon dactylon (48.8%), Phragmites australis (15.6), Raphanus raphanistrum (14.2%), Erigeron Canadensis (13.4%)
4ZhongbaErigeron Canadensis (25.9%), Cynodon dactylon (25.7%), Melilotus officinalis (17.3%), Setaria viridis (16.1%)
5ZengjiagouCynodon dactylon (51.3%), Erigeron Canadensis (25.1%), Glycine soja (12.5%), Raphanus raphanistrum (3.4%)
6Yuxi TownMelilotus officinalis (32.7%), Cynodon dactylon (20.0%), Leonurus japonicas (11.2%), Raphanus raphanistrum (3.8%)
7Yinglong StreetCynodon dactylon (38.3%), Erigeron Canadensis (16.2%), Dysphania ambrosioides (14.5%), Artemisia selengensis (9.0%)
8HujiawanCynodon dactylon (53.5%), Erigeron canadensis (12.3%), Melilotus officinalis (9.6%), Leonurus japonicas (9.3%)
Table 4. Relationship Between Root Diameter and Tensile Strength.
SpeciesFunctionR2n
Cynodon dactylony = 20.38x−0.750.7860
Setaria viridisy = 44.73x−0.470.6655
Melilotus officinalisy = 49.61x−0.630.7153
Erigeron canadensisy = 23.00x−0.590.6354
Phragmites australisy = 23.18x−0.910.7462
Table 5. Root Parameters and Energy Consumption.
SpeciesEnergy Consumption (J)Root Biomass (cm3)Root Area Ratio (%)
Bare soil323.5100
Melilotus officinalis400.361.436.67 × 10−3
Erigeron canadensis450.372.253.91 × 10−3
Phragmites australis472.661.414.71 × 10−3
Disclaimer/Publisher’s Note: The statements, opinions and data contained in all publications are solely those of the individual author(s) and contributor(s) and not of MDPI and/or the editor(s). MDPI and/or the editor(s) disclaim responsibility for any injury to people or property resulting from any ideas, methods, instructions or products referred to in the content.

