Article

Succession Characteristics and Influencing Factors of Phytoplankton Communities in Qionghai Lake

1
State Environmental Protection Key Laboratory of Drinking Water Source Protection, Chinese Research Academy of Environmental Sciences, Beijing 100012, China
2
National Engineering Laboratory for Lake Pollution Control and Ecological Restoration, Chinese Research Academy of Environmental Sciences, Beijing 100012, China
3
State Environmental Protection Scientific Observation and Research Station for Lake Dongting, Chinese Research Academy of Environmental Sciences, Beijing 100012, China
4
School of Ecological and Environmental Sciences, East China Normal University, Shanghai 200241, China
5
School of Animal Science, Xichang University, Xichang 615000, China
*
Author to whom correspondence should be addressed.
Water 2024, 16(2), 229; https://doi.org/10.3390/w16020229
Submission received: 20 November 2023 / Revised: 27 December 2023 / Accepted: 5 January 2024 / Published: 9 January 2024

Abstract

:
The phytoplankton population of Qionghai Lake was surveyed in December 2015, March 2016, June 2016, September 2016, and March 2017. A total of 196 species (including varieties) belonging to 77 genera of 7 phyla were identified. The phytoplankton communities were dominated by Chlorophyta and diatoms, and there were significant differences across the five sampling sites. The phytoplankton abundance, which ranged between 13.85 × 10⁴ and 335.54 × 10⁴ cells·L−1, was significantly higher in spring and summer than in autumn and winter. Chlorella sp. and Cyclotella sp. were the dominant populations, and their dominance degree reached as high as 0.54 and 0.33, respectively. The diversity of the phytoplankton populations was significantly higher in spring and summer than in autumn and winter, and the Shannon–Wiener index and Margalef index ranged from 2.49–3.65 and 2.47–3.10, respectively. The water quality of Qionghai Lake was generally good. The trophic level index was between 30 and 60, showing that the water body was overall in a mesotrophic to slightly eutrophic state. The Spearman correlation analyses revealed that ammonium nitrogen (NH4+-N), water temperature (WT), permanganate index (CODMn), and transparency (SD) were the most important environmental factors that influenced the phytoplankton communities. For example, NH4+-N was significantly correlated with Chroococcus sp. (r = 0.41, p < 0.05) and Cryptomonas ovata Ehrenberg (r = 0.45, p < 0.05), and WT was significantly correlated with Cryptomonas marssonii Skuja (r = 0.43, p < 0.05) and Cryptomonas ovata (r = 0.53, p < 0.01).

1. Introduction

Phytoplankton is typically the main producer in the food chain of aquatic ecosystems. As they have a short life cycle and their community structures vary with the changes in the physical and chemical properties of the water body, they are widely used as indicators to evaluate the quality of the water environment in aquatic ecosystems [1,2,3,4,5]. Excessive growth of cyanobacteria can damage ecosystems and reduce biodiversity [6]. For example, in recent years, cyanobacterial blooms have been a difficult environmental problem caused by the excessive growth of cyanobacteria [7]. The high bloom densities of cyanobacteria have many adverse effects, such as worsening water quality, lower transparency, and the degradation of aquatic vegetation, all of which damage the stability of lake ecosystems [8]. In recent decades, researchers have focused on phytoplankton community structures and generally believed that the accumulation of nutrients is the driving force for cyanobacteria outbreaks and water blooms in lakes [9,10]. However, some studies have found that merely reducing nutrient concentrations does not reduce the abundance of cyanobacteria [11]. For example, over the past 10 years, the nutrient level has dropped significantly in the Taihu Lake Basin, but the area and frequency of cyanobacterial blooms have not decreased [12]. Clearly, nutrients are not the only determinant of growth of cyanobacteria. Existing studies have revealed that phytoplankton communities are affected by many environmental factors, such as water temperature, chemical oxygen demand, nutrients, pH, water level, transparency, and water retention time [13,14,15,16,17,18,19,20,21,22,23,24,25]. In-depth studies of the phytoplankton community structures and their evolution will help to understand the structure and function of lake ecosystems.
Existing research on the phytoplankton in Qionghai Lake has mainly focused on the composition and diversity of the phytoplankton communities [26,27,28]. Therefore, in this study, we investigated the phytoplankton community structure and water quality of the Qionghai Lake Basin from 2015 to 2017. The purpose of this study was to (1) clarify the structure, distribution, diversity, and evolution of the phytoplankton communities in Qionghai Lake; (2) determine the key environmental factors that affect the phytoplankton community structures, dominant taxa, and diversity in Qionghai Lake. This work concludes with recommendations for the local authority, as appropriate measures need to be taken to address the current problems and safeguard the water ecological environment. The conclusions from this research may be useful for the protection of other lakes around the world.

2. Materials and Methods

2.1. Study Area

Qionghai Lake is about 3 km to the southeast of Xichang City in Sichuan Province of China. It is the second largest freshwater lake in Sichuan Province. The Qionghai Basin covers five townships (Xijiao, Daqing, Hainan, Daxing, Gaojian) and one town (Chuanxing) under the jurisdiction of Xichang City, as well as parts of Pushi Township and Mazengyiwu Township in Zhaojue County and part of Donghe Township in Xide County. Qionghai Lake is known as the “Mother Lake” of Xichang City. It provides not only the water supply to the residents of Xichang City and the Qionghai Lake Basin area but also multiple other functions, including tourism, irrigation, farming, environmental purification, and regional climate regulation. It is therefore very important in the social and economic development of Xichang and the Qionghai basin. Qionghai is a typical plateau lake like Dianchi Lake, Erhai Lake, Fuxian Lake, Chenghai Lake, Lugu Lake, Qilu Lake, Yilong Lake, Xingyun Lake, Yangzonghai Lake in Yunnan Province and Caohai Lake in Guizhou Province. It has a long water exchange cycle that can cause easy accumulation of pollutants, and it features high species diversity and specificity and a relatively fragile ecosystem [29,30]. The water environment of Qionghai Lake is generally in good status, but it is experiencing some deterioration in recent years due to the sedimentation, pollution, and soil erosion caused by large-scale land reclamation and disorderly development.
Qionghai Lake belongs to the Yangtze River Basin and the Yalong River water system. The lake has an L-shaped surface with a circumference of 35 km. It spans 11.5 km from north to south and 5.5 km from east to west. The elevation is 1507.14–1509.28 m at the water surface. The bottom of the lake is relatively flat, but the surrounding area of the underwater terrain has large slope changes, and the terrain in the northeast is complex.
In 2015, the lake surface was 31 km2, the drainage area was 310.5 km2, the lake recharge coefficient was 9.97, the lake shoreline was 37.55 km, the average water depth was 11 m, the maximum water depth was 18 m, the water exchange cycle was 834 days, and the water storage capacity was 3.0 × 10⁸ m3.

2.2. Methods

In total, five sampling sites were set up in the current study (Figure 1, Table 1). Water and phytoplankton samples were collected at different times from 2015 to 2017, i.e., in December 2015, March, June, September 2016, and March 2017.
At each site, water was collected from each designated water layer and mix and set to 1000 ml, and immediately fixed by the addition of Lugol’s solution (15 mL). The surface water samples (2 L) collected from each site were used to measure the water chemistry. The pH, water temperature (WT), and dissolved oxygen (DO) were measured on site using a portable pH meter and a water quality multi-parameter analyzer (YSI). The transparency (SD) of the water samples was measured using a Secchi disk.
The methods in “Water and Wastewater Monitoring and Analysis Methods” were used to characterize the collected water samples [31]. Specifically, the permanganate index (CODMn) was measured by the acidic potassium permanganate method. The total nitrogen (TN) was measured by the alkaline potassium persulfate–UV spectrophotometry method. The total phosphorus (TP) was determined by the ammonium molybdate spectrophotometry method. The ammonium nitrogen (NH4+-N) was determined by Nessler’s reagent spectrophotometry method. Chlorophyll a (Chla) was determined spectrophotometrically after acetone extraction. In addition, the phytoplankton in the collected water samples were identified and classified according to a previously described method [32] and AlgaeBase (http://www.algaebase.org/; accessed on 1 July 2022). Specifically, a 0.1 L aliquot of an evenly shaken concentrated phytoplankton sample was placed in the plankton counting box, and about 300 cells were counted using a microscope at 400× magnification (40× on the lens and 10× on the eyepiece) and identified to the lowest taxonomic level (genus or species) [33].

2.3. Data Analysis

2.3.1. Diversity Index and Dominance Analysis

The Margalef index was calculated as
d = S 1 / ln N
where d is the richness index, S is the total number of species, and N is the total number of phytoplankton individuals.
The Shannon–Wiener diversity index was calculated as
H = i = 1 S n i / n l n n i / n
where H′ is the Shannon–Wiener diversity index, n is the total number of phytoplankton individuals, S is the total number of species, and ni is the number of phytoplankton individuals for species i.
The dominance degree of a species was calculated based on the frequency of its occurrence and the number of its individuals [34]:
y = fi × Pi
where y is the dominance degree, fi is the occurrence frequency of the i-th species, and Pi is the ratio of the number of individuals of species i to the total number of individuals. A species was considered dominant when y > 0.02 [35].

2.3.2. Trophic Level of the Water Body

The trophic level of the water body was calculated as follows:
Σ T L I = j = 1 m W j · T L I ( j )
where ΣTLI is the comprehensive trophic level index, TLI(j) is the trophic level index of the j-th parameter, and Wj is the weight of TLI(j). The TLI parameters include Chla, TP, TN, SD, and CODMn. The grading methods and the calculation of indexes and weights are based on the literature [36].

2.3.3. Statistical Analysis

All analyses were implemented with the R language (version 4.1.3). The Spearman correlation coefficient was calculated, using the “psych” package, between the environmental factors and the response variables, including the abundance of dominant species, the concentration of Chla, the phytoplankton abundance, the diversity indexes, and the TLI. Multivariable regression models were established, using the “Relaimpo” package, to fit the environmental factors and the response variables and to explain their differences. The contribution of the main environmental factors to the response variable was evaluated by variance decomposition analysis using the “MASS” package. The results were visualized using the “ggplot2” package.

3. Results and Analysis
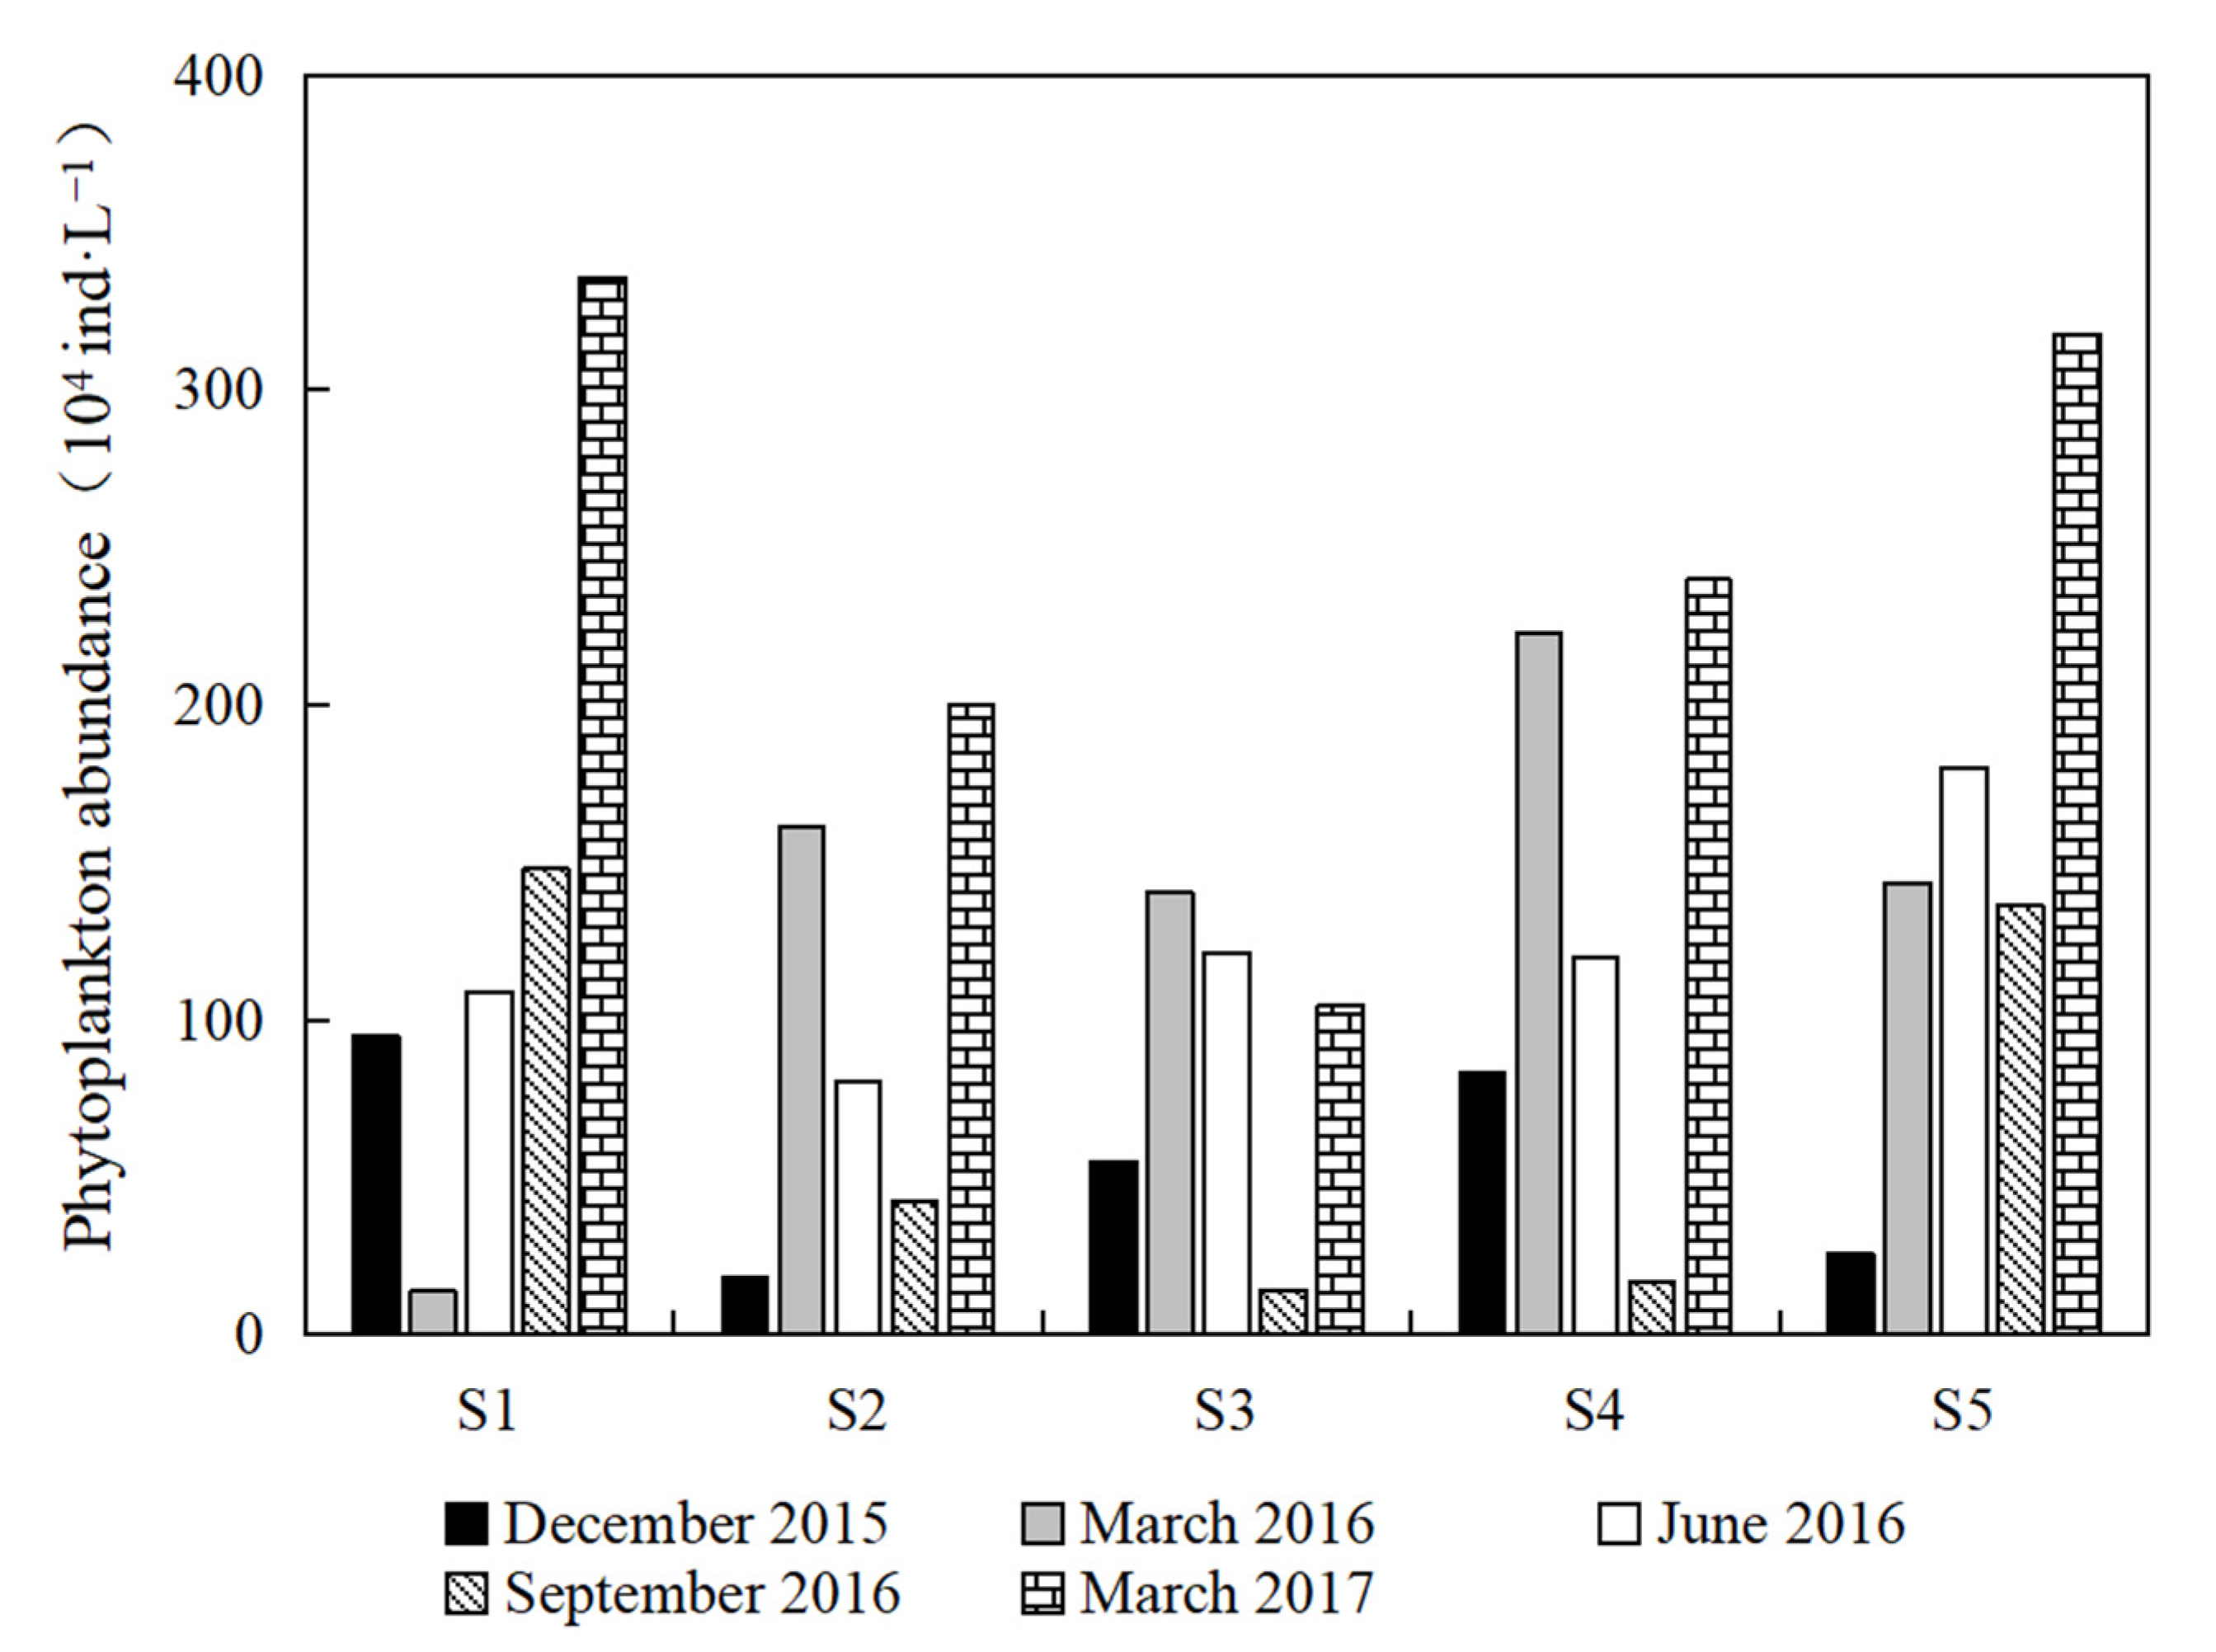
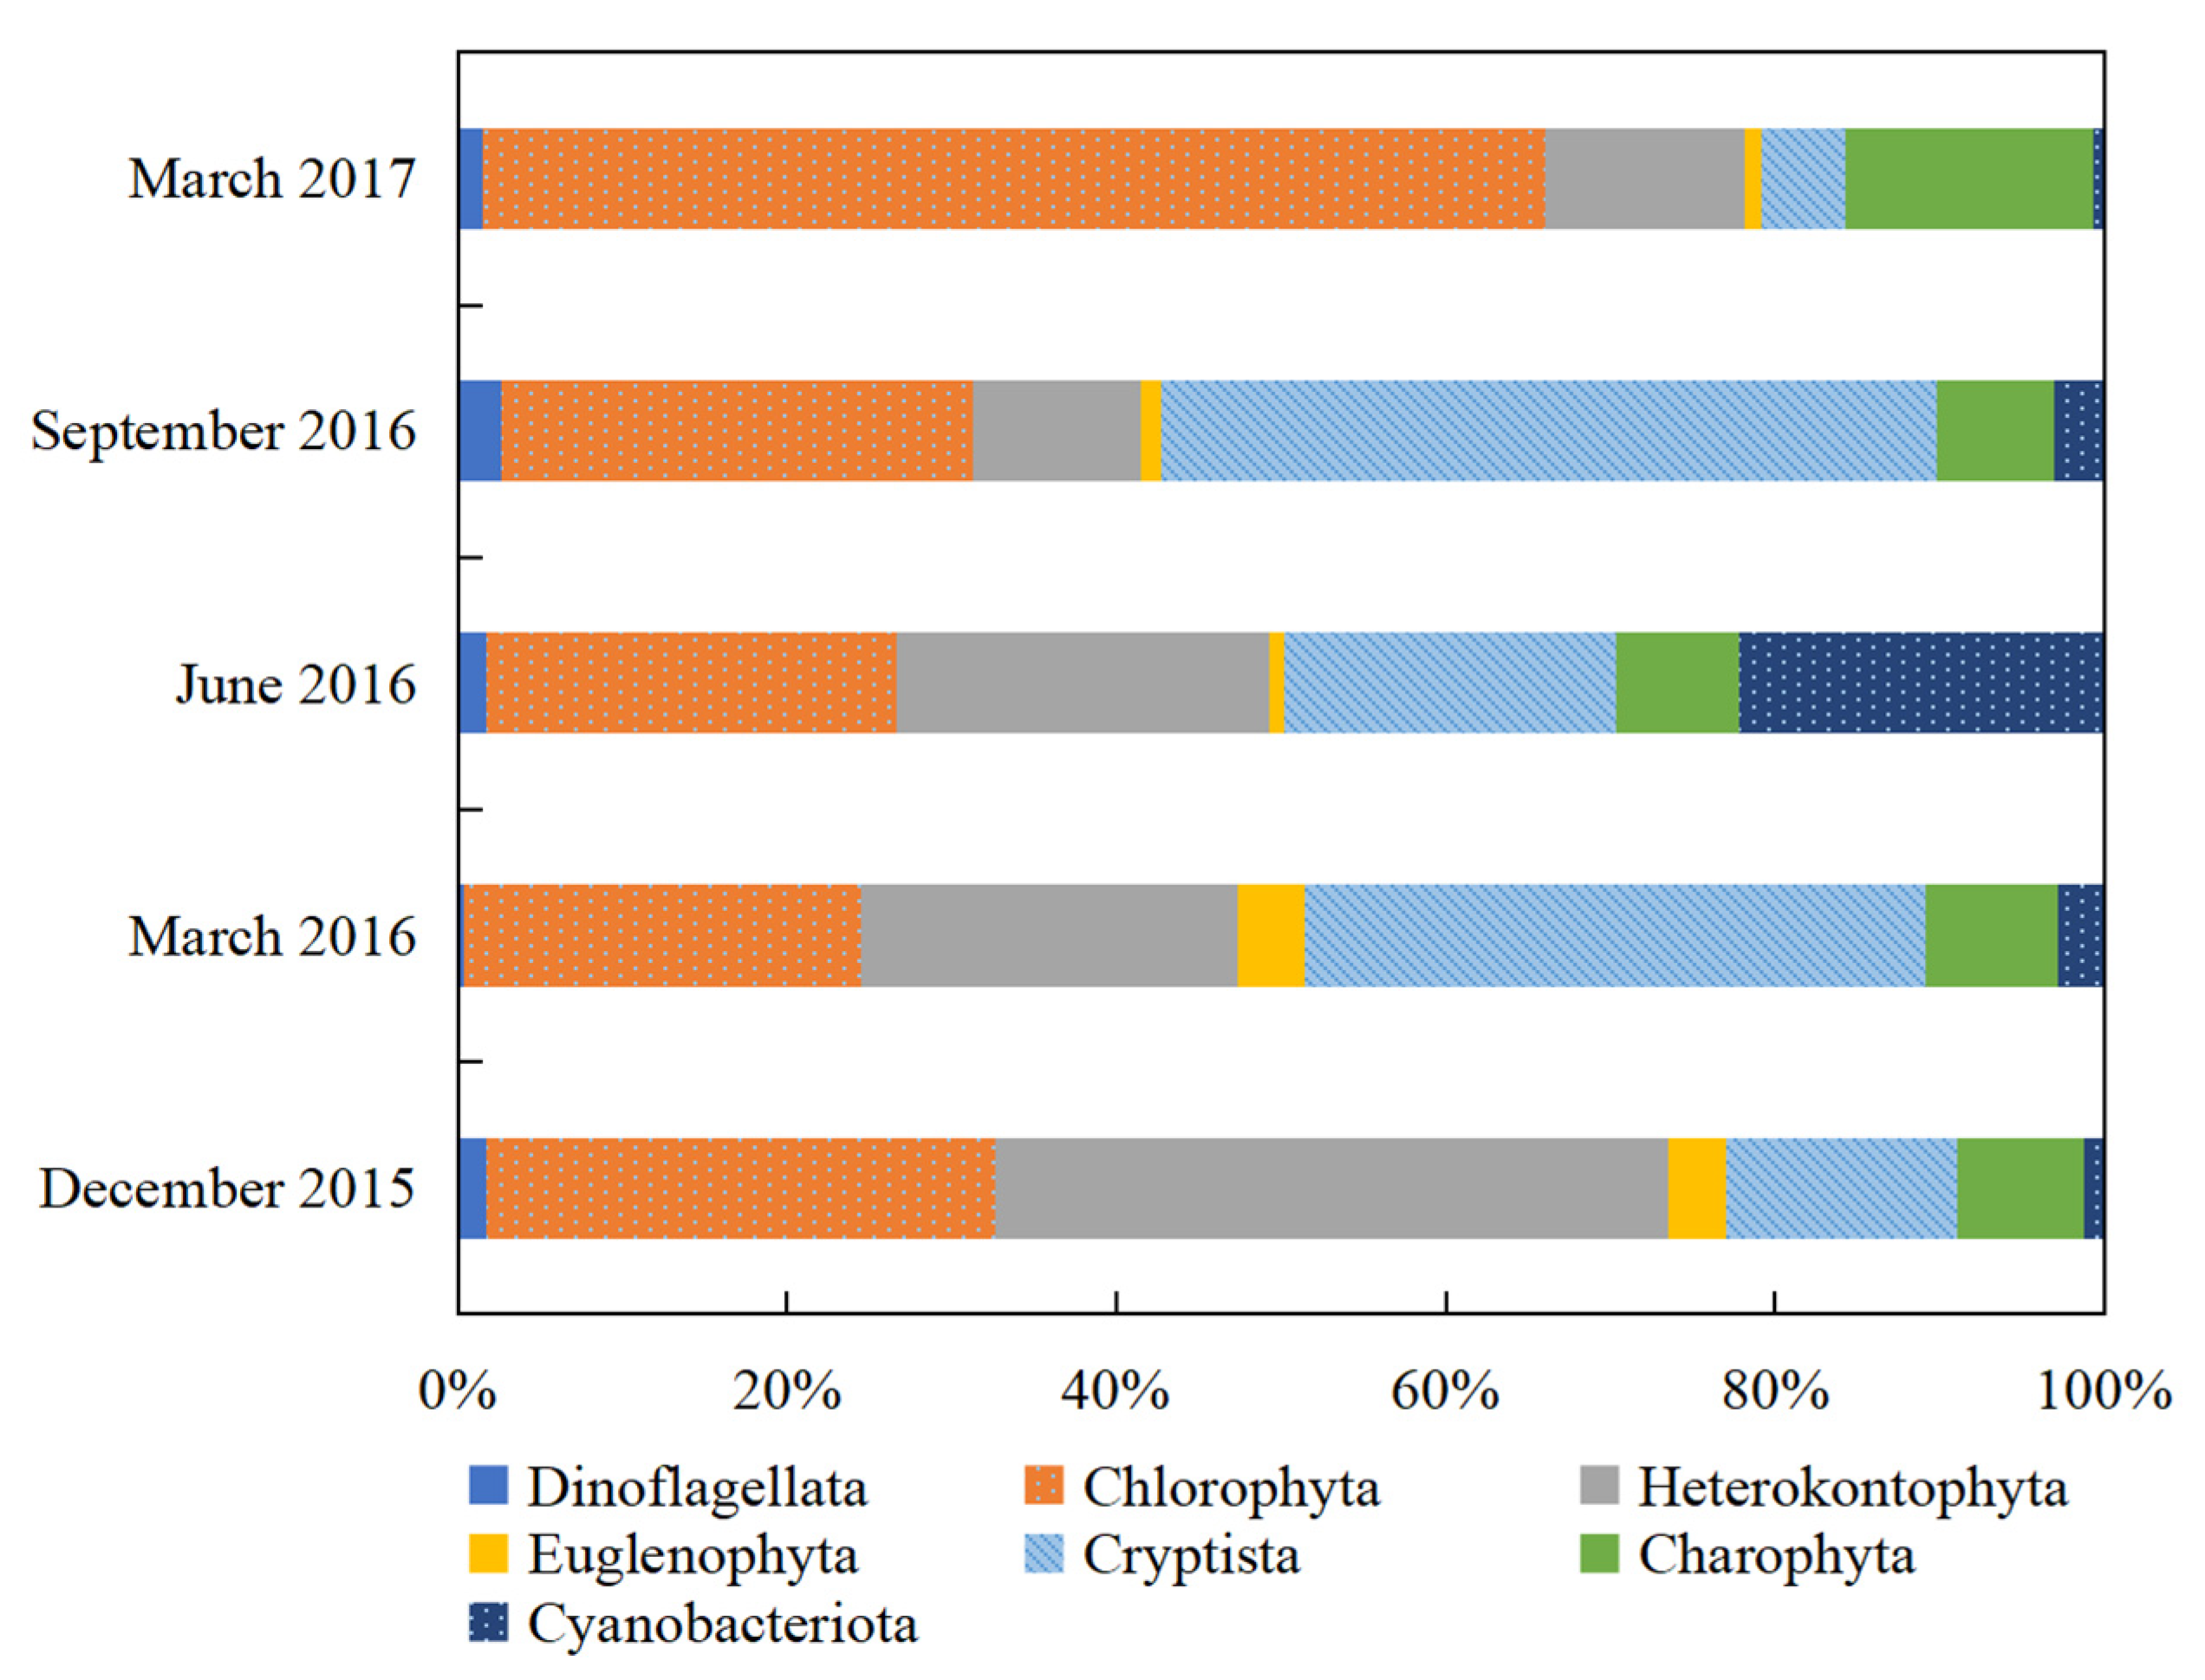
3.1. Composition

In the five surveys from 2015 to 2017, a total of 196 phytoplankton species (including variants) from 77 genera and 7 phyla were detected (Table 2). Among them, the most abundant phylum was Chlorophyta (76 species, 38.8%), followed by Heterokontophyta (39 species, 19.9%; containing diatoms 30 species, chrysophytes 7 species and xanthophytes 2 species), Cyanobacteriota (28 species, 14.3%), Charophyta (25 species, 12.8%), Euglenophyta (15 species, 7.7%), Cryptista (8 species, 4.1%), and Dinoflagellata (5 species, 2.6%).
Figure 2 illustrates the changes of the phytoplankton abundance from 2015 to 2017. In December 2015, the phytoplankton abundance ranged from 17.99 × 10⁴ to 94.88 × 10⁴ cells·L−1, with the maximum at TJB (S1) and the minimum at QLB (S2). In March 2016, the phytoplankton abundance ranged from 13.85 × 10⁴ to 222.62 × 10⁴ cells·L−1, with the maximum at HNT (S4) and the minimum at TJB (S1). In June 2016, the phytoplankton abundance ranged from 80.44 × 10⁴ to 180.03 × 10⁴ cells·L−1, with the maximum at BWP (S5) and the minimum at QLB (S2). In September 2016, the phytoplankton abundance ranged from 13.98 × 10⁴ to 147.89 × 10⁴ cells·L−1, with the maximum at TJB (S1) and the minimum at CQL (S3). In March 2017, the phytoplankton abundance ranged from 104.53 × 10⁴ to 335.54 × 10⁴ cells·L−1, with the maximum at TJB (S1) and the minimum at CQL (S3). Overall, the phytoplankton abundance varied a lot across seasons. It was higher in spring and summer and lower in autumn and winter, with the lowest in December 2015 and the highest in March 2017.
Figure 3 illustrates the changes in the composition of the phytoplankton species from 2015 to 2017. Qionghai Lake was dominated by Chlorophyta, which on average had a phytoplankton abundance of 50.58 × 10⁴ cells·L−1 and accounted for 34.62% of the total phytoplankton. The phytoplankton abundance of Chlorophyta was the highest in March 2017. Cryptista on average had a phytoplankton abundance of 25.97 × 10⁴ cells·L−1 and accounted for 24.82% of the total phytoplankton, and its phytoplankton abundance was the highest in September 2016. Diatoms on average had a phytoplankton abundance of 21.48 × 10⁴ cells·L−1 and accounted for 20.06% of the total phytoplankton, and their phytoplankton abundance was the highest in December 2015. Other phytoplankton were much fewer. It is worth noting that in June 2016, Cyanobacteriota accounted for 22.2% of the total phytoplankton and was significantly more abundant than in other seasons.
Figure 4 shows the dominant phytoplankton species for each sampling time. Both Chlorella sp. and Cyclotella sp. were unambiguously dominant, and they appeared throughout the five sampling times. The dominance degree reached a maximum of 0.54 in March 2017 for Chlorella sp. and 0.33 in December 2015 for Cyclotella sp. In addition, both Cryptomonas ovata and Cryptomonas erosa appeared in three of the five sampling times. The results agree well with the findings of Figure 3. It is worth noting that the dominance degree reached 0.17 for Komma caudata in March 2016 and 0.14 for Quadrigula chodatii in March 2017, but both species appeared with a remarkable dominance degree only once.

3.2. Diversity

In terms of spatial distribution, the Margalef index (d) of the phytoplankton ranged from 2.63–2.84, and the Shannon–Wiener index (H′) ranged from 2.92–3.17. The center of the lake (S3) had higher phytoplankton diversity than the two bay areas (S1 and S2). In terms of temporal distribution, the Margalef index (d) ranged from 2.47–3.10, and the Shannon–Wiener index (H′) ranged from 2.49–3.65. The diversity was clearly higher in spring and summer than in autumn and winter. Overall, both diversity indexes exhibited the same trend (Figure 5).

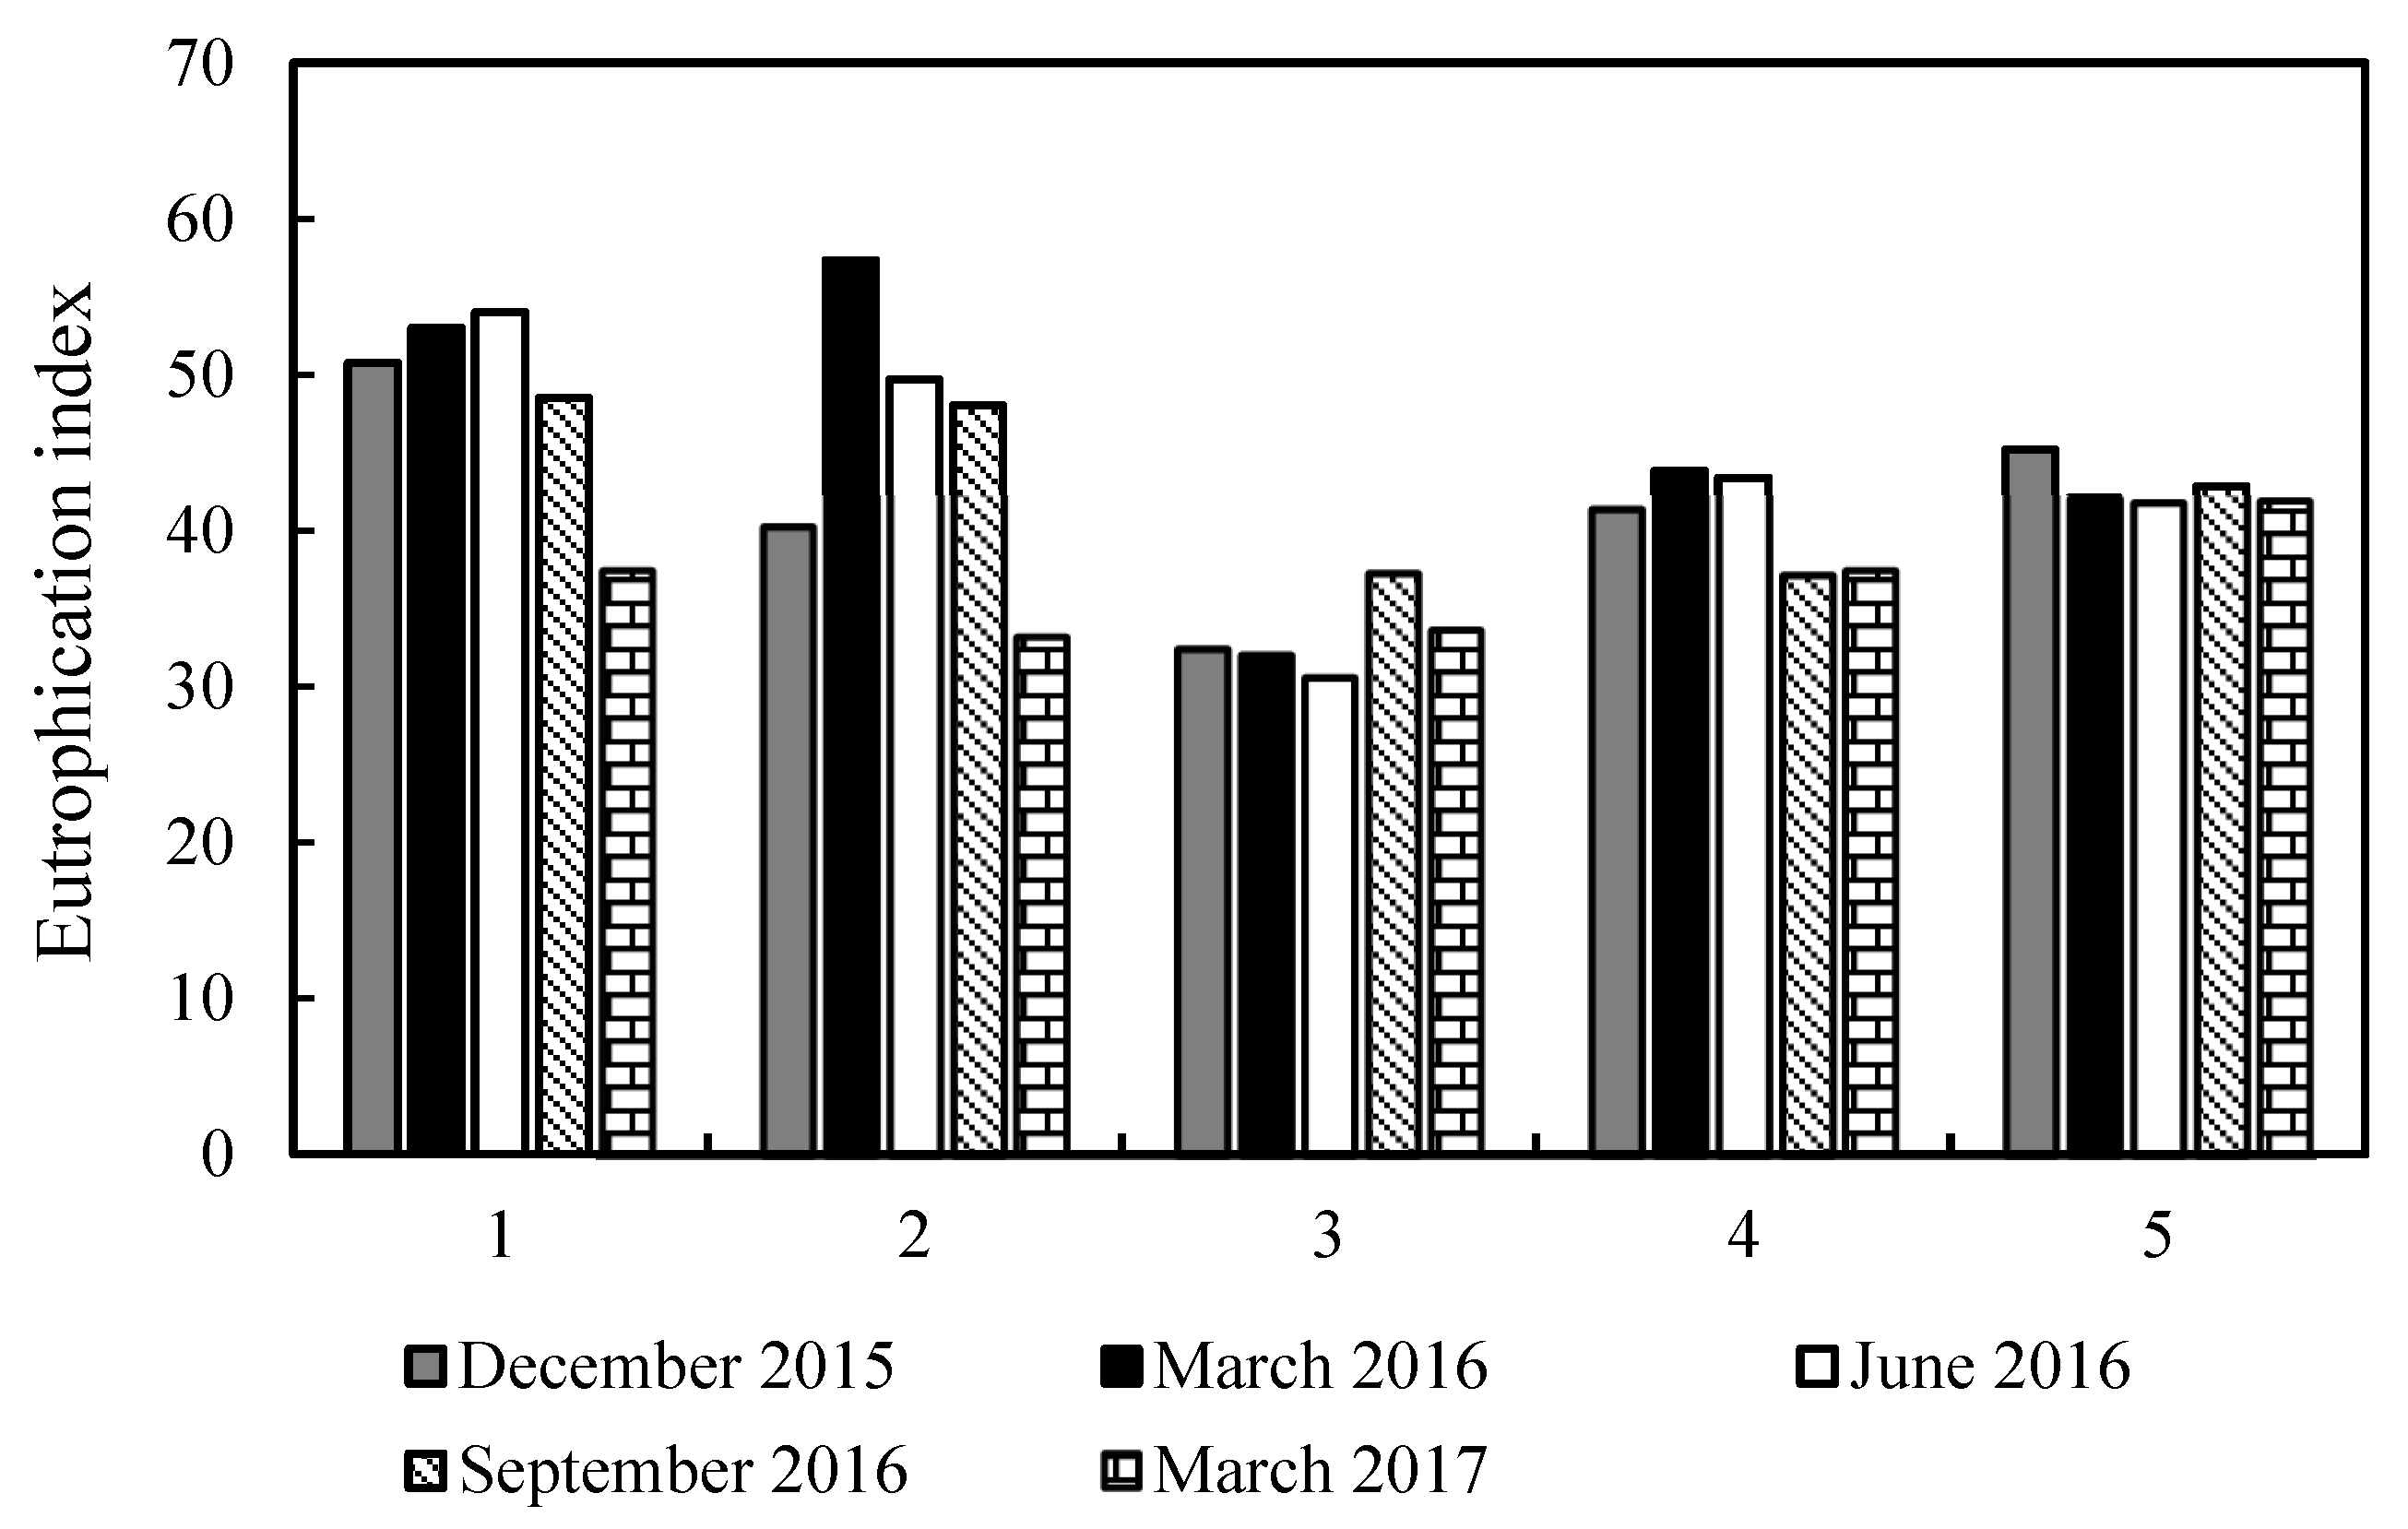
3.3. Trophic Level of the Water Body

The trophic level index was between 30 and 60 at all sampling sites. Hence, the overall trophic level of Qionghai Lake could be classified as mesotrophic to slightly eutrophic. The lake center (S3) had a much lower trophic level index and was nearly oligotrophic. The two bay areas (S1 and S2) had the highest trophic levels and were slightly eutrophic in spring and summer. The other two sites (S4 and S5) were generally mesotrophic (Figure 6).

3.4. Correlations between Phytoplankton and Environmental Factors

The Chla was best explained by the environmental factors, followed by the Shannon diversity index and the phytoplankton abundance. There were significant differences among the environmental factors (p < 0.05). Significant positive correlations existed between Chla and CODMn (r = 0.55, p < 0.01), NH4+-N (r = 0.4, p < 0.05), or water temperature (WT) (r = 0.35, p < 0.05), as well as between the phytoplankton species and DO (r = 0.35, p < 0.05). There was also some influence from TN, TP, and SD (Figure 7A).
The environmental factors could best explain the variation of Cyclotella sp., for which extremely significant differences existed between environmental factors (p < 0.001), followed by Eudorina sp. (p < 0.05) and Synedra sp. For example, significant correlations existed between NH4+-N and Chroococcus sp. (r = 0.41, p < 0.05) and Cryptomonas ovata (r = 0.45, p < 0.05), WT and Pantocsekiella ocellata (r = 0.43, p < 0.05) and Cryptophyta ovata (r = 0.53, p < 0.01), DO and Cyclotella sp. (r = 0.41, p < 0.05), as well as CODMn and Synedra sp. (r = 0.42, p < 0.05). There was also an influence from SD. Overall, the key factors that influenced the distribution of the phytoplankton in Qionghai Lake included NH4+-N, WT, CODMn, and SD (Figure 7B).

4. Discussions

4.1. Community Characteristics

The results revealed obvious spatial and temporal differences in the distribution of phytoplankton populations in the study region. The phytoplankton communities were dominated by Chlorophyta, followed by Cryptista and diatoms. The bay areas (S1 and S2) had significantly higher phytoplankton abundance than the lake center (S3). The 1989–1992 survey by Peng et al. [26] reported that, in Qionghai Lake, diatoms and Chlorophyta accounted for 52.17% and 23.91% of the total phytoplankton, respectively, whereas the 1993 survey by Yao et al. [27] reported that Chlorophyta and diatoms accounted for 42.4% and 31.3% of the total phytoplankton, respectively. Compared to Yao’s survey (99 species and variants from 68 genera and 8 phyla), the current study found a similar number of phytoplankton genera but a rather different number of phytoplankton species (varieties). It could be argued that the structures of the phytoplankton communities in Qionghai Lake did not change significantly despite the rapid social and economic development and the intensifying human activities (tourism, farming, plantation, etc.). The composition and dominant taxa of the phytoplankton in Qionghai Lake were largely the same as those of Fuxian Lake [37] and Lugu Lake [29], with dominance by Chlorophyta and diatoms.

4.2. Trophic Level of the Water Body

Mesotrophic lakes are often dominated by Dinoflagellata, Cryptista, and diatoms, while eutrophic lakes are often dominated by Chlorophyta and Cyanobacteriota [38,39]. The trophic level of Qionghai Lake evolved from oligotrophic in Tang et al.’s continuous monitoring from 1986 to 1991 [40], to mesotrophic in Yao et al.’s study in 1996 [30], mesotrophic–eutrophic in 2006 according to Liang et al. [41], and mesotrophic–eutrophic in 2010 according to Zhu et al. [42]. The current work for 2015–2017 found that the dominant phytoplankton included Chlorophyta, diatoms, and Cryptista (Cyanobacteriota became dominant in June 2016), which corresponded to a mesotrophic–eutrophic status. The trophic level analysis confirmed that Qionghai Lake was in a mesotrophic–eutrophic state. Over the past decades, Qionghai Lake experienced the transition from the oligotrophic to the mesotrophic state and is currently heading towards the slightly eutrophic state. Qionghai Lake exhibited a similar trophic status compared to Caohai Lake in Guizhou [43] and Yangzonghai Lake in Yunnan [44]. The overall quality of its water environment is good, but there is an obvious risk of degradation.
The trophic level varied among the five sampling sites. The center of the lake (S3) was mesotrophic, but the bay areas (S1 and S2) were mesotrophic to slightly eutrophic. This is likely because S3, with greater water depth and higher transparency, is far from the shore and less affected by human activities. In contrast, S1 is adjacent to intensively used agricultural areas and aquaculture ponds, while S2, although adjacent to mountains on the eastern side, is adjacent to the densely populated agricultural areas of Yangjiayuan to the west, which causes accelerated eutrophication of water in the bays. At the border of the Wetland Park (S5), the water is shallow, the transparency is low due to human activities and wind, and the concentration of suspended matter is high in summer and autumn.

4.3. Correlation between Phytoplankton and Environmental Factors

The results showed that NH4+-N, WT, CODMn, and SD were the main factors affecting the distribution of the phytoplankton communities in Qionghai Lake. However, phytoplankton communities affected the concentration of oxygen in the water. Temperature affects the growth and reproduction of most phytoplankton and can change the composition of the phytoplankton communities. It is generally believed that higher temperature promotes the growth and reproduction of Chlorophyta and Cyanobacteriota [45,46]. The members of Cyanobacteria grow at the maximum rate when the water temperature is higher than 25 °C, and their abundance increases rapidly in spring or summer when the water temperature rises sharply. In contrast, diatoms prefer cool water and grow well in autumn and winter, when the water temperature is low and the thermal stratification is disrupted to allow the thorough mixing of water [47,48]. The observed results of the phytoplankton in Qionghai Lake had the same trend, with dominance by diatoms and lower phytoplankton abundance in autumn and winter, and dominance by Chlorophyta and higher phytoplankton abundance in spring and summer.
As photosynthesis is essential to the growth of phytoplankton, the SD is a key factor that affects phytoplankton growth. Both the phytoplankton abundance and the dominant phytoplankton communities were positively correlated with DO, likely because the phytoplankton absorb carbon dioxide and release oxygen during photosynthesis [49]. Arhonditsis et al. [50] reported that transparency, total phosphorus, and predation pressure had the greatest impact on phytoplankton. Previous studies have shown that the stronger the sediment mixing area, the lower the water SD, and the growth of phytoplankton will be inhibited [51,52], which is consistent with the results that SD had strong positive correlations with Chla and Chlorella sp. in this study.
Both CODMn and NH4+-N are known as main factors affecting the structures and distribution of phytoplankton communities [53,54,55,56,57,58,59], and their impacts were reaffirmed in the current results. For Qionghai Lake, the chemical oxygen demand and ammonium nitrogen mainly come from domestic pollution. The wastewater discharge has a higher intensity in the north and the east and is the main source of pollutants in the region. Among the influents of the lake, the Tucheng River is the most polluted; the section between the estuary and the entrance of the settling basin is mildly black and odorous. The input of pollutants directly affects the water quality of S5 and the composition and distribution of the phytoplankton. There are 23 hotels (inns) around Qionghai Lake, and they are mainly distributed to the south of the lake. Among them, ten are near the Qionghai Park, eight are in the Gangyao area to the south, two are in the Qinglong area to the east, and three are in the Chuanxing area to the north. Presently, the hotel sewage is collected by the pipeline network and sent to the Xichang Sewage Treatment Plant for centralized treatment only for the Qionghai Park area. In other areas, the hotel sewage is treated by the individual hotels before direct discharge, because the local sewage pipeline network is incomplete or has not started operation. In addition, the farmland in the Qionghai Basin is highly utilized. During the rainy season, excess inorganic nutrients and other pollutants can enter the water body through the surface runoff of the farmland and the leaching of the farmland soil. The pollutants may enter the lake directly or enter Guanba River, Daqing River, Xiaoqing River, Ezhang River, Gaocang River, etc., all of which are the influents of Qionghai Lake, to eventually accumulate in the lake. Guanba River and Ezhang River are the two rivers with the largest surface runoff flowing into Qionghai Lake, and their input of pollutants directly affects the water quality of S1, S4, and S2, as well as the composition and distribution of the phytoplankton.
In recent years, there has been steady progress in the environmental protection at the Qionghai Basin. The prevention and control of pollution have been improving continuously, but some problems remain. For example, most of the domestic sewage in towns and villages is still discharged directly without treatment, and the construction of sewage treatment facilities in the towns and villages in the Qionghai Basin needs to be accelerated. The maintenance of existing artificial wetlands needs to be improved. The sewage pipeline network needs to be upgraded. Although the main pipe around the lake has been constructed, the construction of secondary and tertiary pipes is not up to date and the domestic sewage from households is not collected effectively. Due to geological subsidence, the original reinforced concrete pipes between Zhaojiacun and Haihekou, which form the pipeline network in the phase III wetland, have serious water leakage that impairs the sewage collection. These problems must be tackled by the appropriate authorities to improve the ecological environment of Qionghai Lake.

5. Conclusions

In the five surveys from 2015 to 2017 of the phytoplankton in Qionghai Lake, a total of 196 species (including variants) from 77 genera and 7 phyla were detected. Among them, the most abundant phylum was Chlorophyta (76 species, 38.8%) and the second most abundant phylum was Heterokontophyta (39 species, 19.9%). The phytoplankton abundance, which ranged from 13.85 × 10⁴ to 335.54 × 10⁴ ind·L−1, was much higher in spring and summer than in autumn and winter. Chlorella sp. and Cyclotella sp. were the dominant taxa, with the highest dominance degree attaining 0.54 and 0.33, respectively.
During the survey period, the Shannon–Wiener index and the Margalef index of the phytoplankton ranged from 2.49–3.65 and 2.47–3.10, respectively. The phytoplankton diversity was significantly higher in spring and summer than in autumn and winter. Qionghai Lake was overall in a mesotrophic to slightly eutrophic state, with the trophic level index of the water ranging between 30 and 60. The Spearman correlation analysis and contribution rate analysis showed that the composition and distribution of phytoplankton communities were significantly affected by the water environmental factors, most prominently NH4+-N, WT, CODMn, and SD.
The results of this study provided ideas and directions for the authorities on the comprehensive treatment of the water environment of Qionghai Lake. Relevant departments are advised to focus on the main factors affecting the growth of phytoplankton in water bodies and the prevention of water blooms, to effectively control the levels of nitrogen and chemical oxygen demand in Qionghai Lake. Measures such as the interception of exogenous rivers, the removal of endogenous sediment, and the restoration of habitats in the water and land areas may lay a solid foundation for the protection of the water environment in Qionghai Lake.

Author Contributions

Conceptualization, X.W. and X.Y.; methodology, X.W.; software, G.Y.; validation, Y.D., B.Z. and X.W.; formal analysis, X.Y.; investigation, G.Y.; resources, X.W.; data curation, X.W.; writing—original draft preparation, X.Y.; writing—review and editing, X.W.; visualization, B.Z.; supervision, Y.D.; project administration, X.W.; funding acquisition, X.Y. All authors have read and agreed to the published version of the manuscript.

Funding

This study was financially supported by the Open Research Fund of State Environmental Protection Key Laboratory of Drinking Water Source Protection, Chinese Research Academy of Environmental Sciences (2022YYSYKFYB12), and the Fundamental Research Funds for the Central Public-interest Scientific Institution (2022YSKY-01).

Data Availability Statement

Data are available on request to the authors.

Conflicts of Interest

The authors declare no conflict of interest.

References

  1. Hill, B.H.; Herlihy, A.T.; Kaufmann, P.R.; DeCelles, S.J.; Borgh, M.A.V. Assessment of streams of the eastern United States using a periphyton index of biotic integrity. Ecol. Indic. 2003, 2, 325–338. [Google Scholar] [CrossRef]
  2. Miller, S.J.; Wardrop, D.H.; Mahaney, W.M.; Brooks, R.P. A plant-based index of biological integrity (IBI) for headwater wetlands in central Pennsylvania. Ecol. Indic. 2006, 6, 290–312. [Google Scholar] [CrossRef]
  3. Padisák, J.; Borics, G.; Grigorszky, I.; Soróczki-Pintér, É. Use of phytoplankton assemblages for monitoring ecological status of lakes within the Water Framework Directive: The assemblage index. Hydrobiologia 2006, 553, 1–14. [Google Scholar] [CrossRef]
  4. Zalack, J.T.; Smucker, N.J.; Vis, M.L. Development of a diatom index of biotic integrity for acid mine drainage impacted streams. Ecol. Indic. 2010, 10, 287–295. [Google Scholar] [CrossRef]
  5. Wu, N.C.; Schmalz, B.; Fohrer, N. Development and testing of a phytoplankton index of biotic integrity (P-IBI) for a German lowland river. Ecol. Indic. 2012, 13, 158–167. [Google Scholar] [CrossRef]
  6. Znachor, P.; Nedom, J.; Hejzlar, J.; Seďa, J.; Komárková, J.; Kolář, V.; Mrkvička, T.; Boukal, D.S. Changing environmental conditions underpin long-term patterns of phytoplankton in a freshwater reservoir. Sci. Total Environ. 2020, 710, 135626. [Google Scholar] [CrossRef]
  7. Chao, C.X.; Lv, T.; Wang, L.G.; Li, Y.; Han, C.; Yu, W.C.; Yan, Z.W.; Ma, X.W.; Zhao, H.C.; Zuo, Z.J.; et al. The spatiotemporal characteristics of water quality and phytoplankton community in a shallow eutrophic lake: Implications for submerged vegetation restoration. Sci. Total Environ. 2022, 821, 153460. [Google Scholar] [CrossRef]
  8. Havens, K.E.; Ji, G.; Beaver, J.R.; Fulton, R.S.; Teacher, C.E. Dynamics of cyanobacteria blooms are linked to the hydrology of shallow Florida lakes and provide insight into possible impacts of climate change. Hydrobiologia 2019, 829, 43–59. [Google Scholar] [CrossRef]
  9. Brookes, J.D.; Carey, C.C. Resilience to blooms. Science 2011, 334, 46–47. [Google Scholar] [CrossRef]
  10. Paerl, H.W.; Huisman, J. Climate Blooms like it hot. Science 2008, 320, 57–58. [Google Scholar] [CrossRef]
  11. Räike, A.; Pietil¨ainen, O.P.; Rekolainen, S.; Kauppila, P.; Pitkänen, H.; Niemi, J.; Raateland, A.; Vuorenmaa, J. Trends of phosphorus, nitrogen and chlorophyll a concentrations in Finnish rivers and lakes in 1975–2000. Sci. Total Environ. 2003, 310, 47. [Google Scholar] [CrossRef] [PubMed]
  12. Yang, Z.; Zhang, M.; Shi, X.L.; Kong, F.X.; Ma, R.H.; Yu, Y. Nutrient reduction magnifies the impact of extreme weather on cyanobacterial bloom formation in large shallow Lake Taihu (China). Water Res. 2016, 302, 302–310. [Google Scholar] [CrossRef]
  13. Muhid, P.; Davis, T.W.; Bunn, S.E.; Burford, M.A. Effects of inorganic nutrients in recycled water on freshwater phytoplankton biomass and composition. Water Res. 2013, 47, 384–394. [Google Scholar] [CrossRef] [PubMed]
  14. Ren, Y.; Pei, H.Y.; Hu, W.R.; Tian, C.; Hao, D.P.; Wei, J.L.; Feng, Y.W. Spatiotemporal distribution pattern of cyanobacteria community and its relationship with the environmental factors in Hongze Lake, China. Environ. Monit. Assess. 2014, 186, 6919–6933. [Google Scholar] [CrossRef] [PubMed]
  15. Zhao, H.J.; Wang, Y.; Yang, L.L.; Yuan, L.W.; Peng, D.C. Relationship between phytoplankton and environmental factors inlandscape water supplemented with reclaimed water. Ecol. Indic. 2015, 58, 113–121. [Google Scholar] [CrossRef]
  16. Shan, K.; Song, L.R.; Chen, W.; Li, L.; Liu, M.L.; Wu, Y.L.; Jia, Y.L.; Zhou, Q.C.; Peng, L. Analysis of environmental drivers influencing interspecific variations and associations among bloom-forming cyanobacteria in large, shallow eutrophic lakes. Harmful Algae 2019, 84, 84–94. [Google Scholar] [CrossRef]
  17. Navas-Parejoa, J.C.C.; Corzoa, A.; Papaspyroua, S. Seasonal cycles of phytoplankton biomass and primary production in a tropical temporarily open-closed estuarine lagoon—The effect of an extreme climatic event. Sci. Total Environ. 2020, 723, 138014. [Google Scholar] [CrossRef]
  18. Peng, X.; Zhang, L.; Li, Y.; Lin, Q.W.; He, C.; Huang, S.Z.; Li, H.; Zhang, X.Y.; Liu, B.Y.; Ge, F.J.; et al. The changing characteristics of phytoplankton community and biomass in subtropical shallow lakes: Coupling effects of land use patterns and lake morphology. Water Res. 2021, 200, 117235. [Google Scholar] [CrossRef]
  19. Tian, C.; Pei, H.Y.; Hu, W.R.; Xie, J. Phytoplankton variation and its relationship with the environmental factors in Nansi Lake, China. Environ. Monit. Assess. 2013, 185, 295–310. [Google Scholar] [CrossRef]
  20. Yang, W.; Zheng, Z.; Zheng, C.; Lu, K.H.; Ding, D.W.; Zhu, J.Y. Temporal variations in a phytoplankton community in a subtropical reservoir: An interplay of extrinsic and intrinsic community effects. Sci. Total Environ. 2017, 612, 720–727. [Google Scholar] [CrossRef]
  21. Stockwell, J.D.; Doubek, J.P.; Adrian, R.; Anneville, O.; Carey, C.C.; Carvalho, L.; Domis, L.N.D.S.; Dur, G.; Frassl, M.A.; Grossart, H.P.; et al. Storm impacts on phytoplankton community dynamics in lakes. Global Change Biol. 2020, 26, 2756–2784. [Google Scholar] [CrossRef] [PubMed]
  22. Mao, Z.G.; Gu, X.; Cao, Y.; Luo, J.H.; Zheng, Q.F.; Chen, H.H.; Jeppesen, E. Pelagic energy flow supports the food web of a shallow lake following a dramatic regime shift driven by water level changes. Sci. Total Environ. 2021, 756, 143642. [Google Scholar] [CrossRef] [PubMed]
  23. Zhang, Y.C.; Hu, M.Q.; Shi, K.; Zhang, M.; Han, T.; Lai, l.; Zhan, P.F. Sensitivity of phytoplankton to climatic factors in a large shallow lake revealed by column-integrated algal biomass from long-term satellite observations. Water Res. 2021, 207, 117786. [Google Scholar] [CrossRef] [PubMed]
  24. Noori, R.; Ansari, E.; Bhattarai, R.; Tang, Q.H.; Aradpour, S.; Maghrebi, M.; Haghighi, A.T.; Bengtsson, L.; Kløve, B. Complex dynamics of water quality mixing in a warm mono-mictic reservoir. Sci. Total Environ. 2021, 777, 146097. [Google Scholar] [CrossRef] [PubMed]
  25. Noori, R.; Ansari, E.; Jeong, Y.W.; Aradpour, S.; Maghrebi, M.; Hosseinzadeh, M.; Bateni, S.M. Hyper-Nutrient Enrichment Status in the Sabalan Lake, Iran. Water 2021, 13, 2874. [Google Scholar] [CrossRef]
  26. Peng, X.; Wu, J.; He, P. A preliminary investigatory report of the algae in Qinghai Lake of Sichuan. J. Southwest China Norm. Univ. Nat. Sci. Ed. 1995, 2, 187–194. [Google Scholar]
  27. Yao, W.Z.; Zhou, Y.J.; Feng, J.G. A preliminary study on the plankton in Qionghai Lake. J. Fish. China 1996, 2, 183–187. [Google Scholar]
  28. Yao, W.Z.; Zhou, Y.J.; Feng, J.G. A study on the evaluation of water pollution and eutrophication of the Qionghai Lake by means of phytoplankton. J. Southwest Agric. Univ. 1996, 2, 170–173. [Google Scholar]
  29. Dong, Y.X. Research and Development of Algae in the Nine Plateau Lakes in Yunnan. Environ. Sci. Surv. 2014, 33, 1–8. [Google Scholar]
  30. Du, X. Research on Community Structure and Ecological Evaluation of Planktonic Algae and Epiphytic Algae in Caohai, Guizhou; Guizhou Normal University: Guiyang, China, 2021. [Google Scholar]
  31. State Environmental Protection Administration. Methods for Monitoring and Analysis of Water and Wastewater, 4th ed.; Chinese Environmental Press: Beijing, China, 2002. [Google Scholar]
  32. Hu, H.J.; Wei, Y.X. The Freshwater Algae of CHINA: Systematics, Taxonomy and Ecology; Science Press: Beijing, China, 2006. [Google Scholar]
  33. Sun, J.; Liu, D.Y. Geometric models for calculating cell biovolume and surface area for phytoplankton. J. Plankton Res. 2003, 25, 1331–1346. [Google Scholar] [CrossRef]
  34. Aksnes, D.L.; Wassmann, P. Modeling the significance of zooplankton grazing for export production. Limnol. Oceanogr. 1993, 38, 978–985. [Google Scholar] [CrossRef]
  35. Lampitt, R.S.; Wishner, K.F.; Turley, C.M.; Angel, M.V. Marine snow studies in the Northeast Atlantic Ocean: Distribution, composition and role as a food source for migrating plankton. Mar. Biol. 1993, 116, 689–702. [Google Scholar] [CrossRef]
  36. Wang, M.C.; Liu, X.Q. Evaluate method and classification standard on lake eutrophication. Environ. Monit. China 2002, 18, 47–49. [Google Scholar]
  37. Ji, Z.Y.; Liu, S.J. Phytoplankton Community Structure, Related Influencing Factors and the Evaluation of Water Quality in the Fuxian Lake. Environ. Monit. China 2019, 35, 67–77. [Google Scholar]
  38. Pang, Q.J.; LI, B.Y. Assessment of eutrophication of Dongping Lake water body. Water Resour. Prot. 2003, 19, 42–44. [Google Scholar]
  39. Matthews, M.W. Eutrophication and cyanobacterial blooms in South African inland waters: 10 years of MERIS observations. Remote Sens. Environ. 2014, 155, 161–177. [Google Scholar] [CrossRef]
  40. Tang, W.H.; Rao, Y.P.; Peng, X. Investigation and Analysis of the Current Situation of Water Quality in Qionghai Lake, Xichang. Chongqing Environ. Sci. 1993, 4, 54–57. [Google Scholar]
  41. Liang, J.; Zhang, S.D.; Wang, H.B. Preliminary Study of Water Eutrophication in Qionghai Lake. Sichuan Environ. 2009, 28, 33–36. [Google Scholar]
  42. Zhu, J.P.; Liu, H.; Zhao, B. Evaluation of Water Eutrophication in Qionghai Lake of Xichang in 2010. Ningxia J. Agric. For. Sci. Technol. 2011, 52, 45–46. [Google Scholar]
  43. Wang, C.; Yuan, T.; Yu, J.X.; Xu, M.; Liu, Y. Spatial-temporal Fluctuations of Water Quality and Nutritional Status Partitioning of Caohai Lake in Guizhou. J. Yangtze River Sci. Res. Inst. 2019, 36, 14–19. [Google Scholar]
  44. Li, C.Y.; Yang, Z.L. Evaluation of Phytoplankton Community and Nutritional Status in Yangzonghai. Pearl River 2013, 34, 20–23. [Google Scholar]
  45. Alam, M.G.M.; Jahan, N.; Thalib, L.; Wei, B.; Maekawa, T. Effects of environmental factors on the seasonally change of phytoplankton populations in a closed freshwater pond. Environ. Int. 2001, 27, 363–371. [Google Scholar] [CrossRef] [PubMed]
  46. Poste, A.E.; Hecky, R.E.; Guildford, S.J. Phosphorus enrichment and carbon depletion contribute to high Microcystis biomass and microcystin concentrations in Ugandan lakes. Limnol. Oceanogr. 2013, 58, 1075–1088. [Google Scholar] [CrossRef]
  47. Abirhire, N.R.L.; North, R.; Hunter, K.; Vandergucht, D.M.; Sereda, J.; Hudson, J.J. Environmental factors influencing phyto-plankton communities in Lake Diefenbaker, Saskatchewan, Canada. J. Great Lakes Res. 2015, 41, 118–128. [Google Scholar] [CrossRef]
  48. Varol, M. Phytoplankton functional groups in a monomictic reservoir: Seasonal succession, ecological preferences, and re-lationships with environmental variables. Environ. Sci. Pollut. Res. 2019, 26, 20439–20453. [Google Scholar] [CrossRef]
  49. Cui, G.Y.; Wang, B.L.; Xiao, J.; Qiu, X.L.; Liu, C.Q.; Li, X.D. Water column stability driving the succession of phytoplankton functional groups in karst hydroelectric reservoirs. J. Hydrol. 2021, 592, 125607. [Google Scholar] [CrossRef]
  50. Arhonditsis, G.B.; Winder, M.; Brett, M.T.; Schindler, D.E. Patterns and mechanisms of phytoplankton variability in Lake Washington (USA). Water Res. 2004, 38, 4013–4027. [Google Scholar] [CrossRef] [PubMed]
  51. Cloern, J.E. Turbidity as a control on phytoplankton biomass and productivity in estuaries. Cont. Shelf Res. 1987, 7, 1367–1381. [Google Scholar] [CrossRef]
  52. Shi, Z.; Xu, J.; Huang, X.P.; Zhang, X.; Jiang, Z.J.; Ye, F.; Liang, X.M. Relationship between nutrients and plankton biomass in the turbidity maximum zone of the Pearl River Estuary. J. Environ. Sci. 2017, 57, 72–84. [Google Scholar] [CrossRef]
  53. Wilkinson, C.R.; Fay, P. Nitrogen fixation in coral reef sponges with symbiotic cyanobacteria. Nature 1979, 279, 527–529. [Google Scholar] [CrossRef]
  54. Mitsui, A.; Kumazawa, S.; Takahashi, A.; Ikemoto, H.; Cao, S.; Arai, T. Strategy by which nitrogen-fixing unicellular cyanobacteria grow photoautotrophically. Nature 1986, 323, 720–722. [Google Scholar] [CrossRef]
  55. Bohme, H. Regulation of nitrogen fixation in heterocyst-forming cyanobacteria. Trends Plant Sci. 1998, 3, 346–351. [Google Scholar] [CrossRef]
  56. Moore, L.R.; Post, A.F.; Rocap, G.; Chisholm, S.W. Utilization of different nitrogen sources by the marine cyanobacteria Prochlorococcus and Synechococcus. Limnol. Oceanogr. 2002, 47, 989–996. [Google Scholar] [CrossRef]
  57. Haande, S.; Rohrlack, T.; Semyalo, R.P.; Brettum, P.; Edvardsen, B.; Lyche-Solheim, A.; Sørensen, K.; Larsson, P. Phytoplankton dynamics and cyanobacterial dominance in Murchison Bay of Lake Victoria (Uganda) in relation to environmental conditions. Limnologica 2011, 41, 20–29. [Google Scholar] [CrossRef]
  58. Liu, X.; Qian, K.M.; Chen, Y.W.; Gao, J.F. A comparison of factors influencing the summer phytoplankton biomass in China’s three largest freshwater lakes: Poyang, Dongting, and Taihu. Hydrobiologia 2017, 792, 283–302. [Google Scholar] [CrossRef]
  59. Cao, J.; Hou, Z.Y.; Li, Z.K.; Chu, Z.S.; Yang, P.P.; Zheng, B.H. Succession of phytoplankton functional groups and their driving factors in a subtropical plateau lake. Sci. Total Environ. 2018, 631–632, 1127–1137. [Google Scholar] [CrossRef]
Figure 1. The geography of Qionghai Lake and the location of the sampling sites.
Water 16 00229 g001
Figure 2. Changes in the phytoplankton abundance.
Water 16 00229 g002
Figure 3. Seasonal composition of phytoplankton in Qionghai Lake.
Water 16 00229 g003
Figure 4. Populations of dominant taxa in different seasons.
Water 16 00229 g004
Figure 5. Spatial and temporal variation of the phytoplankton diversity.
Water 16 00229 g005aWater 16 00229 g005b
Figure 6. Seasonal variation of the trophic level.
Water 16 00229 g006
Figure 7. Correlation between environmental factors and phytoplankton communities (A) and dominant phytoplankton population (B). A1: Chlorella sp., A2: Cyclotella sp., A3: Pantocsekiella ocellata, A4: Cryptomonas marssonii, A5: Cryptomonas erosa, A6: Synedra sp., A7: Eudorina sp., A8: Pandorina sp., A9: Chroococcus sp., and A10: Cryptomonas ovata.
Water 16 00229 g007
Table 1. Collection of water samples from Qionghai Lake.
SiteName and LocationLatitudeLongitudeWater Depth (m)Sampled Water Layer (m)
S1Tangjia Bay (TJB)100°20′17.6″ N27.50′13.l″ E5–60.5, 2.5, 5
S2Qinglun Bay (QLB)100°20′33.1″ N27.48′11.7″ E14.7–150.5, 3.5, 9
S3Center of Qionghai Lake (CQL)102°18′54.2″ N27.48′59″ E17.5–18.70.5, 3.5, 9
S4Hainan Town (HNT)102°17′46.6″ N27°48′35.3″ E11.7–12.50.5, 3.5, 9
S5Border of Wetland Park Phase 2 (BWP)102°16′41.5″ N27°51′17.9″ E2.5–40.5, 2.5
Table 2. Species of phytoplankton in Qionghai Lake.
PhylumGenusSpecies PhylumGenusSpecies
1ChlorophytaActinastrumA. sp.99 NitzschiaN. lanceolata W. Smith
2 AnkistrodesmusA. sp.100 N. acicularis (Kützing) W.Smith
3 A. falcatus var. mirabilis (West and G.S.West) G.S.West101 PantocsekiellaP. ocellata (Pantocsek) K.T.Kiss and Ács
4 A. spiralis (W.B.Turner) Lemmermann102 PinnulariaP. sp.
5 A. angustus (C.Bernard) Oettli103 PlanktoniellaP. sp.
6 A. convolutus Corda104 SurirellaS. elegans Ehrenberg
7 A. falcatus (Corda) Ralfs105 SynedraS. sp.
8 A. fusiformis Corda106 S. famelica Kützing
9 CarteriaC. multifilis (Fresenius) O.Dill107 ChrysococcusC. diaphanus Skuja
10 ChlamydomonasC. globosa J.W.Snow108 DinobryonD. sp.
11 C. ovalis Korshikov109 D. sertularia Ehrenberg
12 C. pertusa Chodat110 D. sociale Ehrenberg
13 C. reinhardtii P.A.Dangeard111 D. divergens O.E.Imhof
14 C. conferta Korshikov112 SynuraS. uvella Ehrenberg
15 ChlorellaC. vulgaris Beijierinck113 S. echinulata Korshikov
16 C. ellipsoidea Gerneck114 TribonemaT. vulgare Pascher
17 ChlorococcumC. sp.115 T. minus (Wille) Hazen
18 ClosteridiumC. sp.116CyanobacteriotaAnabaenaA. sp.
19 CoelastrumC. sphaericum Nägeli117 A. affinis Lemmermann
20 C. reticulatum (P.A.Dangeard) Senn118 AsterocapsaA. sp.
21 C. proboscideum Bohlin119 ChroococcusC. sp.
22 CrucigeniaC. tetrapedia (Kirchner) Kuntze120 DactylococcopsisD. irregularis G.M.Smith
23 C. quadrata Morren121 D. acicularis Lemmermann
24 C. apiculata (Lemmermann) Schmidle122 D. sp.
25 C. fenestrate (Schmidle) Schmidle123 GloeocapsaG. limnetica (Lemmermann) Hollerbach
26 DictyosphaeriaD. sp.124 G. minima (Keissler) Hollerbach
27 DictyosphaeriumD. pulchellum H.C.Wood125 G. turgida (Kützing) Hollerbach
28 EudorinaE. elegans Ehrenberg126 LeptolyngbyaL. sp.
127 L. tenuis (Gomont) Anagnostidis and Komárek
29 FranceiaF. tuberculata G.M.Smith128 MerismopediaM. sp.
30 GolenkiniaG. radiata Chodat129 M. sinica S.-H.Ley
31 GoniumG. pectorale O.F.Müller130 M. minima G.Beck
32 NephrocytiumN. agardhianum Nägeli131 M. punctata Meyen
33 N. lunatum West132 M. elegans A.Braun ex Kützing
34 OocystisO. lacustris Chodat133 M. aeruginea Brébisson
35 O. naegelii A.Braun134 MicrocystisM. sp.
36 O. solitaria Wittrock135 NephrococcusN. confertus Y.-Y.Li
37 O. parva West and G.S.West136 NostocN. sp.
38 PalmellaP. mucosa Kützing137 OscillatoriaO. sp.
39 PandorinaP. morum (O.F.Müller) Bory138 O. acuminata Gomont
40 P. charkowiensis Korschikov139 O. princeps Vaucher ex Gomont
41 PediastrumP. simplex var. duodenarium (Bailey) Rabenhorst140 PhormidiumP. sp.
42 P. biradiatum (Meyen) E.Hegewald141 P. corium Gomont
43 P. clathratum (Schröder) Lemmermann142 P. mucosum N.L.Gardner
44 P. sp.143 TrichodesmiumT. erythraeum Ehrenberg ex Gomont
45 P. sturmii Reinsch144CharophytaClosteriumC. intermedium Ralfs
46 P. tetras (Ehrenberg) Ralfs145 C. parvulum Nägeli
47 P. tetras var. excisum (A.Braun) Hansgirg146 C. cynthia De Notaris
48 P. biradiatum var. longicornutum Gutwinski147 C. limneticum Lemmermann
49 P. duplex var. gracillimum West and G.S.West148 C. venus Kützing ex Ralfs
50 P. duplex Meyen149 C. sp.
51 PlanktosphaeriaP. gelatinosa G.M.Smith150 C. kuetzingii Brébisson
52 PleodorinaP. californica W.R.Shaw151 CosmariumC. impressulum Elfving
53 QuadrigulaQ. chodatii (Tanner-Füllemann) G.M.Smith152 C. obtusatum Schmidle
54 ScenedesmusS. quadricauda Chodat153 C. formosulum Hoff
55 S. dimorphus (Turpin) Kützing154 C. cucumis Corda ex Ralfs
56 S. sp.155 C. granatum Brébisson ex Ralfs
57 S. obliquus var. acuminatus (Lagerheim) Chodat156 C. quadratum Ralfs ex Ralfs
58 S. bijugatus Kützing157 C. reniforme (Ralfs) W.Archer
59 S. bijugus (Turpin) Lagerheim158 C. circulare (Hassall ex Ralfs) Kützing
60 S. bijugus var. alternans (Reinsch) Borge159 C. botrytis Joshua
61 S. ovalternus Chodat160 StaurastrumS. cuspidatum Brébisson
62 S. acuminatus (Lagerheim) Chodat161 S. tetracerum Ralfs ex Ralfs
63 S. armatus (Chodat) Chodat162 S. polymorphum Brébisson
64 S. arcuatus (Lemmermann) Lemmermann163 S. gracile Ralfs ex Ralfs
65 SelenastrumS. gracile Reinsch164 S. retusum W.B.Turner
66 S. bibraianum Reinsch165 S. paradoxum Meyen ex Ralfs
67 SphaerocystisS. schroeteri Chodat166 S. erasum Brébisson
68 TetrachlorellaT. alternans (G.M.Smith) Korshikov167 S. inflexum Brébisson
69 TetraëdronT. sp.168 S. oxyacanthum W.Archer
70 T. tumidulum (Reinsch) Hansgirg169EuglenophytaEuglenaE. sp.
71 T. enorme (Ralfs) Hansgirg170 E. acutissima Lemmermann
72 T. bifurcatum (Wille) Lagerheim171 E. oxyuris Schmarda
73 T. minimum (A.Braun) Hansgirg172 E. caudata E.F.W.Hübner
74 T. caudatum (Corda) Hansgirg173 E. variabilis G.A.Klebs
75 TetrasporaT. sp.174 E. geniculata Dujardin
76 TreubariaT. crassicornuta Z.-Y.Hu175 E. gracilis G.A.Klebs
77HeterokontophytaAchnanthesA. exigua Grunow176 E. viridis (O.F.Müller) Ehrenberg
78 AsterionellaA. sp.177 E. tristella S.P.Chu
79 A. formosa Hassall178 E. pisciformis Klebs
80 AttheyaA. sp.179 LepocinclisL. steinii Lemmermann
81 A. zachariasii Brun180 PhacusP. acuminatus A.Stokes
82 CyclotellaC. sp.181 P. sp.
83 CymbellaC. sp.182 P. caudatus Hübner
84 C. cistula (Ehrenberg) O.Kirchner183 TrachelomonasT. euchlora (Ehrenberg) Lemmermann
85 C. tumidula Grunow184CryptistaChilomonasC. paramaecium Ehrenberg
86 C. ventricosa Kützing185 CryptomonasC. sp.
87 C. naviculiformis Auerswald ex Heiberg186 C. marssonii Skuja
88 DitylumD. sp.187 C. erosa Ehrenberg
89 FragilariaF. capucina Desmazières188 C. ovata Ehrenberg
90 GomphonemaG. sp.189 C. obovate Skuja
91 GyrosigmaG. attenuatum (Kützing) Rabenhorst190 KommaK. sp.
92 MelosiraM. sp.191 Komma caudata (L.Geitler) D.R.A.Hill
93 M. granulate (Ehrenberg) Ralfs192DinoflagellataCeratiumC. hirundinella (O.F.Müller) Dujardin
94 M. varians C.Agardh193 GlenodiniumG. sp.
95 NaviculaN. sp.194 G. cinctum Ehrenberg
96 N. cryptocephala Kützing195 PeridiniumP. sp.
97 N. minuscula Grunow196 P. minutum Kofoid
98 N. viridula (Kützing) Ehrenberg
Disclaimer/Publisher’s Note: The statements, opinions and data contained in all publications are solely those of the individual author(s) and contributor(s) and not of MDPI and/or the editor(s). MDPI and/or the editor(s) disclaim responsibility for any injury to people or property resulting from any ideas, methods, instructions or products referred to in the content.

