Abstract
Water system connectivity is an important measure to optimize the balanced spatial allocation of water resources and water security patterns. Inland river basins in arid zones are generally insufficiently connected, so the scientific evaluation of the current status of water system connectivity and the centrality of its nodes in the water system network has practical significance for the scientific construction of regional water networks. Taking the Tarim River Basin in Xinjiang, China, as an object, this study conducted a comprehensive evaluation of basin water system connectivity by constructing a water system connectivity evaluation system with a total of 12 indicators for the three aspects of pattern connectivity, structural connectivity and functional connectivity. Subsequently, the TOPSIS model, with combined weights of the analytic hierarchy process and the entropy weight method, was used to comprehensively evaluate the connectivity of the watershed’s water system. The research evaluated the node centrality of the water system network that was closely related to the basin water system connectivity by using complex network analyses. The study results indicated the following: (1) among the source streams in the Tarim River Basin, the connectivity of the Aksu Basin was the best and that of the Keriya Basin was the worst and (2) the distribution patterns of the eigenvector centrality and betweenness centrality of the basin hydrological network nodes were similar, with nodes of highest centrality concentrated in the vicinity of the mainstems and the source–mainstem intersections. This work provides a basis and reference for the construction of water system connectivity and the selection of key control sections for ecological flow in the Tarim River Basin.
1. Introduction
Water system connectivity maintains the hydraulic connection and material circulation between different water bodies on the basis of natural and artificially formed river, lake and reservoir water systems to maintain, reshape or build new water flow connection channels to meet certain functional objectives [1]. In order to build a modern and high-quality water infrastructure network and to solve the problems of water resources, water ecology, water environment and water disasters in an integrated manner, China has launched a series of policies and plans in recent years, stressing that “connecting rivers and lakes is an important way to improve the capacity of water resources allocation”. The Fifth Plenary Session of the 19th CPC Central Committee in 2020 clearly proposed the implementation of major projects such as a national water network [2]. By 2035, in order to enhance its ability to allocate and safeguard water resources and to defend against water and drought disasters, China will build an integrated and interconnected provincial, municipal and county water network system for urban and rural areas in accordance with the needs of the State and the provinces, districts and municipalities for water security and safeguards [3]. As an important inland river basin in the arid north-western region, the Tarim River Basin is a significant part of the national water network construction. Current research on water system connectivity mostly focuses on the plains where the river network is more developed [4]; the arid north-west, where river networks are sparser, is less involved. The uneven spatial and temporal distribution of water resources in the arid north-west has resulted in poor connectivity of inland river basins, a weak capacity for a balanced spatial allocation of water resources and an extremely fragile ecological environment [5]. Accompanied by global warming, increased hydrological fluctuations and increased uncertainty of water resources [6] are major constraints to socio-economic development and ecological environment protection and restoration [7]. How to take limited water resources, rationally optimize ecological regulations and improve water-use efficiency are key issues facing the basin at present. Therefore, the evaluation of water system connectivity in the Tarim River Basin is a practical requirement to help build the regional water network and ensure water system connectivity. This is to manage the uncertainty of water resources and water security brought about by climate change.
The establishment of a system of indicators for the evaluation of water system connectivity is a prerequisite and a key technology for the analysis and evaluation of water system connectivity [8]. In recent years, commonly used methods for the evaluation of water system connectivity have included the graph theory method, landscape ecology method, connectivity index method and hydrological modelling method. Gao et al. used graph theory and landscape ecology methods to construct an indicator system considering hydraulic connectivity to evaluate different water system connectivity schemes in the North Canal–Yongding River region of Langfang City [9]. Bu et al. defined a new index, the Longitudinal Functional Connectivity Composite Index (LFCCI), to analyze the hydrological connectivity of the water network in the main urban area of Changzhou under spatial and temporal variations [10]. Zhang et al. developed a quantitative hydrological connectivity assessment model for the lower Yellow River floodplain system using an improved graph theory method [11]. Fang et al. analyzed the spatial and temporal changes in hydrological connectivity for Chengdu City from 2000 to 2020 using a graph theory approach [12]. However, current research in China focuses more on small- and medium-sized watersheds in the plains and lacks analyses of large watersheds in the arid north-west. In this study, the connectivity index method was chosen because this method could reflect the connectivity status of the Tarim River Basin from multiple perspectives, avoiding the one-sidedness of evaluating from only one perspective and making the evaluation results more accurate.
The graph theory method is applicable to water systems with clear nodes (e.g., river crossings, lakes, etc.) and connecting lines (e.g., rivers, etc.). When the water system in a study area includes multiple water body types and there are complex connectivity relationships among them, the landscape ecology method is able to comprehensively analyze the impacts of these connectivity relationships on the ecosystem. When connectivity studies are conducted within a specific watershed or region, the connectivity index method can provide a more specific assessment of the characteristics of the water system in a region. The hydrological modelling method can provide accurate simulations of hydrologic processes to support ecohydrological studies.
Currently, complex network theory also plays a crucial role in water system connectivity. Hajibabaei et al. considered connectivity as the relationships and interconnections between edges within a system. They used a complex network to reconstruct missing information in the water distribution network [13]. Spence et al. considered connectivity to be the ability of water to be transferred from one part of the landscape to another. They analyzed the sensitivity of connectivity to changes in runoff paths using network theory [14]. M. J. Halverson et al. used a betweenness analysis of a complex network and concluded that key stations have a high value [15].
2. Materials and Methods
2.1. Study Area
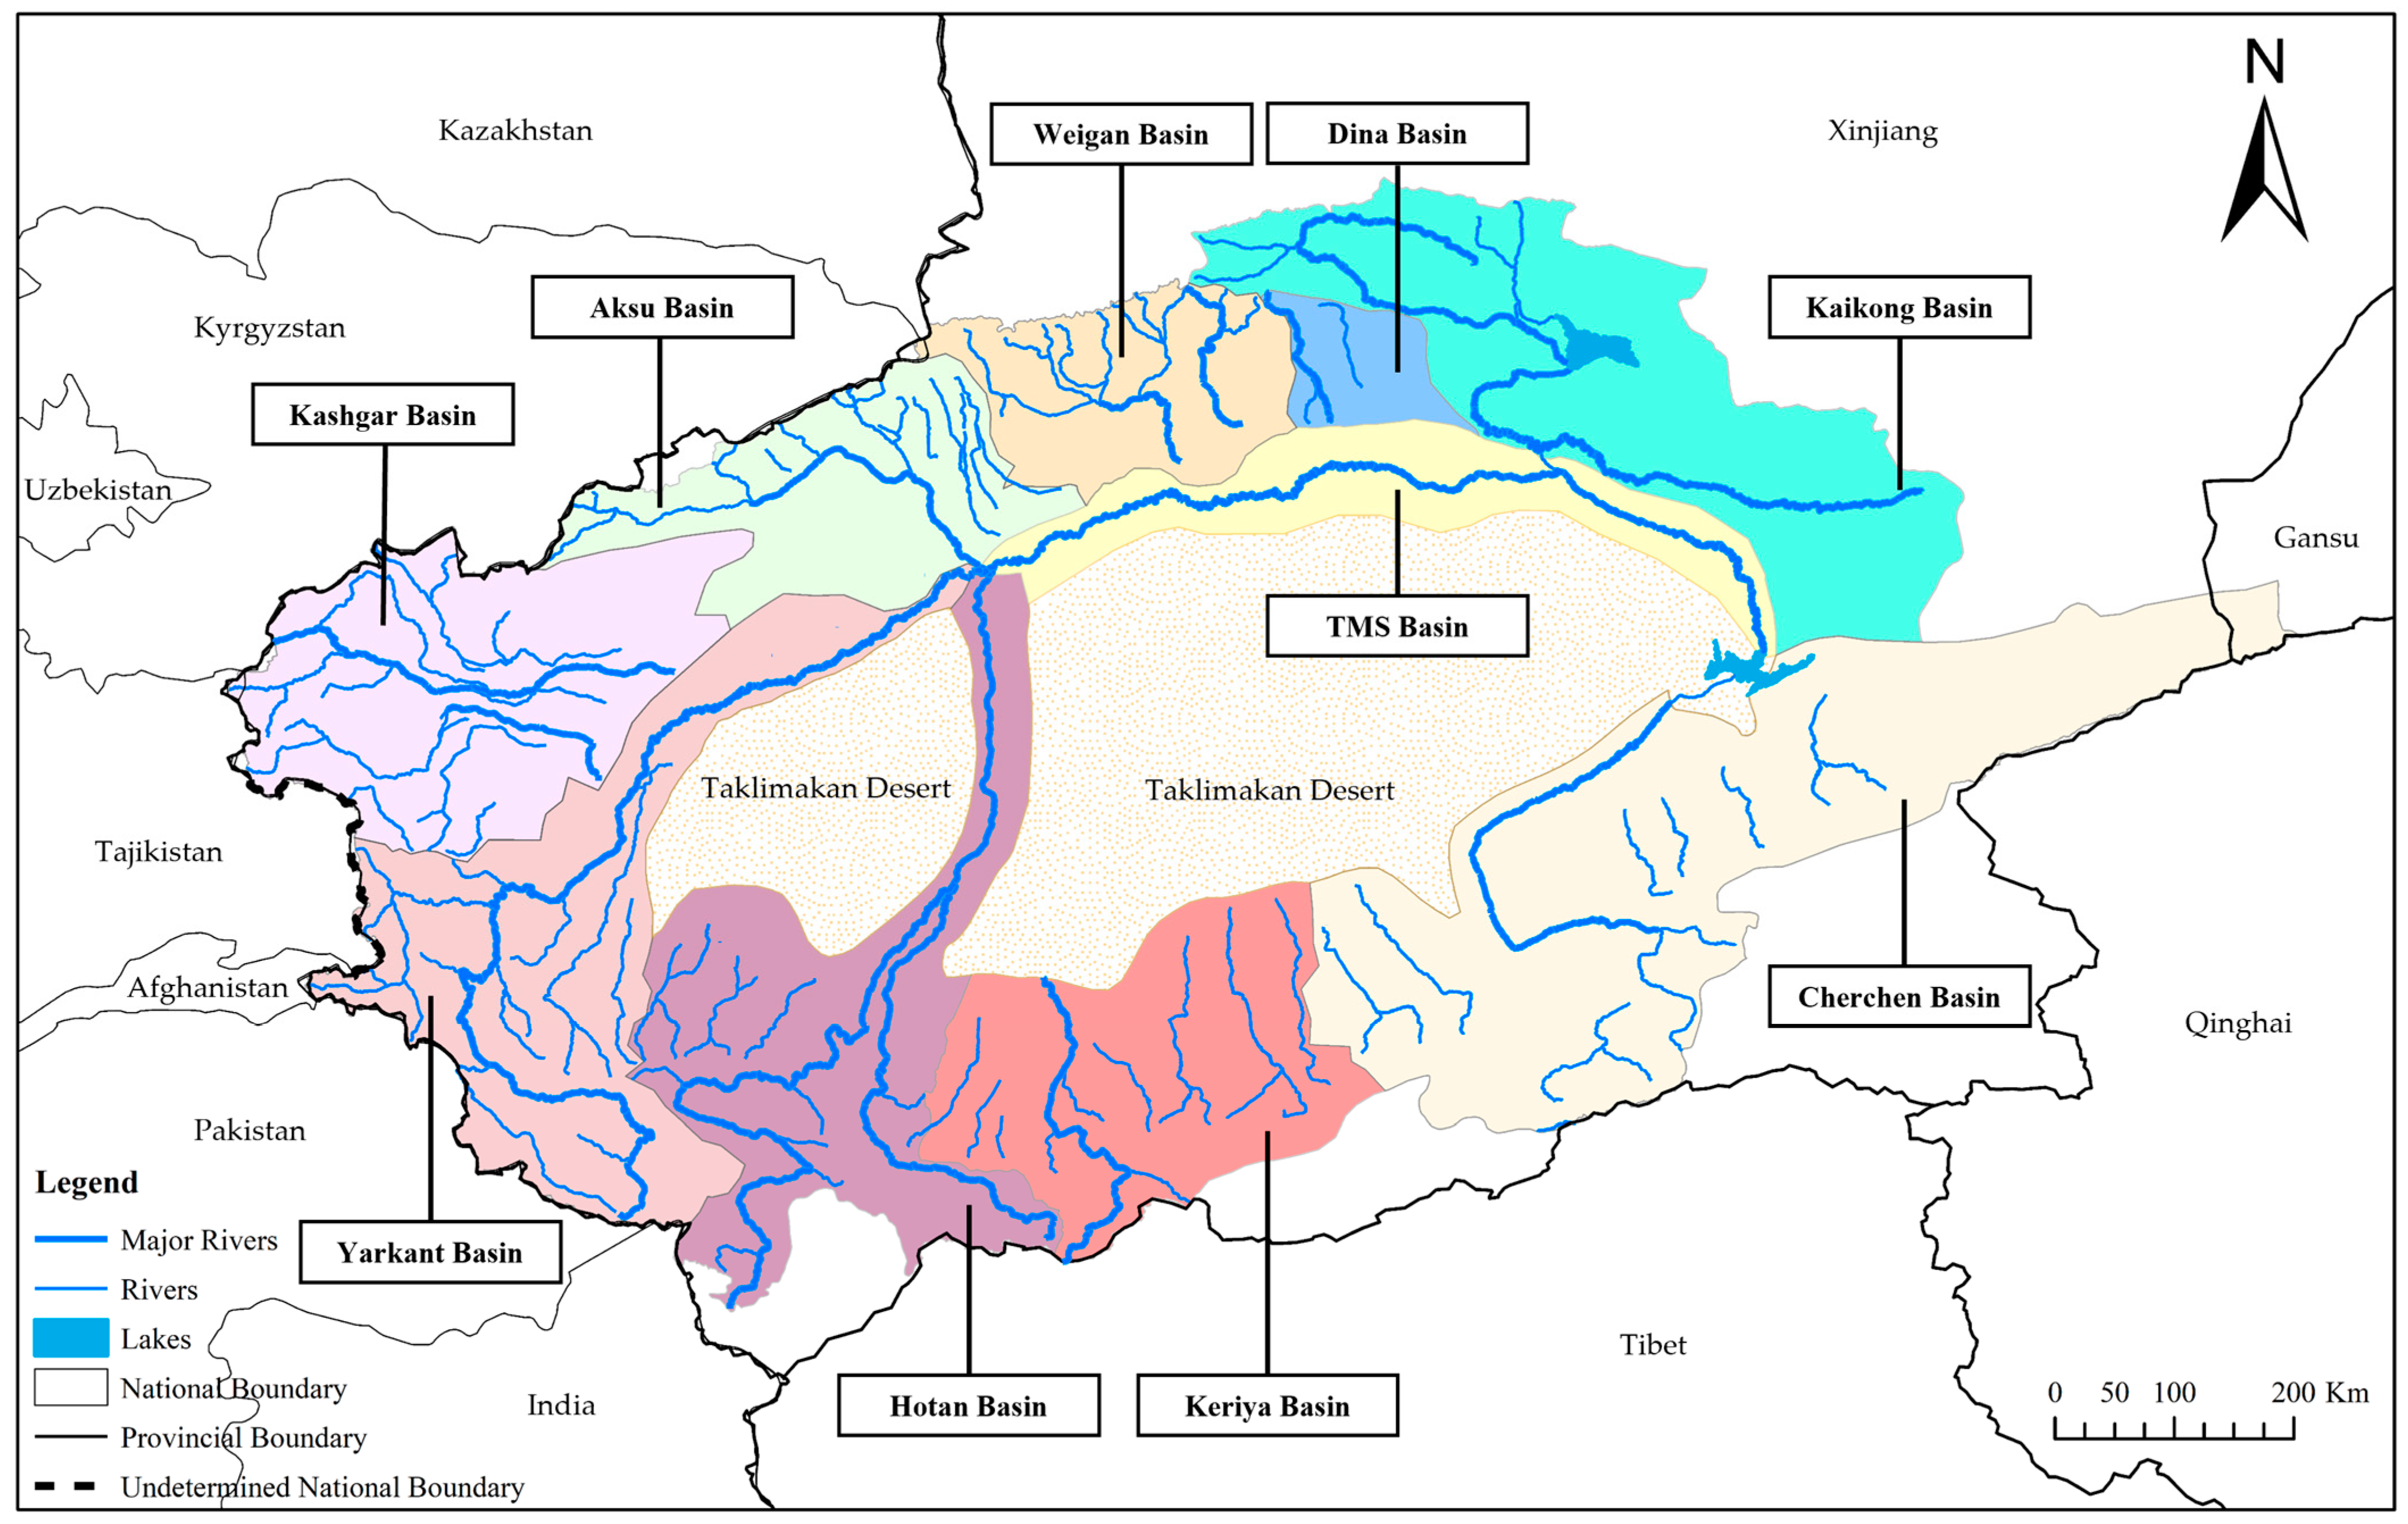
The Tarim River Basin, located to the south of Xinjiang, is the largest inland river basin in China, with a total area of about 102 × 104 km2, accounting for about 61.4 percent of the total area of Xinjiang. The Tarim River Basin consists of 144 rivers, including ‘nine sources and one trunk’ (the Aksu Basin, the Hotan Basin, the Yarkant Basin, the Kaikong Basin, the Cherchen Basin, the Kashgar Basin, the Dina Basin, the Keriya Basin, the Weigan Basin and the main stream of the Tarim River), with a total surface runoff of about 398 × 108 m3 [16]. It is the ‘mother river’ for the people in southern Xinjiang. The main stream of the Tarim River is 1321 km; at present, it is recharged by four headwater streams (namely, the Aksu River, the Hotan River, the Yarkant River and the Kaikong River). The Cherchen River is connected to the main stream of the Tarim River through Taitema Lake, while the remaining four headwater streams (namely, the Kashgar River, the Dina River, the Keriya River and the Weigan River) are in a state of disconnectedness [17]. The distribution of the water system in the Tarim River Basin is shown in Figure 1.

Figure 1.
Tarim river basin water system map.
2.2. Data Sources and Methods
2.2.1. Data Sources
Fractional vegetation cover (FVC) data from the National Tibetan Plateau Data Centre “https://data.tpdc.ac.cn/zh-hans/data/f3bae344-9d4b-4df6-82a0-81499c0f90f7 (accessed on 6 June 2024)” [18] and data on the total runoff, daily runoff and water delivery to the mainstem were obtained from Xinjiang Tarim River Basin Authority.
2.2.2. TOPSIS Comprehensive Evaluation Method
The TOPSIS comprehensive evaluation method, also known as the ‘approximation of ideal solution ranking method’, is a method of ranking evaluation objects according to their proximity to an idealized target, which has the advantages of integrating multiple factors, accurately assessing the degrees of strengths and weaknesses and making the results intuitive and easy to understand [19]. The calculation steps are as follows:
- (1)
- In order to eliminate the effect of the scale between the different evaluation indicators, a matrix with a sample size of m and n indicators was standardized as follows:
- (2)
- The positive ideal solutionand negative ideal solutionfor different water system connectivity evaluation metrics were calculated as follows:
- (3)
- The Euclidean distancesandwere calculated between each headwater basin and the positive ideal solution and the negative ideal solution as follows:where is the combined weight of indicator j using the analytic hierarchy process and the entropy weight method [20]. The analytic hierarchy process is a subjective empowerment method that breaks the problem down into three layers—namely, the target layer, normative layer and indicator layer—and systematically analyzes the relative importance of each evaluation indicator. The entropy weight method is an objective weighting method that utilizes the principle of information entropy to determine the weight of each evaluation index. The combination of the two methods can make the final result more scientific and reasonable.
- (4)
- Calculation of proximity :
The larger the , the closer the source watershed is to a positive ideal solution and the better the connectivity; the smaller the , the closer the source watershed is to a negative ideal solution and the worse the connectivity.
2.2.3. Complex Network Analysis (CNA)
Complex network analysis treats river intersections in a network of water systems as nodes and rivers as connecting edges [21]. By eliminating the isolated water systems in the Tarim River Basin that failed to directly or indirectly connect to the main stream of the Tarim River, two indicators—betweenness centrality and eigenvector centrality [22]—of the complex network analysis method were chosen to analyze the importance of the river intersections in the network of water systems.
- (1)
- Betweenness centrality:
Betweenness centrality is an indicator of the importance of a node in terms of the number of shortest paths between any two nodes in a water system network that pass through that point. The greater the betweenness centrality, the more important the point is in terms of material and energy exchanges between different nodes. The formula is as follows:
where is the betweenness centrality of nodal, is the number of all shortest paths from nodeto and is the number ofshortest paths from node tothat pass through node .
- (2)
- Eigenvector centrality:
The more important and larger the degree of the neighboring nodes connected to the node, the more important the node. The formula is as follows:
where is the eigenvector centrality of node, is a constant, is the number of edges connecting node to and is the degree of node .
2.2.4. Evaluation Indicator System
The research constructs a Tarim River Basin water system connectivity evaluation indicator system using the following three aspects: pattern connectivity, structural connectivity and functional connectivity. For pattern connectivity, the following four indicators were chosen: drainage density, growth index, river density [23] and ecological connectivity [24]. For structural connectivity, the following four indicators were chosen: circuitry of the river network connectivity, node connection rate, network connectivity [25] and degree of node connectivity [26]. For functional connectivity, the following four indicators were chosen: surface runoff index, average annual runoff guarantee rate, fractional vegetation cover [27] and water delivery rate to the main stream. The specific calculation formulae are shown in Table 1.

Table 1.
Evaluation indicator system of the Tarim River Basin water system connectivity.
3. Results
The calculation results of the water system connectivity evaluation indexes of the Tarim River Basin are shown in Table 2. The ideal solution distances and comprehensive score indices under different connectivities of the source basins are shown in Figure 2 and the comparison of the connectivity score indices of the source basins is shown in Figure 3.
Table 2.
Calculation results of evaluation indicators of water system connectivity in the Tarim River Basin.
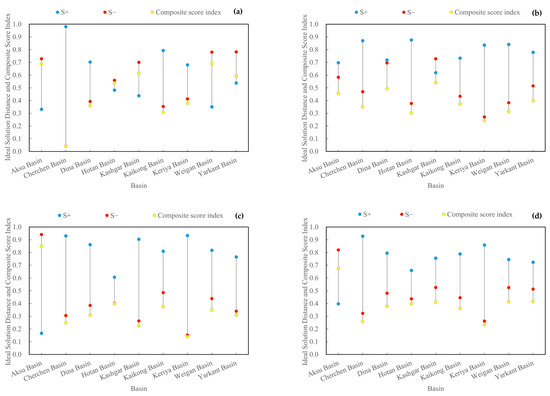
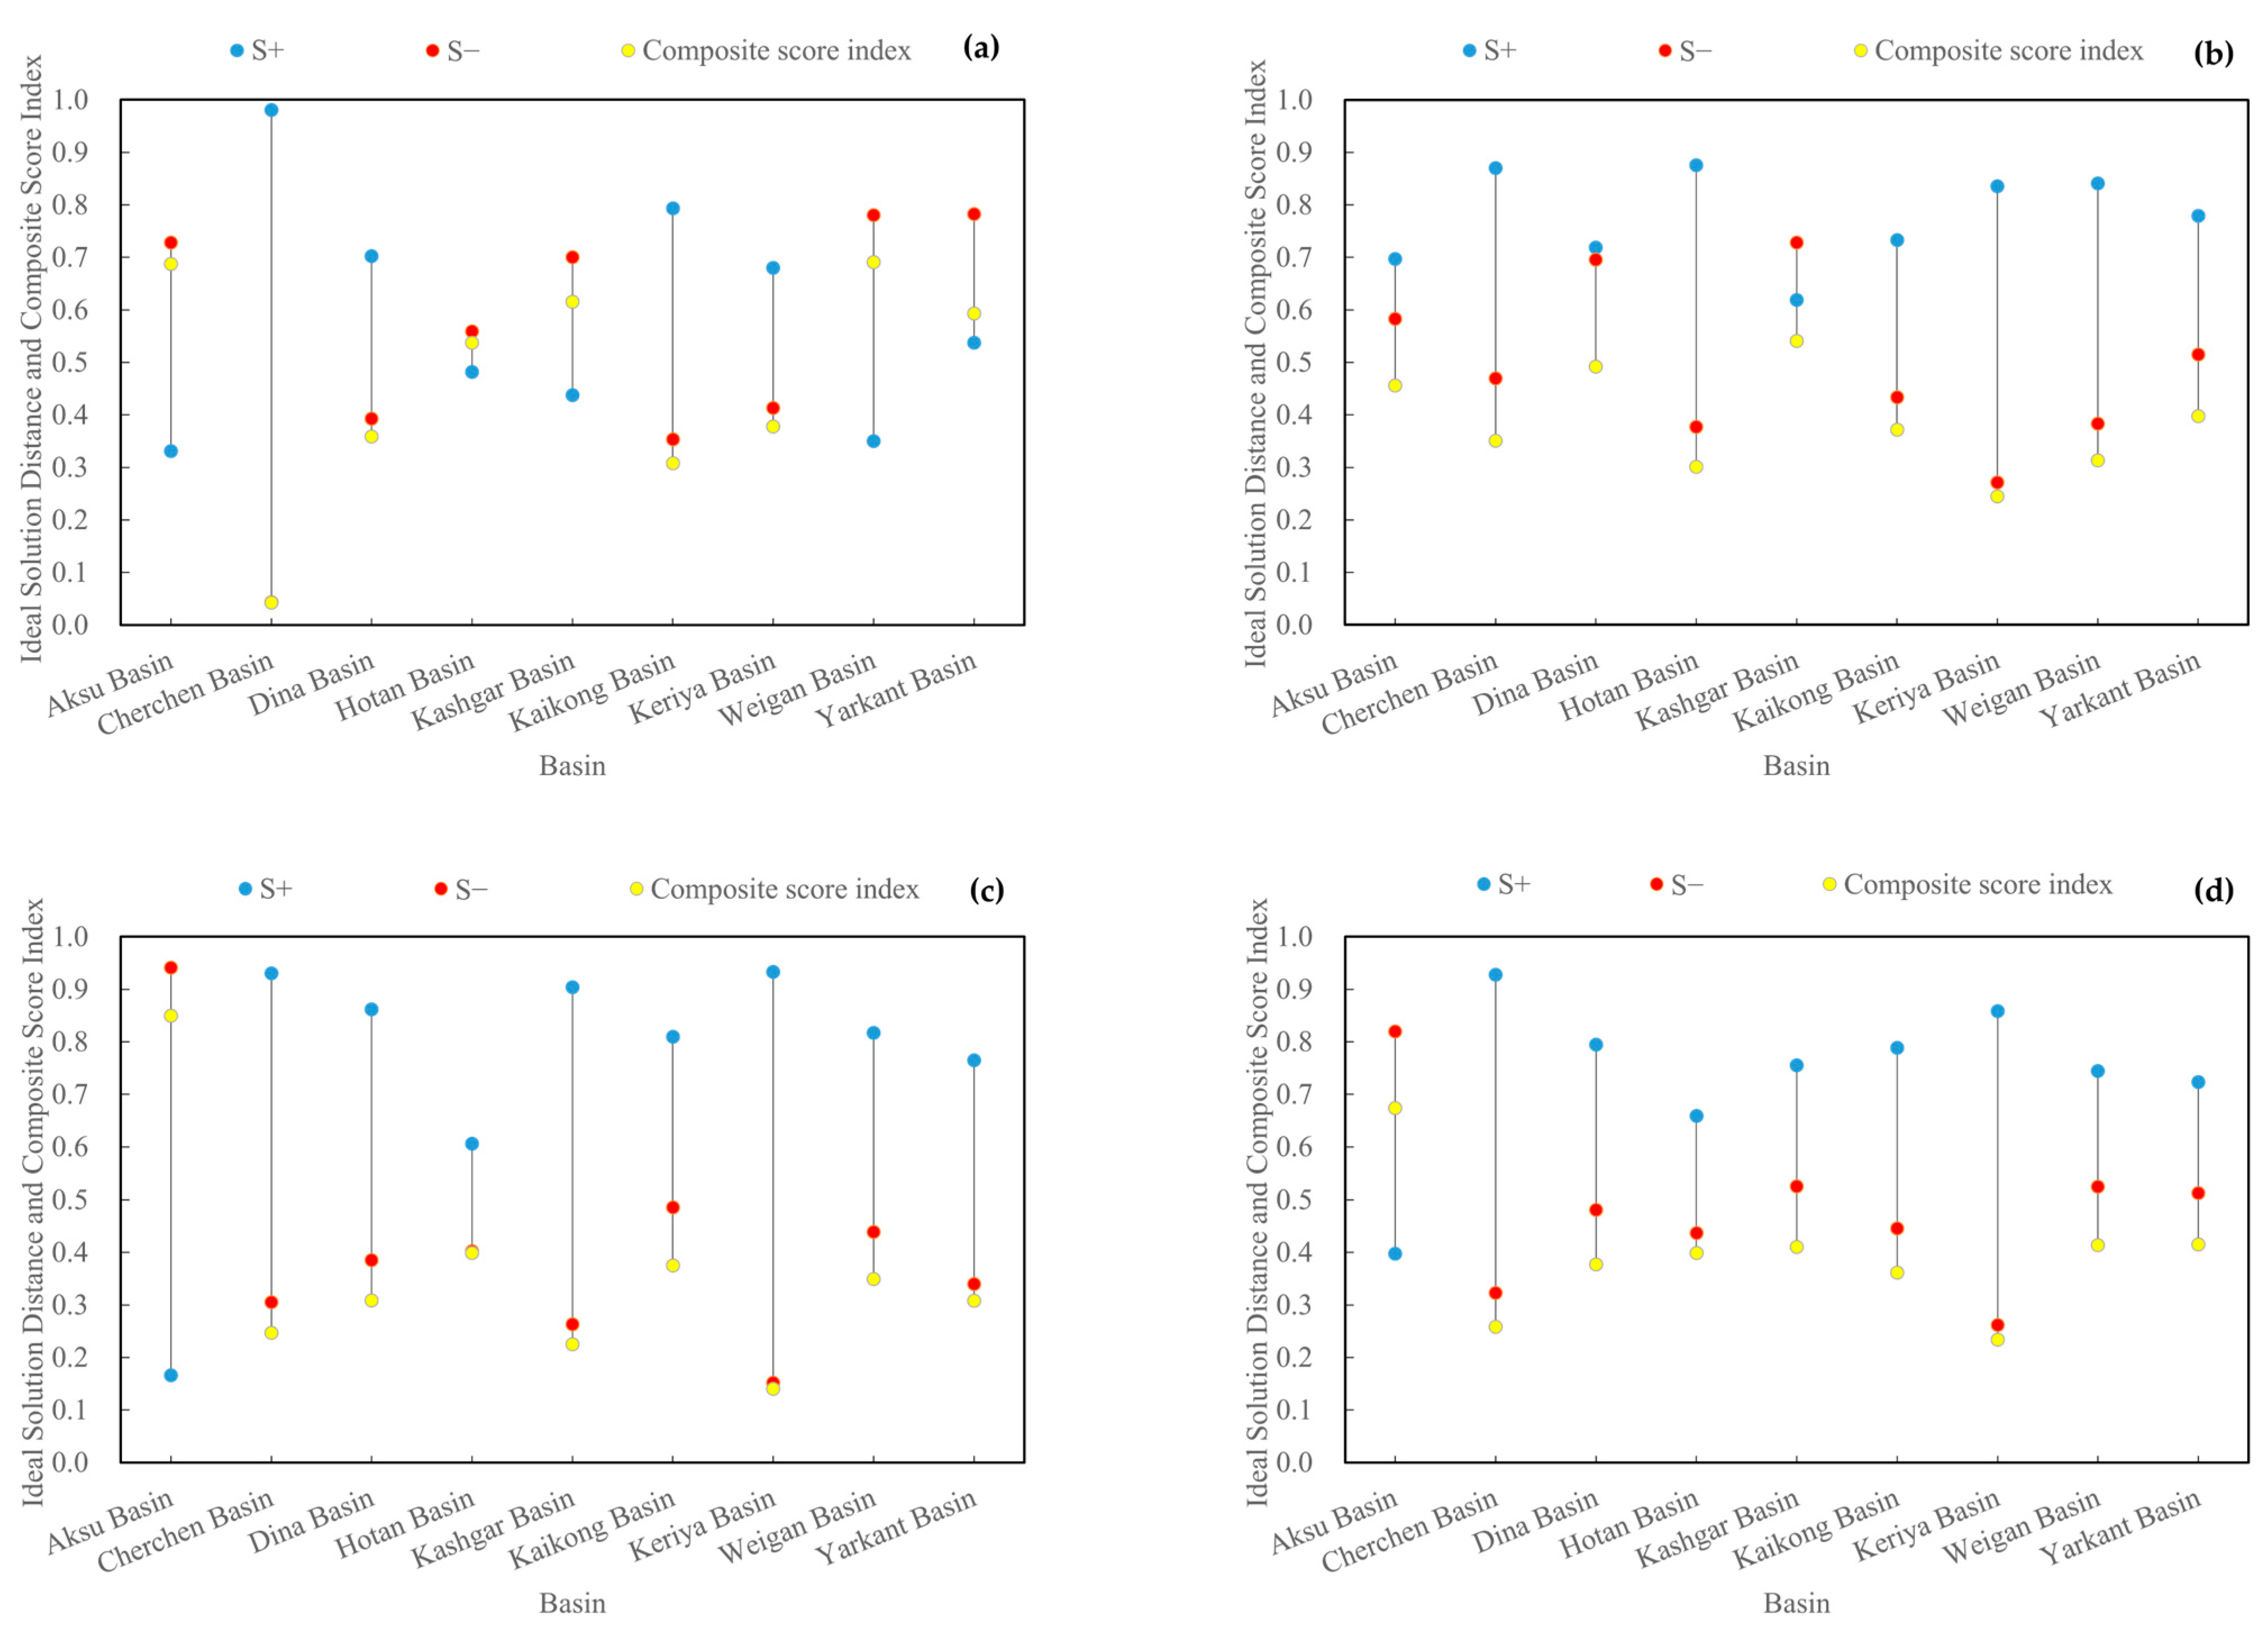
Figure 2.
Plot of ideal solution distance versus composite score index under different connectivities in the headwater basin: (a) pattern connectivity, (b) structural connectivity, (c) functional connectivity and (d) comprehensive connectivity.
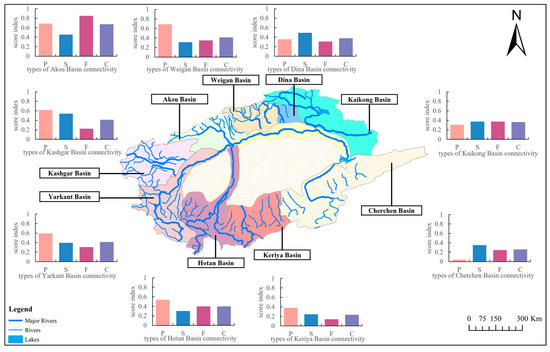
Figure 3.
Plot of ideal solution distance versus composite score index under different connectivities in the headwater basin (P, S, F and C represent pattern connectivity, structural connectivity, functional connectivity and comprehensive connectivity).
3.1. Evaluation of Water System Connectivity
Overall, the Aksu Basin had the best connectivity, with a score index of 0.674, and the Keriya Basin had the worst connectivity, with a composite score index of 0.233, a difference of nearly two times. This was mainly due to the fact that the Aksu Basin had a more balanced performance with better pattern connectivity, structural connectivity and functional connectivity, while the Keriya Basin had the worst performance in terms of structural connectivity and functional connectivity. The scores of the other basins were mostly concentrated in the range of 0.36–0.42, with different strengths and weaknesses in different connectivity aspects.
In terms of pattern connectivity, the score index was highest for the Weigan Basin, at 0.691; the lowest was the Cherchen Basin, at 0.042. Among them, the coefficients for river network development greatly varied from basin to basin. The river network development coefficient of the Weigan Basin was 15.159 and the tributary water system was highly developed. In contrast, the river network development coefficient of the Kaikong Basin was only 0.286, which was due to the fact that the Kaikong Basin was dominated by the main stream and had fewer tributaries. Also, this led to a smaller number of rivers in the basin and a low ranking of river frequency. The length of the river network and ecological network connectivity in the Cherchen Basin were low, reflecting the weak development of river systems, low landscape fragmentation and poor connectivity. In terms of structural connectivity, the score index was highest in the Kashgar Basin at 0.540 and lowest in the Keriya Basin at 0.245. Among them, the degree of water system circularity was low in the Tarim River Basin because the water systems in the Tarim River Basin were tree-like water systems rather than the ring-like water systems common in plain areas. Although there were many small rivers in the Keriya Basin, there were fewer surface connections between rivers and water transfer and energy exchange were weak, which ultimately led to its poor structural connectivity. In terms of functional connectivity, the Aksu Basin had the highest score index of 0.850 and the Keriya Basin had the lowest score index of 0.140. Among them, the Aksu River had the largest amount of water belonging to the main stream of the Tarim River, while the Keriya River did not join the main stream of the Tarim River. Although the Cherchen River transferred water to the main stream of the Tarim River through Taitema Lake, the amount of water transferred was low and the fractional vegetation cover and surface runoff index in the basin were small, which ultimately led to the functional connectivity of the basin also being weak.
3.2. Centrality Analysis of Nodes in the Water System Network
In this study, the water system network was considered as a directed graph. By analyzing the centrality of nodes in the basin, these nodes could be effectively managed for the optimal allocation of water resources. Gephi 0.10.1 and ArcMap 10.8 software were used to calculate the node centrality of the water system network in the Tarim River Basin. The range of the node centrality indicators of the basin water system network is shown in Table 3, the distribution of the node centrality of the basin water system network is shown in Figure 4, the number and percentage of nodes of different degrees of importance of the basin water system network are shown in Figure 5 and the comparison of the node centrality values of the headwater basins is shown in Figure 6.
Table 3.
Range of centrality indicators for nodes of the Tarim River Basin water system network.
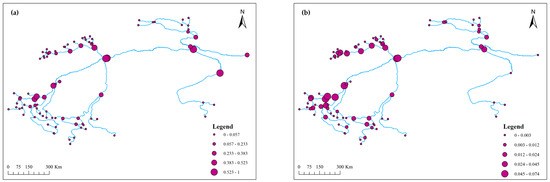
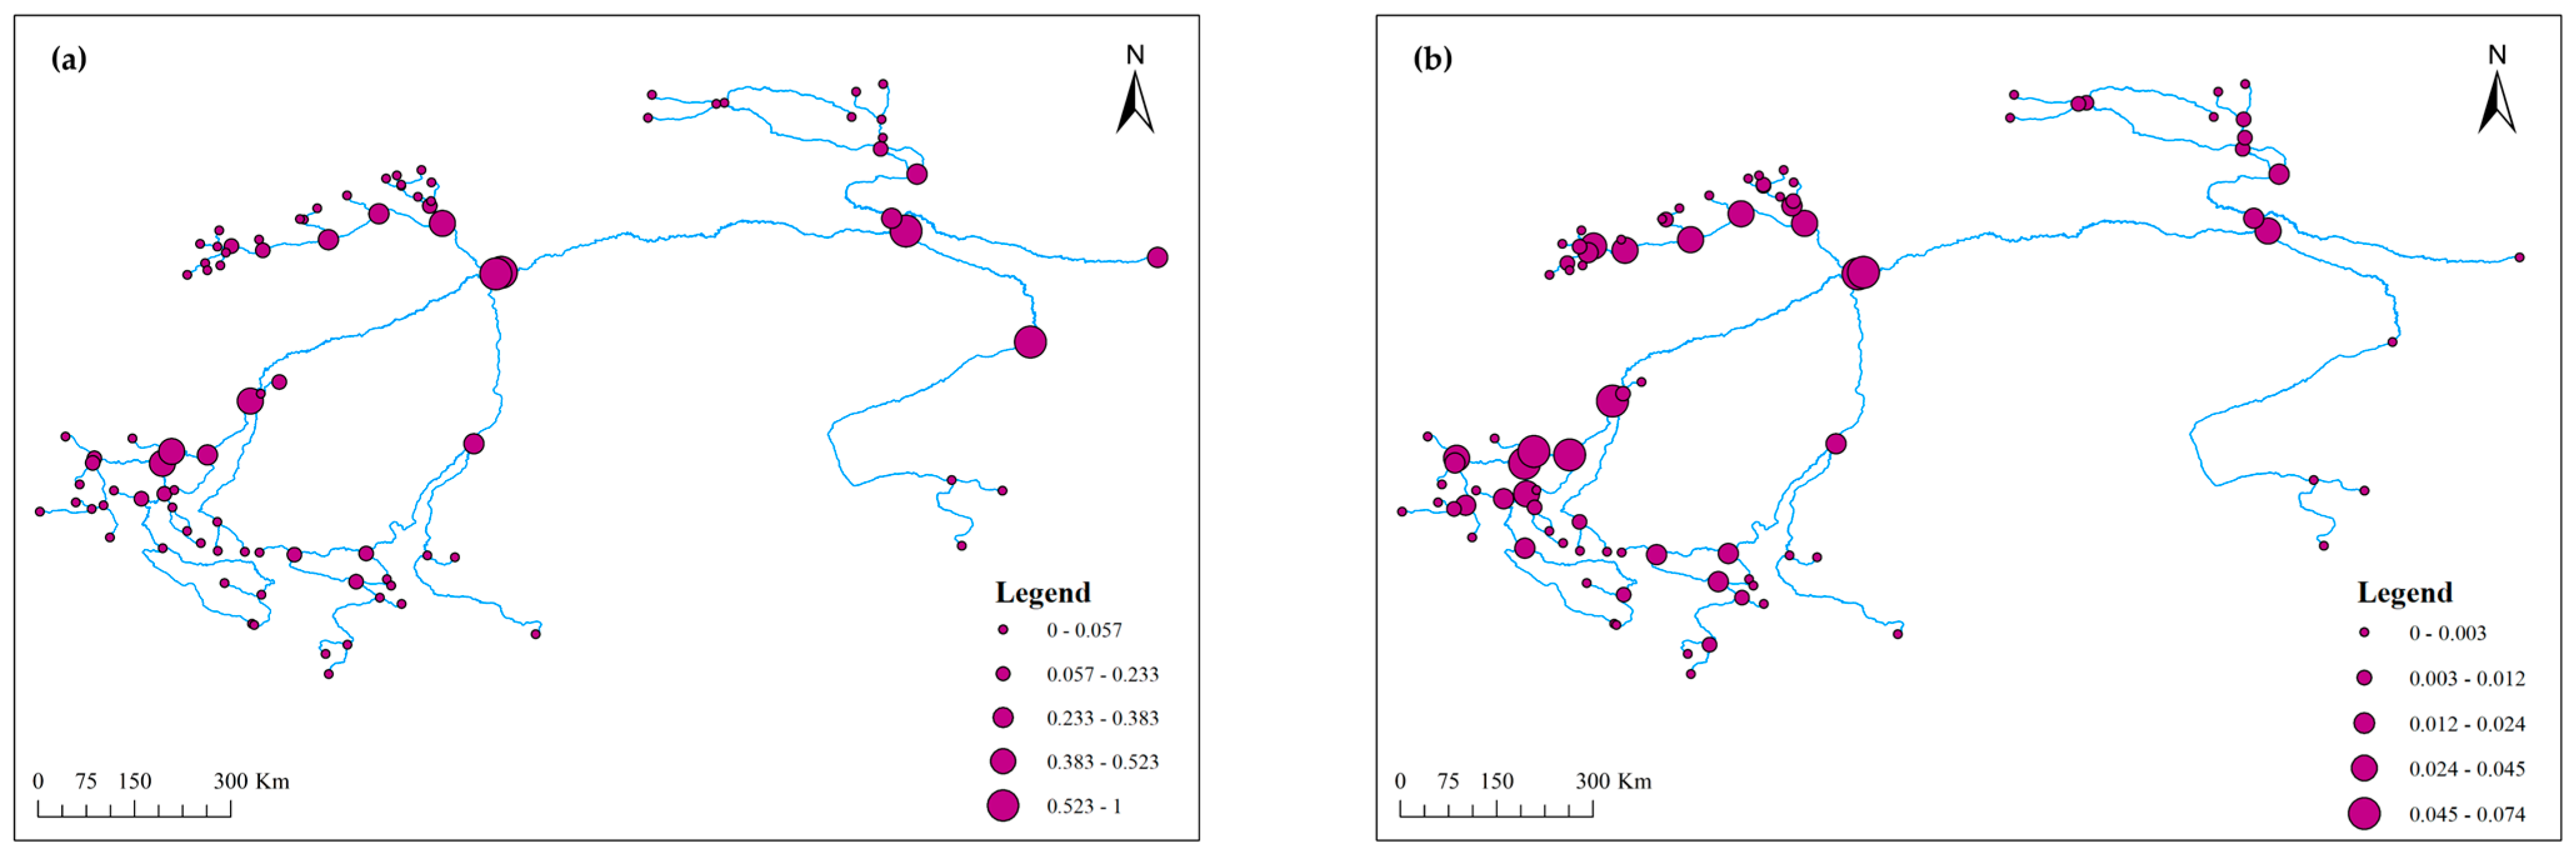
Figure 4.
Distribution of node centrality in the Tarim River Basin water system network: (a) eigenvector centrality; (b) betweenness centrality.
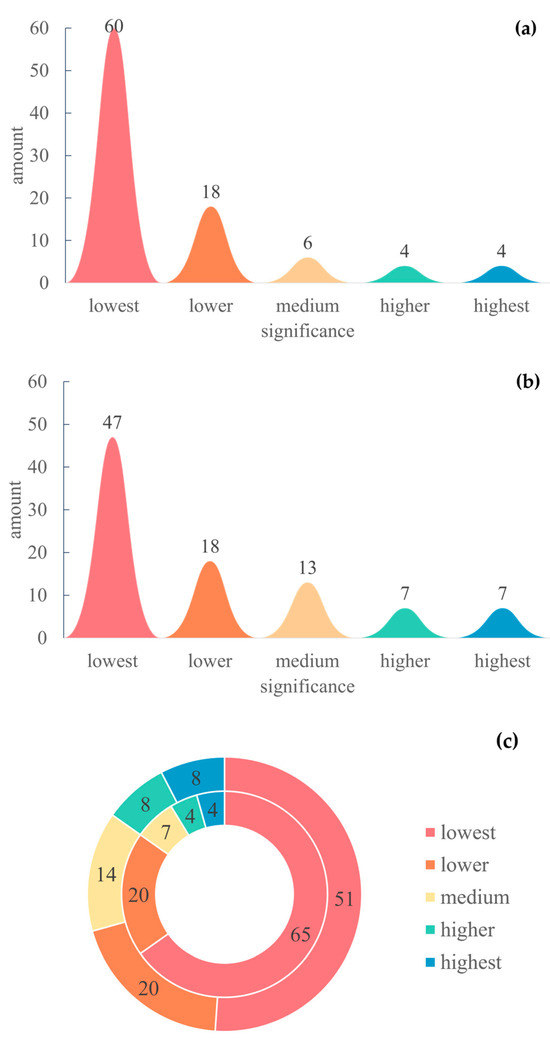
Figure 5.
Number and percentage of nodes of different importance in the Tarim River Basin water system: (a) number of nodes with different levels of importance in terms of eigenvector centrality; (b) number of nodes with different levels of importance in terms of betweenness centrality; (c) percentage of nodes with different levels of importance, where the inner measuring circle is the eigenvector centrality and the outer circle is the betweenness centrality.
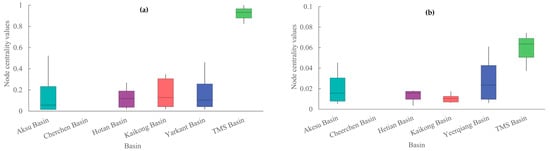
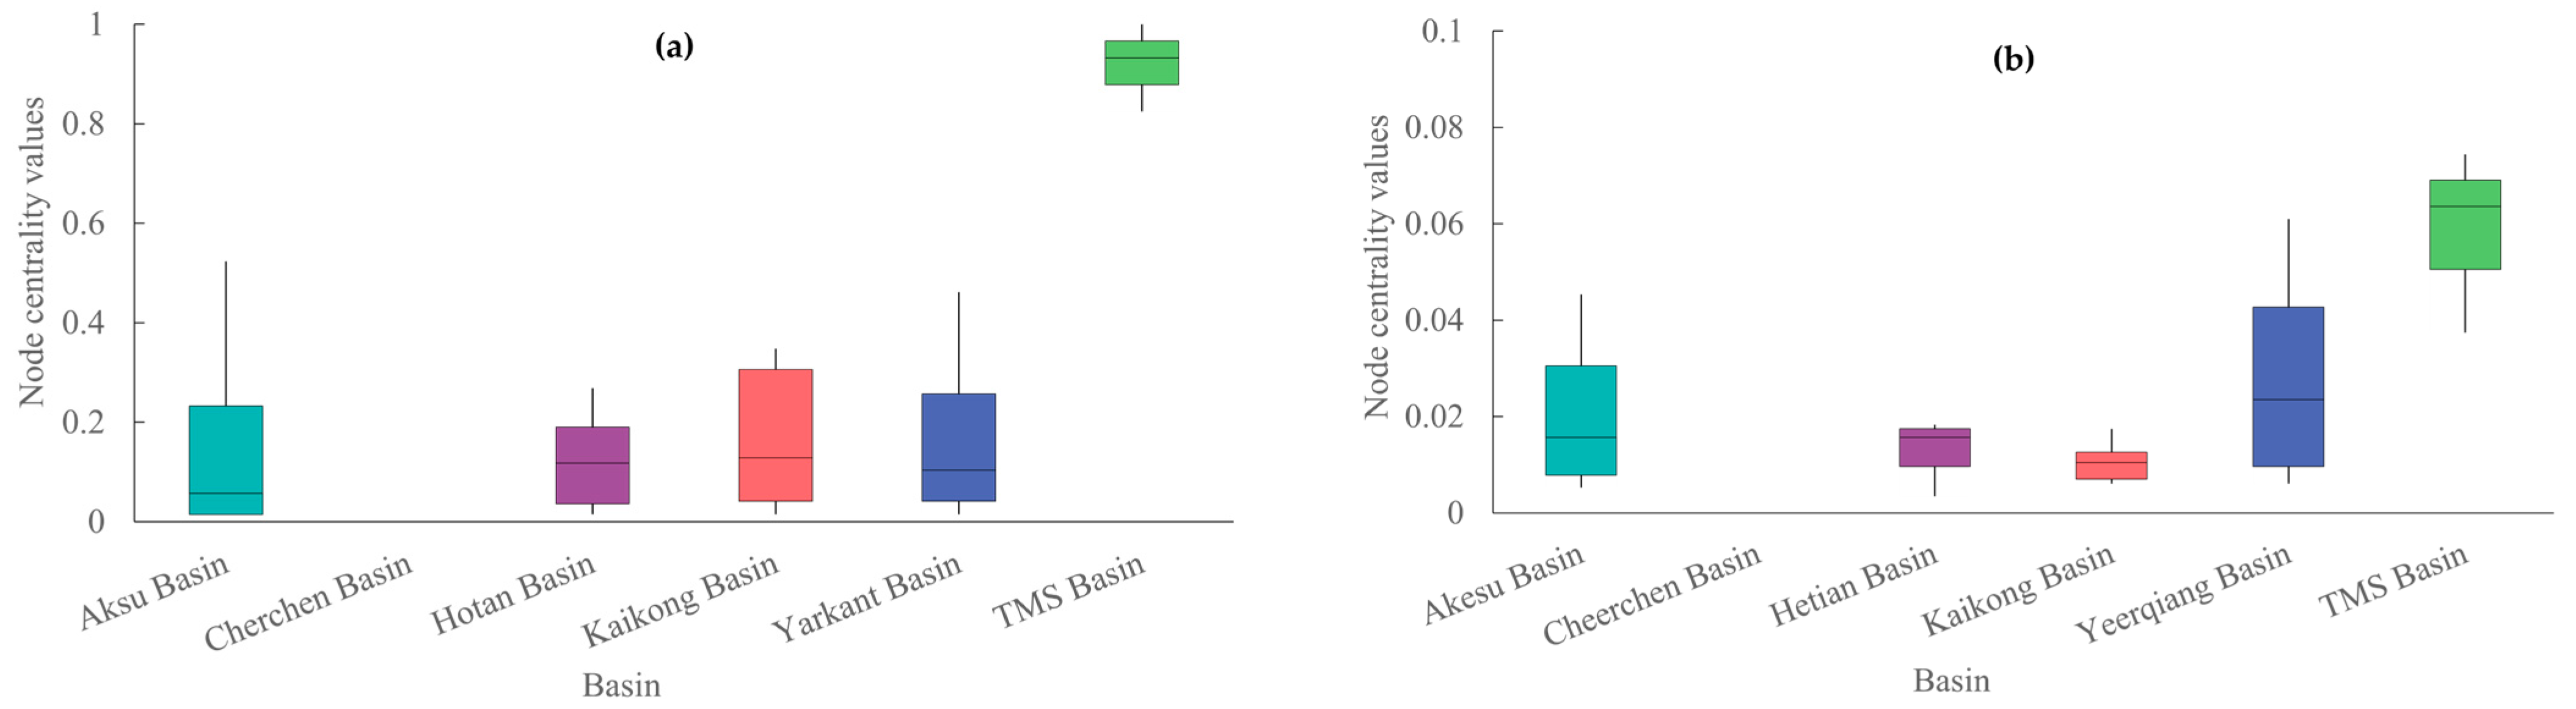
Figure 6.
Comparison of node centrality values for headwater basins: (a) eigenvector centrality; (b) betweenness centrality, which excludes nodes with a centrality value of 0.
The ranges of eigenvector centrality and betweenness centrality were 0–1 and 0–0.074, respectively, with a large difference. However, as a whole, the number of nodes corresponding with both eigenvector centrality and betweenness centrality tended to decrease as the degree of importance increased. The total number of nodes in the water network was 92, of which the number of nodes with the lowest degree of importance of eigenvector centrality and betweenness centrality was the highest, at 60 and 47 nodes, respectively, accounting for 65% and 51%. This was mainly due to the fact that the number of originating points of the river network was higher than the number of intermediate nodes of the river network, which had a point degree of 1 and were not on the shortest path of any two nodes. The degree of the nodes connected to them was usually smaller, which resulted in their centrality value of 0. The nodes with the highest degree of eigenvector centrality and betweenness centrality had the lowest number of nodes, which were 4 and 7 nodes, respectively, with a ratio of 4% and 7%. They were usually located where mainstems or source streams intersected as the shortest paths of any two nodes usually passed through them and the degree of nodes connected to them were larger.
In terms of spatial distribution, the trends of eigenvector centrality and betweenness centrality were similar but different in different basins. The best performance of centrality was found in the mainstem basins, in which the highest eigenvector centrality value was 1 at the confluence node of the main stream of the Tarim River with the trunk engineering of Kuta, and the highest betweenness centrality value was 0.074 at the confluence node of the main stream of the Tarim River with the Aksu River and the Yarkant River. The poorest performance of centrality was found in the Cherchen Basin, in which the eigenvector centrality value and the betweenness centrality value were only 0.014 and 0.0009 at the confluence nodes of the Wuluqsu and Arayarik Rivers, mainly due to the lack of geomorphology in the rivers of the basin. The most important reason was that the rivers in the basin lacked surface connection and could not exchange material and energy. The Aksu Basin and the Yarkant Basin had their own advantages and disadvantages in terms of eigenvector centrality and betweenness centrality. The Kaikong Basin was connected to the main stream of the Tarim River through the trunk engineering of Kuta, which was closer to the node with the highest eigenvector centrality and led to better performance in eigenvector centrality than betweenness centrality.
4. Discussion
Although traditional water system connectivity assessments often focus on small-scale basins, this paper focused on the Tarim River Basin, the largest inland river basin in China. The quantitative assessment of water system connectivity in the Tarim River Basin could solve the problem of the uneven distribution of water resources in the basin, thus enhancing the ecosystem and carrying capacity of rivers, lakes and reservoirs. Although the Kashgar River did not eventually join the Tarim River mainstem, the Kashgar Basin performed well in terms of pattern connectivity and structural connectivity. The monitoring and assessment of water resources in the basin could be strengthened in the future. The use of remote sensing, Internet of Things and other advanced technical means could enhance the real-time monitoring of water quantity, water quality and water ecological conditions to provide a scientific basis for water resource management and decision-making [28]. In addition, comprehensive assessments of water resources are regularly conducted to clarify the total amount, availability and distribution of water resources in a river basin and to scientifically predict future trends in the supply and demand of water resources [29]. At the same time, promoting the construction of a water-saving society to conserve water is a fundamental method to alleviate the contradiction between the supply and demand of water resources. Through the promotion of water-saving irrigation technology, the implementation of industrial water recycling, improving leakage control standards for urban water supply networks and the popularization of water-saving appliances, the awareness of water conservation in society and the efficiency of water resource use have been comprehensively raised. Furthermore, the scientific planning and rational implementation of inter-basin water transfer projects could achieve the optimal allocation and efficient use of water resources [30]. Such projects need to take the impact on the ecological environment into full consideration to ensure that the ecological balance is not disturbed during the transfer process and, at the same time, strengthen the management and protection of water resources in receiving areas to prevent a deterioration in water quality and wastage. Last but not least, good water quality is the basis for the sustainable use of water resources. It is, therefore, necessary to increase efforts to prevent and control water pollution, strictly control industrial wastewater agricultural surface pollution and urban domestic sewage discharge, promote the construction and upgrade of sewage treatment facilities and improve sewage collection as well as the treatment rate and reuse rate. At the same time, the protection and restoration of water ecology should be strengthened, a river and lake length system should be implemented, aquatic biodiversity should be restored and the healthy life of rivers [31] and lakes should be maintained.
This article also analyzed the distribution of important nodes in the watershed by introducing node centrality via a complex network analysis. Based on the distribution of important nodes and the water demand law, the ecological flow control sections were scientifically and reasonably delineated and the ecological water demand and guarantee target of each section were clarified. On the basis of a clear ecological water control section, a refined water scheduling program should be implemented. By optimizing the allocation of water resources, it can be ensured that sufficient ecological water is provided to the river ecosystem while meeting the water needs of human production and living. This requires co-ordination and co-operation between government departments to develop and implement a scientific water scheduling plan [32]. A sound monitoring network for ecological water control sections has been established to monitor real-time key indicators such as water quantity, water quality and ecological conditions. In the meantime, regular ecological assessments are carried out to evaluate the effectiveness of the protection of ecological water control sections and the health of river ecosystems. This helps to identify problems in a timely manner and to take measures to solve them. Eventually, with regard to ecological and environmental problems concerning ecological water control sections such as water pollution and wetland degradation, ecological restoration and protection work has actively been promoted. Through the implementation of measures such as ecological water replenishment, wetland restoration and vegetation planting [33], the quality of the ecological environment around cross-sections has been improved and the self-recovery capacity of the river ecosystem has been enhanced.
5. Conclusions and Recommendations
In this study, a more complete evaluation system was constructed using three aspects—namely, pattern connectivity, structural connectivity and functional connectivity—to evaluate the water system connectivity of the source basins of the Tarim River Basin. In addition, the centrality of water system network nodes, which was closely related to the connectivity of the water systems in the basin, was also analyzed.
However, the article had the following limitations:
- (1)
- The article only compared the connectivity of different headwater basins in the Tarim River Basin and lacked a time-scale comparison.
- (2)
- The analytic hierarchy process required the decision-maker to have an in-depth understanding of the problem in order to accurately construct the judgment matrix.
- (3)
- Betweenness centrality heavily relied on the shortest path of the river. However, in actual watersheds, the flow may be affected by a variety of factors such as the topography, vegetation and soil type.
- (4)
- Eigenvector centrality emphasized the connection relationship between nodes and important nodes, but may have ignored the contribution of the node’s own characteristics (e.g., water quantity and water quality) to the connectivity of the watershed.
The following future improvements could be made:
- (1)
- The connectivity and importance of the nodes could be comprehensively assessed and other network analysis metrics and methods such as closeness centrality and clustering coefficients could be explored.
- (2)
- The watershed system has complexity and uncertainty; an uncertainty analysis could be introduced in the future to assess the impact of different parameters and assumptions on the results.
- (3)
- A demonstration project could be conducted to verify the validity and feasibility of the research results.
Author Contributions
Conceptualization, J.Y. and C.Z.; methodology, J.Y.; software, J.Y., Y.D., B.Z. and H.L.; validation, J.Y. and C.Z.; formal analysis, J.Y. and Y.D.; resources, C.Z. and G.F.; data curation, J.Y.; writing—original draft preparation, J.Y.; writing—review and editing, C.Z. and C.L.; visualization, J.Y.; supervision, Y.C., C.Z., Z.L. and G.F.; project administration, Y.C.; funding acquisition, Y.C. All authors have read and agreed to the published version of the manuscript.
Funding
This research was funded by Xinjiang Natural Science Foundation Key Projects, (Sponsor Yaning Chen, Grant No. 2021D01D01) and the Third Xinjiang Scientific Expedition Program (Sponsor Zhi Li, Grant No. 2022xjkk0106).
Data Availability Statement
Data will be provided upon request.
Acknowledgments
We would like to thank Chuan Wang and Jianghai Li for their invaluable support in this research.
Conflicts of Interest
The authors declare no conflicts of interest.
References
- Xia, J.; Gao, Y.; Zuo, Q.; Liu, X.; Chen, Q.; Dou, M. Characteristics of Interconnected Rivers System and Its Ecological Effects on Water Environment. Prog. Geogr. 2012, 31, 26–31. [Google Scholar]
- Xu, Z.; Pang, B.; Leng, L. Research on the construction of river-lake system connectivity and national water network. South North Water Transf. Water Sci. Technol. 2022, 20, 757–764. [Google Scholar] [CrossRef]
- Jin, F.; Ye, Z.; Chen, Z.; Ma, L. National Water Network Construction for Serving the Chinese Path to Modernization: Development Direction and Strategic Approach. Econ. Geogr. 2024, 44, 148–156. [Google Scholar] [CrossRef]
- Lu, M.; Xu, Y.; Gao, B.; Zhou, C. Variations of hydrological connectivity regulated by sluices in a delta plain. Acta Geogr. Sin. 2021, 76, 2685–2696. [Google Scholar]
- Yin, L.; Zhang, J.; Jiang, J.; Zhang, P.; Gu, X.; Dong, J.; Guo, P.; Yang, B.; Li, Y. Issues and countermeasures on water resources in the Southern Xinjiang. China Geol. 2023, 50, 1–12. [Google Scholar]
- Liu, C.; Chen, Y.; Fang, G.; Zhou, H.; Huang, W.; Liu, Y.; Wang, X.; Li, Z. Hydrological Connectivity Improves the Water-Related Environment in a Typical Arid Inland River Basin in Xinjiang, China. Remote Sens. 2022, 14, 4977. [Google Scholar] [CrossRef]
- Wang, Y.; Wang, H.; Liu, D. Intermittency of Endorheic Rivers in the Tarim River Basin. J. Basic Sci. Eng. 2023, 31, 257–267. [Google Scholar] [CrossRef]
- Wang, Y.; Chen, Y.; Chen, K. Index system of water system connectivity and its application. J. Hydraul. Eng. 2020, 51, 1080–1088+1100. [Google Scholar] [CrossRef]
- Gao, X.; Hu, Z.; Yan, C.; Sun, B. Construction and application of water system connectivity evaluation index system considering hydraulic connectivity. Water Res. Protect. 2022, 38, 41–47. [Google Scholar]
- Bu, J.; Zhang, S.; Li, C.; Xu, X.; Wang, X.; Liu, Q.; Wang, X. A Longitudinal Functional Connectivity Comprehensive Index for Multi-Sluice Flood Control System in Plain Urban River Networks. J. Hydrol. 2022, 613, 128362. [Google Scholar] [CrossRef]
- Zhang, C.; Kuai, S.; Tang, C.; Zhang, S. Evaluation of Hydrological Connectivity in a River Floodplain System and Its Influence on the Vegetation Coverage. Ecol. Indic. 2022, 144, 109445. [Google Scholar] [CrossRef]
- Fang, S.; Chen, M.; Li, J.; Zhang, L.; Zhang, Y.; Yang, C.; Wang, H. Evaluation and Optimization of Urban Hydrological Connectivity Based on Graph Theory: A Case Study in Chengdu, China. Ecol. Inform. 2024, 82, 102749. [Google Scholar] [CrossRef]
- Hajibabaei, M.; Hesarkazzazi, S.; Minaei, A.; Dastgir, A.; Sitzenfrei, R. Using Complex Network Theory for Missing Data Reconstruction in Water Distribution Networks. Sust. Cities Soc. 2024, 101, 105114. [Google Scholar] [CrossRef]
- Spence, C.; Phillips, R.W. Refining Understanding of Hydrological Connectivity in a Boreal Catchment. Hydrol. Process. 2015, 29, 3491–3503. [Google Scholar] [CrossRef]
- Halverson, M.J.; Fleming, S.W. Complex Network Theory, Streamflow, and Hydrometric Monitoring System Design. Hydrol. Earth Syst. Sci. 2015, 19, 3301–3318. [Google Scholar] [CrossRef]
- Chen, Y.; Hao, X.; Chen, Y.; Zhu, C. Study on Water System Connectivity and Ecological Protection Countermeasures of Tarim River Basin in Xinjiang. Bull. Chin. Acad. Sci. 2019, 34, 1156–1164. [Google Scholar] [CrossRef]
- Wang, Y.; Zi, F.; Lu, S.; Li, M.; Zhou, J.; Yang, X.; Wang, W.; Niu, R. Analysis of surface-groundwater changes in the Tarim River Basin of Xinjiang from 1989 to 2019. Sci. Geogr. Sin. 2023, 43, 899–909. [Google Scholar] [CrossRef]
- Li, Y.; Wang, S. Exploration of Eco-Environment and Urbanization Changes Based on Multi-Source Remote Sensing Data-A Case Study of Yangtze River Delta Urban Agglomeration. Sustainability 2024, 16, 5903. [Google Scholar] [CrossRef]
- Zuo, Q.; Zhang, Z.; Wu, B. Evaluation of water resources carrying capacity of nine provinces in Yellow River Basin based on combined weight TOPSIS model. Water Res. Protect. 2020, 36, 1–7. [Google Scholar]
- Liang, X.; Ju, W.; Sun, B.; Hu, Z.; Gao, X.; Zhang, J.; Zhao, J. Water system connectivity evaluation in plain urban river network based on AHP-entropy weight method: A case study of Langfang City. South North Water Transf. Water Sci. Technol. 2022, 20, 352–364. [Google Scholar] [CrossRef]
- Li, F.; Zhao, Y. Evaluation of water network connectivity using complex network method based on node-subbasin double layer structure. J. Water Resour. Water Eng. 2023, 34, 16–26. [Google Scholar]
- Ren, X.; Lü, L. Review of ranking nodes in complex networks. Chin. Sci. Bull. 2014, 59, 1175–1197. [Google Scholar] [CrossRef]
- Dou, M.; Yu, J.; Guan, J.; Yang, L.; Wang, C.; Li, G. Study on relationship between water system development and connectivity in China based on water resource zoning. Adv. Water Sci. 2023, 34, 877–886. [Google Scholar] [CrossRef]
- Wang, Y. The connectivity evaluation of Shanghai urban landscape eco-network. Geogr. Res. 2009, 28, 284–292. [Google Scholar]
- Fu, C.; Deng, J.; Ouyang, H.; Fu, Y.; Zhang, J. Layout and Optimization of Urban Water System Connectivity Based on the Graph Theory. Sci. Geogr. Sin. 2022, 42, 2028–2038. [Google Scholar] [CrossRef]
- Gao, T.; Yin, X.; He, S.; Zhao, Y. Structural Connectivity Evaluation of the Baiyangdian Lake Water System. J. Hydroecol. 2020, 41, 63–69. [Google Scholar] [CrossRef]
- Hu, R.; Chang, J.; Deng, M.; Zhou, H.; Guo, A.; Wang, Y. Multi-dimensional response of hydrological connectivity to ecological water conveyance project. J. Hydraul. Eng. 2023, 54, 1359–1370. [Google Scholar] [CrossRef]
- Dörnhöfer, K.; Oppelt, N. Remote Sensing for Lake Research and Monitoring–Recent Advances. Ecol. Indic. 2016, 64, 105–122. [Google Scholar] [CrossRef]
- Juwana, I.; Muttil, N.; Perera, B.J.C. Indicator-Based Water Sustainability Assessment—A Review. Sci. Total Environ. 2012, 438, 357–371. [Google Scholar] [CrossRef]
- Zhao, Z.-Y.; Zuo, J.; Zillante, G. Transformation of Water Resource Management: A Case Study of the South-to-North Water Diversion Project. J. Clean Prod. 2017, 163, 136–145. [Google Scholar] [CrossRef]
- Jacinto, E.; Fangue, N.A.; Cocherell, D.E.; Kiernan, J.D.; Moyle, P.B.; Rypel, A.L. Increasing Stability of a Native Freshwater Fish Assemblage Following Flow Rehabilitation. Ecol. Appl. 2023, 33, e2868. [Google Scholar] [CrossRef] [PubMed]
- Basuki, T.M.; Nugroho, H.Y.S.H.; Indrajaya, Y.; Pramono, I.B.; Nugroho, N.P.; Supangat, A.B.; Indrawati, D.R.; Savitri, E.; Wahyuningrum, N.; Purwanto; et al. Improvement of Integrated Watershed Management in Indonesia for Mitigation and Adaptation to Climate Change: A Review. Sustainability 2022, 14, 9997. [Google Scholar] [CrossRef]
- Cai, Y.; Liang, J.; Zhang, P.; Wang, Q.; Wu, Y.; Ding, Y.; Wang, H.; Fu, C.; Sun, J. Review on Strategies of Close-to-Natural Wetland Restoration and a Brief Case Plan for a Typical Wetland in Northern China. Chemosphere 2021, 285, 131534. [Google Scholar] [CrossRef] [PubMed]


Disclaimer/Publisher’s Note: The statements, opinions and data contained in all publications are solely those of the individual author(s) and contributor(s) and not of MDPI and/or the editor(s). MDPI and/or the editor(s) disclaim responsibility for any injury to people or property resulting from any ideas, methods, instructions or products referred to in the content. |
© 2024 by the authors. Licensee MDPI, Basel, Switzerland. This article is an open access article distributed under the terms and conditions of the Creative Commons Attribution (CC BY) license (https://creativecommons.org/licenses/by/4.0/).