Article

Study on the Fine Characterization of Spatial Distribution and Predictive Modeling of Remediation of Site Pollution

School of Environmental and Chemical Engineering, Shanghai University, Shanghai 200444, China
*
Author to whom correspondence should be addressed.
Water 2024, 16(21), 3154; https://doi.org/10.3390/w16213154
Submission received: 7 October 2024 / Revised: 30 October 2024 / Accepted: 1 November 2024 / Published: 4 November 2024
(This article belongs to the Topic Organic Pollution in Soil and Groundwater)

Abstract

:
The present study focuses on a site contaminated with halogenated hydrocarbons, utilizing a detailed inventory of contamination data to achieve the precise characterization of groundwater pollution. Employing MOFLOW-2000 software, a groundwater flow model was established for the study area. In conjunction with MT3DMS, a predictive model was constructed to simulate and forecast the spatiotemporal distribution of contaminant migration and attenuation following site remediation. The simulation area was delineated based on geographical features, with the vertical simulation range of strata also determined. To establish a hydrogeological conceptual model for the target remediation site, comprehensive hydrogeological data were collected, encompassing geological structures, hydrological parameters, and rainfall information. Model calibration was based on the six layers of low-permeability aquifer intervals revealed by geological exploration wells MW1–5, as well as the distribution of groundwater-level contours and rainfall data. Based on data from September 2010, an initial three-dimensional model of tetrachloroethylene (PCE) distribution was generated. Subsequently, a solute transport model for PCE was established, incorporating various enhanced reductive dechlorination (ERD) remediation strategies applied at different times and locations. Calibration against actual monitoring data revealed the presence of unmonitored dense non-aqueous phase liquids (DNAPLs) at the site, contributing to the continuous release and elevation of PCE concentrations. By accounting for DNAPL release, the calibrated transport and attenuation model closely matched observed concentration decay patterns, effectively capturing the actual dynamics of contaminant transport and attenuation within the groundwater system. The modeling approach proposed in this study provides important support for contamination remediation and attenuation at the current site, and it is also applicable to simulating and predicting pollution scenarios at similar sites.

1. Introduction

The impact of site contamination on groundwater quality must be urgently addressed owing to the escalating population growth and intensifying industrial and agricultural activities [1,2,3]. Halogenated organic compounds (HOCs) have resulted in widespread environmental pollution issues due to their extensive usage, inadequate handling, and leakage [4,5,6,7]. These compounds primarily infiltrate underground aquifers through the discharge of organic waste liquids and precipitation leaching [8]. Owing to their slightly water-soluble and high-density properties, certain HOCs migrate downwards and accumulate in zones influenced by geological factors, leading to the formation of dense non-aqueous phase liquids (DNAPLs) [9,10].
In recent years, there has been a gradual shift from ex situ to in situ remediation technologies for HOCs due to their enhanced energy efficiency and cost-effectiveness [11]. In situ remediation technologies encompass physical, chemical, and biological remediation methods, as well as permeable reactive barrier technology. In situ physical remediation techniques, like thermal desorption technology, offer advantages such as short remediation cycles, high efficiency, and broad applicability. Various enhanced reductive dechlorination (ERD) technologies, including zero-valent iron synergistic biocarbon technology (EHC), have been successfully employed for the in situ treatment of chlorinated hydrocarbons at contaminated sites. EHC exhibits potent chemical reduction activity and synergistic bioremediation capabilities, making it suitable for long-term remediation [12,13,14].
In situ bioremediation encompasses two primary methods: biostimulation and bioaugmentation. Biostimulation entails the injection of nutrient-rich emulsified vegetable oil (EVO) across a large area to stimulate the growth of organohalide-respiring bacteria (ORB), which then reduce halogenated organic matter [15,16,17,18]. In contrast, bioaugmentation involves introducing isolated strains of ORB (e.g., KB-1) to enhance halogenated respiration and decrease the levels of target halogenated organics [19]. Both methods have been extensively researched [20] and implemented at various times and locations throughout the five-year remediation process at the study site.
Understanding groundwater flow, recharge, and contaminant transport can effectively predict contaminant migration, attenuation, and aid in designing appropriate in situ remediation methods. Numerical simulations of contaminants in groundwater have become the primary method for studying contaminant behavior within groundwater systems [21,22,23]. Chen et al. [24] used T-PROGS software(GMS 10.4) to establish a three-dimensional stratigraphic model of a chlor-alkali contaminated site based on lithological information obtained from soil borings. They numerically simulated the groundwater flow using hydrogeological modeling and groundwater monitoring to determine the transport behavior of the contaminant plume in the groundwater. Wang et al. [25] utilized the MODFLOW and MT3DMS software (5.3 version) packages to model and assess hydrological conditions, water quality attributes, and the migration patterns of ammonia nitrogen within the groundwater system of the study region. Hussein et al. [26] employed numerical simulations (MODFLOW-2000 and MT3D programs) to predict groundwater flow and contaminant transport from sources to groundwater. Aly et al. [27] used MODFLOW and MT3DMS models to assess the potential radiation risks to society and the environment from the planned application of nuclear power plants in Egypt. Many other scholars have also used these models for simulation predictions [28,29,30,31,32,33,34,35,36]. For halogenated organic contaminated sites, the simulation effect of the contaminant transport attenuation model applied to MT3DMS is not yet clear, and the model’s simulation accuracy and problems need to be demonstrated.
To address these issues, a comprehensive dataset of tetrachloroethylene site contamination and remediation attenuation was used to establish a hydrogeological model, a three-dimensional representation of the initial tetrachloroethylene distribution, and a series of remediation models. With the time axis as a variable, various site areas were modeled throughout the remediation period, incorporating alternating dosing phases and intermittent periods at different time intervals. The prediction results from the initial model were used as the starting values for subsequent models, allowing for successive multi-model calculations. By calibrating the model with monitoring data, the simulation can efficiently predict pollutant migration and attenuation. This offers theoretical methods and effective approaches for simulating similar site remediation models.

2. Materials and Methods

2.1. Study Area

The site is located in a pre-mountain alluvial fan zone, with the overall topography in the vicinity being high in the northwest and low in the southeast. The terrain around the site is dominated by terraces, and the major rivers and their tributaries constitute the main drainage system of the area (Figure 1). The site’s climate is semi-arid with low precipitation, cool dry winters, warm summers, and low relative humidity. From 1953 to 2001, the average temperatures in January and July were −1 °C and 22 °C, respectively. The average annual precipitation during this period was 263.65 mm, with the highest precipitation occurring in summer and early fall, primarily from July to October, accounting for about 58% of the annual total.
The borehole and aquifer distribution profile of the study area is shown in Figure 2. The subsurface of the site primarily consists of silt and clay substrates, which have accumulated and been deposited in layers over the years. The flow direction of the middle and deep groundwater is generally consistent with that of the shallow groundwater, trending southeast. Based on the aquifer test results, the hydraulic conductivity of the preferential flow path through silt in the shallow layer (above 6.1 m) of the aquifer is calculated to range between 6.4 m/d and 9.75 m/d. In the intermediate aquifer zone (12.2 to 18.3 m depth), the hydraulic conductivity is about 1.92 m/d, and in the subsurface aquifer (18.3 to 24.4 m depth), it is about 0.64 m/d. The average shallow hydraulic conductivity, derived from aquifer tests, is 8.08 m/d. The measured values of the shallow, intermediate, and deep horizontal hydraulic gradients are 0.002, 0.003, and 0.003, respectively, with an assumed effective porosity of 0.28. Given that pollutants are mainly concentrated in the shallow aquifer, this layer was selected as the primary research object.

2.2. Modeling

2.2.1. Conceptual Hydrogeological Modeling

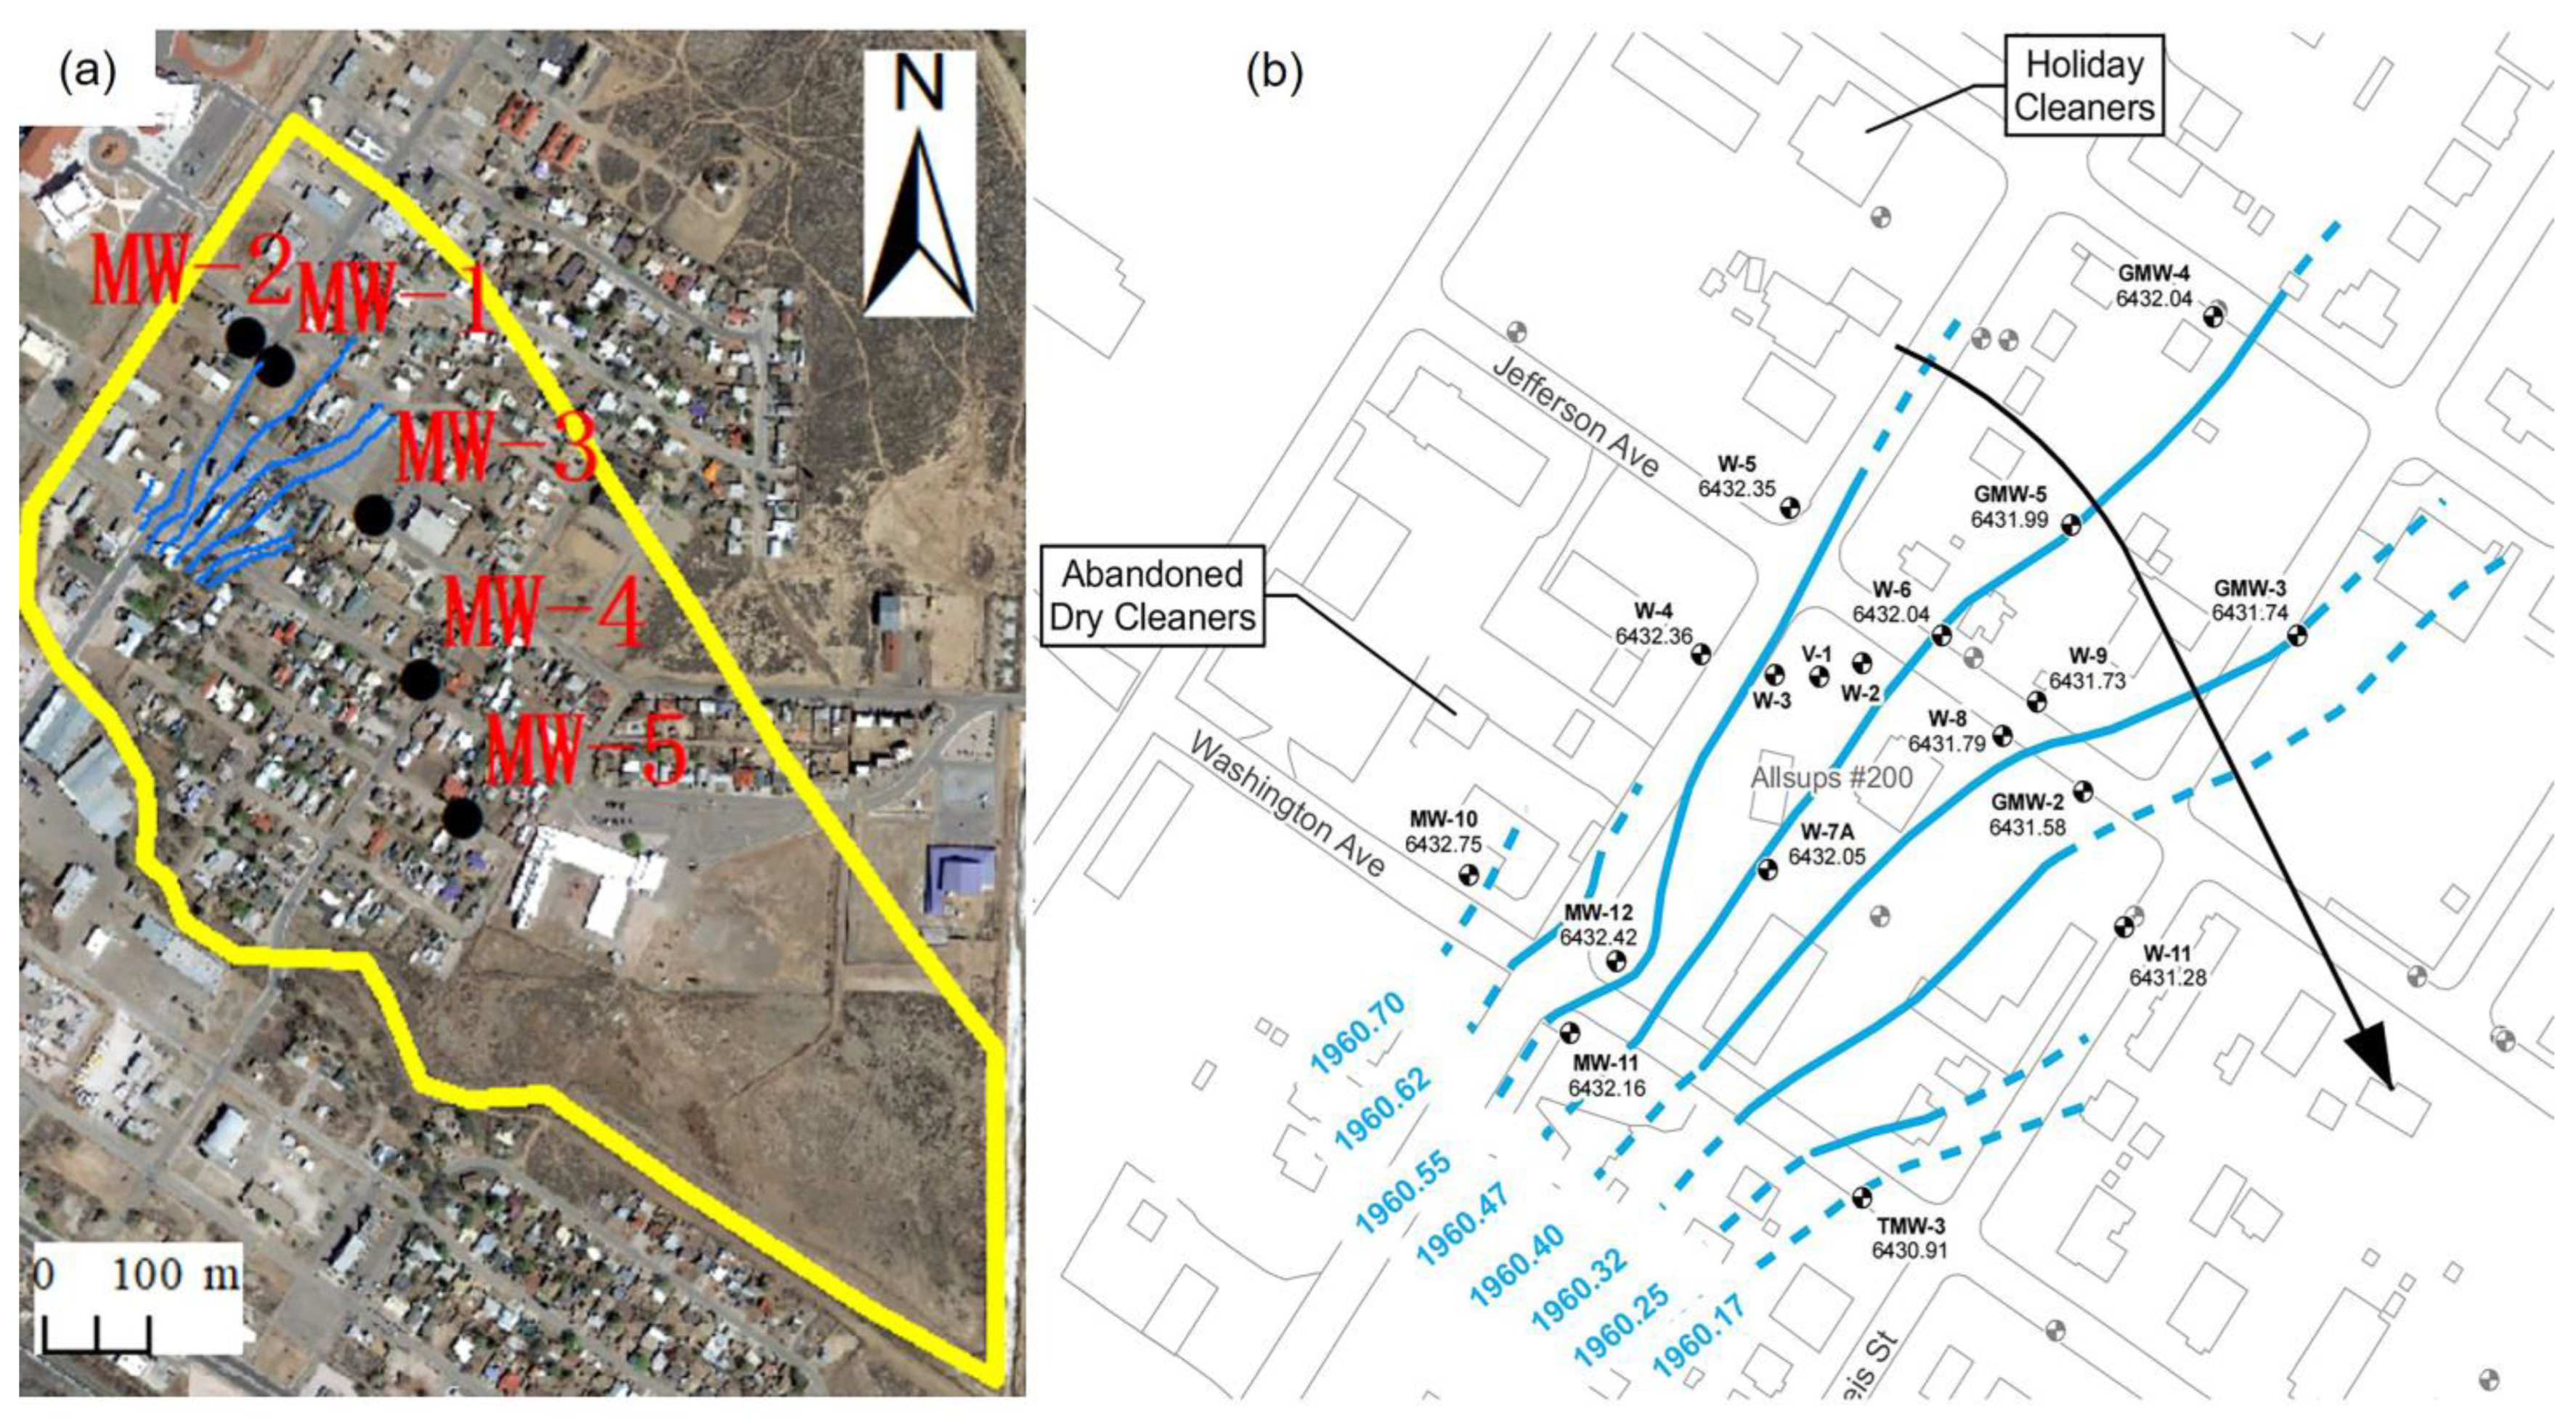
Based on the data, considering the current distribution of the contamination plume and its downstream transportation trend, as well as the presence of a north–south river at the leading edge of the contamination plume (680 m away), it is evident that the shallow and middle groundwater and the river have a significant hydraulic connection. This river can therefore serve as a boundary. In the direction of the vertical groundwater flow, taking into account contaminant dispersion and migration, the boundary of the plume was expanded outward by approximately 100 m. The model area is approximately 0.535 km long and 0.535 km wide, as shown in Figure 3a. The total modeled study area is about 1.2 km long and 1.0 km wide, encompassing an area of approximately 0.535 km2. The shallow groundwater table range within the study area is also depicted in Figure 3a.
Combining borehole histograms with regional geological data, the stratigraphy in this study area, which consists of clay interbedded with silt and sand, is generalized into six vertical layers. There are three aquifers within the study area. A weakly permeable layer exists in the upper part, and thus the upper weakly permeable layer and the lower aquifer are treated as one aquifer group, with consistent boundary conditions and values. Due to the limited distribution of monitoring wells across different layers in the study area and the insufficient information on the groundwater level, the groundwater level for the entire area was extrapolated based on the hydraulic gradient. This approach is justified by the relatively small size of the study area and the minimal lithological changes within the same stratum (Figure 3b).

2.2.2. Mathematical Modeling of Groundwater Pollution Processes

(1)
Mathematical Modeling of Groundwater Flow [37]
Groundwater in the study area is stored in the pore water-bearing medium, and the groundwater flow obeys Darcy’s law; its flow mathematical model is shown below:
x K x x H x + y K y y H y + z K z z H z + ε = μ s H t ( x , y , z ) Ω , t > 0 K x x H x 2 + K y y H y 2 K z z H z 2 + ω = μ H t H x , y , z , t Γ 2 1 = z ( x , y , z ) Γ 2 1 , t > 0 H x , y , z , t t = 0 = H 0 ( x , y , z ) ( x , y , z ) Ω H x , y , z , t Γ 1 = H 1 x , y , z , t ( x , y , z ) Γ 1 , t > 0 K n H n Γ 2 = q x , y , z , t ( x , y , z ) Γ 2 , t > 0
where Ω—simulation domain; H—aquifer head (m); Kxx, Kyy, Kzz—hydraulic conductivity in the x, y, z directions (m/d); μs—specific storage coefficient (m−1); μ—gravity-induced specific yield; ε—source/sink term (1/d); —rainfall infiltration recharge intensity (m/d); H1—known head function for the first type of boundary; Γ1—first type of boundary; Γ2—second type of boundary; q—boundary flux per unit width, where q = 0 represents an impermeable boundary or zero-flux boundary; z—elevation of the water table (m); H0—initial water level in the aquifer (m); Kn—hydraulic conductivity in the direction normal to the boundary (m/d); and n—direction normal to the boundary of the study area.
(2)
Mathematical modeling of solute transport [37]
l q C + l θ D l C l + n θ D n C n + m θ D m C m + q s C s + f = ( θ C ) t   C l , n , m , t = C 0 l , n , m                   l , n , m Ω , t = 0       C l , n , m , t = C s l , n , m                   l , n , m τ , t 0      
where the first term on the left side of the equation is the convective term, and the second, third, and fourth terms are the dispersion terms. C is the concentration of contaminants in groundwater flow (mg/L); Dl is the longitudinal dispersion coefficient (m2/d); Dn is the transverse dispersion coefficient (m2/d); Dm is the vertical dispersion coefficient (m2/d); q is the Darcy velocity (m/d); qs is the volumetric flow rate of the source (d−1); Cs is the concentration of the source (mg/L); θ is the effective porosity; C0 (l,n,m) is the known initial concentration distribution (mg/L); Cs (l,n,m) is the recharge concentration (mg/L) of the contaminated source area; and τ represents the pollution source area.
(3)
Chemical reaction formulas:
Based on this information, the reaction parameters are modeled as quasi-primary kinetics. The quasi-primary kinetic model expression is given below [38]:
L n q e q t = l n q e k 1 t
where k1 denotes the reaction constant h−1 for quasi-primary kinetics; qt denotes the amount of adsorption (mg/g) at time t; and qe denotes the amount of adsorption (mg/g) at equilibrium.

2.2.3. Model Parameterization

(1)
Spatial Grid Distribution
The simulation covers a total area of 0.535 km2, divided into a grid with cells measuring 5 m × 5 m. The region under study was divided into 244 rows and 189 columns, forming a grid with a total of 276,696 cells distributed across six vertical layers. Out of these, 129,012 cells are active, each with an area of 25 m2.
(2)
Time Discretization
The simulation spans from 1 December 2010 to 7 October 2015, covering a period of approximately five years. Each month is treated as a stress period of 30 days, and each stress period is discretized into 30 time steps with 1-day intervals.
(3)
Permeability Coefficient
Initial values for the infiltration coefficient were assigned to the model based on existing data. These values were adjusted according to the comparison between the fitted groundwater isohydraulic line and the actual isohydraulic line, denoted as K. Shallow aquifers, which are the primary focus, were adjusted manually and optimized automatically during the parameter calibration process.
(4)
Boundary Conditions
The specific boundaries were defined and then generalized, as detailed in Table 1.
(5)
Sources and Sinks
Rainfall recharge was calculated using the recharge module to determine the rate of rainfall recharge (rainfall is shown in Figure S1). Given that the depth of the water table in the study area is close to the limit of local evaporation depth, and the lithology of the unsaturated zone is a weakly permeable layer, along with the predominance of residential areas with hardened ground and minimal large-scale vegetation, evaporation and transpiration are negligible. Therefore, evaporation is not considered in this groundwater simulation study.

2.2.4. Optimization of Model Parameters

Parameter optimization was achieved by combining manual parameter adjustments with the automatic parameter adjustment function of the PEST parameter inversion. This process involved adjusting parameters such as the permeability coefficient, water storage coefficient, and boundary values. The relative errors between the simulated and monitored water levels of each observation hole under different permeability coefficients were compared. The average absolute percentage error was calculated, and the set of values with the smallest average absolute percentage error was selected. See Table 2.

3. Results and Discussion

3.1. Calibration of Water Level Simulation Results

Using the optimized parameters, the dynamic equilibrium water level calculated from the steady flow simulation was used as the initial head for the unsteady flow model. The model was modified to an instantaneous flow state, with the stress period and time step set, and was validated using multi-year observation data. During the adjustment process, the region-wide flow field was inferred from the groundwater flow field data of a small area within the simulation area in August 2008, serving as the initial flow field. However, comparing previous years’ observation hole data with simulated water levels revealed that it could not accurately reflect water level changes in each observation hole.
To address this, the presumed initial region-wide flow field was adjusted by modifying some contour lines so that the water level values near the observation holes matched the initial monitoring values. This adjustment resulted in a fitted flow field that aligned with the trend of water level changes in the observation holes over the years and was used as the initial flow field for the unsteady model.
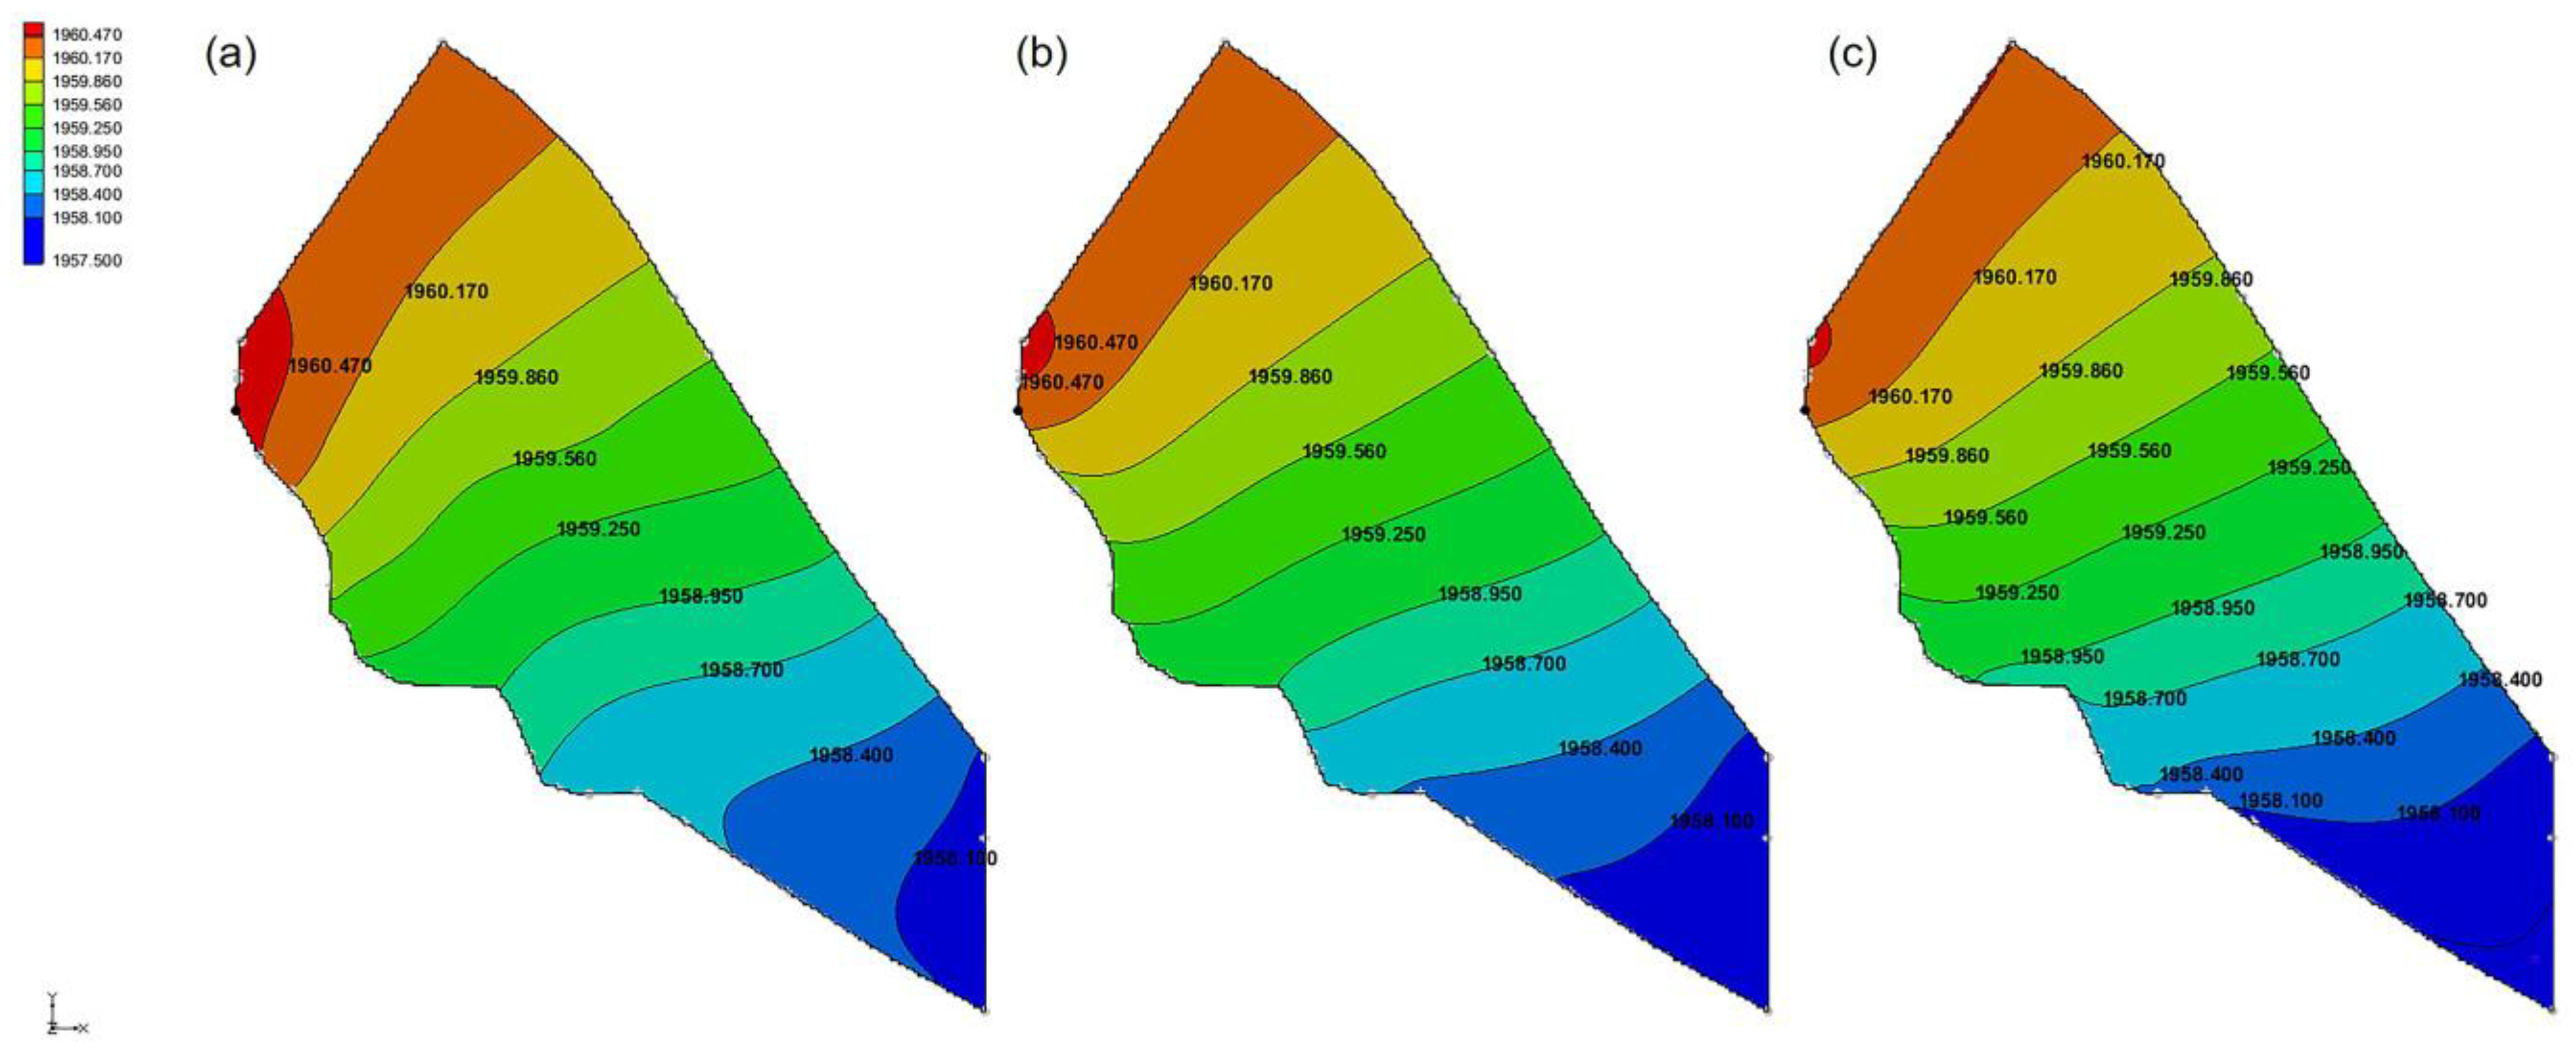
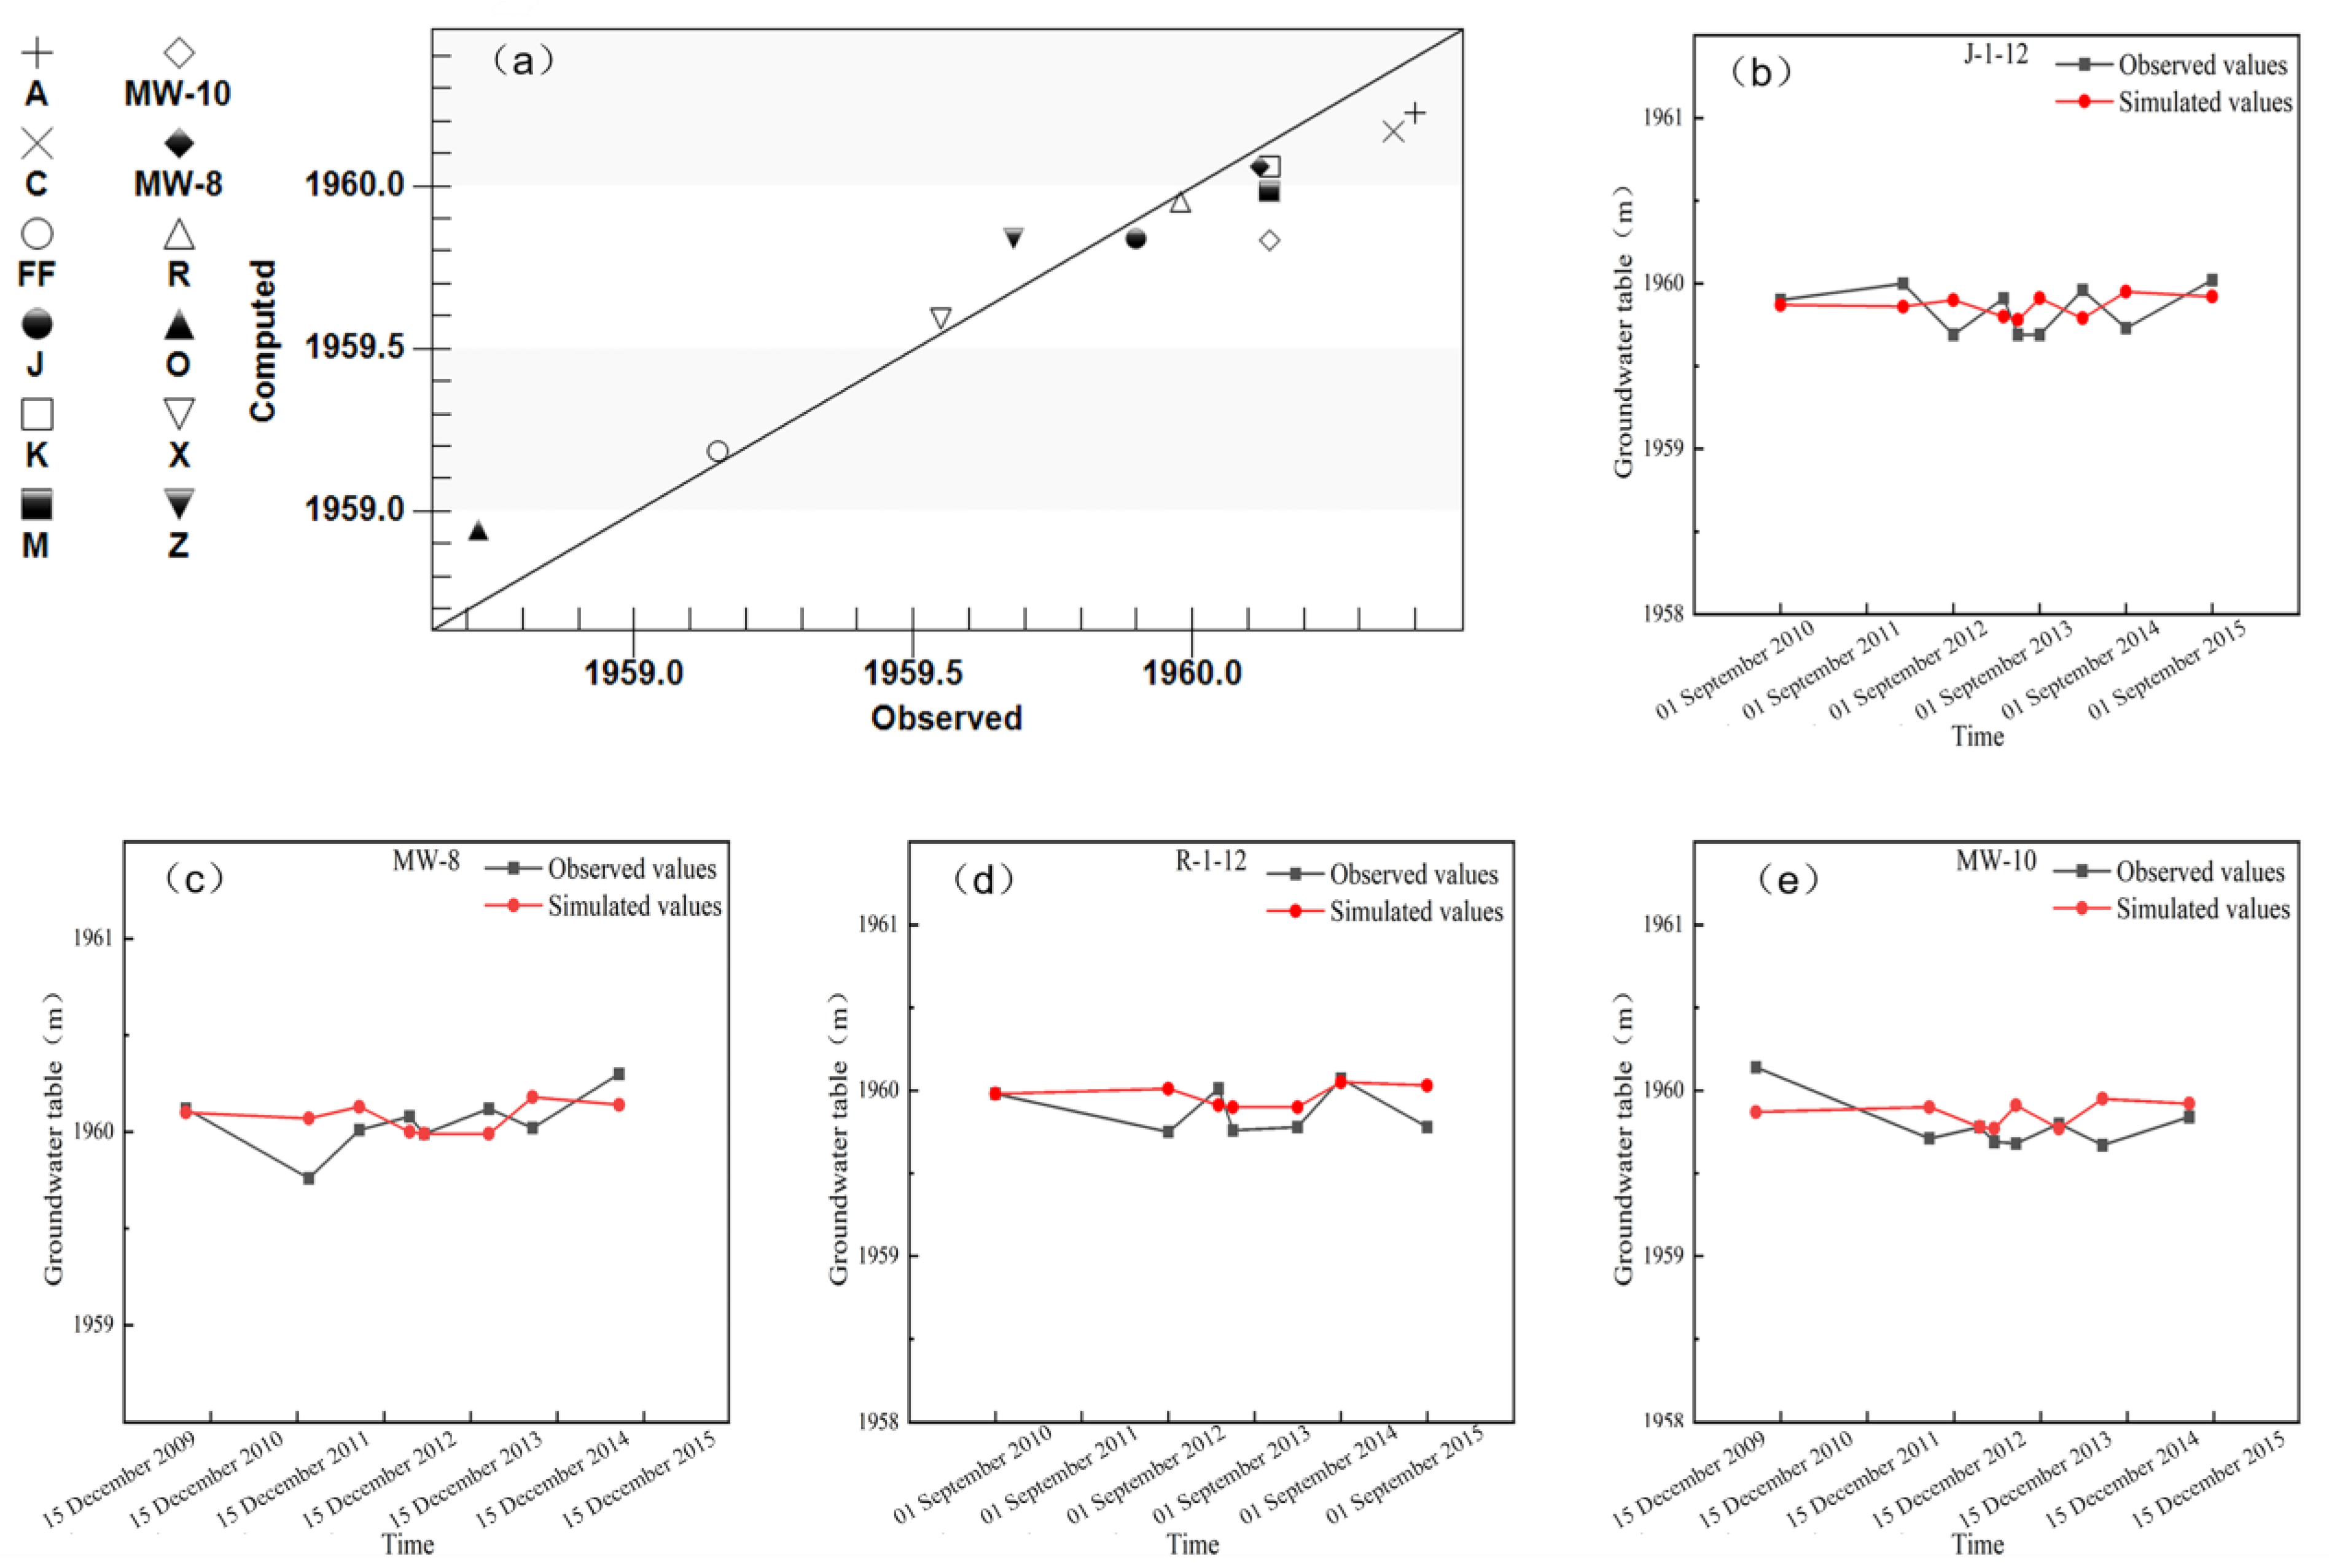
Figure 4 shows the simulated flow field of each aquifer. Comparing the calculated and measured water levels in some monitoring wells (Figure 5), the observed and calculated shallow water levels for each stress period are displayed. The calculated water level is basically the same as the observed water level, with an absolute error of less than 0.5 m in all observation holes, which indicates that the computed water level closely mirrors the real groundwater level in the study area.
Table 3 and Table 4 present the water balance data, showing that outflow from the bottom boundary of the shallow and middle aquifers is the main discharge mode, while outflow from the fixed-head boundary of the deep aquifer is predominant. During the model run, the inflow and outflow were almost identical, with errors controlled within a range of less than 0.1 m3/d, meeting the water balance requirements and demonstrating good model convergence. The corrected model accurately reflects the groundwater flow system characteristics in the study area, has high reliability, and is suitable for actual engineering practice.

3.2. PCE Initial Concentration Distribution

To model the initial pollutant concentration distribution, monitoring well data and pollution plume distribution maps were organized and geographically aligned in ArcGIS software (Version ArcGIS 10.7). Vector point files were plotted based on the well locations, and their corresponding concentration values were entered. These vector point files were converted into a 2D scatter dataset and matched to the model layers, using linear interpolation for the shallow layers due to the large number of data points and kriging for the middle and deep layers. The negative concentration interpolation results in the grid values were replaced with 0 in an Excel spreadsheet, and the processed data were imported into MT3DMS as initial concentrations.
Based on the water flow model, concentration data from 18 monitoring wells in the shallow, middle, and deep aquifers were added (Tables S2–S4), and the blank areas of the PCE concentration data points and concentration boundaries were trimmed according to the concentration distribution map provided. The distribution of the PCE pollution plume in September 2010 is shown in Figure 6.

3.3. Calibration of Solute Transport Simulation Results

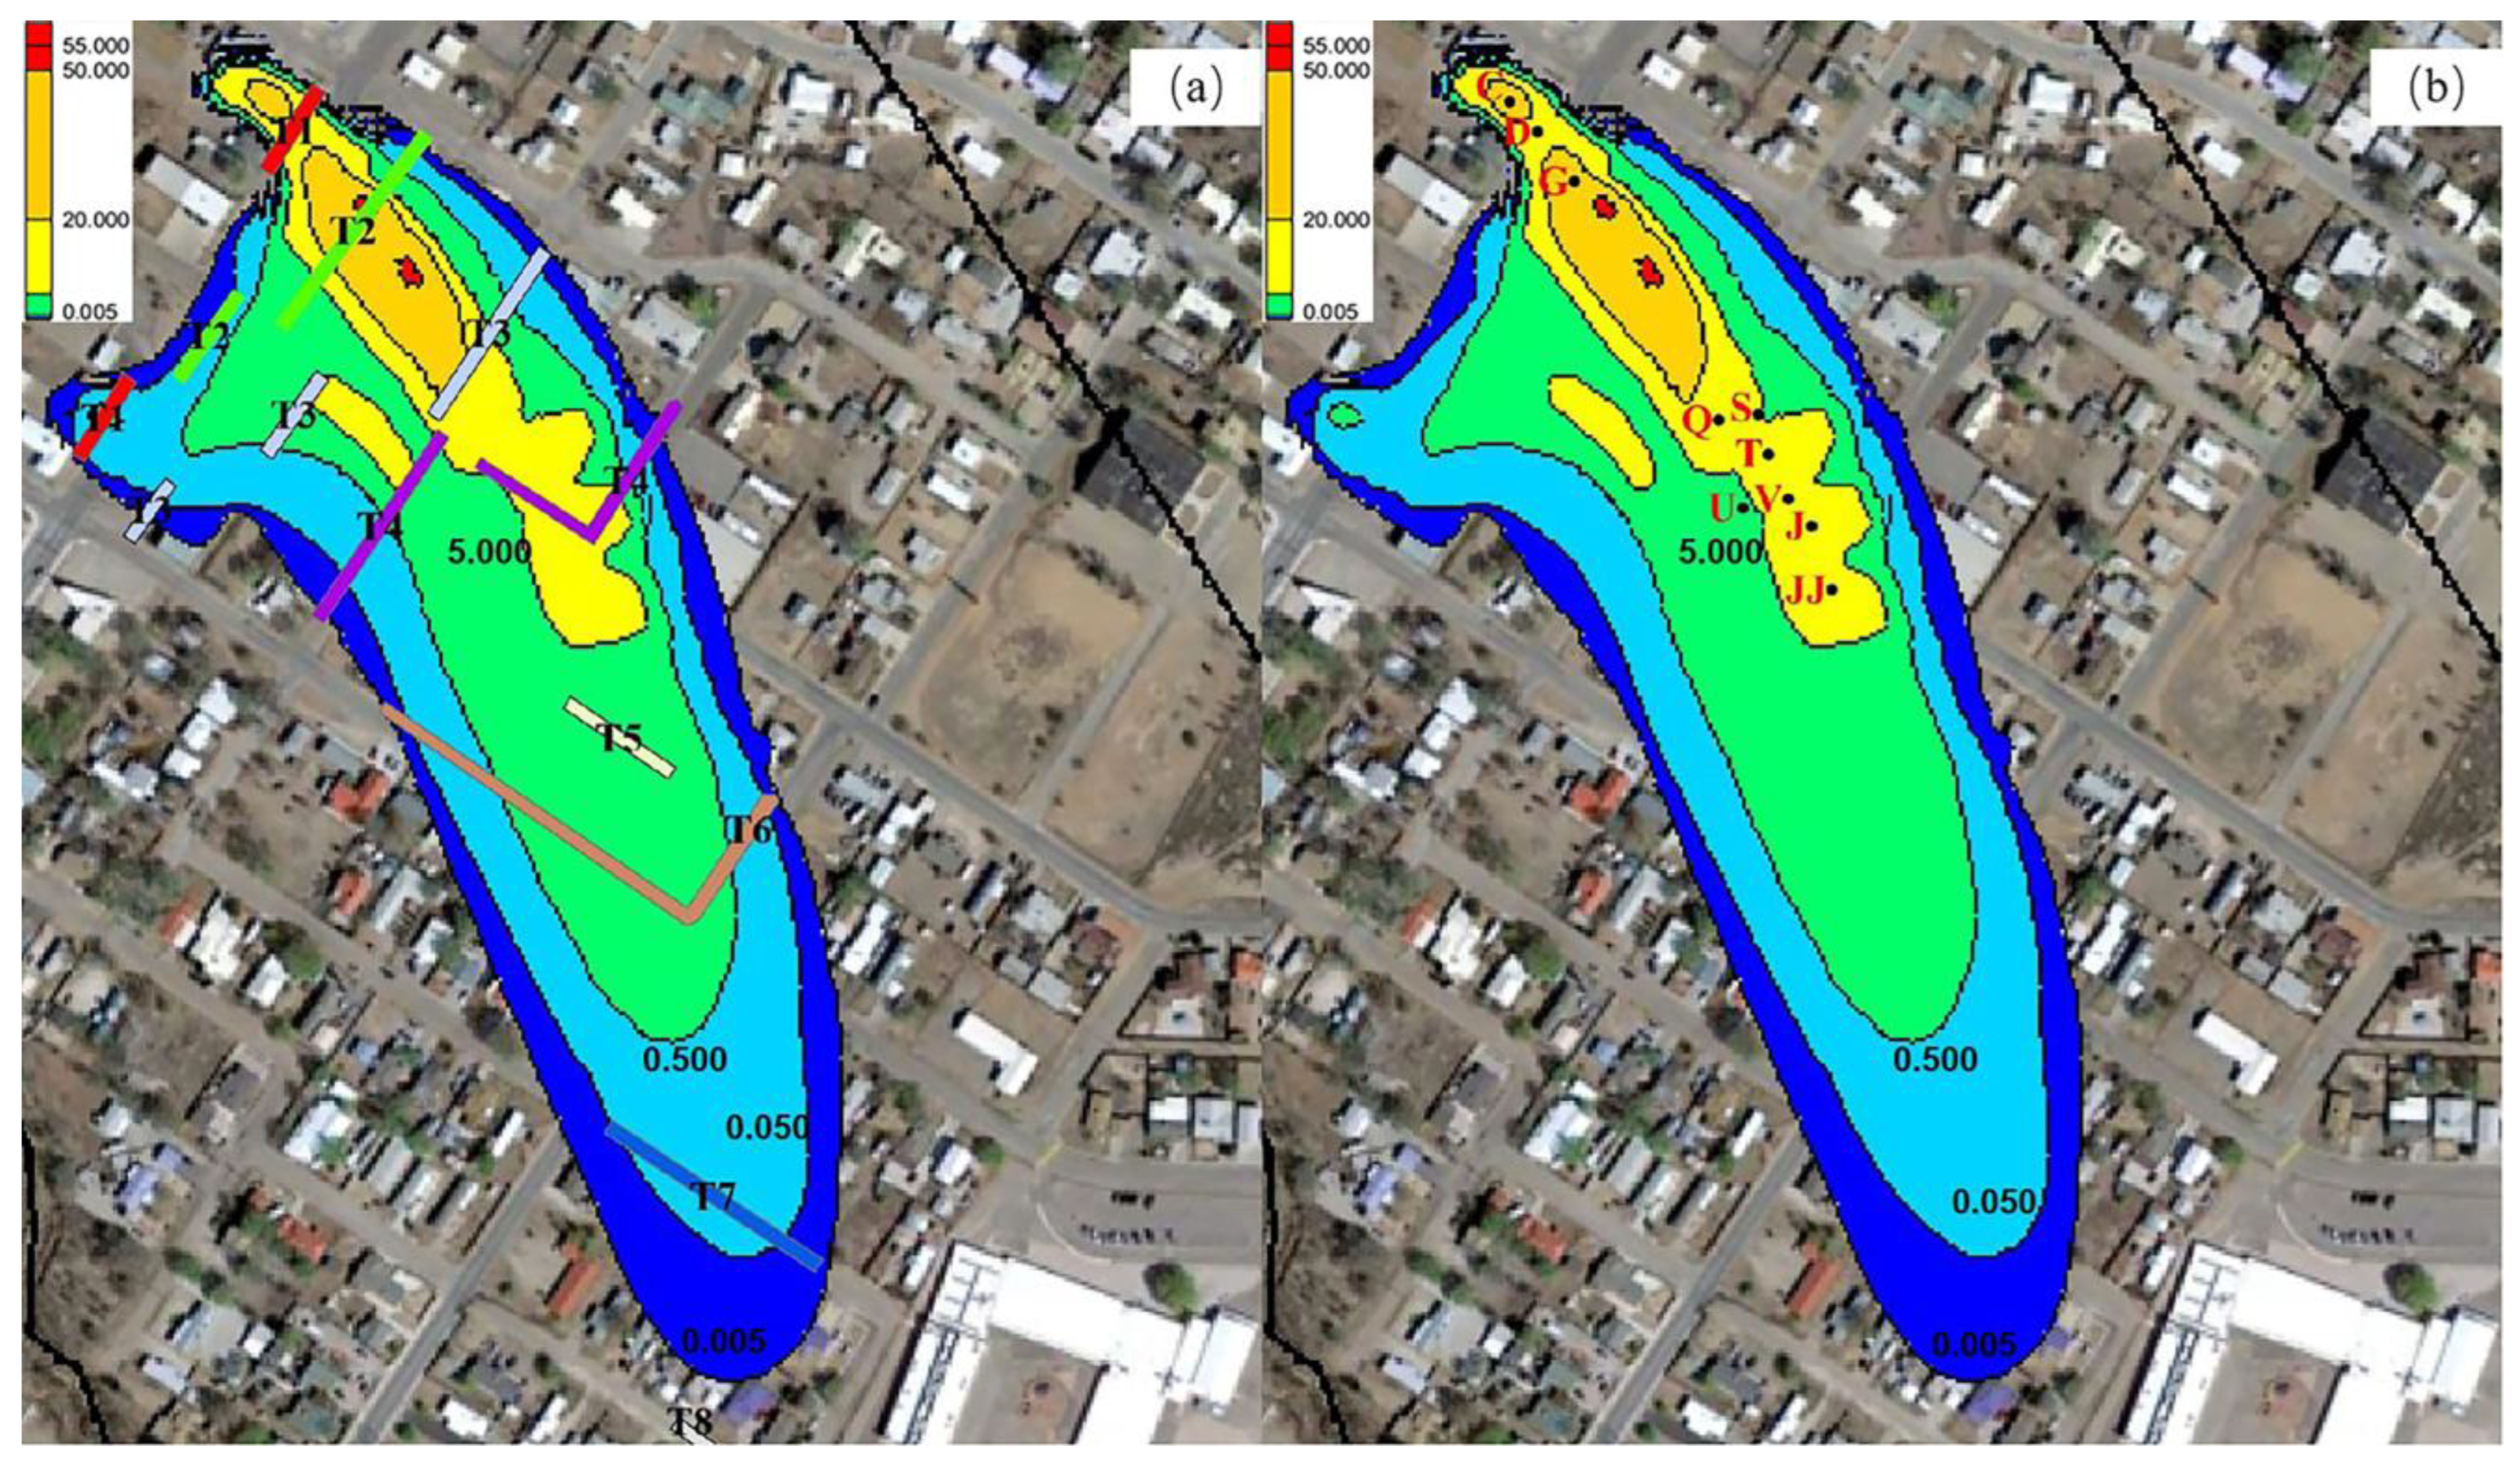
The simulation prediction time and model division are shown in Table 5. The injection well repair rate was 40/year during the injection of EHC reagent and KB-1 bacteriophage, 10/year in the thermal desorption area, and a conventional 5/year during the rest of the time. The lattice reaction rate constants outside of the injection wells were assigned a value of 0.5/year. The injection area of the repair process and the location of the selected monitoring wells are shown in Figure 7.
Continuous monitoring over five years at selected points (C, D, G, Q, S, T, U, V, J, and JJ) from upstream to downstream was used for model calibration. At point C (42, 44), the initial concentration was 36.4 mg/L, which decreased to 0.023 mg/L on 30 August 2012, with a relative error of −8% from the actual monitoring value of 0.025 mg/L. At point D (45, 47), the initial concentration was 17.7 mg/L, decreasing to 0.0047 mg/L on 31 August 2012, close to the monitoring value of 0.004 mg/L, with a relative error of −17.5%.
Midstream points near the injection wells, such as Q (69, 61), T (71, 66), S (68, 65), and U (76, 63), showed initial concentration values of 15.6 mg/L, 7.4 mg/L, 4.9 mg/L, and 1.6 mg/L, respectively. These concentrations were reduced to 0.0796 mg/L, 0.012 mg/L, 1.95 mg/L, and 0.926 mg/L, respectively, with small relative errors when compared to their monitoring values.
Points G (49, 49), V (75, 67), J (77, 69), and JJ (83, 71) did not match the trend of the monitoring values by adjusting the grid reaction rate constants alone. When the concentration of pollutants upstream was low, their PCE concentrations suddenly increased. For example, the concentration at point G dropped to 19 mg/L on 8 October 2012 but suddenly increased to 23.2 mg/L on 2 April 2013. Observing similar phenomena at other points, it was hypothesized that DNAPL formed near these points due to geological depressions, accumulating pollutants migrating from upstream and releasing them over time, leading to concentration fluctuations. In the simulation, an artificial pollutant source was added near these grids to match the simulated values with the monitoring values.
After several attempts, it was found that assigning 38 mg/L to the three grids (48, 48), (48, 49), and (49, 48) around G (49, 49) every 6 months for 1 year starting on 1 June 2011 could make G reach 19.30 mg/L on 8 October 2012; assigning 48 mg/L to the three grids around G on 1 December 2012 could make G reach 23.15 mg/L on 2 April 2013; and assigning 20 mg/L to the three grids around G on 1 June 2013 could make G reach 16.15 mg/L on 16 September 2013. The relative errors between the simulated and monitored values were 1.58%, −0.22%, and 1.06%, respectively, effectively confirming the above conjecture. Applying this approach to the grids where V, J, and JJ are located, the details are shown in Table 6.
Assigning values according to the table results in the following:
V (75.67) reaching 13.85 mg/L on 7 September 2012; 7.27 mg/L on 11 April 2013; 2.01 mg/L on 19 September 2013; 0.561 mg/L on 19 March 2014; and 0.033 mg/L on 16 September 2015. The relative errors between simulated and monitored values were −1.07%, 2.25%, 5.79%, −5.56%, and −11.53%, respectively.
J (77.69) reaching 7.55 mg/L on 4 September 2012; 1.71 mg/L on 9 April 2013; 5.87 mg/L on 23 September 2013; and 0.55 mg/L on 4 March 2014. The relative errors between simulated and monitored values were 0.67%, 0.59%, −2.17%, and 5.36%.
JJ (83.71) reaching 5.18 mg/L on 14 February 2012; 6.25 mg/L on 10 September 2012; 4.65 mg/L on 9 April 2013; 0.85 mg/L on 26 September 2013; 2.05 mg/L on 4 March 2014; 1.02 mg/L on 11 September 2014; and 0.68 mg/L on 28 July 2015. The relative errors between simulated and monitored values were 1.17%, 0.81%, 1.09%, −4.49%, −3.02%, 2.00%, and −0.73%, respectively.
The anthropogenic addition of contaminants was attributed to the presence of undetected dense non-aqueous phase liquid (DNAPL). Due to geological factors, the formation of high-density non-aqueous phase liquids (DNAPLs) leads to a persistent release of targeted halogenated organic compounds. The decreasing concentration in the final assigned values indicates a slowdown in the release of contaminants from the source. At these specific points, we observe a phenomenon where “the upstream pollutant concentration is relatively low, but the concentration at these points suddenly increases”. Therefore, we speculate that this is caused by the presence of DNAPLs. DNAPL in the unsaturated zone primarily volatilizes into the soil gas phase and dissolves into soil water. In the saturated zone, DNAPL exists in non-aqueous and dissolved phases [39]. When DNAPL leaks, it enters the soil and groundwater system by gravity. If the leak is substantial, it can cross the unsaturated zone into the saturated zone and migrate to the bottom of the aquifer, forming a pool of DNAPL that continuously releases contaminants [40,41,42]. A certain amount of DNAPL can also be enriched within weakly permeable media in chronically contaminated parcels, which can release contaminants through reverse osmosis when the concentration of the dissolved phase decreases [43,44]. It was inferred that DNAPLs existed near these wells but could not be detected due to limited monitoring tools. It is recommended that ground-penetrating radar, electromagnetic induction, and other technologies be added to subsequent monitoring to more effectively determine the presence of DNAPLs and improve prediction accuracy.

3.4. Contamination Plume Migration During Remediation

The shallow aquifer, as the primary focus, shows the changes in the contamination plume during the remediation process as depicted in Figure 8. According to the simulation results, the contamination plume of PCE in the study area’s groundwater moved in a southeastward direction, following the water flow, from the northwest during the prediction period. The concentration of the contamination plume in the high-concentration area decreased significantly after six site-wide ERD (enhanced reductive dechlorination) treatments from December 2010 to August 2021, with a continuous trend of downstream migration.
Initially, the contaminated plume covered a planar area of approximately 74,930 m2. By the end of the initial site-wide ERD treatment on 31 December 2013, the contaminated plume covered approximately 67,704 m2, or 90.36% of the initial area (Figure 8b). The second site-wide ERD remediation completed on 7 October 2015 reduced the contaminated plume area to approximately 52,894 m2, representing 70.59% of the initial area (Figure 8c). The red area with a PCE concentration greater than 50 mg/L and the golden-yellow area with a PCE concentration greater than 20 mg/L disappeared by the end of the first ERD remediation. During the phase from 31 December 2013 to 1 March 2014, the site-wide remediation measure of injecting KB-1 microbial agent was taken, resulting in the disappearance of the yellow area with a PCE concentration greater than 5 mg/L. The contamination plume eventually migrated a longer distance along the direction of water flow (northwest to southeast). After comparing the simulation results with the observed concentration changes (Table S1) at the site and making the aforementioned adjustments based on the presumption of the presence of undetected DNAPL, the simulated values for the monitoring wells were found to be consistent with the observed values, as shown in Figure 9.
There are certain limitations in the process of constructing this model:
(1)
Insufficient sampling data. Due to the annual unit of the sampling data in the site information, the data volume is too small, which has consumed considerable time in model calibration to align simulated values with monitored values. It is recommended to enhance data collection efforts to obtain a sufficient quantity and quality of sampling data, ensuring data accuracy and completeness.
(2)
Simplified generalization of geological strata. Within the study area, there are interbedded layers of clay, silt, and sand. Rock formations with similar water-bearing and permeability characteristics have been merged and generalized, resulting in generalized aquifer and aquiclude groups. It is unclear whether this generalization has impacted the simulation results. It is suggested to utilize modern technological means such as remote sensing technology and geophysical exploration to acquire more comprehensive geological stratum information.
(3)
Determination of various parameters. For example, the set reaction rate parameters are obtained from site data, and the reaction rate constants at some points have been manually adjusted during the parameter tuning process. It is recommended that relevant parameters should be measured in a laboratory setting. If laboratory conditions are not feasible, consideration can be given to using existing data from the literature or standard parameters provided by professional institutions, but appropriate verification and calibration are necessary to ensure the accuracy and applicability of the parameters.

3.5. EVS Visualization Display

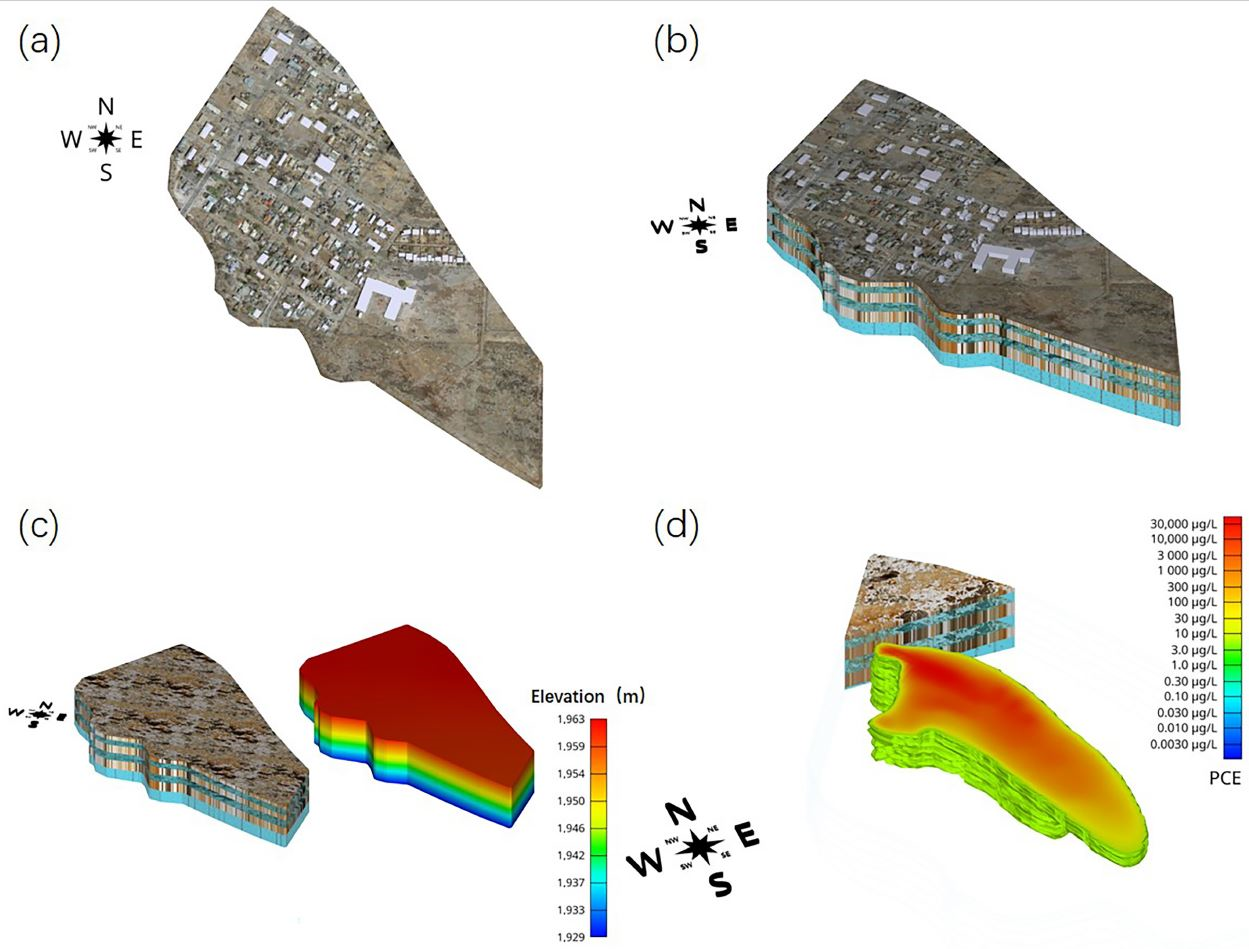
The EVS (Earth Volumetric Studio) software(Version EVS 2022.4)can perform spatial interpolation using 3D Kriging based on pollutant concentration values monitored at three-dimensional spatial points, resulting in a true 3D model of pollutants across the entire space and site. EVS allows for viewing different data within the same model through its visualization module, converting extensive datasets into visual representations. This reveals the spatiotemporal distribution patterns of the data in three dimensions, providing a user-friendly human–computer interaction environment.
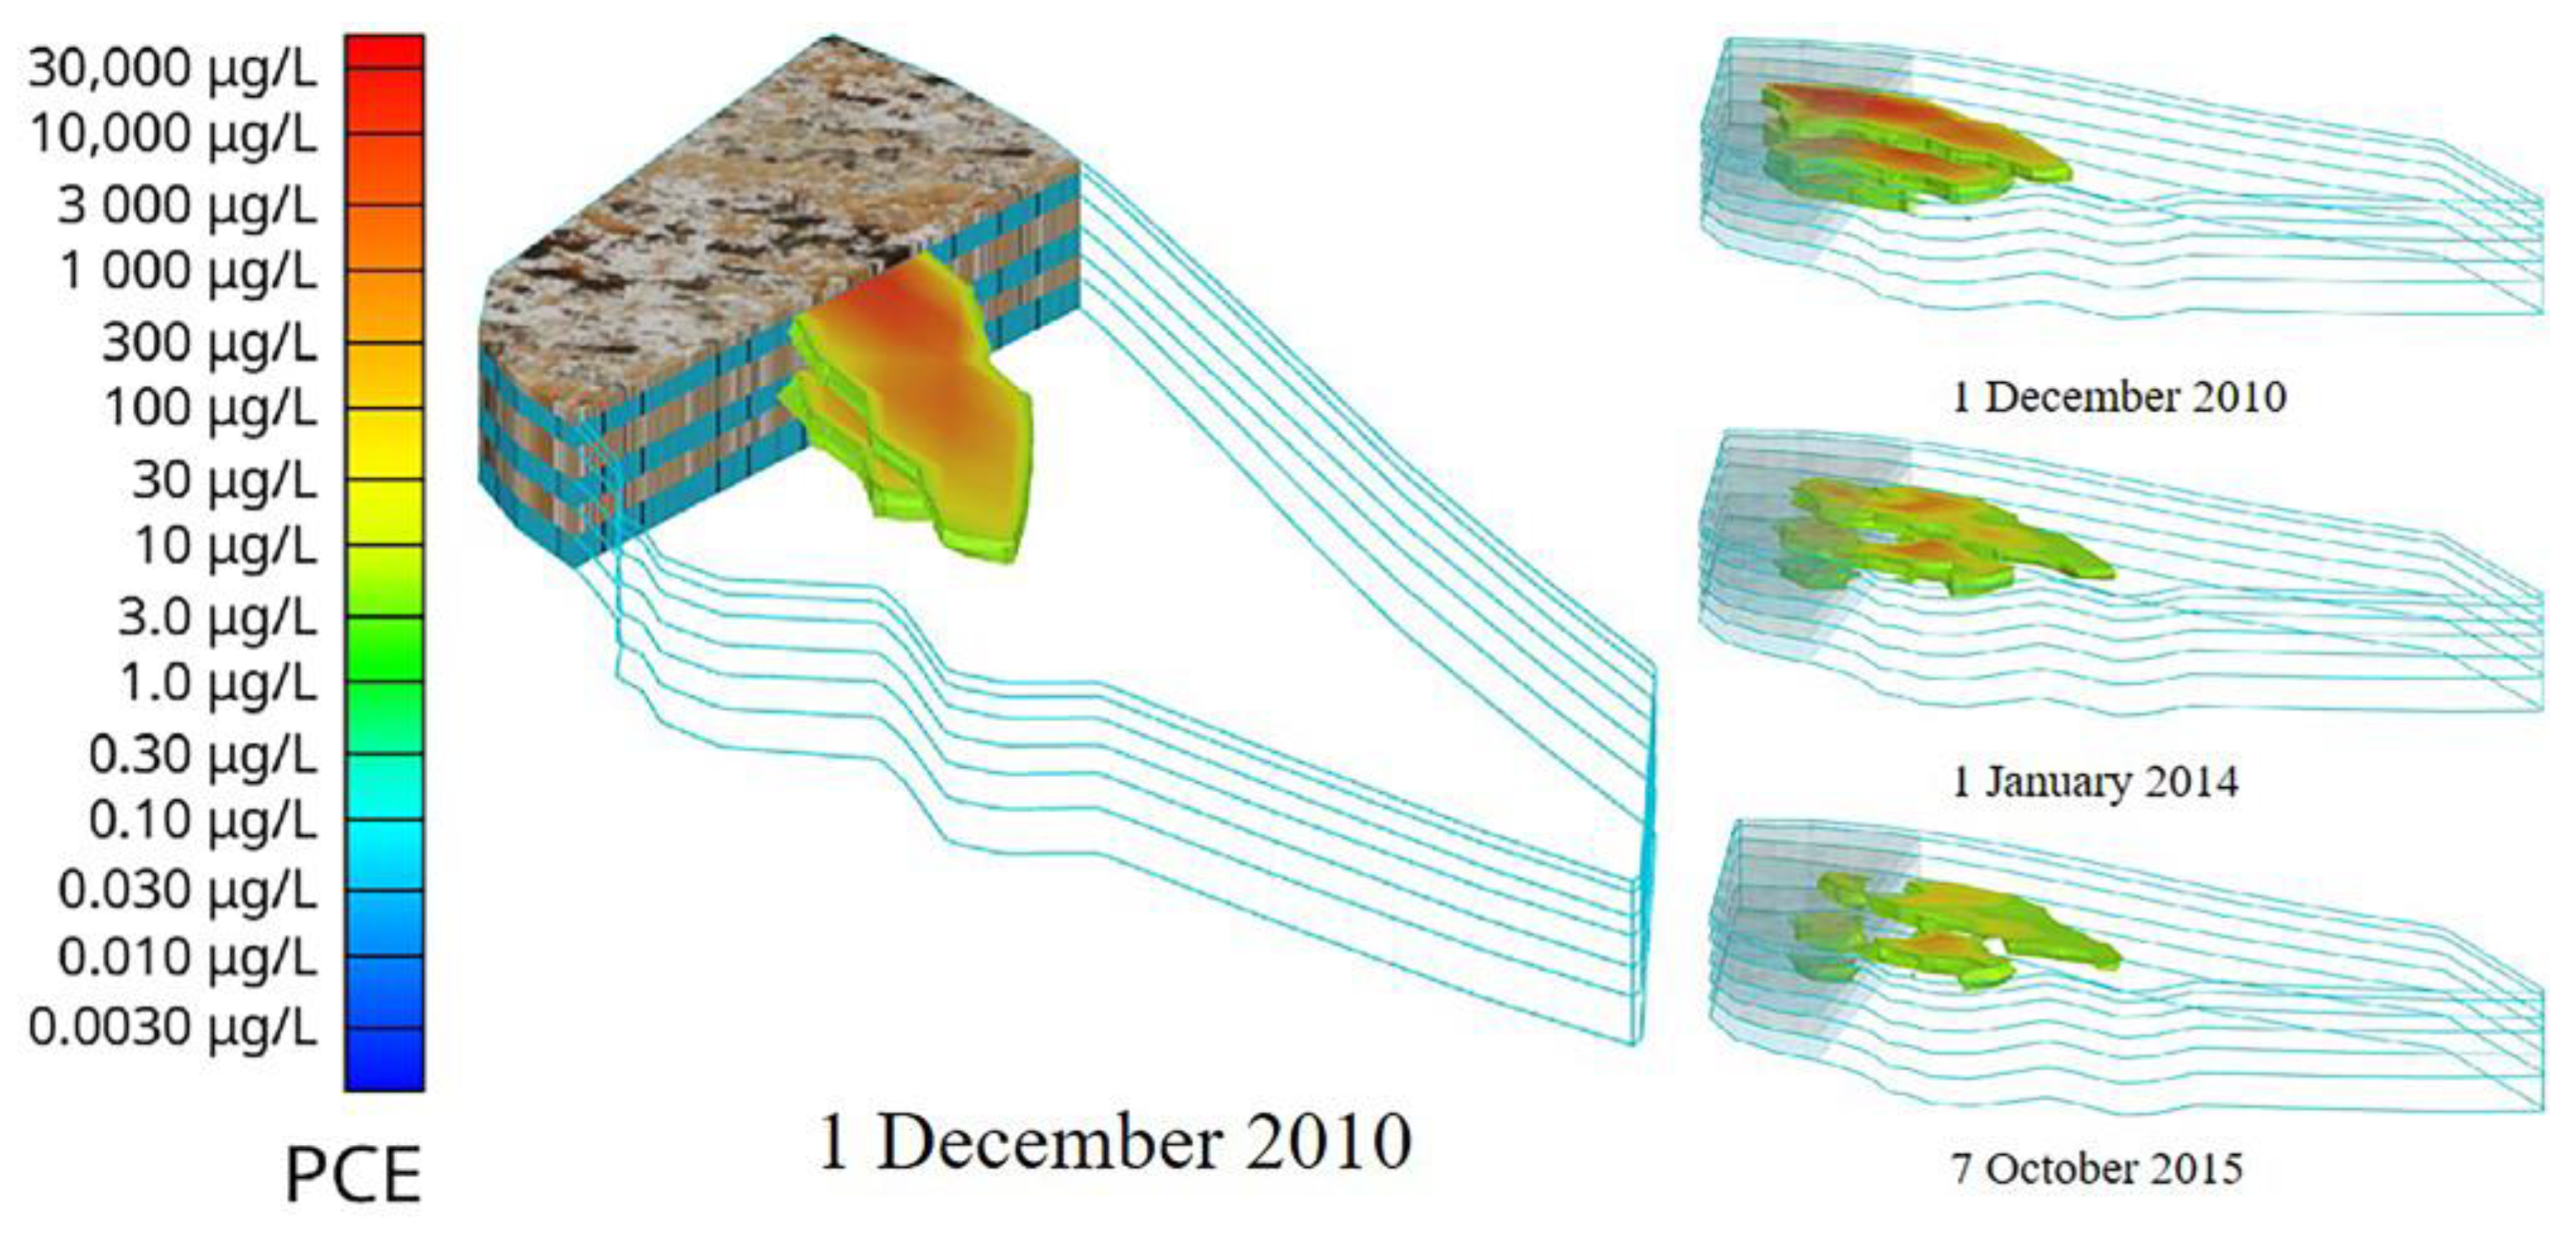
Additionally, EVS offers pre-processing and post-processing for MODFLOW and MT3DMS, enabling efficient and predictive visual simulations through this interactive process. Existing data can be imported into EVS for visualization, as shown in Figure 10 and Figure 11.

4. Conclusions

In this literature review, we found significant research gaps in the accurate simulation and long-term monitoring data of halogenated hydrocarbon-contaminated sites, especially those involving the release behavior of non-aqueous phase liquids (such as DNAPL) in complex geological structures. Our primary objectives were to validate groundwater flow and solute transport models using MODFLOW and MT3DMS. We utilized ArcGIS, Excel 2016, and other software tools to streamline and organize our modeling efforts, laying a solid foundation for subsequent model construction.
By evaluating five years of observational data and modeling results, we successfully corrected the established water flow and solute transport models for pollutant migration and attenuation. For the solute transport model, we confirmed the hypothesis of an undetected DNAPL as a periodically releasing pollutant source. This confirmation was achieved by aligning the simulated pollutant concentration attenuation trends with actual monitoring values. A multi-model succession prediction scheme was constructed for various scenarios, providing valuable simulated predictions.
Despite the successful model validation and predictions, there are inherent limitations in our work, such as potential uncertainties in model parameters and simplifications in the modeling process. Our research has significant implications for guiding decision-makers in formulating scientific and reasonable restoration programs. The models and findings presented in this study offer useful references for future research and practice in related fields, contributing to a better understanding and management of groundwater pollution.

Supplementary Materials

The following supporting information can be downloaded at https://www.mdpi.com/article/10.3390/w16213154/s1, Table S1: Comparison between simulated and monitored PCE concentration values (mg/L). Table S2. Shallow main vector point coordinates and concentration table. Table S3. Coordinates and concentration table of main vector points in the middle layer. Table S4. Coordinates and concentration tables of deep main vector points. Figure S1. Rainfall of the study area.

Author Contributions

J.Y.: writing, original draft, editing, visualization; C.W.: methodology, review. All authors have read and agreed to the published version of the manuscript.

Funding

This research was funded by the “National Key R&D Program Key Special Project” (2020YFC1808205).

Data Availability Statement

The data supporting the findings of this study are available from the authors upon reasonable request. The data are not publicly available due to the need to maintain confidentiality and ensure the security of the research findings.

Conflicts of Interest

The authors declare no conflicts of interest.

References

  1. Yang, J.-B.; Huang, Z.; Zhao, J.-L.; He, L.-Y.; Liu, Y.-S.; Hu, L.-X.; Shi, Y.-J.; Ying, G.-G. Contamination Characteristics and Ecological Risk of Antibiotics in Contaminated Sites of Typical Pharmaceutical Factories in China. Huan Jing Ke Xue = Huanjing Kexue 2024, 45, 1004–1014. [Google Scholar] [PubMed]
  2. Li, W.; Liu, G.-P.; Liu, J.; Lu, L.-H.; Qiao, W.-J.; Yu, X.; Zhang, X.-Y.; Jiang, J.-D. Characterization of Reductive Dechlorination of Chlorinated Ethylenes by Anaerobic Consortium. Huan Jing Ke Xue = Huanjing Kexue 2024, 45, 1080–1089. [Google Scholar] [PubMed]
  3. Li, R.-Y.; Zeng, Y.-Y.; Zhou, J.-L.; Sun, Y.; Yan, Z.-Y. Prediction Model of Groundwater Sulphate Based on Combined Multi-source Spatio-temporal Data. Huan Jing Ke Xue = Huanjing Kexue 2024, 45, 3153–3164. [Google Scholar] [PubMed]
  4. Walaszek, M.; Cary, L.; Billon, G.; Blessing, M.; Bouvet-Swialkowski, A.; George, M.; Criquet, J.; Mossmann, J.R. Dynamics of chlorinated aliphatic hydrocarbons in the Chalk aquifer of northern France. Sci. Total Environ. 2021, 757, 143742. [Google Scholar] [CrossRef] [PubMed]
  5. Polasko, A.L.; Zulli, A.; Gedalanga, P.B.; Pornwongthong, P.; Mahendra, S. A Mixed Microbial Community for the Biodegradation of Chlorinated Ethenes and 1,4-Dioxane. Environ. Sci. Technol. Lett. 2019, 6, 49–54. [Google Scholar] [CrossRef]
  6. Frascari, D.; Zanaroli, G.; Danko, A.S. In situ aerobic cometabolism of chlorinated solvents: A review. J. Hazard. Mater. 2015, 283, 382–399. [Google Scholar] [CrossRef]
  7. Yang, X.; Du, J.; Jia, C.; Yang, T.; Shao, S. Groundwater pollution risk, health effects and sustainable management of halocarbons in typical industrial parks. Environ. Res. 2024, 250, 118422. [Google Scholar] [CrossRef]
  8. Gałgowska, M.; Pietrzak-Fiećko, R.; Felkner-Poźniakowska, B. Assessment of the chlorinated hydrocarbons residues contamination in edible mushrooms from the North-Eastern part of Poland. Food Chem. Toxicol. 2012, 50, 4125–4129. [Google Scholar] [CrossRef]
  9. Gao, Y.W.; Zheng, F.; Shi, X.Q.; Sun, Y.Y.; Xu, H.X.; Wu, J.C. Laboratory Investigation of DNAPL Migration Behavior and Distribution at Varying Flow Velocities Based on Light Transmission Method. Huan Jing Ke Xue = Huanjing Kexue 2015, 36, 2532–2539. [Google Scholar]
  10. Lo, H.C.; Tabe, K.; Iskander, M.; Yoon, S.H. A Transparent Water-Based Polymer for Simulating Multiphase Flow. Geotech. Test. J. 2010, 33, 1–13. [Google Scholar] [CrossRef]
  11. Zhu, X.; Wang, X.; Li, N.; Wang, Q.; Liao, C. Bioelectrochemical system for dehalogenation: A review. Environ. Pollut. 2022, 293, 118519. [Google Scholar] [CrossRef] [PubMed]
  12. Hiortdahl, K.M.; Borden, R.C. Enhanced Reductive Dechlorination of Tetrachloroethene Dense Nonaqueous Phase Liquid with EVO and Mg(OH)2. Environ. Sci. Technol. 2014, 48, 624–631. [Google Scholar] [CrossRef]
  13. Chen, Z.; Tang, X.; Qiao, W.; Puentes Jácome, L.A.; Edwards, E.A.; He, Y.; Xu, J. Nanoscale zero-valent iron reduction coupled with anaerobic dechlorination to degrade hexachlorocyclohexane isomers in historically contaminated soil. J. Hazard. Mater. 2020, 400, 123298. [Google Scholar] [CrossRef]
  14. Pavelková, A.; Stejskal, V.; Vološčuková, O.; Nosek, J. Cost-Effective Remediation Using Microscale Zvi: Comparison of Commercially Available Products. Ecol. Chem. Eng. S 2020, 27, 211–224. [Google Scholar] [CrossRef]
  15. Yu, Y.; Zhang, Y.; Liu, Y.; Lv, M.; Wang, Z.; Wen, L.L.; Li, A. In situ reductive dehalogenation of groundwater driven by innovative organic carbon source materials: Insights into the organohalide-respiratory electron transport chain. J. Hazard. Mater. 2023, 452, 131243. [Google Scholar] [CrossRef] [PubMed]
  16. Blázquez-Pallí, N.; Rosell, M.; Varias, J.; Bosch, M.; Soler, A.; Vicent, T.; Marco-Urrea, E. Multi-method assessment of the intrinsic biodegradation potential of an aquifer contaminated with chlorinated ethenes at an industrial area in Barcelona (Spain). Environ. Pollut. 2019, 244, 165–173. [Google Scholar] [CrossRef] [PubMed]
  17. Zheng, J.; Leng, W.; Wang, J.; Zhi, L.; Wang, S.; Li, J.; Guo, P.; Wei, W.; Song, Y. Bioremediation technologies for cleaning up chlorinated-hydrocarbon contaminated sitesa review. Earth Sci. Front. 2024, 31, 157–172. [Google Scholar]
  18. Sun, M.; Dong, J.; Zhang, M.; Sun, C. Enhanced reductive dechlorination of chlorinated hydrocarbons in groundwater by emulsified zero-valentiron. China Environ. Sci. 2022, 42, 2690–2696. [Google Scholar]
  19. Ai, S.; Zhao, T.; Zhang, L.; Xu, J.; He, J.; Liu, X.; Guo, Y.; Li, X. TCE biodegradation in reactor with two openings with immobilized cells. Chin. J. Appl. Environ. Biol. 2017, 23, 900–906. [Google Scholar]
  20. Nijenhuis, I.; Kuntze, K. Anaerobic microbial dehalogenation of organohalides—State of the art and remediation strategies. Curr. Opin. Biotechnol. 2016, 38, 33–38. [Google Scholar] [CrossRef]
  21. Goyal, D.; Haritash, A.K.; Singh, S.K. A comprehensive review of groundwater vulnerability assessment using index-based, modelling, and coupling methods. J. Environ. Manag. 2021, 296, 113161. [Google Scholar] [CrossRef] [PubMed]
  22. Liu, Y.-c.; Fei, Y.-h.; Li, Y.-s.; Bao, X.-l.; Zhang, P.-w. Pollution source identification methods and remediation technologies of groundwater: A review. China Geol. 2024, 7, 125–137. [Google Scholar] [CrossRef]
  23. Deng, H.; Zhou, S.; He, Y.; Lan, Z.; Zou, Y.; Mao, X. Efficient Calibration of Groundwater Contaminant Transport Models Using Bayesian Optimization. Toxics 2023, 11, 438. [Google Scholar] [CrossRef] [PubMed]
  24. Chen, G.; Sun, Y.J.; Liu, J.Y.; Lu, S.G.; Feng, L.; Chen, X. The effects of aquifer heterogeneity on the 3D numerical simulation of soil and groundwater contamination at a chlor-alkali site in China. Environ. Earth Sci. 2018, 77, 15. [Google Scholar] [CrossRef]
  25. Wang, Z.; Zhao, X.; Xie, T.; Wen, N.; Yao, J. A Comprehensive Evaluation Model of Ammonia Pollution Trends in a Groundwater Source Area along a River in Residential Areas. Water 2021, 13, 1924. [Google Scholar] [CrossRef]
  26. Hussein, E.E.; Fouad, M.; Gad, M.I. Prediction of the pollutants movements from the polluted industrial zone in 10th of Ramadan city to the Quaternary aquifer. Appl. Water Sci. 2019, 9, 20. [Google Scholar] [CrossRef]
  27. Aly, A.I.M.; Hussien, R.A.; Nassar, N. Radioactive dispersion in groundwater resulting from postulated accident at a proposed nuclear power plant, northwestern coast of Egypt. Groundw. Sustain. Dev. 2020, 10, 100326. [Google Scholar] [CrossRef]
  28. Rad, P.R.; Fazlali, A. Optimization of permeable reactive barrier dimensions and location in groundwater remediation contaminated by landfill pollution. J. Water Process Eng. 2020, 35, 101196. [Google Scholar] [CrossRef]
  29. Wondzell, S.M.; LaNier, J.; Haggerty, R. Evaluation of alternative groundwater flow models for simulating hyporheic exchange in a small mountain stream. J. Hydrol. 2009, 364, 142–151. [Google Scholar] [CrossRef]
  30. Hirata, R.; Cagnon, F.; Bernice, A.; Maldaner, C.H.; Galvão, P.; Marques, C.; Terada, R.; Varnier, C.; Ryan, M.C.; Bertolo, R. Nitrate Contamination in Brazilian Urban Aquifers: A Tenacious Problem. Water 2020, 12, 2709. [Google Scholar] [CrossRef]
  31. Abd-Elaty, I.; Saleh, O.K.; Ghanayem, H.M.; Grischek, T.; Zelenakova, M. Assessment of hydrological, geohydraulic and operational conditions at a riverbank filtration site at Embaba, Cairo using flow and transport modeling. J. Hydrol. Reg. Stud. 2021, 37, 100900. [Google Scholar] [CrossRef]
  32. Musacchio, A.; Mas-Pla, J.; Soana, E.; Re, V.; Sacchi, E. Governance and groundwater modelling: Hints to boost the implementation of the EU Nitrate Directive. The Lombardy Plain case, N Italy. Sci. Total Environ. 2021, 782, 146800. [Google Scholar] [CrossRef] [PubMed]
  33. Mirzaee, M.; Safavi, H.R.; Taheriyoun, M.; Rezaei, F. Multi-objective optimization for optimal extraction of groundwater from a nitrate-contaminated aquifer considering economic-environmental issues: A case study. J. Contam. Hydrol. 2021, 241, 103806. [Google Scholar] [CrossRef] [PubMed]
  34. Bridget Odochi, U.; Iheanyichukwu, O.A.; Okechukwu, O.S.; Chukwuemeka, I.C.; Juliana, O.I.; Ifeanyi, O.S.; Nkiru, N.C.; Osita, I.P.; Emmanuel, A.E. Hydrogeological assessment and contaminant transport modelling of Enyimba landfill site in Aba, Nigeria. Water Pract. Technol. 2024, 19, 2108–2124. [Google Scholar] [CrossRef]
  35. Huang, Z.; Li, F.; Cui, W.; Cao, G.; Yao, J. Simulating arsenic discharge flux at a relic smelting site in Guangxi Zhuang Autonomous Region, China. Environ. Sci. Pollut. Res. 2024, 31, 12094–12111. [Google Scholar] [CrossRef]
  36. Al-Hadhrami, A.; Sana, A.; Etri, T.; Al-Mamun, A.; Nikoo, M.R.; Al-Rawas, G. Modeling of seawater intrusion into Salalah coastal plain aquifer, sultanate of Oman. Groundw. Sustain. Dev. 2024, 24, 101076. [Google Scholar] [CrossRef]
  37. Xue, Y.Q.; Xie, C.H. Numerical Simulationfor Groundwater; Science Press: Beijing, China, 2007. [Google Scholar]
  38. Cheung, C.W.; Porter, J.F.; McKay, G. Sorption kinetic analysis for the removal of cadmium ions from effluents using bone char. Water Res. 2001, 35, 605–612. [Google Scholar] [CrossRef]
  39. Gao, S.; Wang, L.; Long, T.; Cao, S.; Chen, Q. Research Progress on Migration Characteristics and Investigation Technologies of DNAPLs Contaminated Sites. J. Ecol. Rural Environ. 2018, 34, 289–299. [Google Scholar]
  40. Parker, B.L.; Cherry, J.; Chapman, S.; Guilbeault, M. Review and analysis of chlorinated solvent dense nonaqueous phase liquid distributions in five sandy aquifers. Vadose Zone J. 2003, 2, 116–137. [Google Scholar] [CrossRef]
  41. Wymore, R.A.; Akladiss, N. Integrated DNAPL site characterization and tools selection. In Proceedings of the 6th International Contaminated Site Remediation Conference, Melbourne, VIC, Australia, 13–16 September 2015. [Google Scholar]
  42. Zhang, W.; Shi, X.; Wu, J.; Wu, J. Impacts of the Spatial Variation of Permeability on the Transport of Dense Non-aqueous Phase Liquids in Porous Media. Geol. J. China Univ. 2013, 19, 677–682. [Google Scholar]
  43. Khachikian, C.; Harmon, T.C. Nonaqueous phase liquid dissolution in porous media: Current state of knowledge and research needs. Transp. Porous Media 2000, 38, 3–28. [Google Scholar] [CrossRef]
  44. Sale, T.; Newell, C. Decision Guide: A Guide for Selecting Remedies for Subsurface Releases of Chlorinated Solvent Sites; ESTCP Project ER-0530; Environmental Security Technology Certification Program: Washington, DC, USA, 2011. [Google Scholar]
Figure 1. Geographical location of the research area.
Water 16 03154 g001
Figure 2. Distribution profile of boreholes and aquifers in the study area (ft). (MW1-5 are labels for boreholes, while the ‘?’ symbol signifies that the geological structure in that specific area requires further verification).
Water 16 03154 g002
Figure 3. Model study area and shallow groundwater level map: (a) Model study area, MW represent boreholes; (b) shallow groundwater level map, the arrow indicates the direction of groundwater flow); TMW, W, GMW represent the wells in the area.
Water 16 03154 g003
Figure 4. Simulated flow field diagram: (a) shallow aquifers; (b) medium aquifers; (c) deep aquifers.
Water 16 03154 g004
Figure 5. Observation hole fitting water level map: (a) comparison chart between observed and calculated groundwater levels; (b) Well J; (c) Well MW-8; (d) Well R; (e) Well MW-10.
Water 16 03154 g005
Figure 6. Initial distribution of PCE contamination plume: (a) 3D distribution; (b) shallow aquifer; (c) middle aquifer; (d) deep aquifer.
Water 16 03154 g006
Figure 7. (a) Injection region division, T1~T8 represent different injection zones; (b) selected monitoring well location, the letters indicate the locations of the monitoring wells we have selected for use.
Water 16 03154 g007
Figure 8. Changes in pollution plumes during ERD remediation process: (a) initial pollution plume; (b) late stage of the first ERD remediation (31 December 2013); (c) end stage of the second ERD repair (7 October 2015).
Water 16 03154 g008
Figure 9. Comparison between observed and calculated PCE concentrations in monitoring wells.
Water 16 03154 g009
Figure 10. EVS visualization rendering geographical location of the research area in (a) plan view; (b) stereoscopic view; (c) three-dimensional elevation model; (d) three-dimensional pollution plume.
Water 16 03154 g010
Figure 11. Changes in pollution plumes during ERD remediation process.
Water 16 03154 g011
Table 1. Boundary generalization.
DirectionBoundary Description
NorthwestGeneralized to the recharge boundary using the parallel line of the groundwater contour.
EastGeneralized to the zero-flow boundary using the vertical line of the groundwater contour.
SouthGeneralized to the boundary of the north-south river right bank and known head boundary.
WestGeneralized to the boundary of the diagonally oriented river left bank and known head boundary.
Table 2. Optimized hydrogeological and solute transport parameters table.
Floor NumberKxx, Kyy
(m/d)
Kzz
(m/d)
Specific YieldCoefficient of StorageαLTRPT *TRVT *Effective Porosity
10.50.010.1-0.10.10.010.28
28.081-1.0 × 10−51.00.10.010.28
30.10.01-1.0 × 10−60.10.10.010.28
41.50.2-1.0 × 10−51.00.10.010.28
50.10.01-1.0 × 10−60.10.10.010.28
60.60.06-1.0 × 10−51.00.10.010.28
Note: * TRPT: ratio of horizontal to vertical dispersion; TRVT: ratio of vertical-to-vertical dispersion.
Table 3. Summary of inflow and outflow of each aquifer on 1 December 2010 (m3/d).
Shallow AquiferMiddle AquiferDeep Aquifer
BoundarySources and SinksBoundarySources and SinksBoundarySources and Sinks
InflowOutflow InflowOutflowInflowOutflowInflowOutflowInflowOutflowInflowOutflow
Flow upper face26.30 Storage 57.41 29.781.09
Flow lower face 67.11Constant head63.9447.261.3540.137.3228.80 1.3731.10
Flow left face Head dep bounds
Flow right face Wells12.83 2.87 1.04
Flow front face Recharge11.47
Flow back face
Total inflow114.54Total outflow114.37 Total inflow68.95Total outflow68.93Total inflow32.19Total outflow32.19
Table 4. Summary of inflow and outflow of each aquifer on 7 October 2015 (m3/d).
Shallow AquiferMiddle AquiferDeep Aquifer
BoundarySources and SinksBoundarySources and SinksBoundarySources and Sinks
InflowOutflow InflowOutflowInflowOutflowInflowOutflowInflowOutflowInflowOutflow
Flow upper face28.51 Storage 58.06 30.011.09
Flow lower face 67.79Constant head63.0548.361.3540.407.2629.14 1.3531.31
Flow left face Head dep bounds
Flow right face Wells12.83 2.87 1.04
Flow front face Recharge11.76
Flow back face
Total inflow116.15Total outflow116.15 Total inflow69.55Total outflow69.55Total inflow32.40Total outflow32.40
Table 5. Simulation prediction time and model division table.
Remediation ProcessTime PeriodRemediation MeasuresCorresponding AreasModel NumberInjection Well Remediation Rate (/d)
1 December 2011~
1 June 2012
In situ thermal desorptionHoliday Cleaners and thermal desorption region near T1 and T2 0.0274
Completed the initial full site ERD treatment in four injection events1 December 2010~
1 March 2011
ERD (injection of emulsified oil EVO)Cross-section of T8PM1.1 *0.0137
1 March 2011~
1 May 2011
ERD (injection of EVO)T3 well sectionPM2.10.0137
1 March 2012~
1 May 2012
ERD (injection of EVO)Remainder of T3, T1, and T2 sections, SPC, and wells T4 to T7PM3.10.0137
1 September 2012~
1 November 2012
ERD, EHC reagent (a repair reagent with an integrated carbon matrix and zero-valent iron source)T1 and T2 and the remainder of the Holiday Cleaners wellsPM4.10.1096
Second site-wide ERD treatment31 December 2013~
1 March 2014
ERD, KB-1 bacterial agent (a biofortified culture)Entire target areaPM5.10.1096
Note: * The time period between the implementation of remediation measures at two neighboring sites is the hiatus, corresponding to the models PM2.2, PM3.2, etc.
Table 6. Assuming the release time and concentration of the pollution source (mg/L).
DateGrid Near GGrid Near VGrid Near JGrid Near JJ
1 June 20113828--
1 December 20113828-6.5
1 June 201238281313
1 December 20124815129
1 June 2013201.7151.2
1 January 2014-1.52.94.5
1 June 2014---1.6
1 June 2015-0.2-1.5
Disclaimer/Publisher’s Note: The statements, opinions and data contained in all publications are solely those of the individual author(s) and contributor(s) and not of MDPI and/or the editor(s). MDPI and/or the editor(s) disclaim responsibility for any injury to people or property resulting from any ideas, methods, instructions or products referred to in the content.