Abstract
Evaluation of water resource carrying capacity is one of the methods used to measure the degree of realization of resource and environmental planning. This study takes 26 county-level units in the Dongting Lake area of Hunan Province as the evaluation object and screens 22 indicators for the evaluation of water resource carrying capacity. The comprehensive weight of the water resources carrying capacity of the Dongting Lake area is calculated using double weight methods (DWM) based on the analytical hierarchy process (AHP) and the entropy weighting method. And then, the back propagation (BP) neural network is used to predict the evolution of the alarm situation of the water resources carrying capacity. The results show the following: (1) In terms of time trend, the water resources carrying capacity of Dongting Lake area is generally stable and is between overload and critical state, but the change trends of water resources carrying capacity of each county are very different; (2) in terms of spatial distribution, the water resources carrying capacity in the western and southern regions of the Dongting Lake area is relatively high, while that in the Yueyang urban area in the eastern region is relatively low, showing a pattern of “high in the west and low in the east”; (3) among the criterion layers, the water resources support force has the highest weight and the smallest change, and the economic support force has the largest change in weight. The decline of water resources carrying capacity is closely related to the speed of economic development; (4) by 2025, the water resources carrying capacity of Nanxian County, Hanshou County, and Xiangyin County will be significantly increased from overload to critical state, and Dingcheng District will gradually turn from critical to overloaded status. This study is the first attempt to evaluate and predict the water resources carrying capacity of the Dongting Lake area at the county level so that the evaluation results are more applicable to grass-roots administrative units with decision-making power. The double-weighting method is used to determine the weights of the indicators so that the evaluation results can be more accurate.
1. Introduction
The issue of water resource utilization and carrying capacity is related to the achievement of the goal of sustainable development for humanity in the future and has received extensive attention in the academic and social fields. The environmental impact caused by the over-exploitation and utilization of water resources is increasing, which profoundly affects the quality of human life and the sustainability of the economy and society [1]. Milano et al. [2] established an integrated water resources modeling framework of the Ebro River Basin in Spain to evaluate the current and future capacity of water resources. Hui et al. [3] focused on the evaluation of the support of water resources for development. Xia et al. [4] believed that the water resources carrying capacity refers to their ability to support the growth of population scale and sustainable social development. Since the 1980s, there has been a proliferation of methods for assessing the water resources carrying capacity, but mainly a single method has been used to assess it, such as the close-value method [5,6], principal component analysis method [7,8], matter-element model method [7,9], projection pursuit method [10,11], fuzzy evaluation method [12,13], conventional trend method [14], multi-objective decision-making method [8,15,16], and system dynamics method (SD) [17,18,19]. After 2005, the comprehensive method coupling model evaluation systems are further used to evaluate the water resources carrying capacity, such as methods such as the DPSIR model [20], the PSR model [21], and the quantity-quality-domain-flow model [22,23,24]. With the wide application of machine learning technology, neural network algorithms, genetic algorithms, and particle swarm optimization algorithms are applied to the quantitative calculation of water resources carrying capacity [25,26,27]. With the improvement of the theoretical system, the system dynamics model is applied to the research of water resources carrying capacity, shifting from water quantity research limited to arid areas to the evaluation and scheduling scheme design of water resources carrying capacity in all climates [28,29,30].
Taking water resources carrying capacity as the theme, a keyword co-occurrence network analysis was conducted on journal literature in the Web of Science Core Collection database. We first screened out keywords that appeared more than 40 times in the literature and then revealed the associations between these keywords through visualization technology (Figure 1). The analysis results show that these keywords are mainly clustered in two research areas: one is centered on the system dynamics model and focuses on the research of watershed and urban water resources management; the other is mainly based on carrying capacity assessment and emphasizes the application of sustainable development and optimization methods. The similarity of colors in the figure indicates the close connection between keywords, while groups of different colors are relatively independent. The size of the keyword nodes reflects the frequency of their occurrence, and the thickness of the lines between nodes indicates the frequency of their co-occurrence. This analysis provides an intuitive perspective for us to understand the main trends of water resources carrying capacity research.
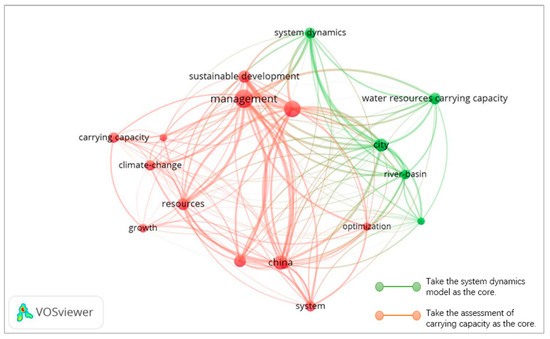
Figure 1.
Relationship diagram of keywords of water resources carrying capacity in literature.
Combined with the actual situation of the Dongting Lake area, based on the yearbook data of 26 county-level units in the Dongting Lake area from 1997 to 2022, this study selects society, economy, resources, and environment as the criterion layers to construct an index system. Combined with “the double weight methods (DWM)” of entropy weight method and the analytic hierarchy process (AHP) to determine the comprehensive weight, and then combined with the BP neural network model to evaluate and predict the water resources carrying capacity. As for the evaluation and prediction of the water resources carrying capacity of the Dongting Lake area based on “county-level units”, there are no results yet. The evaluation and prediction using the DWM method are also rare. This research is an innovative study compared to the current situation.
2. Research Area
2.1. Regional Overview
2.1.1. Regional Scope
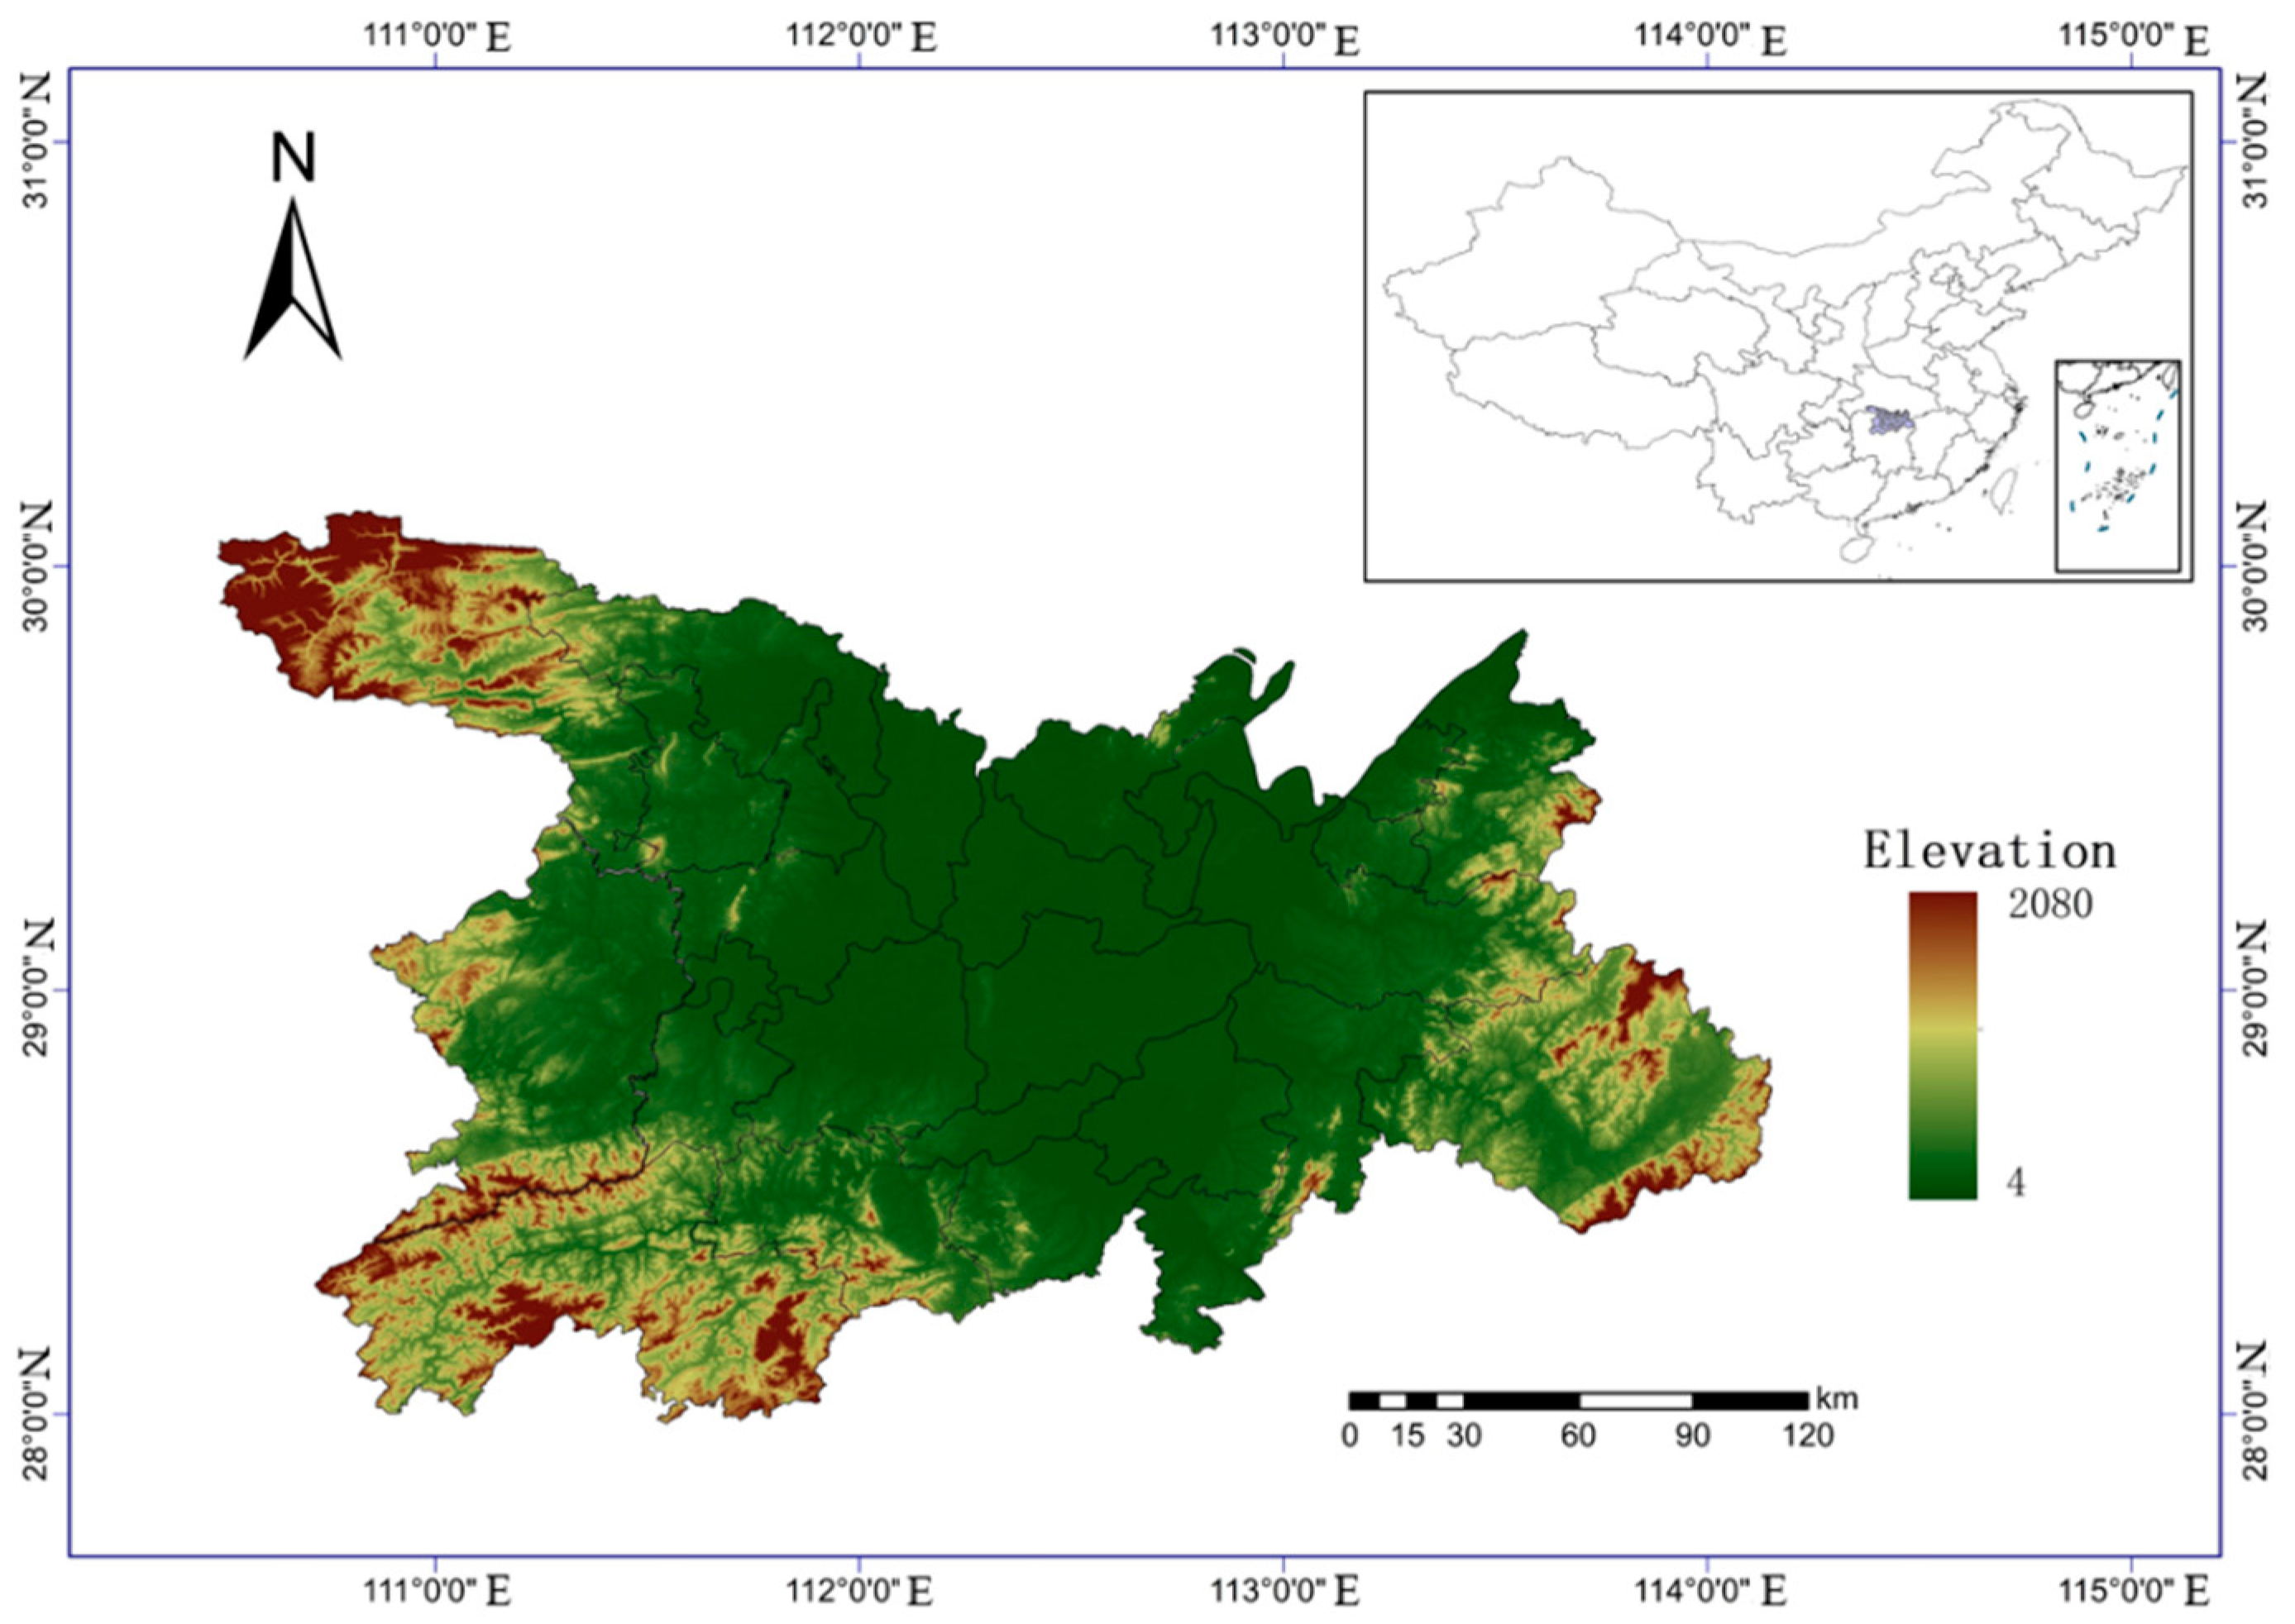
Dongting Lake is the second largest freshwater lake in China, located mainly in Hunan and Hubei provinces, with 81% of its area in Hunan province. Due to the differences in the allocation of economic and social resources between Hunan and Hubei provinces and the differences in the timeliness and difficulty of obtaining data in different provinces, the area within Hunan Province in the Dongting Lake area is selected as the research area, specifically including the cities of Yueyang, Yiyang, and Changde, as well as Wangcheng District of Changsha City (Figure 2). The county-level units include nine districts and counties of Yueyang City, nine districts and counties of Changde City, and seven districts and counties of Yiyang City and Wangcheng District of Changsha. All districts and counties later are referred to as counties for short.

Figure 2.
Demonstration Map of Dongting Lake Area (within Hunan Province).
2.1.2. Regional Economic and Social Conditions
The Dongting Lake area is an important production base for commercial grain, cotton, oil, and tea, as well as a breeding base for pigs, cattle, sheep, and aquatic products in China. It plays a crucial role in the economic and social development of Hunan and even the whole country. Its petroleum, food, light textile, papermaking, and other industries occupy an important position in Hunan Province (Table 1). From 1999 to 2021, the economy of the Dongting Lake area grew rapidly. The regional GDP increased from 74.02 billion yuan in 1999 to 1.04 trillion yuan in 2021, accounting for about 23% of Hunan’s GDP.

Table 1.
Basic economic and social situation of Dongting Lake Area.
2.1.3. Biological Resources
The Dongting Lake area is rich in biological resources (Table 2) [31]. Among them, the statistics of bird populations are based on recent studies [32]. There are currently 432 species of vertebrates belonging to 5 classes and 37 orders. There are 7 species of shrimp and crab animals belonging to 5 families, 48 species of shellfish belonging to 9 families, and 150 species of insects belonging to 50 families [33]. There are a large number of endangered and rare species, including Chinese sturgeon, finless porpoise, baiji dolphin, small white-fronted geese, white stork, and 11 other kinds of national first-class protected animals, and more than 20 kinds of national second-class protected animals [34]. The plant resources are also very rich. There are more than 1400 species of plants, including more than 600 species of medicinal plants, more than 90 species of wild oil plants, more than 70 species of aromatic oil plants with utilization value, more than 80 species of important forage plants, more than 60 species of starch plants, and more than 250 species of economic trees. These biological resources have a high economic value and can be used for a wide range of purposes.
Table 2.
Overview of biological populations in the Dongting Lake area.
2.1.4. Wetland Resources
Dongting Lake contains typical wetland resources of lakes in the world (Table 3) [35]. In 1992, Dongting Lake was listed as an internationally important wetlands by UNESCO. In 1994, the State Council designated East Dongting Lake as a national nature reserve. In 2005, the West Dongting Lake National Wetland Park was established. By 2022, 12 provincial-level and above wetland nature reserves had been established in the Dongting Lake area, with a protection area of 7076 square kilometers (Table 4). Among them, there are four internationally important wetlands.
Table 3.
Composition of Dongting Lake wetland.
Table 4.
Wetland nature reserves in the Dongting area.
2.2. Water Resources Condition
Dongting Lake area is located in the subtropical monsoon climate zone, with an average annual rainfall of 1390 mm (from 1951 to 2021). Dongting Lake gathers the resources of the “Four Rivers”, including the Xiangjiang River, Zijiang River, Yuanshui River, and Lishui River (Table 5), forming a “U”-shaped lake, which enters the Yangtze River through Chenglingji. The lake water is relatively flowing, with rich internal ecosystems and strong self-purification ability. At the same time, more than 4400 reservoirs have been built, which plays an extremely important role in the protection and use of water resources.
Table 5.
Basic conditions of “four waters”.
In 2003, the Three Gorges Reservoir began to store water, which led to a sudden decrease in the amount of water entering and leaving Dongting Lake, resulting in a serious shrinkage of the watershed area of Dongting Lake. From 2003 to 2009, the average amount of water inflow of Dongting Lake dropped sharply by 26% and showed a decreasing trend year by year (Table 6).
Table 6.
Statistics of annual water inflow and outflow of Dongting Lake.
2.3. Research Flow Chart
Based on the above research background, the research flow chart formulated in this study is shown in Figure 3.
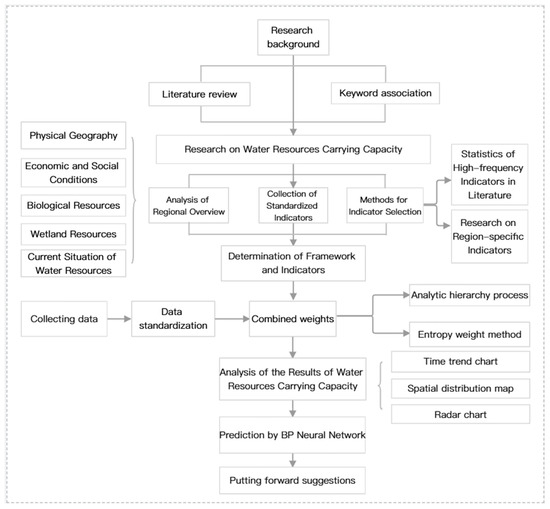
Figure 3.
Research flow chart.
3. Model Methods and Index Systems
3.1. Model Construction
3.1.1. Target Layer and Criterion Layer
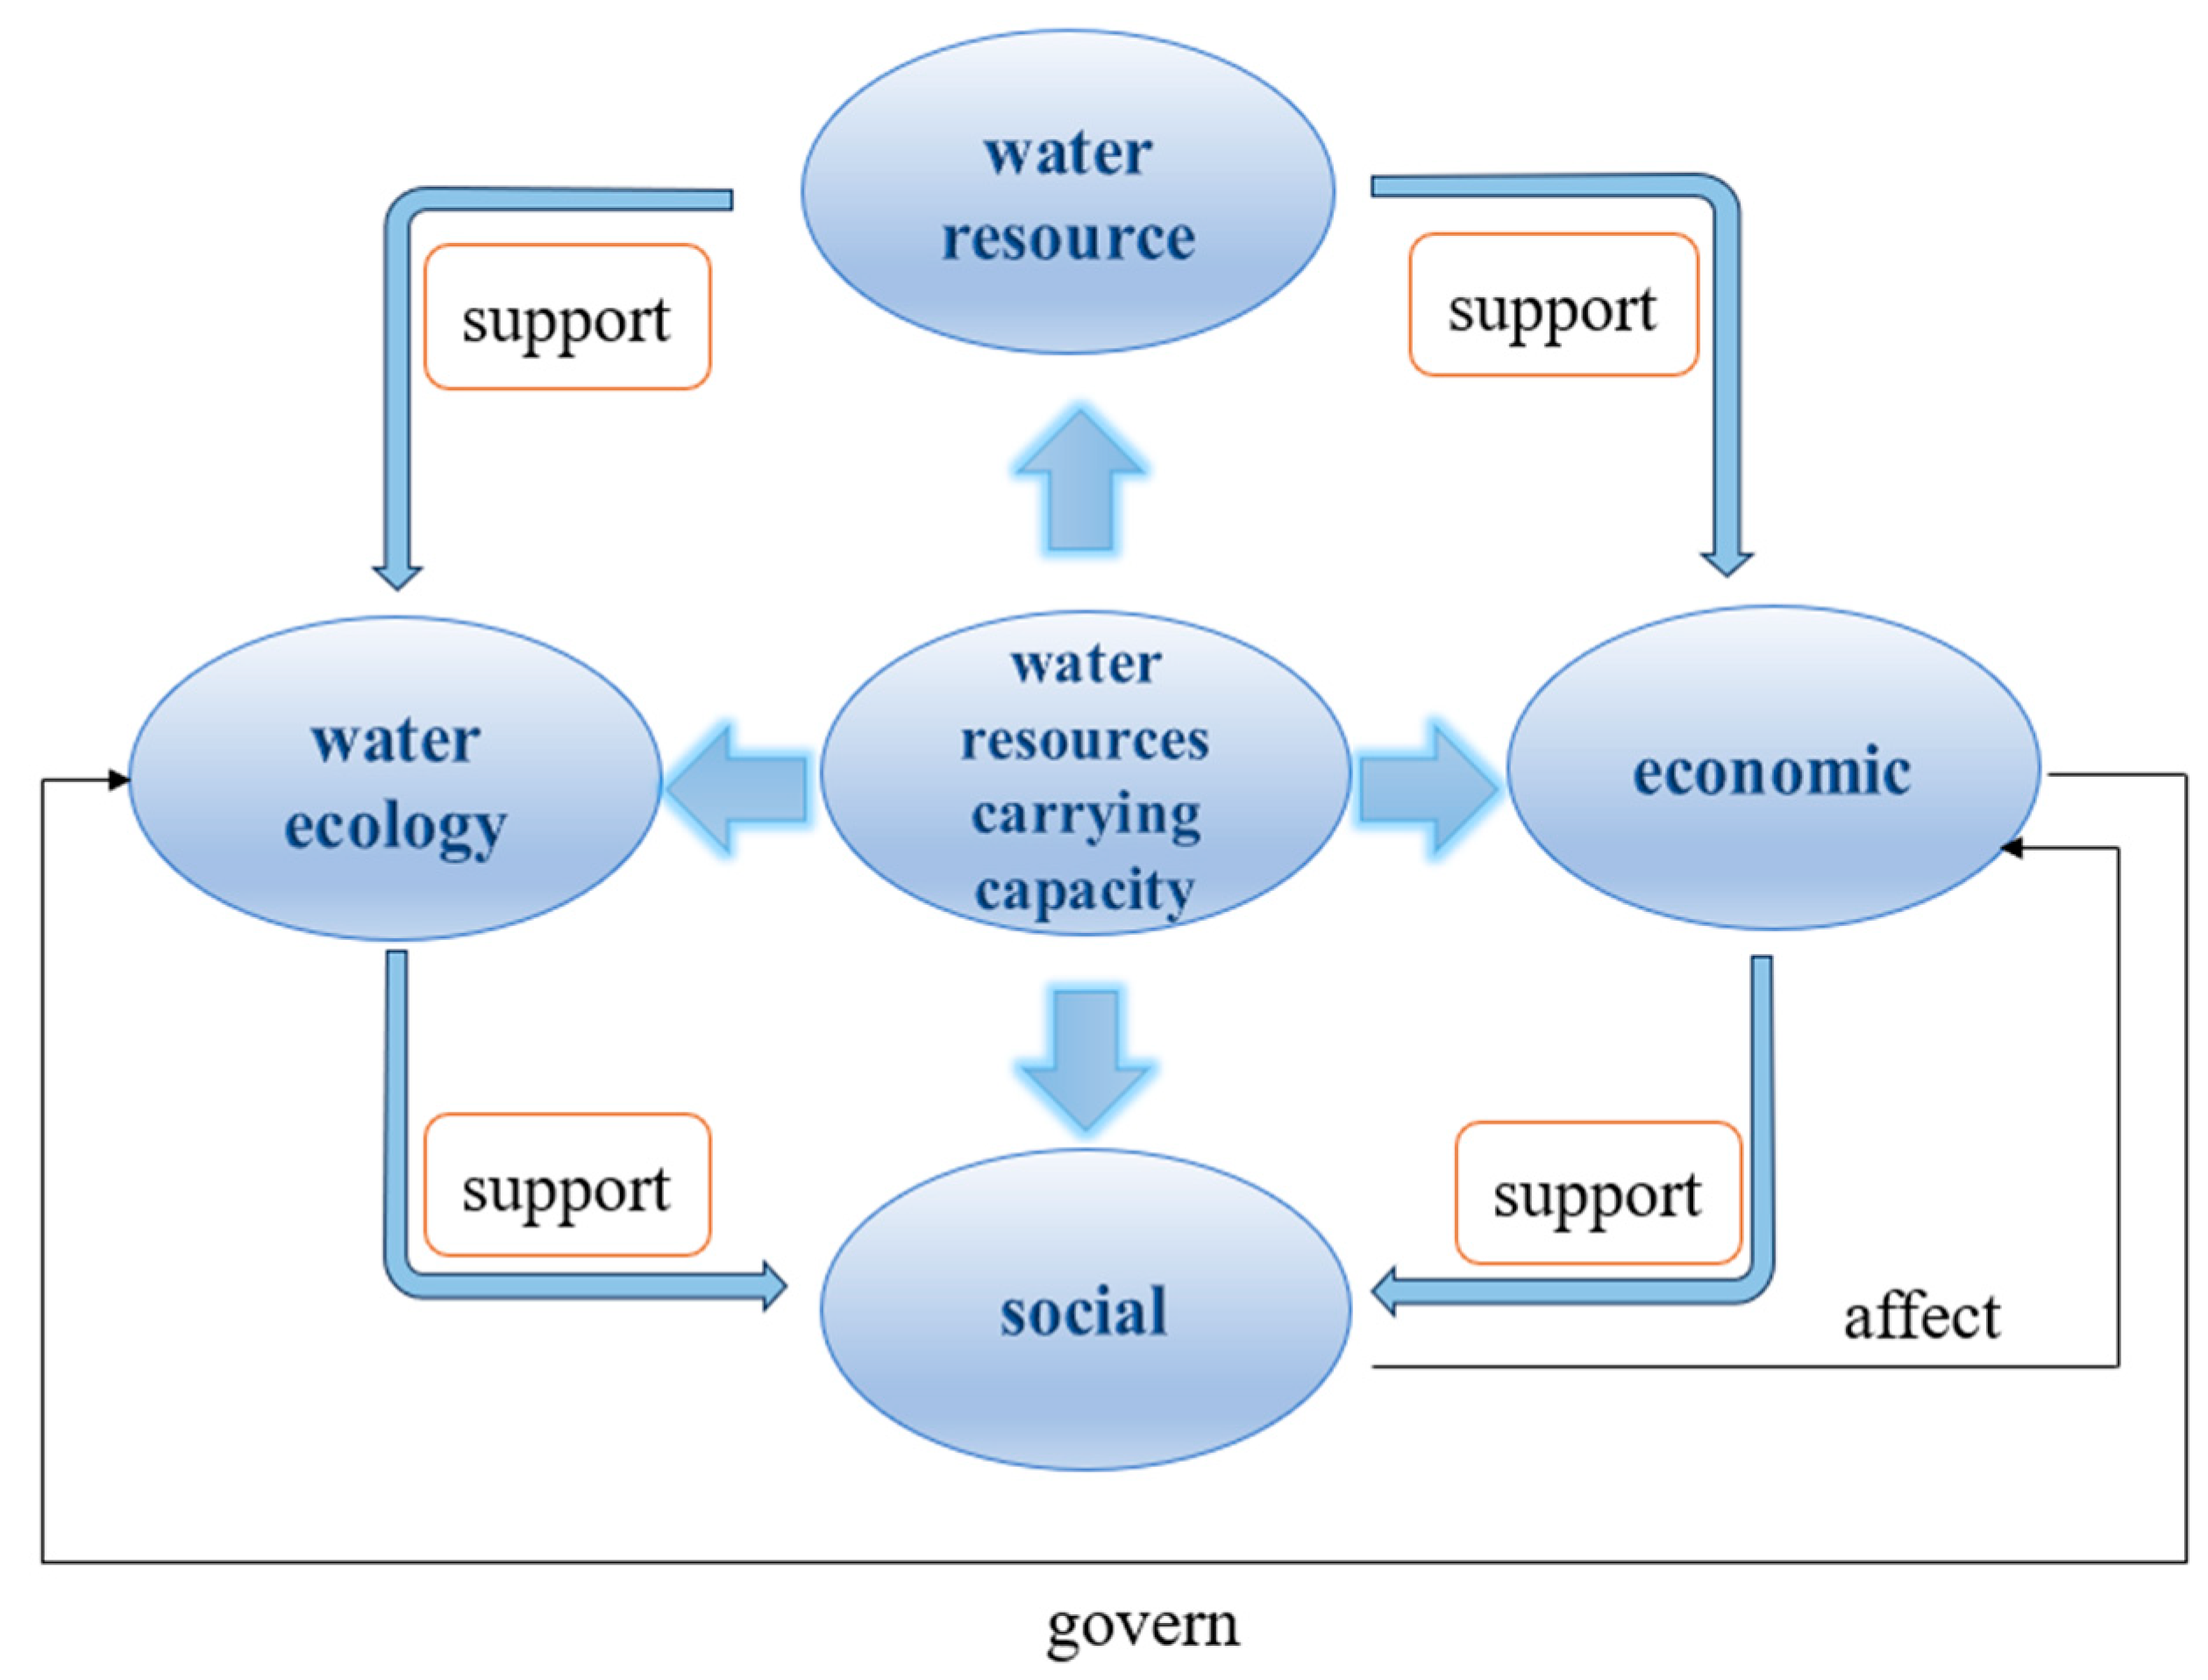
The core resource of the Dongting Lake area is water resources. The target layer is the water resources carrying capacity level of the Dongting Lake area. The most prominent ecological feature is wetland ecology. The carrying capacity of the water resources system is influenced by the “water-social-economic-ecological-environmental” complex system. Therefore, the water resources carrying capacity of the Dongting Lake area adopts a four-dimensional support force construction model, including water resources support force, economic support force, social support force, and water ecological support force (Figure 4).

Figure 4.
Framework of criterion layer.
The water resources support force is the fundamental basis of the water resources carrying capacity. The economic support force is the most direct and realistic manifestation of the capacity for carrying water resources. The social development force (social support force) is based on the water resources support force and economic support force, which is the core of the water resources carrying capacity. The water ecological support force reflects the environmental capacity and is the “mental state” of water resources.
3.1.2. Index Layer
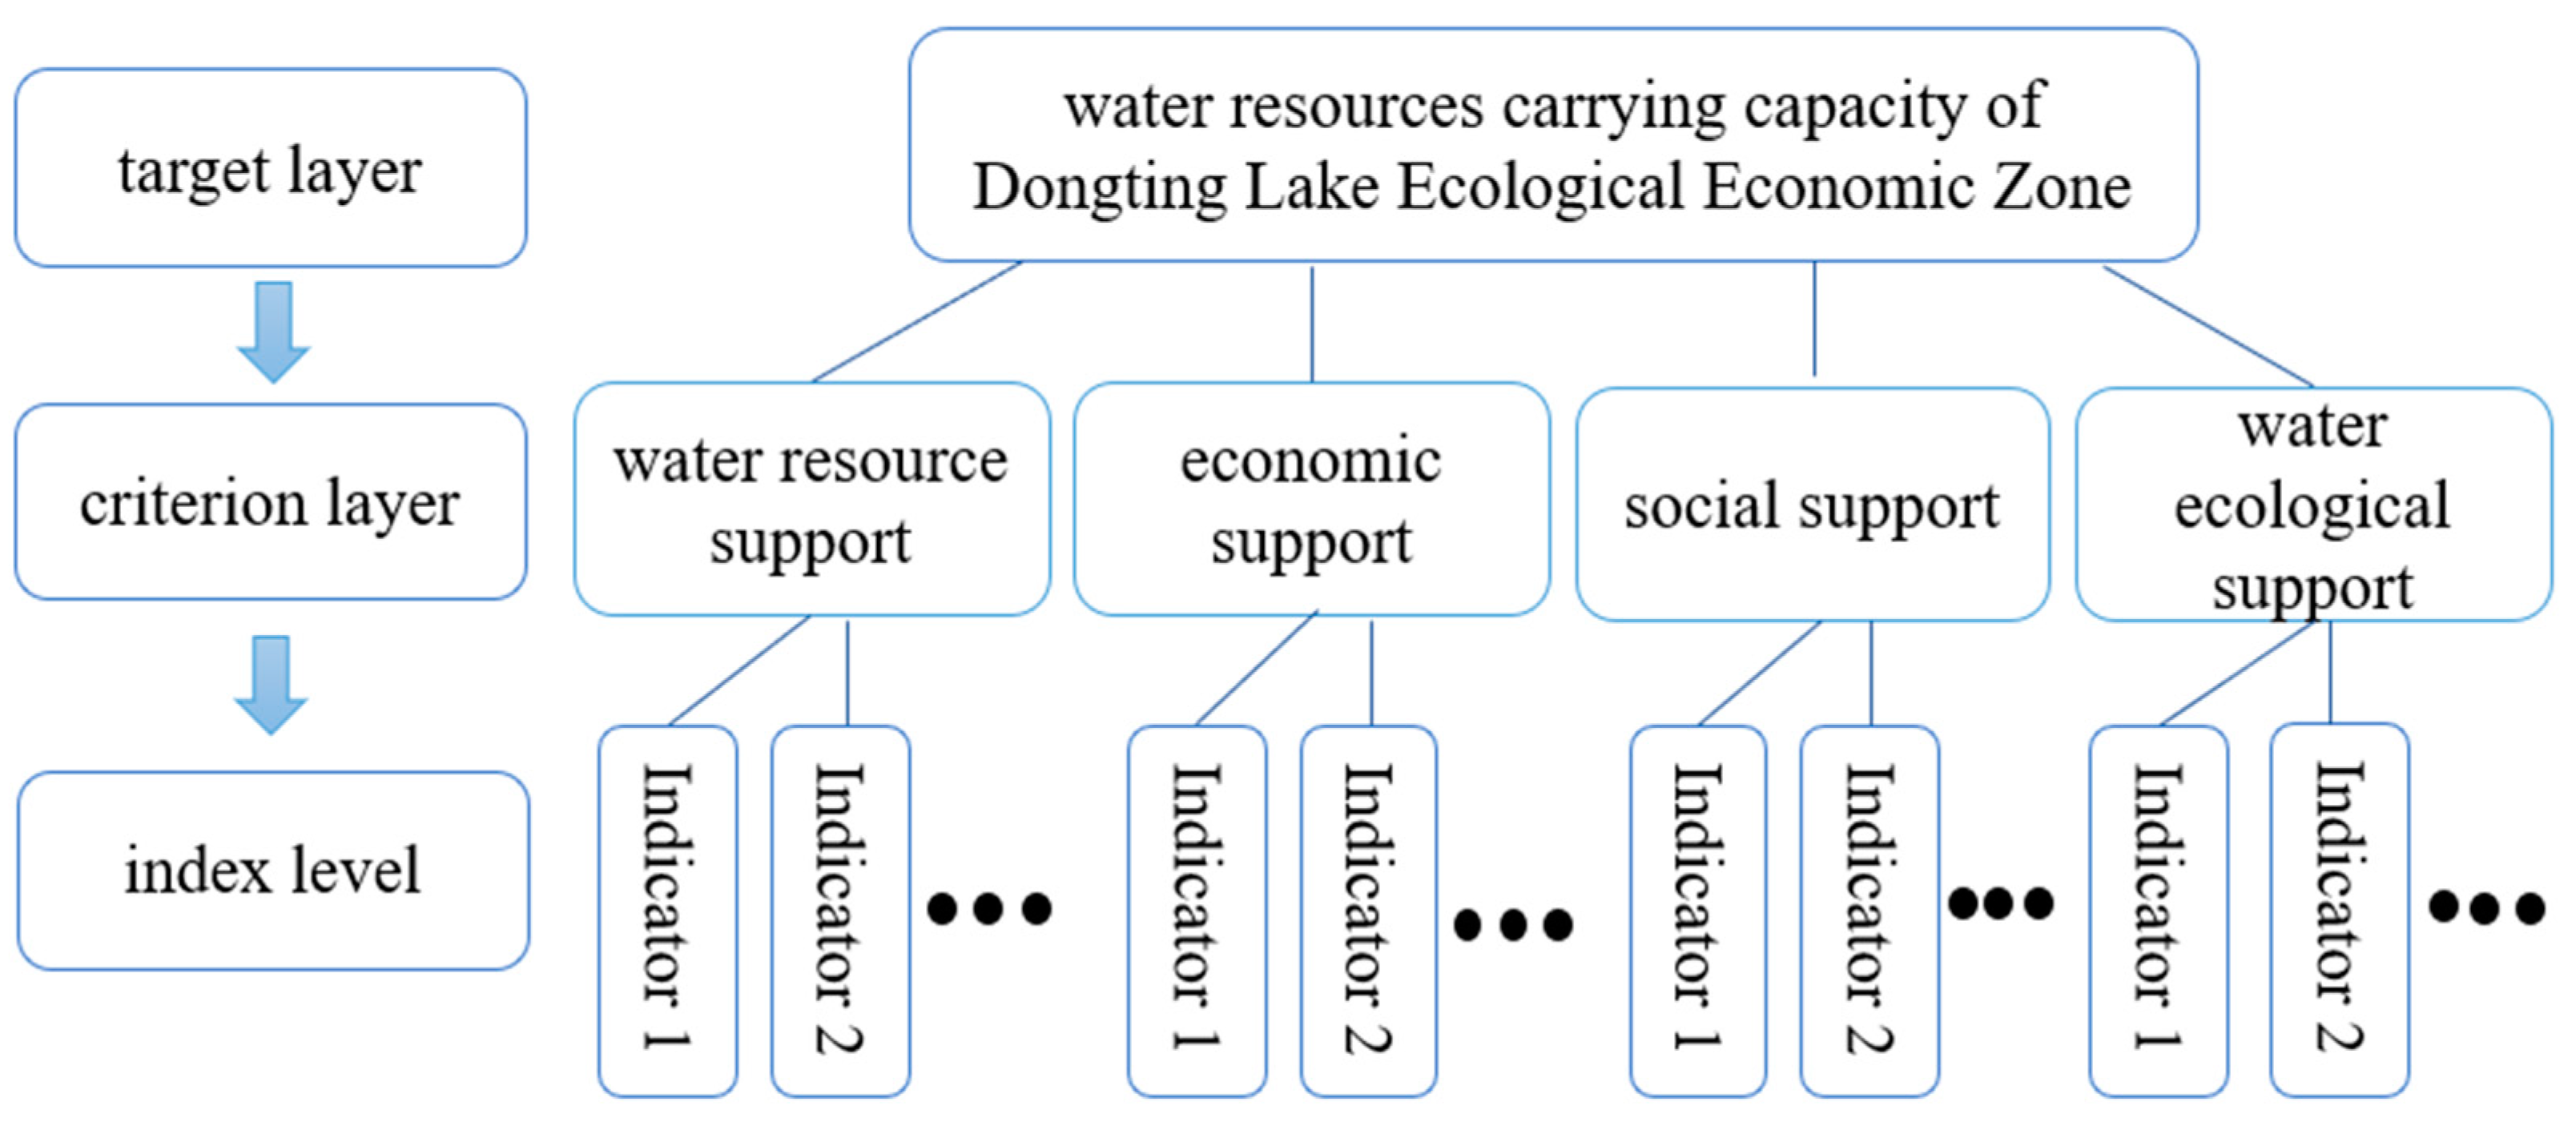
Based on the above criterion layer and combined with the relationship between water resources carrying capacity in Figure 3, the Analytic Hierarchy Process (AHP) and entropy weight method are suitable for the evaluation of water resources carrying capacity. The weight matrix is established through the AHP method to measure the level of water resource carrying capacity and make the logical system of target level-criterion level-indicator level clear (Figure 5).
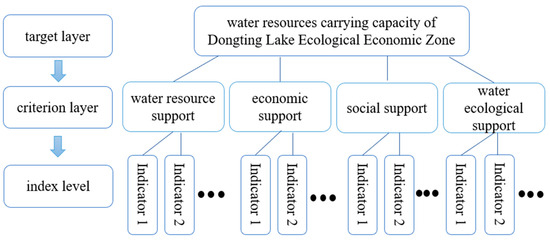
Figure 5.
Logical system of evaluation model.
3.2. Screening of Index System
3.2.1. Construction and Selection of Candidate Indicator Library
As a lake plain in the southern hilly area, the Dongting Lake area has a complex river system and rich biodiversity. Therefore, the specificity of the study area needs to be taken into account when selecting indicators. The frequency analysis method is used to determine the candidate indicators while comprehensively considering the regional characteristics of the Dongting Lake area and the characteristics of the Dongting Lake wetland ecosystem.
By consulting 55 pieces of literature in the field of a comprehensive evaluation of water resources carrying capacity and water resources ecological environment, some indicators with the highest frequency of occurrence are collected from representative literature to construct a candidate indicator library, as shown in Table 7 [8,16,17,18,21,22,24,26,27,28,29,30,36,37,38,39,40,41,42,43,44,45,46,47,48,49,50,51,52,53,54,55,56,57,58,59,60,61,62,63,64,65,66,67,68,69,70,71,72,73,74,75,76,77,78]. In 55 literature, quite a few indicators only appear 1–2 times, which can be considered to be only suitable for the adoption of specific research objects from specific angles and have no universal significance in the field of water resources carrying capacity evaluation. Based on the frequency of literature indicators, the indicators with a frequency of occurrence greater than six and a frequency greater than 10% are composed of an indicator candidate library (Table 7).
Table 7.
Frequency statistics of water resources carrying capacity indicators (candidate indicator library).
Some indicators in the candidate indicator library have repetitive meanings, such as water production coefficient and water production modulus, population density, total population, etc. Some indicators are not suitable for evaluation with administrative units as the object. For example, ecological base flow is an indicator that shows the characteristics of water resources. According to the principle of easy quantification, it is not applicable to the statistics of water resources carrying capacity of administrative divisions. Choosing habitat water use is more meaningful.
3.2.2. Selection of Index System
The high-frequency indicators in the candidate indicator library are all basic indicators that represent the water resource’s carrying capacity, and a set of indicators for describing the water resource’s carrying capacity can be constructed. Relative to the specific area of the Dongting Lake area, it must be supplemented according to the wetland ecological characteristics of the Dongting Lake area (Table 8). Among the 22 indicators, 12 are basic indicators and are directly used from the candidate indicator library (Table 7). Six indicators are unique indicators that better reflect the quantification of lake wetlands with similar usage meanings. Generally, they are indicators obtained indirectly by calculating based on multiple statistical data (Table 9). Four indicators, dam length, water body, and marsh area, are “special indicators” of Dongting Lake.
Table 8.
Construction of water resources carrying capacity index.
Table 9.
Calculation formula of indirect indicators.
- (1)
- Supporting the power of water resources (represented by A). Annual precipitation is the basic index that describes the statistical water resources and is denoted by A1. Per capita water use refers to the average amount of water used by a person in a given period of time and is expressed as A2. The water production coefficient is the total water resources of the Dongting Lake area divided by the total annual rainfall, represented by A3. The reservoir capacity index is an important background index of water resources in the Dongting Lake area, represented by A4. The length of the dam reflects the characteristics of the Dongting Lake area, expressed by A5. Effective irrigated area is an index that measures the degree of water utilization and stability of agricultural production in agricultural production units and regions, as represented by A6;
- (2)
- Economic support (represented by B). Per capita GDP is the most direct data to grasp the macro-economic status of the Dongting Lake area and is represented by B1. GDP growth rate is an important indicator of macro-economy, represented by B2. Water use for 10,000 yuan of GDP is represented by B3. Industrial and agricultural water production rates reflect the water use efficiency of industry and agriculture in the Dongting Lake eco-economic zone and are represented by B4 and B5, respectively. The output of aquatic products is the index of the comprehensive utilization of water resources in the study area, which can better reflect the economic value of lake water, represented by B6;
- (3)
- Social support (represented by C). Population density is an important index used to measure the population distribution in the Dongting Lake area, as represented by C1. The rate of natural increase is a composite indicator of the level and rate of natural population growth and is expressed as C2. The coefficient of Engel is an important basis for evaluating the living standard of the study area, represented by C3. The urbanization rate is an indicator used to evaluate the degree of urbanization, and it is expressed as C4. Domestic water consumption (including urban and rural domestic water consumption) is an important indicator of water utilization and is expressed as C5;
- (4)
- Supporting force of water ecology (represented by D). The forest coverage rate is an important index reflecting the actual level of forest resources and forest land, represented by D1. The water area and marshland area are important indicators of the health of the water environment in the Dongting Lake area, represented by D2. The indicator of ecological environment input shows the promotion effect of economic development on the environment in the Dongting Lake area, represented by D3. The sewage treatment rate refers to the proportion of the treated domestic sewage and industrial wastewater in total sewage discharge, as represented by D4. Ecological water use refers to the urban environmental water used by man-made measures and partially replenished by rivers, lakes, and wetlands, and is denoted by D5.
3.3. Weight Determination Method
Looking at the evaluation results of water resources carrying capacity, the entropy weight method is more often used to determine the weights. According to the analysis of the relationship between keywords in the literature, the entropy weight method is closely related to AHP and water resources carrying capacity (Figure 1). In this study, the Dual Weight Method (DWM), which combines the AHP and entropy weight methods, was used to determine the indicator weights.
3.3.1. Analytic Hierarchy Process
AHP is a subjective weighting method that establishes a hierarchical structure from the target layer, criterion layer, index layer, etc., and conducts step-by-step analysis to compare the relative importance of various related factors. Generally, AHP invites relevant personnel to score indicators and convert them into judgment matrices according to the Saaty relative importance level table (Table 10).
Table 10.
Relative importance of Saaty.
The maximum eigenvalue of the judgment matrix is calculated by using IBM SPSS Statistics 27.0 software. According to the Formulas (1) and (2), the consistency index CI is calculated. Only when CR < 0.1, that is, when the degree of inconsistency is within the allowable range, can the judgment matrix pass the consistency test.
3.3.2. Entropy Weight Method
The entropy weight method is an objective weighting method. That is, the entropy value is used to judge the degree of dispersion of the indicators and thus determine the weight of the indicators. This method is suitable for multi-index comprehensive evaluation. After standardizing the index value, the characteristic proportion or contribution degree Sij of the ith city under the jth index is calculated. The steps are as follows:
- (1)
- Calculate the entropy Hj of the jth index:
- (2)
- Calculate the value of the difference coefficient Ej based on the entropy Hj.
- (3)
- Calculate the index weight Wj.
3.3.3. Weight Determination by DWM
AHP is a subjective weight determination method that reflects the weight information after relevant personnel consider the relationship between various indicators in the research area. The entropy weighting method provides an objectively quantified index weight through data laws. The advantage of DWM is that it can make the results more scientific and reasonable. According to the calculation results of DWM, this study determines the comprehensive weight w, and the calculation formula is as follows:
where a and b are preference coefficients. Referring to the relevant research results [49,50], in general, both are taken as 0.5.
3.4. BP Network Model for Risk Early Warning
3.4.1. BP Neural Network and Its Basic Principles
BP neural network is based on the error backpropagation algorithm, also known as the backpropagation neural network, which is a multi-layer feedforward neural network with hidden layers. It consists of several neurons that form the input layer, hidden layer, and output layer. The operation process of its algorithm contains two stages, namely forward propagation and backward propagation. The input survey samples are transmitted from the input layer to the output layer through the hidden layer. The neurons in each layer only influence the neurons in the next layer in one direction, which is forward propagation. The error between the predicted output and the set output is then compared. If the error between the predicted output and the target output exceeds the accuracy range set by the BP neural network, the error is propagated back from the output layer to the hidden layer, and the connection weights and thresholds of each neuron are adjusted layer by layer until the error of the output survey sample meets the network accuracy requirements. This process is backward propagation.
3.4.2. BP Neural Network Structure
The basic structure of the BP network has n nodes in the input layer and the input variables as ; the number of nodes in the hidden layer as q; the connection weight between the input layer nodes and the hidden layer nodes as ; the threshold of the hidden layer nodes as ; the output of the hidden nodes as yj; the number of nodes in the output layer as m, and the connection weight between the hidden layer nodes and the output layer nodes as ; the threshold of the output layer nodes is ; and the output of the output layer nodes as Ok. Each neuron is represented by a node. The network is composed of nodes in the input layer, hidden layer, and output layer. The hidden layer can be one layer or multiple layers, as shown in Figure 5. The nodes from the previous layer to the latter layer are connected by weights. The hidden nodes generally use the Sigmoid function. The input and output nodes can use the Sigmoid functions or linear functions.
3.5. Division of Risk Early Warning Intervals
For the setting of the grading standards for the risk early warning of water resources carrying capacity, relevant evaluations on the division of risk early warning levels were consulted and borrowed [78,79,80]. In most risk early warning division standards, from safe to dangerous states, they correspond to five levels, from no alarm to extremely severe alarm. The risk early warning of water resources carrying capacity used in this study corresponds to the five levels of carrying capacity level evaluation. Combined with and borrowing from the five-level division of the aforementioned literature, the risk early warning level is divided into five corresponding levels, from extremely severe alarm to no alarm, to reflect the risk early warning status of water resources carrying capacity (Table 11). This five-level division method is often used in some research literature [40,81].
Table 11.
Classification standard for risk early warning results of resource and environmental carrying capacity.
4. Evaluation of Water Resources Carrying Capacity in Dongting Lake Area
4.1. Data Source
The evaluation unit of water resources carrying capacity in the Dongting Lake area is 26 counties. The original data for the above indexes were primarily collected from the 1997–2021 “China Statistical Yearbook”, “Hunan Province Water Resources Bulletin”, “Hunan Province Water Conservancy Statistical Yearbook”, “Yueyang City Water Resources Bulletin”, “Changde City Water Resources Bulletin”, “Yiyang City Water Resources Bulletin”, “Changsha City Water Resources Bulletin”, and “Statistical Bulletin of National Economy”, etc. Interpolation is carried out for the missing data in a very small number of years.
4.2. DWM Weight Calculation
4.2.1. AHP Weight
In the evaluation index system, according to the AHP steps, eight relevant personnel are invited to evaluate the criterion layer and the index system. Among them, there are two ecological environmental management experts, two environmental protection enterprise personnel, two government officials, and two local residents’ representatives. Through the consistency inspection, the relevant personnel in the Dongting Lake area are generally consistent in their judgments on the criterion layer of water resources carrying capacity. Therefore, AHP does not consider the calculation results of the criterion layer and only calculates the index weight. There is no trend of change from year to year in a one-time assessment.
4.2.2. EWM Weight
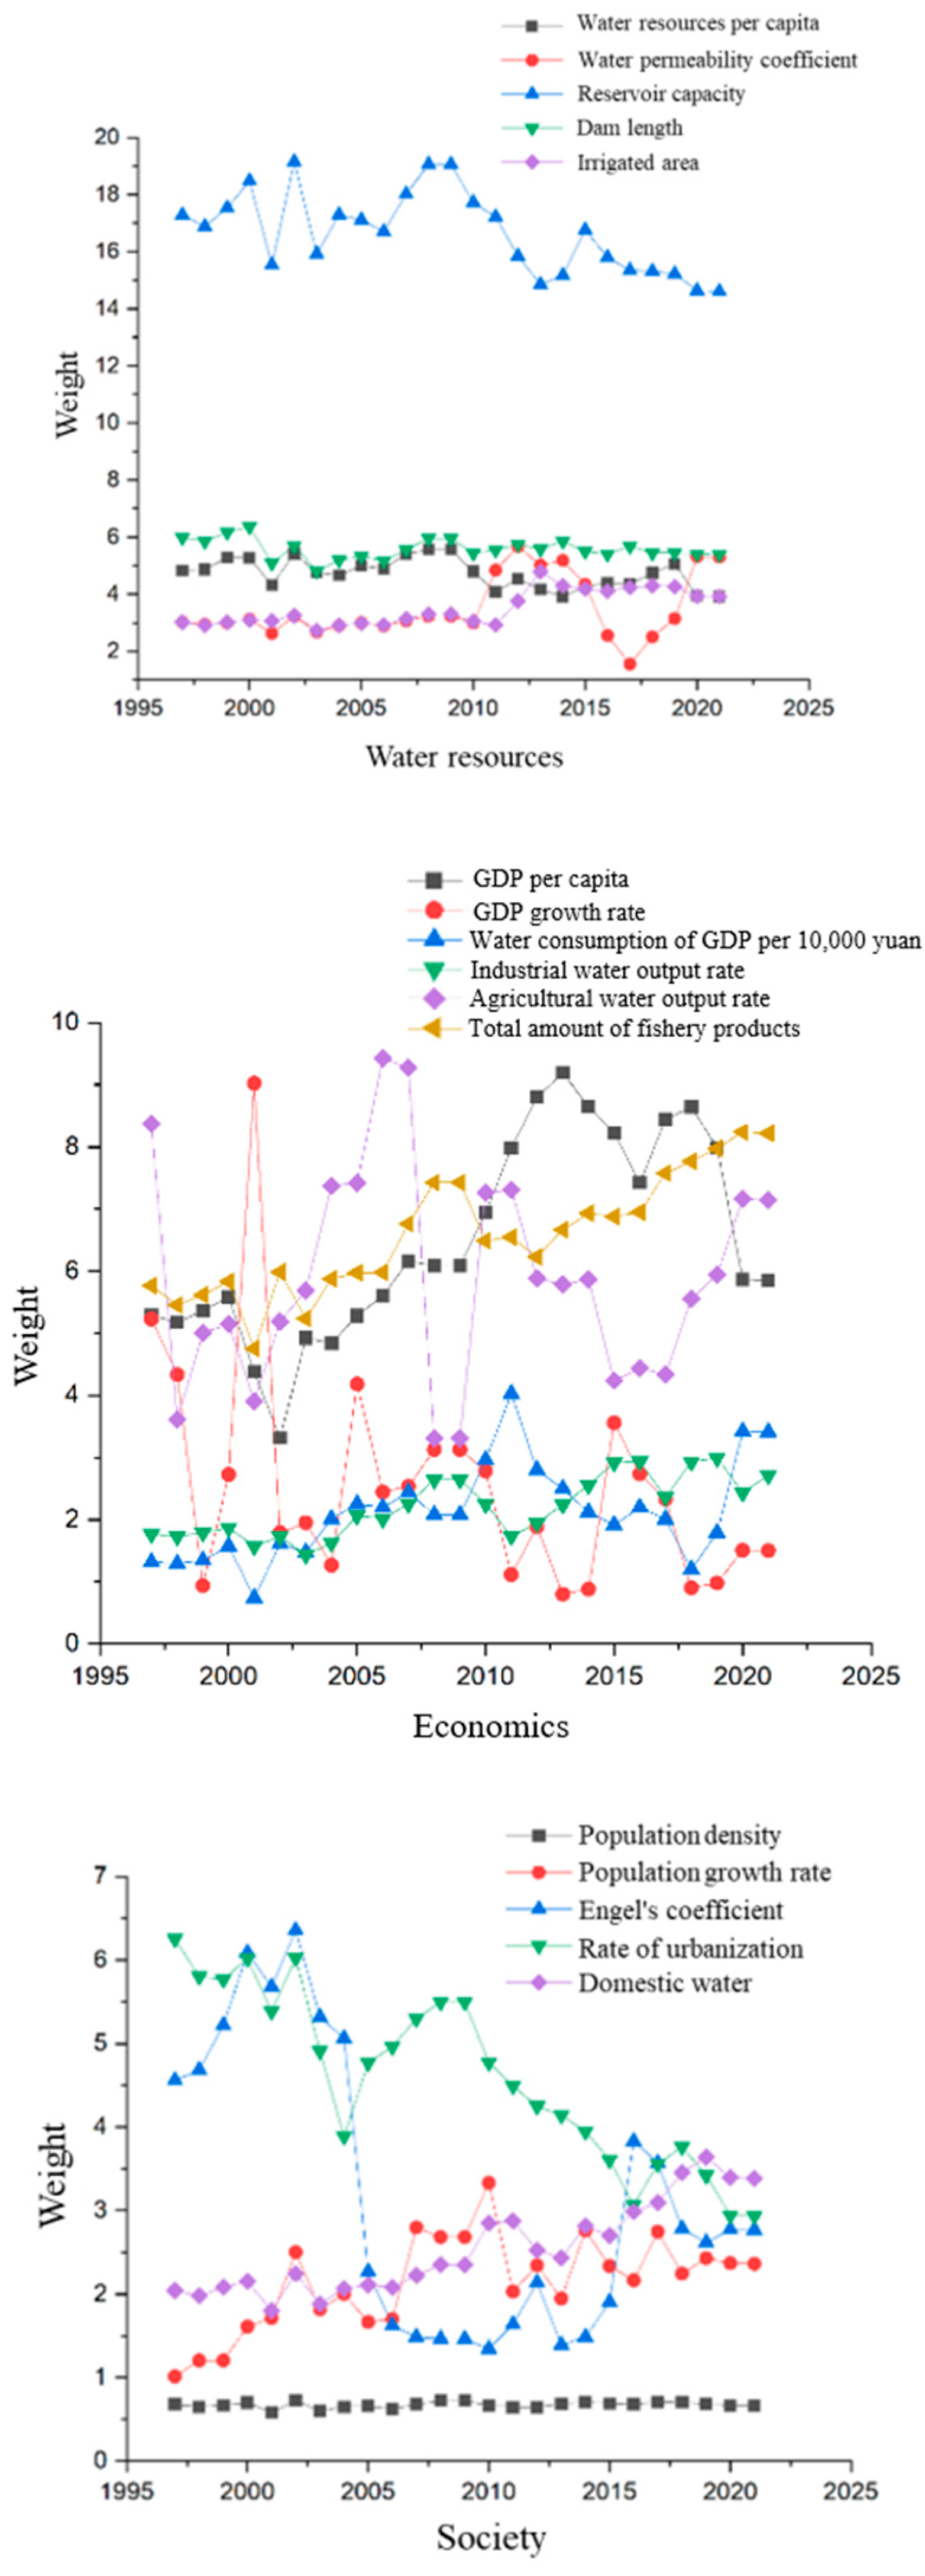
According to the calculation formula of the entropy weight method, calculate the weights of the criterion layer and the index layer. There are 25 years of different data, and there are many calculation results, and there is no year of sudden change. Therefore, the weight ratio of each criterion layer is counted every 5 years (Table 12), and the various indicators show fluctuating changes from year to year (Figure 6).
Table 12.
Weight ratio (%) of criterion layer of entropy weight method.

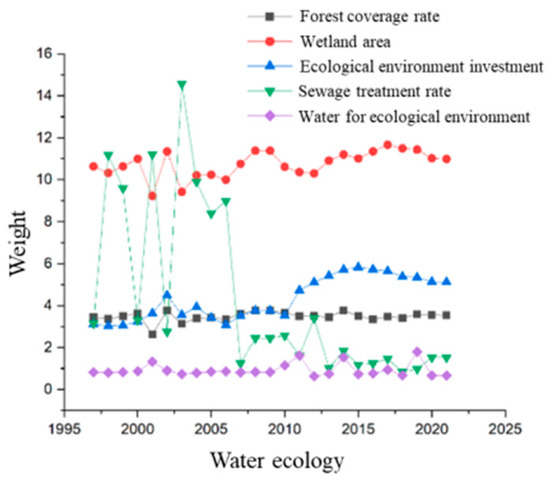
Figure 6.
Annual variation of index layer weights using entropy weight method.
4.2.3. DWM Wight
AHP weights do not change after they are determined. The weight of the entropy weight method will change with the change of the information entropy of a single index in the time series. Therefore, the combined weight actually used also changes from year to year. Calculate the DWM weights are based on Formula (7) (Table 13).
Table 13.
Weight value of each indicator.
4.3. Calculation of Water Resources Carrying Capacity
This study spans a long period of time. A centralized analysis will ignore the details of year-to-year changes. The year-by-year analysis will appear messy in information. Therefore, combined with the “five-year plan”, the comprehensive evaluation results of water resources carrying capacity in the Dongting Lake area are analyzed within a moderate time span (Table 14).
Table 14.
Water resources carrying capacity and ranking of each county in the Dongting Lake area.
5. Result Analysis
5.1. Analysis of Time Trend
5.1.1. Yueyang City
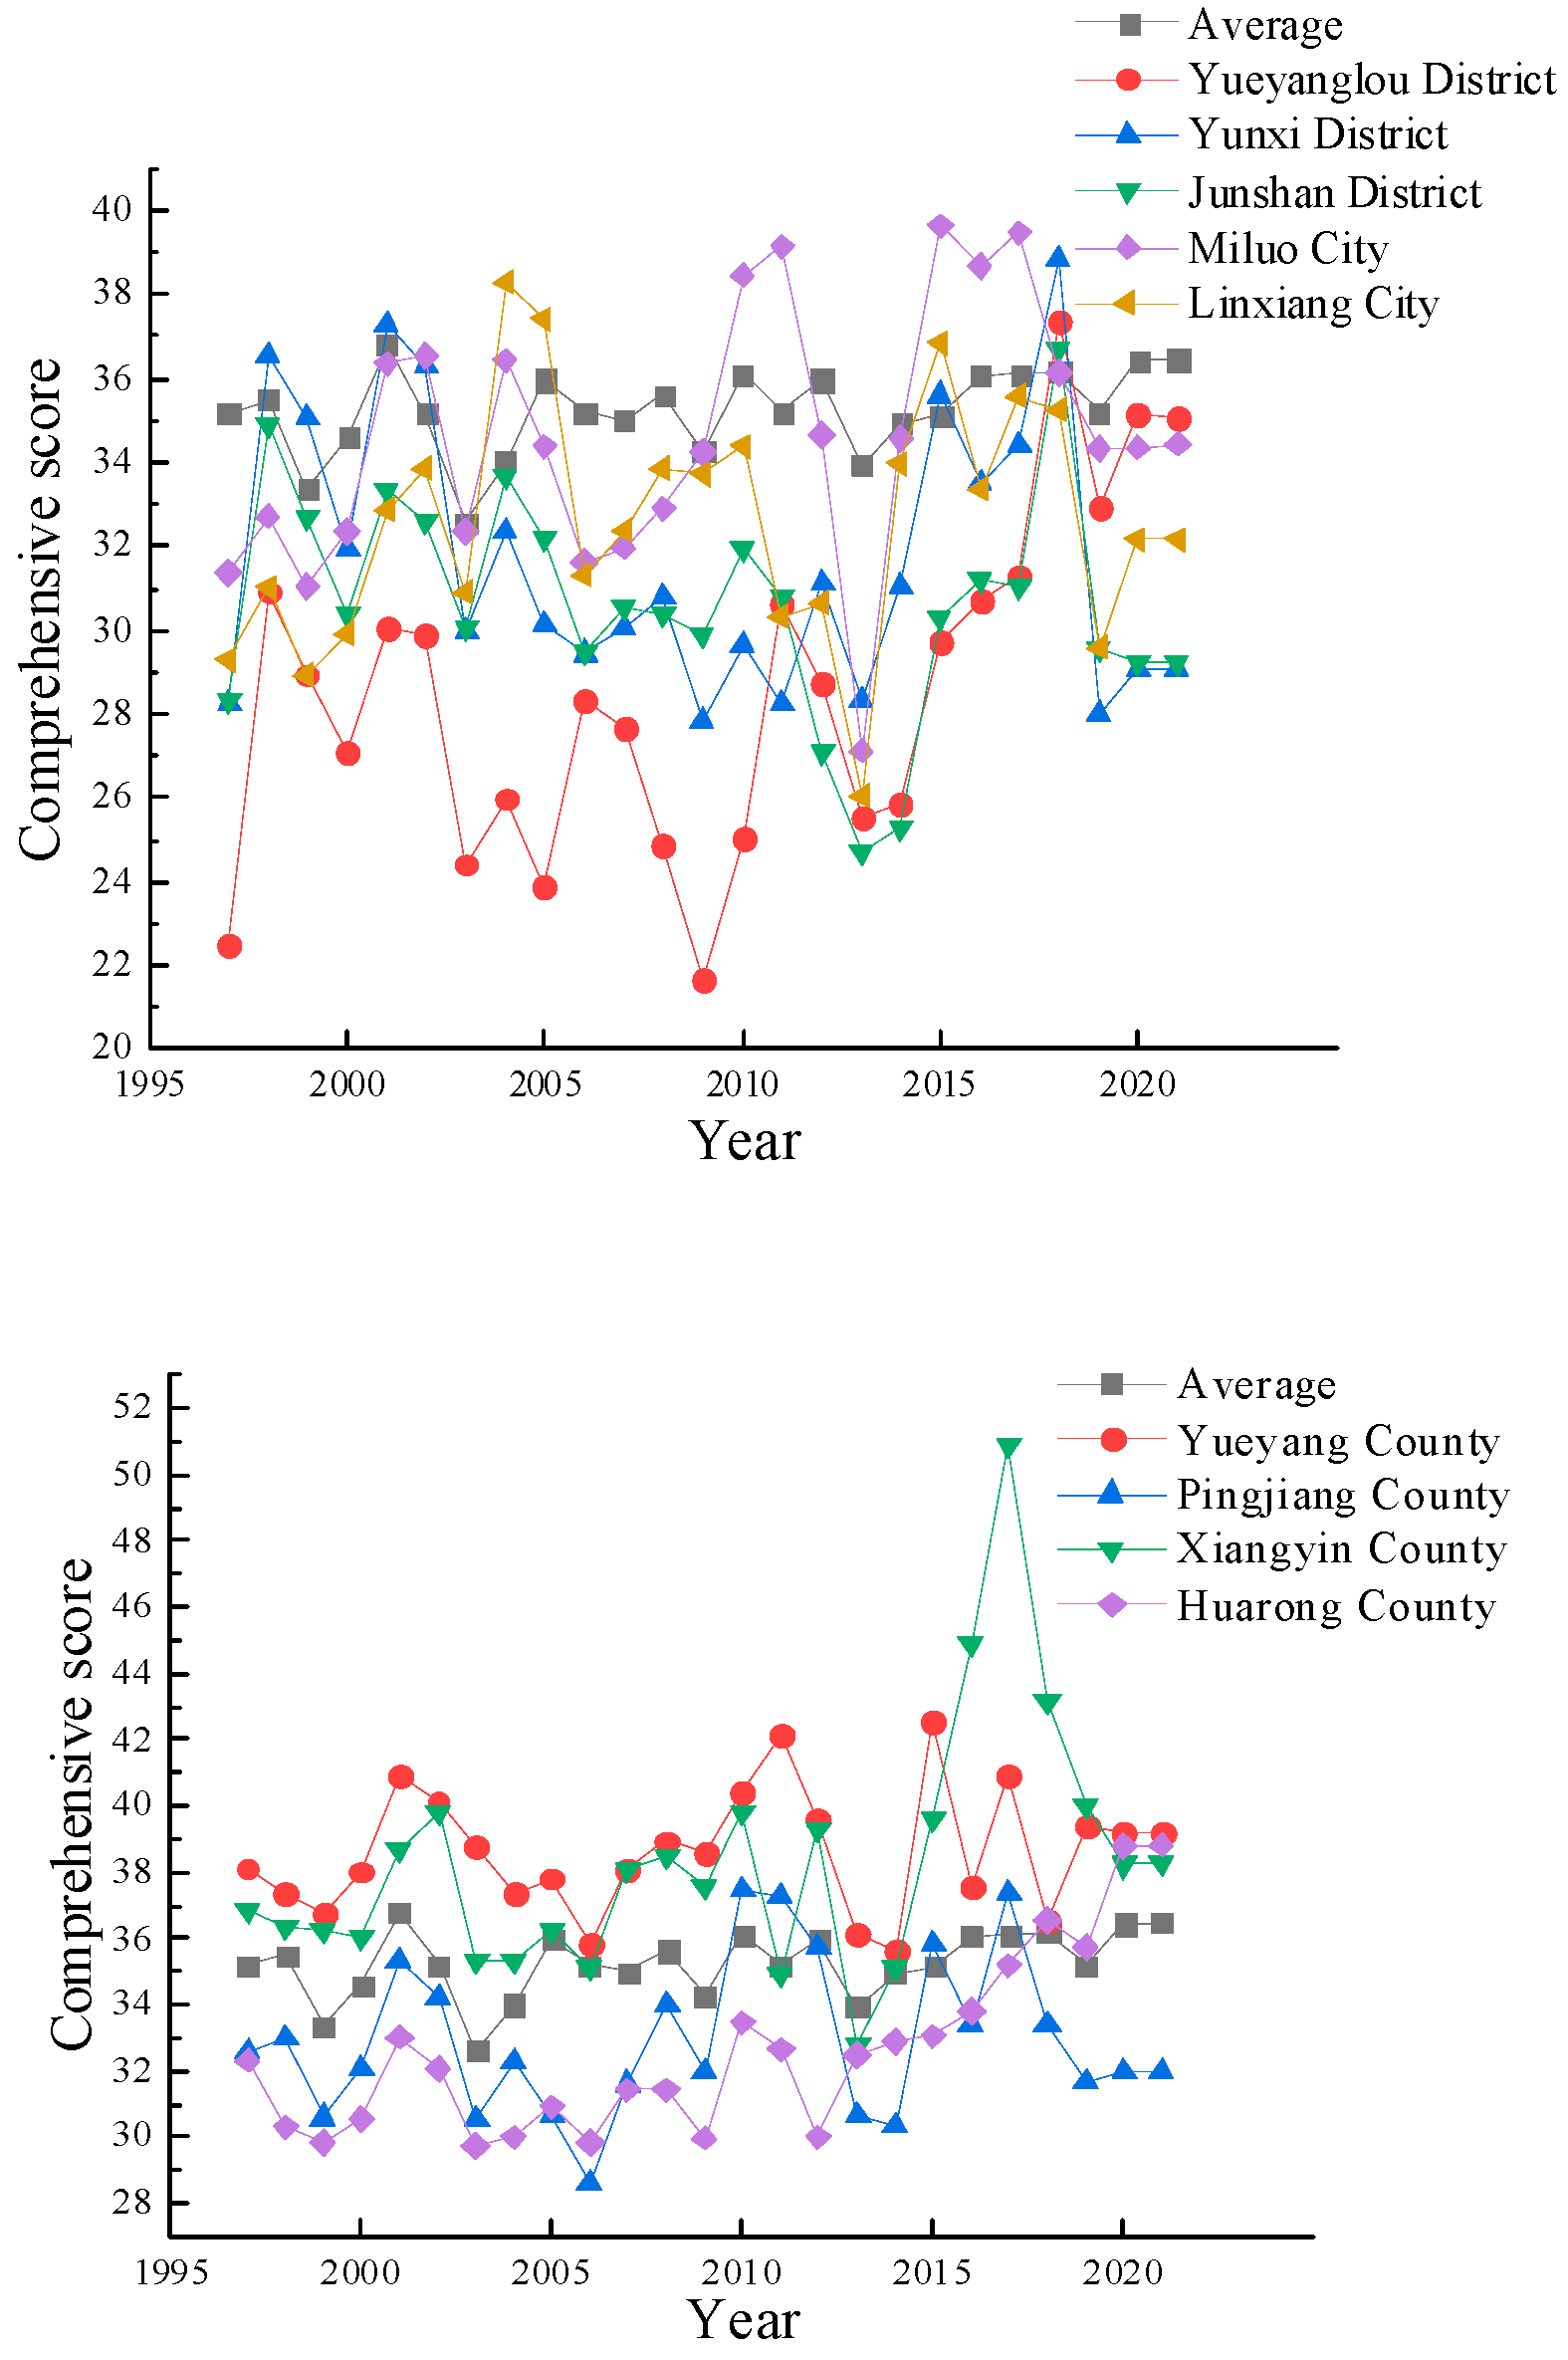
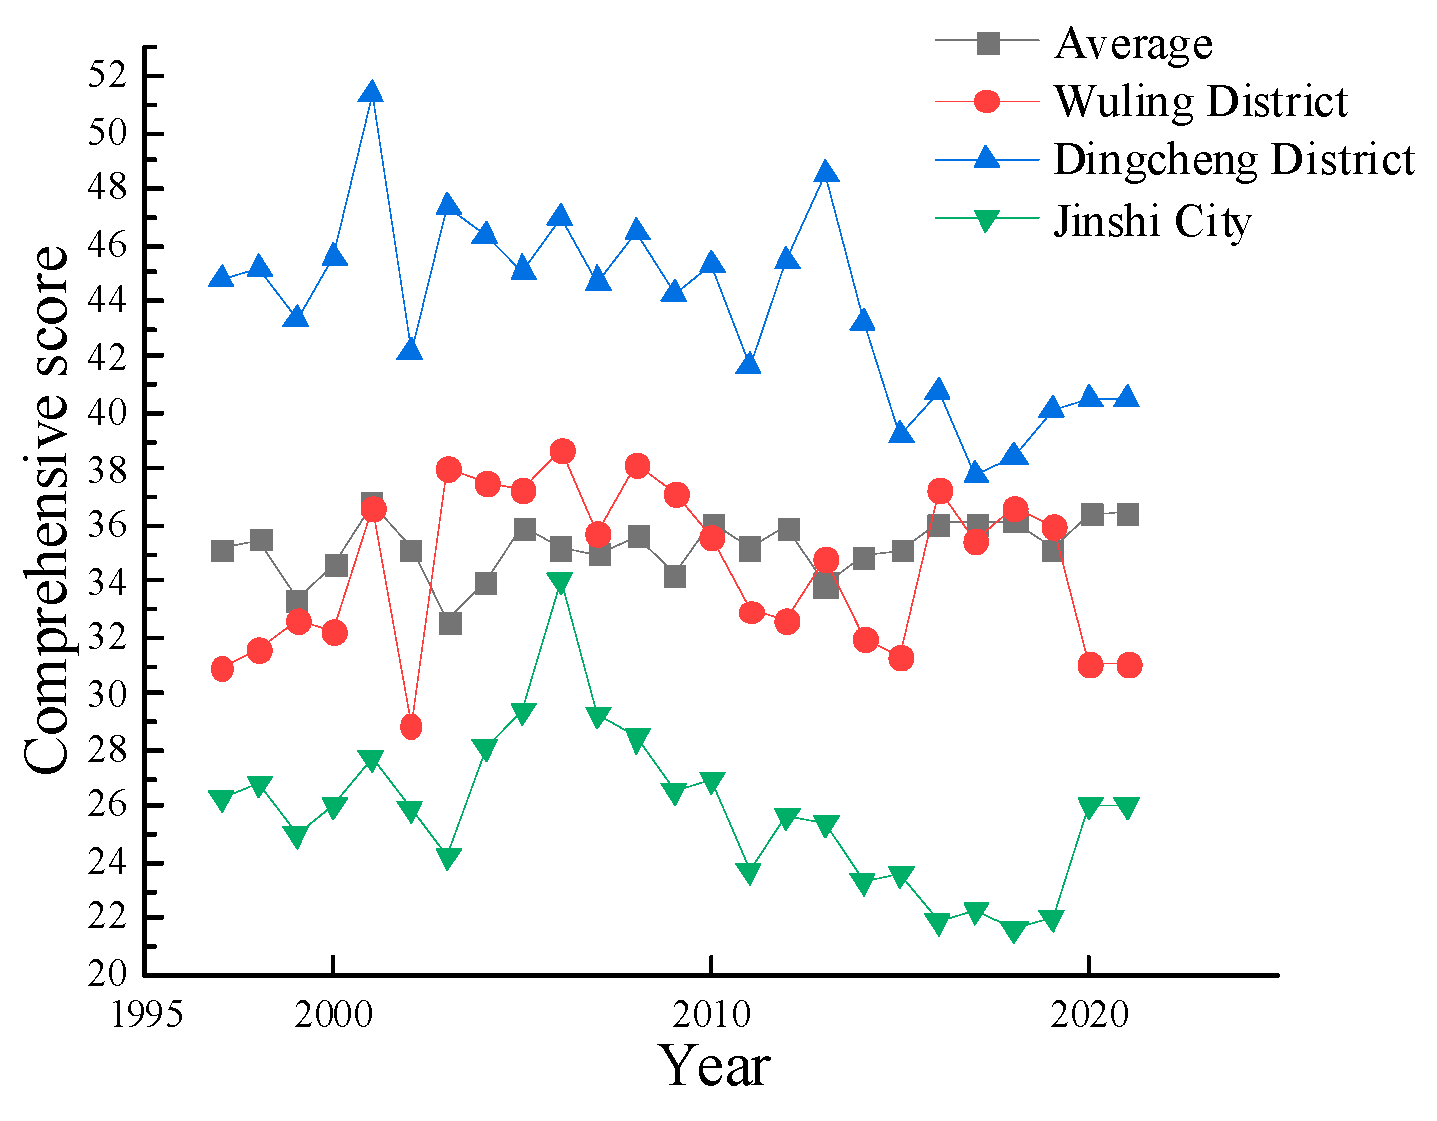
The water resources carrying capacity of each county is similar to the average value of the Dongting Lake area. The water resource carrying capacity of Yueyang County and Xiangyin County has been almost above average in the past 25 years. In the past 25 years, the changes in various aspects of the economy, society, resources, and environment are relatively balanced, and the relative change in water resources carrying capacity is not significant. Among them, the water resources carrying capacity of Huarong County has steadily increased (Figure 7). Overall, the carrying capacity of urban areas fluctuates greatly, with most of them lower than the average level of the Dongting Lake area. Due to the development of social and economic and the implementation of water environment protection measures, the carrying capacity of Yueyanglou District has steadily increased from the lowest to close to the average among this group.
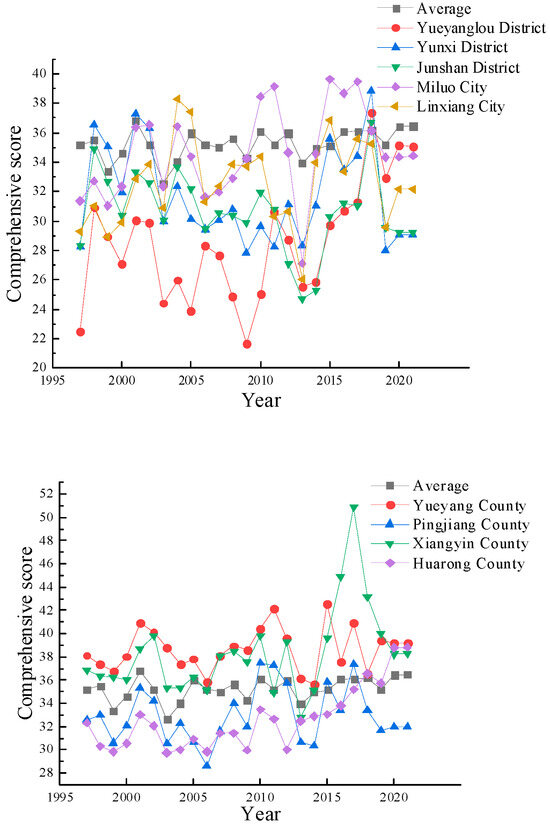
Figure 7.
Trend of water resources carrying capacity in Yueyang City (1997–2021).
5.1.2. Changde City
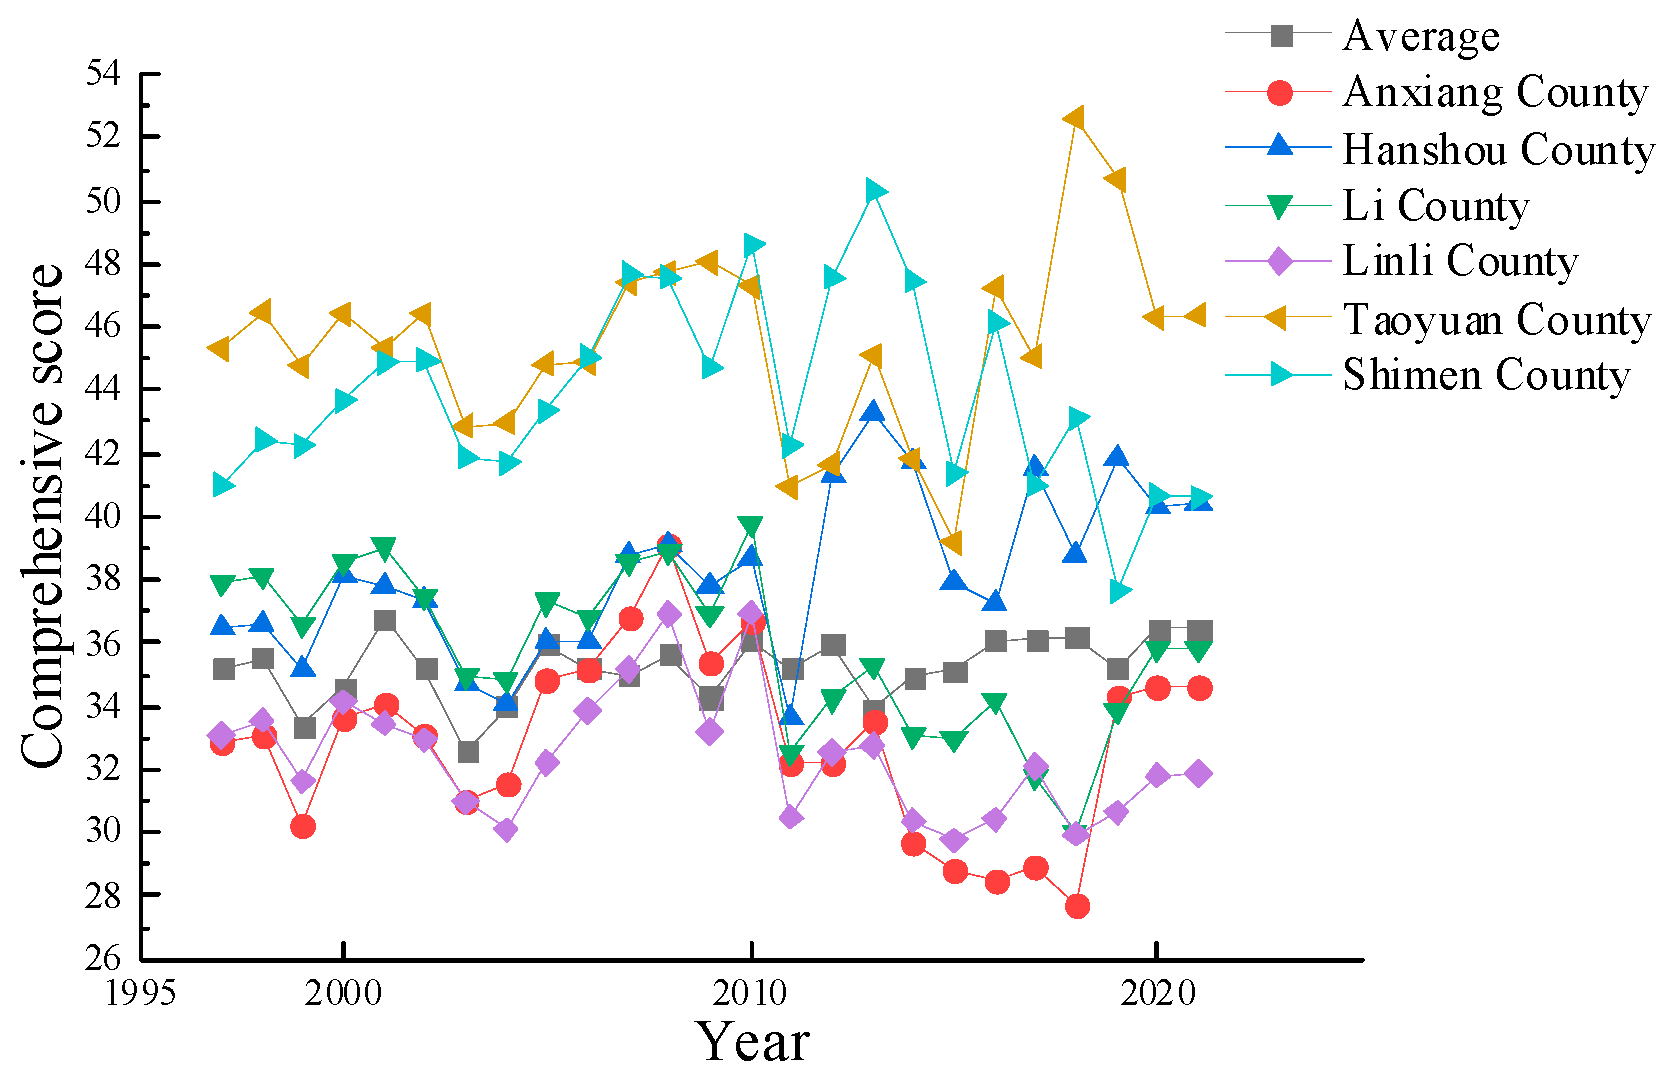
Among the 26 evaluation units in the Dongting Lake area, the water resources carrying capacity of the nine evaluation units in Changde City is at a medium level. The carrying capacity levels of Taoyuan County and Shimen County are significantly higher than the average level, and the carrying capacity levels of Anxiang County and Linli County are slightly lower than the average level (Figure 8).
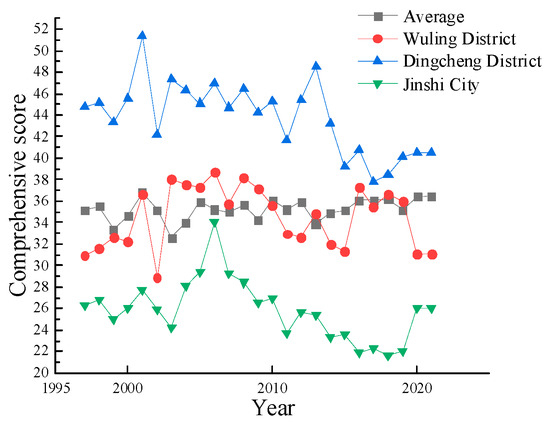

Figure 8.
Trend of water resources carrying capacity in Changde City (1997–2021).
5.1.3. Yiyang City
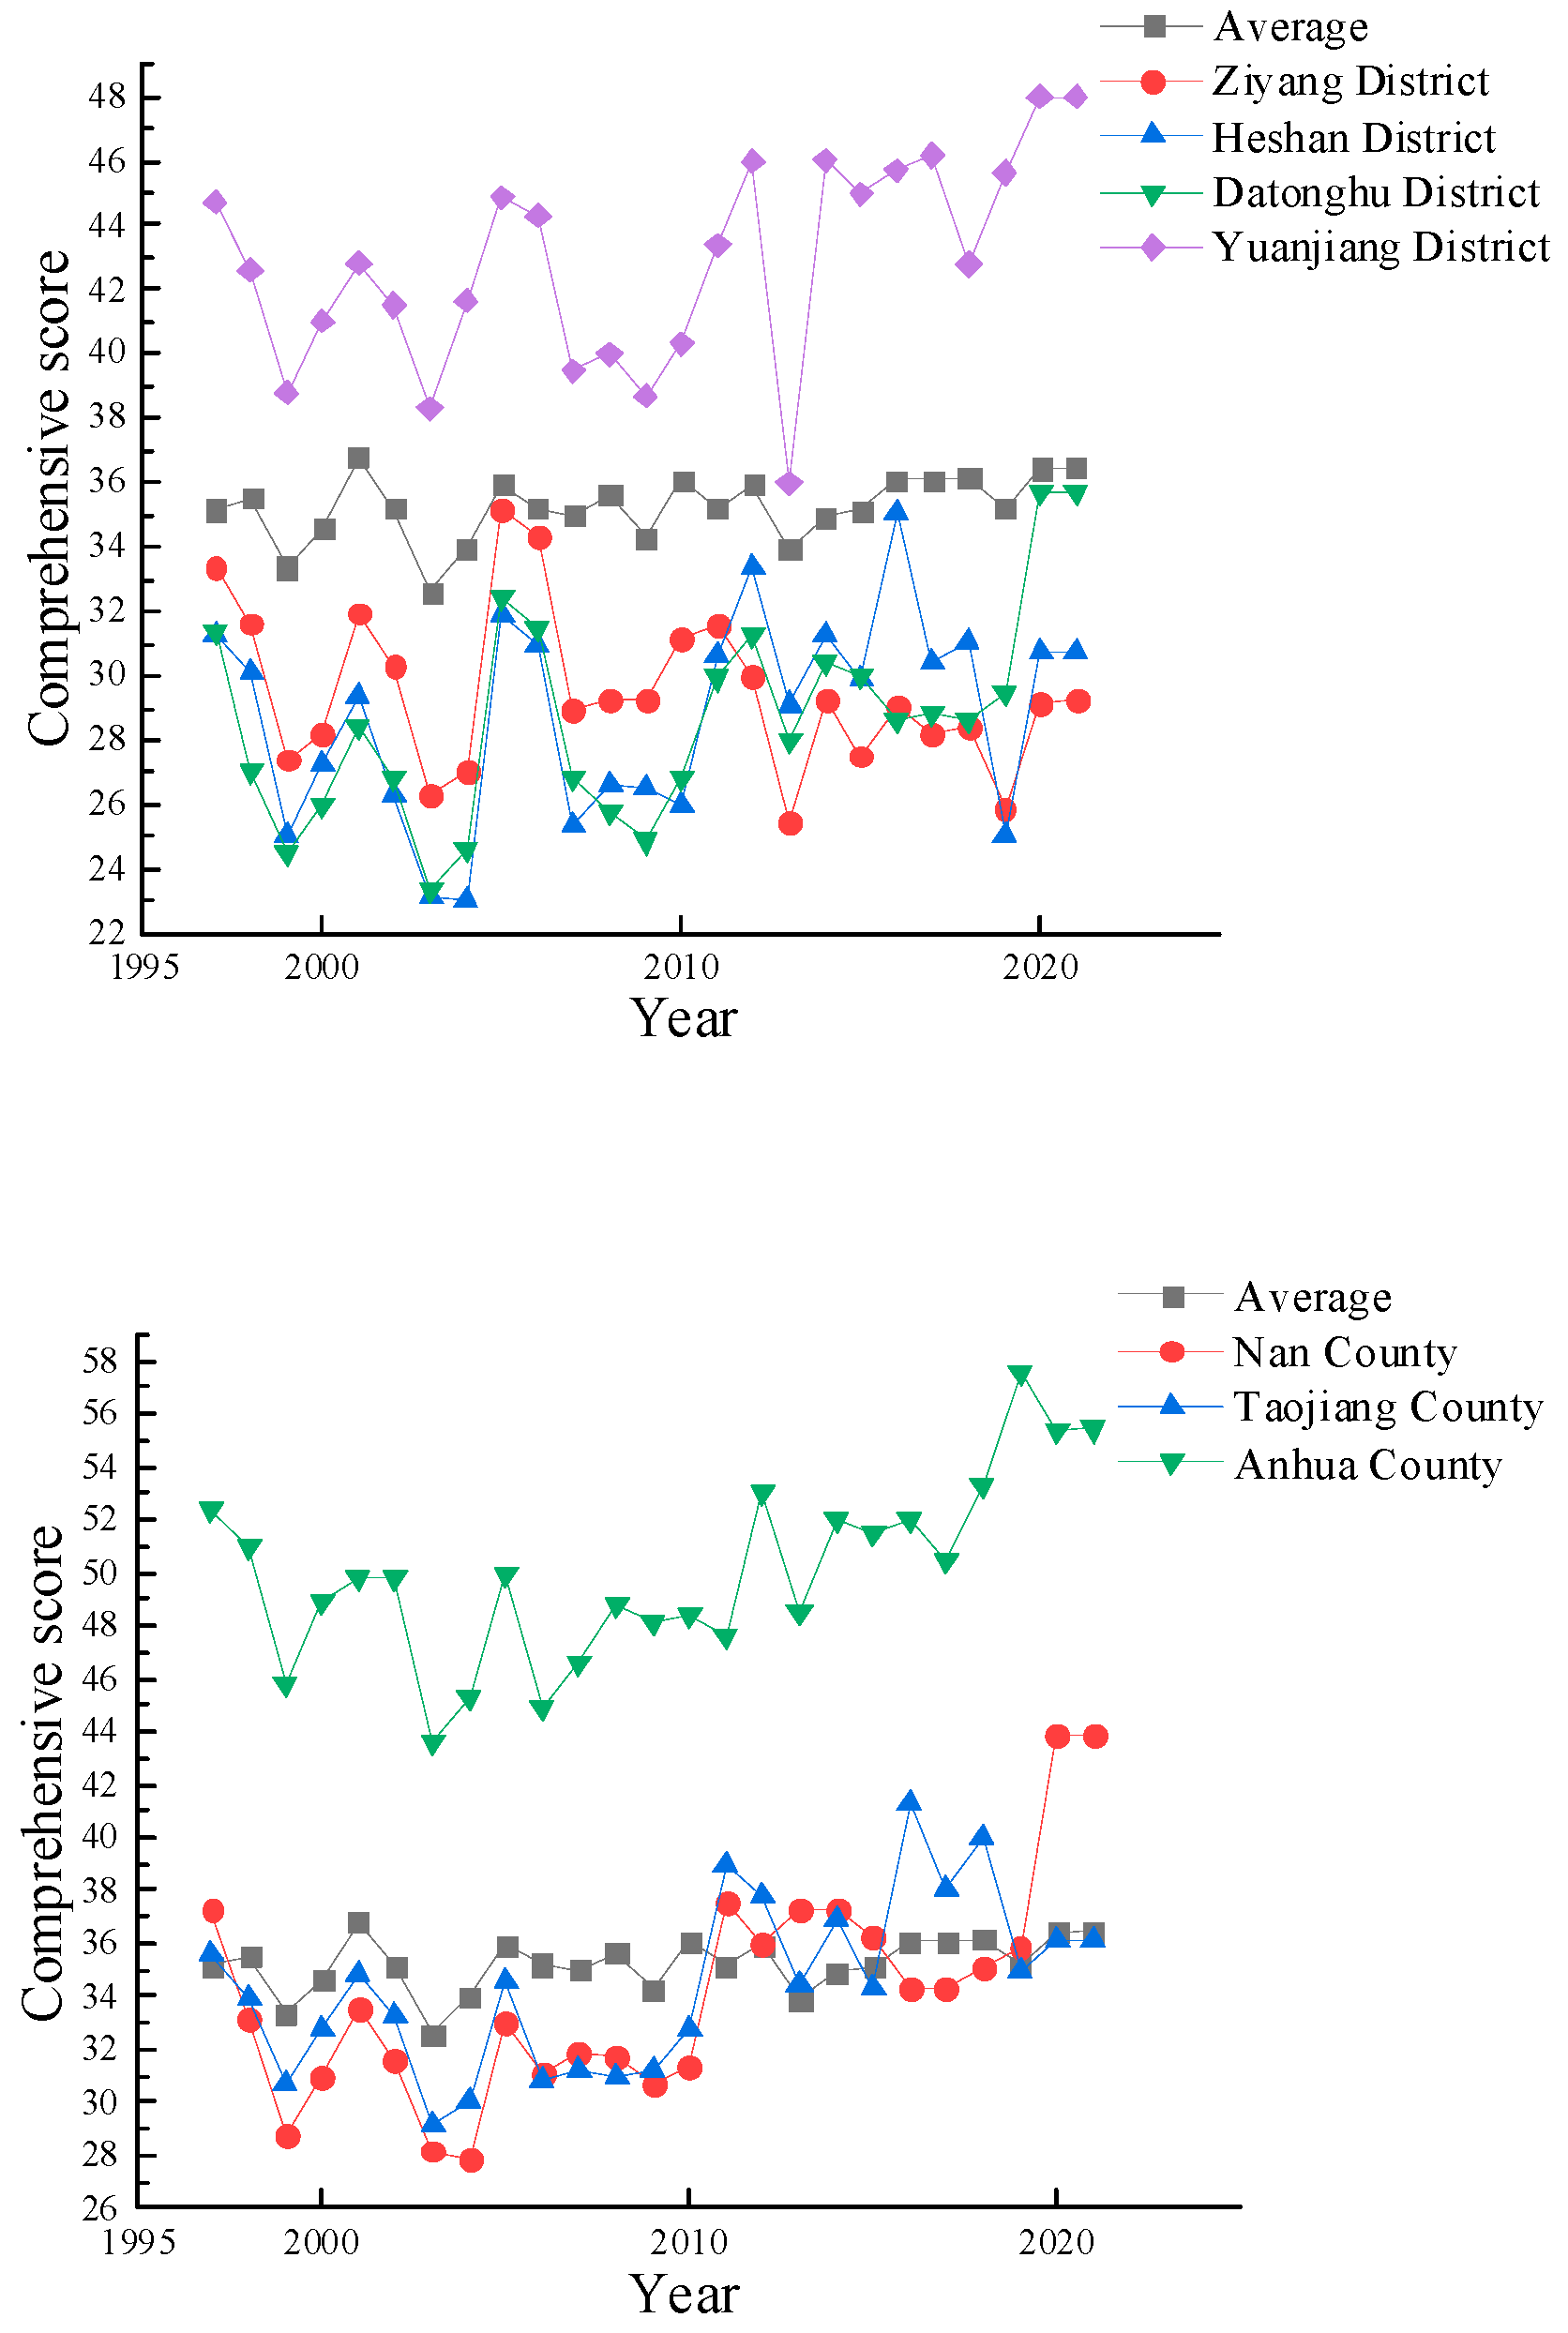
Among the seven evaluation units of Yiyang City, the water resources carrying capacity is all at the medium-high level among the 26 evaluation units in the Dongting Lake area. The carrying capacity of Anhua County is always at a high level. The carrying capacity of Nanxian County and Taojiang County is similar to the average level (Figure 9). The water resources carrying capacity of Yuanjiang city has been in good condition all year round, with the carrying capacity of water resources increasing in an oscillating manner. The water resources carrying capacity of Heshan District, Datong Dongting Lake Ecological Economic Zone, and Ziyang District is consistently lower than the average level throughout the year.
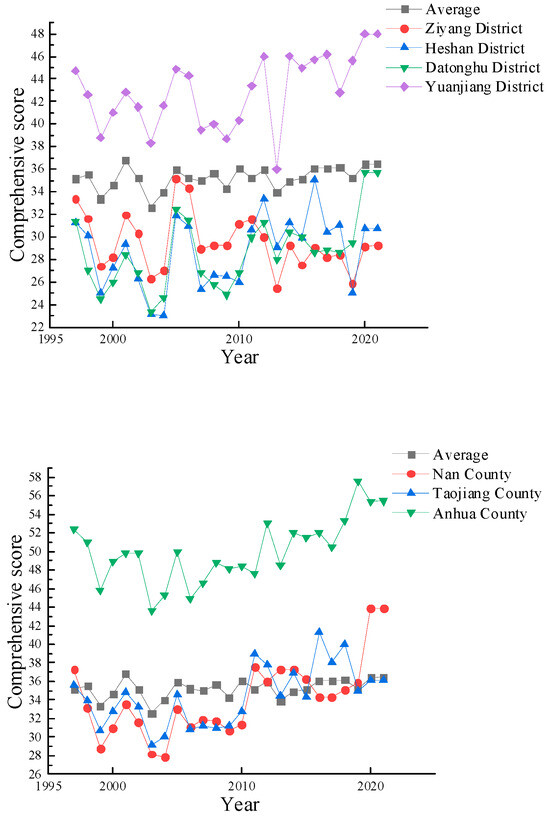
Figure 9.
Trend of water resources carrying capacity in Yiyang City (1997–2021).
5.1.4. Changsha (Wangcheng District)
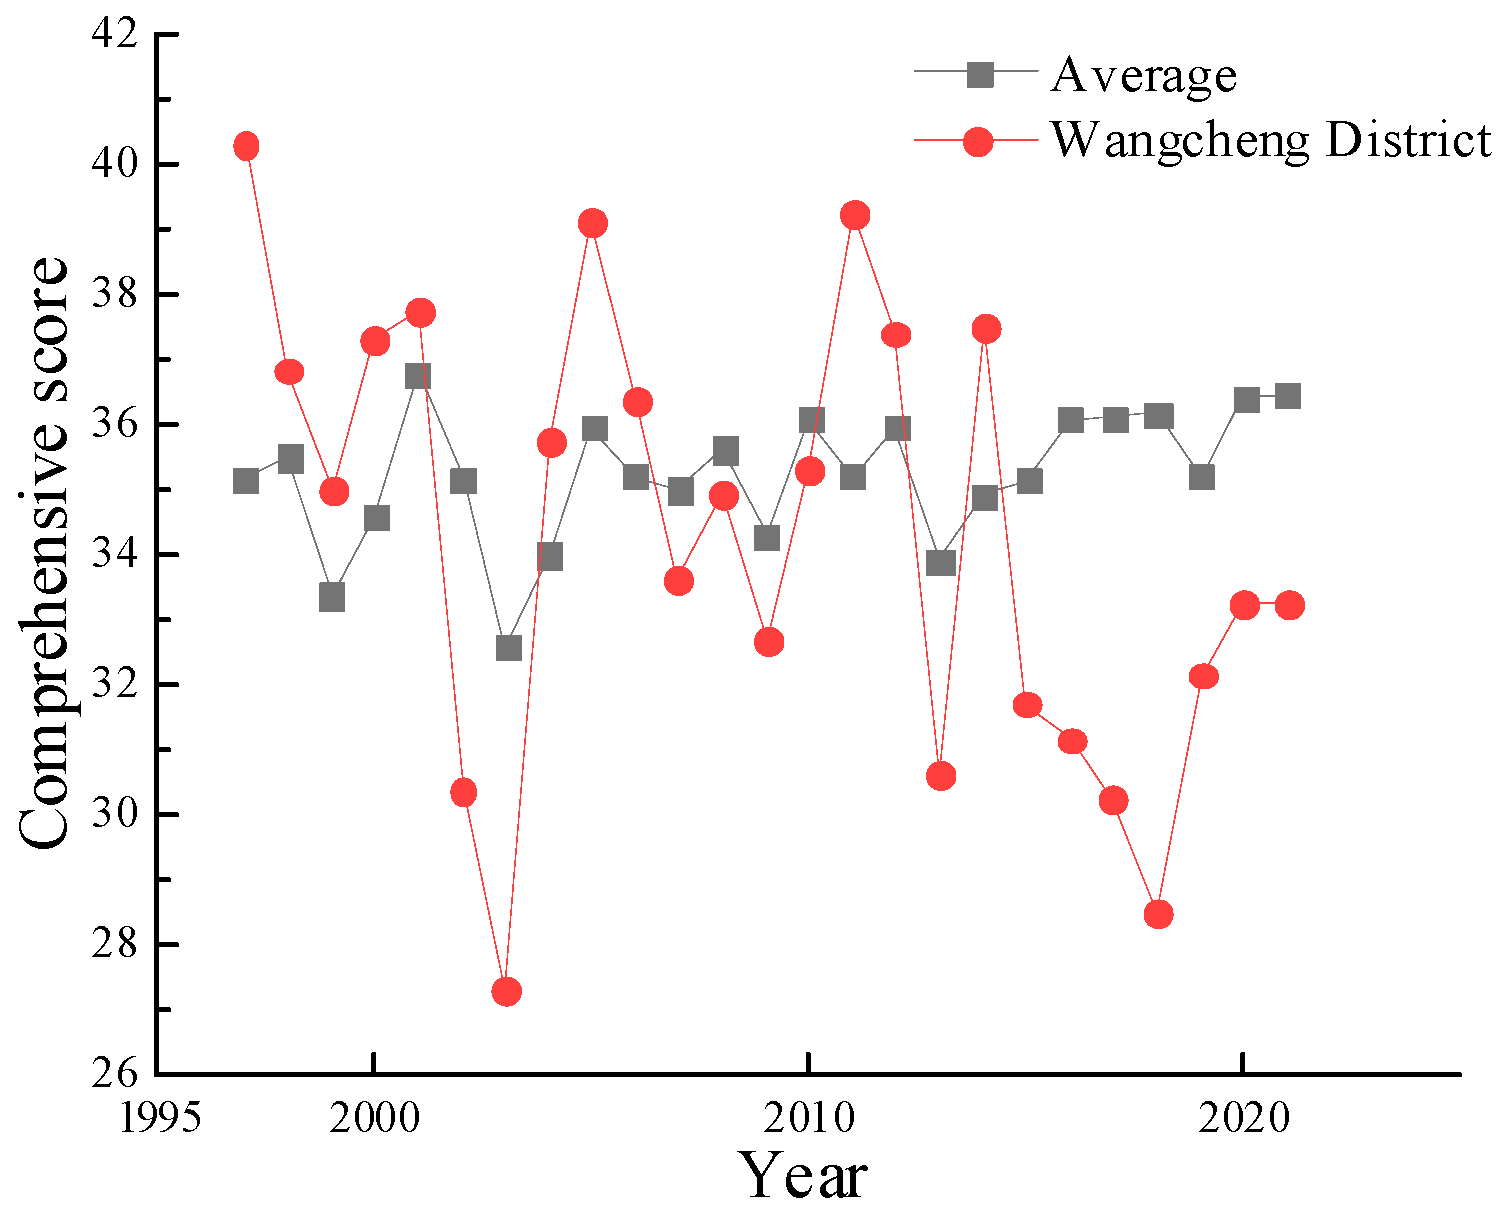
The water resources carrying capacity of the evaluation unit in Wangcheng District is at a medium level among the 26 evaluation units in the Dongting Lake area (Figure 10). In the early stage, the water resource carrying capacity of Wangcheng District fluctuated at an average level between 1997 and 2015. The water resource carrying capacity is higher than the average level in most years, but it has always been lower than the average value in the most recent 7 years. The reason for this is related to Wangcheng District being designated as the sixth district of Changsha City and the urban population and enterprises being transferred to Wangcheng District. This reason has led to high population density and increased water pressure, while the sewage treatment rate and water resource output rate have not significantly improved.

Figure 10.
Trend of water resources carrying capacity in Wangcheng District (1997–2021).
5.2. Spatial Evolution Analysis
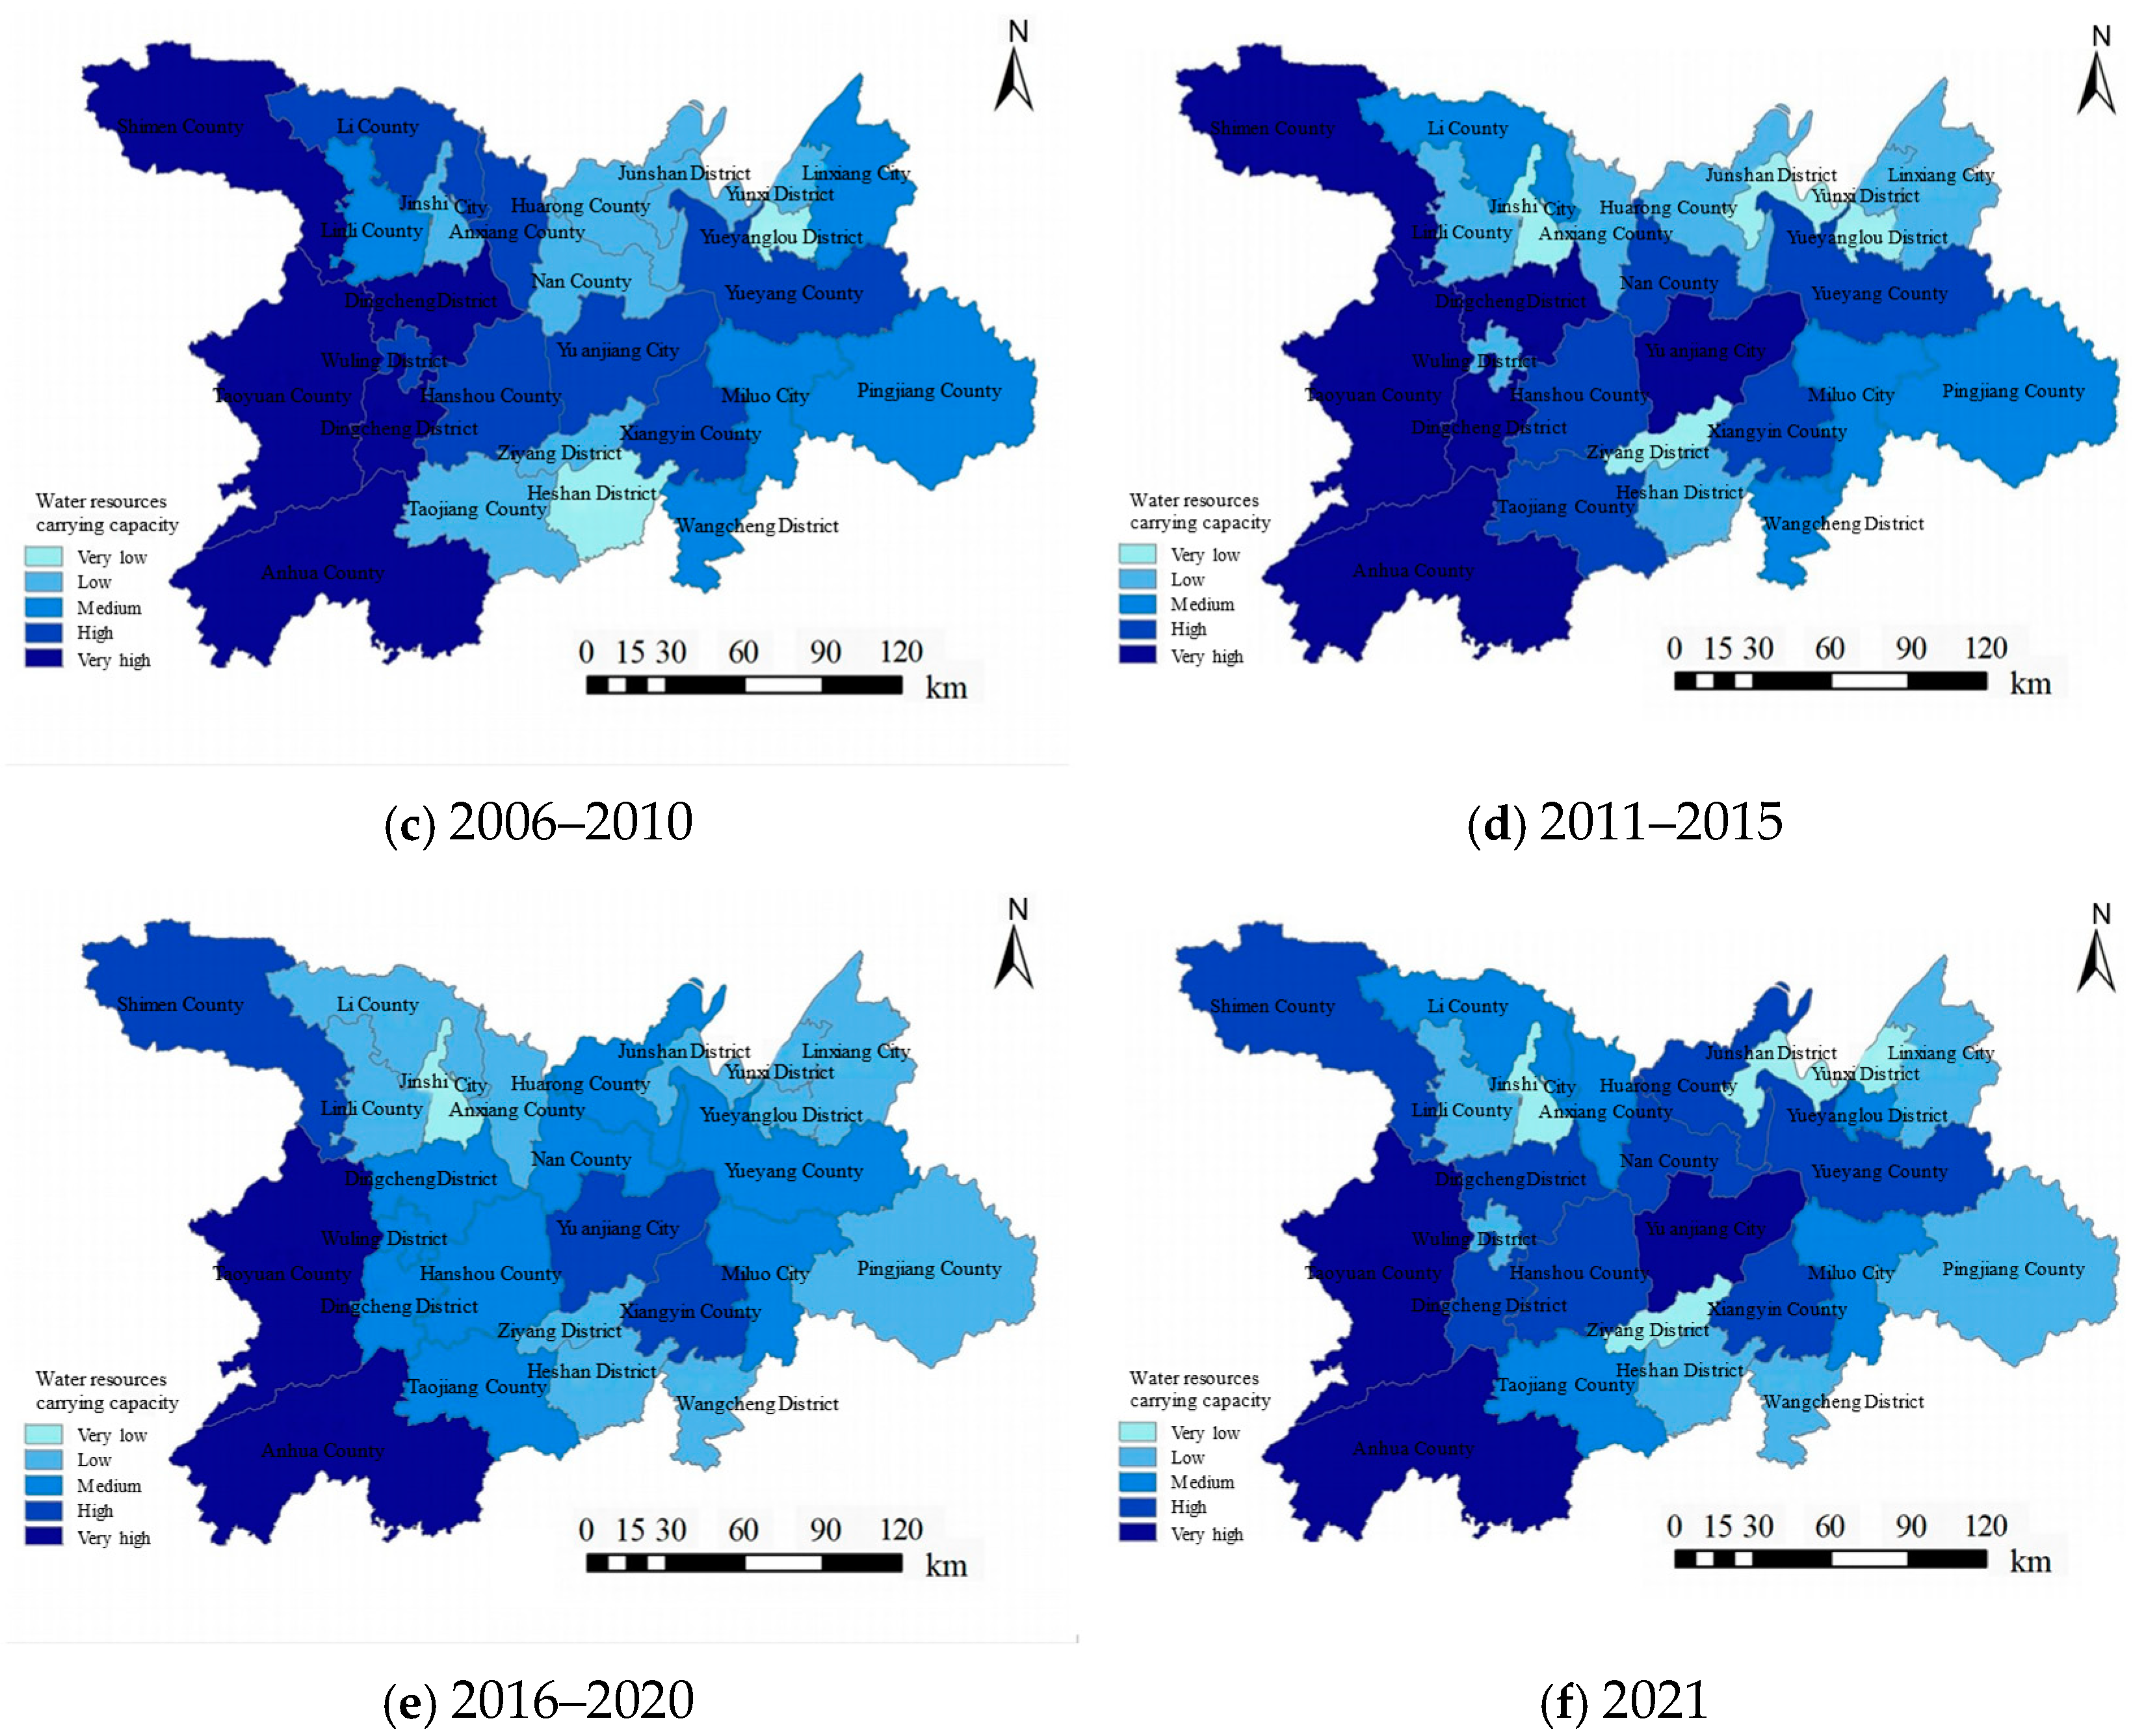
Import the comprehensive score value of water resources carrying capacity into ArcGIS10.6 software. Through the natural breakpoint method and interval grading method, the water resources carrying capacity score is divided into five levels: low, relatively low, medium, relatively high, and high, which is convenient for internal comparison and relative trend analysis. The research period is from the middle of the “Ninth Five-Year Plan” to the beginning of the “14th Five-Year Plan”. Six maps of the spatial evolution of the water resources carrying capacity of the Dongting Lake area were drawn using ArcGIS10.6 software in the Dongting Lake area with 1997–2000, 2001–2005, 2006–2010, 2011–2015, 2016–2020, and 2021 as time sections (Figure 11).
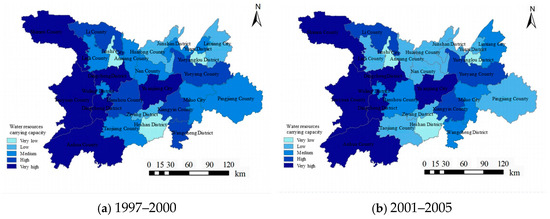

Figure 11.
Spatial distribution of water resources carrying capacity in Dongting Lake area (1997–2021).
The water resources carrying capacity of Dongting Lake area presents an overall pattern of “high in the west and low in the east, high in the middle and low in the north and south”, and the urban area is the area with the most frequent changes in water resources carrying capacity levels. From the “Ninth Five-Year Plan” to the “14th Five-Year Plan” period, it generally shows a relatively stable trend. During the “13th Five-Year Plan” period (2016–2020), the carrying capacity of counties and districts in the middle changes from weak to strong. The changes in water resources carrying capacity in other regions are relatively stable. Junshan District, Yunxi District, Ziyang District, and Jinshi City still need to coordinate the relationship between development and resources.
5.3. Analysis of Superior and Inferior Indicators
5.3.1. Evaluation of Superior and Inferior Indicators
Sort the indicators of each county. Among the 26 research areas, the top four are considered as the advantageous indicator table of this area and are marked in green. The last four are considered as the disadvantageous indicators of this area and are marked in yellow. The value is the contribution score of this indicator in this area to the comprehensive evaluation of water resources carrying capacity (Table 15). Since Wangcheng District is the only area in Changsha City, it is of little significance to compare with Yueyang, Changde, and Yiyang, so it is omitted.
Table 15.
Evaluation of the advantages and disadvantages of the water resources carrying capacity index of each district and county.
Indicators were ranked for each county, with the top four indicators from the 26 research areas being considered indicators of strength for that area and highlighted in green. Indicators ranked in the bottom four are considered to be indicators of weakness in the area and are marked in yellow. The value is the contribution score of the indicator in the comprehensive evaluation of the water resources carrying capacity of the area (Table 15). Since Wangcheng District is the only district belonging to Changsha City, the comparison with Yueyang, Changde, and Yiyang is not very meaningful, so it is omitted.
5.3.2. Comparison of Advantages and Disadvantages of Indicators of Each County
Based on Table 15, the obvious superior and inferior indicators of each county are screened out and compared, which can show the basic situation of various indicators of water resources carrying capacity in the Dongting Lake area as a whole (Table 16). The indicator letters represent the criterion layer; that is, A, B, C, and D are resources, economy, society, and environment, respectively. In terms of specific indicators, the counties have different strengths and weaknesses, reflecting the overall differences in the research area. Anhua County is the region with the highest resource-carrying capacity in the evaluation system. The performance in the four main aspects of society, economy, resources, and environment is relatively good, with particular strengths in water resources. Most of the indicators representing water resources are relatively excellent.
Table 16.
Summary of advantages and disadvantages of water resources carrying capacity index of each district and county.
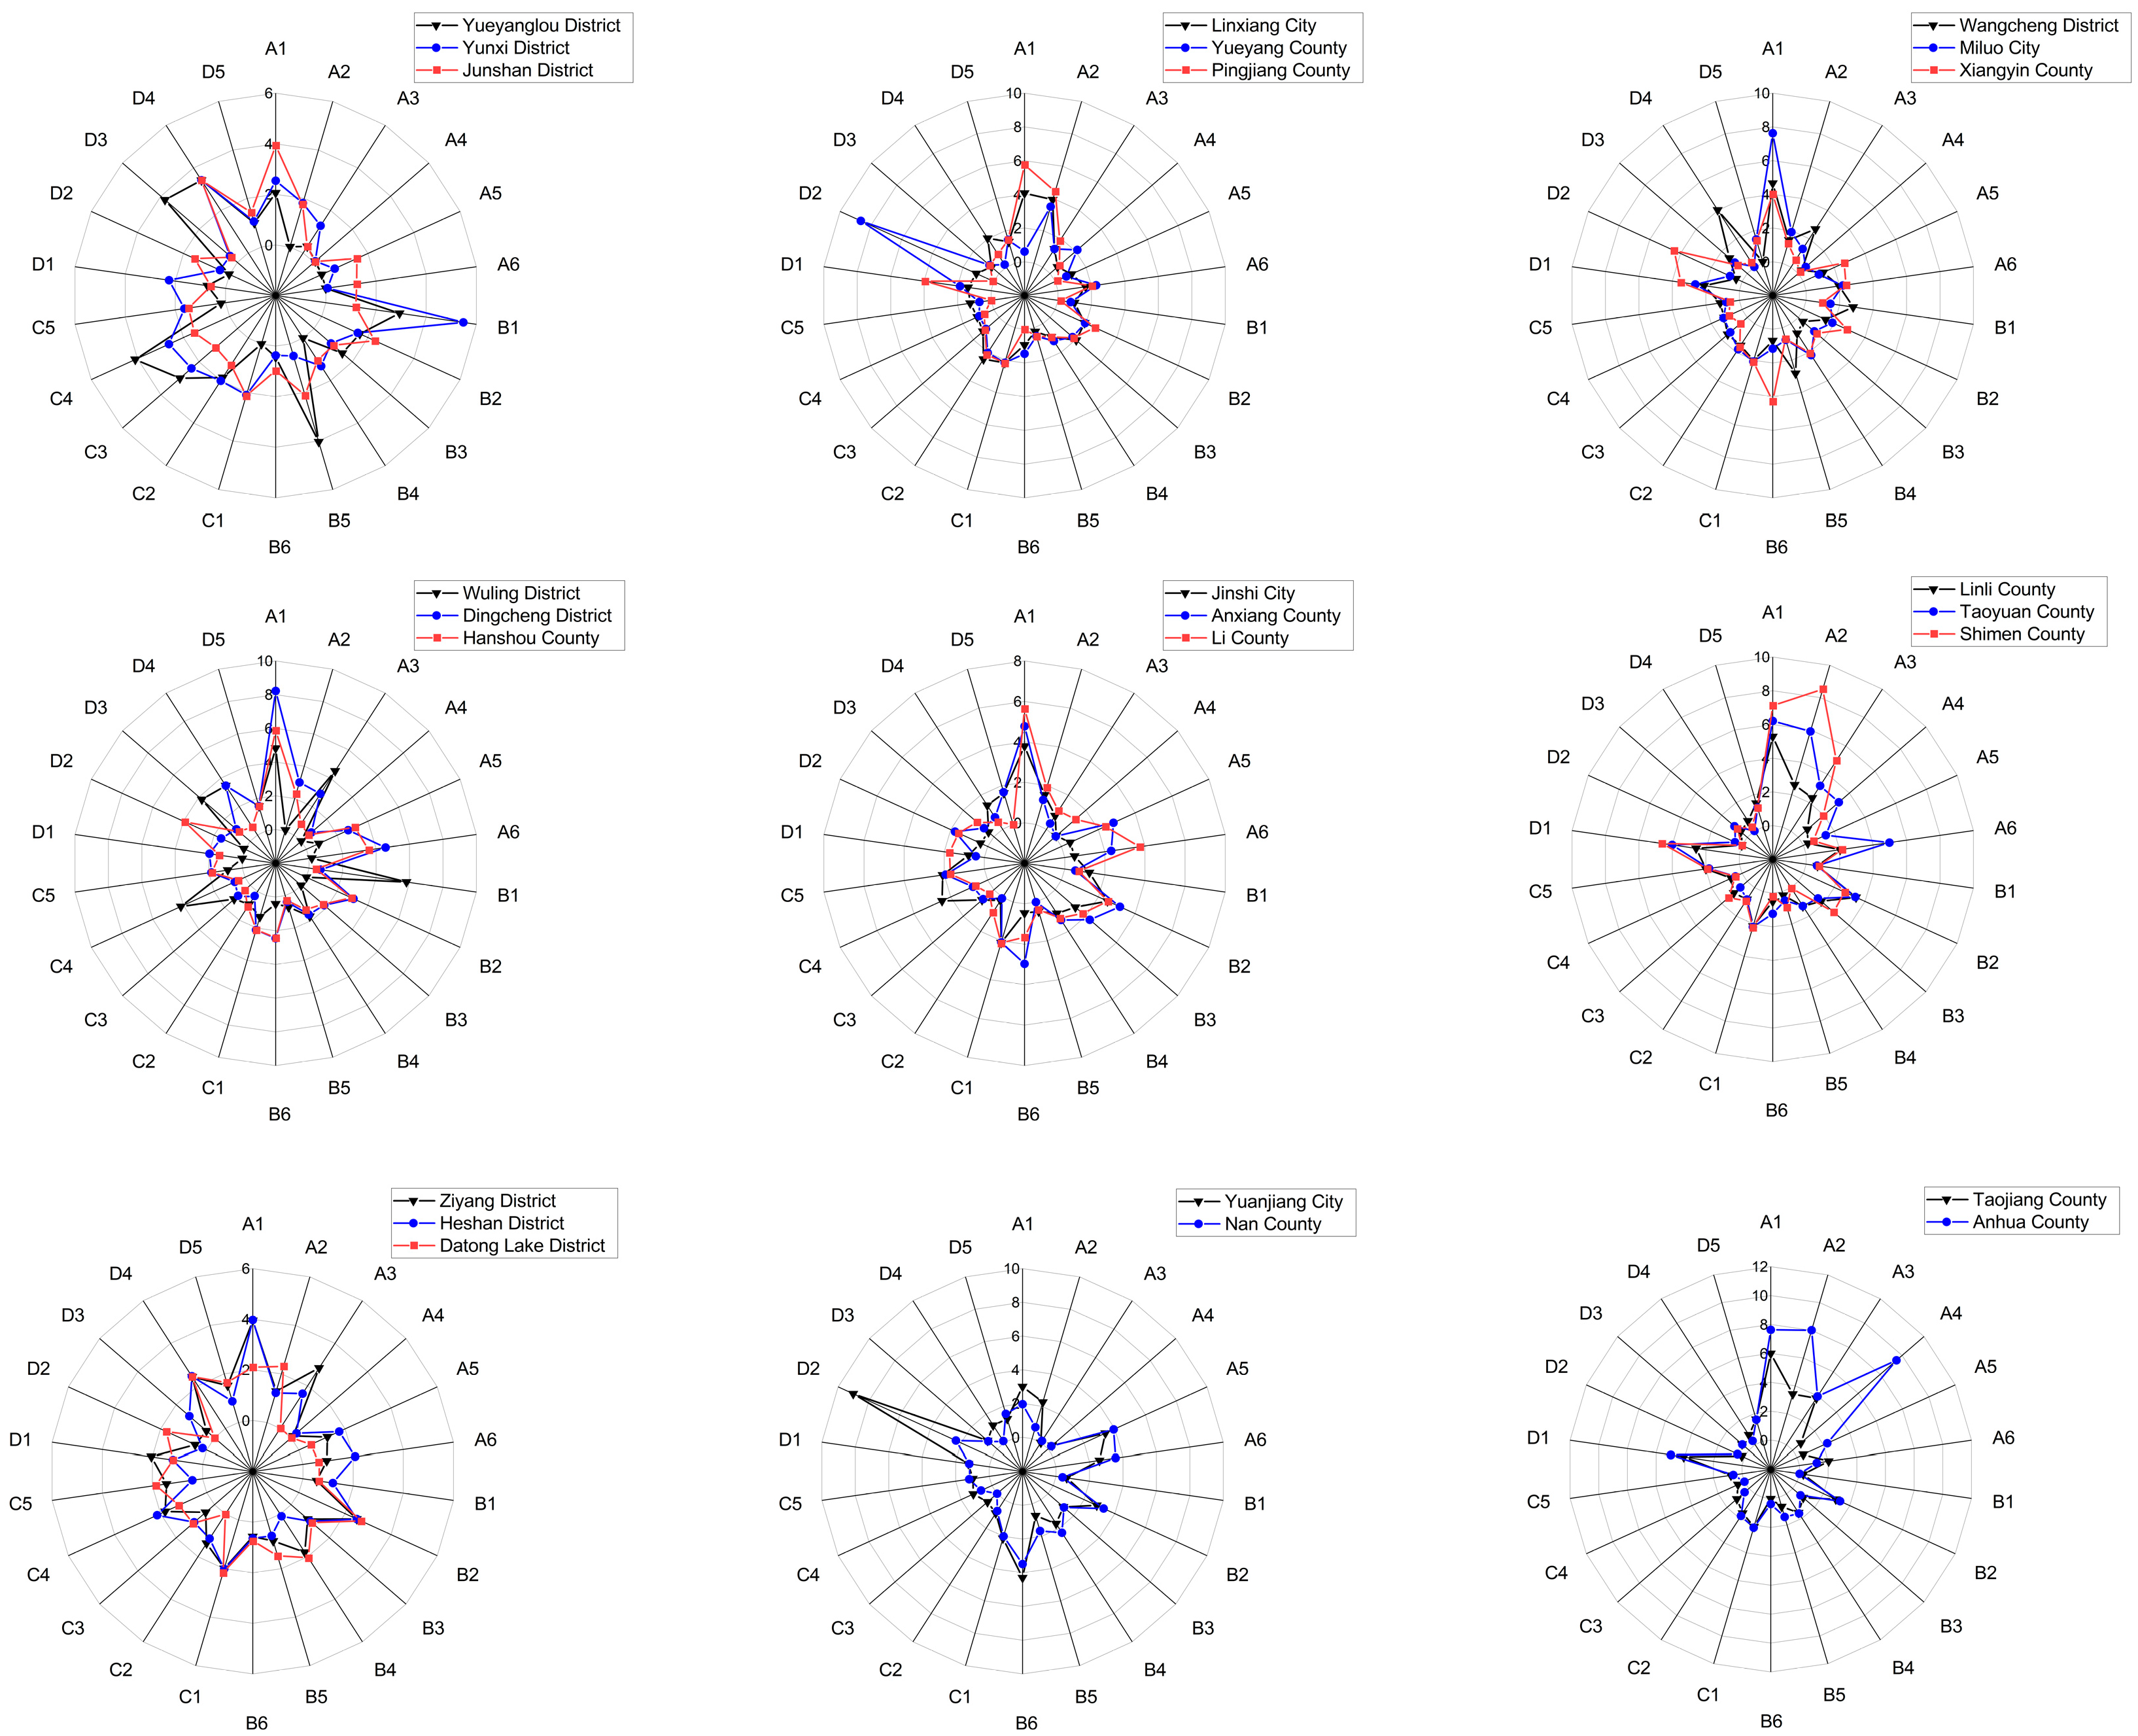
5.3.3. Indicator Radar Chart
The analysis of indicators of strengths and weaknesses describes the relationship between the indicators of a certain region and the average level. The radar chart comparison method is selected for the analysis of superior and inferior indicators. Based on the scores of 22 indicators, the radar chart of the water resources carrying capacity indicator system for the 26 districts and counties is derived. For the convenience of regional analysis and comparison, adjacent districts and counties of the same prefecture-level city are compared on one chart. The radar charts of the scores of the specific indicators for each region are shown in Figure 12.
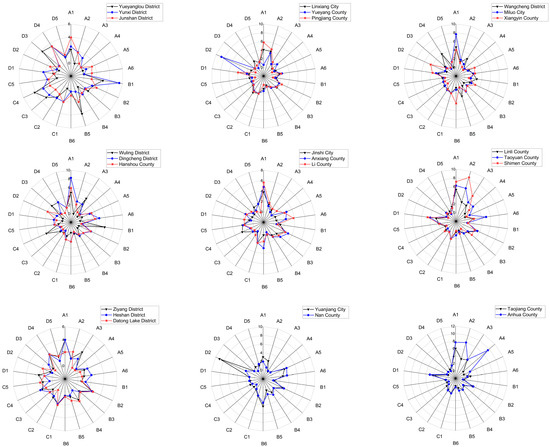
Figure 12.
Radar map for regional index evaluation.
5.4. Prediction of Water Resources Carrying Capacity
5.4.1. Verification of BP Neural Network Prediction Model
According to the DWM value of water resources carrying capacity, the time series method was combined with the BP neural network to simulate the samples. The BP neural network model fitted best with an R2 of at least 0.903 (Table 17). All other errors are within the acceptable range, and the regression prediction effect is good.
Table 17.
Comparison of BP neural network fitting errors of each county in the Dongting Lake area.
Confirming the feasibility of the BP network model using Mean Square Error, Root Mean Square Error, Root Mean Square Error, and R2.
MSE (Mean Square Error): The expected value of the square of the difference between the predicted value and the actual value. The smaller the value, the higher the accuracy of the model.
RMSE (Root Mean Square Error): The square root of MSE. The smaller the value, the higher the accuracy of the model.
MAE (Mean Absolute Error): The average value of absolute errors. The smaller the value, the higher the accuracy of the model.
R2: Comparing the predicted value with the mean value, the closer the result is to 1, the more accurate the model is. It can be concluded that when the delay order is 5, the R-square increases, and overfitting occurs. Verification is performed with the delay order of 4.
5.4.2. Prediction and Spatial Distribution of Water Resources Carrying Capacity
The water resources carrying capacity of the Dongting Lake area is in a critical state between the central and western regions. The region’s water resource carrying capacity is relatively favorable. In the prediction trend of the BP neural network, the western region, which originally had a high water resources carrying capacity, will continue to maintain a high carrying capacity. At the same time, the three counties around Yuanjiang City in the central region will change from overloaded to critical, and Dingcheng District will change from the original critical state of carrying capacity to overload (Figure 13 and Figure 14).
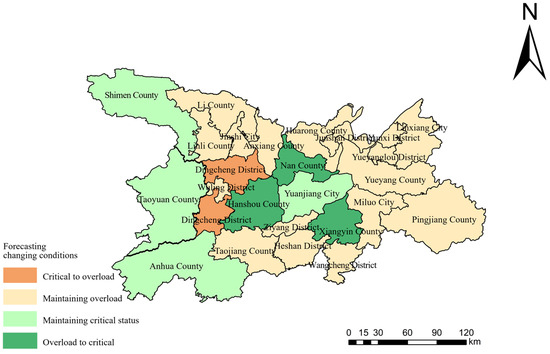
Figure 13.
Spatial distribution of water resources carrying capacity prediction.
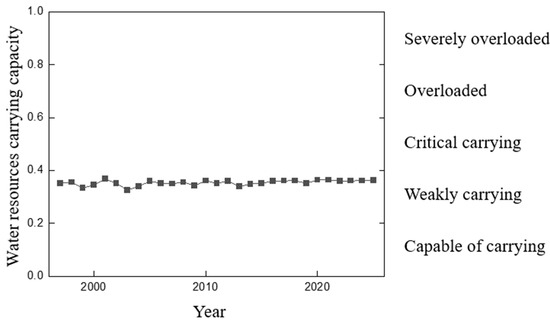
Figure 14.
Prediction of total water resources carrying capacity of the Dongting Lake area.
5.4.3. Early Warning of Water Resources Carrying Capacity
Referring to relevant literature on risk, early warning of water resources carrying capacity [82], and the division standards, the risk early warning levels of resource and environmental carrying capacity are divided into five levels (Table 13), and the early warning values of each region are calculated (Table 18).
Table 18.
Prediction results and risk intervals of BP neural network time series.
- (1)
- On the whole, the water resources carrying capacity of the Dongting Lake area fluctuates and then drops to a stable level, and the risk degree will still be in the state of “overloading”. From 2023 to 2025, the risk degree of water resources carrying capacity in the Dongting Lake area remains unchanged and slightly improves; that is, the predicted water resources carrying capacity of the research area increases. The evaluation value increases from the initial 0.3518 to the highest point of 0.3680 in 2001 and then gradually drops to the lowest point of 0.3429 in 2009. From 2010 to 2021, and in the prediction part, the carrying capacity is stable at about 0.362, which is slightly higher than the initial level. The overall risk is in an “overload” state. By 2025, its comprehensive evaluation value of water resources carrying capacity will slightly increase to 0.363, and the risk will be slightly improved. But there is no substantial change in the risk, and it will continue to be in an “overload” condition, with the signal light remaining an “orange light”;
- (2)
- The time series prediction scheme of the BP neural network toolbox in MATLAB (R2022a) is used in the prediction part. After testing, it is concluded that the prediction model is more accurate for the 4-year results. Therefore, the prediction results continued until 2025. From 1997 to 2025, the risk level of resource and environmental carrying capacity of most districts and counties in the Dongting Lake area will remain unchanged; the water resources carrying capacity of Xiangyin County, Hanshou County, and Nanxian County will recover from overload to critical during 2015–2020; and for Dingcheng district, which is in the critical range, it is predicted that its carrying capacity in the future will change from critical to overload.
6. Discussion
On the basis of the above assessments and projections, the following aspects remain to be discussed:
- (1)
- Natural growth rate refers to the ratio of the natural population growth within a unit of time in a year to the average total number of people in a year, usually expressed in per thousand. It is a comprehensive indicator used to explain the level and speed of natural population growth. Existing achievements define the natural population growth rate as a “negative indicator”. However, with the reality that, at least in China, the birth rate and the number of new births are significantly declining, this study takes the birth rate as a “positive indicator”;
- (2)
- Urbanization rate (also called urbanization ratio) is a measurement indicator of urbanization. Generally, demographic indicators are used, that is, the proportion of the urban population to the total population. C4 (urbanization rate) is a disadvantageous indicator. In terms of the social level of the Dongting Lake area, urbanization is a positive indicator for the evaluation of water resources carrying capacity, but it is a disadvantageous indicator in the three regions with the highest comprehensive carrying capacity. This shows that accelerating the urbanization rate to improve the water resources carrying capacity is not the optimal solution in the Dongting Lake area. This is consistent with the policy direction of implementing the rural revitalization strategy and developing industries according to local conditions;
- (3)
- The county-level unit is the most basic unit of China’s administrative division. It is the only administrative division setting unit that has never been changed since China had administrative units in history, which fully shows the importance of counties in China’s administrative management. This study evaluates and predicts the water resources carrying capacity based on 26 county-level units in the Dongting Lake Ecological Economic Zone. At present, no relevant literature and research results have been released. The entropy weight method is used to determine the objective weight, which is determined by the information entropy of each index data between county-level units. Therefore, compared with city-level units (such as Yueyang, Changde, and Yiyang cities), county-level units are more accurate in evaluation. At the same time, county-level units can better find specific plans and ways to improve water resources carrying capacity;
- (4)
- Weight determination is the most important factor affecting the evaluation results. Selecting a subjective and objective combination method for weighting has a certain rationality for the study of each unit in the research area. Most literatures generally use a single method. In this study, in line with the improvement of research goals and indicators, DWM is used to determine index weights, and the conclusion is more representative.
7. Conclusions
- (1)
- The water resource carrying capacity of the Dongting Lake area is stable and will remain stable for a long time in the future. The increase in water resource carrying capacity in various regions was mainly concentrated from 2015 to 2020, and the decline was mainly concentrated from 2000 to 2010, which is related to national policies to a certain extent;
- (2)
- The water resources carrying capacity is relatively high in the western and southern regions of the Dongting Lake area, while that in the eastern part is relatively low. The areas with the highest water resources carrying capacity are Anhua County, Shimen County, and Taoyuan County. The areas with the weakest carrying capacity are Jinshi City, Yueyanglou District, and Datonghu District;
- (3)
- In the comparison of county-level units, the water resources carrying capacity is significantly different. The numerical range is [0.217, 0.575]. The lowest carrying capacity value was Yueyanglou District in 2009, and the maximum value was Anhua County in 2019. In terms of the rate of change, Yueyanglou District has the largest increase in water resources carrying capacity, with an increase of 47.53%. Wangcheng District has the largest decline. During the evaluation period, it decreases by 22.03%;
- (4)
- Based on the regression analysis and prediction of the BP neural network, the water resources carrying capacity of the Dongting Lake area is generally in an overloaded state and inclined to a critical state. The overall trend is fluctuating down and then slightly up. The areas with higher water resources carrying capacity in the western part of Dongting Lake will continue to be maintained. The counties around Yuanjiang City and in the central part of the lake will change from overloaded to critical, and Dingcheng District will change from the original critical state to overload;
- (5)
- According to the calculation results of the comprehensive subjective and objective evaluation method, combined with the above analysis chart, coordinated efforts in multiple aspects are still required to improve the water resources carrying capacity of each county and district in the Dongting Lake area. The specific measures are as follows: The key to enhancing the carrying capacity of regional water resources lies in establishing the Dongting Lake big data platform to achieve resource coordination and information sharing. Through the transformation towards a green economy, support ecological agriculture and industrial clusters to promote employment among farmers and invigorate the county economy. Meanwhile, integrating into the Yangtze River Economic Belt, innovating governance models, promoting environmental marketization reforms, attracting social capital participation, and jointly enhancing the sustainable carrying capacity of water resources.
Author Contributions
All authors contributed to the study’s conception and design. Material preparation, data collection, and analysis were performed by Z.F., X.D., Y.G., X.F., J.H., X.Z., M.L., Y.C. and Y.F. Writing and revision of the manuscript by Z.F., X.D., X.F., Y.F. and X.H. All authors have read and agreed to the published version of the manuscript.
Funding
This work was financially supported by the “Technology and practice of ‘three-dimensional’ collaborative governance of rural ecological environment” (Grant number KDKJ2024WTKF01) and “Research on resource utilization technology of river and lake sediment in mine ecological restoration”(Grant number KDKJ2023KFJJA03).
Data Availability Statement
All important data for this manuscript are presented in the paper. If you have any questions, please contact the corresponding author.
Conflicts of Interest
The authors declare that they have no known competing financial interests or personal relationships that could have influenced the work reported in this paper.
References
- Luo, Y.; Su, R. Environmental Impact of Waste Treatment and Synchronous Hydrogen Production: Based on Life Cycle Assessment Method. Toxics 2024, 12, 652. [Google Scholar] [CrossRef] [PubMed]
- Li, J. Global water shortage and food crisis. Ecol. Econ. 2021, 37, 5–8. [Google Scholar]
- Feng, Z.; Yang, Y.; Yan, H.; Pan, T.; Li, P. Research on resource and environmental carrying capacity in the past century: From theory to practice. Resour. Sci. 2017, 39, 379–395. [Google Scholar]
- Maltus, T.R. An Essay on the Principle of Population; Pickering & Chatto Publishers: London, UK, 1798. [Google Scholar]
- Falkenmark, M.; Lundqvst, J. Towards water security: Political determination and human adaptation crucial. Nat. Resour. Forum 1998, 21, 37–51. [Google Scholar] [CrossRef]
- Milano, M.; Ruelland, D.; Dezetter, A.; Fabre, J.; Ardoin-Bardin, S.; Servat, E. Modeling the current and future capacity of water resources to meet water demands in the Ebro basin. J. Hydrol. 2013, 500, 114–126. [Google Scholar] [CrossRef]
- Hui, Y.; Jiang, X.; Huang, Q.; Xue, X. Research on evaluation index system of water resources carrying capacity. Bull. Soil Water Conserv. 2001, 21, 30–34. [Google Scholar]
- Xu, Y. Comprehensive evaluation research on water resources carrying capacity in arid areas—Taking the Hotan River Basin in Xinjiang as an example. J. Nat. Resour. 1993, 8, 229–237. [Google Scholar]
- Xia, J.; Zhu, Y. Measurement of water resources security: Research and challenges of water resources carrying capacity. J. Nat. Resour. 2002, 17, 262–269. [Google Scholar]
- Hui, Y.; Jiang, X.; Huang, Q.; Xue, X. Research on dynamic simulation model of water resources carrying capacity system under binary mode. Geogr. Res. 2001, 20, 191–198. [Google Scholar]
- Li, L.; Fu, Q. Research on urban water resources carrying capacity by partial least squares regression model. Adv. Water Sci. 2005, 16, 822–825. [Google Scholar]
- Zhao, N. Empirical research on water resources carrying capacity and pressure status in Beijing. Urban Dev. Stud. 2009, 16, 142–146. [Google Scholar]
- Men, B.; Wang, Z.; Liang, C.; Fu, Q. Application of matter-element model in comprehensive evaluation of regional groundwater resources carrying capacity. J. Sichuan Univ. (Eng. Sci. Ed.) 2003, 35, 34–37. [Google Scholar]
- Tian, J.; Wang, X. Research on water resources carrying capacity in arid areas based on entropy weight fuzzy matter-element model—Taking Minqin County, Gansu Province as an example. J. Fudan Univ. (Nat. Sci. Ed.) 2013, 52, 86–93. [Google Scholar]
- Wang, S.; Hou, Y.; Zhang, X.; Ding, J. Comprehensive evaluation method of water resources carrying capacity in river basins. J. Hydraul. Eng. 2003, 34, 88–92. [Google Scholar]
- Wang, H.; Zhao, Y.; Zheng, Y. Evaluation of water resources carrying capacity of various regions in Yinchuan City by projection pursuit clustering model based on genetic algorithm. J. Ningxia Univ. (Nat. Sci. Ed.) 2009, 30, 408–410. [Google Scholar]
- Pan, X.; Xia, J.; Li, F.; Liu, H.; Ma, M.; Wang, C.; Li, R. Research on water resources carrying capacity in northern typical areas based on GIS—Taking Tongzhou District, Beijing as an example. J. Nat. Resour. 2007, 22, 664–671. [Google Scholar]
- Qu, Y.; Fan, S. Analysis and calculation of water resources carrying capacity in the Heihe River Basin and countermeasures. J. Desert Res. 2000, 20, 1–8. [Google Scholar]
- Xu, Z.; Cheng, G. Research on water resources carrying capacity in the middle reaches of the Heihe River Basin using multi-objective decision analysis technology. J. Lanzhou Univ. 2000, 36, 122–132. [Google Scholar]
- Zhu, Y.; Xia, J.; Tan, G. Research on the theory and method of water resources carrying capacity. Prog. Geogr. 2002, 21, 180–188. [Google Scholar]
- Jiang, X.; Huang, Q.; Hui, Y.; Xue, X. Research on water environment carrying capacity in Guanzhong area of Shaanxi Province. Acta Sci. Circumstantiae 2001, 21, 312–317. [Google Scholar]
- Wang, J.; Jiang, D.; Gu, D.; Qi, W.; Tang, Q. Prediction research on water resources carrying capacity of cities in arid areas based on SD model. Geogr. Territ. Res. 1999, 15, 19–23. [Google Scholar]
- Han, J.; Duan, W.; Li, B. Simulation and prediction of water resources carrying capacity of cities in arid areas based on SD model—Taking Baotou City as an example. J. Arid. Land Resour. Environ. 2005, 19, 188–191. [Google Scholar]
- Jia, R.; Jiang, X.; Xue, H.; Shen, B. Research on water resources carrying capacity model in water-deficient areas. J. Lanzhou Univ. 2000, 36, 114–121. [Google Scholar]
- Zhou, F.; Guo, H.; Liu, Y.; He, B. Evaluation method for sustainable development of water resources in lake basins in humid areas. J. Nat. Resour. 2007, 22, 290–301. [Google Scholar]
- Sun, C.; Li, N. Research on water resources carrying capacity under the development strategy of Liaoning coastal economic belt. J. Saf. Environ. 2010, 10, 127–131. [Google Scholar]
- Zhou, Y.; Su, X.; Zhou, Z. Evaluation of water resources load status based on the four-dimensional index system of “quantity-quality-domain-flow”—Taking the three cities in the Heihe River Basin as an example. Agric. Res. Arid. Areas 2019, 37, 215–223+231. [Google Scholar]
- Yu, H.; Li, L.; Li, J. Comprehensive evaluation of water resources carrying capacity of Beijing-Tianjin-Hebei region based on “quantity-quality-domain-flow”. Resour. Sci. 2020, 42, 358–371. [Google Scholar]
- Wang, H.; Wang, J.; Hu, P. The new connotation of water resources protection: Collaborative protection and restoration of “quantity-quality-domain-flow-ecology”. Water Resour. Prot. 2021, 37, 1–9. [Google Scholar]
- Sun, X.; Peng, A.; Hu, S.; Shi, Y.; Lu, L.; Bi, A. Dynamic Successive Assessment of Water Resource Carrying Capacity Based on System Dynamics Model and Variable Fuzzy Pattern Recognition Method. Water 2024, 16, 304. [Google Scholar] [CrossRef]
- Zhuang, D. Characteristics of wetland biological resources and ecosystem evaluation in Dongting Lake area. Trop. Geogr. 2000, 20, 261–264. [Google Scholar]
- Zhong, F.; Yan, H.; Li, L.; Jiang, R.; Yao, Y.; Deng, X. Structure and diversity of bird communities in Dongting Lake wetland. Chin. J. Ecol. 2007, 26, 1959–1968. [Google Scholar]
- Li, Y. Impact and Mechanism of Poplar Plantation on Understory Plant Diversity in Dongting Lake Wetland. Ph.D. Thesis, Hunan Agricultural University, Changsha, China, 2014. [Google Scholar]
- Deng, L.; Chen, D. Biodiversity protection and sustainable utilization of Dongting Lake wetland. For. Resour. Manag. 2002, 60–63. [Google Scholar] [CrossRef]
- Zhang, Y. Value Evaluation of Ecosystem Service Functions of Dongting Lake Wetland. Ph.D. Thesis, Central South University of Forestry and Technology, Changsha, China, 2007. [Google Scholar]
- Chen, K.; Li, J.; Li, Y.; Yu, C.; Liu, Y. Research on water resources carrying capacity of Shantou City based on RBF neural network model. Water Resour. Power 2012, 30, 31–33+28. [Google Scholar]
- Wang, J.; Hu, G.; Zhang, L. Evaluation and prediction of water resources carrying capacity in Beijing-Tianjin-Hebei region. China Rural. Water Hydropower 2022, 69–74. Available online: https://cqvip.com/doc/journal/941511661 (accessed on 1 November 2024).
- Xu, C.; Huang, J.; Man, Z. Research on water resources carrying capacity of Zhengzhou City based on SD-EF model. China Rural. Water Hydropower 2020, 9–14. Available online: https://cqvip.com/doc/journal/920785698 (accessed on 1 November 2024).
- Xue, Q.; Yang, K.; Cai, Y.; Yang, J. Research on prediction and regulation of water resources carrying capacity of Jiangsu Province based on BP neural network-system dynamics coupling model. Water Resour. Hydropower Eng. 2022, 53, 86–99, (In Chinese and English). [Google Scholar]
- Zuo, Q.; Zhang, Z.; Wu, B. Evaluation of water resources carrying capacity of nine provinces and regions in the Yellow River Basin based on combined weight TOPSIS model. Water Resour. Prot. 2020, 36, 1–7. [Google Scholar]
- Wang, J.; Geng, Y.; Zheng, X. Research on water resources carrying capacity evaluation based on PSR-MDS model—Taking Hebei Province as an example. Yangtze River 2021, 52, 81–86. [Google Scholar] [CrossRef]
- Jiao, L.; Wang, D. Research on water resources carrying capacity of Guilin City based on DPSIR model and water footprint theory. Sci. Soil Water Conserv. 2020, 18, 74–80. [Google Scholar]
- Yuan, R.; Wang, X. Comprehensive Evaluation and Analysis of Water Resources Carrying Capacity in Yangtze River Delta Based on Pythagoras-TOPSIS Method. Sci. Technol. Manag. Res. 2020, 40, 71–79. [Google Scholar]
- Guo, Q.; Wang, J.; Zhang, B. Comprehensive evaluation of regional water resources carrying capacity based on DPSIRM framework. J. Nat. Resour. 2017, 32, 484–493. [Google Scholar]
- Fan, Q. Evaluation of ecological environment in the Yangtze River Economic Belt under the gray correlation model. Stat. Decis. 2018, 34, 117–119. [Google Scholar]
- Zeng, Y. Evaluation Model and Interval Prediction of Water Resources Carrying Capacity in Yulin City. Ph.D. Thesis, Guangxi University, Nanning, China, 2022. [Google Scholar] [CrossRef]
- Sun, F. Analysis and Application of Water Resources Carrying Capacity. Ph.D. Thesis, Hohai University, Nanjing, China, 2006. [Google Scholar]
- Zhang, F.; Su, W.; Zhou, J. Urban ecological security evaluation based on entropy weight gray correlation analysis. Chin. J. Ecol. 2008, 27, 1249–1254. [Google Scholar]
- Wang, B.; Zhang, G.; Liu, G.; Yang, Q.; Yang, Y. Evaluation of ecological environment effects of comprehensive management of soil and water loss in hilly areas of the Loess Plateau. Trans. Chin. Soc. Agric. Eng. 2012, 28, 150–161. [Google Scholar]
- Hou, B.; Li, J.; Pan, N.; Liang, C. Application of improved entropy weight gray correlation model in comprehensive evaluation of wetland water quality. J. Saf. Environ. 2008, 8, 80–83. [Google Scholar]
- Chen, L.; Zhou, H. Evaluation of water resources carrying capacity of karst basins based on fuzzy comprehensive evaluation and principal component analysis. Saf. Environ. Eng. 2021, 28, 159–173. [Google Scholar]
- Tang, J.; Ding, W.; Li, W.; Liu, X. Evaluation and obstacle factors of water resources carrying capacity in the Yellow River Basin. Yellow River 2021, 43, 73–77. [Google Scholar]
- Tian, P.; Wang, J.; Hua, W.; Hao, F.; Huang, J.; Gong, Y. Spatio-temporal pattern and coupling coordination of water resources carrying capacity in urban agglomeration in the middle reaches of the Yangtze River. J. Lake Sci. 2021, 33, 1871–1884. [Google Scholar]
- Jin, J.; Shen, S.; Cui, Y.; Zhang, X.; He, P.; Ning, S. Application of semi-partial subtraction set pair potential in dynamic evaluation of water resources carrying capacity in Yellow River Irrigation District. J. Hydraul. Eng. 2021, 52, 507–520. [Google Scholar]
- Ding, C.; Hu, Y.; Wang, Z.; Zhao, N.; Dong, W.; Wang, L. Evaluation of water resources carrying capacity from the perspective of virtual water social cycle. J. Nat. Resour. 2021, 36, 356–371. [Google Scholar]
- Wang, J.; Yuan, X.; Chen, Y.; Fang, Y.; Zhai, T.; Song, Z. Evaluation method and practical application of resource and environmental carrying capacity for sustainable urban ecosystem management—Taking Yantai City as an example. J. Nat. Resour. 2020, 35, 2371–2384. [Google Scholar]
- Zhang, X.; Liu, X.; Zhang, G.; Wei, G.; Liu, F. Analysis of changes in water resources carrying capacity in Aksu River Basin, Xinjiang. Water Resour. Power 2020, 38, 44–47. [Google Scholar]
- Huang, C.; Geng, L.; Yan, B.; Bian, J.; Zhao, Y. Dynamic prediction and regulation of water resources carrying capacity—Taking the Yellow River Basin as an example. Adv. Water Sci. 2021, 32, 59–67. [Google Scholar]
- Li, S.; Zhao, H.; Wang, F.; Yang, D. Evaluation of water resources carrying capacity of Jiangsu Province based on AHP-TOPSIS model. Water Resour. Prot. 2021, 37, 20–25. [Google Scholar]
- Cui, D.; Chen, X.; Zeng, W. Long-term early warning research on water environment carrying capacity—Taking Kunming City as an example. China Environ. Sci. 2018, 38, 1174–1184. [Google Scholar]
- Lin, L.; Li, D.; Lin, Z. Evaluation of water resources carrying capacity in Kubuqi Desert area based on entropy weight-TOPSIS model. J. Cent. China Norm. Univ. (Nat. Sci.) 2020, 54, 640–648. [Google Scholar]
- Kang, J.; Wang, J.; Wang, S. Evaluation research on agricultural water resources carrying capacity in Haihe River Basin. Water Resour. Hydropower Eng. 2020, 51, 47–56. [Google Scholar]
- Hu, G.; Feng, H.; Ma, Y.; Zhou, X.; Feng, C.; Huang, L. Risk assessment and spatiotemporal distribution characteristics of nitrogen and phosphorus pollution in Dongting Lake Basin. Resour. Environ. Yangtze Basin 2023, 32, 162–171. [Google Scholar]
- Yang, H.; Sun, X.; Cheng, X.; Zhou, G.; Sun, G. Comprehensive evaluation of water resources carrying capacity of Weifang City based on VIKOR method. Acta Sci. Circumstantiae 2020, 40, 716–723. [Google Scholar]
- Li, Z.; Dong, Z.; Chen, M.; Lu, S. Evaluation of water resources carrying capacity of Hefei City based on fuzzy analysis method. Water Resour. Power 2020, 38, 43–46. [Google Scholar]
- Bian, J.; Song, X.; Geng, L.; Yan, B. Characteristic analysis and evaluation research of water resources carrying capacity in Taihu Lake Basin. Water Sav. Irrig. 2020, 73–78+83. Available online: https://cqvip.com/doc/journal/921528412 (accessed on 1 November 2024).
- Ye, F.; Jin, J.; Fang, G. Evaluation of water resources carrying capacity of Hefei City based on set pair analysis connection number. J. Water Resour. Water Eng. 2020, 31, 85–90. [Google Scholar]
- Liu, X.; Liu, L. Comprehensive evaluation research on water resources carrying capacity of Shaanxi Province based on principal component analysis. Math. Pract. Theory 2020, 50, 55–62. [Google Scholar]
- Sun, G.; Sun, X.; Huo, X.; Long, S. Evaluation of water resources carrying capacity based on three-way decision improved TOPSIS. Water Sav. Irrig. 2019, 77–81. Available online: https://cqvip.com/doc/journal/924476001 (accessed on 1 November 2024).
- Fei, X.; Li, J.; Li, L.; Wen, Q.; Zhang, L. Evaluation and driving force research of water resources carrying capacity in Dianchi Lake Basin. J. Irrig. Drain. 2019, 38, 109–116. [Google Scholar]
- Tian, P.; Zhang, Z.; Xu, X.; Yan, F.; Wu, Y.; Zhang, H.; Liu, M. Comprehensive evaluation of water resources carrying capacity of the Yangtze River Economic Belt based on variable weight TOPSIS model. J. Cent. China Norm. Univ. (Nat. Sci.) 2019, 53, 755–764. [Google Scholar]
- Zhang, Q.; Li, S.; Xia, H. Research on water resources carrying capacity of three northeastern provinces based on fuzzy comprehensive evaluation model. Bull. Soil Water Conserv. 2019, 39, 179–188+193. [Google Scholar]
- Liu, T.; Yang, X.; Zhao, K.; Xue, Q. Dynamic evaluation of water resources carrying capacity based on set pair analysis—Taking Sichuan Province as an example. Yangtze River 2019, 50, 94–100. [Google Scholar]
- Xu, Y.; Chen, J.; Xia, H.; Chu, L.; Zhang, X. Evaluation of water resources carrying capacity of Huai’an City based on DPSR-improved TOPSIS model. J. Water Resour. Water Eng. 2019, 30, 47–52+62. [Google Scholar]
- Fan, J.; Huang, J.; Yuan, M.; Zhang, X.; Tan, C. Evaluation of water resources carrying capacity of Pearl River Delta based on subsystem entropy weight model. J. Water Resour. Water Eng. 2019, 30, 100–105. [Google Scholar]
- Xia, H.; Chen, J.; Xu, Y.; Zhang, X.; Shi, Z. Research on water resources carrying capacity of Lianyungang City based on improved TOPSIS model. Water Sav. Irrig. 2019, 86–90+95. Available online: https://cqvip.com/doc/journal/915356069 (accessed on 1 November 2024).
- Huang, Z.; Guo, H. Comprehensive evaluation of resource and environmental carrying capacity of Zhengzhou City based on entropy weight TOPSIS model. Ecol. Econ. 2019, 35, 118–122+127. [Google Scholar]
- Xu, L.; Liu, Y.; He, Y.; Chen, Y.; Xu, F. Design and implementation of regional resource and environment carrying capacity evaluation information platform. Geomat. Spat. Inf. Technol. 2019, 42, 162–165+168. [Google Scholar]
- Yin, Y.; Cheng, S.; Ma, R.; Shen, Q.; Wang, Y.; Jiao, S.; Deng, S.; Tian, C. Discussion on the "double evaluation" model of county-level areas in hilly regions based on “locality” and “synergy”: Taking Chenxi County, Hunan Province as an example. Econ. Geogr. 2020, 40, 102–113. [Google Scholar]
- Shen, Y.; Gong, J.; Ye, J.; Wang, W.; Tao, R. Research on the delimitation of permanent basic farmland based on "double evaluation": Taking Huangshi City as an example. China Land Sci. 2021, 35, 27–36. [Google Scholar]
- Fu, X.; Yang, X.; Song, X. Evaluation of resource and environment carrying capacity of the Yangtze River Economic Belt based on DPSIR-TOPSIS model. J. Cent. South Univ. For. Technol. (Soc. Sci.) 2022, 16, 38–47. [Google Scholar]
- Liu, X.; Zhang, M.; Xu, J.; Guo, Y.; Duan, W.; Shen, Y. Research on water resources carrying capacity of Tarim River Basin based on system dynamics model. Arid. Land Geogr. 2021, 44, 1407–1416. [Google Scholar]


Disclaimer/Publisher’s Note: The statements, opinions and data contained in all publications are solely those of the individual author(s) and contributor(s) and not of MDPI and/or the editor(s). MDPI and/or the editor(s) disclaim responsibility for any injury to people or property resulting from any ideas, methods, instructions or products referred to in the content. |
© 2024 by the authors. Licensee MDPI, Basel, Switzerland. This article is an open access article distributed under the terms and conditions of the Creative Commons Attribution (CC BY) license (https://creativecommons.org/licenses/by/4.0/).