Abstract
Optimizing the land use structure is one of the most effective means of improving the surface water aquatic environment. The relationship between land use patterns and water quality is complex due to the influence of dams and sluices. To further investigate the impact of land use patterns on water quality in different basins, we use the Shaying River as an example, which is a typical tributary of the Huai River Basin. Utilizing 2020 land use data and surface water quality monitoring data from two periods, this study employs GIS spatial analysis, the Random Forest Model, redundancy analysis, and Partial Least-Squares Regression to quantitatively explore how different-scale buffer zone land use patterns impact surface water quality. The key findings include: (1) notable seasonal differences in water quality indicators within the basin. The Water Quality Index (WQI) is significantly better in the non-flood season compared to the flood season, with water quality deteriorating towards the lower reaches. Key indicators affecting water quality include dissolved oxygen (DO), ammonia nitrogen (NH3-N), total phosphorus (TP), and turbidity (Tur) in the flood season and NH3-N, permanganate index (CODMn), and electrical conductivity (EC) in the non-flood season. (2) Cultivated land and construction land are the main land uses in the basin. The sub-basin buffer zone was identified as the most effective scale for land use impact on water quality indicators in the Shaying River. (3) Partial Least-Squares Regression (PLSR) analysis revealed that cultivated land, construction land, and grass are the primary land use types influencing surface water quality changes, and the PLSR model is better during the non-flood season. Cultivated and construction lands show a positive correlation with most water quality indicators, while forest land, water bodies, and grasslands correlate positively with DO and negatively with other indicators. The study underscores that rational land use planning in the sub-basin is crucial for enhancing the quality of the surface water environment.
1. Introduction
Water quality is crucial for preserving ecosystems, supporting agricultural and industrial activities, and sustaining human life [1,2]. However, the challenges posed by rapid urbanization and population growth have led to significant water pollution issues [3,4]. The deterioration of river water quality can be attributed to point-source and non-point-source pollution [5]. Point source pollution, being more localized, is relatively easier to manage by reducing pollutant emissions [6]. However, numerous studies highlight that non-point source pollution, influenced by widespread human activities, is increasingly becoming a critical factor in water quality degradation [7,8]. The land use pattern serves as a clear indicator of the human impact on the ecological environment. It is a principal contributor to the generation and migration of non-point source pollution [9,10]. Given the severity of surface water pollution and the frequent occurrence of algal blooms in lakes and reservoirs, it is imperative to understand the interplay between land use and water quality. By identifying a sustainable land use structure, we can better manage the inputs, outputs, and transformations of non-point source pollution. This approach is essential for enhancing the quality of the water environment in our increasingly polluted world.
Land use patterns play an important role in the transport of pollutants, with each type of land use impacting water quality in different ways. Research indicates that cultivated and construction lands are often the primary sources of water pollutants. Cultivated land, in particular, shows a strong positive correlation with nitrogen and phosphorus nutrient salts, mostly originating from agricultural activities like crop planting, fertilizer application, and irrigation [11,12]. Conversely, construction land negatively affects water quality, primarily through the discharge of industrial wastewater, sewage, and large amounts of domestic sewage [13]. In contrast, forest land and grasslands act as natural ‘sinks’ for pollutants, helping to retain and purify them. They generally exhibit a significant negative correlation with negative water quality indicators [14,15]. However, these lands can also be sources of pollutants under certain conditions. The relationship between land use and water quality is complex and varies depending on regional differences in land use structures and variations in spatial and temporal scales. For instance, cultivated land may mitigate water quality contamination in specific contexts, depending on the study area [16]. Similarly, forest land and grasslands, typically seen as pollutant ‘sinks’, can also become pollutant ‘sources’ in certain scenarios [17]. The impact of land use on water quality is also influenced by spatial and temporal scales. Researchers often divide spatial scales into sub-basins and buffer zones to study these effects [18]. However, there is ongoing debate about which spatial scales are most influential in optimizing water quality. This variability and the regional differences highlight the complexity of managing land use to protect and improve water quality.
The relationship between land use and water quality is influenced not only by spatial scales but also seasonal variations. Studies by different researchers have revealed varying impacts at different scales and times. Xu et al. found the highest correlation between land use and water quality in Yuanhe at the 300 m buffer scale [19]. In contrast, Deng et al. found that construction land within a buffer zone of 500 to 1000 m in the Taihu Lake Basin showed a notable correlation with a broad range of pollutants, suggesting a wider spatial impact [20]. Moreover, the strongest impacts of land use on water quality have been observed at the sub-basin scale in certain studies [21]. This indicates that larger geographical units can also be critical in understanding and managing the relationship between land use and water quality. Seasonal variations further complicate this relationship. Shi, Wang, and others found that the correlation between land use and water quality was more pronounced during the flood season compared to the non-flood season [22,23]. However the opposite conclusion was reached in the studies of the Three Gorges Reservoir and the Hehuang Valley [24,25]. Due to the differences in land use patterns in different watersheds, the common understanding of the impacts of land use practices on water quality remains to be further investigated.
In efforts to elucidate the relationship between land use and water quality, researchers have conventionally employed a variety of statistical and modeling tools. These include correlation analysis [20,26,27], the SWAT (Soil and Water Assessment Tool) hydrological model [28,29], and various multivariate statistical methods [30,31,32]. While these methodologies have been instrumental in advancing our understanding, they are not without limitations. Notably, statistical methods tend to ignore the problem of multicollinearity between variables, and modeling tools such as SWAT require hydrological, meteorological and water quality data to adjust model parameters [33], making it more difficult to extend their use to areas where information is scarce. Compared to the above methods, the Partial Least-Squares Regression (PLSR) technique stands out for its ability to efficiently elucidate response variables using fewer components. This method is particularly effective in scenarios where multicollinearity is prevalent and the quantity of predictor variables exceeds the number of observed samples [34]. PLSR’s proficiency in handling these complex statistical situations makes it a superior tool for predictive analysis in environmental studies and other fields where intricate data relationships are common [35,36,37].
Dams and sluices are pivotal in humanity’s exploitation of water resources, especially amid rapid economic and social development and growing population demands. The construction of these structures has become a global phenomenon [38]. In China, the Huai River Basin, known for its high population density and acute water pollution issues, has over 5000 sluice gates, including approximately 600 large- and medium-sized ones, making it the region with the highest number of such structures in the country [39,40]. The Shaying River, the largest tributary in this basin, has experienced significant water pollution problems due to these dams, adversely affecting residents’ lives and causing substantial economic and environmental damage [41]. While studies on the impact of land use change on water quality are prevalent, they primarily focus on natural water bodies. Little research has been carried out on how different spatial scales of land use patterns affect surface water quality in basins with multiple dams and sluices [32]. To address this gap, we investigated the Shaying River Basin. By combining land use data with monitored surface water quality information, we explored the relationship between land use structures at varying spatial scales and water quality, using mathematical statistics and spatial analysis. This approach aims to better understand how pollutants migrate and transform under the influence of land use patterns shaped by locks and dams.
This study aimed to (1) evaluate the spatial and temporal changes in water quality in the Shaying River using the WQI method and to clarify the water quality status of the Shaying River Basin in 2021; (2) screen the key water quality indicators based on the Random Forest Model and determine the optimal spatial scale through redundancy analysis; and (3) construct a PLSR model of land use and water quality indicators at the optimal scale to determine the most important land use scales that affect seasonal water quality. The results of the study can provide a scientific basis for the optimization of land use structure and water environmental protection in the Shaying River Basin.
2. Materials and Methods
2.1. Study Area
The Shaying River Basin, situated within the Huai River system, is a significant four-order tributary [38]. This river originates in Dengfeng city, Henan province, and meanders through over 40 counties and cities in Henan and Anhui provinces. With Zhoukou city and Yingshang city as two key nodes, the Shaying River is divided into three sections. The region experiences a warm temperate semi-humid continental monsoon climate, characterized by an average annual temperature ranging from 14 °C to 15 °C and average annual precipitation of 753.43 mm [42,43]. The climate features four distinct seasons, with considerable variation in rainfall throughout the year. The flood season spans from June to September, typically peaking in July.
2.2. Data Sources
This study utilized data encompassing water quality, land use, and a digital elevation model (DEM). Specifically, the surface water quality data were from January to December 2021 from the China Environmental Monitoring General Station (http://www.cnemc.cn/, accessed on 3 September 2023). Considering the actual operation of the monitoring stations, we chose 21 national surface water quality monitoring stations with relatively complete data series and obvious spatial characteristics (Figure 1). The water quality data consisted of 8 indexes: water temperature (WT), pH, dissolved oxygen (DO), electrical conductivity (EC), turbidity (Tur), permanganate index (CODMn), ammonia nitrogen (NH3-N), and total phosphorus (TP). The land use data of the basin came from the 2020 national land use remote sensing monitoring data of the Resource and Environment Science Data Centre of the Chinese Academy of Sciences (http://www.resdc.cn, accessed on 6 September 2023). Referring to the standard of “Classification of Land Use Status”, the land use types of the basin were divided into six categories: cultivated land, forest land, grass, water, construction land, and unused land; this last land category was not considered in the subsequent study due to the very small proportion of unused land area in the basin (0.003%). The DEM data were provided by the Geospatial Data Cloud Platform (http://www.gscloud.cn, accessed on 6 September 2023). Digital elevation data were used to extract the basin extent and identify the river system.
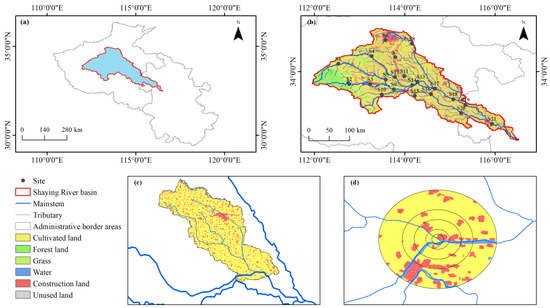
Figure 1.
Location of the study area and sampling sites (a,b) and two buffer scales: (c) the sub-basin and (d) the buffer zone (S1~S21 are national surface water quality monitoring stations).
2.3. Methodology
2.3.1. Water Quality Assessment Method
In this study, eight water quality indicators were used to calculate the WQI; the indicators were WT, pH, Tur, DO, NH3-N, TP, CODMn, and EC. The standardization and relative weight values of the water quality indicators refer to the published related studies [44,45]. In addition, the actual situation in China was also considered, and the standardization factors of some water quality indicators were corrected by comparing them with the Chinese Environmental Quality Standard for Surface Water [46], and the standardization factors and relative weight values of each water quality indicator are shown in Table 1. Referring to previous studies [47], we calculated WQI values for sample points in the basin using Equation (1):
where n is the number of water quality indicators involved in the calculation of the WQI; Ci is the standardization factor of water quality indicator i; and Pi is the relative weight of water quality indicator i; the larger the value of WQI, the better the water quality status. The water quality classes were classified with reference to available studies [44].

Table 1.
Standardized statistics for water quality parameters.
2.3.2. Random Forest Model
This study used the Random Forest (RF) Model to identify key water quality indicators. RF is an integrated learning model constructed based on a decision tree [48], which effectively solves complex system problems such as non-linearity and interaction between variables by introducing the techniques of random sampling and random feature selection and has the advantages of simple operation and high modeling accuracy, and it has been more widely used in the field of water quality prediction in recent years [49,50,51]. Based on the R 4.2.2 platform, we used the “randomForest” package to establish Random Forest regression models between the water quality parameters and the WQI and to assess the importance of each water quality indicator, and the model significance and indicator significance were assessed using the “A3” and “rfPermute” packages, respectively.
2.3.3. Spatial Analysis Method
The water quality of the monitoring sample points in the basin is affected by the incoming water from multiple sources, so we divided the buffer zones into two different spatial scales: (1) the upstream sub-basin of each monitoring sample point (Figure 1c). Based on the collected DEM data, the corresponding sub-basins were divided using the hydrological analysis module of ArcGIS 10.7 software and the locations of the monitoring sample points. (2) A circular buffer zone centered on the monitoring sample point (Figure 1d). With reference to previous related studies [12,21,22,52,53], circular buffer zones with radii of 500 m, 1 km, 2 km, 3 km, and 5 km were delineated.
2.3.4. Statistical Analysis Method
In the trended correspondence analysis of the different water quality indicators at the monitoring sample points in Canoco 5.0 software, the gradient value of the water quality indicator data was less than 3, which met the conditions of redundancy analysis [54]. We take the mean value of each water quality indicator from June to September as the flood season water quality indicator and the mean value of each water quality indicator in the rest of the months as the non-flood season water quality indicator; the water quality indicators are regarded as the response variable, and the percentage of the area of the land use type is taken as the explanatory variable to express the explanatory ability of the land use scale to the variations in each water quality indicator in different periods.
Before constructing the PLSR model, we performed covariance diagnostics on the explanatory variables (land use types) using Pearson correlation analyses [55], which showed significant correlations between multiple variables (Table S1). Therefore, this study analyzed the relationship between optimal buffer land use and water quality indicators using the PLSR model. The cross-validation method was used to determine the number of scores, R2 (model fitting ability), and Q2 (model predictive ability); when R2 > 0.5 and Q2 > 0.5, this indicates that the model is reasonably established [56], the degree of contribution of the explanatory variables to the response variable is indicated by variable importance in projection (VIP), and the explanatory variables with a VIP value of more than 1 are significant to the response variable [34]. The regression coefficient (RC) quantifies the effect of each explanatory variable on the response variable in the PLSR model, which was built using SIMCA 14.1 software.
3. Results
3.1. Water Quality Characteristics
3.1.1. Spatio-Temporal Characteristics of the Water Quality Indicators
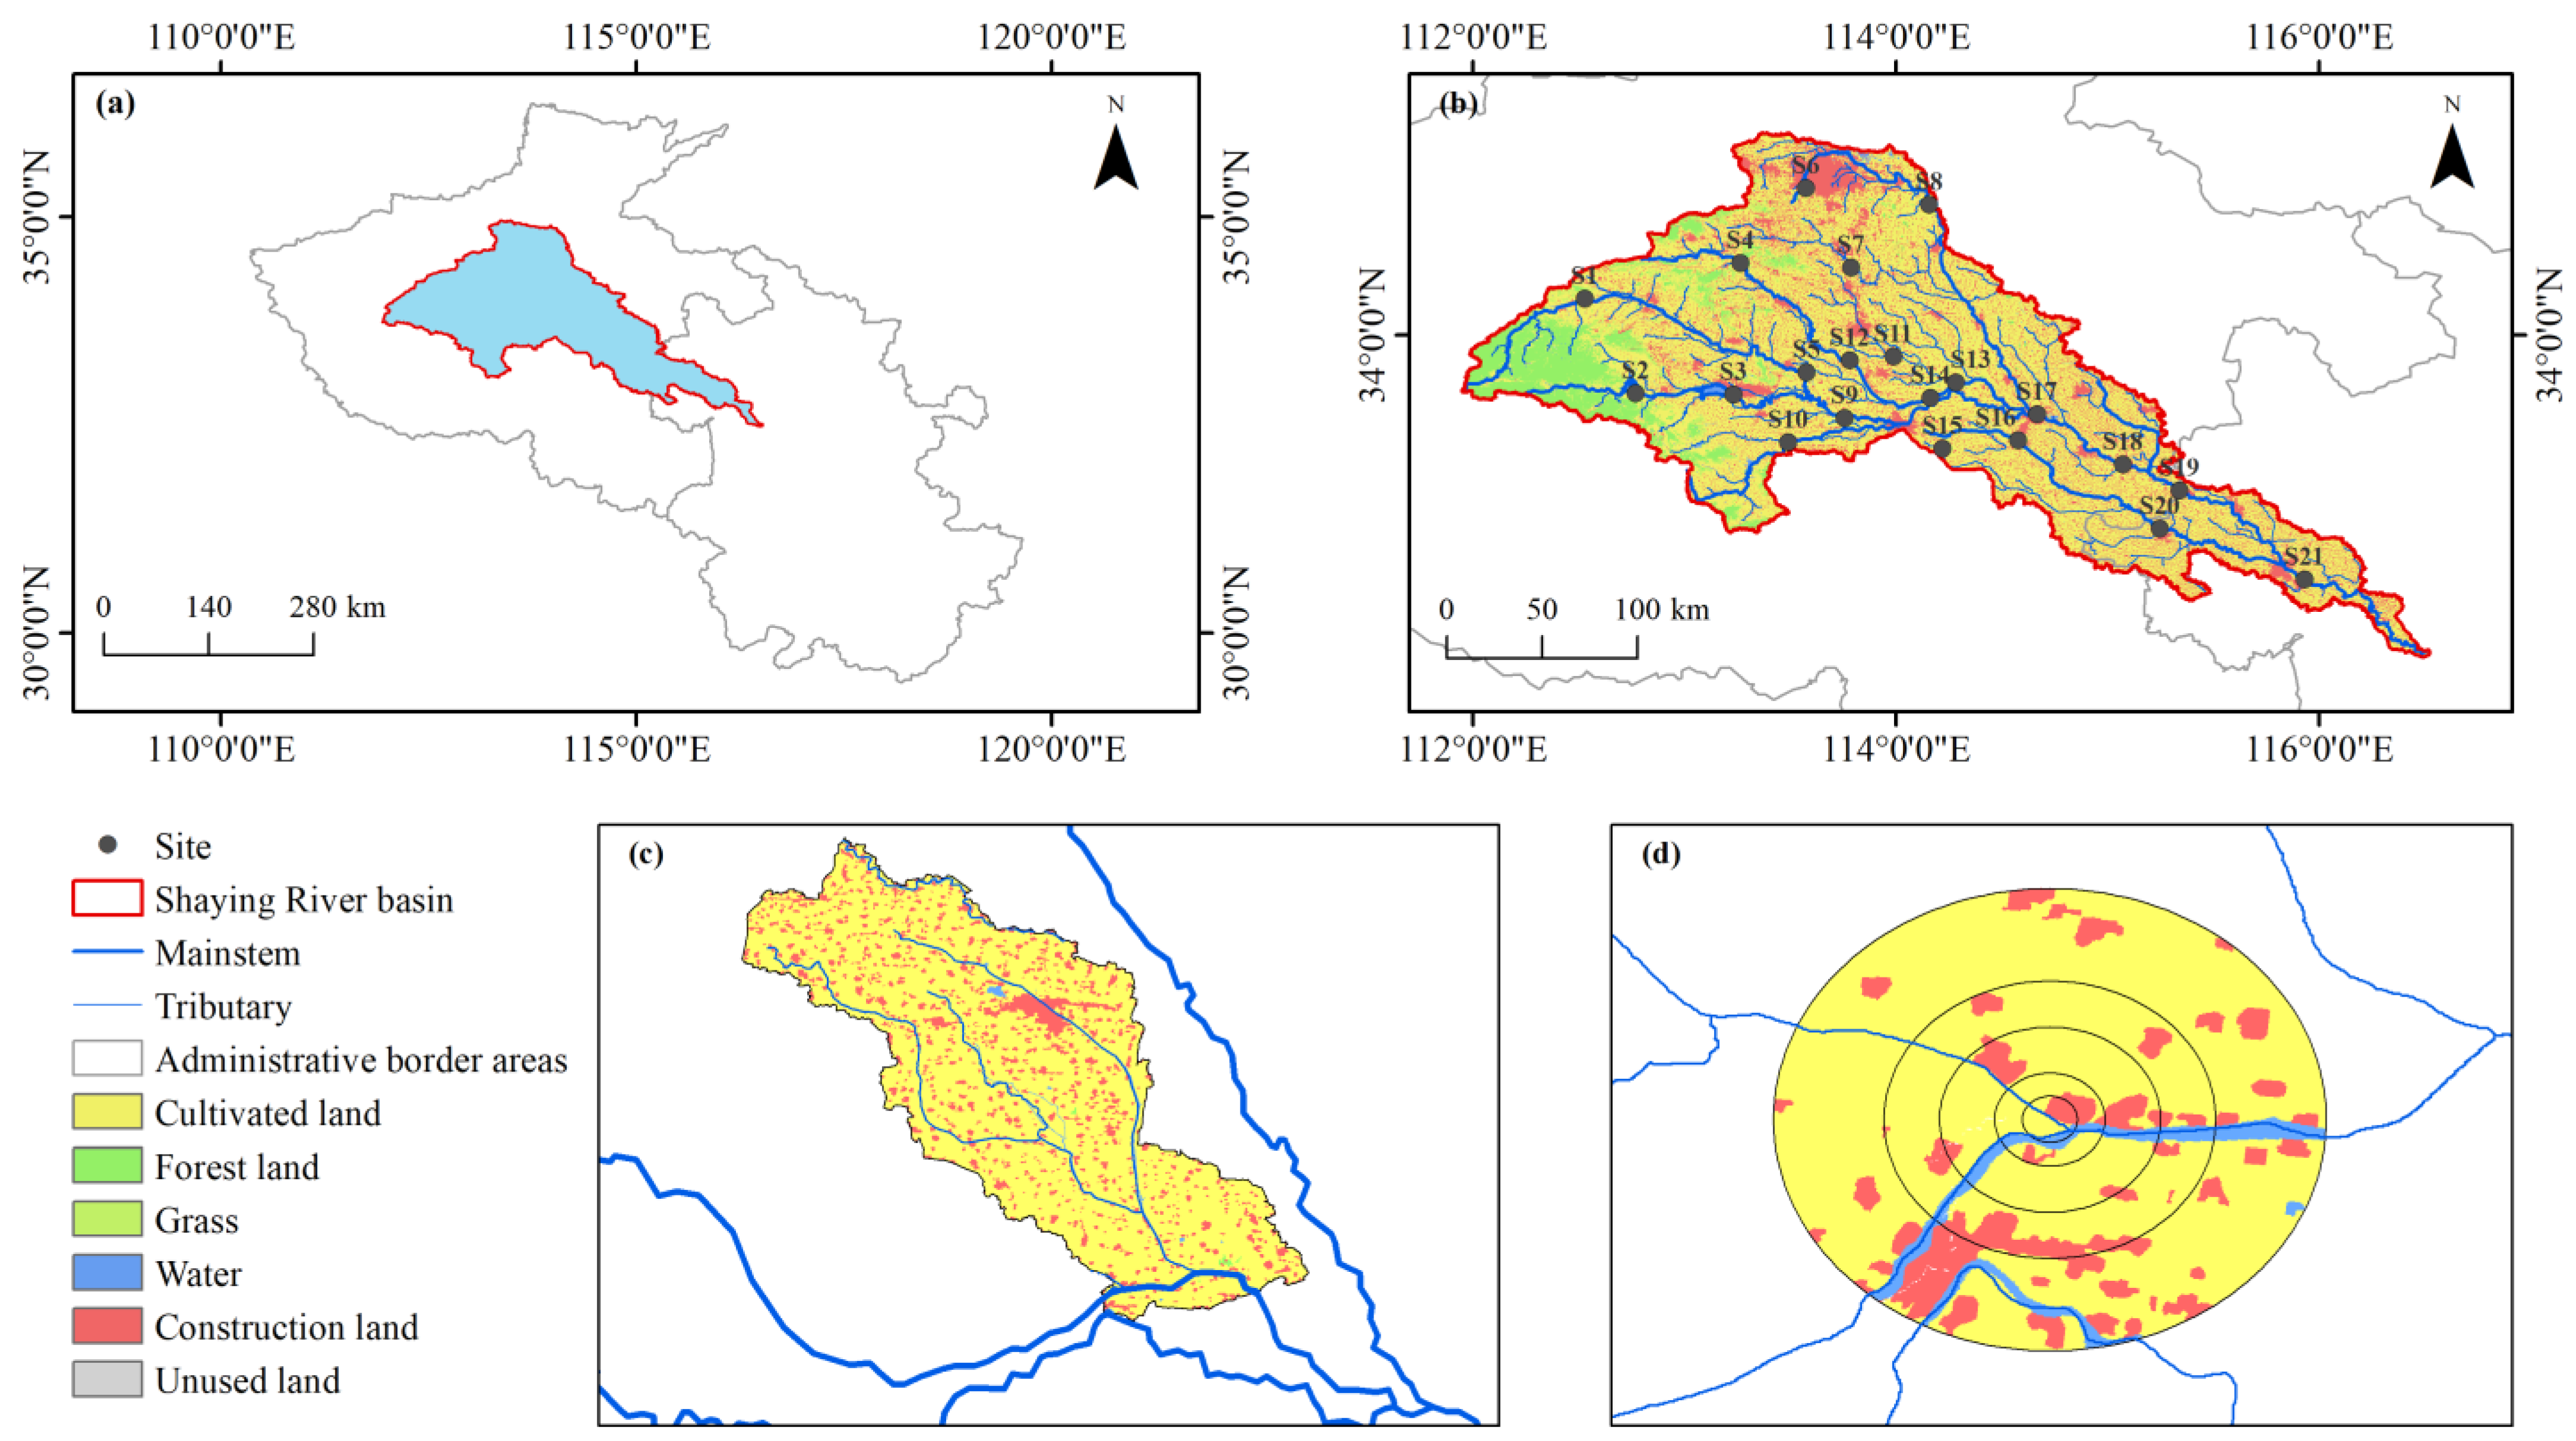
The results for the seasonal descriptive statistics of water quality indicators at monitoring sections in the basin are shown in Figure 2. The WT ranged from 11.92 to 29.44 °C, pH ranged from 7.35 to 8.71, the water quality was in a weakly alkaline state throughout the year, the EC varied from 231.4 to 1009.22 μs/cm, and the difference between the flood season and the non-flood season was relatively small; the Tur varied from 4.42 to 107.69 NTU, the DO varied from 3.82 to 13.14 mg/L, and the average value during the flood season was smaller than that during the non-flood season, of which 23.8% of the monitoring sections had DO concentrations inferior to those of the “Surface Water Quality Guidelines”. The average value of the flood season is smaller than that of the non-flood season, in which 23.8% of the monitoring section DO concentration is worse than the limit value of the class III standard in the Environmental Quality Standard for Surface Water [46]; CODMn fluctuates in the range of 1.58~8.43 mg/L; NH3-N varies in the range of 0.03~1.03 mg/L; and the TP range varied between 0.01~0.24 mg/L. Compared with the non-flood season, the nutrient salt indicator concentration in the flood season as a whole showed a higher level. From a spatial point of view, the concentrations of negative water quality indicators were higher in the middle and lower reaches than in the upper reaches, which may be related to the higher percentage of forest land and grass in the upper reaches. Combined with the results of the water quality indicator variability test (Table 2), it was found that DO, TP, Tur, CODMn, and EC had highly significant seasonal differences (p < 0.001), while pH and NH3-N showed more significant variability.

Figure 2.
Spatial distribution of water quality indicators at the monitoring sample sites during different periods (a) WT, (b) pH, (c) DO, (d) CODMn, (e) NH3-N, (f) TP, (g) EC, (h) Tur.
Table 2.
Seasonal statistics of the water quality parameters.
3.1.2. Spatio-Temporal Characteristics of the WQI
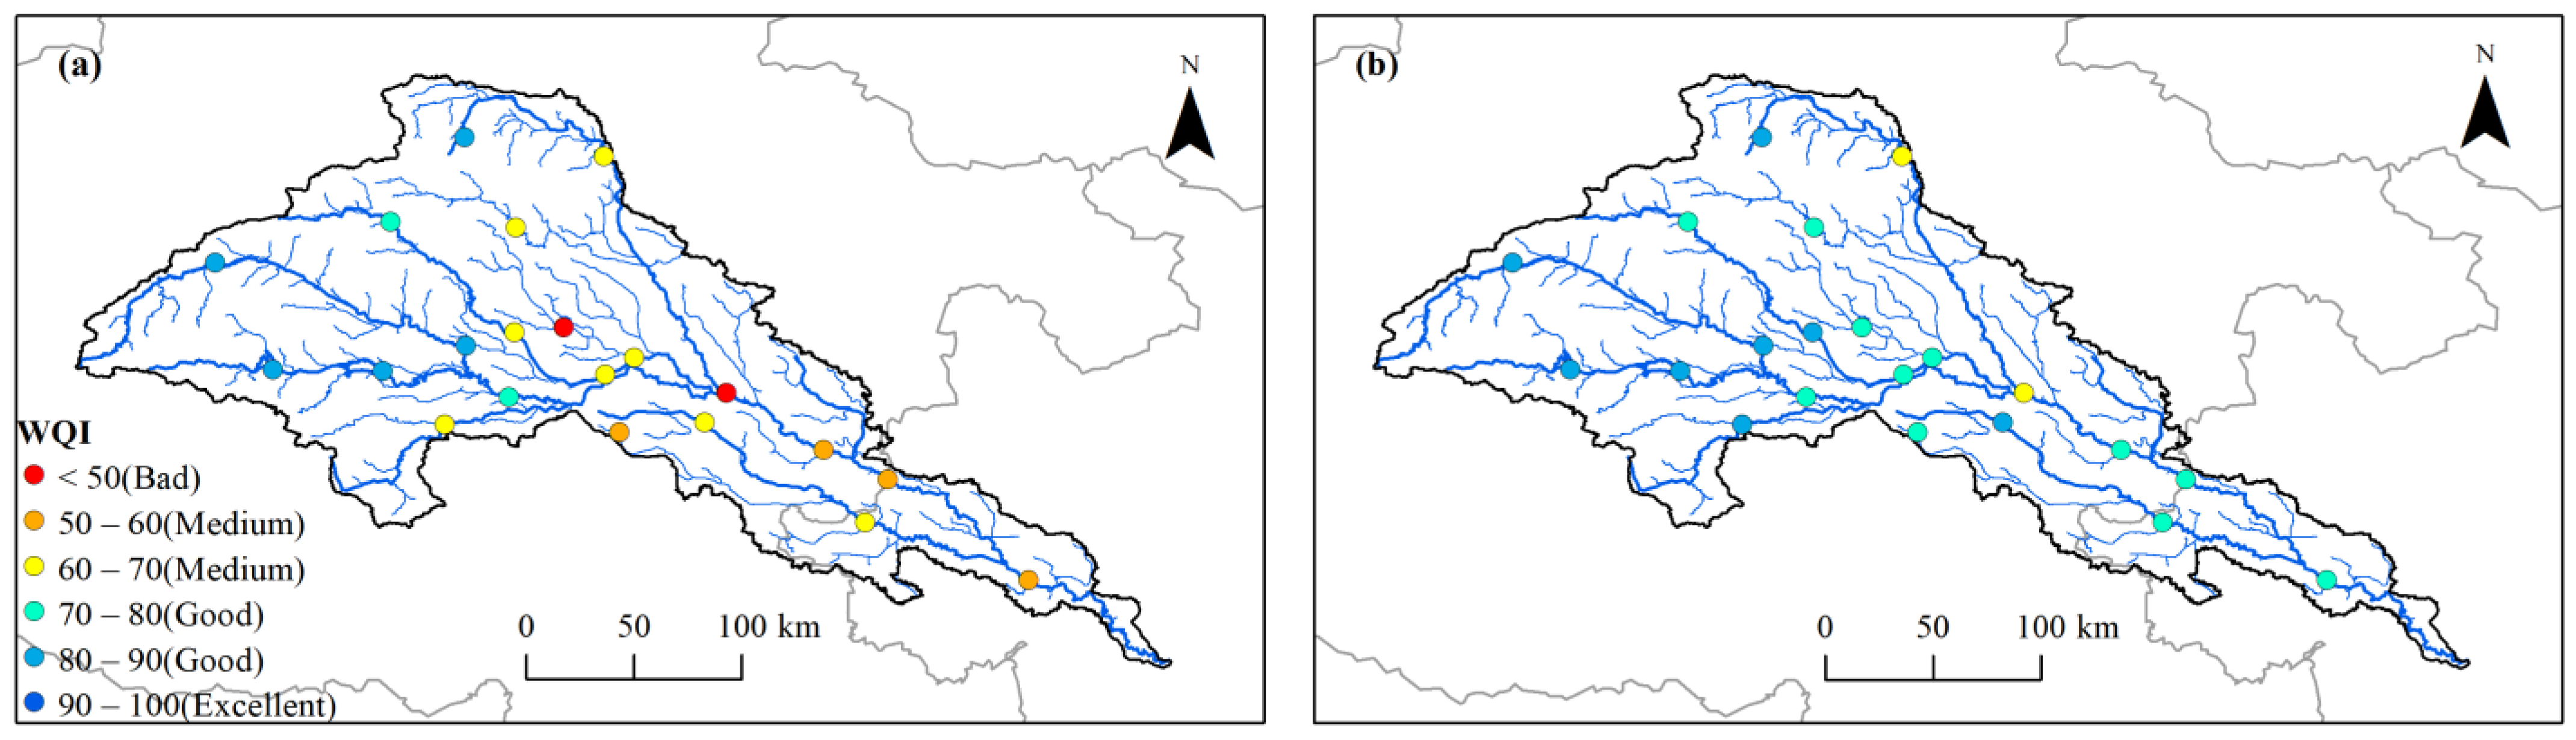
The water quality scores within the Shaying River Basin were calculated using a comprehensive evaluation index, revealing distinct seasonal variations, as depicted in Figure 3. There was significant seasonal variation in the WQI values in this basin and the water quality is better during the non-flood season. In the flood season, the WQI values fluctuated between 48.2 and 87.6, averaging at 67.5. A closer look at the distribution reveals that 9.5% of the sampling points fell into the “poor” status, while the majority, 57.2%, were classified as “medium quality”, and 33.2% achieved a “good” status. During the non-flood season, however, the WQI scores were notably higher, ranging from 67.1 to 90, with an average score of 78.9. In this period, a significant 90.5% of the sampling points were rated as “good”, and 9.5% were rated as “moderate”. It’s important to note that none of the sampling points reached an “excellent” status in either the flood or non-flood seasons.

Figure 3.
Spatial distribution of the WQI in the Shaying River Basin: (a) flood season and (b) non-flood season.
From a spatial perspective, the WQI values in the Shaying River exhibited a downward trend, moving from upstream to downstream. The lower WQI values were predominantly found in the middle and lower reaches of the river. This trend is particularly pronounced around the Zhoukou sampling site, where the WQI notably decreases. The Zhoukou sampling site stands as a pivotal site along the main course of the Shaying River. This key location serves as the confluence for major tributaries including the Sha River, Ying River, and Jialu River. Its strategic position makes it particularly susceptible to rainfall impacts during the flood season. During the flood season, rainfall elevates the river’s water level, prompting the opening of gates to release excess water. This process results in pollutants accumulated from various sources at the gate being swept downstream. Furthermore, the land use composition in the middle and lower reaches of the river basin is largely dominated by cultivated fields and construction areas. This configuration offers limited capability for retaining pollutants. Agricultural activities will exacerbate downstream river water pollution. During the non-flood season, with the reduction in hydraulic activities such as flooding and drainage, water quality is more strongly influenced by agricultural production and human activities [57].
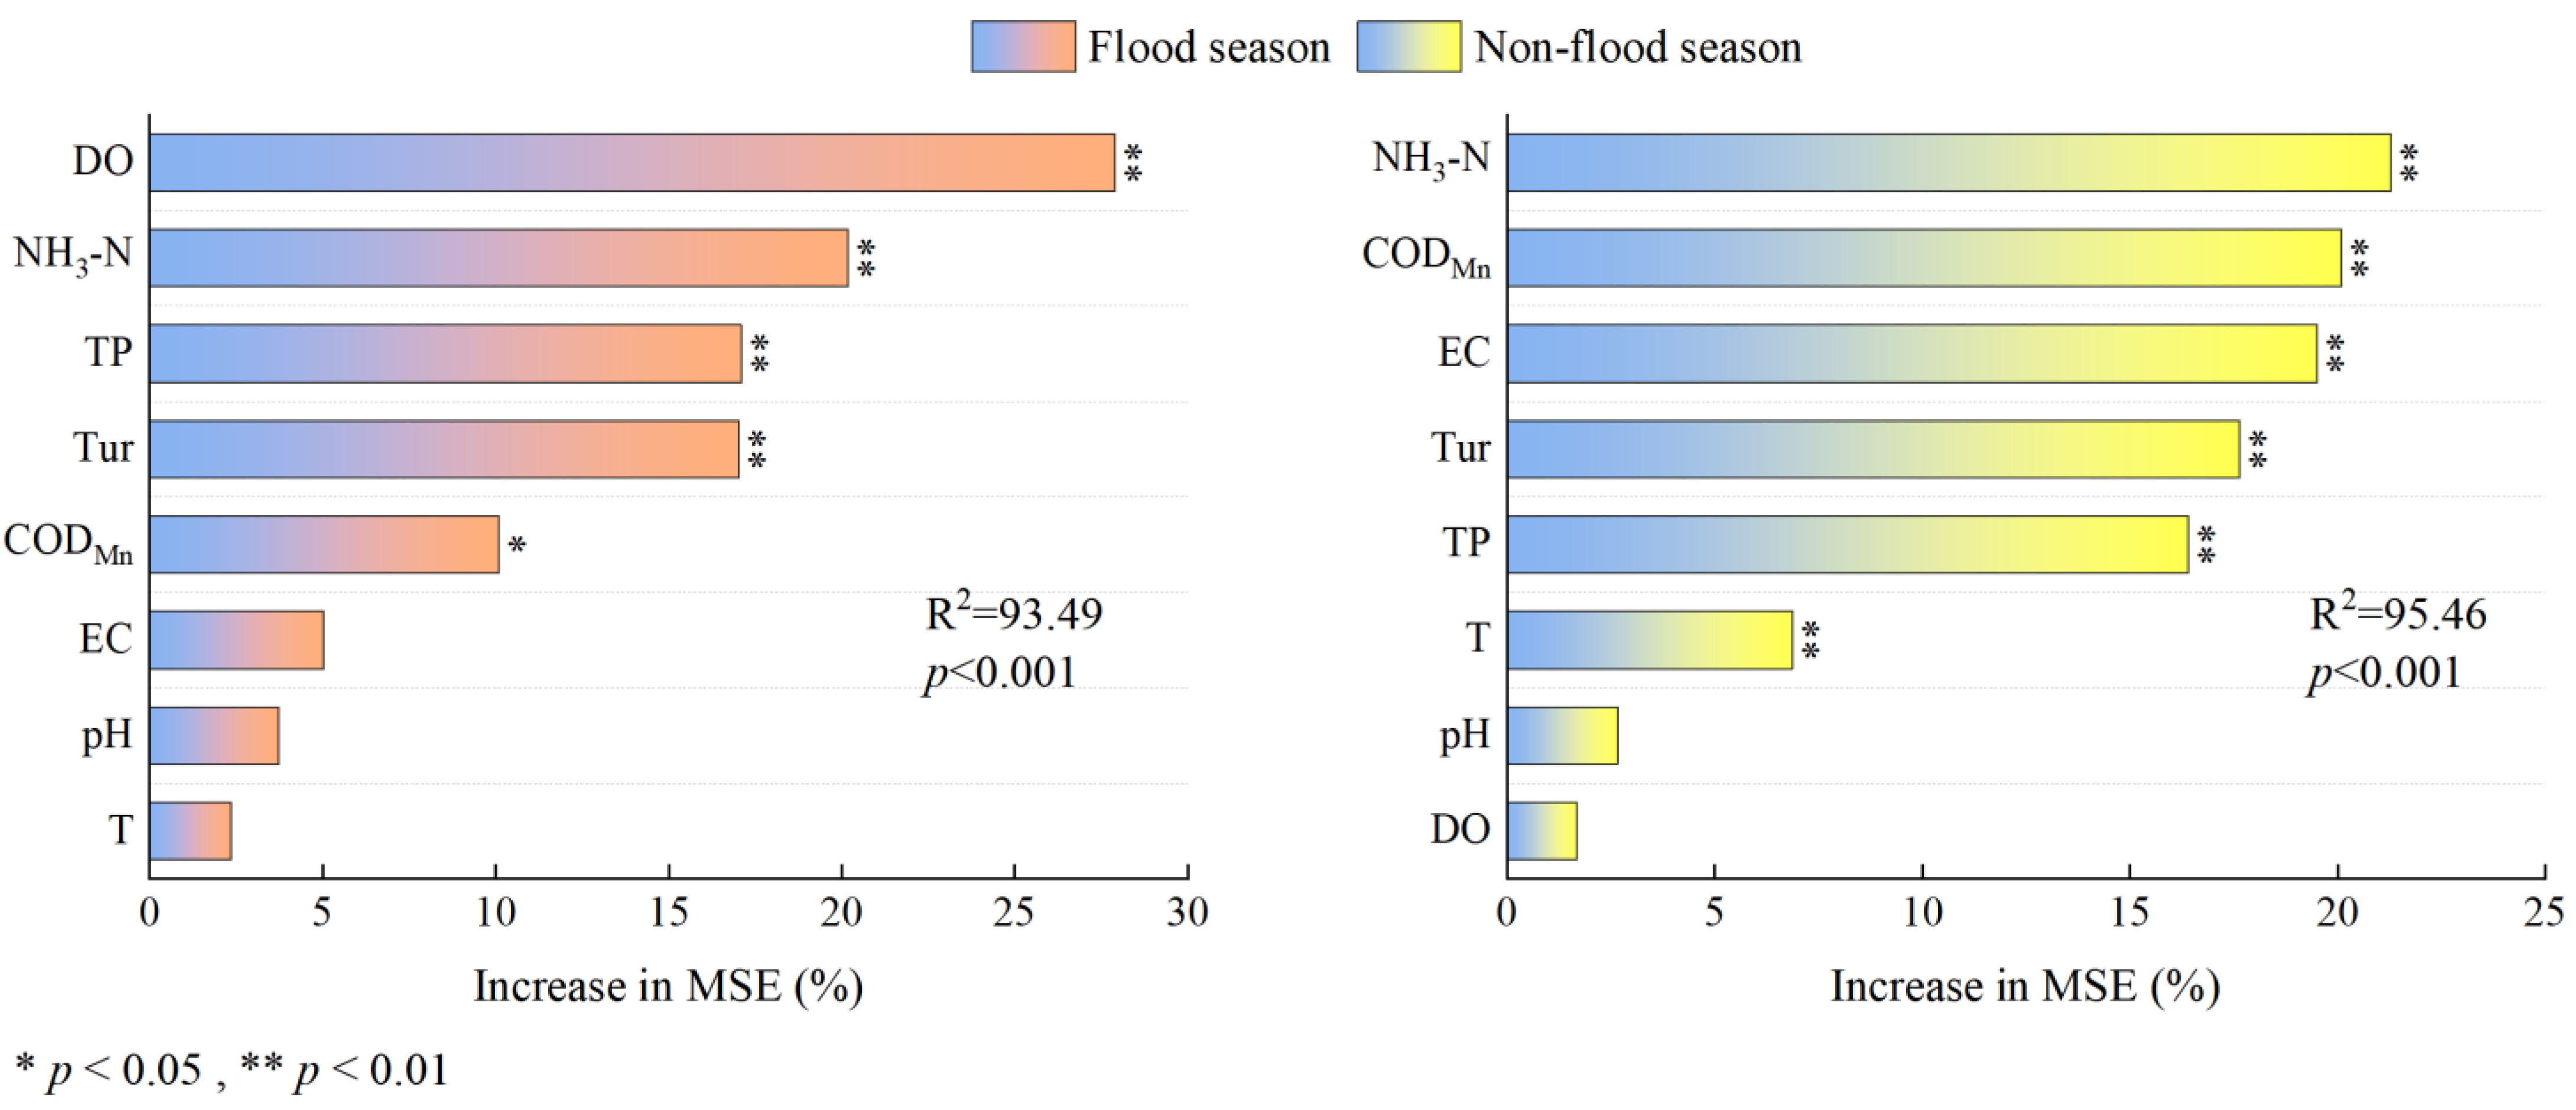
The best models for the Random Forest (RF) in the different seasons were derived through parameter optimization. Optimal performance was achieved when the number of decision trees was set to 300 and 250, and the maximum number of features was 4 and 3, respectively. These models exhibited strong explanatory abilities, accounting for 93.49% and 95.46% of the variance in the water quality indicators for the response variable (WQI). The ‘IncMSE’ (increase in mean square error) value in the model was utilized to assess the significance of each water quality indicator. ‘IncMSE’ indicates the percentage increase in error after excluding a variable, with larger values indicating a greater impact on water quality. A significance test was conducted on all water quality indicators and the model, with the results displayed in Figure 4. The key indicators varied between the seasons. During the flood season, DO was the most influential, increasing the mean square error by 27.88%, followed by NH3-N (20.18%), TP (17.10%), and Tur (17.03%). These four indicators showed a highly significant effect on the WQI (p < 0.01). During the non-flood season, the importance of the indicators was ranked as follows: NH3-N (21.27%) > CODMn (20.09%) > EC (19.51%) > Tur (17.64%) > TP (16.39%) > WT (6.86%) > DO (2.66%) > pH (1.88%), with NH3-N, CODMn, and EC being key indicators significantly affecting the WQI (p < 0.01).

Figure 4.
Ranking of the relative importance of the water quality indicators.
3.2. Optimal Spatial Scale
3.2.1. Land Use Characteristics at Different Scales
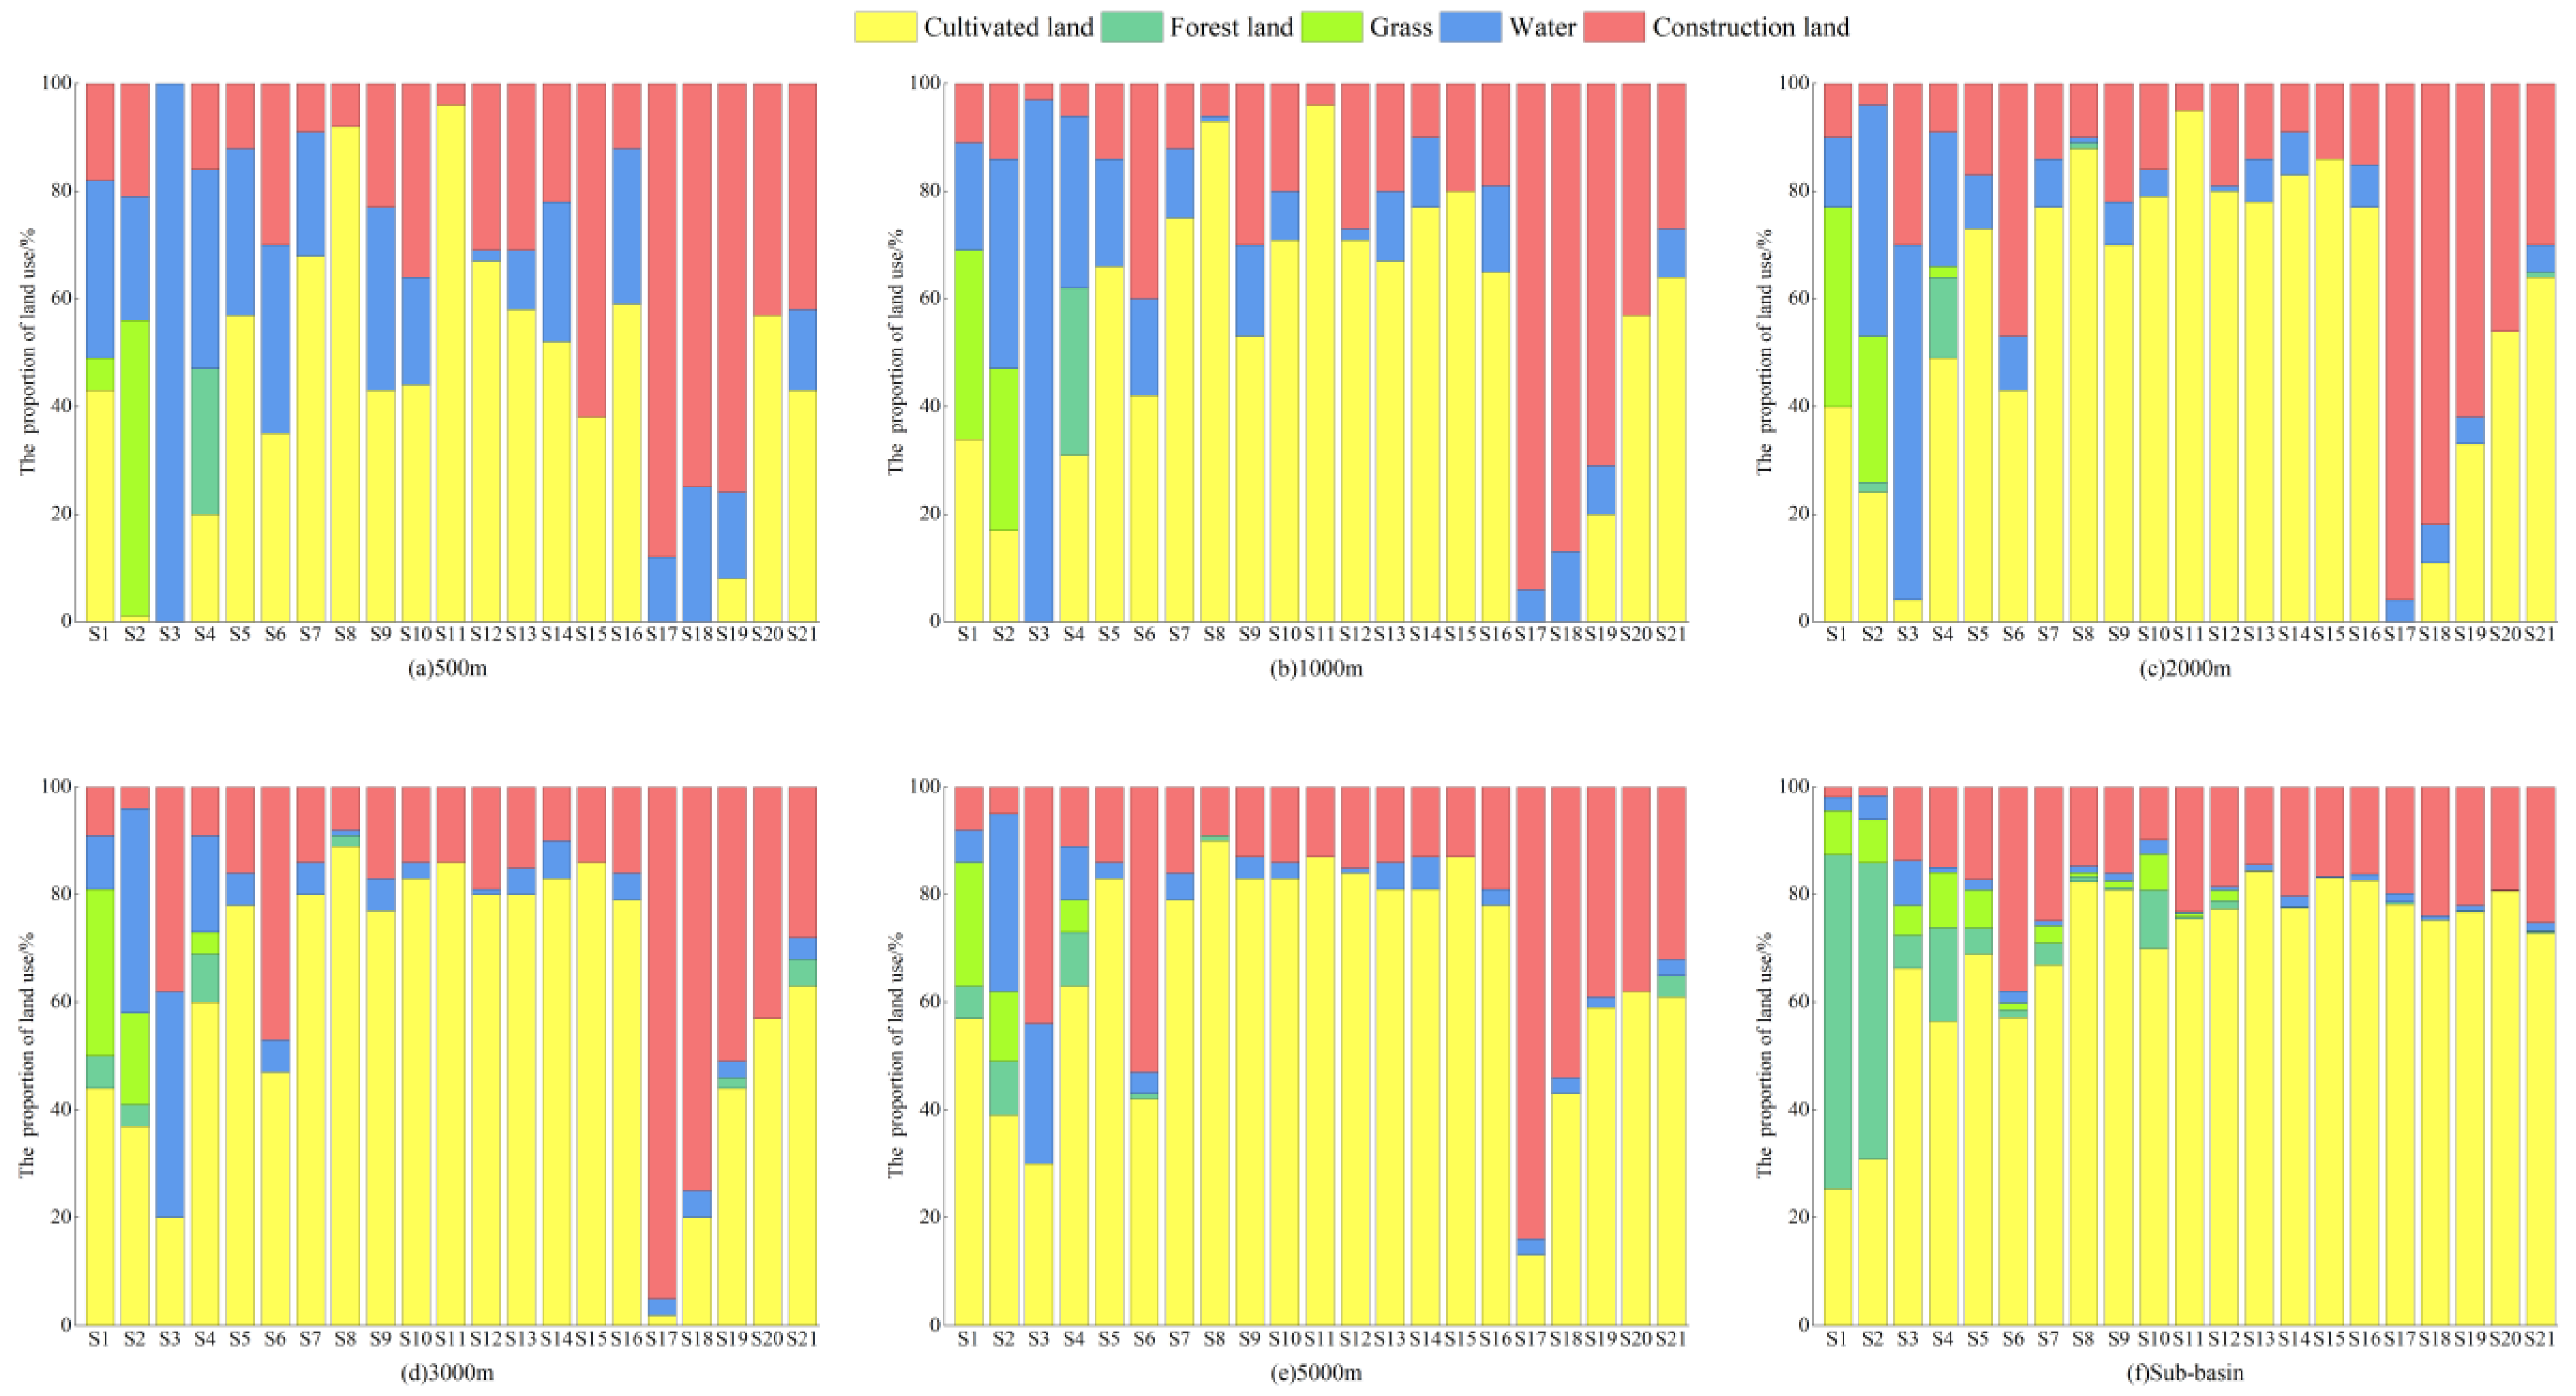
The results of buffer zone division at different scales are shown in Figure 5. As a whole, the land use categories of the Shaying River Basin are mainly dominated by cultivated land and construction land, with the ratio of the area from large to small ranking as follows: cultivated land > construction land > forest land > grass > water, of which the area of cultivated land accounted for 68.97%, followed by construction land at 18.36%; from a spatial point of view, most of the land use types of the upper reaches of the water are dominated by forest land, grass, and water and a high proportion of cultivated land and construction land in the lower and middle reaches. With the population growing, economic development planning caused a big difference in land use in the basin; from the results of the division of the buffer zone, as the distance of the circular buffer zone expands from 500 m to 5 km, the proportion of cultivated land area and construction land area at each sampling point gradually increases, and the area of forest land, grass, and water decreases.

Figure 5.
Proportion of area of different land use types in buffer zones at different scales.
3.2.2. Determination of the Optimal Buffer
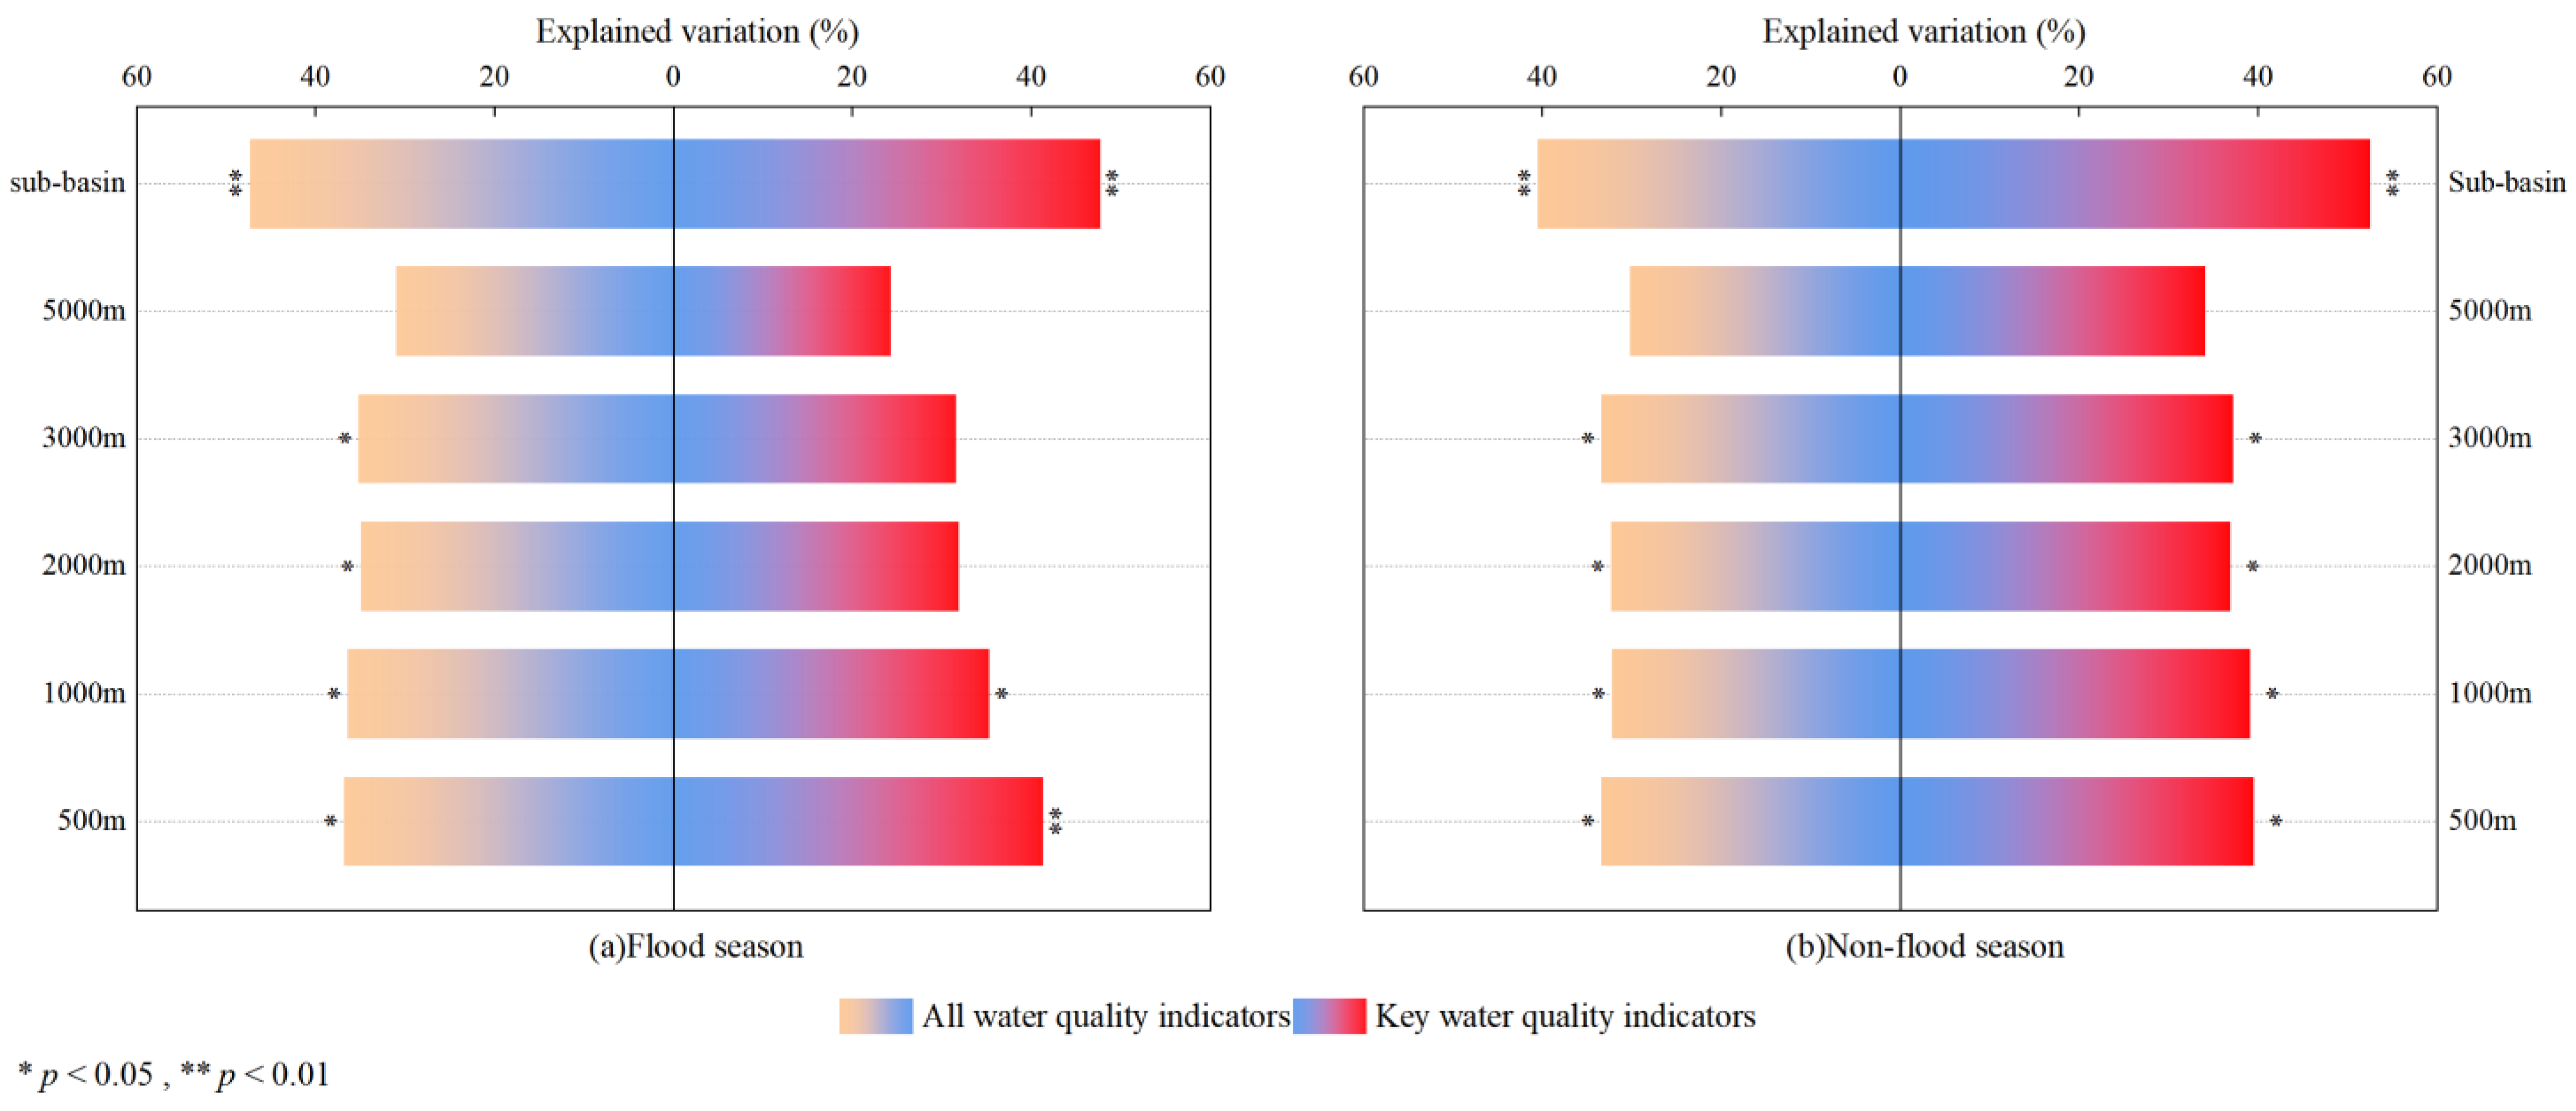
To determine the most effective response scale of land use on water quality in different periods, a redundancy analysis was conducted on key water quality indicators and land use patterns across various buffer scales. The results, presented in Table 3, show that the explanatory degree for these scales ranged from 24.2% to 47.6% during the flood season and from 34% to 52.5% in the non-flood season. This suggests that land use patterns significantly influence water quality changes in the sub-basin. Regarding buffer types, within circular buffers, the explanatory power of land use patterns on water quality indicators decreased as buffer distance increased, dropping from 41.2% (p = 0.006) at a 500 m scale to 24.2% (p = 0.282) at a 5 km scale. In contrast, the response degree of land use structures in sub-basin buffer zones showed a more significant impact on water quality indicators, with 47.6% (p = 0.008) during the flood season and 52.5% (p = 0.006) during the non-flood season being recorded. Consequently, the sub-basin buffer zone was identified as the optimal scale for analyzing the impact of land use on water quality.
Table 3.
Degree of land use interpretation of water quality at different scales.
3.3. Results of the Optimal PLSR Model
Table 4 presents the results of the optimal PLSR model analyzing the impact of land use on water quality at the sub-basin scale across different periods. During the flood season, the model extracted one to two principal components, demonstrating that land use accounted for 71.7% to 85.8% of the variation in water quality indicators. Tur showed the highest explanation rate (R2 = 0.858), followed by DO, NH3-N, and TP. The model exhibited strong predictive capabilities, particularly for NH3-N (Q2 = 0.742) and then TP, Tur, and DO. In the non-flood season, the extraction of two to three principal components led to R2 and Q2 values above 0.8 for NH3-N, CODMn, and EC. This indicates that the optimal PLSR model for key water quality indicators during the non-flood season has superior explanatory and predictive abilities compared to the model established for the flood season.
Table 4.
Optimal PLSR modeling of land use on water quality indicators for different periods.
The RC and VIP in the PLSR model reflect the extent to which land use affects the water quality indicators, which are detailed in Table 5 for each water quality indicator for different time periods. During the flood season, most indicators showed a positive correlation with cultivated and building lands. Notably, cultivated land was a key variable impacting NH3-N, TP, and Tur. Forest land, grasslands, and water bodies displayed consistent correlations with these indicators, with them being positively correlated with DO and negatively correlated with others. In the non-flood season, each water quality indicator had a positive correlation with cultivated and construction lands but a negative correlation with forest lands and water bodies. Key variables influencing NH3-N changes were construction land and grasslands. The most impactful variables on CODMn were cultivated land, construction land, and water, while those on EC were cultivated land, grasslands, and water. Overall, the key variables in the optimal model were similar in both flood and non-flood seasons, with cultivated land, grasslands, and construction land significantly affecting the water quality indicators during different periods.
Table 5.
Regression coefficients of the optimal PLSR model for different periods.
4. Discussion
4.1. Drivers of Water Quality Changes
Different indicators significantly impacted the WQI changes in the basin across various periods. During the flood season, DO, with a mean square error percentage increase of 25%, was the most influential. DO is a crucial factor in biochemical reactions that occur in water bodies. It reflects the self-purification ability of the water and serves as a key indicator of surface water quality [58,59,60]. DO changes are primarily affected by water temperature. In the flood season, rising temperatures enhance biological activities and nutrient chemical reactions, reducing water’s oxygen solubility.
In the non-flood season, NH3-N had the greatest impact, with a mean square error percentage increase of 21.27%. NH3-N and TP are principal indicators of nutrient levels, crucial for algae growth and significantly influenced by human activities, including domestic and industrial wastewater discharge and agricultural fertilizer loss [61,62]. Tur, indicating suspended matter, affects aquatic plant photosynthesis and animal foraging, promotes microorganism propagation, and increases water quality deterioration risk [63]. CODMn has emerged as a primary surface water quality exceedance indicator in China (https://www.mee.gov.cn/, accessed on 15 October 2023), reflecting organic matter contamination [64] and sharing sources similar to NH3-N and TP [39,65]. EC measures water’s ionic concentration, with higher values indicating increased dissolved nutrients and potential algal bloom outbreaks [39,66].
Figure 6 shows the comparison between land use structure and all key water quality indicators. The explanatory degree of land use for all water quality indicators ranged from 31.1% to 47.5% in the flood season and from 30.3% to 40.6% in the non-flood season, while for the key indicators, it ranged from 24.2% to 47.6% and from 34% to 52.5%, respectively. Overall, the land use pattern in the sub-basin scales responded more effectively to the key water quality indicators. The Random Forest Model analysis also indicated that the selected key indicators, covering both physical and chemical aspects, aptly represent the basin’s water quality changes.
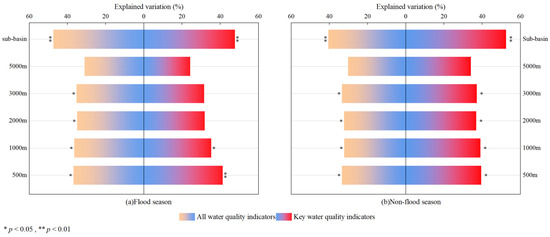
Figure 6.
Land use and the degree of interpretation of water quality indicators under different scenarios.
4.2. Rationality of Buffer Zone Delineation
The impacts of land use on river water quality across various basin scales are influenced by distinct environmental factors, including land use structure, topography and geomorphology, climate, and soil physico-chemical properties. This study employed redundancy analysis to quantify the spatial relationship between land use and river water quality. It was found that land use at the sub-basin scale offered the highest explanatory rate for water quality changes, accounting for 47.6% during the flood season and 52.5% in the non-flood season. These findings align with those observed in the Three Gorges Reservoir Area in China and the Sarapuí River [21,67]. Under smaller-scale buffers, the land use structure tends to be more homogeneous, and the proportion of forest and grassland within these buffers is relatively low. This homogeneity often renders the relationship between land use patterns and water quality status less clear. As the smallest hydrological unit, the sub-basin comprehensively incorporates upstream catchment influences, thereby addressing the uncertainty associated with the impact of individual land types on water quality.
4.3. Management Advice
This study highlights the impact of land use on river water quality in different seasons [22,68]. The findings show that during the non-flood season, the explanatory rate of water quality by land use structure was higher than in the flood season (Table 4). Additionally, the R2 and Q2 values from the PLSR model of water quality indicators were greater in the non-flood season, indicating a stronger explanation and prediction of water quality indicators by land use during this period (Table 5). This could be attributed to lower rainfall and runoff in the non-flood season [69], making human activities the primary influencing factors. As a comprehensive product of human activities, including agriculture, irrigation, and domestic and industrial wastewater discharge, land use significantly impacts water quality in the non-flood season. Therefore, controling water environment interference from human activities is crucial during this period. In the flood season, the regression relationship between cultivated land and water quality was more pronounced, with cultivated land being a key variable affecting NH3-N, TP, and Tur, all with regression coefficients above 0.2. This is likely due to surface runoff from heavy rainfall, which transports unabsorbed nutrients and chemicals from crops into rivers, degrading water quality [70,71]. The relatively large area of cultivated land and construction land in the Shaying River Basin negatively affects the water quality, while grass and forest land have a purifying effect on water quality and contribute more to water quality changes at the sub-basin scale. We suggest limiting the area of cultivated land and construction land, taking measures such as returning farmland to grassland and forest, and making full use of the root system and understory vegetation to trap pollutants in the water body. The results of the study show a stronger correlation between land use and water quality during the non-flood season, with human activities being the main factor; thus, measures such as conservation tillage as well as precise fertilizer application can be used to reduce the output of pollutants from farmland while improving the regulation of industrial and domestic wastewater discharge.
5. Conclusions
This paper focuses on the Shaying River, a key tributary of the Huai River Basin, and establishes six buffer scales to study the impact of land use patterns on surface water quality. Utilizing 2020 remote sensing land use classification data and a water quality dataset, the following conclusions were drawn:
- (1)
- Water quality indicators in the basin exhibit pronounced seasonal variations. The quality is poorer during the flood season compared to the non-flood season, with a gradual deterioration from upstream to downstream. This suggests that the hydrological period and location at the river flow significantly influence the water quality. Enhancing water environment management at controlled sample sites is recommended. According to Random Forest screening, the key water quality indicators are DO, NH3-N, TP, and Tur for the flood season and NH3-N, CODMn, and EC for the non-flood season.
- (2)
- The Shaying River Basin’s land use is primarily composed of cultivated and construction lands. The redundancy analysis results indicate that the land use at the sub-basin buffer scale most effectively explains water quality changes in both seasons, making it the optimal scale for assessing land use impacts on basin water quality.
- (3)
- The optimal PLSR model findings highlight that cultivated land, construction land, and grasslands significantly impact river water quality. The optimal PLSR model for the non-flood season demonstrates superior predictive and explanatory abilities. Most water quality indicators show a positive correlation with cultivated and construction lands, while forest land, water, and grasslands correlate positively with DO and negatively with other indicators.
Supplementary Materials
The following supporting information can be downloaded at: https://www.mdpi.com/article/10.3390/w16030420/s1. Table S1: Correlation of land use types in buffer zones at different scales.
Author Contributions
Conceptualization, X.Z.; methodology, X.Z.; software, X.Z.; validation, X.Z. and M.W.; formal analysis, X.Z. and M.W.; investigation, M.W.; resources, M.W.; data curation, M.W.; writing—original draft preparation, X.Z.; writing—review and editing, P.L.; visualization, P.L. and H.L.; supervision, Y.W.; project administration, Q.L.; funding acquisition, M.W. All authors have read and agreed to the published version of the manuscript.
Funding
This work was supported by the National Natural Science Foundation of China (No. 51909091, No. 51979107, and No. 52209018), the Science and Technology Projects of Water Resources Department of Henan Province, China (GG202332 and GG202334), the China Scholarship Council (No. 202108410234), and the North China University of Water Resources and Electric Power Innovation Ability Improvement Project for Postgraduates (NCWUYC-2023027).
Data Availability Statement
The original contributions presented in the study are included in the article/supplementary material, further inquiries can be directed to the corresponding author.
Conflicts of Interest
Authors Maofeng Weng, Pujian Li, and Hongxue Liu are employed by the company Northwest Engineering Corporation Limited, Power China. The remaining authors declare that the research was conducted in the absence of any commercial or financial relationships that could be construed as a potential conflict of interest.
References
- Peng, S.; Li, S. Scale relationship between landscape pattern and water quality in different pollution source areas: A case study of the Fuxian Lake watershed, China. Ecol. Indic. 2021, 121, 107136. [Google Scholar] [CrossRef]
- Xu, S.; Li, S.-L.; Zhong, J.; Li, C. Spatial scale effects of the variable relationships between landscape pattern and water quality: Example from an agricultural karst river basin, Southwestern China. Agric. Ecosyst. Environ. 2020, 300, 106999. [Google Scholar] [CrossRef]
- Naderian, D.; Noori, R.; Heggy, E.; Bateni, S.M.; Bhattarai, R.; Nohegar, A.; Sharma, S. A water quality database for global lakes. Resour. Conserv. Recycl. 2024, 202, 107401. [Google Scholar] [CrossRef]
- Boretti, A.; Rosa, L. Reassessing the projections of the world water development report. NPJ Clean Water 2019, 2, 15. [Google Scholar] [CrossRef]
- Liu, Y.; Li, H.; Cui, G.; Cao, Y. Water quality attribution and simulation of non-point source pollution load flux in the Hulan River basin. Sci. Rep. 2020, 10, 3012. [Google Scholar] [CrossRef] [PubMed]
- Wang, W.; Liu, X.; Wang, Y.; Guo, X.; Lu, S. Analysis of point source pollution and water environmental quality variation trends in the Nansi Lake basin from 2002 to 2012. Environ. Sci. Pollut. Res. 2016, 23, 4886–4897. [Google Scholar] [CrossRef]
- Wan, H.; Xu, R.; Zhang, M.; Cai, Y.; Li, J.; Shen, X. A novel model for water quality prediction caused by non-point sources pollution based on deep learning and feature extraction methods. J. Hydrol. 2022, 612, 128081. [Google Scholar] [CrossRef]
- Wang, S.; Wang, Y.; Wang, Y.; Wang, Z. Assessment of influencing factors on non-point source pollution critical source areas in an agricultural watershed. Ecol. Indic. 2022, 141, 109084. [Google Scholar] [CrossRef]
- Gu, Q.; Hu, H.; Ma, L.; Sheng, L.; Yang, S.; Zhang, X.; Zhang, M.; Zheng, K.; Chen, L. Characterizing the spatial variations of the relationship between land use and surface water quality using self-organizing map approach. Ecol. Indic. 2019, 102, 633–643. [Google Scholar] [CrossRef]
- de Oliveira, L.M.; Maillard, P.; de Andrade Pinto, E.J. Application of a land cover pollution index to model non-point pollution sources in a Brazilian watershed. Catena 2017, 150, 124–132. [Google Scholar] [CrossRef]
- Xu, G.; Li, P.; Lu, K.; Tantai, Z.; Zhang, J.; Ren, Z.; Wang, X.; Yu, K.; Shi, P.; Cheng, Y. Seasonal changes in water quality and its main influencing factors in the Dan River basin. Catena 2019, 173, 131–140. [Google Scholar] [CrossRef]
- Ding, J.; Jiang, Y.; Liu, Q.; Hou, Z.; Liao, J.; Fu, L.; Peng, Q. Influences of the land use pattern on water quality in low-order streams of the Dongjiang River basin, China: A multi-scale analysis. Sci. Total Environ. 2016, 551, 205–216. [Google Scholar] [CrossRef] [PubMed]
- Yang, Z.; Zou, L.; Xia, J.; Qiao, Y.; Bai, F.; Wang, Q.; Cai, D. Spatiotemporal variation characteristics and source identification of water pollution: Insights from urban water system. Ecol. Indic. 2022, 139, 108892. [Google Scholar] [CrossRef]
- Li, K.; Chi, G.; Wang, L.; Xie, Y.; Wang, X.; Fan, Z. Identifying the critical riparian buffer zone with the strongest linkage between landscape characteristics and surface water quality. Ecol. Indic. 2018, 93, 741–752. [Google Scholar] [CrossRef]
- Nafi’Shehab, Z.; Jamil, N.R.; Aris, A.Z.; Shafie, N.S. Spatial variation impact of landscape patterns and land use on water quality across an urbanized watershed in Bentong, Malaysia. Ecol. Indic. 2021, 122, 107254. [Google Scholar]
- Li, Y.; Yen, H.; Lei, Q.; Qiu, W.; Luo, J.; Lindsey, S.; Qin, L.; Zhai, L.; Wang, H.; Wu, S. Impact of human activities on phosphorus flows on an early eutrophic plateau: A case study in Southwest China. Sci. Total Environ. 2020, 714, 136851. [Google Scholar] [CrossRef] [PubMed]
- Duan, M.; Du, X.; Peng, W.; Jiang, C.; Zhang, S.; Ding, Y. Quantitative assessment of background pollutants using a modified method in data-poor regions. Environ. Monit. Assess. 2020, 192, 160. [Google Scholar] [CrossRef]
- Wu, J.; Lu, J. Spatial scale effects of landscape metrics on stream water quality and their seasonal changes. Water Res. 2021, 191, 116811. [Google Scholar] [CrossRef]
- Xu, Q.; Wang, P.; Shu, W.; Ding, M.; Zhang, H. Influence of landscape structures on river water quality at multiple spatial scales: A case study of the Yuan river watershed, China. Ecol. Indic. 2021, 121, 107226. [Google Scholar] [CrossRef]
- Deng, X. Influence of water body area on water quality in the southern Jiangsu Plain, eastern China. J. Clean. Prod. 2020, 254, 120136. [Google Scholar] [CrossRef]
- Zhang, J.; Li, S.; Dong, R.; Jiang, C.; Ni, M. Influences of land use metrics at multi-spatial scales on seasonal water quality: A case study of river systems in the Three Gorges Reservoir Area, China. J. Clean. Prod. 2019, 206, 76–85. [Google Scholar] [CrossRef]
- Shi, P.; Zhang, Y.; Li, Z.; Li, P.; Xu, G. Influence of land use and land cover patterns on seasonal water quality at multi-spatial scales. Catena 2017, 151, 182–190. [Google Scholar] [CrossRef]
- Wang, Y.-B.; Junaid, M.; Deng, J.-Y.; Tang, Q.-P.; Luo, L.; Xie, Z.-Y.; Pei, D.-S. Effects of land-use patterns on seasonal water quality at multiple spatial scales in the Jialing River, Chongqing, China. Catena 2024, 234, 107646. [Google Scholar] [CrossRef]
- Xu, J.; Liu, R.; Ni, M.; Zhang, J.; Ji, Q.; Xiao, Z. Seasonal variations of water quality response to land use metrics at multi-spatial scales in the Yangtze River basin. Environ. Sci. Pollut. Res. 2021, 28, 37172–37181. [Google Scholar] [CrossRef]
- Li, H.-H.; Huang, Y.-M.; Guo, W.; Hou, H.-Y.; Fan, M.-Y.; Qi, X.-P.; Jia, P.-H.; Guo, Q.-B. Influence of land use and land cover patterns on water quality at different spatio-temporal scales in Hehuang Valley. Huan Jing Ke Xue = Huanjing Kexue 2022, 43, 4042–4053. [Google Scholar] [PubMed]
- Wang, S.; Xu, Y.; Wang, D.; Gao, B.; Lu, M.; Wang, Q. Effects of industry structures on water quality in different urbanized regions using an improved entropy-weighted matter-elementmethodology. Environ. Sci. Pollut. Res. 2020, 27, 7549–7558. [Google Scholar] [CrossRef] [PubMed]
- Kändler, M.; Blechinger, K.; Seidler, C.; Pavlů, V.; Šanda, M.; Dostál, T.; Krása, J.; Vitvar, T.; Štich, M. Impact of land use on water quality in the upper Nisa catchment in the Czech Republic and in Germany. Sci. Total Environ. 2017, 586, 1316–1325. [Google Scholar] [CrossRef] [PubMed]
- Yang, H.; Wang, G.; Wang, L.; Zheng, B. Impact of land use changes on water quality in headwaters of the Three Gorges Reservoir. Environ. Sci. Pollut. Res. 2016, 23, 11448–11460. [Google Scholar] [CrossRef] [PubMed]
- Yan, T.; Bai, J.; Arsenio, T.; Liu, J.; Shen, Z. Future climate change impacts on streamflow and nitrogen exports based on CMIP5 projection in the Miyun Reservoir Basin, China. Ecohydrol. Hydrobiol. 2019, 19, 266–278. [Google Scholar] [CrossRef]
- Messina, N.J.; Couture, R.-M.; Norton, S.A.; Birkel, S.D.; Amirbahman, A. Modeling response of water quality parameters to land-use and climate change in a temperate, mesotrophic lake. Sci. Total Environ. 2020, 713, 136549. [Google Scholar] [CrossRef] [PubMed]
- Marmontel, C.V.F.; Lucas-Borja, M.E.; Rodrigues, V.A.; Zema, D.A. Effects of land use and sampling distance on water quality in tropical headwater springs (Pimenta creek, São Paulo State, Brazil). Sci. Total Environ. 2018, 622, 690–701. [Google Scholar] [CrossRef]
- Luo, Z.; Shao, Q.; Zuo, Q.; Cui, Y. Impact of land use and urbanization on river water quality and ecology in a dam dominated basin. J. Hydrol. 2020, 584, 124655. [Google Scholar] [CrossRef]
- Mahdian, M.; Hosseinzadeh, M.; Siadatmousavi, S.; Chalipa, Z.; Delavar, M.; Guo, M.; Abolfathi, S.; Noori, R. Modelling impacts of climate change and anthropogenic activities on inflows and sediment loads of wetlands: Case study of the Anzali wetland. Sci. Rep. 2023, 13, 5399. [Google Scholar] [CrossRef]
- Wang, M.; Wang, Y.; Li, Y.; Liu, X.; Liu, J.; Wu, J. Natural and anthropogenic determinants of riverine phosphorus concentration and loading variability in subtropical agricultural catchments. Agric. Ecosyst. Environ. 2020, 287, 106713. [Google Scholar] [CrossRef]
- Meng, C.; Liu, H.; Li, Y.; Wang, Y.; Li, X.; Shen, J.; Gong, D.; Zhang, M.; Wu, J. Landscape patterns of catchment and land-use regulate legacy phosphorus releases in subtropical mixed agricultural and woodland catchments. Sci. Total Environ. 2022, 804, 150055. [Google Scholar] [CrossRef] [PubMed]
- Ma, B.; Wu, C.; Jia, X.; Zhang, Y.; Zhou, Z. Predicting Water Quality using Partial Least Squares Regression of Land Use and Morphology (Danjiangkou Reservoir, China). J. Hydrol. 2023, 129828. [Google Scholar] [CrossRef]
- Li, N.; Xu, J.; Yin, W.; Chen, Q.; Wang, J.; Shi, Z. Effect of local watershed landscapes on the nitrogen and phosphorus concentrations in the waterbodies of reservoir bays. Sci. Total Environ. 2020, 716, 137132. [Google Scholar] [CrossRef] [PubMed]
- Luo, Z.; Zhang, S.; Liu, H.; Wang, L.; Wang, S.; Wang, L. Assessment of multiple dam-and sluice-induced alterations in hydrologic regime and ecological flow. J. Hydrol. 2023, 617, 128960. [Google Scholar] [CrossRef]
- Wang, L.; Han, X.; Zhang, Y.; Zhang, Q.; Wan, X.; Liang, T.; Song, H.; Bolan, N.; Shaheen, S.M.; White, J.R. Impacts of land uses on spatio-temporal variations of seasonal water quality in a regulated river basin, Huai River, China. Sci. Total Environ. 2023, 857, 159584. [Google Scholar] [CrossRef] [PubMed]
- Dou, M.; Yu, L.; Jin, M. Study on relationship between box dimension and connectivity of river system in Huaihe River Basin. J. Hydraul. Eng 2019, 50, 670–678. [Google Scholar]
- Ding, T.-T.; Du, S.-L.; Huang, Z.-Y.; Wang, Z.-J.; Zhang, J.; Zhang, Y.-H.; Liu, S.-S.; He, L.-S. Water quality criteria and ecological risk assessment for ammonia in the Shaying River Basin, China. Ecotoxicol. Environ. Saf. 2021, 215, 112141. [Google Scholar] [CrossRef]
- Hao, M.; Zuo, Q.; Li, J.; Shi, S.; Li, B.; Zhao, X. A comprehensive exploration on distribution, risk assessment, and source quantification of heavy metals in the multi-media environment from Shaying River Basin, China. Ecotoxicol. Environ. Saf. 2022, 231, 113190. [Google Scholar] [CrossRef]
- He, B.; He, J.; Wang, L.; Zhang, X.; Bi, E. Effect of hydrogeological conditions and surface loads on shallow groundwater nitrate pollution in the Shaying River Basin: Based on least squares surface fitting model. Water Res. 2019, 163, 114880. [Google Scholar] [CrossRef] [PubMed]
- Tian, Y.; Jiang, Y.; Liu, Q.; Dong, M.; Xu, D.; Liu, Y.; Xu, X. Using a water quality index to assess the water quality of the upper and middle streams of the Luanhe River, northern China. Sci. Total Environ. 2019, 667, 142–151. [Google Scholar] [CrossRef] [PubMed]
- Wu, Z.; Wang, X.; Chen, Y.; Cai, Y.; Deng, J. Assessing river water quality using water quality index in Lake Taihu Basin, China. Sci. Total Environ. 2018, 612, 914–922. [Google Scholar] [CrossRef] [PubMed]
- GB 3838-2002; Environmental Quality Standards for Surface Water. State Environmental Protection Administration of China; Standards Press of China: Beijing, China, 2002.
- Pesce, S.F.; Wunderlin, D.A. Use of water quality indices to verify the impact of Córdoba City (Argentina) on Suquía River. Water Res. 2000, 34, 2915–2926. [Google Scholar] [CrossRef]
- Breiman, L. Random forests. Mach. Learn. 2001, 45, 5–32. [Google Scholar] [CrossRef]
- Chen, K.; Chen, H.; Zhou, C.; Huang, Y.; Qi, X.; Shen, R.; Liu, F.; Zuo, M.; Zou, X.; Wang, J. Comparative analysis of surface water quality prediction performance and identification of key water parameters using different machine learning models based on big data. Water Res. 2020, 171, 115454. [Google Scholar] [CrossRef] [PubMed]
- Fang, X.; Li, X.; Zhang, Y.; Zhao, Y.; Qian, J.; Hao, C.; Zhou, J.; Wu, Y. Random forest-based understanding and predicting of the impacts of anthropogenic nutrient inputs on the water quality of a tropical lagoon. Environ. Res. Lett. 2021, 16, 055003. [Google Scholar] [CrossRef]
- Wang, F.; Wang, Y.; Zhang, K.; Hu, M.; Weng, Q.; Zhang, H. Spatial heterogeneity modeling of water quality based on random forest regression and model interpretation. Environ. Res. 2021, 202, 111660. [Google Scholar] [CrossRef]
- Wang, H.; Xiong, X.; Wang, K.; Li, X.; Hu, H.; Li, Q.; Yin, H.; Wu, C. The effects of land use on water quality of alpine rivers: A case study in Qilian Mountain, China. Sci. Total Environ. 2023, 875, 162696. [Google Scholar] [CrossRef]
- Wen, J.-W.; Wang, P.; Huang, G.-X.; Zhang, H.; Nie, M.-H.; Ding, M.-J.; She, Y.-Y. Influence of Land Use Structure and Spatial Pattern on Water Quality of Small and Medium-sized Rivers in Poyang Lake Basin. Huan Jing Ke Xue = Huanjing Kexue 2023, 44, 6728–6743. [Google Scholar]
- Shen, Z.; Hou, X.; Li, W.; Aini, G.; Chen, L.; Gong, Y. Impact of landscape pattern at multiple spatial scales on water quality: A case study in a typical urbanised watershed in China. Ecol. Indic. 2015, 48, 417–427. [Google Scholar] [CrossRef]
- Wu, J.; Jin, Y.; Hao, Y.; Lu, J. Identification of the control factors affecting water quality variation at multi-spatial scales in a headwater watershed. Environ. Sci. Pollut. Res. 2021, 28, 11129–11141. [Google Scholar] [CrossRef]
- Cheng, P.; Meng, F.; Wang, Y.; Zhang, L.; Yang, Q.; Jiang, M. The impacts of land use patterns on water quality in a trans-boundary river basin in northeast China based on eco-functional regionalization. Int. J. Environ. Res. Public Health 2018, 15, 1872. [Google Scholar] [CrossRef] [PubMed]
- Huang, J.; Huang, Y.; Zhang, Z. Coupled effects of natural and anthropogenic controls on seasonal and spatial variations of river water quality during baseflow in a coastal watershed of Southeast China. PLoS ONE 2014, 9, e91528. [Google Scholar] [CrossRef] [PubMed]
- Pan, B.; Han, X.; Chen, Y.; Wang, L.; Zheng, X. Determination of key parameters in water quality monitoring of the most sediment-laden Yellow River based on water quality index. Process Saf. Environ. Prot. 2022, 164, 249–259. [Google Scholar] [CrossRef]
- Salmasi, F.; Abraham, J.; Salmasi, A. Effect of stepped spillways on increasing dissolved oxygen in water, an experimental study. J. Environ. Manag. 2021, 299, 113600. [Google Scholar] [CrossRef] [PubMed]
- Wu, T.; Wang, S.; Su, B.; Wu, H.; Wang, G. Understanding the water quality change of the Yilong Lake based on comprehensive assessment methods. Ecol. Indic. 2021, 126, 107714. [Google Scholar] [CrossRef]
- Dong, B.; Qin, T.; Wang, Y.; Zhao, Y.; Liu, S.; Feng, J.; Li, C.; Zhang, X. Spatiotemporal variation of nitrogen and phosphorus and its main influencing factors in Huangshui River basin. Environ. Monit. Assess. 2021, 193, 292. [Google Scholar] [CrossRef] [PubMed]
- Jiang, Q.; Wang, B.; Jin, G.; Tang, H.; Xu, J.; Zhu, X. The response patterns of riverbank to the components carried by different pollution sources in the river: Experiments and models. J. Hydrol. 2023, 617, 128903. [Google Scholar] [CrossRef]
- Lunt, J.; Smee, D.L. Turbidity alters estuarine biodiversity and species composition. ICES J. Mar. Sci. 2020, 77, 379–387. [Google Scholar] [CrossRef]
- Wang, C.; Zhang, H.; Lei, P.; Xin, X.; Zhang, A.; Yin, W. Evidence on the causes of the rising levels of CODMn along the middle route of the South-to-North Diversion Project in China: The role of algal dissolved organic matter. J. Environ. Sci. 2022, 113, 281–290. [Google Scholar] [CrossRef]
- Wu, J.; Zeng, S.; Yang, L.; Ren, Y.; Xia, J. Spatiotemporal characteristics of the water quality and its multiscale relationship with land use in the Yangtze River Basin. Remote Sens. 2021, 13, 3309. [Google Scholar] [CrossRef]
- Ahmadianfar, I.; Jamei, M.; Chu, X. A novel hybrid wavelet-locally weighted linear regression (W-LWLR) model for electrical conductivity (EC) prediction in surface water. J. Contam. Hydrol. 2020, 232, 103641. [Google Scholar] [CrossRef] [PubMed]
- de Mello, K.; Valente, R.A.; Randhir, T.O.; dos Santos, A.C.A.; Vettorazzi, C.A. Effects of land use and land cover on water quality of low-order streams in Southeastern Brazil: Watershed versus riparian zone. Catena 2018, 167, 130–138. [Google Scholar] [CrossRef]
- Rodrigues, V.; Estrany, J.; Ranzini, M.; de Cicco, V.; Martín-Benito, J.M.T.; Hedo, J.; Lucas-Borja, M.E. Effects of land use and seasonality on stream water quality in a small tropical catchment: The headwater of Córrego Água Limpa, São Paulo (Brazil). Sci. Total Environ. 2018, 622, 1553–1561. [Google Scholar] [CrossRef] [PubMed]
- Zhang, J.; Li, S.; Jiang, C. Effects of land use on water quality in a River Basin (Daning) of the Three Gorges Reservoir Area, China: Watershed versus riparian zone. Ecol. Indic. 2020, 113, 106226. [Google Scholar] [CrossRef]
- Li, X.; Zhang, W.; Zhao, C.; Li, H.; Shi, R. Nitrogen interception and fate in vegetated ditches using the isotope tracer method: A simulation study in northern China. Agric. Water Manag. 2020, 228, 105893. [Google Scholar] [CrossRef]
- Wang, R.; Wang, Q.; Dong, L.; Zhang, J. Cleaner agricultural production in drinking-water source areas for the control of non-point source pollution in China. J. Environ. Manag. 2021, 285, 112096. [Google Scholar] [CrossRef]
Disclaimer/Publisher’s Note: The statements, opinions and data contained in all publications are solely those of the individual author(s) and contributor(s) and not of MDPI and/or the editor(s). MDPI and/or the editor(s) disclaim responsibility for any injury to people or property resulting from any ideas, methods, instructions or products referred to in the content. |
© 2024 by the authors. Licensee MDPI, Basel, Switzerland. This article is an open access article distributed under the terms and conditions of the Creative Commons Attribution (CC BY) license (https://creativecommons.org/licenses/by/4.0/).