Article

Debating the Rules: An Experimental Approach to Assess Cyprinid Passage Performance Thresholds in Vertical Slot Fishways

by
Filipe Romão
1,*,
Ana L. Quaresma
1,
Joana Simão
2,
Francisco J. Bravo-Córdoba
3,
Teresa Viseu
2,
José M. Santos
4,*,
Francisco J. Sanz-Ronda
5 and
António N. Pinheiro
1
1
CERIS—Civil Engineering for Research and Innovation for Sustainability, Instituto Superior Técnico, University of Lisbon, Av. Rovisco Pais, 1049-001 Lisbon, Portugal
2
LNEC—National Laboratory for Civil Engineering, Hydraulics and Environment Department, Water Resources and Hydraulic Structures, Av. do Brasil 101, 1700-066 Lisbon, Portugal
3
GEA-Ecohidráulica, Centro Tecnológico Agrario y Agroalimentario Itagra.ct, 34004 Palencia, Spain
4
CEF—Forest Research Centre, Associate Laboratory TERRA, School of Agriculture, University of Lisbon, Tapada da Ajuda, 1349-017 Lisbon, Portugal
5
GEA-Ecohidráulica, Area of Hydraulics and Hydrology, Department of Agroforestry Engineering, University of Valladolid, 34004 Palencia, Spain
*
Authors to whom correspondence should be addressed.
Water 2024, 16(3), 439; https://doi.org/10.3390/w16030439
Submission received: 4 December 2023 / Revised: 19 January 2024 / Accepted: 24 January 2024 / Published: 29 January 2024

Abstract

:
Throughout the world, emerging barriers in river systems block longitudinal connectivity for migrating fish, causing significant impacts by precluding them from carrying out vital life cycle activities. Fishways are still the main mitigation solution implemented, where barrier removal is not feasible. Within the multiple technical fish passage devices, the vertical slot fishway (VSF) is considered the most reliable. Early design guidelines, established for cyprinids, indicate that the volumetric dissipation power (Pv) in the pools should be Pv < 150 Wm−3, while most frequent slope values range from 10 to 12%. In this study, an experimental approach was conducted to question and debate the validity of these recommendations. For this, the Iberian barbel (Luciobarbus bocagei, Steindachner, 1864) passage performance was assessed in a full-scale fishway that exceeded Pv design guidelines, under different configurations. These varied in discharge (Q) and mean pool water depth (hm): VSF1 (Q = 81 Ls−1; hm = 0.55 m); VSF2 (Q = 110 Ls−1; hm = 0.80 m); and the same design was equipped with a deep notch: DN1 (Q = 71 Ls−1; hm = 0.55 m); DN2 (Q = 99 Ls−1; hm = 0.80 m). The slope was set to 15.2% while the head drop per pool was Δh = 0.28 m, which generated a Pv that ranged from 222 in VSF1 to 187 Wm−3 in DN2. Passage behaviour was assessed using PIT telemetry and time-to-event analysis to evaluate the barbel upstream passage using standardized metrics: (i) motivation (ii) ascend success, and (iii) transit time. The hydrodynamic scenarios experienced by fish were characterized through a numerical model using computational fluid dynamics (CFD). The results, contrary to what was expected, showed a higher performance in VSF1 confirmed by the ascent analysis and transit time. Although no differences were found in fish motivation, the results indicate that larger fish displayed lower times to perform the first passage attempt. The CFD results show that, although maximum velocities and turbulence (turbulent kinetic energy (TKE) and Reynolds shear stress (RSS)) do not change significantly between configurations, their distribution in the pools is quite different. Regarding TKE, larger volumes with magnitudes higher than 0.05 m2s−2 were notorious in both DN1 and DN2 configurations compared to VSF1, influencing passage efficiency which is in line with the ascent and transit time metrics results. Overall, the present research undeniably debates the literature design guidelines and reinforces the need to jointly assess species-specific fish passage criteria and fishway hydrodynamics, whereas precaution should be taken when using very general recommendations.

1. Introduction

Globally, the loss of river longitudinal connectivity is an urgent problem with no obvious straightforward solution in sight. Although the concern with obsolete barrier removal has been increasing in the past decade, barriers fragmenting rivers will continue to emerge in the near future, as the water demand is persistently increasing to offset the climate change scenarios and population growth [1,2]. Historically, negative impacts generated by such obstructions on aquatic biota are well documented through multiple spheres [3,4,5,6]. For fish species, the negative consequences are evident by precluding them from moving freely and performing basic life-cycle activities, such as finding appropriate habitats to spawn and searching for food or refuge [7,8]. With no obvious solution, besides barrier removal, which in many cases, is not an option due to fierce competition for water resources and to satisfy several human uses, fishways are the main mitigation solution used to allow a pathway for fish in dammed rivers [9]. Moreover, the re-establishment of river connectivity is currently a paramount goal for European Member States to achieve a good ecological status and thus reduce the environmental impacts of anthropogenic barriers on water bodies, according to the EU Water Framework Directive (WFD; 2000/60/EC) and Nature Restoration Law, a key element of Biodiversity Strategy 2030 [10].
In the early years, the main driver of fish passage research was to ensure safe passage through river barriers for high-priority species, such as anadromous salmonids [11]. This mindset has led to replicating fishway designs around the globe with specific adaptations for salmonids [12], even if the river system had no such species [13,14]. Presently, the paradigm has shifted towards a more holistic approach, where the whole fish community [15], particularly the widespread family of cyprinids, encompassing a variety of ecologies and sizes, and the river basin attributes [16] should be accounted for when planning the restoration of longitudinal connectivity using fish passage devices [17]. Naturally, this incremental progress brought several research gaps to emerge, namely basic eco-hydraulic fundamentals for fish passage effectiveness for numerous species around the world. Furthermore, many of the design principles in fishway construction guidelines, which are still implemented, were derived from straightforward hydraulic simulations in scale models [18,19], where target fish passage experiments were not performed [20,21,22,23]. Currently, by looking at the big picture, researchers are applying efforts to a much more refined scale where several fishway designs are assessed in terms of species-specific passage criteria using laboratory [24] and field experiments [25]. Additionally, new generation technologies are being tested to bridge uncharted fish-specific behaviour patterns under hydrodynamic scenarios to further assist the development of passage devices through hydraulic modelling [23,26], monitoring [27], maintenance [28], and cost-efficient solutions [29].
Amongst the distinct strategies for reconnecting dammed rivers, fish passage devices are a generally well-accepted mitigation tool [12]. Depending on site-specificities and budget constraints, different designs hold the potential to restore fish passageways. Currently, technical fishways, fish lifts, nature-like channels, rock ramps, or even integrated systems are some of the options available [9]. Within the technical types, the Vertical Slot Fishway (VSF) is considered one of the best models because, although they tend to use a high operational discharge, they also offer benefits in terms of fish passage negotiation [24,30], such as the following: (i) fish can swim between adjacent pools at their preferential depth; (ii) they can persist operational even with fluctuations in the up-and-downstream water levels; (iii) they require less maintenance compared to pool-type fishways equipped with orifices and/or notches since they are less prone to clogging due to river debris accumulation.
General recommendations for VSFs suitable for cyprinids indicate a maximum head drop between pools (Δh) of 0.15–0.25 m under streaming flows (being lower for smaller size species), although according to Larinier [21], they can go up to Δh = 0.30 m for fast swimmers such as the barbel (Barbus spp.). The minimum required water depth (hmin) in the pools is 0.50 m and the volumetric dissipated power—a hydraulic descriptor that indicates average pool turbulence (Pv)—should be lower than 150 Wm−3 [21,22,31,32]. The most frequent slope values range from 10 to 12% for small-scale hydropower facilities, while pool length, width, and slot size may vary according to fish dimensions and operational discharge available [33]. Sometimes this type of facility is converted into a deep notch by adding a sill (or small weir) at the base of the slot, which theoretically may provide better guidance and stabilization of the jet, preventing short-circuiting (or by-passing of the dissipation pool) and limiting the flow in the fishway [19,21,34]. According to O’Connors et al. [35], this type of feature may also be installed in the middle of the vertical slot to reduce the operational discharge and to favour smaller species passage.
In light of the current state of the art, this research aimed to assess the hydraulic thresholds set for cyprinids in VSF. Exploring hydraulic thresholds at VSF, namely increasing slope further beyond its usual range, is important because if these devices perform effectively under such hydraulic conditions, they will be less space-demanding and less costly. For this reason, we developed an experimental laboratory approach in a full-scale fishway model, conducting fish trials and computational fluid dynamics (CFD) modelling to characterize the hydrodynamic scenarios. Four VSF configurations installed under a steep slope of 15.2% were analyzed: two VSFs and two VSFs equipped with a Deep Notch (DN), with two different flow discharges and water depths, respectively. The head drop between pools, water depth, and discharge was adjusted to generate a volumetric dissipated power higher than the literature recommendations (Pv > 150 Wm−3) [21,31,36]. The Iberian barbel (Luciobarbus bocagei, Steindachner, 1864) was selected as the target species (hereafter barbel) because it represents Mediterranean potamodromous cyprinids, which currently face serious threats due to river fragmentation [37]. We hypothesized that barbel would display a low passage performance in fishway configurations that exceeds the hydraulic thresholds defined in general recommendations for cyprinids [21,32,36]. Specifically, a time-to-event analysis was adopted to assess the barbel upstream passage performance using standardized metrics [38]: (i) motivation, (ii) ascend success, and (iii) transit time. Additionally, the effect of biometric variables (body length and condition factor, which is a parameter computed from the relationship between the weight and the length of a fish used to describe its condition) on the passage metrics were included as main covariates. The tested configurations’ hydrodynamic parameters, namely velocity and turbulent kinetic energy (TKE) parallel to the bottom component of the Reynolds shear stress (RSS), were assessed.

2. Materials and Methods

2.1. Ethical Note

All proceedings involving fish sampling and handling strictly complied with the European standards (Directive 2010/63/EU) and Portuguese legislation (Decree-Law 113/7 August 2013, article 35, no. 5), transposing the European Directive for animal experimentation (Directive 2010/63/EU). License for capture, transportation, detention, and handling (no. 251/2019/CAPT), as well as the fishing permit (no. 5/2019) was issued by the Portuguese Institute for Nature Conservation and Forests (ICNF). Fish trials and maintenance in the holding facilities at LNEC (see below) were authorized by the Department for Health and Animal Protection (Direção de Serviços de Saúde e Proteção Animal), in accordance with the recommendations of the “protection of animal use for experimental and scientific work”. Fish handling and experimentation were coordinated by J. M. Santos, who holds a FELASA C certification to perform animal experimentation. All procedures were adopted to minimize fish distress.

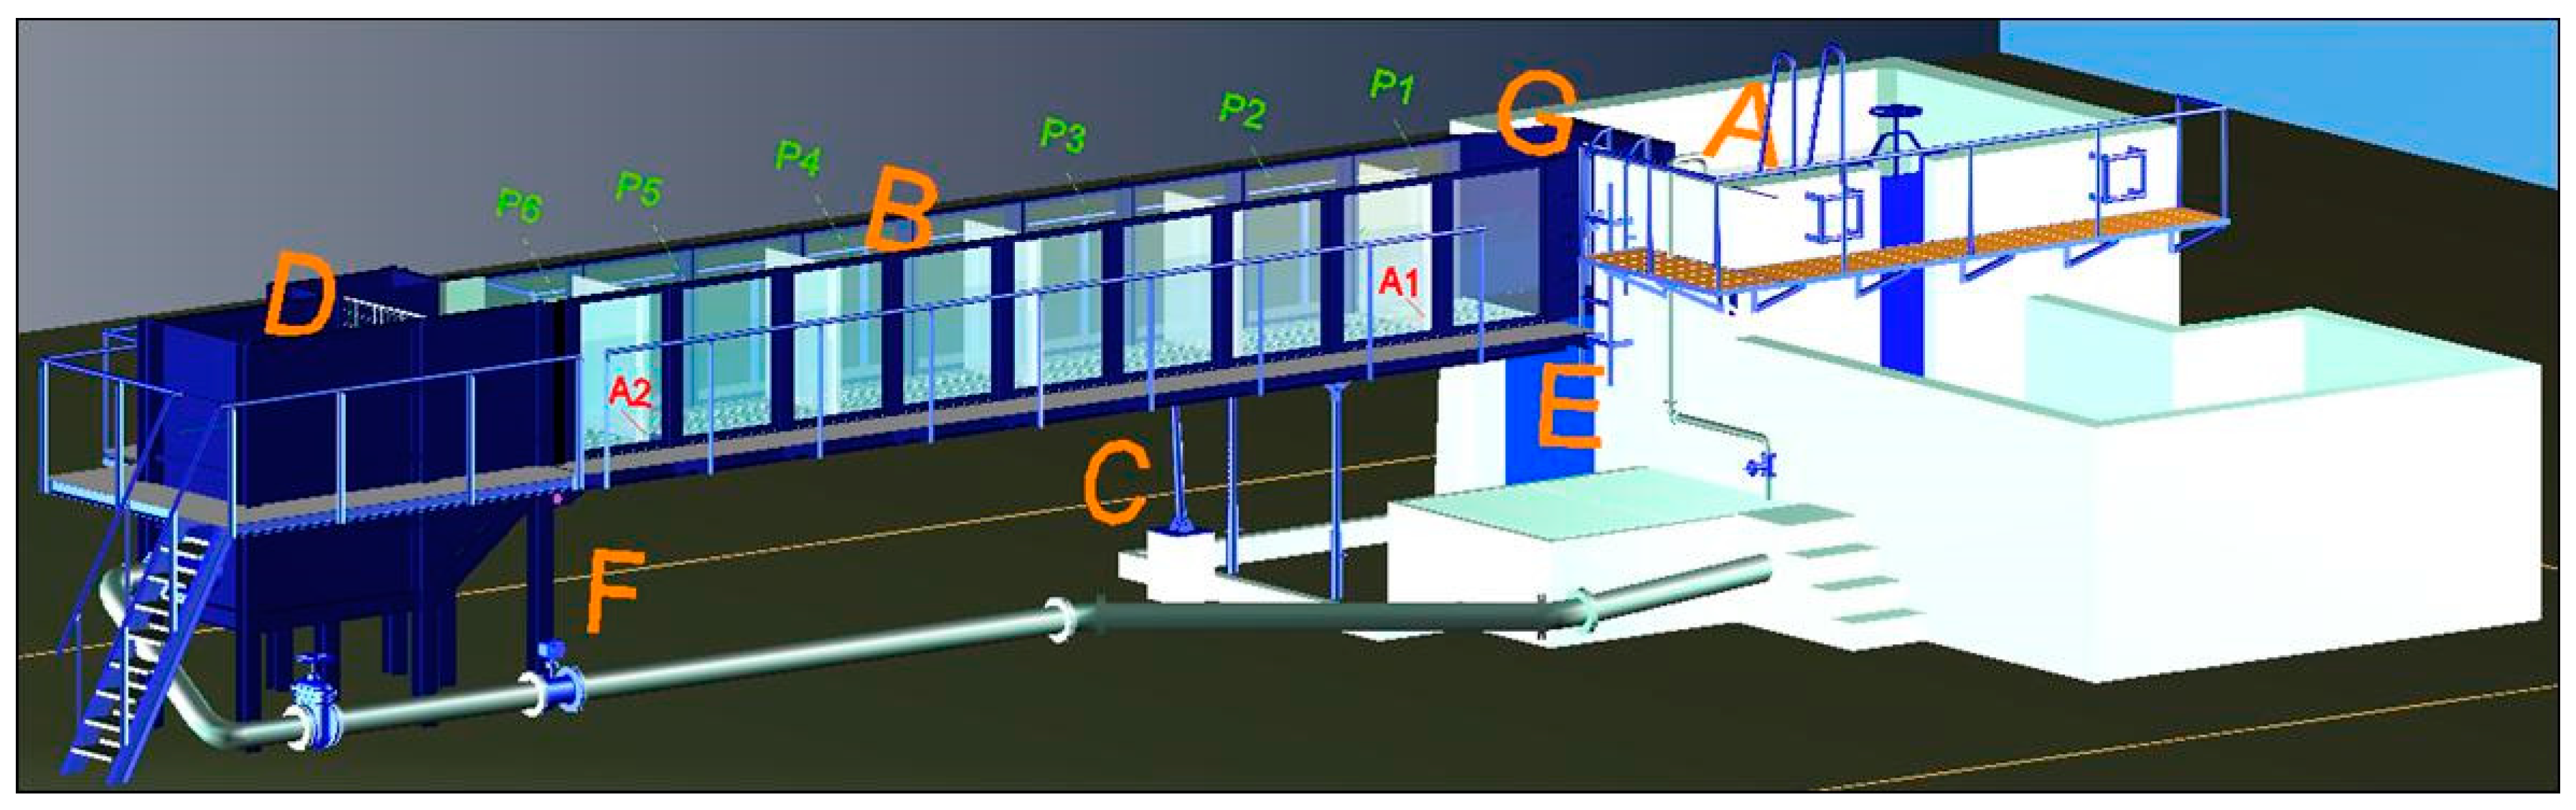
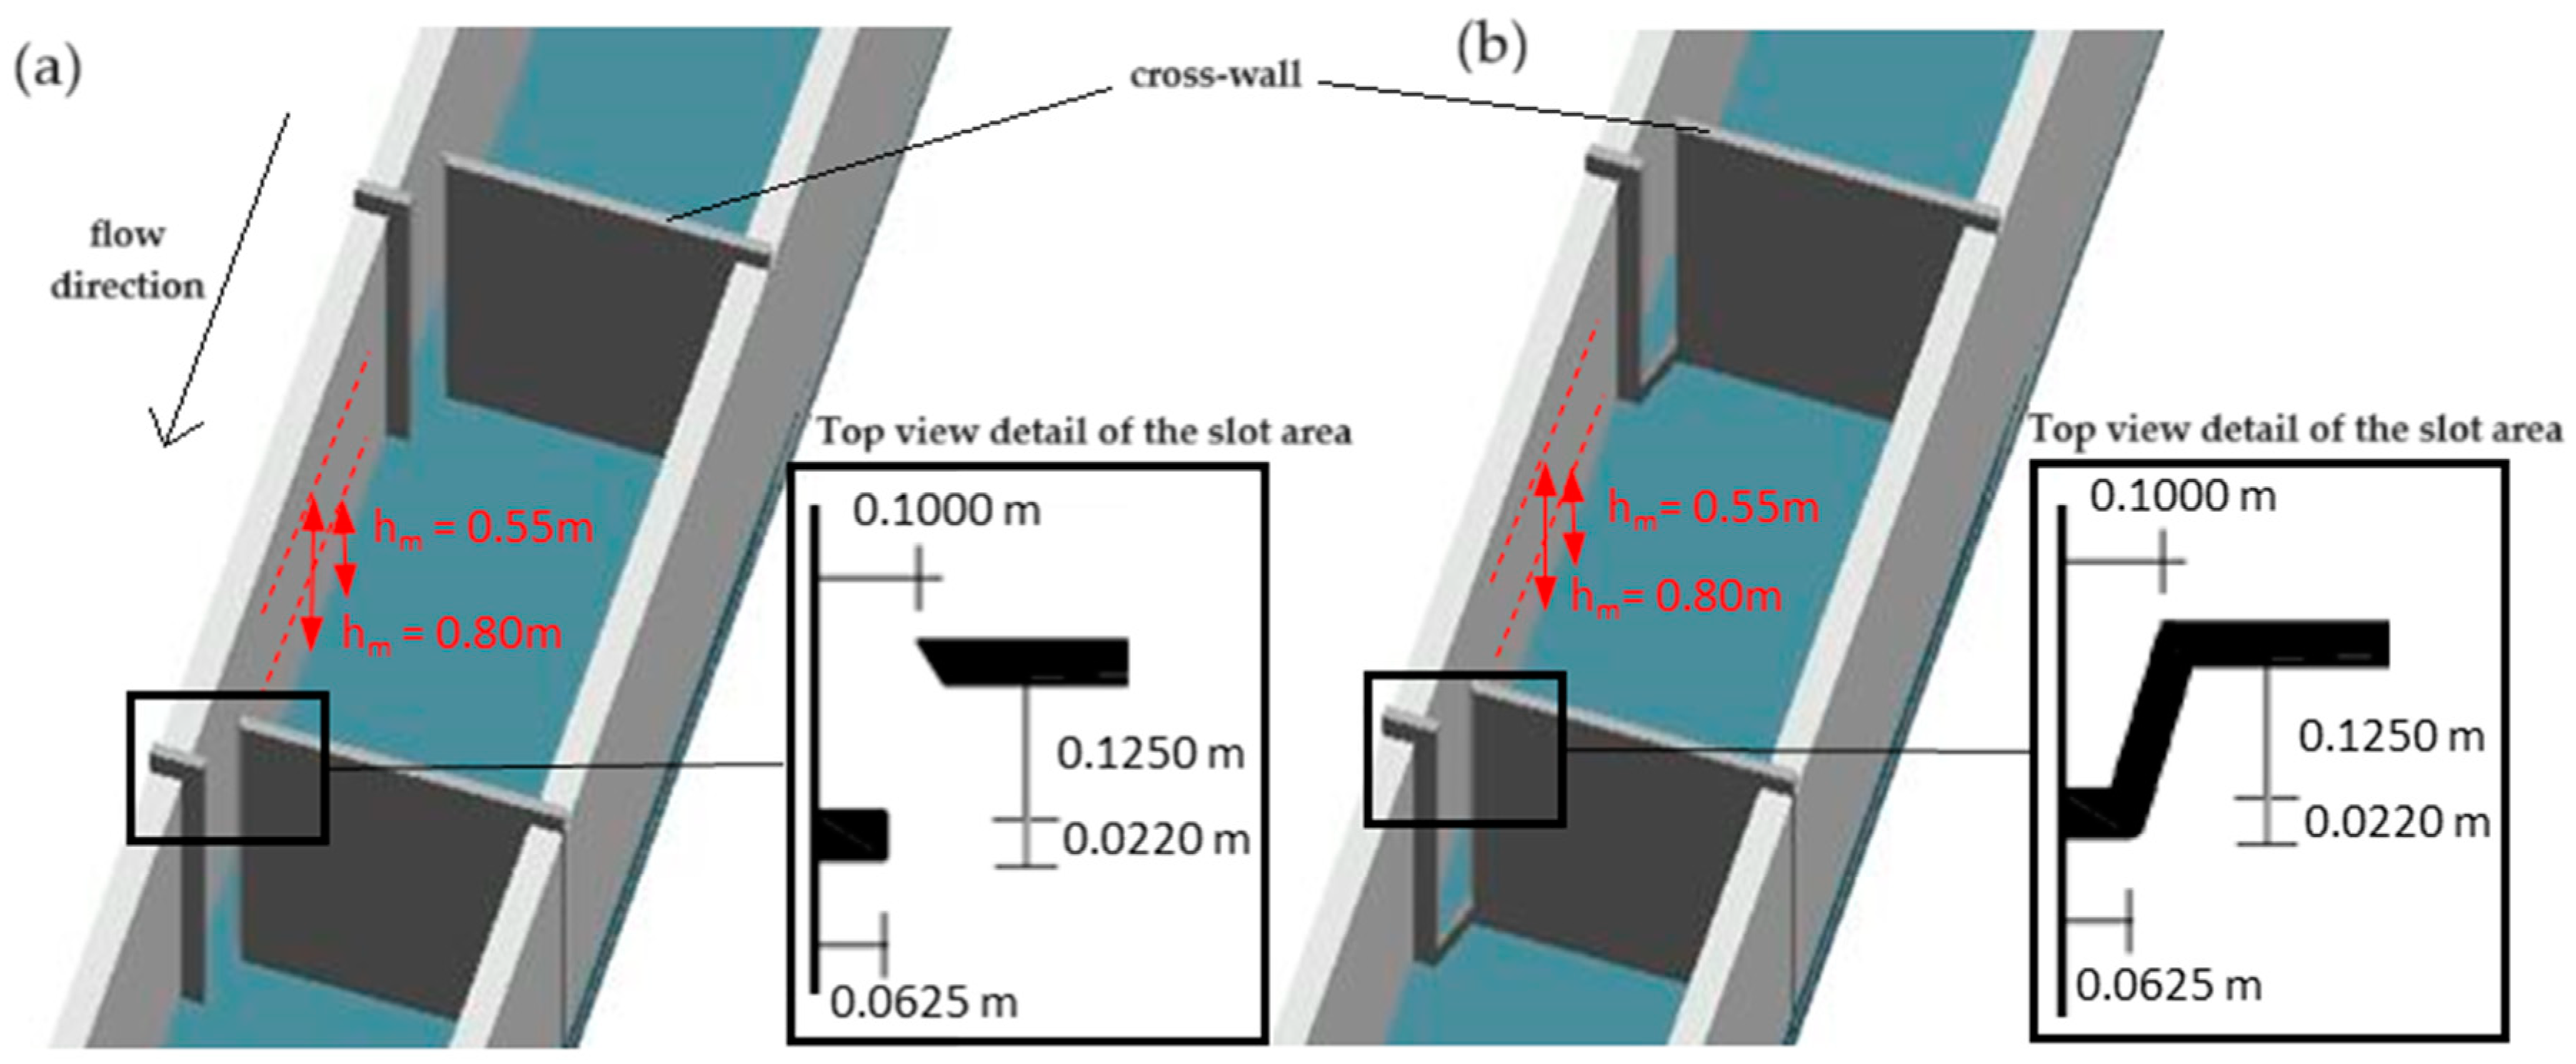
2.2. Experimental Fishway Setup

The experiments were conducted in a full-scale prototype fishway model (Figure 1) at the National Laboratory for Civil Engineering (LNEC) at the Hydraulics and Environment Department in Lisbon, Portugal. This facility comprises an open channel (10.00 m long, 1.00 m wide, and 1.20 m high) with adjustable slope, steel frames, and glass panels on lateral walls allowing the observation of fish passage behaviour: a downstream tank (4.00 m long, 3.00 m wide, and 4.00 m height) and an upstream chamber (1.85 m long, 1.00 m wide, and 1.20 m height). In addition, an acclimation chamber (1.00 m long, 1.00 m wide, and 1.20 m high) was set up using two mesh panels to provide fish the opportunity to acclimatize to the flow conditions before the start of the trials. The flow provided to the fishway circulates in a close circuit and was gauged with an electromagnetic flow meter (precision 0.4%), while adjustments were secured through a pump frequency controller (Figure 1).
A VSF was installed using a 15.2% slope, and four configurations were tested: (i) a standard VSF design (based on design 11—Rajaratnam et al. [19]) with two distinct flow depths in the pools (VSF1 and VSF2); (ii) the same design converted into a deep notch using a sill (0.10 m high) with the same two flow depths (DN1 and DN2) (Figure 2). The chosen sill height is in line with the literature recommendations and previous studies [19,34].
The open channel was partitioned by five cross-walls made of plywood (22 mm thick) forming a fishway. Two mean water depths in the pools were tested for both configurations (Table 1). The remaining features, namely head drop between the pools, pool length and width, and slot size, were kept identical between configurations (Table 1). The volumetric dissipated power in a pool was calculated according to the following expression: P v = ρ g Q Δ h L B h m , where ρ is the water-specific mass = 1000 Kgm−3; g is the gravitational acceleration = 9.81 ms−2. By using two mean water depths, four distinct volumetric dissipated power values were assessed. The chosen water depths allowed comparisons with previous studies performed by [24], where a similar VSF configuration with a lower slope (8.5%) was tested.
Additionally, a PIT-tag detection system composed of two antennas was installed (Figure 1). This system was installed in the vertical slots of cross-wall 1 (A1—fishway entrance) and cross-wall 6 (A2—fishway exit). Each antenna was connected to a multiplex dedicated reader and received at 14 Hz (0.29 s per antenna) (Oregon RFID®, Portland, OR, USA). A battery (12 V:60 Ah) was used to power supply the systems.

2.3. Fish Collection, Tagging and Trials

Passage performance experiments were conducted using wild fish. A total of 100 adult barbel were captured in a small coastal river—Lizandro (38°54′08.8″ N 9°21′41.1″ W) using a low-voltage backpack electrofishing gear (Hans Grassl IG-200, Schonau am Konigssee, Germany; [39]).
Fish capture occurred during the late reproductive migration season [40], from 28 June to 17 July. To avoid partiality in the swimming performance during the laboratory trials, only adult fish with similar total length (mean total length ± SD: 17.4 ± 2.3 cm; mean total body mass ± SD: 56.5 ± 24.6 g) were selected [41,42,43]. After the capture procedure, fish were placed in a holding mesh in the river to recover (approximately 2–3 h) from the electric fishing procedure. Afterwards, fish were thoroughly handled and readily transported with aerated river water to the laboratory in a 190 L transport box (HansGrassl, Schonau am Konigssee, Germany) to maintain normal oxygen levels and minimize transportation stress.
In the laboratory, fish were transferred to 700 L holding tanks equipped with mechanical and biological filters with a turnover rate of 2300 Lh−1 (High-Performance Canister Filter FX5, Fluval, Québec, QC, Canada) in a close circuit. To keep low levels of stress, small quantities of water were added from the holding tanks to the transport tank. This controlled addition allowed for minimizing thermal and pH differences before transferring the fish to the holding tanks. After this procedure, fish were finally transferred to the holding tanks where they remained for at least 48 h (recovery period) under a natural photoperiod. Water quality in the holding tanks was monitored daily using a multi-parametric probe (HANNA Instruments, HI 9812-5): temperature (mean ± SD: 21.5 ± 0.1 °C), pH (mean ± SD: 7.4 ± 0.1), and conductivity (mean ± SD: 242.8 ± 1.4 µScm−1).
After the recovery period, all fish were anesthetized with eugenol (50 mgL−1 diluted in ethanol in proportion 1:10, exposure time between 1 and 2 min) and marked in the posterior quarter of their peritoneal cavity with PIT tags (Passive Integrated Transponder) using a PIT tag implanter (Oregon RFID®, Portland OR, USA). The PIT system consisted of an integrated circuit chip, a capacitor, and an antenna [44]. To identify the tag, a scanning device was used (DataTracer FDX, HDX, Oregon RFID®) that produced a short-range electromagnetic field that generated a low-frequency radio signal, and the scanning device received a unique alphanumeric code sent by the tag [44]. According to Ostrand et al. [45], pit tagging does not represent a significant change in the growth, survival, and behaviour of several fish species. Nonetheless, the weight of the tag should be less than 2% of the body mass of the fish [46]; therefore, the tags used had the following features: glass transponder 12 mm × 2.12 mm, and 0.1 g, Half Duplex—HDX ISO 11784/11785—, Oregon RFID®. After the tagging procedure, fish were allowed to recover from manipulation-induced stress for at least 24 h before the start of the trials. No fish died during or after the handling procedures.
Fish trials were conducted using a similar methodology applied by Romão et al. [24,47], thus each fish trial was composed of a school of five individuals with similar size. Pooled movement data for the school have been used as a valid metric for fish preferences e.g., [48]. The use of schools allowed this study to create a natural movement behaviour. These fish tend to move in schools rather than individually, a behaviour that is advantageous for moving fish [49,50,51]. Nonetheless, by using a PIT system, individual fish tracking was allowed during the experiments. Trials began with an acclimation period of 30 min followed by a 90 min period of fish passage assessment. For this, a school of five barbels was placed in the acclimation area and following that timeframe, the front net panel was removed, and fish were allowed to displace volitionally within the fishway. According to Goering and Castro-Santos [52], the relevance of setting an acclimatization period is broadly accepted and is a standard feature of laboratory studies. Five trials were performed in each configuration tested (VSF1, VSF2, DN1, DN2) × 5 trials], corresponding to 25 individuals per configuration. In each trial water quality in the experimental fishway was monitored using a multi-parametric probe (HANNA Instruments, HI 9812-5): temperature (mean ± SD: 22.4 ± 1.1 °C), pH (mean ± SD: 7.6 ± 0.3), and conductivity (mean ± SD: 253.8 ± 6.6 µScm−1).

2.4. Numerical Modelling

In this study, the flow field numerical modelling of the tested fishway configurations was performed with FLOW-3D® (Santa Fe, NM, USA) [53], a commercial 3D CFD model which has been widely used in recent years for fishway research, e.g., [54,55,56,57,58,59]. FLOW-3D® uses the Finite Volume Method to solve the governing equations of motion for fluids in a Cartesian staggered grid to obtain transient, three-dimensional solutions to multiscale and multiphysics flow problems [53]. In FLOW-3D®, the computational domain is subdivided using Cartesian coordinates into a structured mesh grid of variable-sized hexahedral cells. The grid is defined independently of the geometry and, subsequently, the geometry is embedded in the grid by the Fraction Area/Volume Obstacle Representation (FAVORTM) technique [60]. To accurately capture the free surface dynamics, the volume of fluid (VOF) method was applied [60]. The generalized minimum residual (GMRES) implicit solver [61], which is the default solver of FLOW-3D®, was used. GMRES is a non-stationary iterative method, with iteration-dependent coefficients [62], which are highly accurate and efficient for a wide range of problems [53]. Flow science [53] presents additional details regarding the theoretical and numerical fundamentals of FLOW-3D®.
The second-order monotonicity preserving method and the large-eddy simulation (LES) model were used. The momentum advection method and turbulence model choices were made following the results obtained in a previous study [58], where several model parameters were evaluated, and a quantitative and qualitative comparison of experimental and numerical model results was performed for a pool-type fishway with bottom orifices. The acceleration of gravity was applied in the negative z-direction and the positive x-direction so that the x-axis was parallel to the fishway bottom. The upstream and downstream boundaries were specified as pressure boundary conditions based on the water depths observed experimentally. The side walls and the bottom were modelled as no-slip boundaries, and, at the top, a symmetry boundary condition (zero value for normal velocity; zero gradients for the other quantities) was applied. The initial pressure was set to the atmospheric pressure. The wall roughness was set using the roughness height computed from the Strickler formula considering n = 0.01 m−1/3s−1 [63]. This value was the one that led to the best agreement between simulated and measured discharges and flow depths in a previous study [58].
The computational domain was discretized using multi-block grids to optimize the mesh according to the simulated fishway configurations (Figure 2). These were generated using AutoCAD and were imported into the code as stereolithography (STL) files. The grid blocks were created with uniform cell sizes. The mesh was constituted by eight grid blocks: one, which contained the entire fishway geometry, and as for the other seven nested blocks, two had half the mesh size of the overall block, one contained pools 2 to 4, another contained the upstream cross-wall, and the other five blocks had a quarter of the mesh size of the overall block containing the slot area. One coarser mesh and a refined one, with half the size of the mesh cells (doubling the number of cells in each direction), were tested to check the influence of the grid resolution on the results. The chosen mesh sizes were of similar size or smaller than those of previous studies, e.g., [64,65,66], that have shown to provide acceptable results compared to laboratory measurements [58]. To verify the mesh resolution quality, the LES IQ proposed by [67] was used. According to Pope [68], a good LES should have a LES IQ greater than 0.80, which means that 80% of the turbulent kinetic energy (TKE) is resolved. The authors of. [67] consider that a LES IQ of 0.75 to 0.85 may be considered adequate for most engineering applications, which typically occur at high Reynolds numbers. To perform this analysis and select an optimal resolution (i.e., the coarsest mesh able to solve the TKE), different mesh resolutions were compared (0.02 m and 0.01 m in the block containing pools 2 to 4), finally selecting the one with LES IQ greater than 0.80. A 0.01 m grid size mesh provided an adequate LES IQ (0.89). This mesh size is smaller or of similar size to previous pool-type fishway studies that used CFD to analyze pool-type fishway flows [65,66,69,70,71,72].
To achieve a time-independent solution, velocity, flow rate, and water levels within the fishway were monitored during the simulation process by plotting the difference between consecutive time steps and ending the simulation when an asymptotic behaviour was reached (100-time steps were used for the analysis). The same behaviour was observed for all the developed models: the differences between the monitored variables in each time step were reduced progressively until an oscillatory behaviour was reached.
Additionally, the mean water depth in the pools and discharge were measured in each configuration tested in the facility. Comparisons between the values measured in the facility and numerical model show relative differences (computed by dividing the difference between numerical and experimental values by the latter ones) lower than 6%. The discharges set in the facility were as follows: VSF 1—81 Ls−1; VSF2—110 Ls−1; DN1—71 Ls−1; DN2—99 Ls−1. On the other hand. in the numerical model, the following values were obtained: VSF1—81 Ls−1 VSF2—115 Ls−1; DN1—74 Ls−1; DN2—104 Ls−1. This resulted in relative differences of 0.1, 4.6, 4.5, and 5.5%, respectively. Regarding the pool mean water depth, the measured values were as follows VSF1—0.55 m VSF2—0.80 m; DN1—0.55 m; DN2—0.80 m. On the other hand, in the numerical model, the following values were obtained: VSF1—0.53 m; VSF2—0.77; DN1—0.53 m; DN2—0.78 m. This resulted in relative differences of 3.5, 3.7, 4.1, and 2.7%, respectively. These differences are in line with the ones found for other previously tested configurations, where the numerical model and the chosen parameters had previously been thoroughly verified and validated [62], and also with previous studies that used CFD to analyze pool-type fishway flows, e.g., [65,66,69,70,71,72], thus showing that the model accurately reproduced the flow fields under analysis.

2.5. Data Analysis

The assessment of the upstream fish passage performance in the four configurations tested was determined using standardized metrics: motivation, ascend success, and transit time. As a proxy for motivation, the time between the beginning of the trial and the first attempt (detection in antenna A1) was assumed. In addition, the attempt percentage, defined as the total number of fish that made at least one attempt (fish with at least one record in A1) divided by the total number of fish, was determined.
The metric ascend success accounted for fish detected in antenna A1 and A2, which corresponds to a passage success or complete negotiation of the configuration tested. These movements were also analyzed in terms of passage time and transit time (time needed to travel between A1 and A2); additionally, to enable comparisons between other fishway assessments, transit time data were relativized by the water height difference between antennas (transit time per meter of ascended height) [38].
To evaluate the effect of the main covariates (body length and Fulton’s condition factor—K) on each of the response variables (transit time per meter of ascended height, and time between the start of the trial and first attempt), survival analysis using Cox Proportional Hazard regression was used [73], applying the concept of survival time (i.e., time or height until an event occurs) [74,75]. Right censoring (e.g., the time to a certain event is equal or greater than the observed) was adopted for all fish without attempts (for the metric—time between the start of the trial and first attempt), and the total duration of the trial was assigned (90 min per trial). Regarding the metric transit time per meter of ascended height, for fish that were between A1 and A2 at the end of the trial, right censoring was also adopted; however, the time assigned was considered as the time from the start of the attempt (detection in A1) until the end of the trial.
Fulton’s condition was determined according to the following equation: K = body mass·total length−3 (gcm−3). The differences between condition factor, body mass, and total length, between trials, were explored using a non-parametric statistical approach due to the non-normality of the data. For this purpose, Kruskal–Wallis tests were computed using NCSS software (Version 12). Cox Proportional Hazard regression statistical analyses were performed in Statgraphics Centurion (Statgraphics Technologies, Inc., The Plains, VA, USA) statistical software (Version 18.1) and SAS® (Stockholm, Sweden, PHReg procedure) (version 9.4). The non-proportionality assumption was tested through Martingale and Schoenfeld residuals. The comparison of the attempt percentage and the passage success was performed using the Chi-square test of independence using the software Statgraphics Centurion (version 18.1).
CFD data from FLOW-3D® were visualized, post-processed, analyzed, compared, and exported with FLOW-3D POST [53]. All the numerical results refer to Pool 3, which is used as a reference for a typical pool. The volume averaged and maximum values of the mean velocity magnitude (U) and turbulent kinetic energy (TKE) parallel to the bottom component of the Reynolds shear stress (RSS) were evaluated for this pool. The zones with velocities lower or equal to 0.81 ms−1 (the critical swimming speed of the barbel, [43]) and with TKE lower than 0.05 m2s−2 were assessed. According to Silva et al. [76], when negotiating a pool-type fishway with bottom orifices, the Iberian barbel used these low turbulent kinetic energy locations (<0.05 m2s−2) as resting areas before subsequent efforts to negotiate areas of higher velocity and turbulence.

3. Results

3.1. Fish Trials

The results from the Kruskal–Wallis tests revealed no significant differences (p > 0.05) in total length, body mass, and the K-condition factor between fish groups tested in the four configurations analyzed.
Regarding motivation analysis, fish trials unveiled different attempt percentages between the four configurations tested, although Chi-square tests indicate no statistical significance (χ2 = 7.08; p = 0.069). In VSF1, barbels displayed a 68% (17/25) attempt percentage, while for the remaining configurations, percentages were lower: DN2 (48%; 12/25); DN1 (40%; 10/25), and VSF2 (26%; 9/25). Concerning the time between the beginning and the first attempt, both covariates showed a significant relation with this metric (Table 2), which indicates a lower time for larger fish (p = 0.05) while for Fulton’s condition factor, fish with higher K displayed a longer time to perform the first attempt (p = 0.030).
Comparing the four configurations, in terms of the time between the beginning of the trial and the first attempt, significance was identified in DN1 (p = 0.045; [HR-1] × 100 = 56%) and DN2 (p = 0.038; [HR-1] × 100 = 58%) compared to the reference level (VSF1). Figure 3 presents the Kaplan–Meyer curves for the proportion of fish regarding the time between the beginning and the first attempt.
Considering the ascent success, significant differences were found (χ2 = 21.19; p < 0.001). In VSF1, barbels presented 100% ascent success (17/17), being lower in the other configurations: 88.9% (8/9) in VSF2, 60% (6/10) in DN1, and 25% (3/12) in DN2. Regarding median transit time per meter of ascended height (min/m), fish showed the lowest passage time in configuration VSF1 (11 min/m) succeeded by DN1 (16 min/m), VSF2 (17 min/m), and DN2 (28 min/m).
For transit time, the Cox Proportional Hazard regression models applied indicated no significance (p > 0.05) in both covariates included in the model (body length and condition factor) (Table 2). However, significant differences were found when comparing trials between configurations: Trials conducted in configuration DN2 revealed a significantly higher transit time (Table 2) compared to the remaining ones, representing a hazard risk of 84% (p = 0.003; [HR-1] × 100) of performing higher transit time compared to the reference level (VSF1), and therefore a lower passage performance. Figure 4 presents the Kaplan–Meyer curves for the proportion of fish regarding the transit time.

3.2. Hydrodynamic Characterization

Table 3 presents the volume averaged and the maximum mean velocity magnitudes and turbulent kinetic energies parallel to the bottom component of Reynolds shear stress, and the percentage of pool volume with the mean velocity magnitude lower or equal to 0.81 ms−1 and TKE lower or equal to 0.05 m2s−2 obtained using the numerical model for the studied fishway configurations. All the configurations have similar values of mean velocity and turbulent kinetic energy parallel to the bottom component of Reynolds shear stress magnitudes with small differences among them. However, the pool volume that is lower or equal to the given thresholds is higher in the VSF when compared to the DN configurations.
Figure 5 shows the mean velocity magnitude and the 3D time-averaged velocity vectors of the studied fishway configurations at z = 50% hm (0.40 m for VSF2 and DN2 and 0.275 m for VSF1 and DN1). Although the mean and maximum velocity magnitudes are similar for all the studied configurations, the velocity patterns are distinct. The DN configurations present a larger jet with higher velocity magnitudes extending longer into the pool. Comparatively, Figure 6 shows the pool volume that has average velocity magnitudes higher or equal to 0.81 ms−1. The volume of the pool that has mean velocity magnitudes lower or equal to 0.81 ms−1 (the critical swimming speed—Ucrit—of the barbel, Mateus et al. [43]) is also slightly higher in the VSF compared to the DN configurations, where mean velocity magnitudes higher or equal to 0.81 ms−1 extend through all the pool from one slot to the next one. The vertical slot region velocity distribution was also analyzed in more detail. The mean velocity magnitude in the slot region ranges from 0.9 ms−1 for DN1 and DN2 to 1.0 ms−1 for VSF1 and VSF2. The maximum velocity magnitude in the slot region is 2.5 ms−1 for all configurations. The volume of the slot region that has mean velocity magnitudes lower or equal to 0.81 ms−1 is slightly higher for the DN configurations. In the VSF configurations, the volume of the slot that has mean velocity magnitudes lower or equal to 0.81 ms−1 is 44%, whereas it is 49% and 47% in DN1 and DN2, respectively.
Figure 7 shows the zone of the studied fishway configurations with TKE higher or equal to 0.05 m2s−2. VSF1 is the configuration that presents a higher volume with lower turbulent kinetic energy, whereas in DN2, there are almost no resting areas since a large volume of the pool has TKE higher than 0.05 m2s−2. In the DN configurations, the higher TKE values extend along the whole pool volume and water depth, whereas in the VSF configurations, the zones close to the pool bottom have low TKE values.

4. Discussion

The present study aimed to estimate the passage performance in two VSF and two DN configurations of a widespread Iberian potamodromous cyprinid species currently threatened due to the loss of river connectivity under extreme eco-hydraulic conditions that exceed the general guidelines referred to in the literature [19,20,31,32]. In this research, a step back was taken to question and debate the validity of the main design recommendations currently used, since this type of laboratory study, which holds the potential to control confounding variables [24], is lacking [11]. Therefore, PIT-telemetry and time-to-event standardized metrics were used to characterize the passage performance of adult barbel in the late reproductive season, while the hydrodynamic scenarios experienced by fish were assessed using a numerical model using CFD.
Contrarily to what was initially hypothesized, the results showed a higher passage performance in VSF1 that presents the most extreme conditions in terms of Pv, one of the most common ways to specify how demanding a fishway is in terms of pool turbulence. Specifically, the ascent success analysis revealed a significant difference in the proportion of fish negotiating the VSF1 compared to other configurations, indicating a higher performance and therefore passage efficiency. Additionally, transit time also corroborated this result, since fish performing in the same configuration revealed a significantly lower time (11 minm−1) to navigate the complete fishway compared to other configurations. In comparison, Romão et al. [29], when evaluating the passage performance of the barbel during the migration season in a VSF compliant with the literature guidelines, found that the median transit time was 22 minm−1 in a VSF (Q = 81 Ls−1) installed under 8.5% slope, hm = 0.80 m, Δh = 0.16 m, and Pv = 83 Wm−3. According to Bravo-Córdoba et al. [38], during a field assessment carried out to compare the passage efficiency of the barbel performing in a VSF versus a pool-type fishway with submerged notch equipped with bottom orifice, determined a median transit time of 8.1 minm−1 in a VSF with lower head drops (Δh = 0.15 m), slope (6.2%), and slot flow velocities (1.48 ms−1). Moreover, Sanz-Ronda et al. [77], in a field passage assessment, described a median transit time of 5.5 minm−1 for the same species performing in a VSF with higher slope (7.7%), head drops (Δh = 0.20 m), and slot flow velocities (1.75 ms−1). Additionally, Bravo-Córdoba et al. [78] assessed the passage performance of a potamodromous species, the Brown trout, (Salmo trutta) in a pool-type fishway with a head drop between pools that exceeded design recommendations (Δh = 0.65 m) and observed that approximately one-fifth of fish that attempted to ascend were able to negotiate the complete fishway. Nonetheless, slower transit times were registered compared to other fishway assessments compliant with general design recommendations [78].
Regarding motivation metrics, the attempt percentages were higher (68%) for VSF1, and the lowest was registered in VSF2 (26%), although no significance between them was found. Significant differences were detected when comparing the four configurations using the metric, i.e., the time between the beginning and the first attempt, indicating that a higher proportion of fish were less motivated to cross the first slot in DN1 and DN2 compared to VSF1. When analyzing the effect of the main covariates, the results indicate a higher performance or lower time for larger fish. Accordingly, several studies conducted in the laboratory [41,42,43] and the field [79] corroborate this tendency. Concerning the condition factor, although significance was identified, fish with higher conditions revealed a lower motivation. Nevertheless, it is worth considering that the studied fish were sampled from the same river system and population and presented similar total lengths, suggesting a higher probability of sharing similar life traits and swimming capacity [80].
Regarding hydrodynamic scenarios, the modelling results clearly show maximum magnitudes that exceed design recommendations for all the assessed configurations. Regarding the volumetric dissipation power, the guidelines specify a Pv < 150 Wm−3 for cyprinids [21], whereas in this study, the values ranged from 187 Wm−3 in DN2 to 222 Wm−3 in VSF1, representing around 25 to 50% increase, respectively. Although this parameter is widely used, it is, in fact, a simple indicator of average turbulence in a pool that may be promptly computed but should not, in any case, be used blindly, as the results of this study suggest. Indeed, this descriptor overshadows the real complexity of turbulent flow dynamics. Looking at a more refined scale, through modelling the results, the chance of drawing further conclusions seems much more factual compared with over-simplistic estimations. Hence, the analysis of velocities and turbulence descriptors, such as TKE and RSS, and how they vary along the pools (the designated areas to dissipate energy and resting areas for ascent movements), allows us to bridge closer swimming behaviour and hydrodynamics [81,82,83]. Hinch and Bratty [84] found that sockeye salmon were more successful in completing their upstream migrations through fishway negotiation when spending reduced periods above their critical swimming speeds. Silva et al. [76] observed that the Iberian barbel mainly used areas with low TKE (<0.05 m2s−2) to negotiate a pool-type fishway with bottom orifices. The four configurations tested present similar average values of velocities and turbulence (TKE and RSS). However, the pool distributions of these parameters are quite different, suggesting that fish passage performance varies accordingly, as confirmed by the ascent success and transit time. In both VSF1 and VSF2, ascent success was higher than in DN1 and DN2 configurations that exhibited larger pool volumes with values above the Ucrit thresholds. Likewise, concerning TKE, larger volumes with magnitudes higher than 0.05 m2s−2 [76] were identified in both DN1 and DN2 configurations, reflecting a lower passage performance for the barbel. In fact, the configuration where fish had higher ascent success and lower transit time, VSF1, presents a larger pool volume with mean velocity magnitudes lower than 0.81 ms−1, and TKE lower than 0.05 m2s−2 in more than 90% and 50% of the pool, respectively, whereas in DN2, these percentages drop to 80% and 37%.
Given the physical similarity of the VSF and the DN configurations, in which only the addition of the sill changes—a structure, generally installed to provide better guidance and stabilization of the jet as well as avoid short-circuiting [21,35]—the evidence is clear that pool turbulence distribution changes significantly. Therefore, the pools designated as areas of energy dissipation, which are determinants to allow fish to rest during ascent movements, can be deeply transformed by using this type of structure. Therefore, precautions should be taken when designing and installing these structures, particularly in steep fishways with high head drops. Furthermore, designers should be encouraged to model the hydrodynamic scenarios and crosscheck that information with species-specific attributes to better understand the relationship between the passage behaviour and hydrodynamics.
The barbel is a potamodromous rheophilic fish whose behaviour has been assessed both in the field [79] and laboratory [29,85]. Depending on the river systems and environmental conditions, upstream movements are unleashed towards suitable spawning grounds during spring, which can often extend to late summer or early autumn, generally with lower stocks of breeding fish and consequent movements [32,40]. Early assessments resulting from confined swimming performance experiments pointed to weaker swimming capacity compared to salmonids. For instance, according to Mateus et al. [43], the average Ucrit of the babel is 0.81 ms−1 (mean total length = 29 cm) while for adult Atlantic salmon (Salmo salar) (mean total length = 48.6 cm) in freshwater, it is 1.5 ms−1 [86]; in fact, fishway design recommendations reflect these differences. Accordingly, the criteria for salmonids indicate Δh = 0.30 m, which can extend to 0.45 m or 0.60 m to large salmonids (in pool-type fishways with plunging flows), and the upper limit for volumetric dissipated values is 200 Wm−3, while for cyprinids, the head drop should range from 0.15 to 0.25 m and Pv < 150 Wm−3 [21]. However, open channel swimming tests have shown that the barbel exhibits a higher capacity than expected, as shown by Sanz-Ronda et al. [79], which emphasized that this species is capable of passing much higher flow velocities than was previously believed. In accordance, the results achieved in this study also point in the same direction. Nonetheless, it is worth considering that target species seems to present a wide adaptability in terms of required flows for fish passage negotiation, since encouraging results were achieved when testing multislot fishways, which operate with much lower discharges (around 50% less) and consequent turbulence magnitudes compared to standard VSF designs [47].
In summary, the results of this research raise questions, thereby opening a debate about the validity of the general guidelines established for cyprinids, particularly the use of simple turbulence indicators (Pv) and the basis on which they were determined. As other questions remain unanswered in the field of fish passage engineering [8,9], the main guidelines are undeniably crucial to address, given their major importance in restoring fish longitudinal connectivity, which is a pressing issue and a growing concern each day. Should the present technical design guidelines be more conservative for rheophilic potamodromous cyprinids, even if they have the capacity to withstand higher flows and turbulence? To the best of our knowledge, guidelines should be regularly updated and should be species-specific and not overgeneralized in large groups, for example, salmonids or cyprinids as massive intra and inter-specific differences may occur within these taxonomic units. Furthermore, recent advancements in fish phylogenetic classification [87], which recently have led to an increased splitting of species in Europe [88], also pose an additional challenge to the use of very general guidelines, as taxonomic units are constantly changing (e.g., the Iberian nase—Pseudochondrostoma polylepis—recently changed from the cyprinidae family to leuciscidae). Therefore, further research should focus on assessing species-specific fish passage criteria for fish communities, and precaution should be undertaken when using very broad guidelines, particularly when using simple indicators such as Pv.
Finally, more research and field validation are required to support the results gathered with this experimental laboratory approach. In terms of management applications, a case-by-case policy should be adopted, taking into account the characteristics of the whole fish community in the river system in order to develop more detailed guidelines in compliance with species-specific passage performance thresholds.

Author Contributions

Conceptualization, F.R., A.L.Q. and J.S.; methodology F.R., F.J.B.-C., A.L.Q. and F.J.S.-R.; software, A.L.Q.; validation, A.N.P., F.J.S.-R. and J.M.S.; formal analysis, F.R., A.L.Q., J.S. and F.J.B.-C.; investigation, F.R., A.L.Q. and J.S.; resources, J.M.S. and T.V.; data curation, F.J.B.-C., F.R. and A.L.Q.; writing—original draft preparation, J.S. and F.R.; writing—review and editing, F.R., A.L.Q., J.M.S., T.V., A.N.P. and F.J.S.-R.; visualization, F.R. and A.L.Q.; supervision, A.N.P. and F.J.S.-R.; funding acquisition, A.N.P., J.M.S. and J.S. All authors have read and agreed to the published version of the manuscript.

Funding

Civil Engineering Research and Innovation for Sustainability (CERIS) is a research unit funded by the Fundação para a Ciência e Tecnologia I.P. (FCT), Portugal (UIDB/04625/2020). Forest Research Centre (CEF) is a research unit funded by FCT, Portugal (UIDB/00239/2020). Filipe Romão (https://doi.org/10.54499/2022.03193.CEECIND/CP1713/CT0010, accessed on the 5 of January, 2024) and Ana Quaresma (https://doi.org/10.54499/2022.08169.CEECIND/CP1713/CT0012, accessed on the 5 of January, 2024) are financed by FCT funds under the program Individual Call to Scientific Employment Stimulus (CEEC). Joana Simão was financed with a PhD grant from FCT ((PD/BD/142883/2018).

Data Availability Statement

Data are contained within the article.

Acknowledgments

The authors would like to acknowledge the assistance of the staff of the National Laboratory for Civil Engineering (LNEC) during the fish experiments. We would also like to acknowledge the Institute for Nature Conservation and Forests (ICNF), who provided us with the necessary electric fishing and handling permits.

Conflicts of Interest

The authors declare no conflicts of interest.

References

  1. Grill, G.; Lehner, B.; Thieme, M.; Geenen, B.; Tickner, D.; Antonelli, F.; Babu, S.; Borrelli, P.; Cheng, L.; Crochetiere, H.; et al. Mapping the World’s Free-Flowing Rivers. Nature 2019, 569, 215–221. [Google Scholar] [CrossRef]
  2. Belletti, B.; Garcia de Leaniz, C.; Jones, J.; Bizzi, S.; Börger, L.; Segura, G.; Castelletti, A.; van de Bund, W.; Aarestrup, K.; Barry, J.; et al. More than One Million Barriers Fragment Europe’s Rivers. Nature 2020, 588, 436–441. [Google Scholar] [CrossRef] [PubMed]
  3. Dudgeon, D.; Arthington, A.H.; Gessner, M.O.; Kawabata, Z.-I.; Knowler, D.J.; Lévêque, C.; Naiman, R.J.; Prieur-Richard, A.-H.; Soto, D.; Stiassny, M.L.J.; et al. Freshwater Biodiversity: Importance, Threats, Status and Conservation Challenges. Biol. Rev. 2006, 81, 163–182. [Google Scholar] [CrossRef] [PubMed]
  4. Reid, A.J.; Carlson, A.K.; Creed, I.F.; Eliason, E.J.; Gell, P.A.; Johnson, P.T.J.; Kidd, K.A.; MacCormack, T.J.; Olden, J.D.; Ormerod, S.J.; et al. Emerging Threats and Persistent Conservation Challenges for Freshwater Biodiversity. Biol. Rev. 2019, 94, 849–873. [Google Scholar] [CrossRef] [PubMed]
  5. McCartney, M. Living with Dams: Managing the Environmental Impacts. Water Policy 2009, 11, 121–139. [Google Scholar] [CrossRef]
  6. Dopico, E.; Arboleya, E.; Fernandez, S.; Borrell, Y.; Consuegra, S.; de Leaniz, C.G.; Lázaro, G.; Rodríguez, C.; Garcia-Vazquez, E. Water Security Determines Social Attitudes about Dams and Reservoirs in South Europe. Sci. Rep. 2022, 12, 6148. [Google Scholar] [CrossRef]
  7. Lucas, M.C.; Baras, E.; Thom, T.J.; Duncan, A.; Slavik, O. Migration of Freshwater Fishes; Blackwell Science Ltd.: Hoboken, NJ, USA, 2001; ISBN 978-0-632-05754-2. [Google Scholar]
  8. Lennox, R.J.; Paukert, C.P.; Aarestrup, K.; Auger-Méthé, M.; Baumgartner, L.; Birnie-Gauvin, K.; Bøe, K.; Brink, K.; Brownscombe, J.W.; Chen, Y.; et al. One Hundred Pressing Questions on the Future of Global Fish Migration Science, Conservation, and Policy. Front. Ecol. Evol. 2019, 7, 286. [Google Scholar] [CrossRef]
  9. Silva, A.T.; Lucas, M.C.; Castro-Santos, T.; Katopodis, C.; Baumgartner, L.J.; Thiem, J.D.; Aarestrup, K.; Pompeu, P.S.; O’Brien, G.C.; Braun, D.C.; et al. The Future of Fish Passage Science, Engineering, and Practice. Fish Fish. 2018, 19, 340–362. [Google Scholar] [CrossRef]
  10. Communication from the Commission to The European Parliament, the Council, the European Economic And Social Committee and the Committee of the Regions Eu Biodiversity Strategy for 2030 Bringing Nature Back Into Our Lives; 2020. Available online: https://environment.ec.europa.eu/strategy/biodiversity-strategy-2030_en (accessed on 20 October 2023).
  11. Katopodis, C.; Williams, J.G. The Development of Fish Passage Research in a Historical Context. Ecol. Eng. 2012, 48, 8–18. [Google Scholar] [CrossRef]
  12. Keefer, M.L.; Jepson, M.A.; Clabough, T.S.; Caudill, C.C. Technical Fishway Passage Structures Provide High Passage Efficiency and Effective Passage for Adult Pacific Salmonids at Eight Large Dams. PLoS ONE 2021, 16, e0256805. [Google Scholar] [CrossRef]
  13. Mallen-Cooper, M.; Brand, D.A. Non-Salmonids in a Salmonid Fishway: What Do 50 Years of Data Tell Us about Past and Future Fish Passage? Fish. Manag. Ecol. 2007, 14, 319–332. [Google Scholar] [CrossRef]
  14. Noonan, M.J.; Grant, J.W.A.; Jackson, C.D. A Quantitative Assessment of Fish Passage Efficiency. Fish Fish. 2012, 13, 450–464. [Google Scholar] [CrossRef]
  15. Ovidio, M.; Sonny, D.; Watthez, Q.; Goffaux, D.; Detrait, O.; Orban, P.; Nzau Matondo, B.; Renardy, S.; Dierckx, A.; Benitez, J.-P. Evaluation of the Performance of Successive Multispecies Improved Fishways to Reconnect a Rehabilitated River. Wetl. Ecol. Manag. 2020, 28, 641–654. [Google Scholar] [CrossRef]
  16. Segurado, P.; Branco, P.; Ferreira, M.T. Prioritizing Restoration of Structural Connectivity in Rivers: A Graph Based Approach. Landsc. Ecol. 2013, 28, 1231–1238. [Google Scholar] [CrossRef]
  17. Branco, P.; Segurado, P.; Santos, J.M.; Ferreira, M.T. Prioritizing Barrier Removal to Improve Functional Connectivity of Rivers. J. Appl. Ecol. 2014, 51, 1197–1206. [Google Scholar] [CrossRef]
  18. Rajaratnam, N.; Van der Vinne, G.; Katopodis, C. Hydraulics of Vertical Slot Fishways. J. Hydraul. Eng. 1986, 112, 909–927. [Google Scholar] [CrossRef]
  19. Clay, C.H. Design of Fishways and Other Fish Facilities, 2nd ed.; CRC Press: Boca Raton, FL, USA, 1995. [Google Scholar]
  20. Larinier, M. Environmental Issues, Dams and Fish Migration. Dams, Fish and Fisheries: Opportunities, Challenges and Conflict Resolution, MARMULLA G. 2001, pp. 45–84. Available online: https://hal.inrae.fr/hal-02582630 (accessed on 15 September 2023).
  21. Larinier, M. Fishways—General considerations. Bull. Fr. Pêche Piscic. 2002, 364, 21–27. [Google Scholar] [CrossRef]
  22. Rodríguez, T.T.; Agudo, J.P.; Mosquera, L.P.; González, E.P. Evaluating Vertical-Slot Fishway Designs in Terms of Fish Swimming Capabilities. Ecol. Eng. 2006, 27, 37–48. [Google Scholar] [CrossRef]
  23. Chorda, J.; Maubourguet, M.M.; Roux, H.; Larinier, M.; Tarrade, L.; David, L. Two-Dimensional Free Surface Flow Numerical Model for Vertical Slot Fishways. J. Hydraul. Res. 2010, 48, 141–151. [Google Scholar] [CrossRef]
  24. Romão, F.; Quaresma, A.L.; Branco, P.; Santos, J.M.; Amaral, S.; Ferreira, M.T.; Katopodis, C.; Pinheiro, A.N. Passage Performance of Two Cyprinids with Different Ecological Traits in a Fishway with Distinct Vertical Slot Configurations. Ecol. Eng. 2017, 105, 180–188. [Google Scholar] [CrossRef]
  25. Bravo-Córdoba, F.J.; García-Vega, A.; Fuentes-Pérez, J.F.; Fernandes-Celestino, L.; Makrakis, S.; Sanz-Ronda, F.J. Bidirectional Connectivity in Fishways: A Mitigation for Impacts on Fish Migration of Small Hydropower Facilities. Aquat. Conserv. Mar. Freshw. Ecosyst. 2023, 33, 549–565. [Google Scholar] [CrossRef]
  26. Bombač, M.; Novak, G.; Mlačnik, J.; Četina, M. Extensive Field Measurements of Flow in Vertical Slot Fishway as Data for Validation of Numerical Simulations. Ecol. Eng. 2015, 84, 476–484. [Google Scholar] [CrossRef]
  27. Soom, J.; Pattanaik, V.; Leier, M.; Tuhtan, J.A. Environmentally Adaptive Fish or No-Fish Classification for River Video Fish Counters Using High-Performance Desktop and Embedded Hardware. Ecol. Inform. 2022, 72, 101817. [Google Scholar] [CrossRef]
  28. Fuentes-Pérez, J.F.; García-Vega, A.; Bravo-Córdoba, F.J.; Sanz-Ronda, F.J. A Step to Smart Fishways: An Autonomous Obstruction Detection System Using Hydraulic Modeling and Sensor Networks. Sensors 2021, 21, 6909. [Google Scholar] [CrossRef]
  29. Romão, F.; Quaresma, A.L.; Santos, J.M.; Amaral, S.D.; Branco, P.; Pinheiro, A.N. Multislot Fishway Improves Entrance Performance and Fish Transit Time over Vertical Slots. Water 2021, 13, 275. [Google Scholar] [CrossRef]
  30. Ballu, A.; Pineau, G.; Calluaud, D.; David, L. Experimental-Based Methodology to Improve the Design of Vertical Slot Fishways. J. Hydraul. Eng. 2019, 145, 04019031. [Google Scholar] [CrossRef]
  31. DVWK; Fisheries and Aquaculture Management Division. Fish Passes: Design, Dimensions and Monitoring; FAO/DVWK: Rome, Italy, 2002; ISBN 978-92-5-104894-8. [Google Scholar]
  32. Baudoin, J.M.; Burgun, V.; Chanseau, M.; Larinier, M.; Ovidio, M.; Sremski, W.; Steinbach, P.; Voegtle, B. The ICE Protocol for Ecological Continuity—Assessing the Passage of Obstacles by Fish; Concepts, Design and Application; Onema: Vincennes, France, 2014. [Google Scholar]
  33. Larinier, M. Fish Passage Experience at Small-Scale Hydro-Electric Power Plants in France. Hydrobiologia 2008, 609, 97–108. [Google Scholar] [CrossRef]
  34. Pena, L.; Puertas, J.; Bermúdez, M.; Cea, L.; Peña, E. Conversion of Vertical Slot Fishways to Deep Slot Fishways to Maintain Operation during Low Flows: Implications for Hydrodynamics. Sustainability 2018, 10, 2406. [Google Scholar] [CrossRef]
  35. Connor, J.; Stuart, I.; Jones, M. Guidelines for the Design, Approval and Construction of Fishways; Arthur Rylah Institute for Environmental Research: Heidelberg, Germany; Department of Environment, Land, Water and Planning: Victoria, BC, Canada, 2017.
  36. Armstrong, G.S.; Great Britain Environment Agency. Environment Agency Fish Pass Manual: Guidance Notes on the Legislation, Selection and Approval of Fish Passes in England and Wales; Environment Agency: Bristol, UK, 2010.
  37. Hermoso, V.; Clavero, M. Threatening Processes and Conservation Management of Endemic Freshwater Fish in the Mediterranean Basin: A Review. Mar. Freshw. Res. 2011, 62, 244–254. [Google Scholar] [CrossRef]
  38. Bravo-Córdoba, F.J.; Valbuena-Castro, J.; García-Vega, A.; Fuentes-Pérez, J.F.; Ruiz-Legazpi, J.; Sanz-Ronda, F.J. Fish Passage Assessment in Stepped Fishways: Passage Success and Transit Time as Standardized Metrics. Ecol. Eng. 2021, 162, 106172. [Google Scholar] [CrossRef]
  39. CEN—EN 14011; Water Quality—Sampling of Fish with Electricity. GlobalSpec: New York, NY, USA. Available online: https://standards.globalspec.com/std/282064/en-14011 (accessed on 6 September 2023).
  40. Rodriguez-Ruiz, A.; Granado-Lorencio, C. Spawning Period and Migration of Three Species of Cyprinids in a Stream with Mediterranean Regimen (SW Spain). J. Fish Biol. 1992, 41, 545–556. [Google Scholar] [CrossRef]
  41. Hammer, C. Fatigue and Exercise Tests with Fish. Comp. Biochem. Physiol. Part A Physiol. 1995, 112, 1–20. [Google Scholar] [CrossRef]
  42. Plaut, I. Critical Swimming Speed: Its Ecological Relevance. Comp. Biochem. Physiol. Part A Mol. Integr. Physiol. 2001, 131, 41–50. [Google Scholar] [CrossRef] [PubMed]
  43. Mateus, C.S.; Quintella, B.R.; Almeida, P.R. The Critical Swimming Speed of Iberian Barbel Barbus Bocagei in Relation to Size and Sex. J. Fish Biol. 2008, 73, 1783–1789. [Google Scholar] [CrossRef]
  44. Castro-Santos, T.; Haro, A.; Walk, S. A Passive Integrated Transponder (PIT) Tag System for Monitoring Fishways. Fish. Res. 1996, 28, 253–261. [Google Scholar] [CrossRef]
  45. Ostrand, K.G.; Zydlewski, G.B.; Gale, W.L.; Zydlewski, J.D. Long Term Retention, Survival, Growth, and Physiological Indicators of Salmonids Marked with Passive Integrated Transponder Tags. Am. Fish. Soc. Symp. 2011, 76, 1–11. [Google Scholar]
  46. Ficke, A.D.; Myrick, C.A.; Kondratieff, M.C. The Effects of PIT Tagging on the Swimming Performance and Survival of Three Nonsalmonid Freshwater Fishes. Ecol. Eng. 2012, 48, 86–91. [Google Scholar] [CrossRef]
  47. Romão, F.; Branco, P.; Quaresma, A.L.; Amaral, S.D.; Pinheiro, A.N. Effectiveness of a Multi-Slot Vertical Slot Fishway versus a Standard Vertical Slot Fishway for Potamodromous Cyprinids. Hydrobiologia 2018, 816, 153–163. [Google Scholar] [CrossRef]
  48. Ficke, A.D.; Myrick, C.A.; Jud, N. The Swimming and Jumping Ability of Three Small Great Plains Fishes: Implications for Fishway Design. Trans. Am. Fish. Soc. 2011, 140, 1521–1531. [Google Scholar] [CrossRef]
  49. Weihs, D. Hydromechanics of Fish Schooling. Nature 1973, 241, 290–291. [Google Scholar] [CrossRef]
  50. Boyd, G.L.; Parsons, G.R. Swimming Performance and Behavior of Golden Shiner, Notemigonus Crysoleucas, While Schooling. Copeia 1998, 1998, 467–471. [Google Scholar] [CrossRef]
  51. Johansen, J.L.; Vaknin, R.; Steffensen, J.F.; Domenici, P. Kinematics and Energetic Benefits of Schooling in the Labriform Fish, Striped Surfperch Embiotoca Lateralis. Mar. Ecol. Prog. Ser. 2010, 420, 221–229. [Google Scholar] [CrossRef]
  52. Goerig, E.; Castro-Santos, T. Is Motivation Important to Brook Trout Passage through Culverts? Can. J. Fish. Aquat. Sci. 2017, 74, 885–893. [Google Scholar] [CrossRef]
  53. FLOW-3D®. Users Manual; Flow Science Inc.: Santa Fe, NM, USA, 2019; Available online: https://www.flow3d.com/ (accessed on 10 May 2023).
  54. Duguay, J.M.; Lacey, R.W.J. Numerical Study of an Innovative Fish Ladder Design for Perched Culverts. Can. J. Civ. Eng. 2016, 43, 173–181. [Google Scholar] [CrossRef]
  55. Feurich, R.; Boubée, J.; Olsen, N.R.B. Improvement of Fish Passage in Culverts Using CFD. Ecol. Eng. 2012, 47, 1–8. [Google Scholar] [CrossRef]
  56. Kim, S.; Yu, K.; Yoon, B.; Lim, Y. A Numerical Study on Hydraulic Characteristics in the Ice Harbor-Type Fishway. KSCE J. Civ. Eng. 2012, 16, 265–272. [Google Scholar] [CrossRef]
  57. Kolden, E.; Fox, B.D.; Bledsoe, B.P.; Kondratieff, M.C. Modelling Whitewater Park Hydraulics and Fish Habitat in Colorado. River Res. Appl. 2016, 32, 1116–1127. [Google Scholar] [CrossRef]
  58. Quaresma, A.L.; Pinheiro, A.N. Modelling of Pool-Type Fishways Flows: Efficiency and Scale Effects Assessment. Water 2021, 13, 851. [Google Scholar] [CrossRef]
  59. Shahabi, M.; Ahadiyan, J.; Ghomeshi, M.; Narimousa, M.; Katopodis, C.; Azizi Nadian, H. Numerical Study of the Effect of a V-Shaped Weir on Turbulence Characteristics and Velocity in V-Weir Fishways. River Res. Appl. 2023, 39, 21–34. [Google Scholar] [CrossRef]
  60. Hirt, C.W.; Nichols, B.D. Volume of Fluid (VOF) Method for the Dynamics of Free Boundaries. J. Comput. Phys. 1981, 39, 201–225. [Google Scholar] [CrossRef]
  61. Yao, G.F. Development of New Pressure-Velocity Solvers in FLOW-3D; Flow Science Technical Note, Flow Science, Inc.: Los Alamos, NM, USA, 2004. [Google Scholar]
  62. Barrett, R.; Berry, M.; Chan, T.F.; Demmel, J.; Donato, J.; Dongarra, J.; Eijkhout, V.; Pozo, R.; Romine, C.; van der Vorst, H. Templates for the Solution of Linear Systems: Building Blocks for Iterative Methods; Other Titles in Applied Mathematics; Society for Industrial and Applied Mathematics: Philadelphia, PA, USA, 1994; ISBN 978-0-89871-328-2. [Google Scholar]
  63. Souders, D.T.; Hirt, C.W. Modeling Roughness Effects in Open Channel Flow; Flow Science Technical Note; Flow Science, Inc.: Santa Fe, NM, USA, 2002. [Google Scholar]
  64. Fuentes-Pérez, J.F.; Eckert, M.; Tuhtan, J.A.; Ferreira, M.T.; Kruusmaa, M.; Branco, P. Spatial Preferences of Iberian Barbel in a Vertical Slot Fishway under Variable Hydrodynamic Scenarios. Ecol. Eng. 2018, 125, 131–142. [Google Scholar] [CrossRef]
  65. Marriner, B.A.; Baki, A.B.M.; Zhu, D.Z.; Thiem, J.D.; Cooke, S.J.; Katopodis, C. Field and Numerical Assessment of Turning Pool Hydraulics in a Vertical Slot Fishway. Ecol. Eng. 2014, 63, 88–101. [Google Scholar] [CrossRef]
  66. Quaranta, E.; Katopodis, C.; Revelli, R.; Comoglio, C. Turbulent Flow Field Comparison and Related Suitability for Fish Passage of a Standard and a Simplified Low-Gradient Vertical Slot Fishway. River Res. Appl. 2017, 33, 1295–1305. [Google Scholar] [CrossRef]
  67. Celik, I.B.; Cehreli, Z.N.; Yavuz, I. Index of Resolution Quality for Large Eddy Simulations. J. Fluids Eng. 2005, 127, 949–958. [Google Scholar] [CrossRef]
  68. Pope, S.B. Turbulent Flows. Available online: https://www.cambridge.org/highereducation/books/turbulent-flows/C58EFF59AF9B81AE6CFAC9ED16486B3A (accessed on 26 November 2023).
  69. Bermúdez, M.; Puertas, J.; Cea, L.; Pena, L.; Balairón, L. Influence of Pool Geometry on the Biological Efficiency of Vertical Slot Fishways. Ecol. Eng. 2010, 36, 1355–1364. [Google Scholar] [CrossRef]
  70. Barton, A.F.; Keller, R.J.; Katopodis, C. Verification of a Numerical Model for the Prediction of Low Slope Vertical Slot Fishway Hydraulics. Australas. J. Water Resour. 2009, 13, 53–60. [Google Scholar] [CrossRef]
  71. Bombač, M.; Četina, M.; Novak, G. Study on Flow Characteristics in Vertical Slot Fishways Regarding Slot Layout Optimization. Ecol. Eng. 2017, 107, 126–136. [Google Scholar] [CrossRef]
  72. Fuentes-Pérez, J.F.; Silva, A.T.; Tuhtan, J.A.; García-Vega, A.; Carbonell-Baeza, R.; Musall, M.; Kruusmaa, M. 3D Modelling of Non-Uniform and Turbulent Flow in Vertical Slot Fishways. Environ. Model. Softw. 2018, 99, 156–169. [Google Scholar] [CrossRef]
  73. Allison, P.D. Survival Analysis Using the SAS System: A Practical Guide; SAS Institute: Cary, NC, USA, 1995. [Google Scholar]
  74. Castro-Santos, T.; Haro, A. Quantifying Migratory Delay: A New Application of Survival Analysis Methods. Can. J. Fish. Aquat. Sci. 2003, 60, 986–996. [Google Scholar] [CrossRef]
  75. Castro-Santos, T.R.; Perry, R.W. Time-to-Event Analysis as a Framework for Quantifying Fish Passage Performance. In Telemetry Techniques: A User Guide for Fisheries Research; American Fisheries Society: Bethesda, MD, USA, 2012; pp. 427–452. [Google Scholar]
  76. Silva, A.T.; Santos, J.M.; Ferreira, M.T.; Pinheiro, A.N.; Katopodis, C. Effects of Water Velocity and Turbulence on the Behaviour of Iberian Barbel (Luciobarbus bocagei, Steindachner 1864) in an Experimental Pool-Type Fishway. River Res. Appl. 2011, 27, 360–373. [Google Scholar] [CrossRef]
  77. Sanz-Ronda, F.J.; Bravo-Córdoba, F.J.; Fuentes-Pérez, J.F.; Castro-Santos, T. Ascent Ability of Brown Trout, Salmo Trutta, and Two Iberian Cyprinids—Iberian Barbel, Luciobarbus bocagei, and Northern Straight-Mouth Nase, Pseudochondrostoma Duriense − in a Vertical Slot Fishway. Knowl. Manag. Aquat. Ecosyst. 2016, 417, 10. [Google Scholar] [CrossRef]
  78. Bravo-Córdoba, F.J.; Fuentes-Pérez, J.F.; García-Vega, A.; Peñas, F.J.; Barquín, J.; Sanz-Ronda, F.J. Brown Trout Upstream Passage Performance for a Fishway with Water Drops between Pools beyond Fish Passage Design Recommendations. Water 2022, 14, 2750. [Google Scholar] [CrossRef]
  79. Sanz-Ronda, F.J.; Ruiz-Legazpi, J.; Bravo-Córdoba, F.J.; Makrakis, S.; Castro-Santos, T. Sprinting Performance of Two Iberian Fish: Luciobarbus bocagei and Pseudochondrostoma Duriense in an Open Channel Flume. Ecol. Eng. 2015, 83, 61–70. [Google Scholar] [CrossRef]
  80. Alexandre, C.M.; Quintella, B.R.; Ferreira, A.F.; Romão, F.A.; Almeida, P.R. Swimming Performance and Ecomorphology of the Iberian Barbel Luciobarbus bocagei (Steindachner, 1864) on Permanent and Temporary Rivers. Ecol. Freshw. Fish 2014, 23, 244–258. [Google Scholar] [CrossRef]
  81. Odeh, M.; Noreika, J.; Haro, A.; Maynard, A.; Castro-Santos, T.; Cada, G. Evaluation of the Effects of Turbulence on the Behaviour of Migratory Fish; US Geological Survey: Reston, VA, USA, 2002; p. 55. [Google Scholar]
  82. Enders, E.C.; Boisclair, D.; Roy, A.G. The Effect of Turbulence on the Cost of Swimming for Juvenile Atlantic Salmon (Salmo Salar). Can. J. Fish. Aquat. Sci. 2003, 60, 1149–1160. [Google Scholar] [CrossRef]
  83. Mallen-Cooper, M.; Zampatti, B.; Stuart, I.G.; Baumgartner, L.J. Innovative Fishways—Manipulating Turbulence in the Vertical Slot Design to Improve Performance and Reduce Cost; Murray Darling Basin Authority: Canberra, NSW, Australia, 2008. [Google Scholar]
  84. Hinch, S.G.; Bratty, J. Effects of Swim Speed and Activity Pattern on Success of Adult Sockeye Salmon Migration through an Area of Difficult Passage. Trans. Am. Fish. Soc. 2000, 129, 598–606. [Google Scholar] [CrossRef]
  85. Alexandre, C.M.; Ferreira, T.F.; Almeida, P.R. Fish Assemblages in Non-Regulated and Regulated Rivers from Permanent and Temporary Iberian Systems. River Res. Appl. 2013, 29, 1042–1058. [Google Scholar] [CrossRef]
  86. Laine, A.; Jokivirta, T.; Katopodis, C. Atlantic Salmon, Salmo salar L., and Sea Trout, Salmo trutta L., Passage in a Regulated Northern River—Fishway Efficiency, Fish Entrance and Environmental Factors. Fish. Manag. Ecol. 2002, 9, 65–77. [Google Scholar] [CrossRef]
  87. Betancur-R, R.; Wiley, E.O.; Arratia, G.; Acero, A.; Bailly, N.; Miya, M.; Lecointre, G.; Ortí, G. Phylogenetic Classification of Bony Fishes. BMC Evol. Biol. 2017, 17, 162. [Google Scholar] [CrossRef]
  88. Vavalidis, T.; Zogaris, S.; Economou, A.N.; Kallimanis, A.S.; Bobori, D.C. Changes in Fish Taxonomy Affect Freshwater Biogeographical Regionalisations: Insights from Greece. Water 2019, 11, 1743. [Google Scholar] [CrossRef]
Figure 1. View of the experimental fishway with adjustable slope. A—downstream tank; B—open-channel; C—hydraulic shaft (slope range 0–15.2%); D—upstream tank; E—pump; F—flow meter; G—acclimation chamber; A1—Antenna 1 and A2—Antenna 2; P1 to P6—Pool 1 to Pool 6.
Water 16 00439 g001
Figure 2. View of a pool of the configurations tested, including top-view details of the slot area: (a) vertical slot fishway—VSF (VSF1 hm = 0.55 m; VSF2 hm = 0.80 m); and (b) vertical slot fishway equipped with a deep notch (created using a sill 0.10 m high)—DN (DN1 hm = 0.55 m; DN2 hm = 0.80 m). The tested pool mean water depth values (hm) are also presented (in red).
Water 16 00439 g002
Figure 3. Kaplan–Meyer curves for the proportion of fish detected in antenna A1 (first attempt) since the beginning of the trial in the four configurations tested. VSF 1 (Q = 81 Ls−1); VSF 2 (Q = 110 Ls−1); DN1 (Q = 71 Ls−1); DN 2 (Q = 99 Ls−1).
Water 16 00439 g003
Figure 4. Kaplan–Meyer curves for the proportion of fish and respective transit time per meter height for the four configurations tested. VSF 1 (Q = 81 Ls−1); VSF 2 (Q = 110 Ls−1); DN1 (Q = 71 Ls−1); DN 2 (Q = 99 Ls−1).
Water 16 00439 g004
Figure 5. Mean velocity magnitude and 3D time-averaged velocity vector patterns (scaled by mean velocity magnitude) at z = 50%hm: (a) VSF1; (b) VSF2; (c) DN1; (d) DN2.
Water 16 00439 g005
Figure 6. Iso-volume of mean velocity magnitudes higher or equal to 0.81 ms−1: (a) VSF1; (b) VSF2; (c) DN1; (d) DN2.
Water 16 00439 g006
Figure 7. Iso-volume of TKE with magnitudes higher than 0.05 m2s−2: (a) VSF1; (b) VSF2; (c) DN1; (d) DN2.
Water 16 00439 g007
Table 1. Summary of the main hydraulic parameters of each configuration tested.
ConfigurationVSF1VSF2DN1DN2
I (%)15.2
L (m)1.85
B (m)1.00
b (m)0.10
Δh (m)0.28
Q (Ls−1)811107199
hm (m)0.550.800.550.80
Cd0.500.500.500.50
Pv (Wm−3)222208194187
Notes: I—channel slope, L—pool length, B—pool width, b—slot width, ΔH—head drop between pools, Q—flow discharge, hm—pool mean water depth, Cd—discharge coefficient, and Pv—volumetric power dissipation.
Table 2. Estimation of the parameters of the Cox Proportional Hazard models (β: regression coefficient; HR: hazard ratio = exp (β); SE: standard error) for the response variables in relation to the body length (in cm), the condition factor, and the trial. None of the selected Cox models violated the proportional hazard assumptions.
β ± SEp-ValueHR
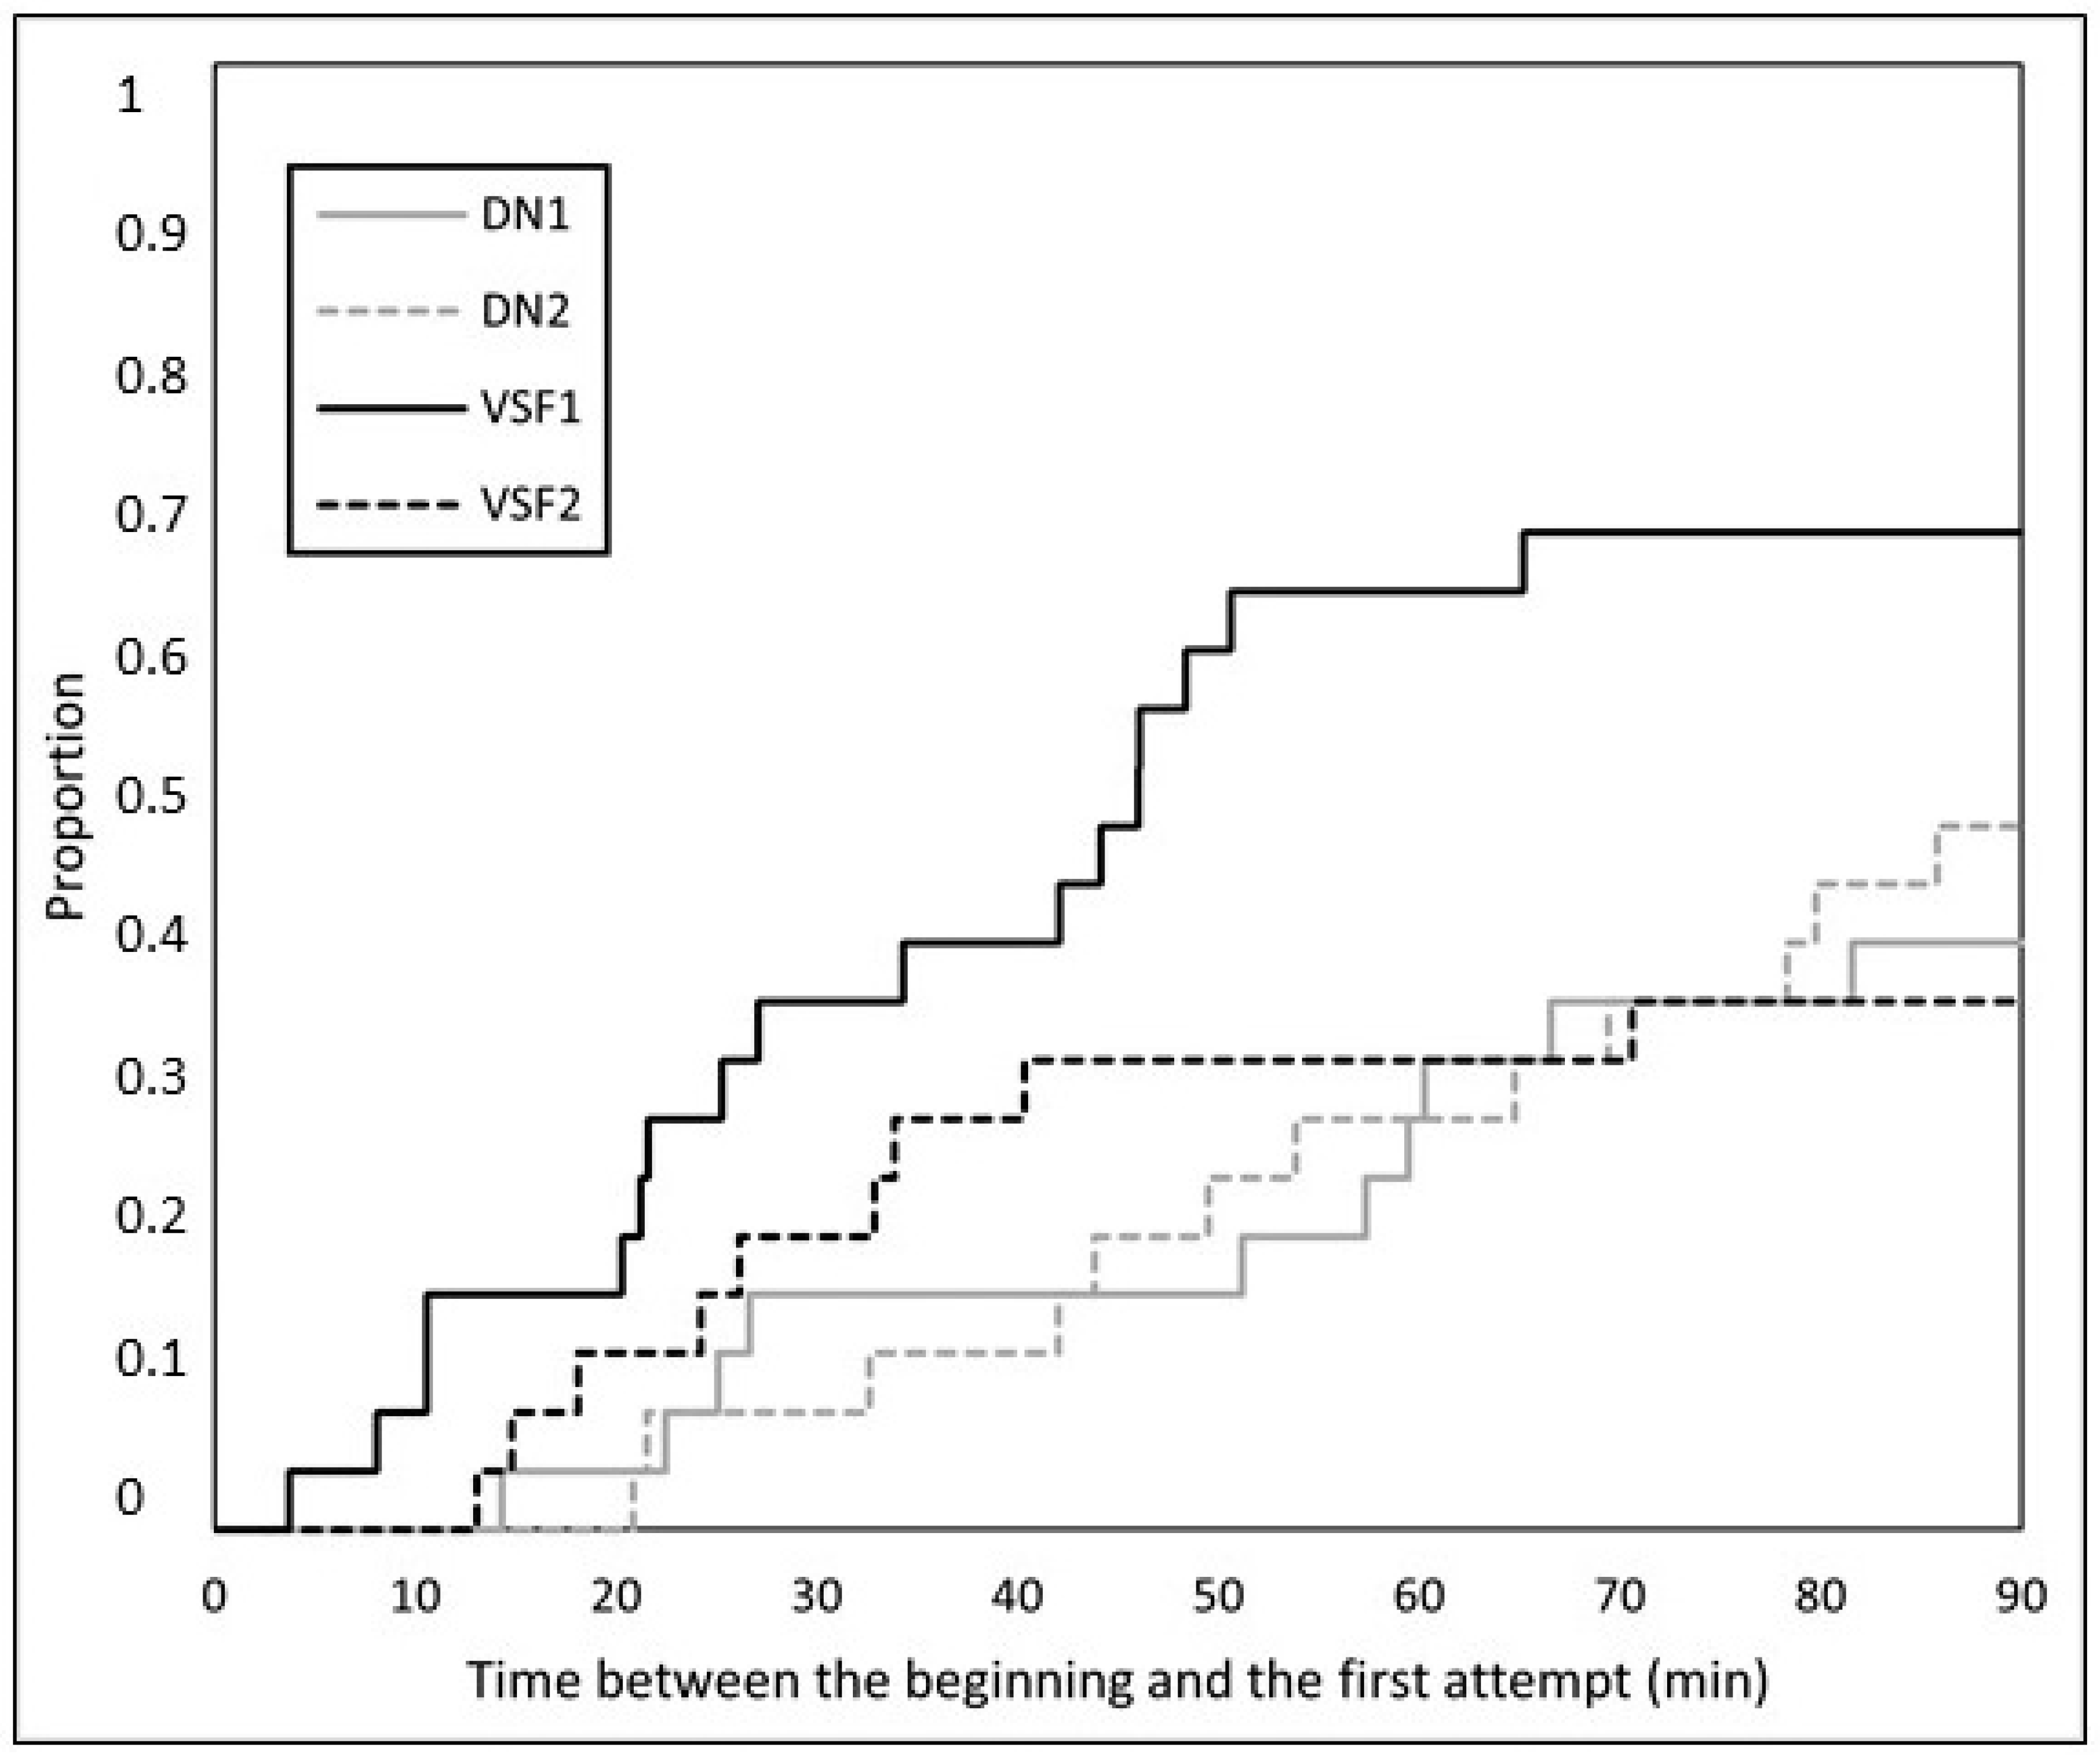
Time between the beginning and the first attempt (n = 100)
Body length (cm)0.110 ± 0.0560.0501.116
Condition factor−4.542 ± 2.0980.0300.011
Trial = DN1−0.810 ± 0.4040.0450.445
Trial = DN2−0.708 ± 0.3790.0620.493
Trial = VSF1Reference level
Trial = VSF2−0.868 ± 0.4180.0380.420
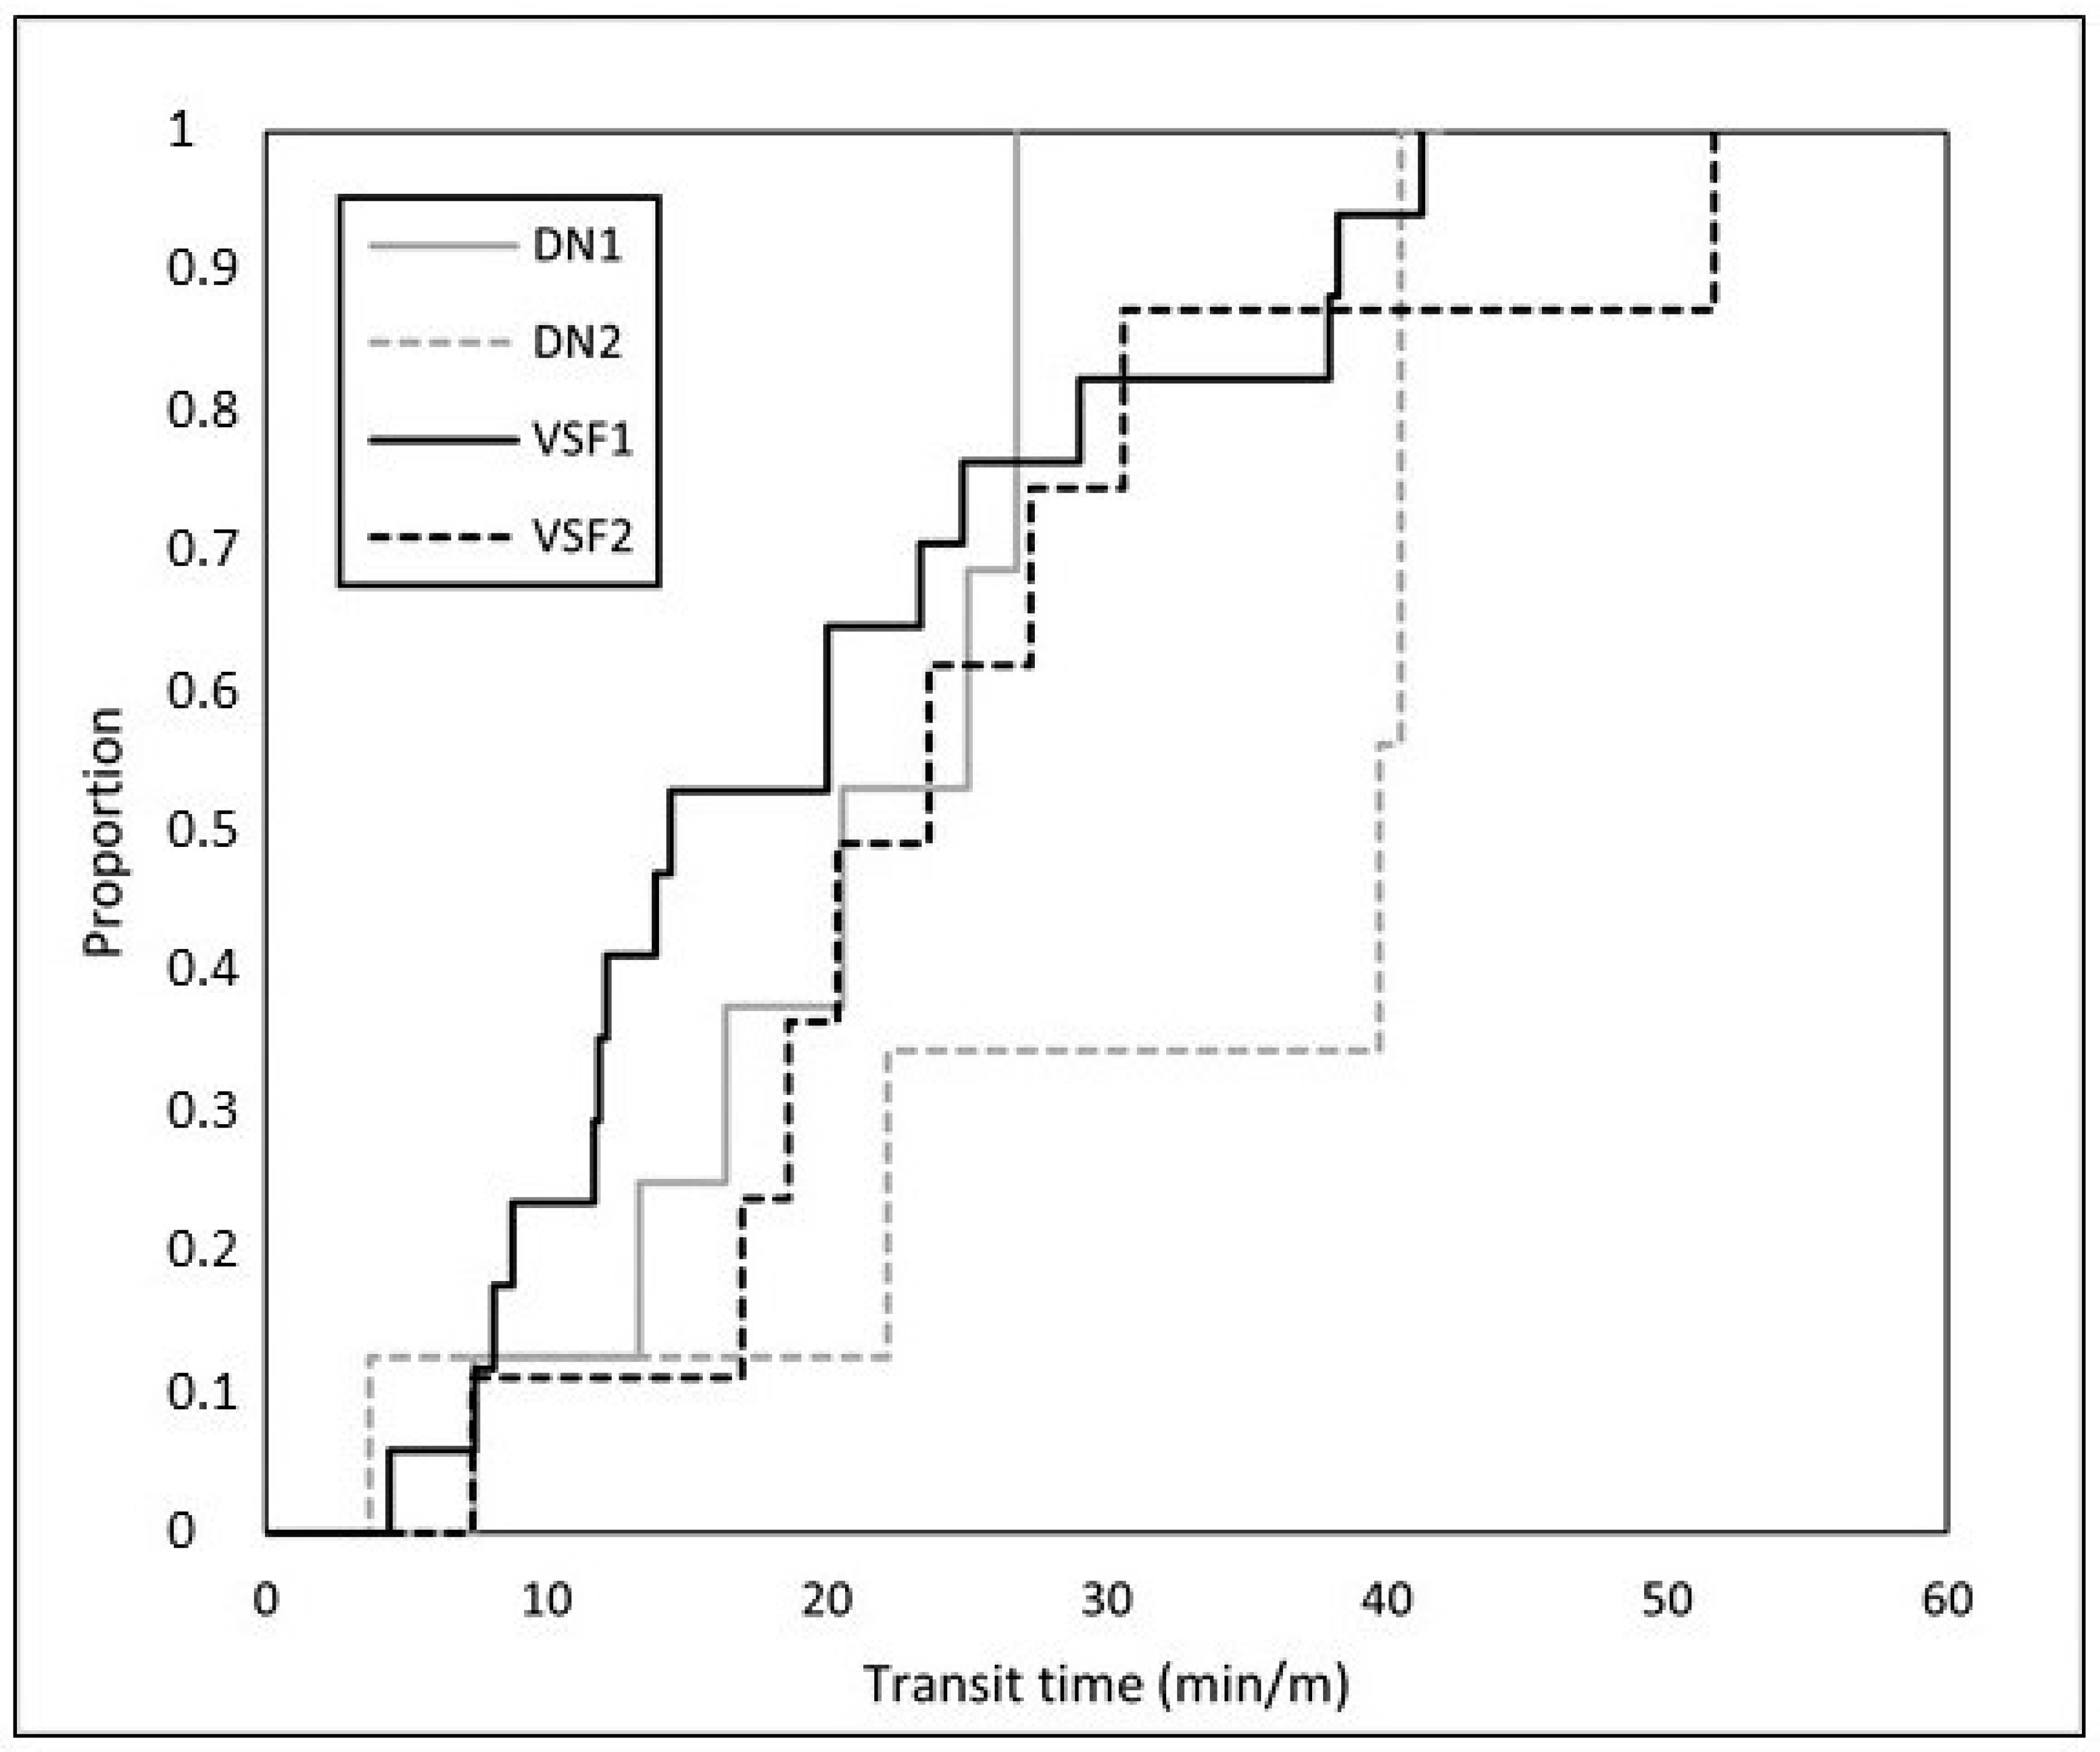
Transit time per meter of ascended height (n = 47)
Body length (cm) 0.236
Condition factor 0.379
Trial = DN1−0.352 ± 0.4850.4670.703
Trial = DN2−1.851 ± 0.6300.0030.157
Trial = VSF1Reference level
Trial = VSF2−0.472 ± 0.4520.2960.624
Table 3. Hydrodynamic characterization. Discharges, volume averaged and maximum mean velocity magnitudes (U average and U max), turbulent kinetic energy (TKE average and TKE max) parallel to the bottom Reynolds shear stress (RSS average and RSS max), and % of pool volume (Vol.), where U and TKE are lower than a given threshold of the vertical slot (VSF1 and VSF2) and deep notch fishway (DN1 and DN2).
Fishway ConfigurationVSF1VSF2DN1DN2
Q (Ls−1)811107199
Uaverage (ms−1)0.410.460.450.45
Umax (ms−1)2.522.482.502.54
Vol.U≤0.81 ms−1 (%)91908580
TKEaverage (m2s−2)0.0790.0780.0770.073
TKEmax (m2s−2)0.730.760.620.72
Vol.TKE≤0.05 m2s−2 (%)54514437
RSSaverage (Pa)869710598
RSSmax (Pa)115110389931197
Disclaimer/Publisher’s Note: The statements, opinions and data contained in all publications are solely those of the individual author(s) and contributor(s) and not of MDPI and/or the editor(s). MDPI and/or the editor(s) disclaim responsibility for any injury to people or property resulting from any ideas, methods, instructions or products referred to in the content.

