Article

Prediction of Sunlight- and Salinity-Driven Inactivation Kinetics of Microbial Indicators with Validation in a 3D Water Quality Model

by
Chomphunut Poopipattana
1,*,
Motoaki Suzuki
2,
Manish Kumar
1,3,4 and
Hiroaki Furumai
1
1
Research and Development Initiative, Chuo University, Tokyo 192-0393, Japan
2
Department of Urban Engineering, The University of Tokyo, Tokyo 113-8656, Japan
3
Escuela de Ingeniería y Ciencias, Technologico de Monterrey, Campus Monterey, Monterrey 64700, Mexico
4
Sustaianbility Cluster, School of Advanced Engineering, UPES, Dehradun 248007, India
*
Author to whom correspondence should be addressed.
Water 2024, 16(3), 437; https://doi.org/10.3390/w16030437
Submission received: 15 December 2023 / Revised: 13 January 2024 / Accepted: 17 January 2024 / Published: 29 January 2024
(This article belongs to the Special Issue Sustainable Water Supply, Sanitation and Wastewater Systems)

Abstract

:
We conducted laboratory experiments under varied solar radiation and salinity levels to investigate their influences on the natural attenuation of multiple promising microbial indicators including fecal bacteria and two types of bacteriophages. Inactivation coefficients were estimated and compared following first-order kinetics. Somatic coliphage was found to be the most resistant, while fecal bacteria exhibited higher susceptibility to both factors. The estimated inactivation coefficients of E. coli were applied to a 3D water quality model and validated with a daily basis monitoring dataset. The validation revealed high consistency among modelled and monitored concentrations, with a less than 1-log concentration difference. Further, the effect of actual solar radiation and salinity on E. coli inactivation after a rainfall event was calculated and compared. The results exhibited that solar radiation is a stronger influential factor. Simulation illustrated that lower-strength radiation exposure can limit E. coli inactivation, enabling them to survive up to one week after combined sewer overflow (CSO) discharge. The model revealed a promising capacity as a tool for the timely prediction of the CSO-induced severity of microbial contamination and associated risk, as well as associated natural attenuation; thus, this model can enhance the competency of public water managers for decision making.

1. Introduction

When it comes to off-site sanitation, there are two ways to carry the sewage: (a) separate systems, wherein only the sewage including the grey water travels through the network, while a separate network system is placed for carrying the stormwater; and (b) combined system, where the entire network is responsible for carrying both the sewage generated from the households as well as the stormwater from surface runoff. The most used off-site sanitation network is the combined sewer system (CSS), a conventional system that is still in operation in many urban and semi-urban areas worldwide, including Tokyo in Japan. For instance, more than 80% of the extensive sewerage network that runs through Tokyo is CSS [1]. The CSS has several advantageous characteristics, like (i) easier to construct, (ii) low-cost maintenance, (iii) hydraulically easy to transport and stable, and (iv) reduced emission of urban non-point source pollution loads in the case of limited rainfall. However, there are several limitations as well, for example, conveying wastewater and stormwater runoff in the same systems leads to a wide range of pollutants spilling into receiving water during intense rainfall events. In fact, it has been reported that Tokyo has more than 700 stormwater overflow chambers and 30 CSO events every year, posing potential health risks to coastal waterfront areas [2]. Thus, combined sewer overflow (CSO) is recognized as a major source of contamination that potentially poses risks to human health and aquatic ecosystems. This is primarily due to several chemical and biological hazardous discharges, such as pathogens like Vibrio cholerae, Shigella spp., Salmonella gastroenteritis, and multidrug-resistant Enterococcus strains [3,4,5,6,7].
Studies have summarized the impacts on water quality from CSO occurrences globally and implied that CSO is a major environmental concern for prospective safe ambient water [8,9,10]. Despite an aged sewer system, the various impacts of CSO contamination are still not fully understood, thus being frequently studied in recent years [11,12,13]. The estuary of Tokyo, Japan, is one such region that is often heavily contaminated by pollutants sourced from CSO [14,15,16]. A substantial number of CSO discharge points renders it a fundamental diffuse source of pollution, thereby introducing complexities in its management and control. In addition, an estuary is a water system with unique characteristics, especially dynamic in terms of salinity level.
To evaluate the situation of fecal contamination derived from CSO, several microbial indicators have been used to represent fecal contamination. Fecal bacteria including E. coli, as a widely accepted fecal indicator, fecal coliform, and enterococcus were monitored in various studies [17,18,19,20]. Moreover, bacteriophages were proposed to represent viral contamination from human sources due to their similar morphology and biological characteristics to highly resistant and harmful enteric viruses [21,22]. To determine their suitability as fecal indicators in an estuarine environment, it is necessary to understand the fate of these microbial indicators under the influence of salinity and solar radiation. Previous studies have elucidated the adverse impact of solar radiation on E. coli, shedding light on the mechanisms behind its damage, including the role of various solar radiation components such as UV-A and UV-B [23,24,25]. Nevertheless, the discrepancies in the effects of inactivation may arise due to variations in solar radiation intensity and the specific strains of E. coli engaged across different research investigations. On the other hand, water quality models are proven to be a useful and powerful tool to understand the behavior of pollutants and to support the decision making in water safety management [15]. They can be used to describe the temporal and spatial variability in microbial concentrations without labor-intensive workloads and limitations due to detection methods. In addition, multiple scenarios can be replicated and examined.
In the past, various researchers focused on developing water quality models for the receiving water bodies simulating the spatio-temporal variations in the microbial concentrations emerging from CSOs. For instance, a 3D model was developed to assess the environmental impact of the discharge of treated wastewater into the sea [26]. Similarly, for riverine conditions, river quality models were constructed [17,27]. Furthermore, a 2D model for a tidal estuary was provided [28]. Studies introduced three-dimensional hydrodynamics into their water quality models considering lakes to understand the dynamics of E. coli in rivers and sewers [29,30]. Also, the integration of urban discharges with water quality models resulted in a better understanding of the spatio-temporal variability in the microbial loading due to CSOs [31,32].
In this study, E. coli behavior in coastal waters was further comprehended through the modelling approach. A study introduced hydrodynamic modelling using E. coli as an indicator of contamination in a CSO-affected coastal area in Norway [33]. However, the hydrodynamic conditions are greatly related to the geographical conditions of the region. In the present study, we attempted to replicate the situation after rainfall events to obtain the most accurate coefficients for E. coli inactivation. The coefficients are area-specific and expected to provide higher accuracy in the model predictions compared to literature-obtained coefficients. Overall, the objectives of this study are as follows: (i) to determine salinity- and solar-radiation-driven inactivation kinetics of three types of fecal bacteria and two types of bacteriophages, (ii) to apply and validate a 3D water quality model for the prediction of E. coli inactivation, and (iii) to estimate the effect of salinity and solar radiation on E. coli inactivation.

2. Materials and Methods

2.1. Laboratory Experiment

Experiments were designed to investigate the effect of sunlight and salinity on inactivation rate of microbial indicators. All experiments were conducted in a light-simulated chamber (MF 400GC/BUD, KOITO, Tokyo, Japan) with controlled temperature and humidity. Metal halide lamps were used in the chamber due to the similarity of their wavelength to actual sunlight (300–800 nm). The experimental setup is shown in Figure 1, consisting of glass petri dishes, with a size of 90mm in diameter and 60mm in height, placed over a magnetic stirrer at constant speed. Water bath was used to prevent overheating. The dishes were wrapped in aluminum foil on the side to prevent light exposure. Triplicates were conducted for all four salinity levels, i.e., 0, 5, 10, and 20 Practical Salinity Units (PSUs). In addition, fully covered dishes were included in dark conditions. Temperature was maintained at 25 °C and humidity at 80%.
To imitate the real situation after rainfall events, raw wastewater was obtained from a wastewater treatment plant in the experimental area. Wastewater sampling was carried out in the mornings of three separate weekdays under dry weather conditions. Prior to use, samples were thoroughly mixed with a vortex mixer and filtered through a 3 µm mixed cellulose ester membrane (ADVANTEC, Oyama, Japan) to remove turbidity. After that, 10-times dilution with milli-Q water and salinity adjustment with artificial seawater powder was conducted to mimic the coastal surface water conditions. In addition, general water quality items are summarized in Supplementary Materials (Tables S1 and S2).
Under dark conditions, 200 mL of sample was placed in the dishes. Subsequently, 10 to 15 mL of sample was drawn sequentially 6 times at an interval of every 24 h to measure the concentrations of five target microbial indicators. On the other hand, 270 mL was used in light conditions, and 15 to 50 mL of sample was drawn for the analysis 6 times over 32 h. The petri dishes were weighed before and after sampling to consider evaporation. Radiation intensity was monitored using a light sensor (LI-1500, Ricoh, Tokyo, Japan). Experiment units at 0 PSU were exposed to an average radiation of 289 W/m2, whereas average radiation of 348 W/m2 was monitored for 5, 10, and 20 PSUs.
For the microbial analysis, E. coli and enterococcus were cultured for 24 h and measured using Chromocult coliform agar (Merck, Darmstadt, Germany). The fecal coliform was counted using desoxycholate agar (Eiken Chemical, Tokyo, Japan). F-specific bacteriophage or F-phage (FPH) was determined by the single-agar layer plate counting method using Salmonella typhimurium WG 49 as the host strain, modified from [34]. Somatic coliphage (SOMCPH) was determined by the double-agar layer plate counting method using E. coli WG5 as the host strain, following [35].

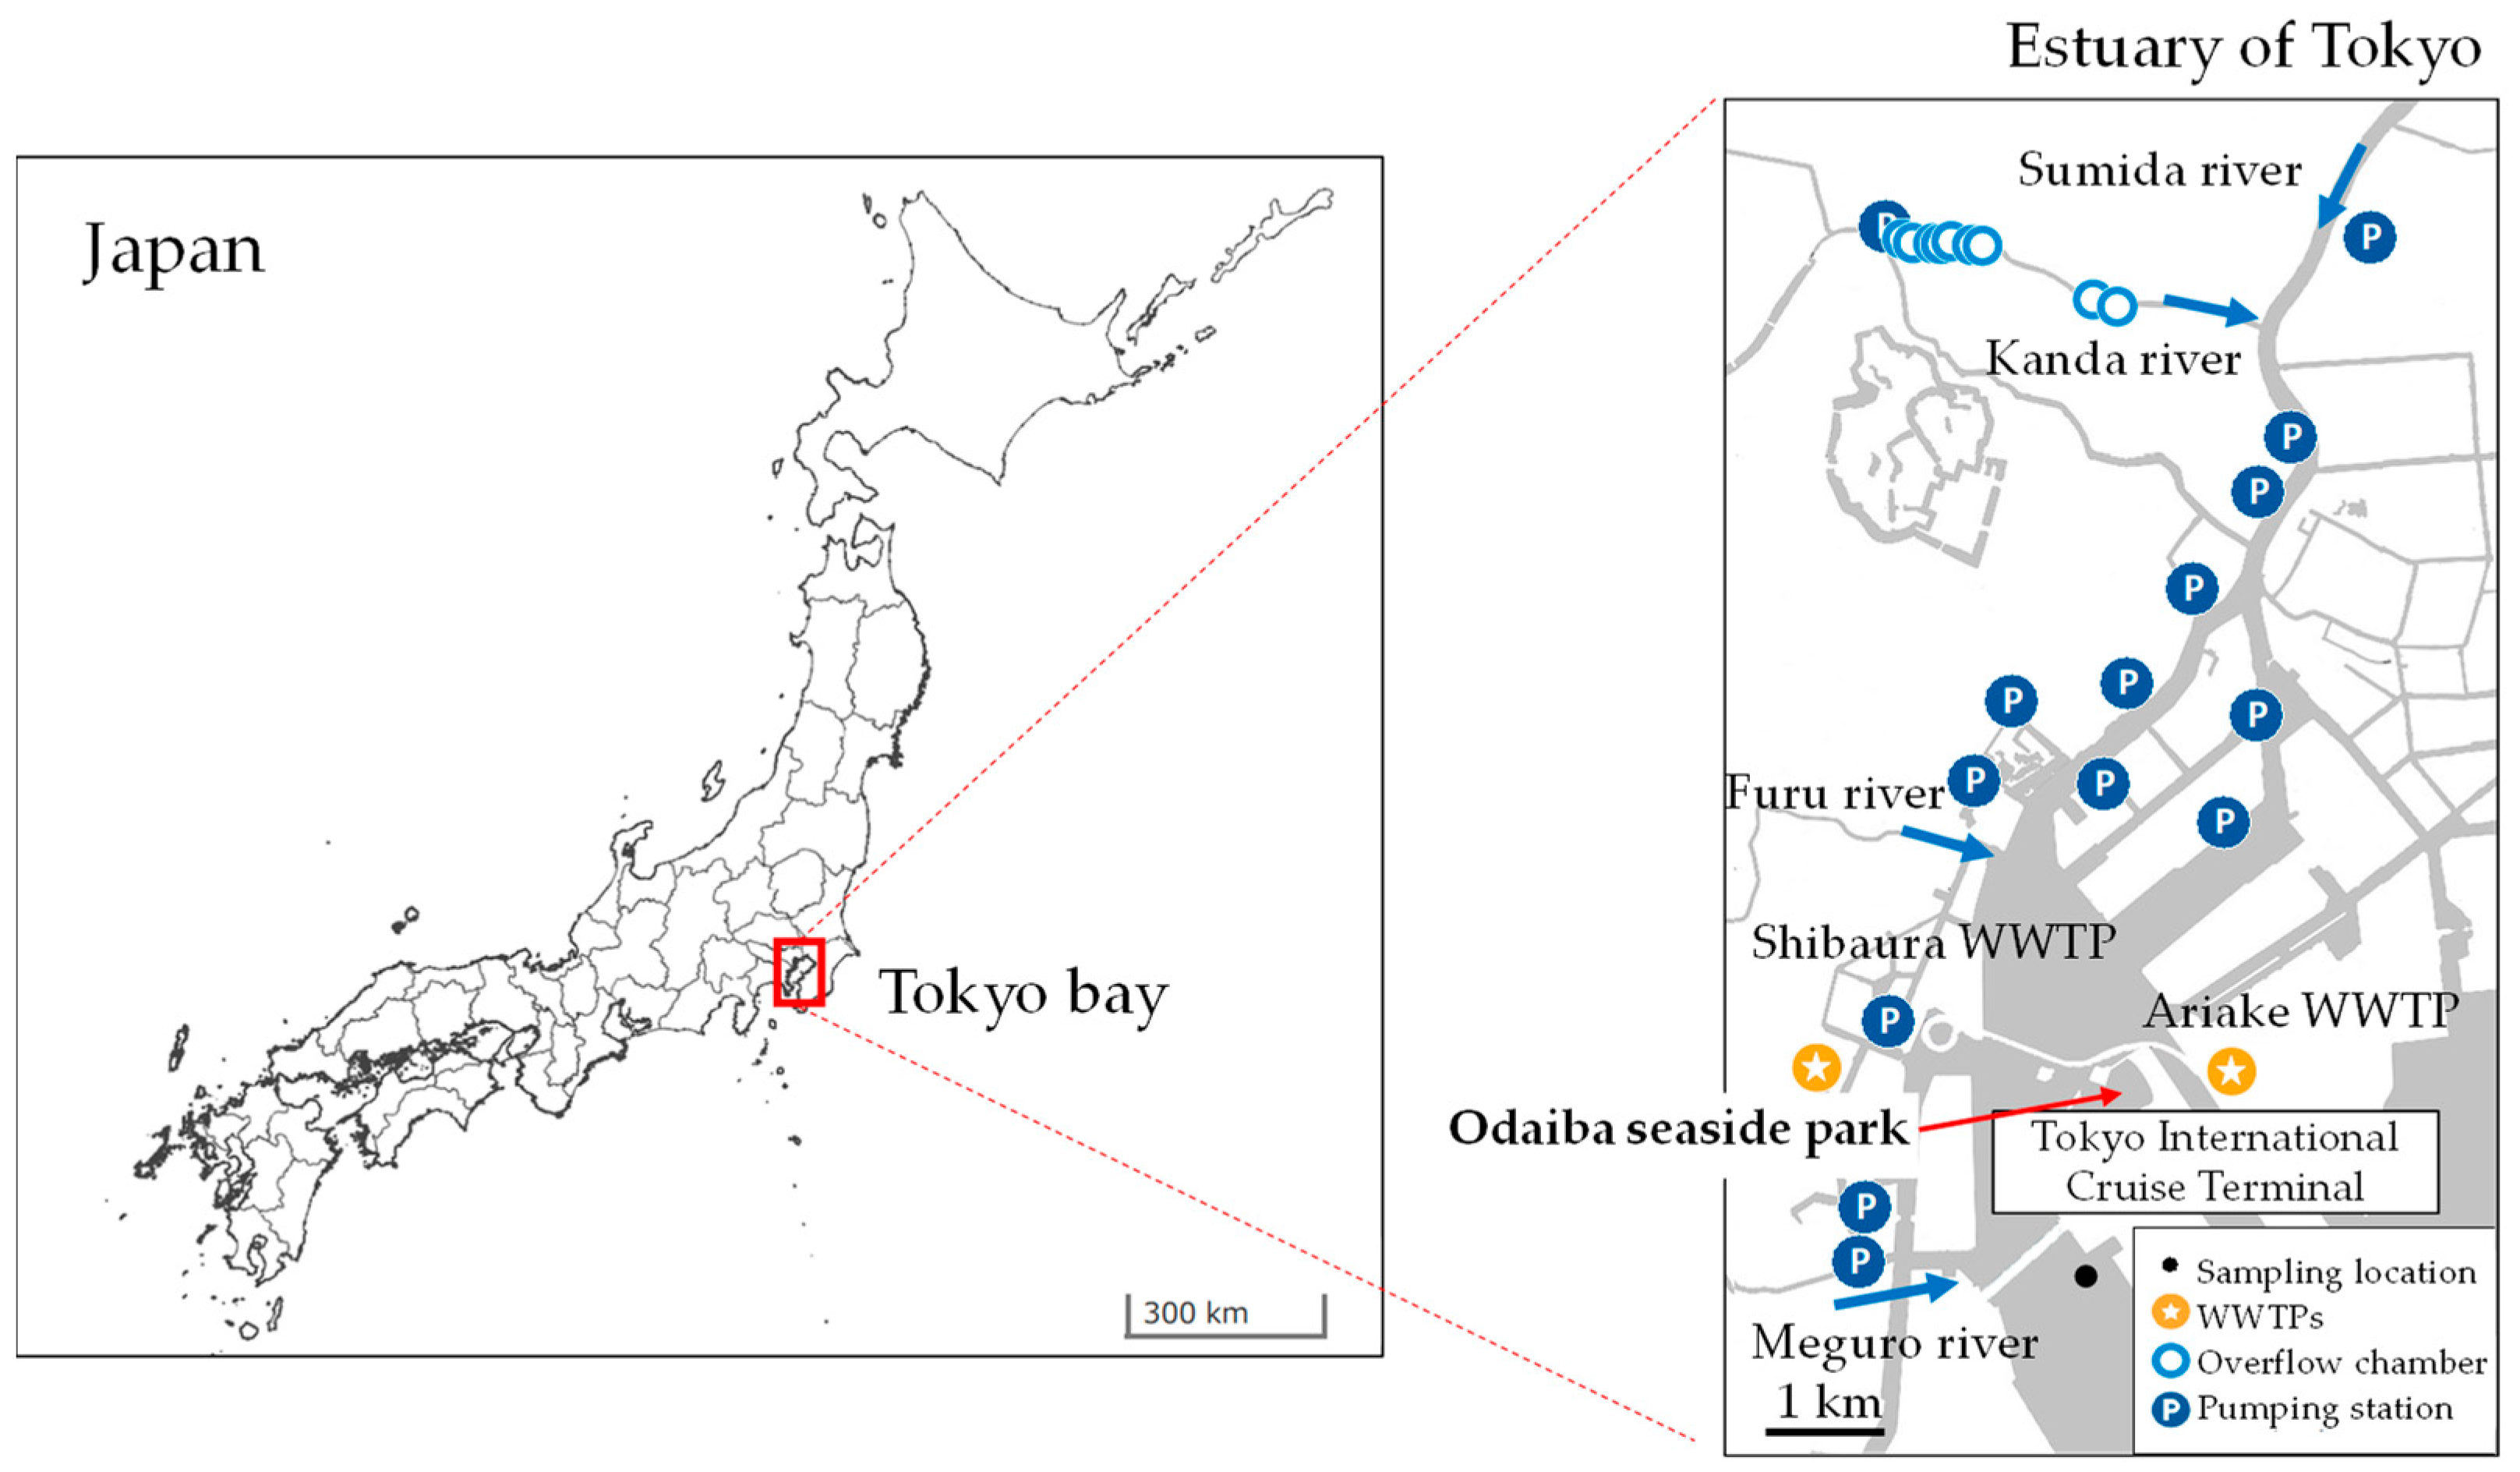
2.2. Study Area and Water Quality Monitoring

The study area is the estuary of Tokyo, situated in the inner part of Tokyo Bay, Japan. The area occasionally receives pollutants from urban rivers upstream and other sources, as illustrated in Figure 2. Located in the estuary is a well-known place for water activities called “Odaiba seaside park”. The Tokyo metropolitan area is located in the humid subtropical region, characterized by hot and humid summers and cool to mild winters. The annual average temperature is 15 °C, and annual precipitation is approximately 1640 mm. The wet season occurs during the summer months, typically from June to September. The data were obtained from the Japan Meteorological Agency (JMA) for the period from 2000 to 2023 [37].
A daily water sampling campaign was conducted. Surface water samples were collected at Tokyo International Cruise Terminal consecutively for 23 days at the same time (11:00 AM–12:00 AM), from 8 to 30 November 2021. Map and photos of sampling location are shown in Figure 2 and Figure 3. Stainless-steel bucket was used for the collection of water samples and transferred to 180 mL pre-sterilized polyethylene bags, and they were transported to laboratory for E. coli and total coliform analyses. Two rainfall events occurred during the sampling period, viz. 48 mm rainfall with max. intensity of 11 mm/hr on November 9th and 37 mm rainfall with max. intensity of 6.5 mm/hr during November 21st and 22nd.
For better efficiency, E. coli and total coliform were measured using Colilert® test kit (IDEXX Laboratories, Inc., Westbrook, ME, USA). In addition, enterococcus was enumerated using EnterolertTM test kit. Water sample dilution was performed according to the expected concentrations with an exception for EnterolertTM, which required at least 10-times dilution due to the inhibiting effect of high-saline water. Firstly, water samples were mixed with reagent in 100 mL sterile bottles and poured into Quanti-tray/2000. Trays were sealed and incubated at 35 °C for Colilert® and 41 °C for EnterolertTM for 24 h, according to manufacturer’s instructions. After that, results were read under UV light. Yellow wells were counted as positive for total coliform, and yellow and fluorescent wells were counted for E. coli. As for EnterolertTM, yellow wells were counted as positive. Concentrations were calculated based on Most Probable Number (MPN) method. Monitoring results were used to validate the model predictions.

2.3. Three-Dimensional Water Quality Model

Detailed information of the model was described previously [15] with modifications. In brief, the simulation program was written in FORTRAN. Model validation was previously conducted through a comparison of simulation results with observation results of salinity, temperature, and E. coli concentration [15,38]. The hydrodynamic model consists of two nested computational models, including the Tokyo Bay model and the Odaiba model. The Tokyo Bay model has a 2 km mesh system with dimensions of (25 × 33) in horizontal and vertical grids. On the other hand, the Odaiba model has a 100 m mesh system with 60 × 290 grids.
As for sources of CSO, 29 pumping stations, 6 sewage treatment plants, and 6 inflow rivers were included in the Odaiba model. In addition, hundreds of overflow chambers located in 23 wards of Tokyo were accounted for in the calculation. Briefly, the total CSO was estimated by adding drainage runoff to the dry weather flow and subtracting with intercepting flow, which is three-times the hourly maximum dry weather flow in Tokyo.
In the Odaiba model, which is intended for use for water safety prediction, E. coli concentration can be reproduced as a fecal indicator. To determine fate of E. coli, inactivation rates, including basic decay rate (kb), inactivation rate by salinity (kS), and inactivation rate by sunlight (kI), were considered, as shown in Equation (1). These inactivation rates were obtained from the experiments mentioned earlier.
k = k b + k S C S + k I I e x p a h
  • k b = basic inactivation coefficient = 0.045 (day1)
  • k S = inactivation coefficient depending on salinity = 0.100 (day−1PSU−1)
  • C S = salinity level (PSU)
  • k I = inactivation factor by sunlight = 0.038 (m2day−1W−1)
  • I = solar irradiance (Wm−2)
  • a = extinction coefficient = 0.65 (m−1)
  • h = water depth (m)

3. Results

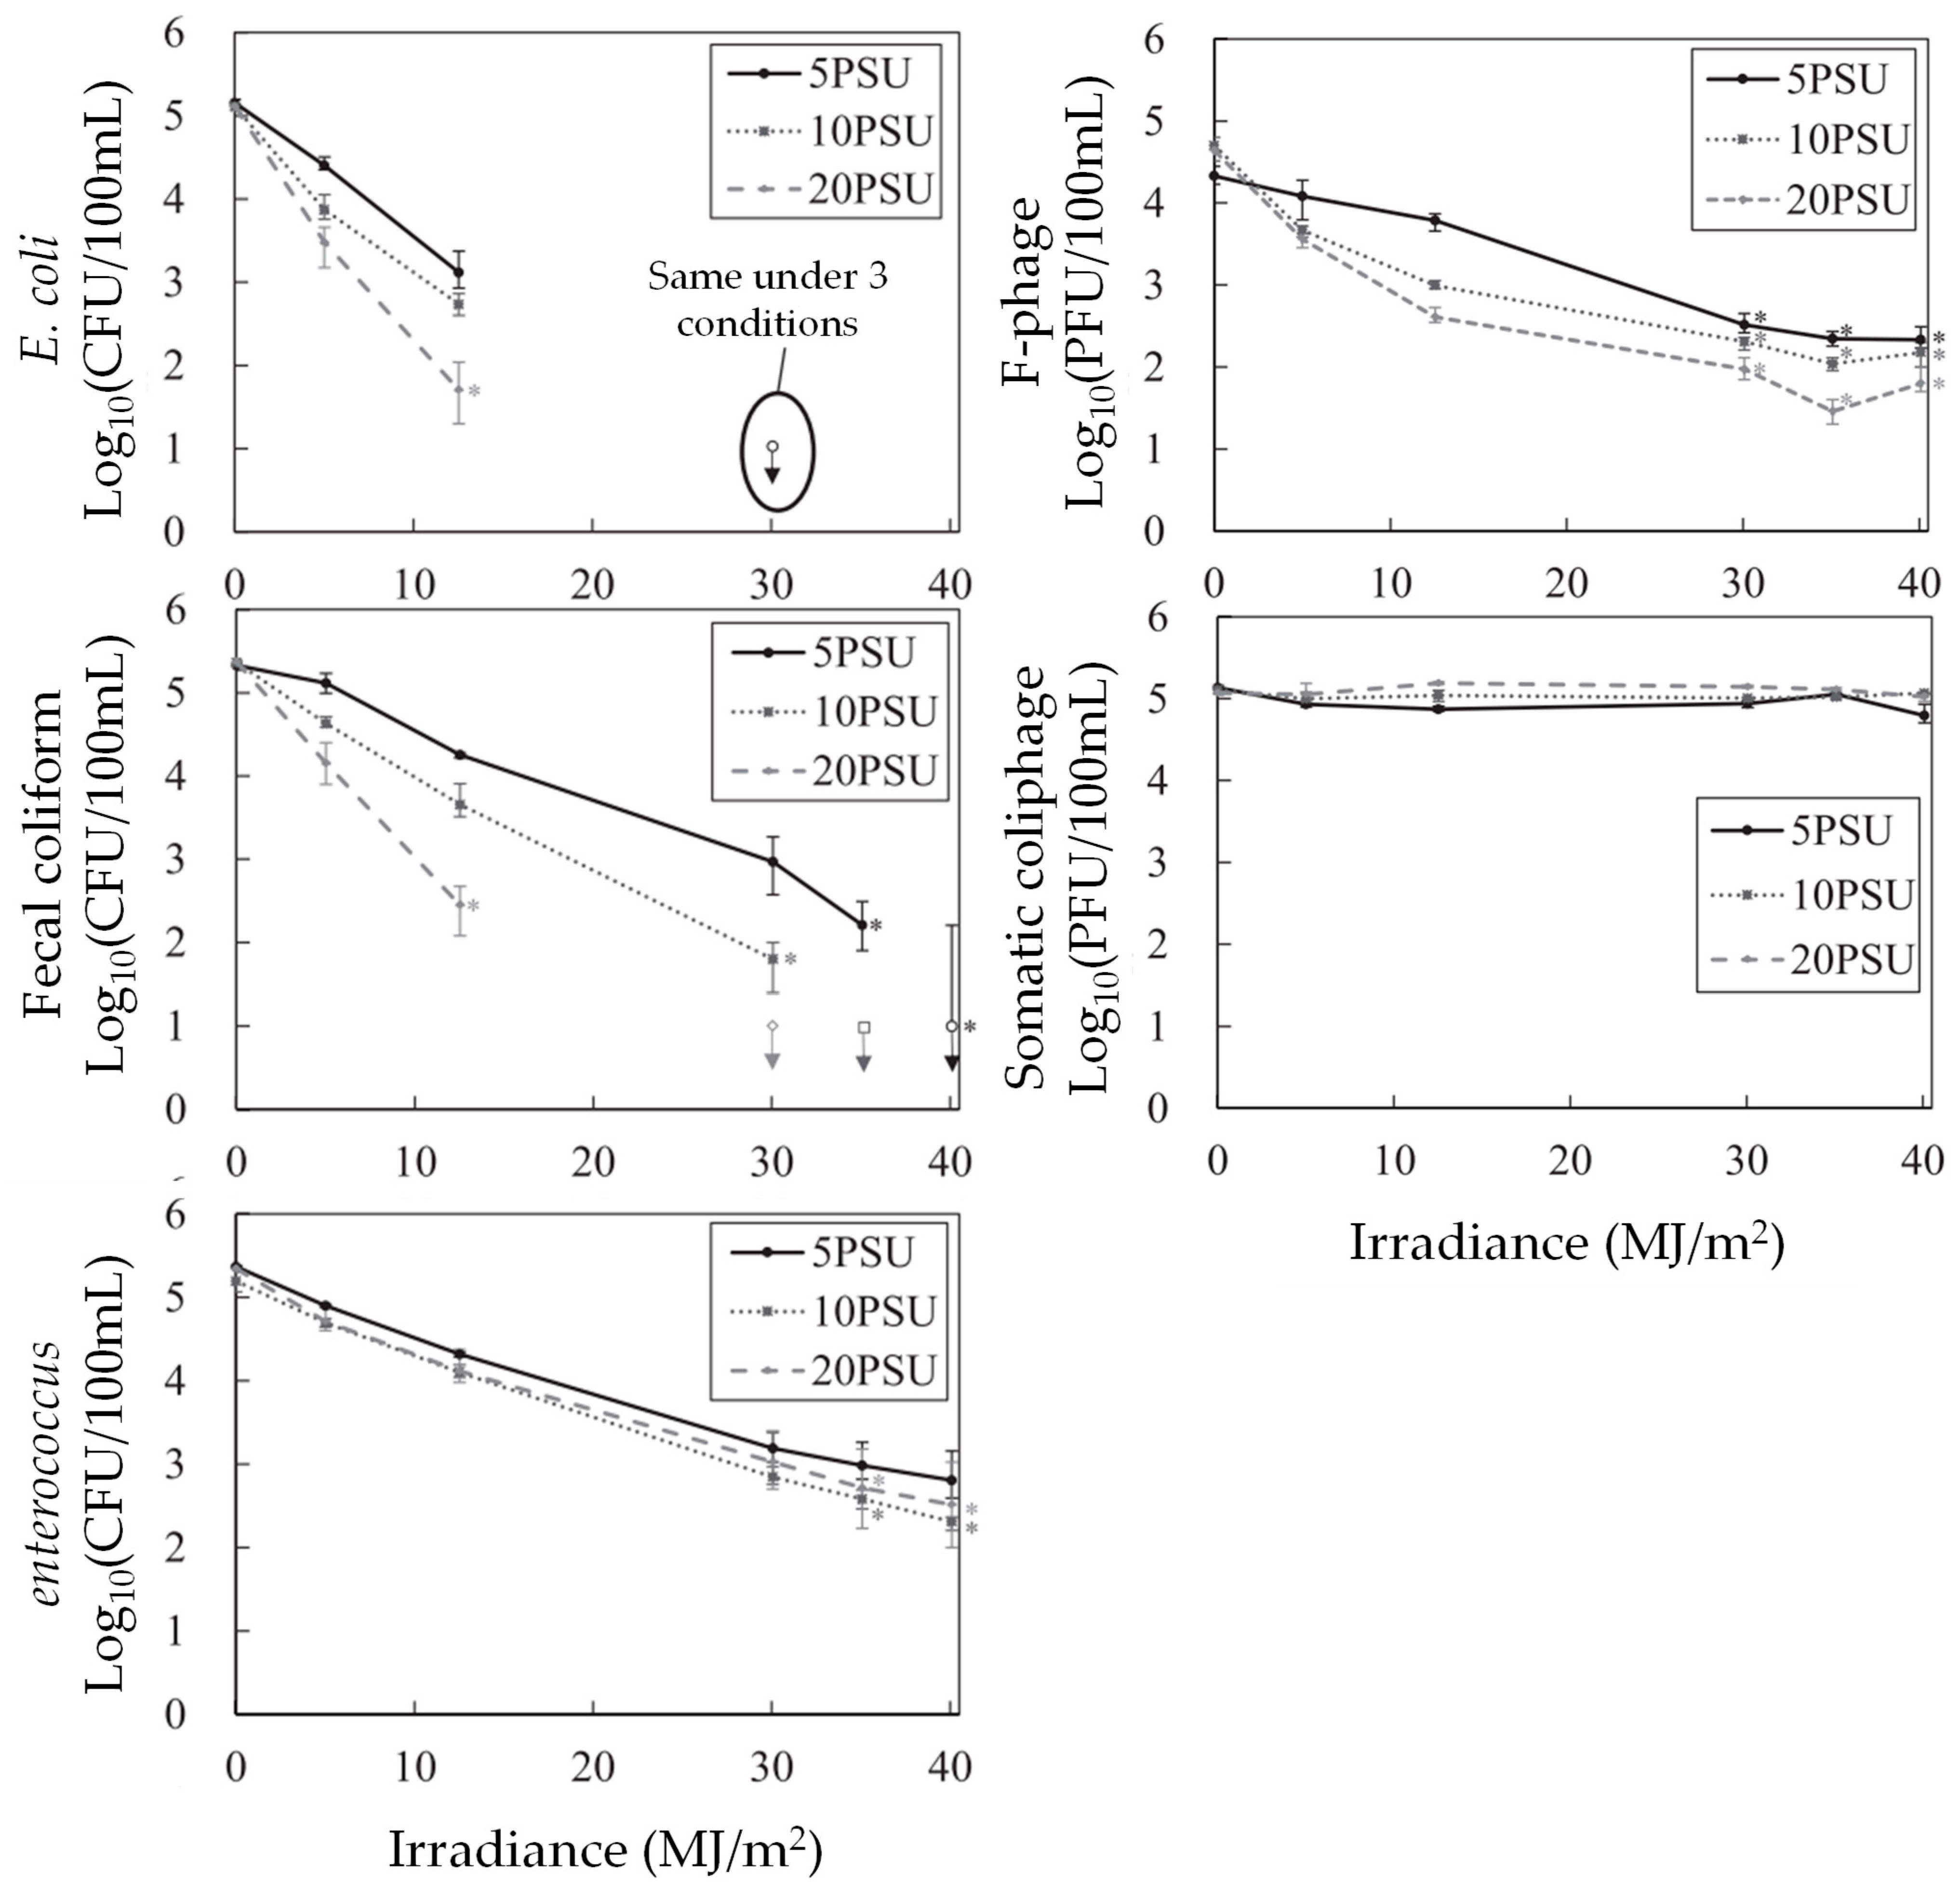
3.1. Inactivation Kinetics of Fecal Bacteria and Bacteriophages

The inactivation coefficients of microbial indicators were calculated following first-order kinetics. The water from the surface level to h level was considered well mixed in the calculations. Basic inactivation coefficients (kb) were estimated from experiments under dark conditions at a salinity of 0 PSU. To estimate the inactivation coefficients for salinity (kS) and solar radiation (kI), a multiple regression analysis was performed. Salinity and solar radiation were used as explanatory variables, with k as the dependent variable.
Results from the experiment are summarized in Table 1 and Table 2. In most cases, the regression model showed R2 > 0.90, suggesting that the model can explain variables well, except for fecal bacteria and both bacteriophages. R2 was found to be quite low in the experiment under dark conditions for F-phage and somatic coliphage (0.68 and 0.20). The reduction in phages over 5 days of the experiment under dark conditions at 0 PSU was small, especially somatic coliphage. It can be explained that both F-phage and somatic coliphage have very high persistence under the specific condition without stresses from salinity and solar radiation. The temporal behavior of all microbial indicators showed a significant influence under salinity and solar radiation, with a p-value less than 0.5.
Comparisons among kS of fecal bacteria imply their different susceptibility to salinity. Enterococcus was found most resistant to salinity with lower kS at 0.012 day1psu1, followed by E. coli and fecal coliform, as illustrated in Figure 4. Due to its thick cell wall structure, enterococcus is more resilient to external stresses such as high osmotic pressure. Pertaining to their sensitivity to sunlight inactivation, kI shows a similar trend, with enterococcus being the most resistant bacteria (0.013 m2day−1W−1), followed by fecal coliform and E. coli. On the other hand, the basic decay rate of enterococcus shows the highest rate at 0.382 day1. Overall, E. coli as well as fecal coliform show higher rates of kS at 0.100 day1PSU1.
On the contrary, somatic coliphage was found to be the most resistant compared with F-phage and other fecal bacteria, as shown in Table 2. The susceptibility of F-phage has been investigated earlier. A previous study found increasing sunlight inactivation of F-phage under higher salinity [39]. The present study found that somatic coliphage was susceptible to shorter solar wavelengths (UV-B and shorter UV-A), while F-phage was more sensitive to longer wavelengths. Their faster decay can be explained with the abundance of longer solar wavelengths presented in high-saline water since the shorter wavelengths were attenuated more in high-saline water. In addition, a previous study that monitored the concentration of bacteriophages in surface water in the area also mentioned the absence of F-phage, showing no long-term survival under high salinity [15].

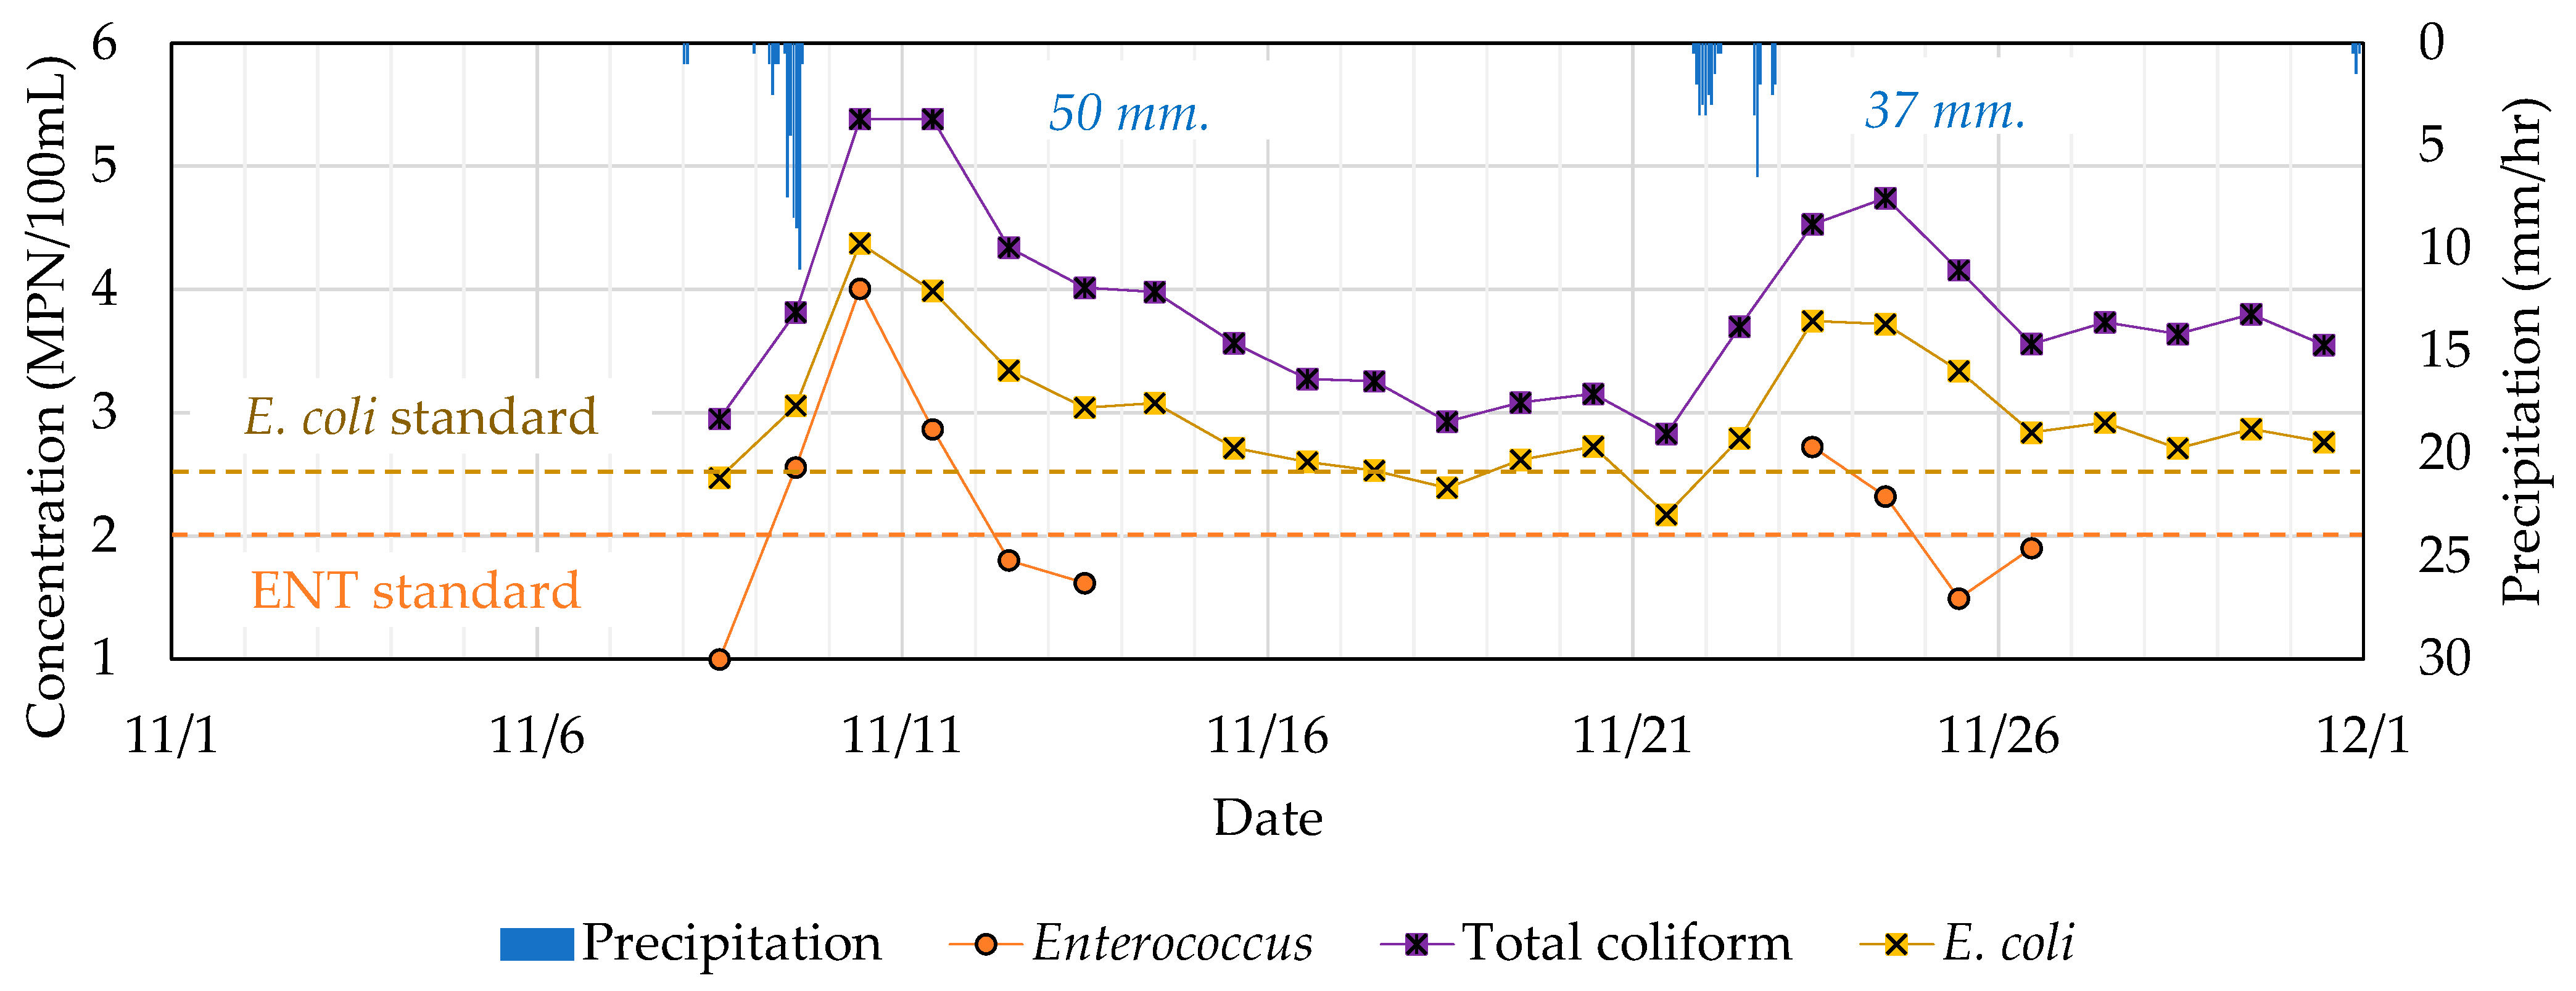
3.2. Water Quality Monitoring at Tokyo International Cruise Terminal

During the sampling period of November 8th to 30th 2021, two rainfall events occurred, which caused significant and rapid increases in the concentration of microbial indicators. As shown in Figure 5, the monitored concentrations of E. coli, total coliform, and enterococcus were all raised to a greater degree for the first rainfall event compared to the second one. Due to the higher max. rainfall intensity and total precipitation, a greater volume of CSO was expected to be discharged, causing a higher microbial load.
Total coliform was around 0.5–1.0 log concentration higher than E. coli, while enterococcus indicated lower concentration levels. The concentration of E. coli exceeded the standard level assigned for triathlon races (250 CFU/100mL) after both rainfall events. Over a one-week period was required for the E. coli concentration to recover to the standard level. The extended period of contamination was observed due to low solar irradiation during wintertime. From November 10th to 17th, the average solar radiation per day was only 12.67 MJ/m2, whereas data exhibited an average of 20.58 MJ/m2 for dry days in August, which is the summer season of the same year.
Similar to E. coli, the enterococcus concentration increased to levels above the standard (100 CFU/100mL) after rainfall. It should be noted that, in some cases, data on Enterococcus concentration were unavailable due to limitations in the availability of the test kit. Compared with other microbial indicators, enterococcus illustrated a slightly different trend, with more a rapid decrease, suggesting their different persistence and behavior in this estuarine system.

4. Discussion

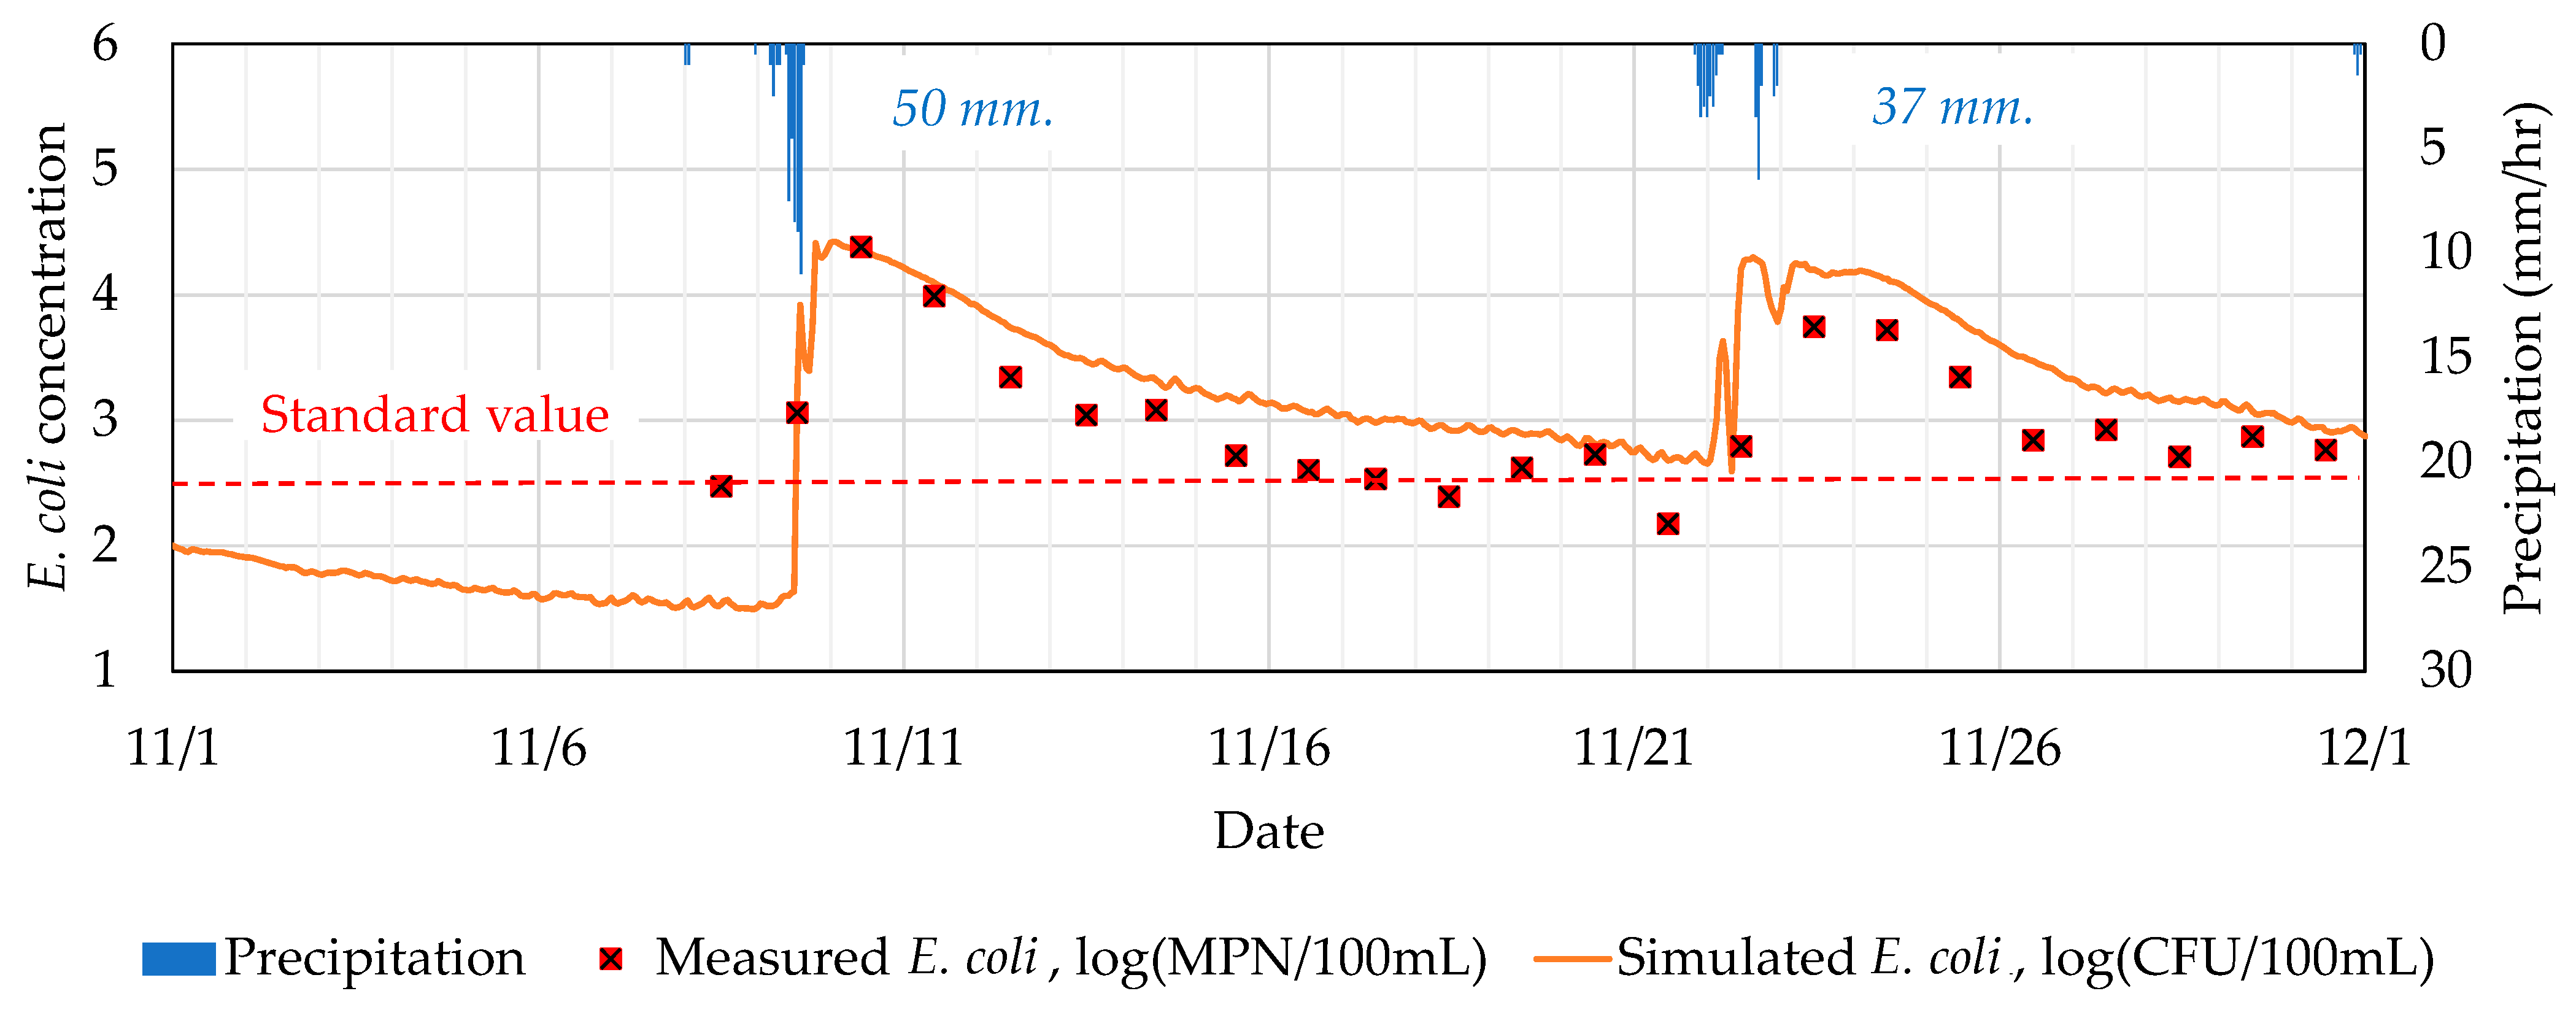
4.1. The Reproducibility of E. coli Concentration in the Water Quality Model

Simulations were conducted for the period of 1 November to 1 December 2021, during which two rainfall events occurred, with total precipitation of 48 and 37 mm, respectively. Time-based simulated and measured E. coli are compared in Figure 6. Overall, the comparison shows high consistency with a less than 1-log concentration difference. The water quality model was able to closely imitate E. coli behavior, including the rising trend, timing of peak concentration, and reduction due to inactivation processes.
Prior to rainfall events, the E. coli level was 2.47 log(MPN/100mL) and gradually increased to the peak concentration within 2 days. The first rainfall event was more intense with max. intensity of 11 mm/hr, which resulted in a higher peak concentration for measured E. coli at 4.38 log (MPN/100mL). On the other hand, the concentration decreased due to natural inactivation processes. Overall, the actual E. coli inactivation was at a slightly higher rate compared to the simulated trend. The difference started to show up after 48 h of attaining the peak concentration. The difference gap was 0.08 to 0.53 log concentration. This may be attributed to the fact that the actual salinity level in the area is higher than simulated values after the rainfall event. As the present study missed the chance to record the salinity level during the monitoring campaign, the same is recommended for future studies.
Summarily, due to the observed close resemblance between actual measurements through environmental monitoring and that predicted by the used water quality model, a real-time prediction is possible for E. coli concentration in the coastal area of Tokyo using the water quality model.

4.2. Effect of Salinity and Solar Radiation to E. coli Inactivation

The inactivation effects of solar radiation and salinity were estimated separately using kinetic rates from the experiments. The salinity used in the calculations were outputs of the water quality model. Figure 7 illustrates the cumulative inactivation effect on E. coli due to solar radiation and salinity over time, incorporating the actual solar radiation values and simulated salinity at Odaiba seaside park. The effects were calculated in terms of the time integration of inactivation kinetic terms in Equation (1) from the onset of the first rainfall event to just before the second rainfall event.
Despite the differences among salinity levels during and after the rainfall event, the estimated inactivation effect shows an insignificant change. The salinity level was brought down to 16.0 PSU during rainfall before recovering to normal levels of 23.0–24.0 PSU. On the other hand, the influence of solar radiation intensity was illustrated. During the rainfall period, solar radiation was limited, resulting in the minimal inactivation effect. Thus, inactivation due to salinity was more significant during the weak solar radiation. Further, it was observed that the accumulated inactivation effect of solar radiation increases in a step pattern, owing to the lack of radiation at nighttime.
Over several days after the rainfall event, the effect of solar radiation accumulated and became much higher than the effect of salinity. The estimation clearly shows that solar inactivation is more influential on E. coli inactivation, especially over an extended period. In the case of a long rainfall event with precipitation that continues for several days, a lower salinity level in the surface water, as well as extended solar radiation absence, is expected to significantly lower the E. coli inactivation rate, causing them to survive longer. Future studies may be focused on evaluating the synergistic effect of solar radiation and salinity on the inactivation rate.
The obtained research is vital for exploring the intricate dynamics within the distinctive estuarine ecosystem, from the perspective of the fate of fecal indictors including three types of fecal bacteria and two types of bacteriophages through laboratory experiments. The notable advantage of the presented approach is the simultaneous examination of multiple fecal indicators that can be replicated elsewhere for obtaining real-time water safety parameters for recreational use. The present study explicitly demonstrated a method for evaluating a broad range of microbial indicators and the effect of the estuarine environment on them. It also demonstrated ways to clearly identify the differences among their behavior. The estimation of inactivation kinetics contributes valuable insights into the fates and behavior of microbial indicators in estuarine environments.

5. Conclusions

The influences of solar radiation and salinity on the inactivation of fecal indicators were investigated separately. Critical observations made in this study are summarized in the following points:
  • Somatic coliphages illustrated the highest persistence to both solar radiation and salinity with kI = 0.001 (m2day−1W−1) and kS = −0.010 (day−1PSU−1), whereas fecal bacteria were found to be more susceptible with enterococcus and persisted with kI = 0.013 (m2day−1W−1) and kS = 0.012 (day−1PSU−1). This is owing to the thick cell wall structure of the enterococcus, enabling it to be more resilient to external stresses such as high osmotic pressure.
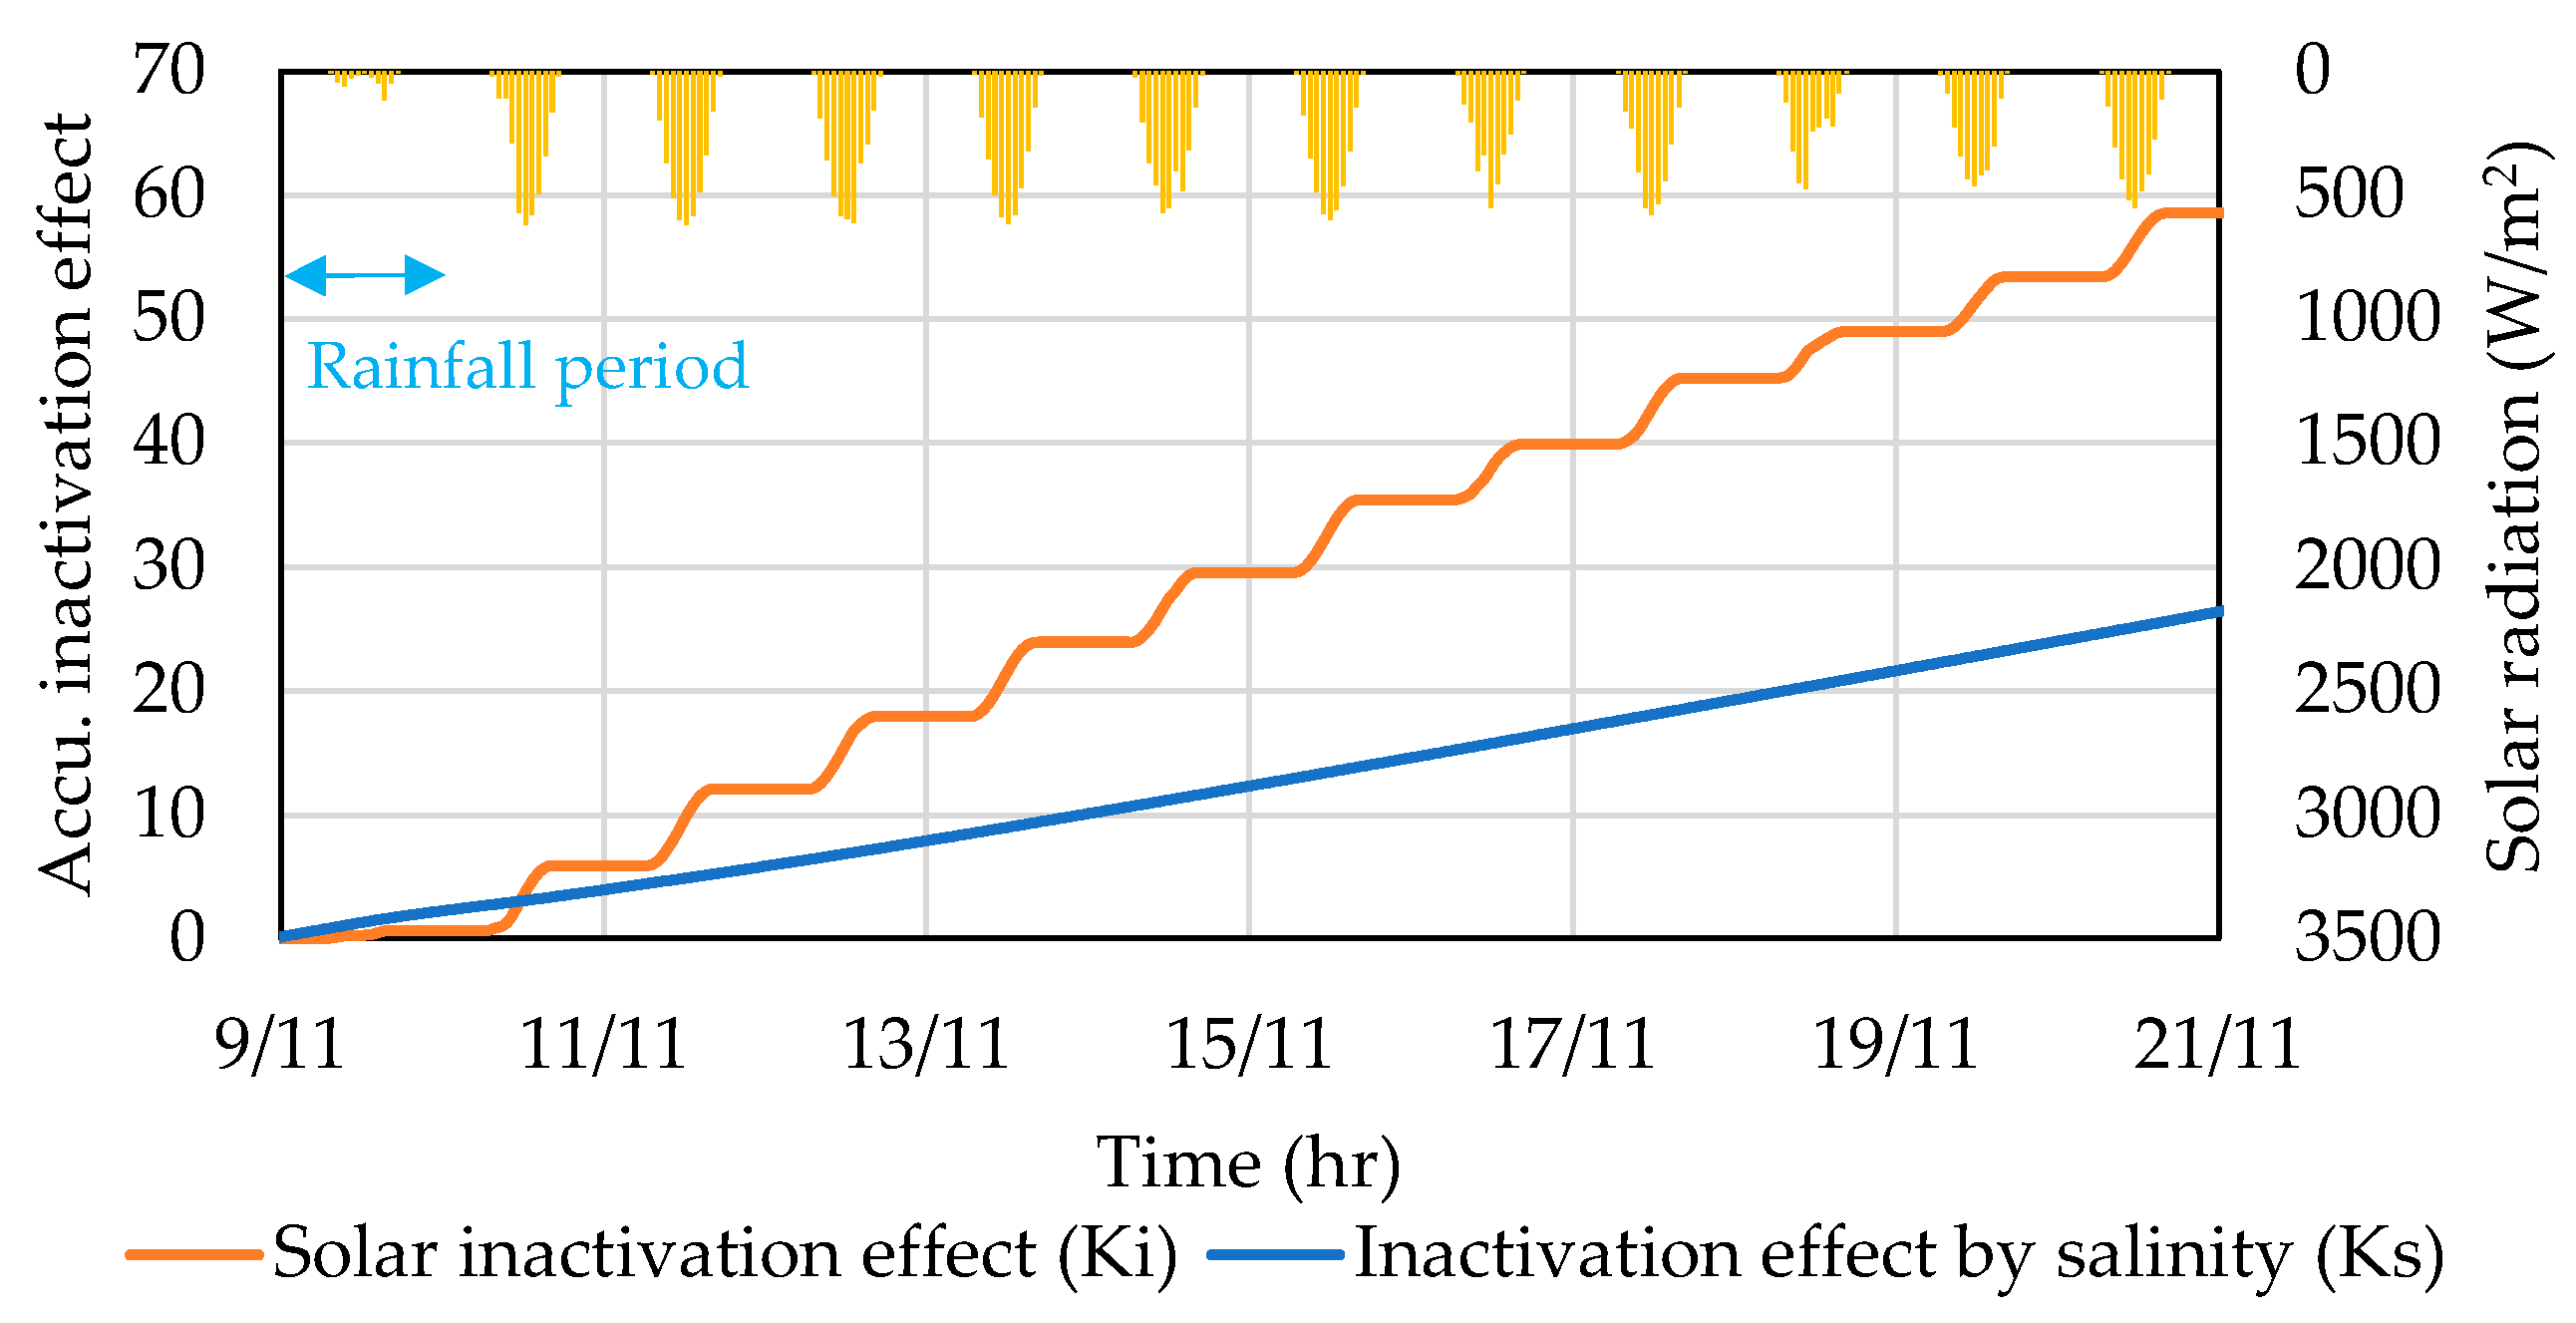
  • For the inactivation of E. coli, the effects of both factors were investigated further. Calculations indicated that solar radiation was a stronger factor dominating the survival time of E. coli. It should be noted that this conclusion was drawn without considering the complication regarding the interaction between solar radiation and salinity.
  • Consequently, it is imperative to develop strategies for mitigating the impact of CSO that address not only frequent small to moderate rainfall events but also extended periods of rainfall lasting several days. For instance, implementing a scenario analysis focused on source control measures, such as optimizing the operation of stormwater reservoirs and pumping stations, can effectively reduce pollutant discharges during these prolonged rainfall events. This approach is particularly significant, given the demonstrated correlation between extended rainfall periods, reduced solar radiation exposure, and the prolonged survival of E. coli and other microbial indicators.
  • In the second phase, we integrated experimentally validated inactivation kinetics of E. coli, a well-known and widely used fecal indicator, and a validated hydrodynamic water quality model. The accuracy of the modelled predictions was affirmed by daily monitoring data of actual situations. The trend of modelled E. coli corresponded well with monitoring data, showing a concentration difference of less than 1 log. The validated water quality model can be used for timely bathing water quality predictions, as well as assistance in decision making for water pollution control in the area and elsewhere.

Supplementary Materials

The following supporting information can be downloaded at: https://www.mdpi.com/article/10.3390/w16030437/s1, Table S1: Concentration of microbial indicators in raw wastewater (RS) and samples after filtration (AF) with log10 reduction value (LRV) used in incubation experiments.; Table S2: Water quality of samples after filtration used in incubation experiments (n = 3).

Author Contributions

Conceptualization, C.P. and H.F.; investigation, C.P. and M.S.; data curation, C.P. and M.S.; writing—original draft preparation, C.P.; writing—review and editing, H.F. and M.K.; visualization, C.P.; supervision, H.F.; funding acquisition, H.F. All authors have read and agreed to the published version of the manuscript.

Funding

This research was conducted in the Research unit for advanced urban drainage management, Research and Development Initiative, Chuo University. The work was supported by the JSPS KAKENHI Grant Numbers 20H02283 & 23H01542 and the Joint research funds with Minato City.

Data Availability Statement

The data used in the current study are available from the corresponding author upon reasonable request.

Acknowledgments

We would like to thank the Tokyo Metropolitan Bureau of Construction for sharing high-resolution precipitation data for our research. We are also grateful to the Tokyo Metropolitan Bureau of Ports and Harbors and the office of the Tokyo International Cruise Terminal for allowing us to conduct water sampling in the area and for facilitating our work during the specified period.

Conflicts of Interest

The authors declare no conflicts of interest.

References

  1. Furumai, H. Environmental Management and Technology: cSUR-UT; Library for Sustainable Urban Regeneration, Volume 1; Springer: Tokyo, Japan, 2008; pp. 29–46. [Google Scholar]
  2. Combined Sewer Overflow Control: Surprising Sewerage. Available online: https://www.mlit.go.jp/english/2006/d_c_and_r_develop_bureau/02_surprise/06_02_1011_p910_combined.html (accessed on 10 January 2024).
  3. Hajj-Mohamad, M.; Aboulfadl, K.; Darwano, H.; Madoux-Humery, A.S.; Guérineau, H.; Sauvé, S.; Dorner, S. Wastewater micropollutants as tracers of sewage contamination: Analysis of combined sewer overflow and stream sediments. Environ. Sci. Process Impacts 2014, 16, 2442–2450. [Google Scholar] [CrossRef]
  4. Liu, J.L.; Wong, M.H. Pharmaceuticals and personal care products (PPCPs): A review on environmental contamination in China. Environ. Int. 2013, 59, 208–224. [Google Scholar] [CrossRef]
  5. Phillips, P.J.; Chalmers, A.T.; Gray, J.L.; Kolpin, D.W.; Foreman, W.T.; Wall, G.R. Combined sewer overflows: An environmental source of hormones and wastewater micropollutants. Environ. Sci. Tech. 2012, 46, 5336–5343. [Google Scholar] [CrossRef]
  6. Sang, Z.; Jiang, Y.; Tsoi, Y.K.; Leung, K.S.Y. Evaluating the environmental impact of artificial sweeteners: A study of their distributions, photodegradation and toxicities. Water Res. 2014, 52, 260–274. [Google Scholar] [CrossRef]
  7. Ekhlas, D.; Kurisu, F.; Kasuga, I.; Cernava, T.; Berg, G.; Liu, M.; Furumai, H. Identification of new eligible indicator organisms for combined sewer overflow via 16S rRNA gene amplicon sequencing in Kanda River, Tokyo. J. Environ. Manag. 2021, 284, 112059. [Google Scholar] [CrossRef]
  8. Botturi, A.; Ozbayram, E.G.; Tondera, K.; Gilbert, N.I.; Rouault, P.; Caradot, N.; Gutierrez, O.; Daneshgar, S.; Frison, N.; Akyol, Ç.; et al. Combined sewer overflows: A critical review on best practice and innovative solutions to mitigate impacts on environment and human health. Crit. Rev. Environ. Sci. Technol. 2021, 51, 1585–1618. [Google Scholar] [CrossRef]
  9. Owolabi, T.A.; Mohandes, S.R.; Zayed, T. Investigating the impact of sewer overflow on the environment: A comprehensive literature review paper. J. Environ. Manag. 2022, 301, 113810. [Google Scholar] [CrossRef]
  10. Petrie, B. A review of combined sewer overflows as a source of wastewater-derived emerging contaminants in the environment and their management. Environ. Sci. Pollut. Res. 2021, 28, 32095–32110. [Google Scholar] [CrossRef] [PubMed]
  11. Zan, R.; Blackburn, A.; Plaimart, J.; Acharya, K.; Walsh, C.; Stirling, R.; Kilsby, C.G.; Werner, D. Environmental DNA clarifies impacts of combined sewer overflows on the bacteriology of an urban river and resulting risks to public health. Sci. Total Environ. 2023, 889, 164282. [Google Scholar] [CrossRef]
  12. Crocetti, P.; Eusebi, A.L.; Bruni, C.; Marinelli, E.; Darvini, G.; Carini, C.B.; Bollettini, C.; Recanati, V.; Akyol, Ç.; Fatone, F. Catchment-wide validated assessment of combined sewer overflows (CSOs) in a mediterranean coastal area and possible disinfection methods to mitigate microbial contamination. Environ. Res. 2021, 196, 110367. [Google Scholar] [CrossRef] [PubMed]
  13. Bertels, D.; De Meester, J.; Dirckx, G.; Willems, P. Estimation of the impact of combined sewer overflows on surface water quality in a sparsely monitored area. Water Res. 2023, 244, 120498. [Google Scholar] [CrossRef]
  14. Poopipattana, C.; Nakajima, M.; Kasuga, I.; Kurisu, F.; Katayama, H.; Furumai, H. Spatial Distribution and Temporal Change of PPCPs and Microbial Fecal Indicators as Sewage Markers after Rainfall Events in the Coastal Area of Tokyo. J. Water Environ. Technol. 2018, 16, 149–160. [Google Scholar] [CrossRef]
  15. Poopipattana, C.; Furumai, H. Fate Evaluation of CSO-derived PPCPs and Escherichia coli in Tokyo Coastal Area after Rainfall Events by a Three-dimensional Water Quality Model. J. Water Environ. Technol. 2021, 19, 251–265. [Google Scholar] [CrossRef]
  16. Poopipattana, C.; Suzuki, M.; Furumai, H. Impact of long-duration CSO events under different tidal change conditions on distribution of microbial indicators and PPCPs in Sumida river estuary of Tokyo Bay, Japan. Environ. Sci. Pollut. Res. 2021, 28, 7212–7225. [Google Scholar] [CrossRef]
  17. Passerat, J.; Ouattara, N.K.; Mouchel, J.M.; Vincent, R.; Servais, P. Impact of an intense combined sewer overflow event on the microbiological water quality of the Seine River. Water Res. 2011, 45, 893–903. [Google Scholar] [CrossRef]
  18. Al Aukidy, M.; Verlicchi, P. Contributions of combined sewer overflows and treated effluents to the bacterial load released into a coastal area. Sci. Total Environ. 2017, 607–608, 483–496. [Google Scholar] [CrossRef]
  19. Romei, M.; Lucertini, M.; Renzoni, E.E.; Baldrighi, E.; Grilli, F.; Manini, E.; Marini, M.; Iagnemma, L. A detention reservoir reduced combined sewer overflows and bathing water contamination due to intense rainfall. Water 2021, 13, 3425. [Google Scholar] [CrossRef]
  20. Ordulj, M.; Jozić, S.; Baranović, M.; Krželj, M. The Effect of Precipitation on the Microbiological Quality of Bathing Water in Areas under Anthropogenic Impact. Water 2022, 14, 527. [Google Scholar] [CrossRef]
  21. McMinn, B.R.; Ashbolt, N.J.; Korajkic, A. Bacteriophages as indicators of faecal pollution and enteric virus removal. Lett. Appl. Microbiol. 2017, 65, 11–26. [Google Scholar] [CrossRef] [PubMed]
  22. Dias, E.; Ebdon, J.; Taylor, H. The application of bacteriophages as novel indicators of viral pathogens in wastewater treatment systems. Water Res. 2017, 129, 172–179. [Google Scholar] [CrossRef] [PubMed]
  23. Muela, A.; García-Bringas, J.M.; Arana, I.; Barcina, I. The effect of simulated solar radiation on Escherichia coli: The relative roles of UV-B, UV-A, and photosynthetically active radiation. Microb. Ecol. 2000, 39, 65–71. [Google Scholar] [CrossRef] [PubMed]
  24. Jozić, S.; Morovié, M.; Šolić, M.; KrstuIović, N.; Ordulj, M. Effect of solar radiation, temperature and salinity on the survival of two different strains of Escherichia coli. Fresenius Environ. Bull. 2014, 23, 1852–1859. [Google Scholar]
  25. Maraccini, P.A.; Mattioli, M.C.M.; Sassoubre, L.M.; Cao, Y.; Griffith, J.F.; Ervin, J.S.; Van De Werfhorst, L.C.; Boehm, A.B. Solar Inactivation of Enterococci and Escherichia coli in Natural Waters: Effects of Water Absorbance and Depth. Environ. Sci. Technol. 2016, 50, 5068–5076. [Google Scholar] [CrossRef]
  26. Scroccaro, I.; Ostoich, M.; Umgiesser, G.; De Pascalis, F.; Colugnati, L.; Mattassi, G.; Vazzoler, M.; Cuomo, M. Submarine wastewater discharges: Dispersion modelling in the Northern Adriatic Sea. Environ. Sci. Pollut. Res. 2010, 17, 844–855. [Google Scholar] [CrossRef]
  27. Jalliffier-Verne, I.; Heniche, M.; Madoux-Humery, A.S.; Galarneau, M.; Servais, P.; Prévost, M.; Dorner, S. Cumulative effects of fecal contamination from combined sewer overflows: Management for source water protection. J. Environ. Manag. 2016, 174, 62–70. [Google Scholar] [CrossRef] [PubMed]
  28. Liu, W.C.; Huang, W.C. Modeling the transport and distribution of fecal coliform in a tidal estuary. Sci. Total Environ. 2012, 431, 16. [Google Scholar] [CrossRef] [PubMed]
  29. Sokolova, E.; Pettersson, T.J.; Bergstedt, O.; Hermansson, M. Hydrodynamic modelling of the microbial water quality in a drinking water source as input for risk reduction management. J. Hydrol. 2013, 497, 15–23. [Google Scholar] [CrossRef]
  30. Thupaki, P.; Phanikumar, M.S.; Beletsky, D.; Schwab, D.J.; Nevers, M.B.; Whitman, R.L. Budget analysis of Escherichia coli at a southern Lake Michigan beach. Environ. Sci. Tech. 2010, 44, 1010–1016. [Google Scholar] [CrossRef]
  31. Andersen, S.T.; Erichsen, A.C.; Mark, O.; Albrechtsen, H.J. Effects of a 20 year rain event: A quantitative microbial risk assessment of a case of contaminated bathing water in Copenhagen, Denmark. J. Water Health 2013, 11, 636–646. [Google Scholar] [CrossRef]
  32. De Marchis, M.; Freni, G.; Napoli, E. Modelling of E. coli distribution in coastal areas subjected to combined sewer overflows. Water Sci. Technol. 2013, 68, 1123–1136. [Google Scholar] [CrossRef]
  33. Eregno, F.E.; Tryland, I.; Tjomsland, T.; Kempa, M.; Heistad, A. Hydrodynamic modelling of recreational water quality using Escherichia coli as an indicator of microbial contamination. J. Hydrol. 2018, 561, 179–186. [Google Scholar] [CrossRef]
  34. ISO 10705-1; International Organisation for Standardisation: Water quality—Detection and Enumeration of Bacteriophage, Part 1: Enumeration of F-specific RNA Bacteriophages. International Organisation for Standardisation: Geneva, Switzerland, 1995.
  35. ISO/FDIS 10705–2; International Organization for Standardization: Water Quality—Detection and Enumeration of Bacterio- Phages—Part 2: Enumeration of Somatic Coliphages. International Organisation for Standardisation: Geneva, Switzerland, 2000.
  36. Suzuki, M.; Poopipattana, C.; Furumai, H. Effects of sunlight and salinity inactivation on the fate of fecal indicator microorganisms in raw sewage. J. Jpn. Soc. Civ. Eng. Ser. G Environ. Res. 2020, 76, 411–421. (In Japanese) [Google Scholar] [CrossRef] [PubMed]
  37. Historical Weather Data: Japan Meteorological Agency. Available online: https://www.data.jma.go.jp/obd/stats/etrn/index.php (accessed on 10 January 2024).
  38. Koibuchi, Y.; Sato, S. Advanced Monitoring and Numerical Analysis of Coastal Water and Urban Air Environment: cSUR-UT; Library for Sustainable Urban Regeneration, Volume 3; Chapter 3; Springer: Tokyo, Japan, 2010; pp. 33–69. [Google Scholar]
  39. Sinton, L.W.; Hall, C.H.; Lynch, P.A.; Davies-Colley, R.J. Sunlight Inactivation of Fecal Indicator Bacteria and Bacteriophages from Waste Stabilization Pond Effluent in Fresh and Saline Waters. Appl. Environ. Microbiol. 2002, 68, 1122–1131. [Google Scholar] [CrossRef] [PubMed]
Figure 1. Laboratory experiment setting in light-simulated chamber (modified from [36]).
Water 16 00437 g001
Figure 2. Map of study area and sampling location (base map GIS data from the Geospatial Intermation Authority of Japan (GSI)).
Water 16 00437 g002
Figure 3. Photos of sampling location (Tokyo International Cruise Terminal).
Water 16 00437 g003
Figure 4. Concentration changes in microbial indicators with irradiance at different salinity levels (modified from [36]) (* plate count less than 15).
Water 16 00437 g004
Figure 5. Monitored concentrations of enterococcus, total coliform, and E. coli at Tokyo International Cruise Terminal (November 2021).
Water 16 00437 g005
Figure 6. Comparison among measured and simulated E. coli concentrations over the simulation period.
Water 16 00437 g006
Figure 7. Accumulated inactivation effect on E. coli caused by solar radiation and salinity.
Water 16 00437 g007
Table 1. Inactivation coefficients of fecal bacteria under different light conditions and salinity.
Microbial IndicatorsLight ConditionSalinity (PSU)R2kb (Day−1)p-ValuekS
(Day−1PSU−1)
p-ValuekI
(m2Day−1W−1)
p-Value
E. coliDark00.950.0450.38----
Dark 0, 10, 200.96--0.1000.080.0380.00
Light5, 10, 20
enterococcusDark00.960.3820.15----
Dark0, 10, 200.98--0.0120.310.0130.00
Light5, 10, 20
Fecal
coliform
Dark00.98−0.1680.11----
Dark0, 10, 200.86--0.1270.090.0250.00
Light5, 10, 20
Table 2. Inactivation coefficients of bacteriophages under different light conditions and salinity.
Microbial IndicatorsLight ConditionSalinity (PSU)R2kb
(Day−1)
p-ValuekS
(Day−1PSU−1)
p-ValuekI
(m2Day−1W−1)
p-Value
F-phageDark00.680.2610.03----
Dark 0, 10, 201.00--0.0730.000.0100.00
Light5, 10, 20
Somatic coliphageDark00.200.0190.78----
Dark0, 10, 200.73--−0.0100.000.0010.00
Light5, 10, 20
Disclaimer/Publisher’s Note: The statements, opinions and data contained in all publications are solely those of the individual author(s) and contributor(s) and not of MDPI and/or the editor(s). MDPI and/or the editor(s) disclaim responsibility for any injury to people or property resulting from any ideas, methods, instructions or products referred to in the content.

