Article

Assessment of Multi-Regional Comprehensive Benefits of the South-to-North Water Diversion Project in China

1
College of Hydrology and Water Resources, Hohai University, Nanjing 210098, China
2
State Key Laboratory of Simulation and Regulation of Water Cycle in River Basin, China Institute of Water Resources and Hydropower Research, Beijing 100083, China
3
Key Laboratory of Water Safety for Beijing-Tianjin-Hebei Region of Ministry of Water Resources, Beijing 100038, China
4
School of Civil Engineering and Water Resources, Qinghai University, Xining 810016, China
*
Author to whom correspondence should be addressed.
Water 2024, 16(3), 473; https://doi.org/10.3390/w16030473
Submission received: 26 December 2023 / Revised: 27 January 2024 / Accepted: 28 January 2024 / Published: 31 January 2024

Abstract

:
Inter-basin water transfer (IBWT) projects are an effective means of addressing regional water resource imbalances. However, owing to the long construction cycle, large investment amount, and wide impact range, water diversion projects exhibit delayed and complex benefits, often lacking clear comprehension. In this study, we established a multi-regional comprehensive benefit assessment framework for the IBWT, considering spatiotemporal and multi-dimensional value effects. Using the South-to-North Water Diversion Project (SNWDP) in China as an example, we assessed its comprehensive benefits from 2003 to 2020. The results showed that the comprehensive benefits of the project were USD 207 billion, encompassing economic and ecological benefits, accounting for 71.6% and 28.4%, respectively. In 2020, the benefits of the SNWDP amounted to USD 39.3 billion, with a per-unit area benefit range of USD −1.03 to 4.27. The operation of the SNWDP effectively alleviated groundwater overexploitation in water-receiving areas. However, without the SNWDP, the total loss caused by industrial development limitations due to water scarcity would have been USD 154.3 billion. These results indicate the importance of a practical framework for assessing IWBT project benefits, aiding managers in assessment tasks, and facilitating the prediction and adjustment of project benefits.

1. Introduction

The input of water resources is an essential component of socioeconomic development. Only 1% of the total water volume (13.86 billion km3) on Earth is directly available for human production and consumption, and its distribution is highly uneven [1]. Groundwater is a water source that many regions rely on, particularly in southeastern Europe [2]. Currently, approximately 3.6 billion people globally reside in water-scarce regions, equivalent to nearly half of the world’s population [3]. Furthermore, the phenomenon of water scarcity and imbalance continues to worsen due to population growth and the demands of economic development [4]. Hence, centuries-old water diversion projects provide an effective solution by transferring water from water-abundant to water-scarce regions through engineering solutions [5,6]. There are currently over 350 water diversion projects in over 40 countries, such as the Central Valley Project in America [7], the Inter-Linking of Rivers in India [8], and the South-to-North Water Diversion Project in China [9], with an annual water diversion volume exceeding 500 billion cubic meters [10]. China and India are typical developing countries with an uneven distribution of water resources [8,11]. Numerous mega water diversion projects have been initiated there to alleviate water shortages and imbalances, and such projects are expected to continue in the future [12].
Many scholars have studied the impact and various aspects of water transfer projects [8,13]. Some research concludes that diversion projects have significantly positive effects in promoting the economies of the recipient areas, enhancing regional equity, and strengthening cooperation between water-providing and water-receiving regions [10,14]. For example, in California’s North-to-South water transfer project, the annual water transfer totaled 36.2 billion cubic meters, which ensured water availability for living and production in Los Angeles and other areas. This project promoted the development of industry and agriculture and narrowed the socioeconomic gap between the east and west in the development of the country [15]. In addition, water transfer projects often serve multiple functions, such as power generation, navigation, recreation, and flood control, which also can have significant benefits [6,16]. For example, the Lesotho Highlands Water Project generates 30% of the total local revenues through water transfers and electricity generation [17]. Peng et al. [14] illustrated that the construction of these projects requires substantial investment, which stimulate local economic development, and Larsona et al. [18] found that a water transfer project significantly improved the ecological environment of the receiving areas and effectively prevented ground subsidence in California. However, some studies have argued that this merely results from the transfer of benefits from water-providing areas to water-receiving areas [19]. The construction of water diversion projects may have adverse socioeconomic [20] and ecological impacts [13] on water-providing areas. For instance, the Quebec Water Transfer Project in Canada has had significant socioenvironmental impacts on Indigenous populations due to displacement and anthropogenic pressure on tribal lands [21]. Furthermore, the implementation of water diversion projects can lead to reduced downstream water flows and altered hydrological conditions, which may have adverse effects on aquatic habitats [22]. For example, the California Water Transfer Project and the Delta Mendota Canal of the Central Valley Project reduced freshwater inflow to San Francisco Bay by 40%, resulting in an 80 km salinity gradient [23]. To avoid the negative impact of water diversion projects, the European Union’s Water Framework Directive advocates the sustainable use of water resources through changes in water usage and scientific management methods [2,24]. To summarize, although water diversion projects are beneficial for solving the problem of imbalance between the supply and demand of resources, their comprehensive benefits remain a subject of controversy and caution worldwide [8,20].
The South-to-North Water Diversion Project (SNWDP) is China’s largest inter-basin water diversion project, diverting water from the Yangtze River Basin to the Yellow River Basin and the Haihe River Basin, and consisting of the eastern, middle, and western routes [3]. The construction of the first phase of the east and middle routes commenced in 2002 and 2003, respectively, and water transfer began in 2013 and 2014. The west route is designed to transport water from the upper Yangtze River tributaries but remains in the planning stage because of challenging topographical and ecological factors [25]. The entire SNWDP has incurred a total investment exceeding CNY 240 billion and has necessitated the resettlement of more than 300 thousand people [26]. The impacts of the SNWDP have attracted widespread attention.
Regarding water-receiving areas, since the project began operation in 2014, the cumulative water supply has reached 35 billion cubic meters, resulting in substantial water resource benefits [27] and significantly alleviating the issue of groundwater depletion [13]. The groundwater depth in Beijing has increased by 3 m over the past five years, with the contribution of the SNWDP accounting for approximately 40% of this increase [28]. In addition, water transfer routes create green ecological landscapes through environmental governance [11] and promote the ecological replenishment of rivers and lakes in water-providing areas [29]. Dengzhou, the first eco-replenishment city in the middle route, witnessed a rapid increase in its ecosystem services value from USD 3.79 billion to USD 4.6 billion [30]. Regarding water-proving areas, Jia et al., using Landsat multispectral data and ALOS radar remote sensing data, found that the forested area in the water source region exhibited an increasing trend from 2007 to 2017 [29]. NDVI showed a significant spatial increase in the upper reaches and around the Danjiangkou Reservoir [31]. Furthermore, Zhang and Nie found that the ecosystem service value of Xichuan County and Danjiangkou City in 2019 increased by CNY 10.26 billion compared to 1989, with a significant impact from forested and aquatic areas [32]. However, Gu et al. argued that improving the ecological environment involves a high cost of ecological protection [33]. To ensure the quality and quantity of water transferred from the water source area, a large amount of funds must be invested in environmental protection and pollution prevention work. Simultaneously, the local area may also sacrifice economic development opportunities, resulting in a loss of development opportunities [34]. The water-providing area in Henan Province and Shiyan City lost approximately CNY 12 billion of industrial and agricultural opportunities from 2015 to 2020 [35]. Regarding the middle and lower reaches of the Han River, the water diversion has significantly impacted hydrological conditions, where monthly flow decreased by approximately 4.05–4.27%. However, the flow variation process became more stable than before [36]. Xu et al. found changes in the density of flora and fauna in river water bodies [37]. Furthermore, heavy metal pollution in the middle and lower reaches of the Han River worsened after water diversion [4]. The occurrence rate of algal blooms in the middle and lower reaches is expected to increase by approximately twofold [38]. Numerous businesses have been affected, resulting in local fiscal losses of approximately CNY 2.2 billion in Xiangyang City owing to severe water and soil pollution [39].
Based on the above research, it is evident that the impact of a water diversion project is a complex process, with benefits manifesting in multiple dimensions [14]. From a spatial perspective, it includes water-providing areas, water-receiving areas, and the middle and lower reaches of the river. From a temporal viewpoint, it encompasses the construction and operational periods. Regarding benefits, it covers both economic and ecological aspects, and in its characteristics, it should include both positive and negative impacts. Currently, studies on water transfer projects primarily focus on qualitative analysis [6,13,20] and quantitative evaluation of specific aspects [14,19]. However, there is a lack of a more comprehensive qualitative analysis that considers the multi-dimensional impact of water transfer projects. Thus, the main objectives of this paper are as follows: first, we construct a comprehensive multi-regional benefit evaluation framework for IBWT; second, taking the first phase of the east and middle routes of the SNWDP in China as examples, we assess the comprehensive benefits of water-providing areas, water-receiving areas, and the middle and lower reaches from 2003 to 2020; and finally, we explore the future development trends of the SNWDP and the possibility of loss without it.

2. Materials and Methods
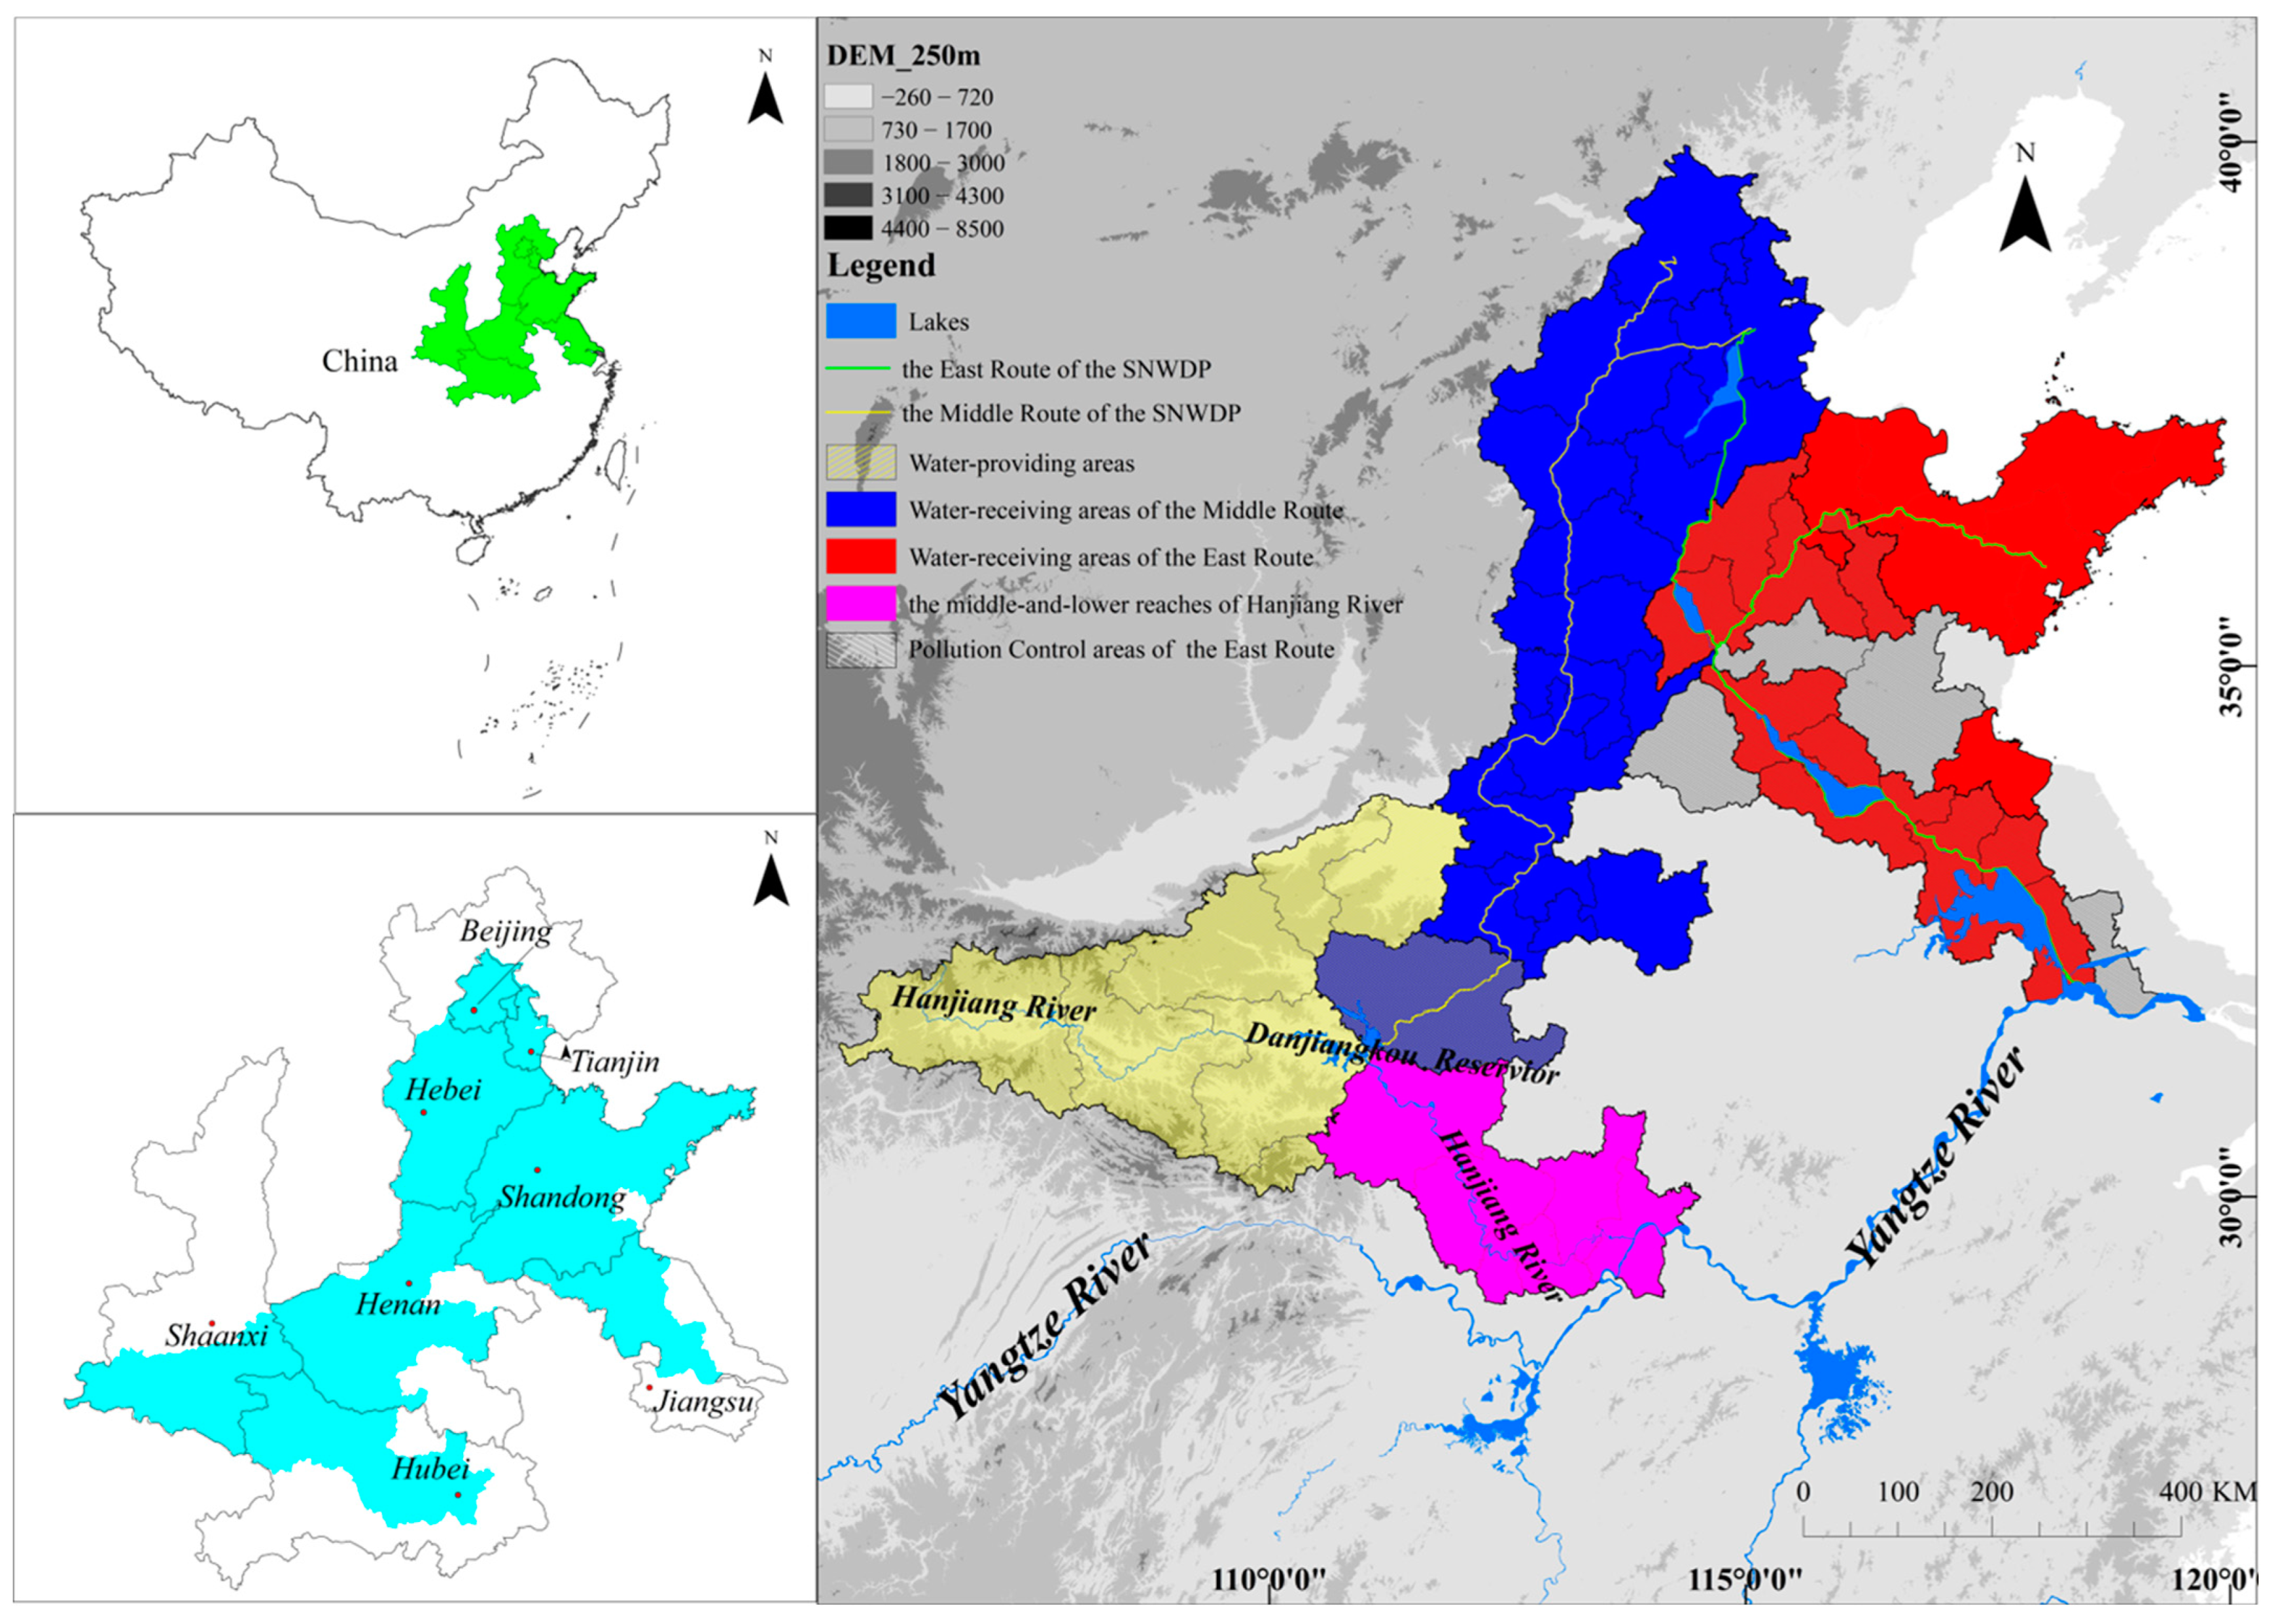
2.1. Study Area

The middle route of the SNWDP diverts water from the Danjiangkou Reservoir in the Hanjiang River Basin, which is also known as the Han River. The area above the Danjiangkou Reservoir is a water-providing area, whereas the area below it is in the middle and lower reaches of the Han River (Figure 1). The total length of the middle route is 1432 km, and it is planned to divert 9.5 billion cubic meters annually from the Danjiangkou Reservoir. Water is distributed across four provinces and municipalities in 22 municipal areas. The eastern route diverts water from the main stream of the Yangtze River in Yangzhou City, Jiangsu Province, and gradually lifts water through cascade pumping stations. It is divided into two water transmission lines, one of which flows north, providing an emergency water supply to Shandong and Tianjin (officially operational on 10 May 2021), and the other flows eastward to supply water to the Shandong Peninsula. Owing to the severe water pollution in lakes and rivers along the route, pollution control is the primary task of the first phase of the east route project. The scope of the pollution control plan for the east route project covers all areas that affect the water quality of the east route. According to the statistics data from the Pollution Control Volume of China South-to-North Water Diversion Project, Jiangsu and Shandong provinces accounted for the largest share of the pollution control investment in Phase I, at about 73%. Thus, this study focuses on Shandong and Jiangsu provinces, involving 15 city-level regions. The project plans to transfer 2.01 billion cubic meters of water to Shandong and 2.25 billion cubic meters to Jiangsu.

2.2. Research Framework

In this study, we established a multi-regional comprehensive benefit assessment framework for IWBT projects, encompassing temporal–spatial effects and multi-dimensional value effects. Temporal effects manifest through the benefits of the construction and operational phases. Spatial effects encompass benefits in water-providing areas, water-receiving areas, and the middle and lower reaches. Multi-dimensional value impacts are reflected in terms of investment benefits, water resource benefits, ecological benefits, and opportunity losses from industry development. These impacts are characterized by both positive and negative benefits. The complex interconnections and influence pathways among the different benefits are shown in Figure 2.
During the construction period of the project (Figure 2a), large-scale engineering construction (such as preparation, environmental protection, and water transfer projects) usually generates a large demand for raw materials, land, labor, technology, and other factors. These demands, with the implementation of investment amounts, directly drive the output of the upstream industrial chain, stimulate local and surrounding market consumption behavior, and generate economic benefits. However, the construction of specific projects, such as water transfer projects, permanently occupies local farmland, resulting in opportunity losses in agricultural development. Additionally, the construction of environmental protection projects requires industrial structure adjustments along the routes, restricting or even closing down high-emission industries and resulting in opportunity losses for local industrial development. Activities such as soil and water conservation and afforestation within environmental protection initiatives can also alter land types in the source area, thereby changing the ecological benefits of the region.
When the water diversion project enters the operation period (Figure 2b), although most construction projects are completed, unfinished construction, such as supporting facility infrastructure and sewage treatment projects, still stimulates market consumption to generate economic benefits. Additionally, opportunity losses caused by a specific project may not be recoverable in the short term and may still have an impact. However, as the project enters the operational period, an increasing amount of water flows into the receiving area, generating water resource benefits. A portion of this water is used for production and daily life, participating in market economy behavior, and generating economic benefits. Another portion of the water is used for the ecological replenishment of river channels, which increases the surface water area and groundwater reserves. Simultaneously, there have been some changes in the ecological environment along the water transfer route, leading to the generation of new water areas and construction of ecological green belts to protect the water transfer route. These phenomena have improved the ecological environment of the water-receiving areas and generated ecological benefits. However, because of the outflow of water from the upstream (water-providing areas), the water volume in the middle and downstream basins decreases, which negatively impacts the water environment’s capacity.

2.3. Methods

2.3.1. Assessment of Economic Benefit

1.
Investment benefits
In this study, the Cobb–Douglas (C–D) production function was used to evaluate investment benefits, which can be expressed as shown in Equations (1) and (2) [40]. The basic theory is that the growth of economic output in a region is a result of the combined effects of labor input growth, material capital input growth, and technological progress.
Y = A K α L β
where Y, A, K, and L represent the total output value, general technological level, fixed asset investment value, and labor input in a certain period in one region; α and β represent the elasticity of capital and labor input, respectively.
For ease of computation, Equation (1) is logarithmically transformed into the following linear equation:
l n Y = l n A + α × l n K + β × l n L
Taking the partial derivative of Y with respect to K in Equation (2):
Y = α · Y · K K
where ∆Y represents the change in output value (billion USD), K represents the change in fixed investment (this refers to the investment of the SNWDP in this study, billion USD), K represents the fixed asset investment (billion USD), and Y represents the output value for the current year (billion USD).
2.
Water Resource Benefits
Water resource benefits are primarily realized through water supply and can be calculated based on the proportion of the contribution of water to value-added creation, with reference to Yang et al. [27].
B i = G i W i × W s i × f i
where B i represents the economic benefits generated by the water resources used for i , where i = 1 , 2 , 3 correspond to agricultural, industrial, and domestic water use, respectively; G i represents the value added of i ; W i represents the total water consumption for i ; W s i is the water transfer volume diverted by the SNWDP; f i is the water resource benefit coefficient for i .
3.
Losses of opportunity development
Opportunity loss is generally the economic loss caused by the partial development rights that areas are forced to forego for some reason. In this study, opportunity loss in development is primarily reflected in agriculture and industry. The former was assessed by multiplying the area of permanent farmland, crop yield per unit area of farmland in the region, and crop prices. Generally, the loss of industrial development opportunities cannot be obtained directly through market pricing, and indirect market pricing needs to be applied to estimate it by comparing affected areas with unaffected areas, with reference to Wang et al. [34], which can be expressed as follows:
I k , c o s t = G D P k , c o s t × N k × φ k
where, I k , c o s t represents the industrial loss cost in region k in the year after implementing ecological protection; G D P k , c o s t is the loss in the per capita value added in the secondary industry for the protected region in that year; N k is the total population in the region for that year; φ k is the revenue coefficient, representing the proportion of fiscal revenue to the region’s GDP for that year.
G D P k , c o s t = G D P k 1 × 1 + γ k + δ G D P k
δ = ( α β ) ( α β ) ,
where G D P k represents the actual per capita value added in the secondary industry for the year following the implementation of pollution control; G D P k 1 is the actual per capita value added in the secondary industry for the previous year; γ k is the per capita value added rate in the secondary industry for the year following the implementation of pollution control; δ is the opportunity loss parameter; α and β represent the annual per capita value added growth rates in the secondary industry for the research area and the reference area, respectively, when pollution is not restricted; and α and β represent the annual per capita value added growth rates in secondary industry for the research area and the reference area, respectively, after pollution control is implemented.

2.3.2. Assessment of Ecological Benefit

Ecological benefits occur in water-providing areas, water-receiving areas, and the middle and lower reaches of the Han River. Regarding water-providing areas, environmental projection activities such as returning farmland to forests, wetland restoration, and closing factories have an impact on local land-use types. Land-use type is the most intuitive basis for evaluating the ecological and environmental quality of a region [26]. This study refers to the equivalent factor table of the ecosystem service value revised by Xie et al. [41], which states that the value of standard unit ecosystem service is equal to 1/7 of the national average grain yield market value. The standard unit ecosystem service value was revised based on the actual situation of the water-receiving areas, and the ecological benefits of the water-providing areas were evaluated. This can be expressed using Equations (8) and (9), with reference to Xie et al. [41].
E j = 1 7 i = 1 n m i j M j ,
where E j represents the ecosystem service value of the standard unit equivalence factor for region j , (USD/hm2); m i j is the grain output value of crop i for region j , (USD); M j is the total planting area for grain in region j and (USD); and n represents the crop type.
E S V j = k = 1 n S k , j × E j × E F k , f ,
where E S V j represents the total value of water ecosystem services in region j (USD). k represents the land-use type. S k , j is the land area of region j for land type k , (hm2). EF is the equivalence factor of ecological service function f for land type k , which is shown in Table 1.
Regarding water-receiving areas, ecological benefits were first demonstrated by the increase in surface water area and forest land along the water transfer line. Additionally, there are surface water benefits in water-receiving areas generated through ecological water replenishment of rivers along the line. Finally, groundwater benefits are generated by the replacement of groundwater pressure through external water transfer. The benefits generated by land-use changes, such as the benefits along the water transmission line and the surface water benefits in the receiving areas, were evaluated using the ecosystem service value coefficient.
Groundwater benefits mainly include the prevention of groundwater funnel decline and ground subsidence, the regulation and storage benefits of increased groundwater volume, and the energy-saving benefits of groundwater level elevation. Zhang et al. believed that the overexploitation of groundwater is the main cause of land subsidence disasters [42]. Continuous overexploitation of groundwater has led to the formation of groundwater depression funnels in the area [43]. Thus, decrements in groundwater extraction can prevent ground subsidence and control groundwater depression funnels. The groundwater benefit of preventing groundwater funnel decline and ground subsidence can be expressed as follows, with reference to Zeng et al. [44]:
G 1 = W 1 × ( P 1 + P 2 ) ,
where G 1 represents the economic benefits of preventing groundwater funneling and ground subsidence effects, (USD); P 1 and P 2 are the average land subsidence and groundwater funnel loss caused by per unit cubic meter of groundwater overexploitation, respectively. W 1 is the volume of reduction in groundwater exploitation in the water-receiving areas of the SNWDP, (m3), which main includes a reduction in groundwater exploitation in urban areas and the ecological recharge infiltration of external water transfer. The infiltration rate is selected as 0.57, referring to Bian and Wei et al. [45,46].
In addition, Jiao et al. reported that groundwater resources have significant regulatory and storage functions [47]. This refers to the storage of surface water in a groundwater aquifer during the rainy or off-season through natural infiltration for development and utilization during the dry season. The groundwater benefit of preventing groundwater funnel decline and ground subsidence can be expressed as follows:
G 2 = W 2 × P 3 ,
where G 2 represents the benefit of regulation and storage benefits, (USD); W 2 is the additional groundwater storage volume, (m3). In this study, the infiltration amount of ecological water replenished for external water transfer was used as a newly increased amount of groundwater, with regulation and storage benefits. P 3 is the storage price per cubic meter of water, which is based on the regional comprehensive water price [48].
With a gradual increase in the groundwater level, the energy-saving benefits of water resource extraction can be obtained by evaluating the value of the water level increase, water resource mining, and the cost of water exploitation per cubic meter, with reference to Jiang et al. [49].
G 3 = H 1 × P 4 ,
where G 3 represents the energy savings benefit from raising the groundwater level, (USD); ΔH1 is the reduced elevation difference, (m); and P4 is the unit electricity price, (USD/m).
Regarding the middle and lower reaches of the Han River, after the operation in the middle route of the SNWDP, the flow of the basin decreased, and the water environment capacity also significantly decreased. Shen evaluated that, before the operation of the SNWDP, the NH3-N and TP water environmental capacities in the middle and lower reaches of the Han River basin were 33,089 t/a and 1065 t/a, respectively. After the operation of the SNWDP according to planned water transfer, the water environmental capacity of NH3-N and TP decreased by 18.2% and 32.3%, respectively [50]. Thus, the loss of the water ecological environment capacity was assessed based on the actual annual water diversion volume and the market trading prices of NH3-N and TP.

2.3.3. Data Sources

In this study, water diversion data and the decrease in groundwater extraction were obtained from relevant yearbooks [51,52]. The investment data for project construction were obtained from the Yearbook of China South-to-North Water Diversion Project Construction [53]. Investments in the sewage disposal and treatment project were obtained from the Pollution Control Volume of China South-to-North Water Diversion Project [54]. Other data related to the industrial economy, population, and fixed asset investments were obtained from the National Bureau of Statistics [55]. Information on permanent agricultural land was obtained from the Land Acquisition and Resettlement Volume of the China South-to-North Water Diversion Project [56]. Land-use-type areas were derived from remote sensing data with 500 m precision. Information on grain benefits, planting areas, and yields was sourced from the National Compilation of National Agricultural Cost and Benefit [57] and the China Agricultural Yearbook [58].

3. Results

3.1. Investment Amount and Water Diversion Volume of the SNWDP

As shown in Figure 3, the total completed investment in the SNWDP from 2003 to 2020 amounted to USD 64.15 billion. The main facility, support facility, and sewage disposal projects accounted for 55%, 31%, and 13%, respectively. The peak investment period was 2010–2014, accounting for 61% of the total investments. Different regions had varying contents for the main projects. In the water-providing areas, the main projects included the construction of the Danjiangkou Dam, reservoir area resettlement, and cultural heritage protection, with a total investment of USD 7.73 billion. The main projects in the water-receiving areas include the construction of a trunk line, environmental protection, land acquisition, and resettlement, with a total investment of USD 23.4 billion. The main projects in the middle and lower reaches of the Han River, also known as governance projects, aim to reduce or eliminate the adverse effects of water diversion, with a total investment of USD 1.7 billion. Sewage treatment is the focus of pollution control projects, with a total investment of USD 8.2 billion and an average of approximately USD 0.45 billion annually. It was primarily concentrated in water-providing areas, east-route pollution control areas, and the middle and lower reaches of the Han River. The former two were mainly used to ensure the quality of water delivery, whereas the latter was mainly used to prevent pollution caused by sewage discharge after the downstream water volume decreased.
The east and middle routes of the SNWDP began transferring water in 2014 and 2015, respectively. By 2020, the total volume of water diverted was 36.4 billion cubic meters. The water diversion increased from 0.78 billion cubic meters in 2014 to 9.3 billion cubic meters in 2020. Among the recipient regions, Henan Province received the highest volume of water, totaling 11.5 billion cubic meters. Shandong Province received the lowest water volume, with a total supply of 3.05 billion cubic meters. Domestic water use was the primary purpose of water diversion, accounting for 43%, followed by industrial water use (25%). Agricultural water use constituted the smallest proportion (11%), with only Henan and Shandong provinces utilizing the transferred water for agricultural production. Ecological water replenishment has significantly increased since 2017. In 2020, it accounted for 31% of the total water diversion, or 9.3 billion cubic meters.

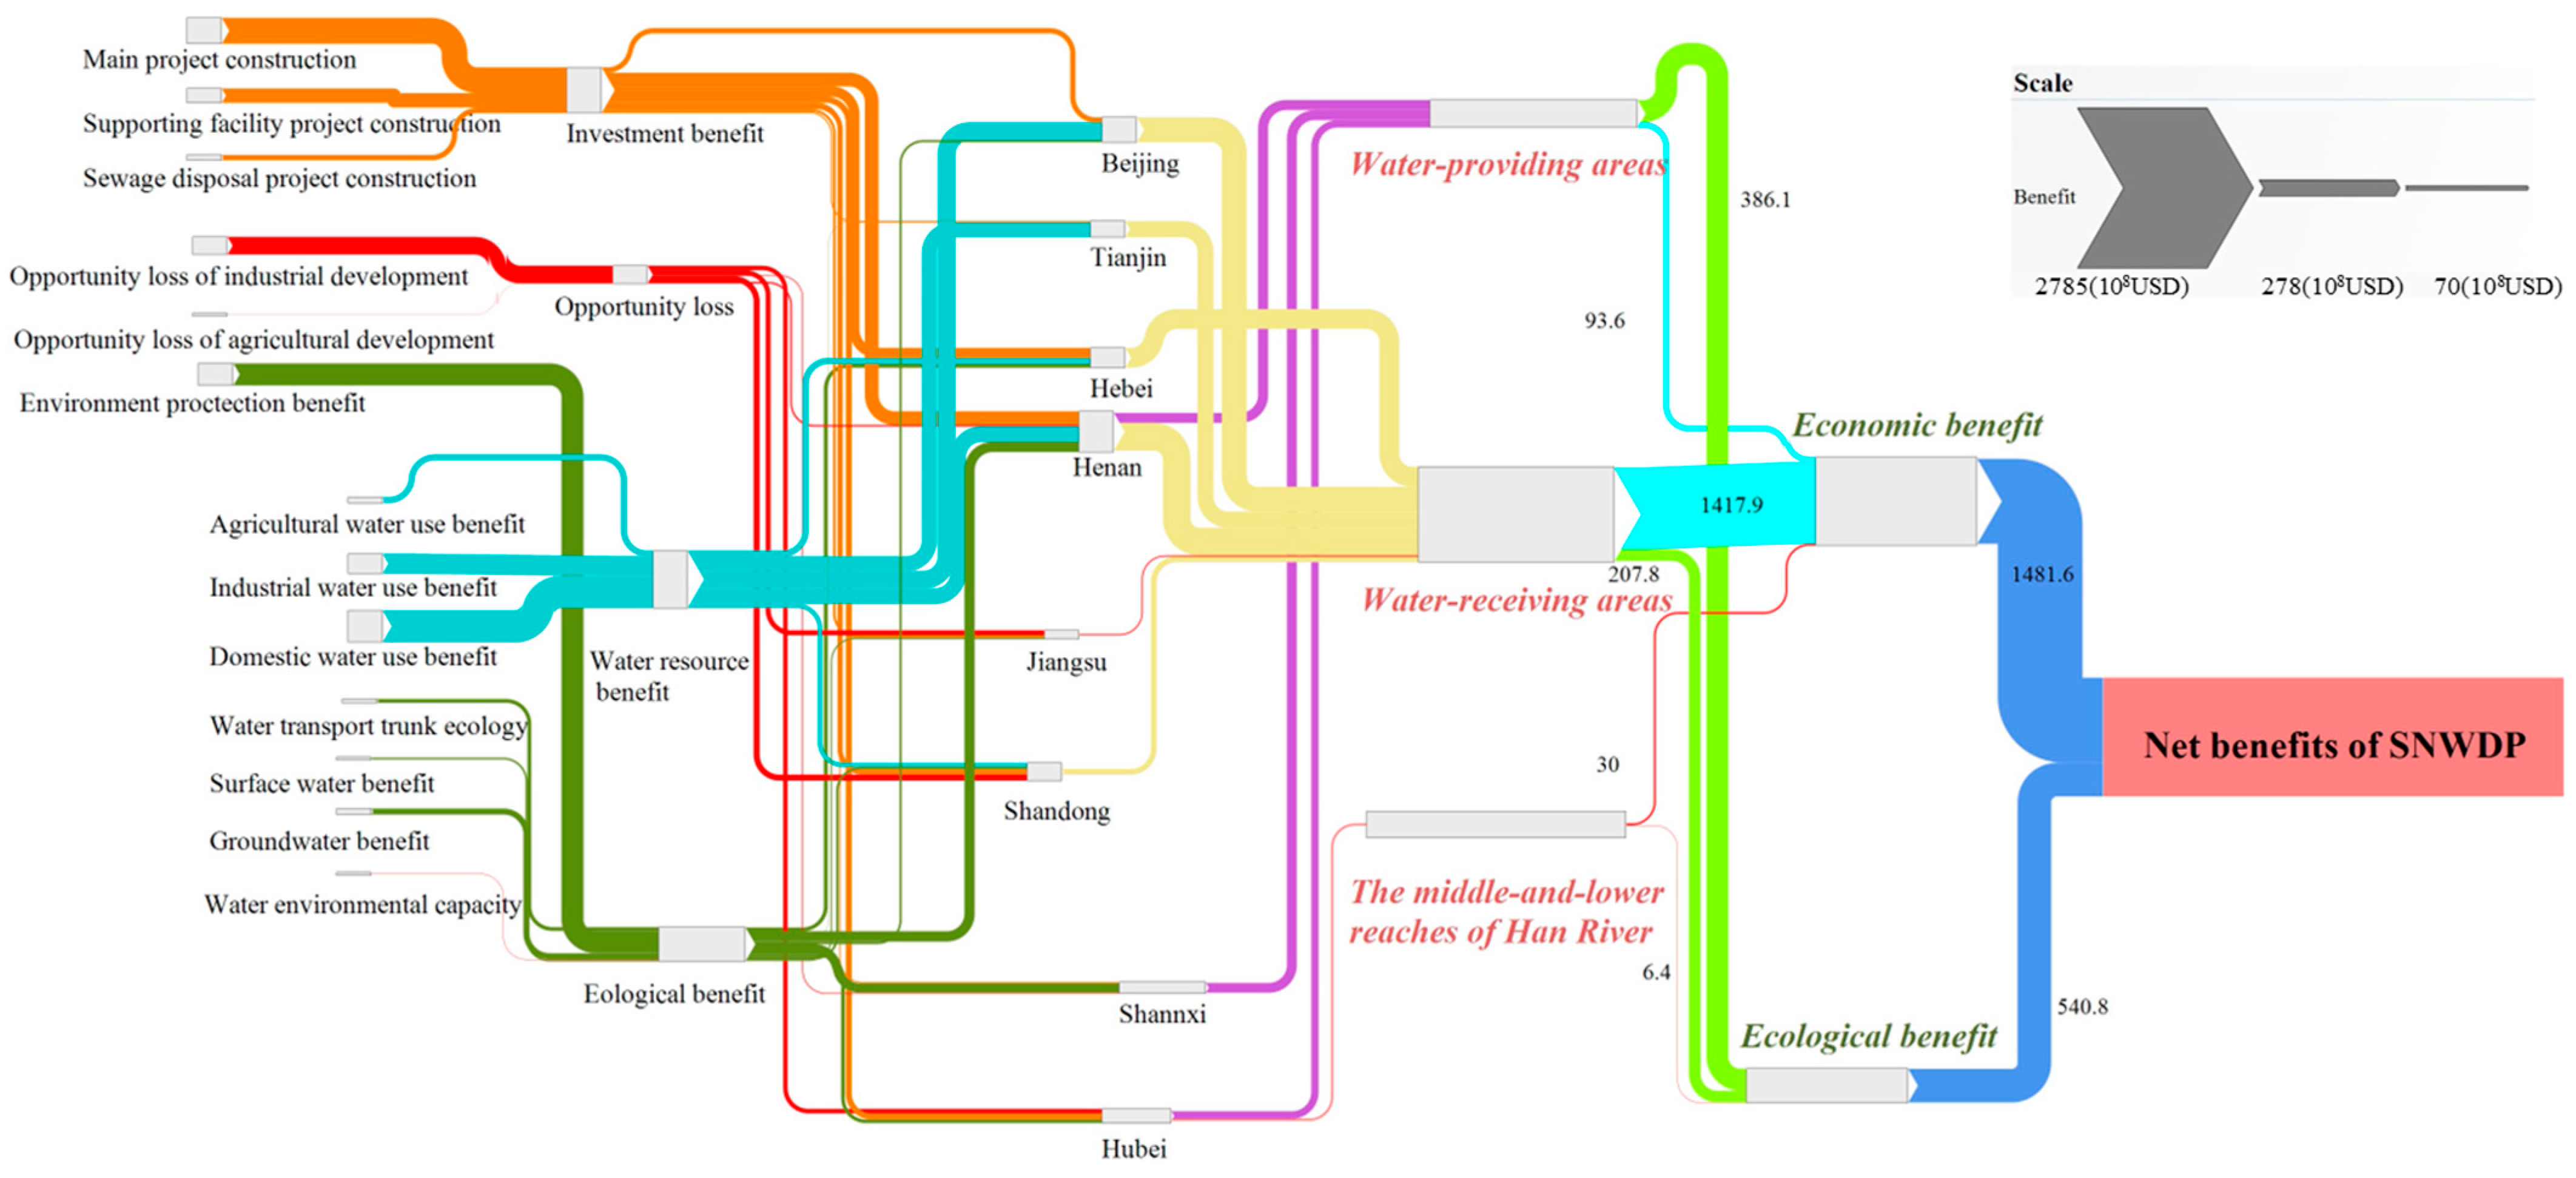
3.2. Analysis of the Comprehensive Benefits of the SNWDP from 2003 to 2020

As shown in Figure 4, the net benefits of the SNWDP were USD 207 billion, encompassing economic and ecological benefits, accounting for 71.6% and 28.4%, respectively. With regard to economic benefit, a total of 96% of economic benefits are derived from water-receiving areas, primarily investment and water resource benefits. The total investment benefit is USD 79.5 billion, with an investment multiplier of 1.24. This indicates that with USD one billion of investment in the research area, the local GDP would increase by USD 1.24 billion. Among these, the region with the highest investment benefits is Hebei Province, totaling USD 24 billion, with an investment multiplier of 1.29. This is consistent with the research by Tang et al. [59], who found that the multiplier of water conservancy investment on GDP is approximately 1.3. The total water resource benefit is USD 99.8 billion. Beijing has the highest water resource benefit of USD 30.5 billion, with a per-unit cubic meter water resource benefit of USD 4.6, which is higher than the result (USD 3.6) of Yang et al. [27]. The main reason is that, with advancements in technology and management tools, the water consumption per unit value added has gradually reduced, increasing the value per cubic meter of water.
With regard to ecological benefits, 66% of the ecological benefits originate from water-providing areas. To meet the water quality requirements for water transfer, the government has initiated water pollution prevention projects, industrial restructuring (including the closure of numerous polluting enterprises), and soil and water conservation projects since 2006, resulting in the water source area generating ecological service value that has shifted mainly from farmland to forest and water land. This is consistent with the research findings of Zhang et al. [32] and Shen et al. [60]. From 2006 to 2020, the incremental ecological value amounted to USD 38.6 billion, primarily concentrated in the Henan and Shaanxi provinces.
The net benefits of the SNWDP result from subtracting negative benefits from positive benefits, with negative benefits manifesting in both economic and ecological aspects. From 2003 to 2020, the total negative benefits of the SNWDP amounted to USD 31.8 billion, with industrial development opportunity costs accounting for the largest proportion at 95%, which are mainly concentrated in the east route pollution control areas, accounting for 62%. The industrial opportunity cost in Jiangsu and Shandong province is about USD 0.57 and 0.68 billion per year, respectively. Li et al. [61] estimated that the industrial opportunity cost in Jiangsu province was about USD 0.48 billion per year, which is significantly lower than the results obtained in this paper. This is mainly due to the consideration of Taizhou City, which accounts for 20% of the opportunity cost loss in Jiangsu province, and contrarily, Li et al. [61] used the market trading method to predict the loss of emissions reduction, which is the lowest opportunity cost.
One of the primary tasks of the SNWDP is to alleviate the ecological deterioration of water-receiving areas. Until 2020, the total ecological benefits in water-receiving areas amounted to USD 20.75 billion. Ecological benefits were generated by the creation of new water bodies and forests, surface water ecological benefits from ecological replenishment, and underground water ecological benefits, constituting 15%, 33%, and 52%, respectively. The ecological benefit to the middle route receiving area was USD 14.3 billion, with underground water accounting for 71%. The North China Plain (including the Beijing, Tianjin, and Hebei water-receiving areas) is one of the areas with the most serious groundwater overexploitation. With the help of 2.06 billion cubic meters of urban groundwater extraction decrement and 5.7 billion cubic meters of ecological water replenishment in river channels, the ecological benefits of the North China Plain increased from USD 0.34 billion in 2015 to USD 2.69 billion in 2020. However, the actual groundwater benefits may be greater. According to statistics, the decrease in underground water extraction in the North China Plain was 6.3 billion after the operation of the SNWDP. In this study, only the decrease in underground water extraction that occurs in urban areas was considered, where water is mainly supplied from the waterworks and the main source is groundwater.

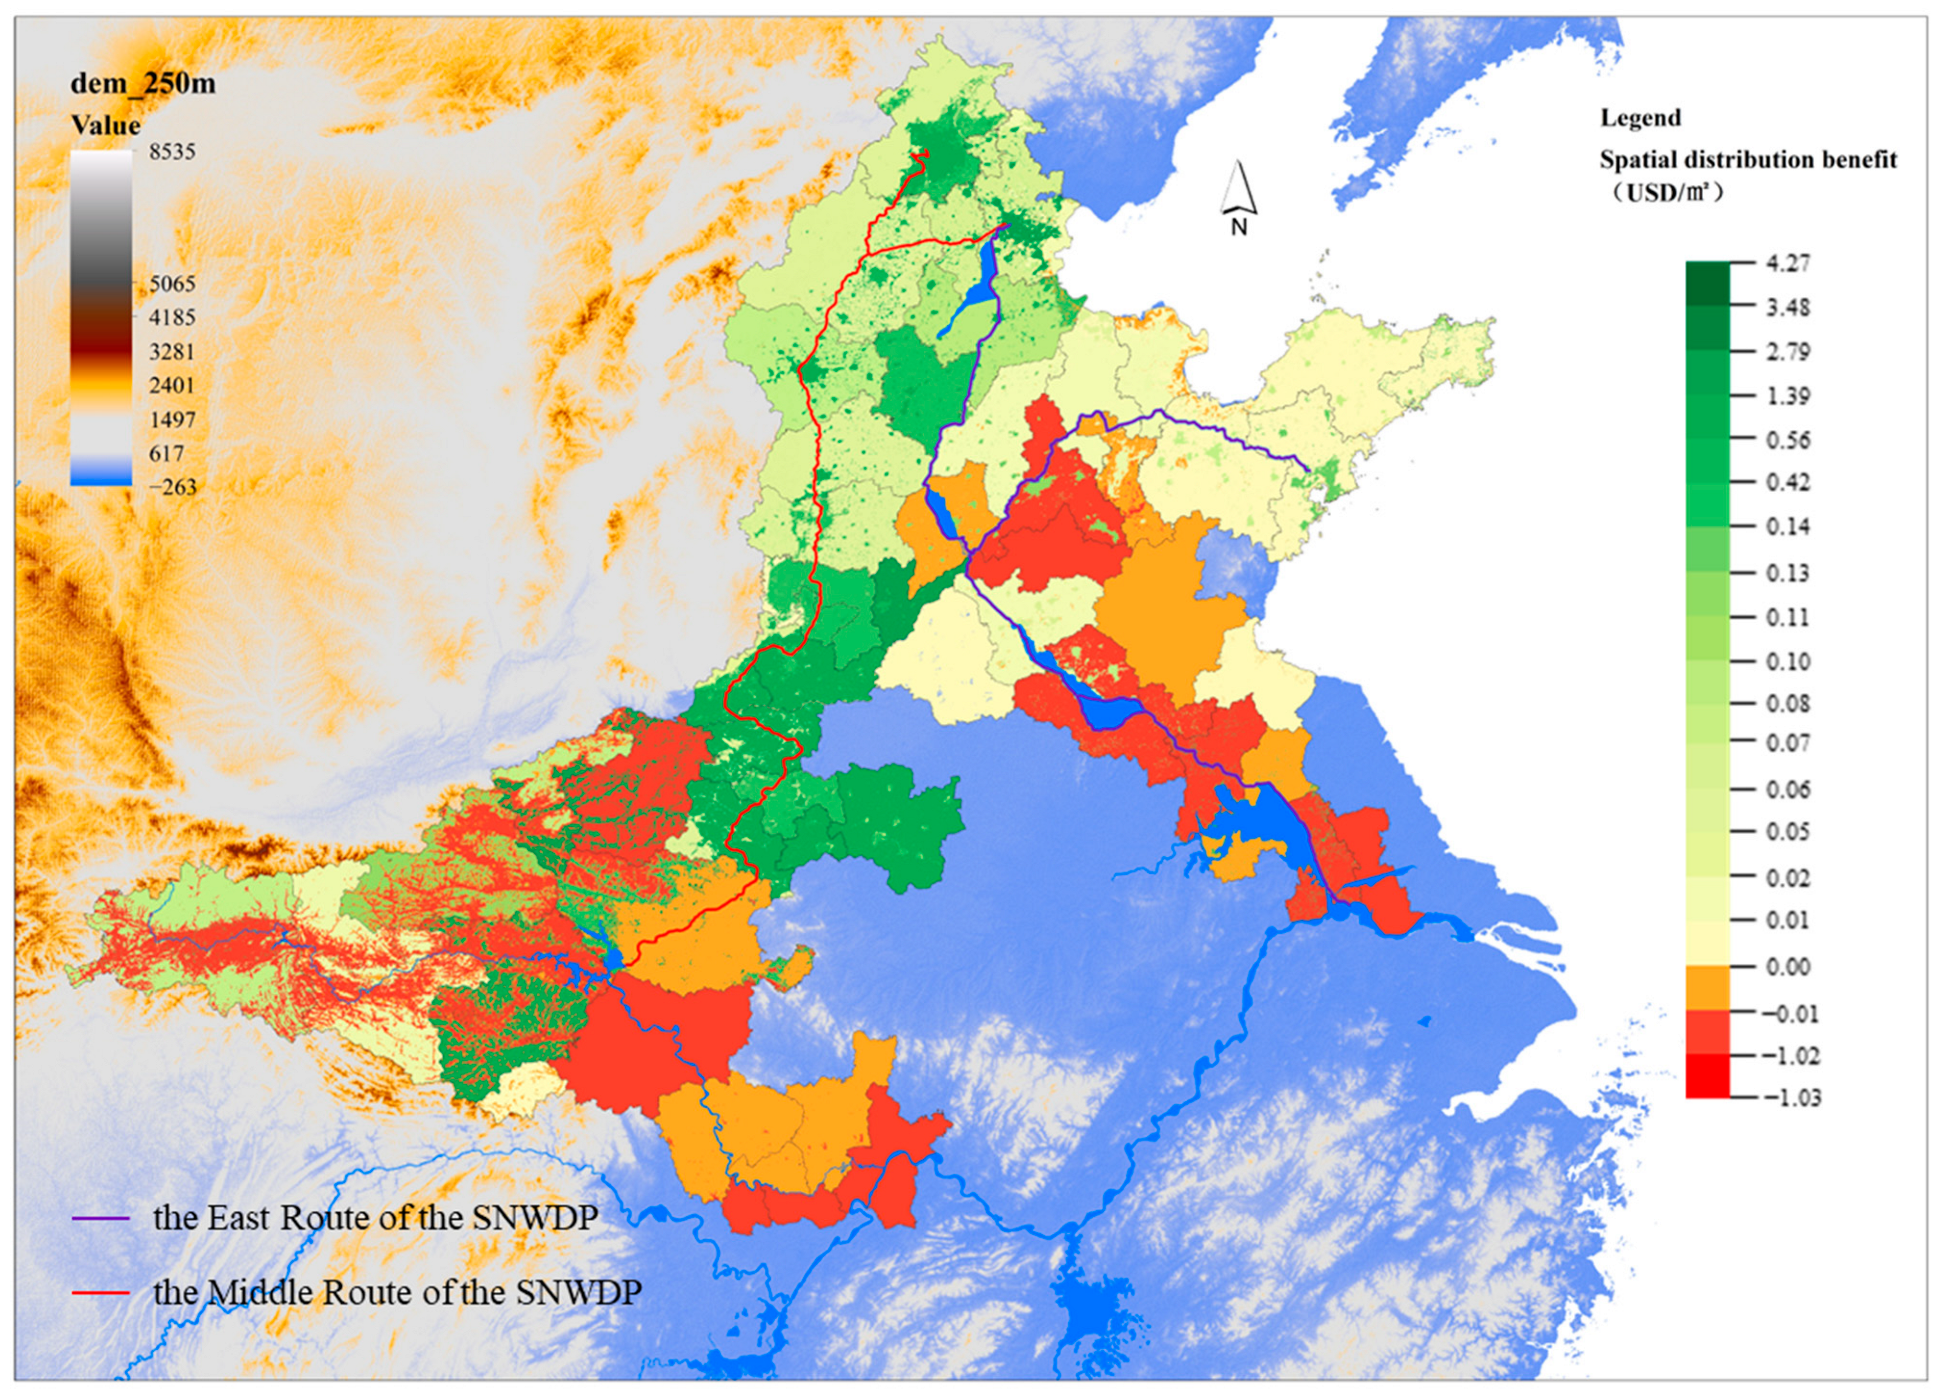
3.3. Spatial Distribution of Benefits of the SNWDP in 2020

In 2020, the net benefits of the SNWDP amounted to USD 39.3 billion, accounting for 20% of the total benefits. The positive benefits were USD 41.3 billion, with water resource benefits accounting for the largest proportion at 56%. Henan Province had the highest water resource benefits, totaling USD 6.8 billion, and the economic benefit per unit cubic meter of water resource was USD 2.8. The proportion of ecological benefits was 44%, primarily concentrated in the water-receiving areas. The water-providing areas in Shaanxi Province contributed the most significant share at 46%, where the largest ecological value was generated by forests, with the forest area increasing by 27% compared with 2005. In 2020, the negative benefits of the SNWDP amounted to USD 1.99 billion, primarily owing to the opportunity loss of industrial development, with the east route pollution control area accounting for 54% of the total. Jiangsu Province and Shandong Province incurred negative benefits of USD 0.69 billion and USD 0.72 billion, respectively.
To observe the spatial distribution of the SNWDP’s comprehensive benefits across different regions, we combine the various benefits with the area of land use type. For instance, the advantages of water used for industrial production and urban domestic use correspond to the built-up land areas, whereas water used for agriculture corresponds to the extent of cultivated land. Ecological benefits related to forests, water bodies, and other factors were distributed across the corresponding land areas. Benefits that did not significantly affect specific land types, such as investment benefits and underground water benefits, were considered to occur throughout the administrative area. This approach enabled us to derive the spatial distribution of benefits per unit area within the SNWDP study area.
As shown in Figure 5, the per unit area benefits of the SNWDP in 2020 amounted to USD 0.07. The highest benefit, reaching USD 4.26, was observed in Shiyan City, Hubei Province, located in a water-providing area, and was primarily driven by ecological benefits. The main reason for this is that Shiyan City, as a core water source area for the SNWDP, has recently placed significant emphasis on wetland conservation. Not only did the wetland area increase by 28% compared to 2005 but the per unit area ecological value was also quite high at USD 14.3, which is 2.5 times that of the wetlands in the water-providing area of Shaanxi. The lowest per-unit area benefit was USD −1.02, occurring in Xiangyang City, Hubei Province, in the middle and lower reaches of the Han River. This negative benefit was caused by the loss of environmental water capacity. Considering that the reduction in water volume is a primary factor affecting the river basin’s water environment [53], with the operation of the SNWDP, Xiangyang City experienced the most significant reduction in water volume. According to observations from the Huangjiagang Hydrological Station (Xiangyang City), the reduction in water volume was 31.8% compared with the period before the operation of the project [44]. This severely damaged the environmental water capacity of Xiangyang City.
Regarding the spatial distribution of benefits in various regions of the SNWDP, the per-unit area benefit in water-providing areas was USD 0.07. The benefit intensity increased from west to east, indicating that the closer it was to the Danjiangkou Reservoir, the more pronounced the effects of environmental protection. Negative benefits in the water-providing areas result from the loss of industrial development opportunities, and their impact gradually spreads from west to east, with a per-unit area loss of USD 0.04 in terms of industrial development opportunities. In the receiving areas of the SNWDP, including pollution control areas, the per-unit area benefit was USD 0.074. In the middle route receiving areas (except Nanyang City), positive benefits were observed, primarily driven by water resource benefits, with a per-unit area water resource benefit of USD 0.51. The cities in Henan Province generally have higher per-unit area benefits, ranging from USD 0.06 to 0.89. Agricultural water use benefits were the highest per unit area, whereas forest benefits were the lowest. Water resource benefits in most cities in Hebei Province were generally lower, with per-unit area benefits ranging from USD 0.06 to 0.77.
Regarding the eastern route of the SNWDP, most areas serve as both receiving and pollution control areas. However, in many areas of Shandong Province, positive benefits were observed, whereas in most areas of Jiangsu Province, negative benefits were observed. This is primarily because the benefits of water resources and ecological replenishment in Jiangsu Province have not yet been assessed. Consequently, the benefits in Jiangsu Province are mainly driven by the loss of industrial development opportunities, with a per-unit area loss of USD −0.015. By contrast, in Shandong Province, the benefits were mainly driven by water resource benefits, with a per-unit area benefit of USD 0.007. Notably, the operation of the eastern route has increased the ecological benefits along the receiving areas of Jiangsu and Shandong provinces, with per-unit area water body ecological benefits of USD 0.11 and USD 0.24, respectively.
Regarding the middle and lower reaches of the Han River, all regions exhibited negative benefits, with a per-unit area benefit of USD −0.009. The areas with the most significant negative benefits were concentrated downstream of the Danjiangkou Reservoir (Xiangyang City) and downstream cities along the Han River (Qianjiang City, Xiantao, and Wuhan City).

4. Discussion

4.1. Analysis of Comprehensive Benefit Future Trends of the SNWDP

As shown in Figure 6, during the construction period, the SNWDP exhibited a trend of increasing net benefits followed by a decline. This is primarily because the construction period is driven by investment benefits; as investment costs gradually decrease, a project’s overall benefits decline. After the project entered the operational period, the benefits continued to show a sustained upward trend, with an average annual growth rate of 56%. It is expected that the future benefits of SNWDP will continue to increase.
Regarding the benefits in water-providing areas, ecological benefits are the primary driving factors. According to remote sensing analysis, the forest area in water-providing areas increased continuously from 2005 to 2020, expanding from 5.98 thousand square kilometers to 7.12 thousand square kilometers. This was a significant contributor to the rapid increase in the ecological service value of the water-providing area within a short period. However, when agricultural and industrial development are significantly constrained, the ecological value, corrected using economic value as a factor, is likely to decline. As ecological services and economic development continue to adapt, ecological values and economic development are expected to show significant upward trends. In 2020, the prices per hectare of modified farmland in Henan and Shaanxi within the water-providing areas increased by 23% and 24%, respectively, compared to 2019. This is a major contributing factor to the significant increase in the ecological value of the water source area in 2020.
Regarding the water-receiving areas, the overall benefit showed an upward trend, with an average annual growth rate of 252%. After entering the operational period, the benefits were primarily driven by water resources. Although the volume of water diversion increased from 0.78 billion cubic meters in 2014 to 9.3 billion cubic meters in 2020, there is still some distance to cover to reach the planned value. Therefore, water resource benefits are likely to increase. Moreover, there was significant variation in unit water benefits across different regions. Beijing has the highest domestic water benefit at USD 7.46 per cubic meter, which is 8.6 times the lowest domestic water benefit. Shandong has the highest industrial water benefit of USD 9.47 per cubic meter, which is 3.8 times the lowest industrial water benefit. The primary reason for unit water benefits is the varying levels of development in the tertiary sector across the receiving areas. If, in the future, water resources are allocated more efficiently as water diversion volumes increase, the benefits of the SNWDP could see more noticeable improvements. Notably, the long-term diversion of water is likely to have a significant impact on local ecology, especially in terms of reducing damage to underground water ecosystems. Under the development concept of “ Clear waters and green mountains are as good as mountains of gold and silver” in China, many scholars are exploring ways to actualize the value of ecological services [62]. Therefore, the ecological benefits of the SNWDP are likely to be further expanded.
Regarding the middle and lower reaches of the Han River, the overall trend is negative in terms of benefits, primarily resulting from a 93% loss in industrial development opportunities and a 7% loss in water environmental capacity. However, the loss of industrial development opportunities decreased significantly after 2015. The growth rate decreased from 38% (2006–2015) to 2% (2016–2019), and industrial development opportunity loss decreased from USD 1.74 billion to USD 1.42 billion in 2020. This indicates that the negative effect of industrial structural adjustments is gradually decreasing as industries are upgraded. According to the trend of growing opportunity loss in industrial development, there is a potential for further decline of negative effects in the future.

4.2. Analysis of Possible Impacts without the SNWDP

In the absence of inter-basin water diversion projects, regions facing water resource shortages and ecological degradation typically adopt various measures to address these challenges. This discussion focuses on the impact of adjusting industrial structures, specifically limiting the development of high-water-consumption industries. From 2014 to 2020, the total volume of water used for domestic and industrial purposes was 28 billion cubic meters (Table 2). If these waters were not utilized to generate benefits as originally intended but instead resulted in losses by restricting industrial development, the cumulative loss would be USD 110 billion. Additionally, in the absence of the SNWDP, the ecological benefits generated during the construction of the project and the surface and groundwater benefits resulting from ecological replenishment in the receiving areas were not considered, totaling USD 13.5 billion. Moreover, benefits in water source areas, pollution control areas, and the middle and lower reaches of the Han River (positive or negative) would not occur, totaling USD 26.8 billion. Therefore, based on the above evaluation, if there is no SNWDP, the total possible losses caused by industrial development restrictions in the receiving areas owing to water resource shortages will be USD 154.3 billion.

5. Conclusions

This study established a comprehensive benefit assessment framework encompassing temporal, spatial, and multi-dimensional value impacts. Temporal effects manifested the construction benefits and operational benefits. Spatial effects encompass the benefits in water-providing areas, water-receiving areas, and the middle and lower reaches of the Han River. Various methods were employed to evaluate the investment benefits, water resource benefits, ecological benefits, and opportunity development cost losses for the eastern and middle routes of the SNWDP from 2003 to 2020.
When integrated with a comprehensive benefit assessment framework, we can more effectively evaluate the advantages of water transfer projects across various project aspects compared to previous studies, mainly due to extensive data collection. From 2003 to 2020, the net benefits of the SNWDP amounted to USD 207 billion, with positive benefits reaching USD 239 billion and negative benefits totaling USD 30.9 billion. In terms of time scale, during the construction phase (2003–2013), the benefits amounted to USD 74.3 billion, primarily driven by investment benefits, constituting 65% of the total benefits. In the operational phase (2014–2020), the benefits amounted to USD 18.4 billion, with water resource benefits playing a dominant role, accounting for 56%. From a spatial perspective, the benefits in the water-providing areas, receiving areas, and downstream regions of the Han River amounted to USD 47.9 billion, USD 162.6 billion, and USD −0.51 billion, respectively. In 2020, the unit area average benefit for the SNWDP was USD 0.07. Based on this evaluation, the benefits of the SNWDP outweigh its drawbacks. However, we recommend that relevant managers closely monitor the hydrological situation, water ecological environment, and biological community evolution trends in the middle and lower reaches of the Han River to prevent environmental risks that downstream areas may face under different circumstances. Further, it is necessary to actively explore ways to realize the ecological service value of the water source area to improve the local economic development. To optimize the use of water resources in the receiving area, it is necessary to actively promote water conservation awareness, strengthen water conservation behavior, and explore the optimal path to achieve the sustainable development of the South-to-North Water Diversion Project.
This work primarily focused on assessing the ecological and economic benefits in different areas based on the comprehensive framework of IWBT. It is intended to be beneficial for managers to understand, predict, and adapt the benefits of water diversion projects. Our assessment framework can be applied to any water diversion project that involves relevant elements. Nevertheless, a thorough understanding of the SNWDP’s social and natural hydrological influence is needed, as is a feasible method for quantifying it, which is also the study’s main limitation. In addition, it is crucial to develop models that can uniformly evaluate the impacts of water diversion projects in the future.

Author Contributions

M.Y.: Conceptualization, Methodology, Software, Validation, Formal analysis, Writing the original draft. C.Q.: Conceptualization, Formal analysis, Review, and Editing. Y.Z. (Yongnan Zhu): Conceptualization, Visualization. Y.Z. (Yong Zhao): Validation, Funding acquisition. G.H.: Visualization, Supervision. L.W.: Visualization. All authors have read and agreed to the published version of the manuscript.

Funding

This research was jointly supported by the National Natural Science Foundation of China (Grant Nos. 52239004, 52025093, 52061125101, and 52109042) and the National Key Research and Development Program of China (2021YFC3200204).

Data Availability Statement

The data presented in this study are available upon request from the corresponding author.

Conflicts of Interest

The authors declare no conflicts of interest.

References

  1. Khilchevskyi, V.; Karamushka, V. Global Water Resources: Distribution and Demand. In Clean Water and Sanitation; Leal Filho, W., Azul, A.M., Brandli, L., Lange Salvia, A., Wall, T., Eds.; Encyclopedia of the UN Sustainable Development Goals; Springer International Publishing: Cham, Switzerland, 2021; pp. 1–11. ISBN 978-3-319-70061-8. [Google Scholar]
  2. Skoulikaris, C.; Ganoulis, J.; Aureli, A. A Critical Review of the Transboundary Aquifers in South-Eastern Europe and New Insights from the EU’s Water Framework Directive Implementation Process. Water Int. 2021, 46, 1060–1086. [Google Scholar] [CrossRef]
  3. New York State Department of Environmental Conservation. Guidelines for Conducting Bird and Bat Studies at Commercial Wind Energy Projects; Division of Fish Wildlife and Marine Resources: Albany, NY, USA, 2009.
  4. Sheng, J.; Qiu, W. Inter-Basin Water Transfer Policies and Water-Use Technical Efficiency: China’s South-North Water Transfer Project. Socio-Econ. Plan. Sci. 2023, 85, 101432. [Google Scholar] [CrossRef]
  5. Sun, S.; Zhou, X.; Liu, H.; Jiang, Y.; Zhou, H.; Zhang, C.; Fu, G. Unraveling the Effect of Inter-Basin Water Transfer on Reducing Water Scarcity and Its Inequality in China. Water Res. 2021, 194, 116931. [Google Scholar] [CrossRef] [PubMed]
  6. Rollason, E.; Sinha, P.; Bracken, L.J. Interbasin Water Transfer in a Changing World: A New Conceptual Model. Prog. Phys. Geogr. Earth Environ. 2022, 46, 371–397. [Google Scholar] [CrossRef]
  7. Siddik, M.A.B.; Dickson, K.E.; Rising, J.; Ruddell, B.L.; Marston, L.T. Interbasin Water Transfers in the United States and Canada. Sci. Data 2023, 10, 27. [Google Scholar] [CrossRef]
  8. Pasi, N.; Smardon, R. Inter-Linking of Rivers: A Solution for Water Crisis in India or a Decision in Doubt? J. Sci. Policy Gov. 2012, 2, 1. [Google Scholar]
  9. Liu, J.; Zang, C.; Tian, S.; Liu, J.; Yang, H.; Jia, S.; You, L.; Liu, B.; Zhang, M. Water Conservancy Projects in China: Achievements, Challenges and Way Forward. Glob. Environ. Change 2013, 23, 633–643. [Google Scholar] [CrossRef]
  10. Su, Q.; Chen, X. Efficiency Analysis of Metacoupling of Water Transfer Based on the Parallel Data Envelopment Analysis Model: A Case of the South–North Water Transfer Project-Middle Route in China. J. Clean. Prod. 2021, 313, 127952. [Google Scholar] [CrossRef]
  11. Sun, S.-K.; Wu, P.-T.; Wang, Y.-B.; Zhao, X.-N. The Virtual Water Content of Major Grain Crops and Virtual Water Flows between Regions in China. J. Sci. Food Agric. 2013, 93, 1427–1437. [Google Scholar] [CrossRef]
  12. Yu, M.; Wang, C.; Liu, Y.; Olsson, G.; Wang, C. Sustainability of Mega Water Diversion Projects: Experience and Lessons from China. Sci. Total Environ. 2018, 619–620, 721–731. [Google Scholar] [CrossRef]
  13. Yan, H.; Lin, Y.; Chen, Q.; Zhang, J.; He, S.; Feng, T.; Wang, Z.; Chen, C.; Ding, J. A Review of the Eco-Environmental Impacts of the South-to-North Water Diversion: Implications for Interbasin Water Transfers. Engineering 2023, in press. [Google Scholar] [CrossRef]
  14. Peng, Z.; Yin, J.; Zhang, L.; Zhao, J.; Liang, Y.; Wang, H. Assessment of the Socio-Economic Impact of a Water Diversion Project Fora Water-Receiving Area. Pol. J. Environ. Stud. 2020, 29, 1771–1784. [Google Scholar] [CrossRef]
  15. Li, Y.; Chen, X.; Shen, Y. Research on the Social and Economic Benefits and Ecological Issues of Water Diversion Projects in the United States. J. Econ. Water Resour. 2006, 24, 74–76. [Google Scholar]
  16. Zhuang, W. Eco-Environmental Impact of Inter-Basin Water Transfer Projects: A Review. Environ. Sci. Pollut. Res. 2016, 23, 12867–12879. [Google Scholar] [CrossRef]
  17. Matete, M.; Hassan, R. Integrated Ecological Economics Accounting Approach to Evaluation of Inter-Basin Water Transfers: An Application to the Lesotho Highlands Water Project. Ecol. Econ. 2006, 60, 246–259. [Google Scholar] [CrossRef]
  18. Larson, K.J.; Başaǧaoǧlu, H.; Mariño, M.A. Prediction of Optimal Safe Ground Water Yield and Land Subsidence in the Los Banos-Kettleman City Area, California, Using a Calibrated Numerical Simulation Model. J. Hydrol. 2001, 242, 79–102. [Google Scholar] [CrossRef]
  19. Liu, H.; Di, H.; Huang, Y.; Zheng, L.; Zhang, Y. A Comprehensive Study of the Impact of Large-Scale Landscape Pattern Changes on the Watershed Ecosystem. Water 2021, 13, 1361. [Google Scholar] [CrossRef]
  20. Wilson, M.; Li, X.-Y.; Ma, Y.-J.; Smith, A.; Wu, J. A Review of the Economic, Social, and Environmental Impacts of China’s South–North Water Transfer Project: A Sustainability Perspective. Sustainability 2017, 9, 1489. [Google Scholar] [CrossRef]
  21. de Queiroz, A.R.S.; Motta-Veiga, M. Análise dos impactos sociais e à saúde de grandes empreendimentos hidrelétricos: Lições para uma gestão energética sustentável. Ciênc. Saúde Coletiva 2012, 17, 1387–1398. [Google Scholar] [CrossRef] [PubMed]
  22. Faúndez, M.; Alcayaga, H.; Walters, J.; Pizarro, A.; Soto-Alvarez, M. Sustainability of Water Transfer Projects: A Systematic Review. Sci. Total Environ. 2023, 860, 160500. [Google Scholar] [CrossRef] [PubMed]
  23. Davies, B.R.; Thoms, M.; Meador, M. An Assessment of the Ecological Impacts of Inter-Basin Water Transfers, and Their Threats to River Basin Integrity and Conservation. Aquat. Conserv. Mar. Freshw. Ecosyst. 1992, 2, 325–349. [Google Scholar] [CrossRef]
  24. Voulvoulis, N.; Arpon, K.D.; Giakoumis, T. The EU Water Framework Directive: From Great Expectations to Problems with Implementation. Sci. Total Environ. 2017, 575, 358–366. [Google Scholar] [CrossRef] [PubMed]
  25. Su, Q.; Chang, H.-S.; Chen, X.; Xiao, J. Metacoupling of Water Transfer: The Interaction of Ecological Environment in the Middle Route of China’s South-North Project. Int. J. Environ. Res. Public. Health 2022, 19, 10555. [Google Scholar] [CrossRef] [PubMed]
  26. Wang, C.; Jiang, Q.; Shao, Y.; Sun, S.; Xiao, L.; Guo, J. Ecological Environment Assessment Based on Land Use Simulation: A Case Study in the Heihe River Basin. Sci. Total Environ. 2019, 697, 133928. [Google Scholar] [CrossRef] [PubMed]
  27. Yang, L.; Zhu, Q.; Sun, J.; Du, Y.; Shen, B. Water Supply Benefit Evaluation of Middle Route Project of South-to-North Water Diversion in Beijing City. Yangtze River 2017, 48, 44–46+78. [Google Scholar] [CrossRef]
  28. Long, D.; Yang, W.; Scanlon, B.R.; Zhao, J.; Liu, D.; Burek, P.; Pan, Y.; You, L.; Wada, Y. South-to-North Water Diversion Stabilizing Beijing’s Groundwater Levels. Nat. Commun. 2020, 11, 3665. [Google Scholar] [CrossRef] [PubMed]
  29. Jia, Y.; Zhu, C.; Ling, F.; Zhang, Y.; Wang, L.; Du, G. Forest Cover Monitoring and Its Changes in Hanjiang River Basin Based on Landsat Multispectral and PALSAR/PALSAR-2 Data. Resour. Environ. Yangtze Basin 2021, 30, 321–329. [Google Scholar]
  30. Zhang, X.; Duan, B.; He, S.; Wu, X.; Zhao, D. Assessment of the Value of Ecosystem Services in Water Sources of the South-North Water Diversion Central Project: The Case of Dengzhou City, Henan Province. Environ. Monit. Assess. 2021, 193, 670. [Google Scholar] [CrossRef]
  31. Liu, H.; Zheng, L.; Yin, S. Multi-Perspective Analysis of Vegetation Cover Changes and Driving Factors of Long Time Series Based on Climate and Terrain Data in Hanjiang River Basin, China. Arab. J. Geosci. 2018, 11, 509. [Google Scholar] [CrossRef]
  32. Zhang, X.; Nie, Y. Evaluation of Ecosystem Service Value in Water Source Area of the MiddleRoute of South-to-North Water Transfer Projec. J. North China Univ. Water Resour. Electr. Power Nat. Sci. Ed. 2022, 43, 89–95+102. [Google Scholar] [CrossRef]
  33. Gu, W.; Shao, D.; Jiang, Y. Risk Evaluation of Water Shortage in Source Area of Middle Route Project for South-to-North Water Transfer in China. Water Resour. Manag. 2012, 26, 3479–3493. [Google Scholar] [CrossRef]
  34. Wang, Y.; Zhu, K.; Xiong, X.; Yin, J.; Yan, H.; Zhang, Y.; Liu, H. Assessment of the Ecological Compensation Standards for Cross-Basin Water Diversion Projects from the Perspective of Main Headwater and Receiver Areas. Int. J. Environ. Res. Public. Health 2022, 20, 717. [Google Scholar] [CrossRef]
  35. Yu, M.; Wood, P.; Van De Giesen, N.; Liu, X.; Li, Q.; Wang, G.; Zhang, J. Enhanced Potential Ecological Risk Induced by a Large Scale Water Diversion Project. Stoch. Environ. Res. Risk Assess. 2020, 34, 2125–2138. [Google Scholar] [CrossRef]
  36. Nong, X.; Yi, X.; Chen, L.; Shao, D.; Zhang, C. Impact of Inter-Basin Water Diversion Project Operation on Water Quality Variations of Hanjiang River, China. Front. Ecol. Evol. 2023, 11, 1159187. [Google Scholar] [CrossRef]
  37. Xu, J.; Du, C.; Wang, X.; Tan, J.; Xia, C.; Hou, J.; Fan, Z.; Wu, H.; Wang, J.; He, X. Current Situation and Changing Trend of Aquatic Organisms Resources in Main Stream of Hanjiang River from 2017 to 2020. J. Huazhong Agric. Univ. 2021, 40, 127–137. [Google Scholar]
  38. Xia, R.; Zou, L.; Zhang, Y.; Zhang, Y.; Chen, Y.; Liu, C.; Yang, Z.; Ma, S. Algal Bloom Prediction Influenced by the Water Transfer Project in the Middle-Lower Hanjiang River. Ecol. Model. 2022, 463, 109814. [Google Scholar] [CrossRef]
  39. Liang, X.; Yang, M. Research and Analysis of Eco-Environment in Middle and Lower Reaches of Hanjiang River. West Froum 2018, 28, 90–99. [Google Scholar]
  40. Greer, M. Chapter 4—The Economics (and Econometrics) of Cost Modeling. In Electricity Cost Modeling Calculations, 2nd ed.; Greer, M., Ed.; Academic Press: Cambridge, MA, USA, 2022; pp. 175–209. ISBN 978-0-12-821365-0. [Google Scholar]
  41. Xie, G.; Zhen, L.; Lu, C.; Xiao, Y.; Chen, C. Expert Knowledge Based Valuation Method of Ecosystem Services in China. J. Nat. Resour. 2008, 23, 911–919. [Google Scholar]
  42. Zhang, Z.; Hu, C.; Wu, Z.; Zhang, Z.; Yang, S.; Yang, W. Monitoring and Analysis of Ground Subsidence in Shanghai Based on PS-InSAR and SBAS-InSAR Technologies. Sci. Rep. 2023, 13, 8031. [Google Scholar] [CrossRef] [PubMed]
  43. Liu, R.; Zhao, Y.; Cao, G.; Wang, Q.; Ma, M.; Li, E.; Deng, H. Threat of Land Subsidence to the Groundwater Supply Capacity of a Multi-Layer Aquifer System. J. Hydrol. Reg. Stud. 2022, 44, 101240. [Google Scholar] [CrossRef]
  44. Zeng, Z.; Xu, J.; Wu, G.; Wang, Y.; Huo, J. Evaluation of Ecological Services of the First Phase of Middle Route of the South-to-North Water Transfer Project: A Case Study of Beijing City. South-North Water Transf. Water Sci. Technol. 2022, 20, 1168–1178. [Google Scholar] [CrossRef]
  45. Bian, Y. Study on the Influence of Ecological Water Supplement of Yongding River on Groundwater Dynamics in Beijing; China University of Geosciences (Beijing): Beijing, China, 2020. [Google Scholar]
  46. Wei, H.; Yao, X.; Sun, Y.; Liu, P.; Wang, B.; Wang, W.; Zhang, Q. Analysis on Leakage Characteristics of Ecological Water Supplement in the North Part of the Plain Section of Yongding River. Beijing Water 2022, 14, 1262. [Google Scholar] [CrossRef]
  47. Jiao, Y.; Liu, J.; Li, C.; Qiu, Q.; Yu, X.; Wang, W.; Zhang, G. Regulation Storage Calculation and Capacity Evaluation of the Underground Reservoir in the Groundwater Overdraft Area of Northern China. Environ. Earth Sci. 2020, 79, 18. [Google Scholar] [CrossRef]
  48. Meng, Q.; Ouyang, Z.; Mang, D. Water Ecosystem Service Asseseement and Valuation in Beijing; Science Press: Beijing, China, 2012. [Google Scholar]
  49. Jiang, S.; Wang, J.; Zhao, Y.; Shang, Y.; Gao, X.; Li, H.; Wang, Q.; Zhu, Y. Sustainability of Water Resources for Agriculture Considering Grain Production, Trade and Consumption in China from 2004 to 2013. J. Clean. Prod. 2017, 149, 1210–1218. [Google Scholar] [CrossRef]
  50. Shen, S. Research on Impact of Cascade Reservoirs and Water Diversion on Water Environment in the Middle and Lower Reaches of the Hanjiang River; Wuhan University: Wuhan, China, 2020. [Google Scholar]
  51. CSNWDP. Compilation Committee of China South-to-North Water Diversion Project Yearbook (CSNWDP); China Water & Power Press: Beijing, China, 2021. [Google Scholar]
  52. HNSNWDP. Compilation Committee of Henan Province South to North Water Diversion Yearbook Compilation Committee (HNSNWDP); The Yellow River Water Conservancy Press: Zhengzhou, China, 2021. [Google Scholar]
  53. CSNWDPC. Compilation Committee of China South-to-North Water Diversion Project Construction Yearbook (CSNWDPC); China Water & Power Press: Beijing, China, 2021. [Google Scholar]
  54. CSNWDP-PC. Compilation Committee of China South-to-North Water Diversion Project (Pollution Control Volume) (CSNWDP-PC); China Water & Power Press: Beijing, China, 2018. [Google Scholar]
  55. NBS. China Statistical Yearbook. National Bureau of Statistics of the People’s Republic of China (NBS); China Statistics Press: Beijing, China, 2021. [Google Scholar]
  56. CSNWDP-PC. Compilation Committee of China South-to-North Water Diversion Project (Land Acquisition and Resettlement Volume) (CSNWDP-PC); China Water & Power Press: Beijing, China, 2018. [Google Scholar]
  57. NDRC. The National Cost-Benefit Survey for Agricultural Product. National Development and Reform Commission (NDRC); China Statistics Press: Beijing, China, 2021. [Google Scholar]
  58. MARAPR. Ministry of Agriculture and Rural Affairs of the People’s Republic of China (MARAPR), China Agricultural Yearbook 2021; China Agricultural Press: Beijing, China, 2021. [Google Scholar]
  59. Tang, W.; Xu, X.; Xu, G. On the Stimulating Effect of Large-Scale Water Conservancy Project Investment on China’s Economy: Based on the Analysis of Water Conservancy Social Accounting Matrix. Contemp. Finance Econ. 2011, 11, 20–29. [Google Scholar]
  60. Shen, H.; Tian, Q.; Wu, G. Study on Land/Cover Change in the Water Supply Area of the Middle-Route of the South-to-North Water Diversion (MR-SNWD) Project. Res. Soil Water Conserv. 2015, 22, 204–208+347. [Google Scholar] [CrossRef]
  61. Li, J.; Xue, Z.; Wang, D. Research on the Ecological Compensation of the Eastern Route of South-to-North Water Transfer Project Based on the Evolutionary Game Theory. China Rural. Water Hydropower 2022, 12, 31–38. [Google Scholar]
  62. Xu, Y.; Zhao, W.; Zhang, Z. The Practice of Nature-Based Solutions in China: Ecosystem Product Value Realization. Curr. Opin. Environ. Sci. Health 2023, 36, 100514. [Google Scholar] [CrossRef]
Figure 1. Geographical location of the south-to-north water diversion study area.
Water 16 00473 g001
Figure 2. Research framework for multi-regional comprehensive benefits of IWBT projects. Figure (a) shows the different benefits involved in the construction period of the water diversion project. Figure (b) shows the different benefits involved in the operation period of the water diversion project.
Water 16 00473 g002
Figure 3. Investment amount and water diversion volume of the SNWDP.
Water 16 00473 g003
Figure 4. Flow chart of comprehensive benefits of the SNWDP from 2003 to 2020.
Water 16 00473 g004
Figure 5. Spatial distribution of per unit area comprehensive benefits of the SNWDP in 2020.
Water 16 00473 g005
Figure 6. Benefits of the SNWDP in different regions from 2003 to 2020.
Water 16 00473 g006
Table 1. Equivalence factor of ecological service function.
Ecosystem TypesForest LandGrass LandFarm LandWetlandsRiver/Lakes
Supply servicesFood production0.330.4310.360.53
Raw material production2.980.360.390.240.35
Reconciliation
services
Gas regulation4.321.50.722.410.51
Climate regulation4.071.560.9713.552.06
Hydrological regulation4.091.520.7713.4418.77
Waste disposal1.721.321.3914.414.85
Support
services
Soil conservation4.022.241.471.990.41
Maintaining biodiversity4.511.871.023.693.43
Cultural servicesAesthetic Landscape2.080.870.174.694.44
Total28.1211.677.954.7745.35
Table 2. Results of benefits without SNWDP.
Water Diversion Volume (108 m3)
(Excluding Ecological Water Replenishment)
Receiving Areas in Middle RouteReceiving Areas in East RouteWater-Providing Areas of East and Middle RoutePollution Control Areas of East RouteThe Middle and Lower Reaches of the Han River
BeijingTianjinHebeiHenanShandongJiangsu
44.2 56.0 59.9 101.1 18.9 ----
Loss due to Restricted Industrial Development
(108 USD)
186.623.6312.8179.3 -
Ecological Benefits Driven by External Ecological Water Replenishment Volume (108 USD)Surface Water Ecological Benefits12.62.9934.2-
Benefits From Increased Groundwater Storage9.70.616.67.10.8-
Benefits along the Water Transmission Line0.30.39.93.231.4170.3
Actual Benefits of SNWDP Evaluated by This Study
(108 USD)
511.8−191.2−52.2
Total (108 USD)−1275 − 511.8 + 191.2 + 52.2 = −1543.4
Disclaimer/Publisher’s Note: The statements, opinions and data contained in all publications are solely those of the individual author(s) and contributor(s) and not of MDPI and/or the editor(s). MDPI and/or the editor(s) disclaim responsibility for any injury to people or property resulting from any ideas, methods, instructions or products referred to in the content.

