Abstract
Cyanobacteria, also known as blue-green algae, are photosynthetic bacteria that play a crucial role in aquatic ecosystems and are susceptible to changes in temperature. Hence, as global temperatures rise due to climate change, some Cyanobacterial species will thrive in warmer temperatures, which will result in increased blooms during the growing season. The MIKE-3 model is calibrated to existing (2022) conditions and is used to assess the impact of the RCP 4.5 scenario for the year 2050 in Fairy Lake (a shallow urban lake in Ontario). The simulations projected indicate that in 2050, in the central parts of Fairy Lake’s central basin, water temperatures will be above 20 °C for 2281 h compared to 2060 h in 2022. This situation indicates there will be a 10.7% increase in the duration of Cyanobacteria blooms in the central area of Fairy Lake. Similarly, in the northern area of Fairy Lake, the MIKE-3 model results indicate that surface temperature durations above 20 °C will increase from 1628 h to 2275 h for the year 2050, resulting in an additional 647 h of increased temperatures at the surface under RCP 4.5 scenario conditions. This situation indicates there will be a 39.7% increase in the duration of Cyanobacteria blooms in the northern portion of Fairy Lake. These modeling conditions indicate there will be significantly more habitat amenable to Cyanobacteria growth when surface water temperatures are above 20 °C, indicating substantial increases in the available growth time of Cyanobacteria due to climate change, all of which translate to major concerns caused by climate change.
1. Introduction
Cyanobacteria in freshwater pose a significant threat to public health and ecosystems [1]. Cyanobacteria are single-celled, prokaryotic organisms found in water bodies and moist terrestrial surfaces [1]. Large Cyanobacterial blooms, labeled harmful algal blooms (HABs), may lead to adverse environmental impacts, such as decreased ecosystem stability, the production of toxic Cyanotoxins, and mortality. These blooms are a major source of contaminants affecting drinking water quality, causing taste, odor, and toxicity issues [2].
Toxic Cyanobacteria are now recognized as health hazards, particularly in recreational waters [3,4,5], threatening drinking water and food safety as well as global water security [5]. HABs have been observed globally, impacting various water bodies, including lakes, rivers, and coastal areas [4,6,7]. In freshwater, they grow either directly as mats on the sediment or on the surface of submerged macrophytes [8].
For relatively northern countries such as Canada, Cyanobacteria may occur year-round, with rapid summer proliferation leading to Cyanobacterial blooms, often recurring in the same water bodies [9]. Global climate change, nutrient over-enrichment, and hydrologic modifications contribute to the increased frequency of harmful algal blooms. Frequently, harmful algal blooms tend to reappear in the same water body on an annual basis, although not consistently [8]. Therefore, cyanobacteria resurgences are of concern. Mitigative management practices need to be identified to stop or curtail their resurgence. The global rise in temperatures due to climate change may have implications for the distribution and abundance of blue-green algae. Changes in temperature patterns may contribute to the expansion of suitable habitats for these organisms, affecting water bodies worldwide. It is important to note that while warmer temperatures may favor the growth of blue-green algae, other factors such as nutrient availability, light exposure, and water circulation also play significant roles in the formation and persistence of cyanobacterial blooms, phenomena which are described in [10].
Cyanobacterial blooms in drinking water and recreational bodies pose challenges for communities and regulators due to their recurring nature. Predicting these blooms’ timing, magnitude, duration, and health impact is complex [2,11]. In Canada, a seasonal Maximum Acceptable Concentration (MAC) of 1.5 µg/L is set for total microcystins in drinking water [7], whereas microcystins are a class of toxins produced by certain freshwater cyanobacteria, commonly known as blue-green algae. Recreational activities such as swimming and boating may result in health risks, with Health Canada recommending a maximum concentration of 10 µg/L for total microcystins in recreational waters used for primary contact activities [2].
Canada, with over 900,000 lakes [12], holds the global record for lakes in a country and relies on these waterbodies for essential needs such as drinking water, crop irrigation, fishing, swimming, and boating. There are many urban lakes (>246 waterbodies) in Canada [13] already experiencing algal blooms and many more that will develop due to issues including anthropogenic inputs and climate change, although the degree to which the impact of climate change on the growth of Cyanobacteria is yet unknown. Canadian lakes and their watersheds face mounting challenges. Climate change, intensified farming, and urban and industrial expansion are causing pollutants to infiltrate aquatic habitats, jeopardizing the health of lakes and the vital ecosystem services they offer [12]. A study by [14] reveals a rising trend in confirmed Cyanobacteria-dominated algal blooms, reporting a multitude of diverse waterbodies in Ontario from 1994 to 2019.
From these noted concerns, the importance of understanding the mechanisms of outbreaks is critical to providing the understanding of possible methods that could influence the proliferation/outbreaks of Cyanobacteria as control mechanisms. As a result, there is an urgency to understand mechanisms that might work to control outbreaks under the auspices of climate change and issues of urban lakes for which control is important to protect urban regions. The result is the value of understanding how management might assist in identifying controls, and hence, the need to know is very important.
2. Scope of Contributing Variables
Gaining an understanding of the drivers of Cyanobacterial Harmful Algal Blooms (CyanoHABs) and understanding the influence of physiochemical and environmental variables is essential for optimizing water resource management [15]. As evidenced by the number of variables that are potentially important to understand and include, there are many, including physical-chemical variables, such as water temperature, ambient temperature, Secchi disk depth, turbidity, wind speed and direction, phosphates, total phosphorus, total nitrogen, nitrate, nitrite, ammonium ion, dissolved oxygen, conductivity, calcium, iron, alkalinity, pH, and more, indicative of the challenges of understanding CyanoHABs [15,16,17,18,19,20,21,22].
As a further indication of the complexity of understanding CyanoHABs, catchment and lake parameters such as buoyancy, nutrient uptake, light, carbon-concentrating mechanisms, temperature upwelling events, wind mixing, precipitation, catchment land-use, and factors affecting iron also play significant roles [23].
Physical lake characteristics, including temperature and stratification strength, regulate Cyanobacteria biomass [18]. Hydrological connectivity between aquatic and terrestrial landscapes influences nutrient movement and terrestrial-aquatic linkages [4]. Ecological factors such as the presence of grazing zooplankton and competition for resources impact Cyanobacteria proliferation. Once a lake experiences a bloom, the likelihood of recurrence increases [24]. Water column stability and ecological niche factors, including abundant nutrients, warm temperatures, and low water column mixing, contribute to Cyanobacterial proliferation [8,25].
A primary key to estimating the implications is that of temperature. Climate warming is changing key features of lakes, including thermal stratification, the ice-free season, and the occurrence of anoxia. These alterations impact nutrient availability, influencing the timing and extent of Cyanobacterial blooms. Increasing evidence indicates ongoing climate change intensifying, resulting in an increased extent and severity of these blooms, leading to greater Cyanobacterial dominance in various water bodies, regardless of nutrient conditions [26,27,28]. Lürling et al. [29] conducted a controlled experiment in 39 water bodies in the Netherlands and observed that warming caused an 18% increase in Cyanobacterial chlorophyll-a, while algal chlorophyll-a concentrations were on average 8% higher at 25 °C than at 20 °C. All these dimensions are influenced by temperature in the extent of Cyanobacteria blooms and the use of adaptive management within and outside water bodies to navigate eras of bloom uncertainty.
3. Modelling Approach
3.1. Advantages and Needs of Modeling
Apparent from the complexities described above, accurate prediction of Cyanobacterial blooms is urgently needed to improve the understanding of algal bloom dynamics and support proactive decision-making and risk mitigation, which requires significant complexity in modeling [5,30,31,32,33,34,35]. Predicted information provides local water managers with tools for managing adverse effects posed by CyanoHABs [32].
Predicting water quality changes in freshwater bodies, particularly algal dynamics, is challenging due to the biochemical process’s complexity and uncertainties [32,36]. Computational technology advancements have improved numerical algal bloom models, but calibration and validation of model parameters are challenging [9,37].
Three-dimensional hydrodynamic models, solving differential equations for water transport, advection, and dispersion, are critically important to ensure that physical processes are appropriately represented in modeling water bodies [38]. Environmental models are integral for the purposes of adaptive management, combining initial forecasts with post-implementation monitoring for revised actions. Despite progress, each water quality model has constraints, necessitating careful assessment to overcome shortcomings [39,40]. Hence, understanding the ranges of concerns, particularly in relation to temperature, is challenging, and the robustness of the modeling of temperature is critical to ensure that predictions are accurately characterized.
3.2. MIKE-3 Modelling
To understand the mechanisms of Cyanobacterial growth and the need for a strategy to explore different control methods, this research utilizes the MIKE-3 Flow Model Flexible Mesh, a three-dimensional model chosen for its enormous capability, flexibility, and applicability in oceanographic, coastal, and estuarine environments [41,42]. The Hydrodynamic Module is founded on the numerical solution of the three-dimensional Reynolds-averaged Navier–Stokes equations, accommodating both the full 3D Navier–Stokes equations and the 3D shallow water equations. The Hydrodynamic Module integrates continuity, momentum, temperature, salinity, and density equations, followed by a turbulent closure scheme. This approach allows for Cartesian or spherical coordinates in the horizontal domain and employs a sigma-coordinate transformation approach for the free surface. Spatial discretization uses a cell-centered finite volume method, with unstructured grids in the horizontal plane and structured discretization in the vertical domain. The MIKE-3 model employs a semi-implicit approach for time integration, treating horizontal terms explicitly and vertical terms implicitly, with interface convective fluxes calculated using an approximate Riemann solver [42].
In this research, MIKE-3 modeling is used to predict changes in the water temperatures of shallow waterbodies (as applied to Fairy Lake) and thereby adopted to assess the impacts of climate change.
4. Description of Fairy Lake Site
4.1. Characteristics of Fairy Lake
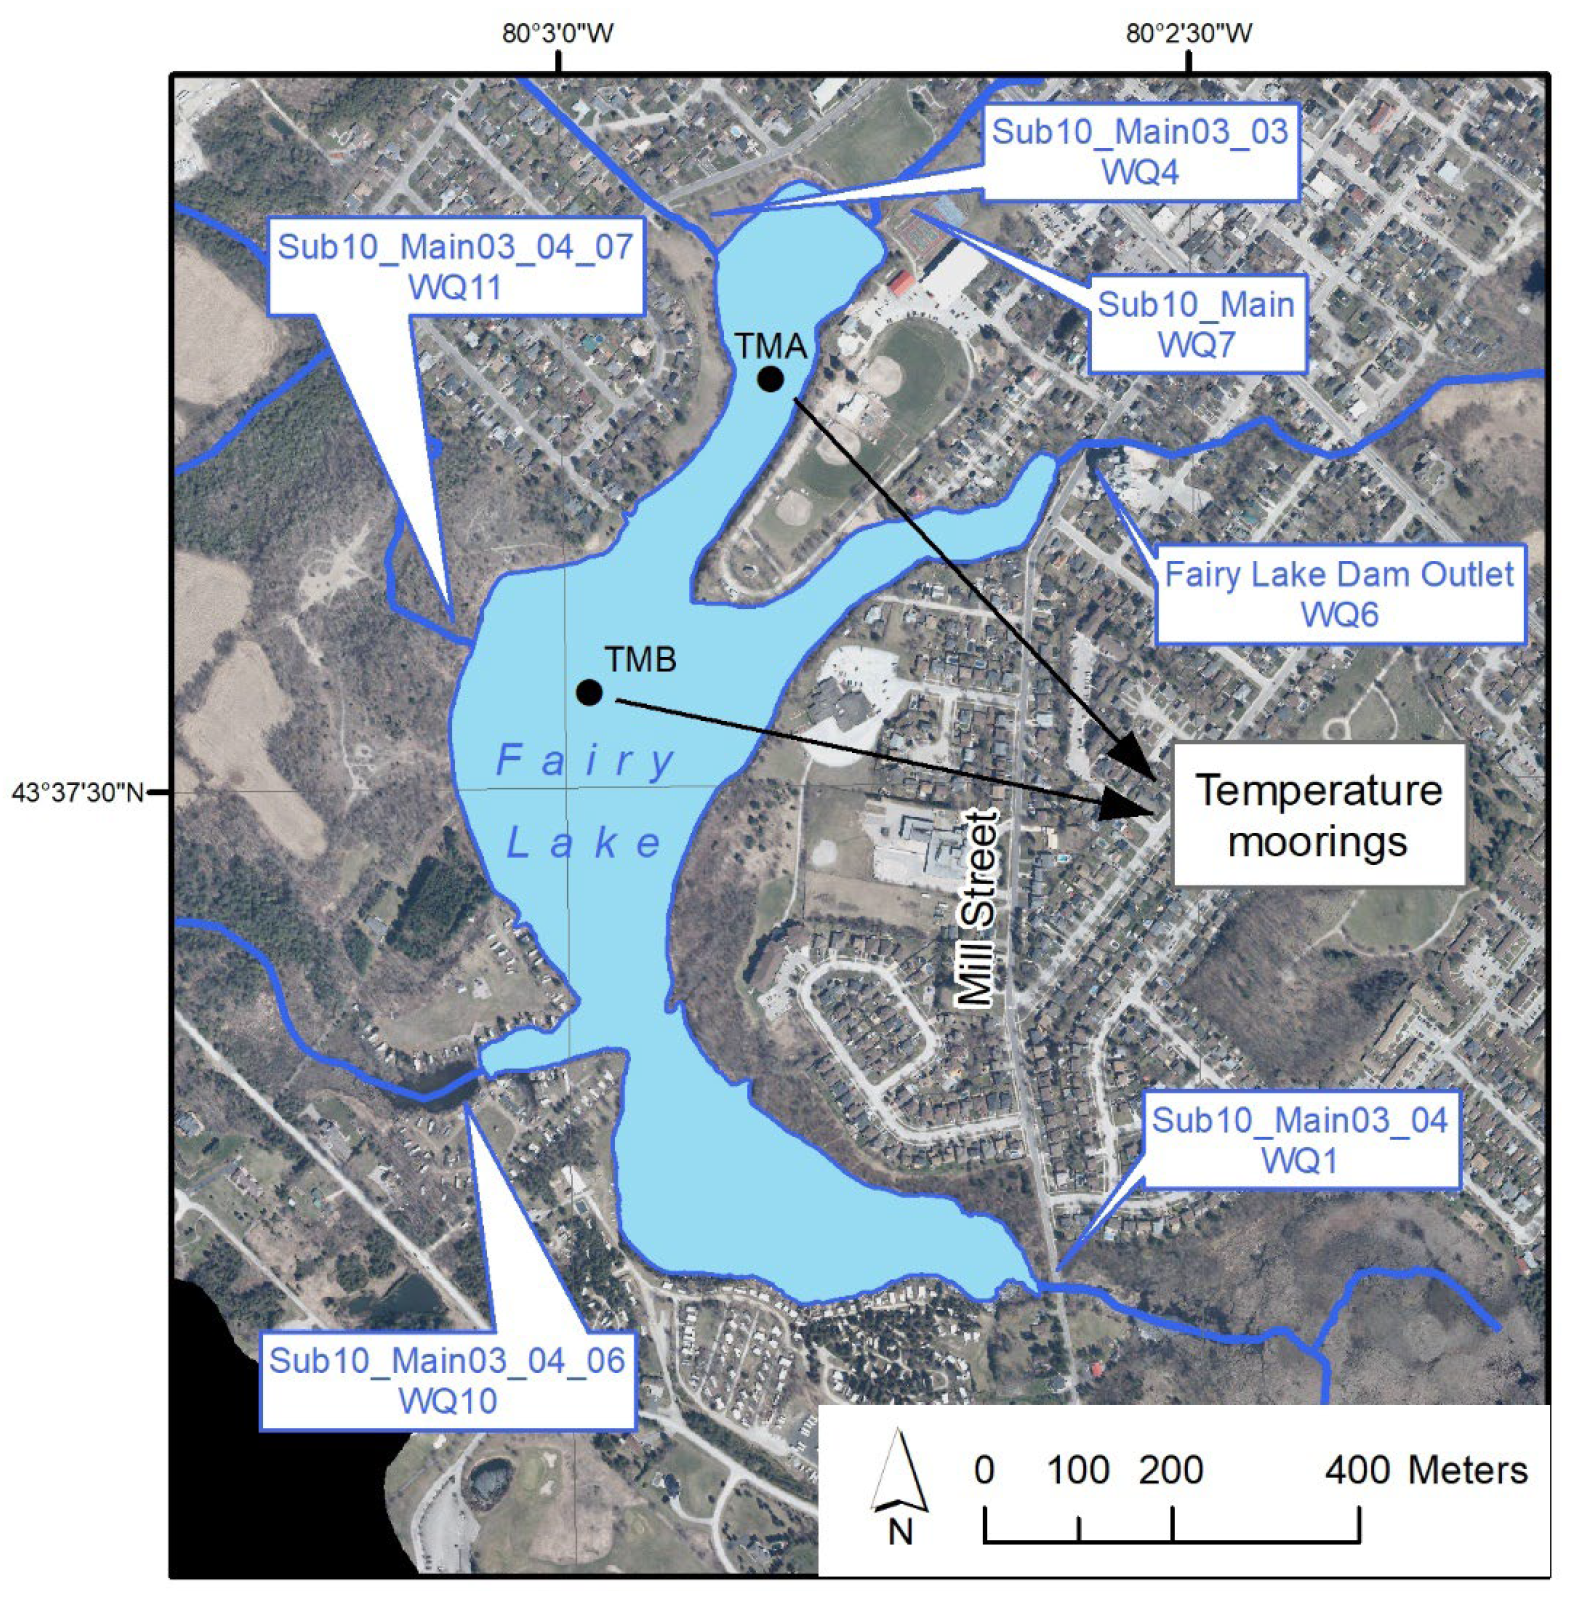
Fairy Lake is a man-made lake, ~26 ha in size, located in Acton near the headwaters of Black Creek adjacent to Prospect Park and Rotary Park, surrounded by residential properties in the Province of Ontario, Canada. The Fairy Lake dam is located at the northeast arm of the Lake, near Mill Street West and Victoria Street. Black Creek flows eastward below the dam and discharges to the Credit River system. Outlet flows from the Lake are controlled using a series of stop logs that can be adjusted to regulate the elevation of Fairy Lake, which is currently set at an elevation of 345 m above sea level (ASL) [43]. Fairy Lake is part of a designated Provincially Significant Wetland (PSW), and the surrounding area also includes additional PSWs southwest of the lake [44]. The Lake is also adjacent to rural lands, campground/trailer parks, and natural open spaces, as shown in Figure 1.
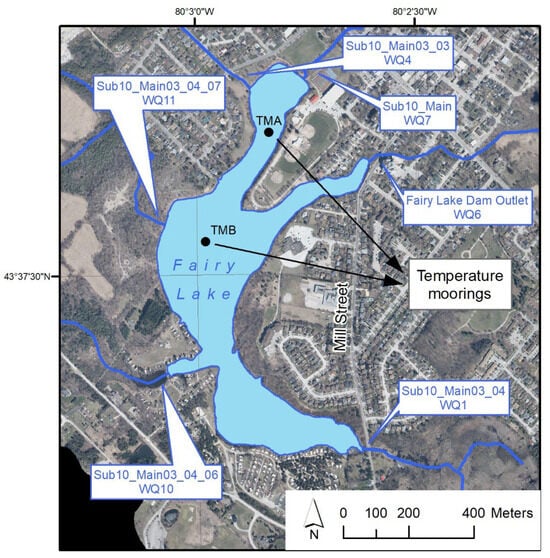
Figure 1.
Fairy Lake.
A bathymetric survey revealed that Fairy Lake has a surface area of approximately 26 ha and a perimeter of 4.6 km. The south end of the Lake has a depth of less than 2 m, while deeper water is restricted to small areas in the main and Prospect Park basins of the lake. The average lake depth is 1 m, and the maximum depth is 7 m. The volume of the Lake is 400,656 m3 [45].
Two Temperature Mooring (TMA and TMB) (shown in Figure 1) were installed in Fairy Lake and started data collection for water temperatures at depths of 0.5, 1.0, 2.0, 3.0, 4.0, 5.0 m, and the Bottom from 19 May 2022 at 12.00 p.m., along with Lake water level data. Water level data has been barometrically compensated using barometric data from the climate station at Acton Wastewater Treatment Plant. The Town of Halton Hills recently conducted a bathymetric survey in April 2022, and the elevation of the water surface in the lake was 345.7 m above sea level [46].
The chemical composition of Fairy Lake is characteristic of a shallow, alkaline character and is a productive system dominated by aquatic plants. The water quality of Fairy Lake appears to be responsive to external activities and internal processes that include the following: direct discharge to the Lake from upstream sources; discharge to the Lake from agricultural sources upstream; discharge of storm sewers to the Lake; internal nutrient dynamics (nutrient release from sediments during anoxia and/or remineralization of organic matter); direct input of fecal matter from waterfowl and runoff from surrounding landscapes and the upstream catchment; and the local wetland setting [45]. Over the past two years, blue-green algae have been identified in the Lake, and there has been increasing public concern about the conditions in the Lake both from an ecological standpoint and a recreational standpoint. Each year, there are a variety of public complaints/concerns around topics from natural vegetation blocking the views to the presence of blue-green algae, the quality of the water, or concern with levels of aquatic vegetation in the Lake [47].
4.2. Hydrodynamic Model Setup on Fairy Lake
- (a)
- Bathymetry and Mesh Generation
Fairy Lake bathymetry was conducted on 20 April 2022, and at that time, the elevation of water was at 345.41, and this water level was used as zero. The bathymetry data consist of 40,567 points, out of which 1937 were boundary points. Shown in Figure 2 are 374 nodes and 521 elements. Five boundary arcs were selected to represent boundaries. The created mesh has the smallest area of 2.91 m2, smallest angle of 26°, smallest time step based on water depth as 0.3 s, and smallest time step based on water level. Ten evenly sigma layers of 0.1 m and six z-level layers of 0.5, 0.5, 0.5, 0.5, 0.2, and 0.1 m are used in the vertical direction. The bathymetry of the mesh was validated by comparing the average elevation (m) in meters above sea level (MASL) with the Lake bed’s measured average elevation.
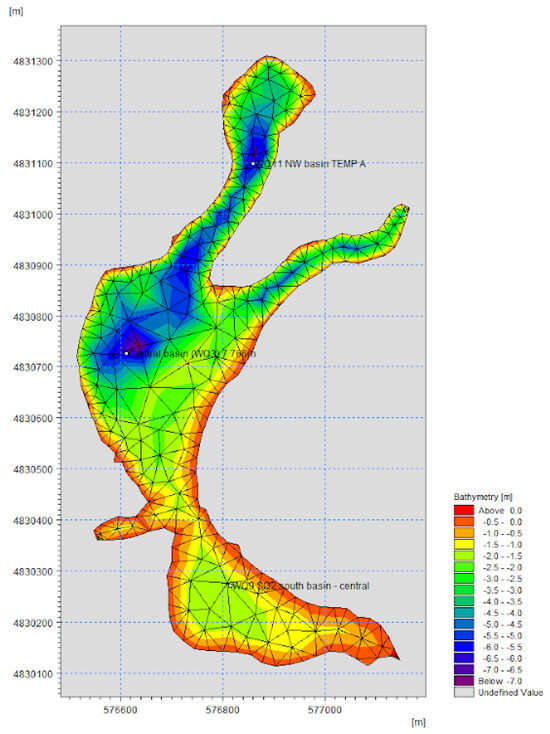
Figure 2.
Fairy Lake Model mesh.
- (b)
- Hydrodynamic Module Parameters
A shallow water equation is used as the governing equation for the Fairy Lake model as it takes less computation time. MIKE-3 solves the shallow water equations under the Boussinesq and hydrostatic assumptions using a cell-centered finite volume method with explicit time stepping. Horizontally, it uses a triangular unstructured mesh, while vertically, a structured grid is used with sigma-coordinate layers and z layers. Interested readers are encouraged to consult [41] for details of these vertical layers.
- (c)
- Model Boundaries
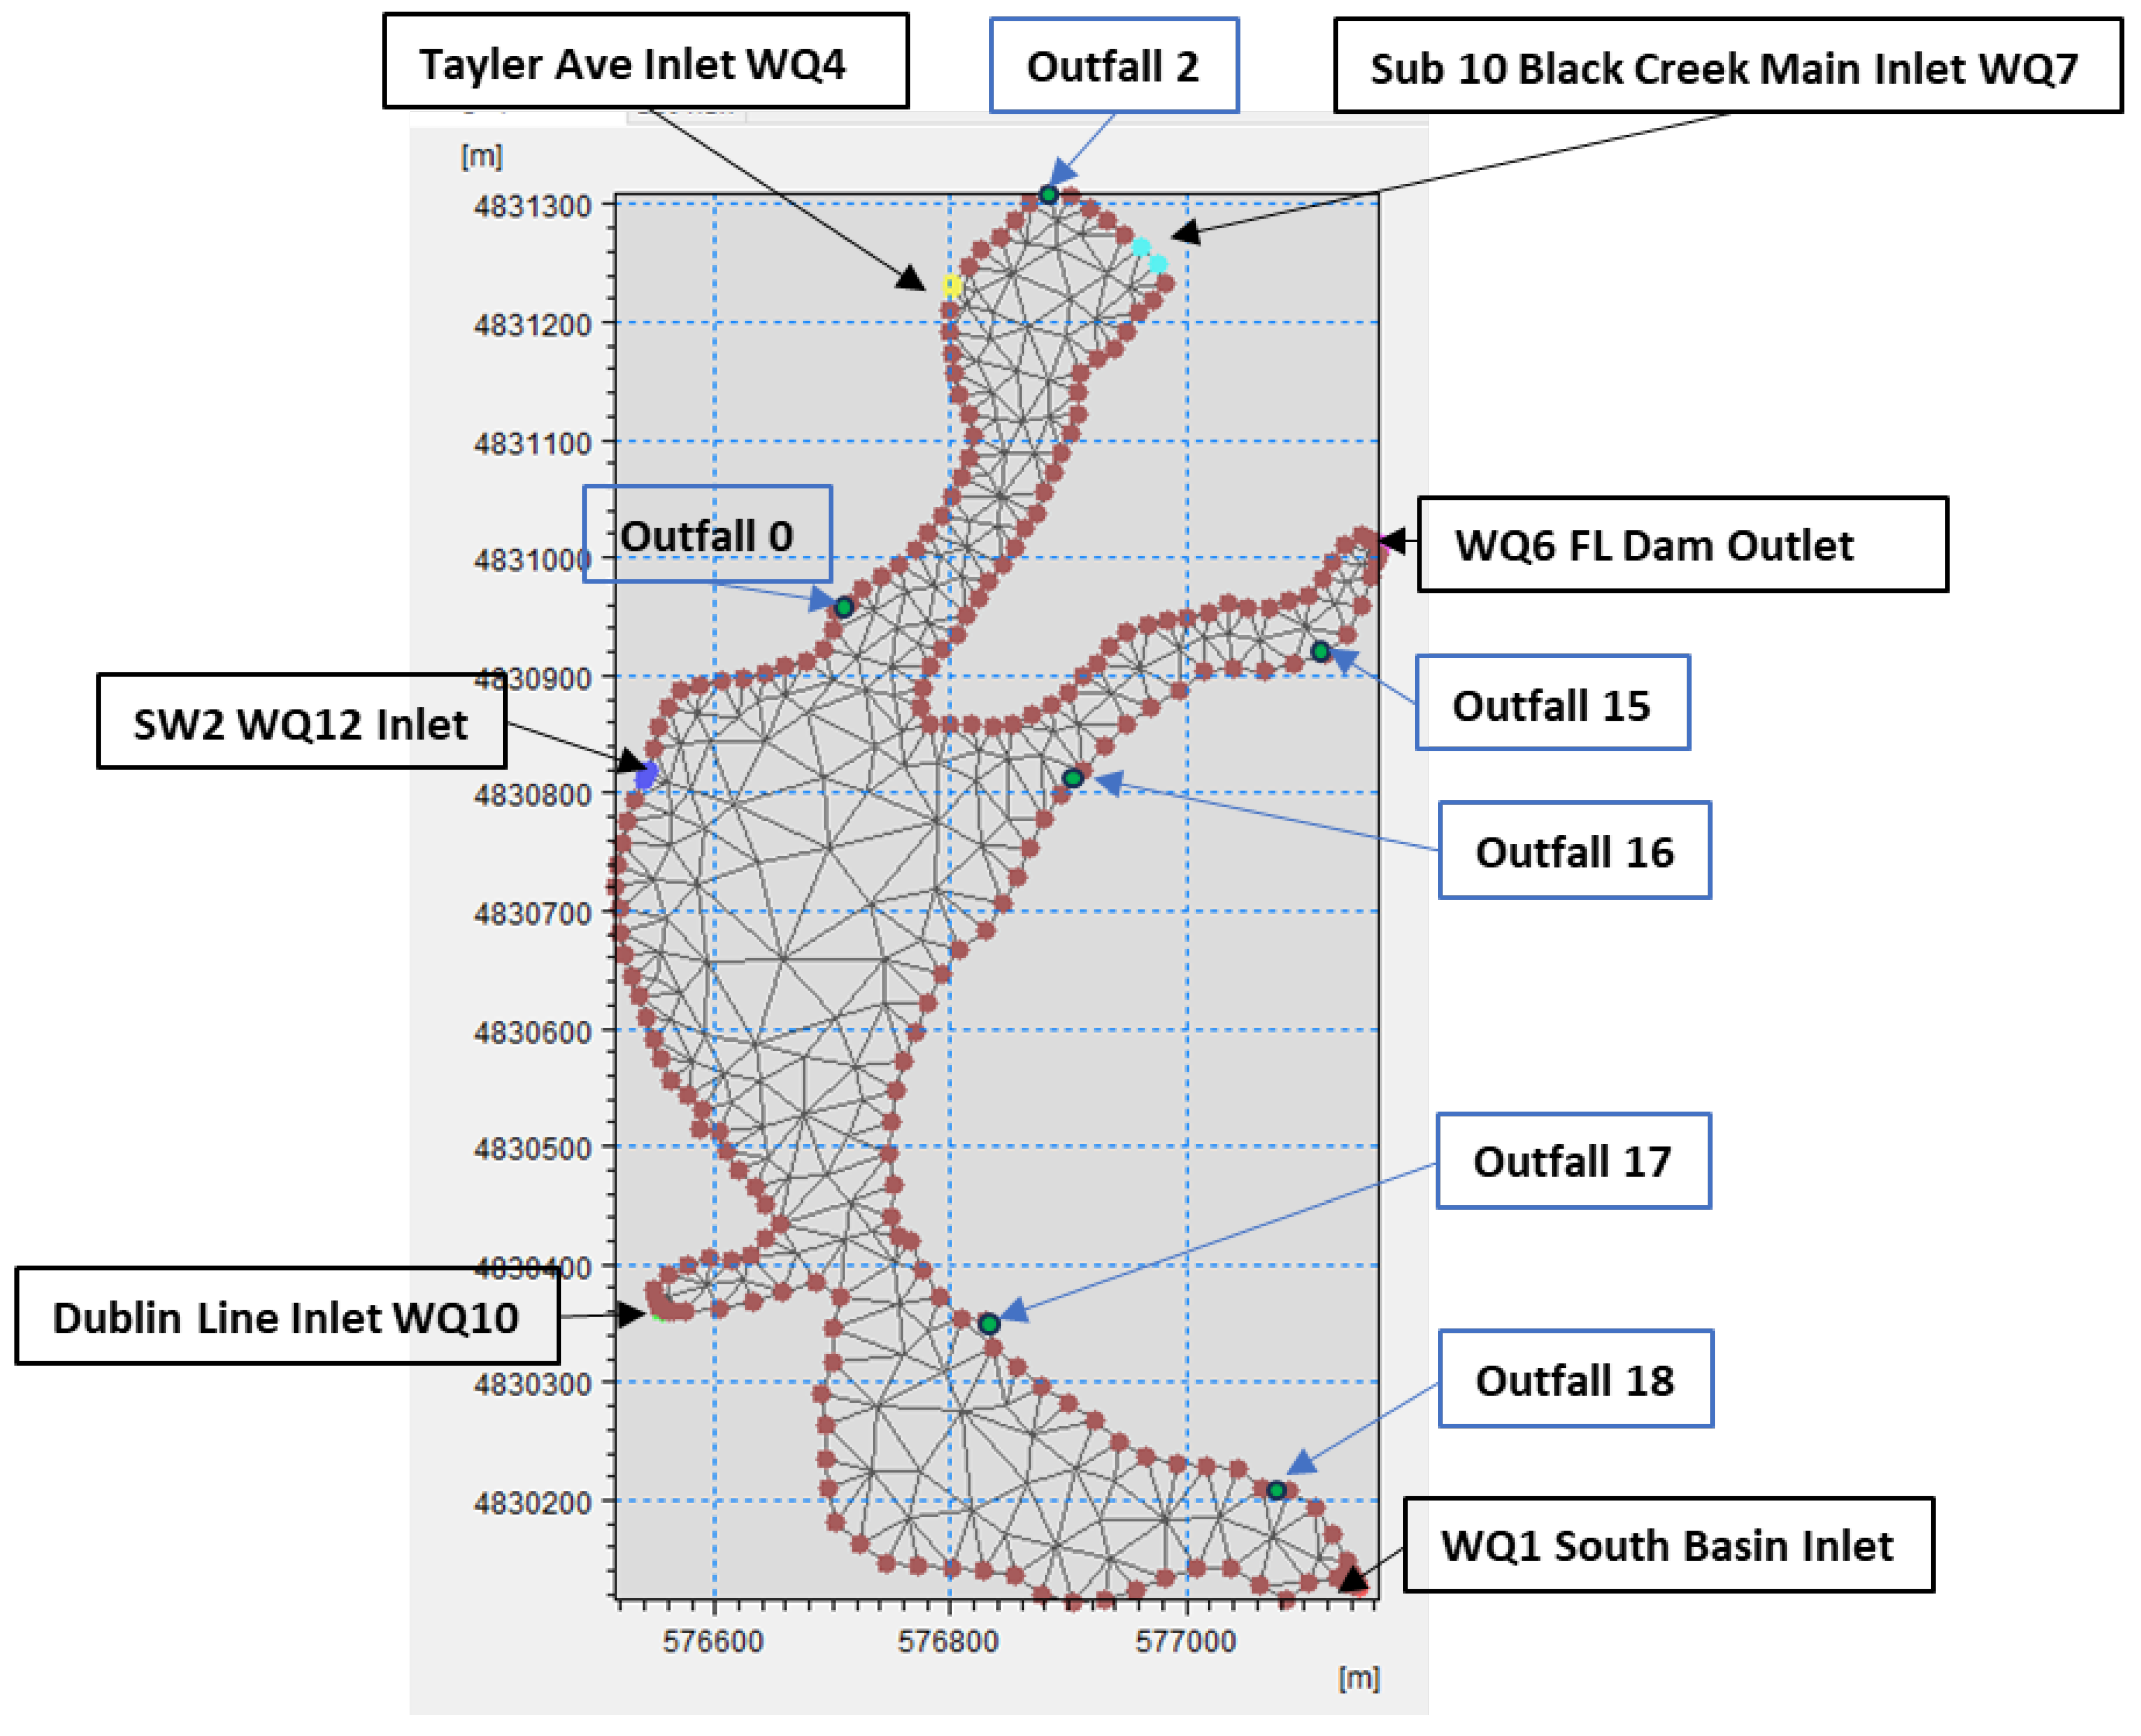
The model boundaries (as shown in Figure 3) are Sub-10 Black Creek Main Inlet WQ7, Tayler Ave Inlet WQ4, SW 2 WQ12 inlet, Dublin Line WQ10 Inlet, South Basin WQ1Inlet, and FL Dam WQ6 outlet.
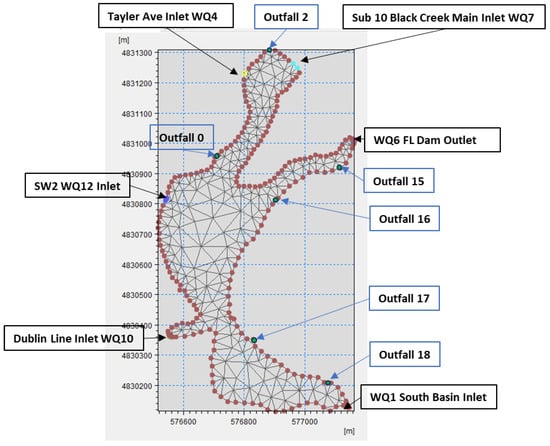
Figure 3.
Fairy Lake Model boundaries and outfalls.
In Figure 3 of Fairy Lake, all the outfalls are added as sources in the model. The outflow time series from the Fairy Lake Catchment model is used in the model for both boundary conditions and the outfalls. No structure exists in the model domain. The flow time series of these outfalls is input in the Fairy Lake model as sources and was provided by the output of the Fairy Lake catchment model. The outlet of Fairy Lake (shown as the WQ6 FL Dam outlet in Figure 3) has a rating curve that was developed in 2016 [48]. The rating curve was adjusted based on the zero level of the Bathymetry conducted in 2022. The minimum and maximum time steps used in the Model are 0.01 and 3600 s after the calibration. However, a 3600-second time step is used to create output. The parameters used for the HD Model Setup are presented in Supplementary Table S1.
- (d)
- Temperature/Salinity Module Setup
For time integration and space discretization, a high-order solution technique was used. For horizontal dispersion, a scaled eddy viscosity formulation with a constant value of 1 × 10−05 was used. A scaled eddy viscosity formulation with a constant value of 1 × 10⁻¹⁰ was used for vertical dispersion. The details of the model setup are presented in Supplementary Text S2.
- (e)
- Boundary Conditions and Sources for Temperature/Salinity Module
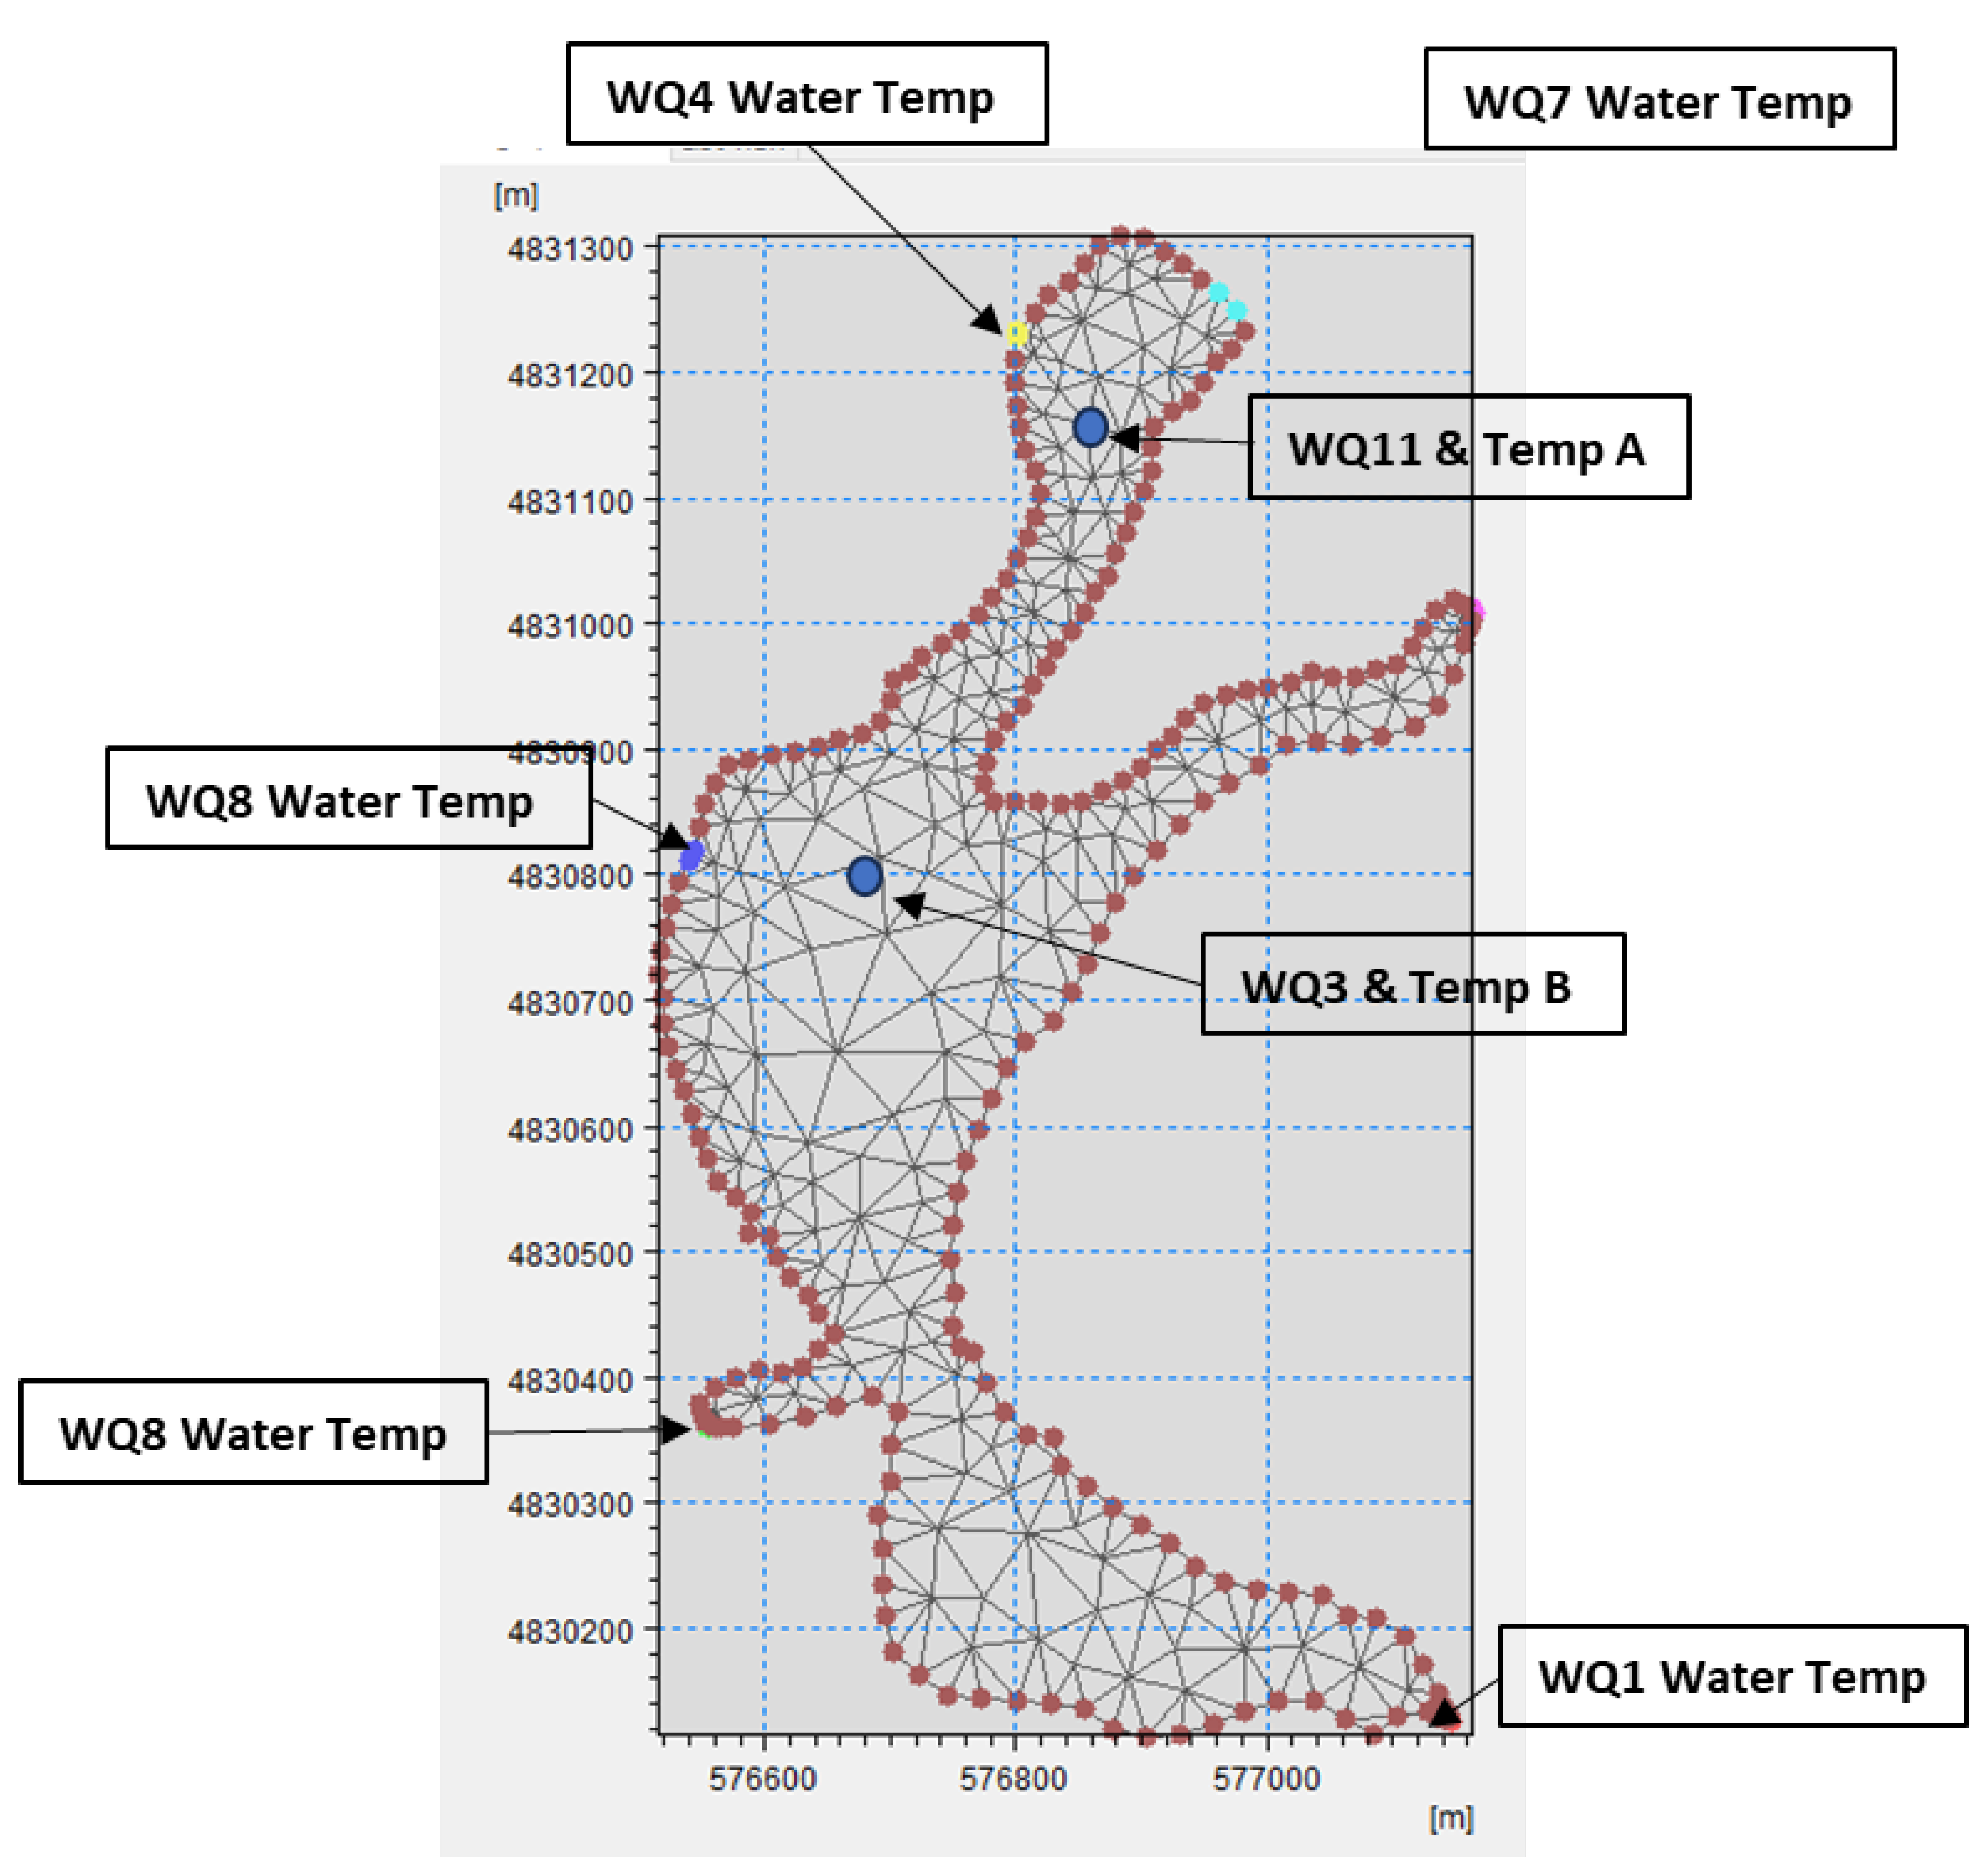
Water temperature is measured at four creek inputs to Fairy Lake as WQ1, WQ4, WQ7, and WQ8, as shown in Figure 4. These water temperature series are used in modeling. No water temperatures are available at the SW2-WQ12 inlet, so the temperature from the WQ8 water temperature series is assumed at this location. At the outlet boundary, a zero gradient is used.

Figure 4.
For Outfall 0 and Outfall 2, the WQ8 water temperature series is used, and for Outfall 15, Outfall 16, Outfall 17, and Outfall 18, the WQ1 water temperature series is used.
- (f)
- Turbulence Module Set Up
A low-order, fast algorithm is applied for time integration and space discretization. Various parameters used for the Turbulence module setup are provided in Supplementary Text S3 and Supplementary Table S3.
4.3. Modeling Results
The developed Fairy Lake model was run from 22 April to 22 October 2022. The start time was matched with the time when bathymetry was conducted. It is assumed that the ‘cold’ run (a term used by MIKE-3 to denote a period for the model to stabilize the temperature) finishes on 19 May 2022, when the two mooring stations started measuring the lake elevations and water temperature at various depths. This was conducted as the Lake Elevation and Temperature data were available from 19 May to 22 October 2022.
- (a)
- Hydrodynamic Model Calibration
The model is calibrated against measured water level data at two monitoring locations (TMA and TMB) in Fairy Lake, as shown in Figure 5. The cold start of the model was assumed from 22 April to 19 May 2022, with calibration from 19 May to 22 October 2022. The simulated water level versus the observed water levels from TMA and TMB at the surface and at 5 m depth.
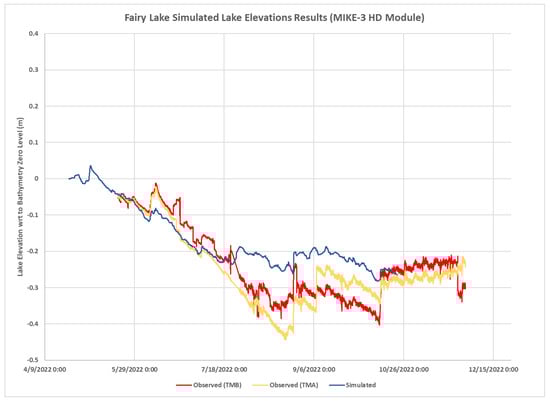
Figure 5.
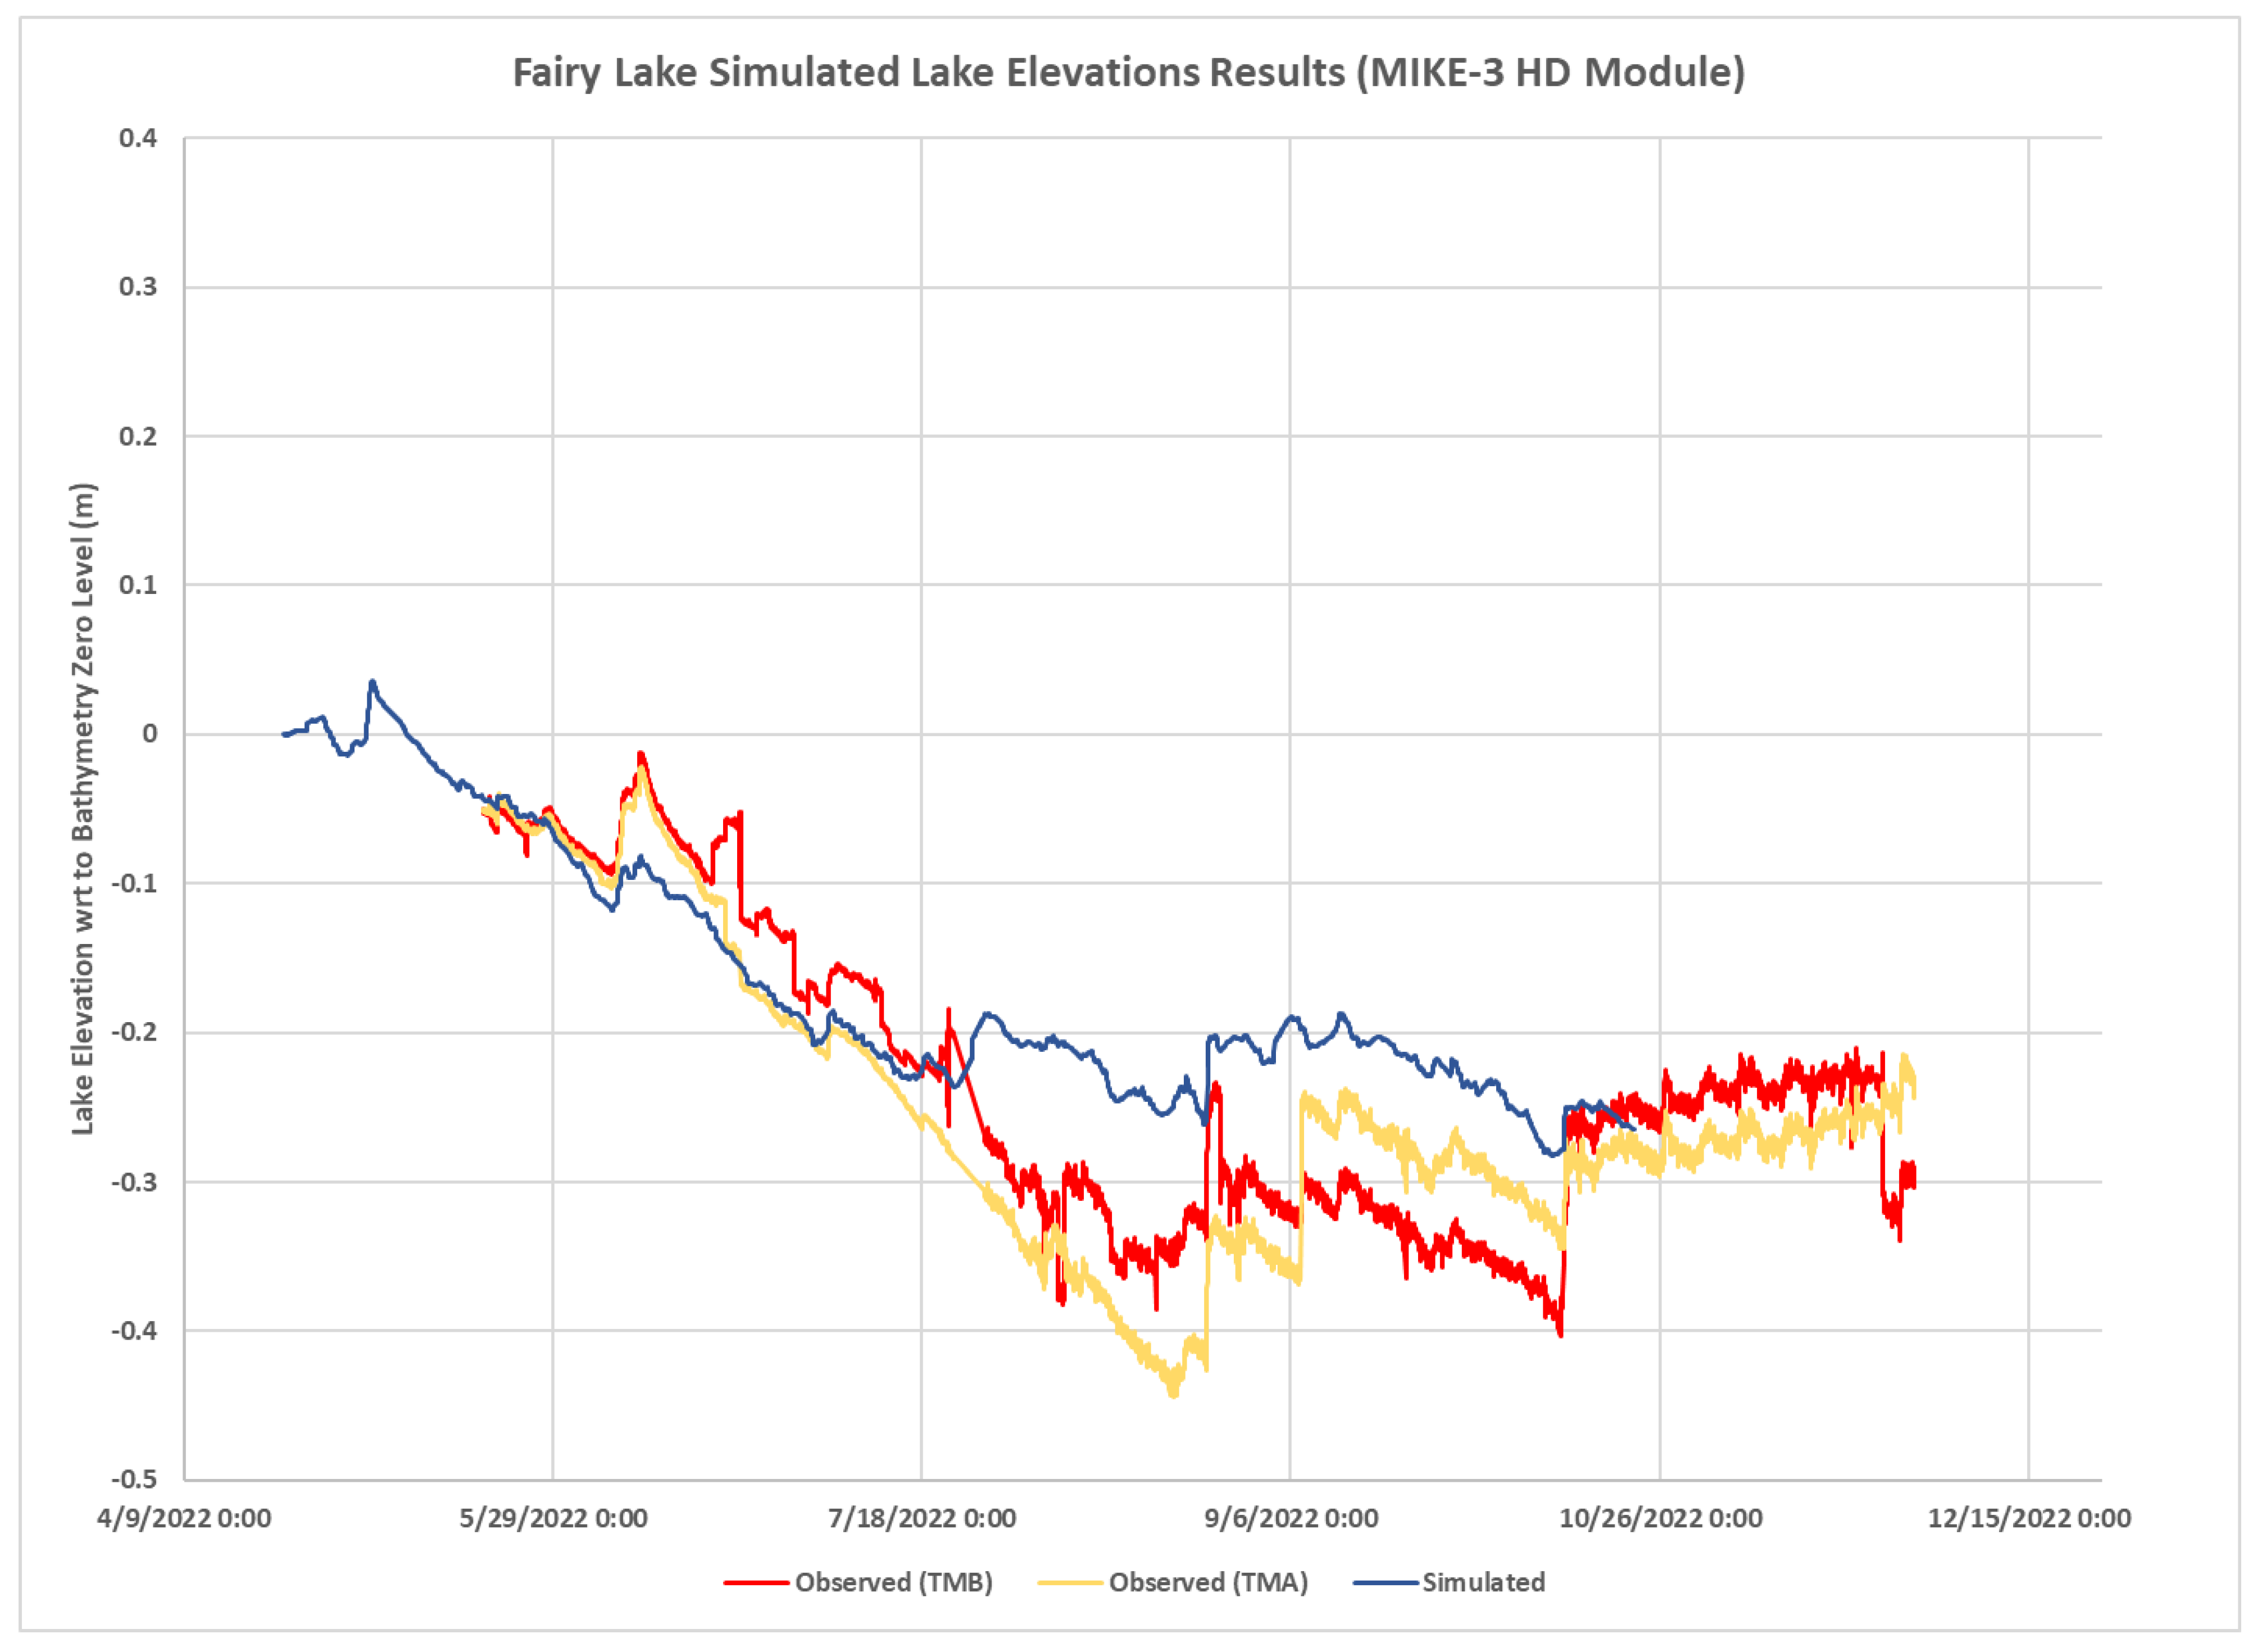
Fairy Lake observed and simulated elevations.
The results are shown in Figure 5, where simulated Lake levels are plotted against the observed lake levels.
The simulated results of Fairy Lake matched well with the observed data from 19 May to 20 July 2022, but from that point to 10 October 2022, there were deviations of ~0.1 m until 26 October 2022, when the simulated values again matched the observed data. The MIKE-3 Fairy Lake HD model was calibrated and validated using the following statistical parameters: Average Standard Deviation, Correlation Coefficient (R2), and Nash Sutcliffe Correlation Coefficient (NSE). Correlation Coefficients ranged between 0.75 and 0.77, and NSE ranged between 0.4 and 0.5, which demonstrates that the model is reasonably calibrated. The statistics of the simulated lake levels are summarized in Table 1.

Table 1.
Fairy Lake Hydrodynamic Model Calibration Results Run.
- (b)
- Calibration of the Temperature module
Simulated water temperatures at two monitoring locations, WQ-11 and WQ-3, at both surface and deep levels, are shown in Figure 6 and Figure 7.

Figure 6.
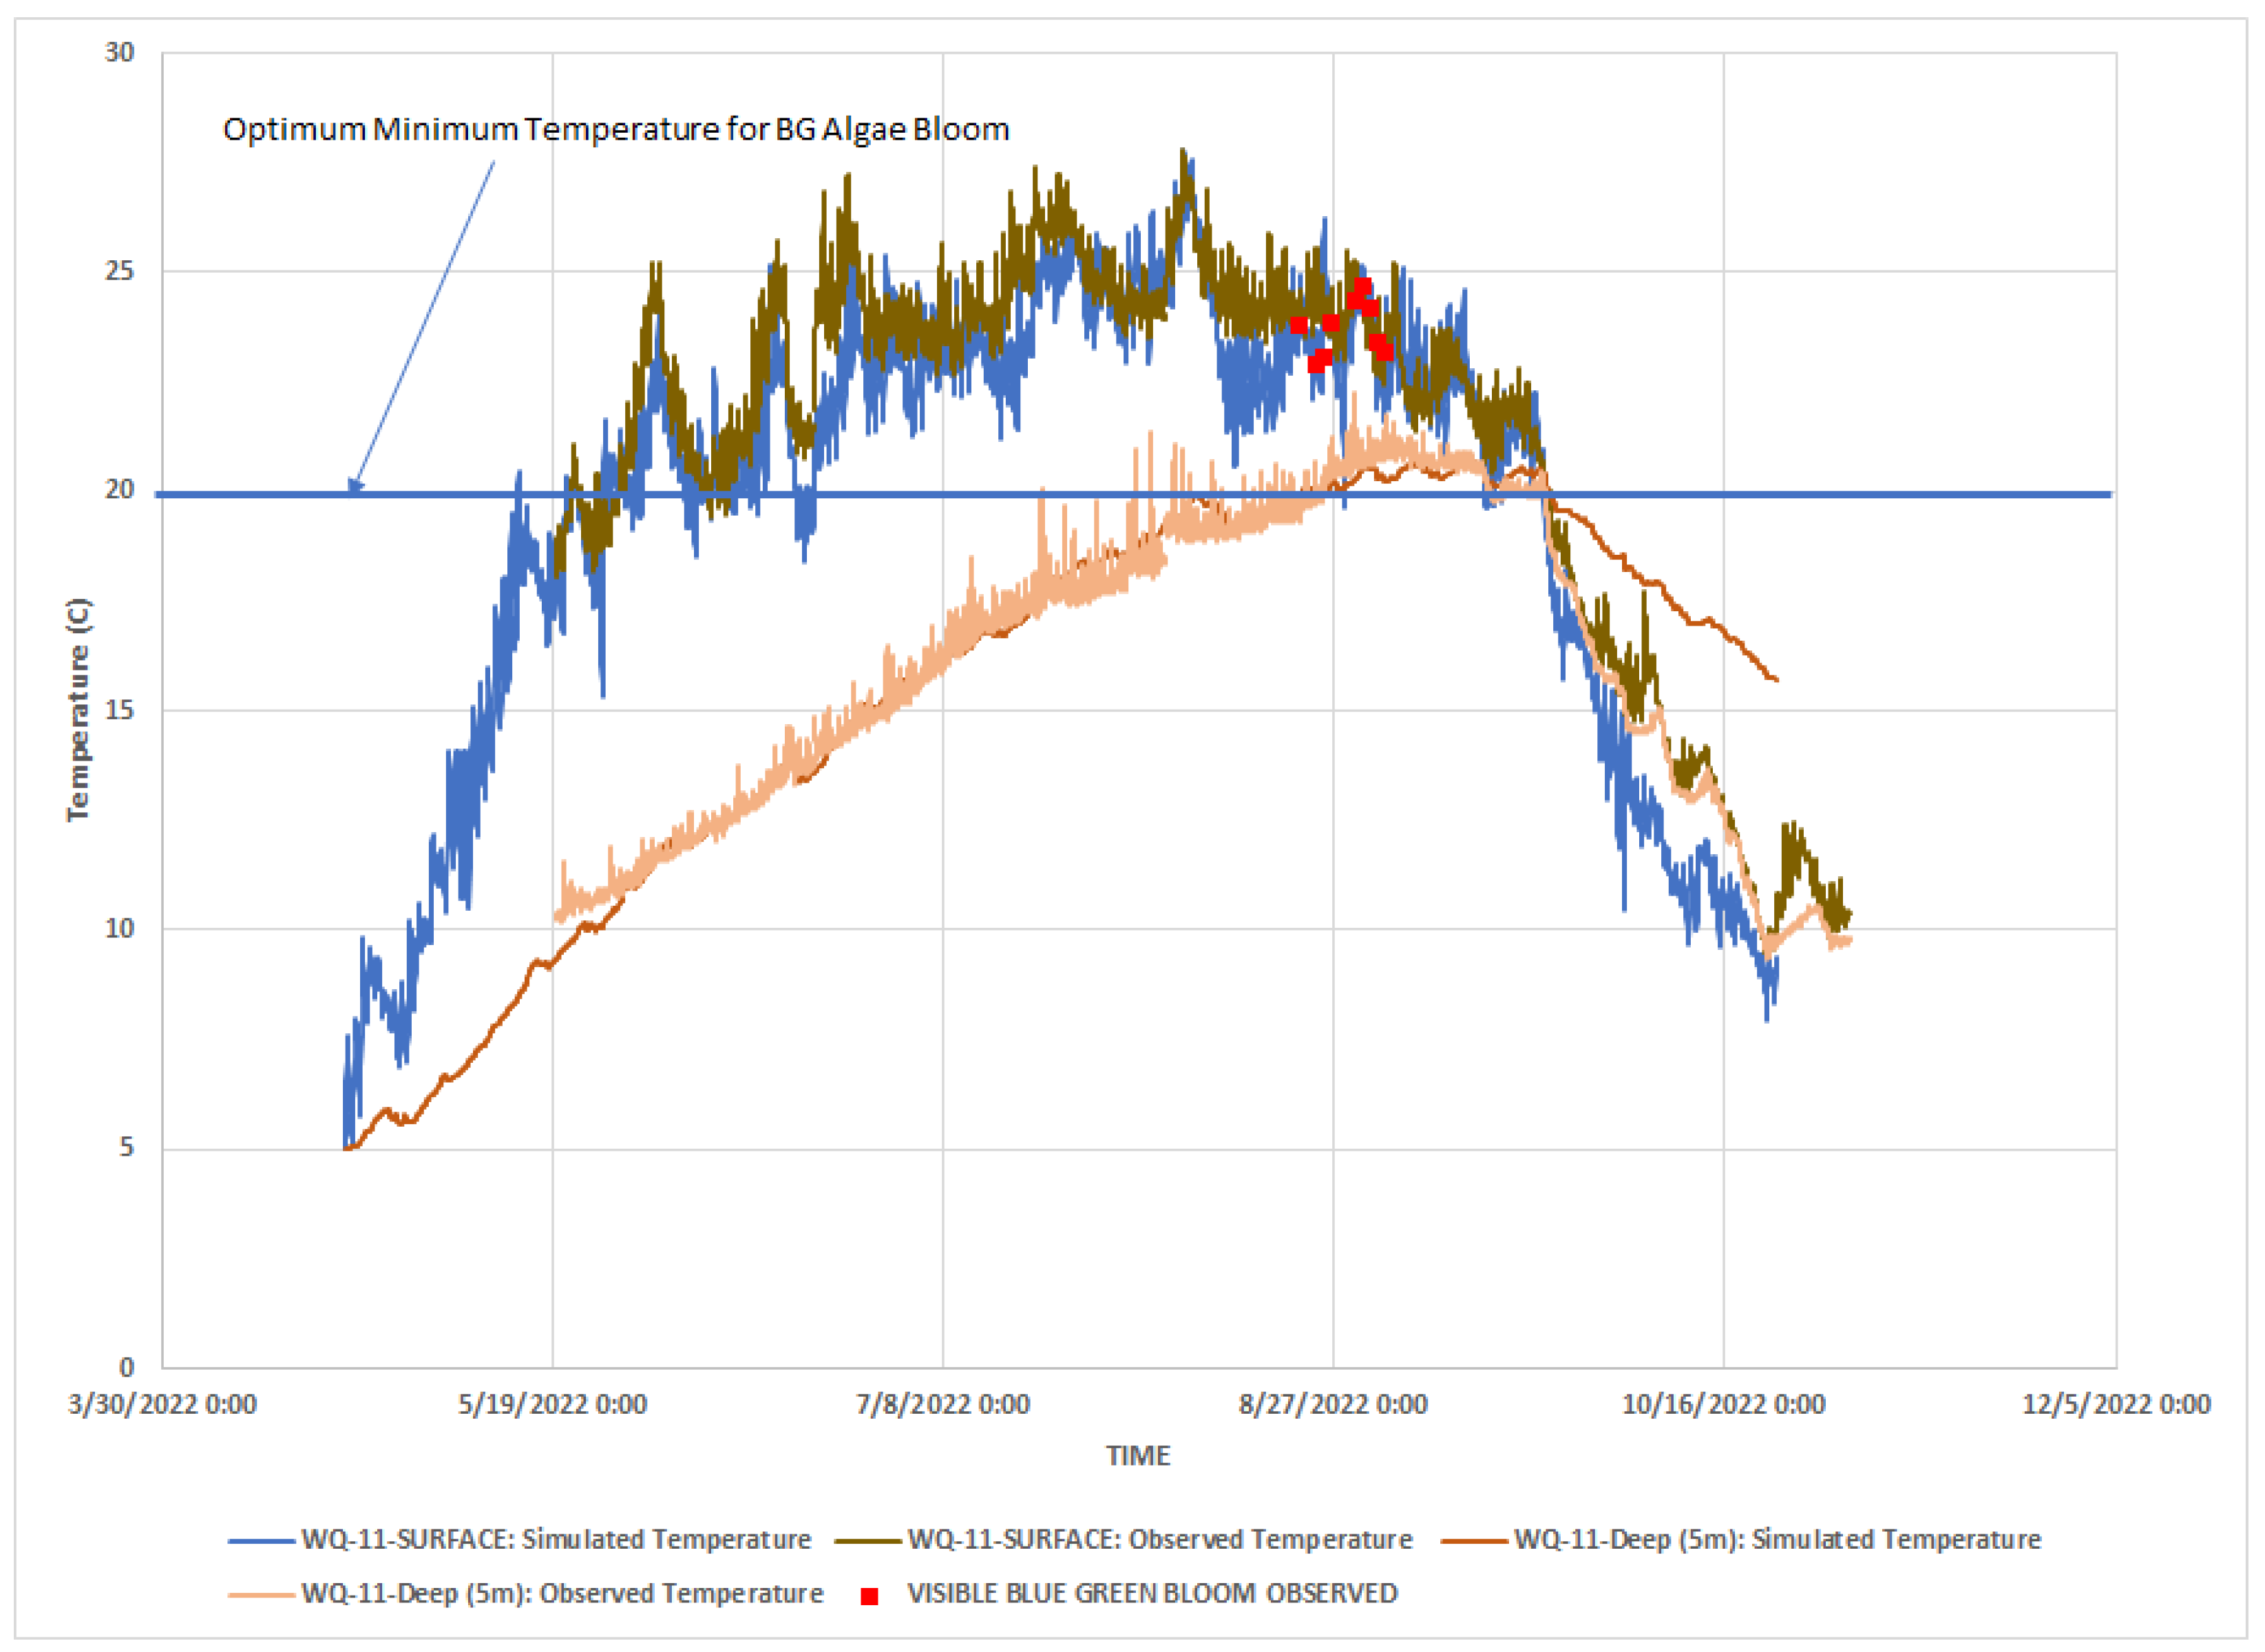
Fairy Lake observed and simulated temperatures at WQ11.
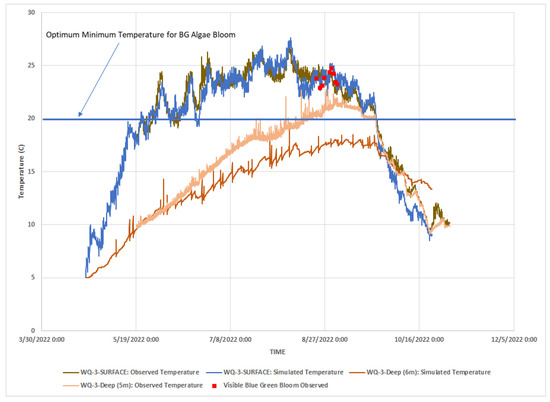
Figure 7.
Fairy Lake observed and simulated temperatures at WQ3.
The simulated Fairy Lake water temperature for both the surface and deep levels for WQ-11 (as shown in Figure 6) shows good calibration. For the other monitoring location, which is at the center of the lake (WQ3), the simulated temperatures match the surface, but there are variations at the deep location. Figure 6 also shows when the Blue-Green Algae bloom was observed in Fairy Lake. Note that before the Blue-Green Algae bloom, observed water temperatures (above 20 °C) were present for more than 1744 h (72 days).
- (c)
- Statistics of simulated water temperatures
The MIKE-3 Fairy Lake HD model Temperature Module was calibrated and validated using the following statistical parameters: Average Standard Deviation, Correlation Coefficient (R2), and Nash Sutcliffe Correlation Coefficient (NSE).
Water temperature is monitored at both the locations of WQ-11 and WQ-3 for depths of zero, 1, 2, 3, 4, 5, and the bottom (herein called deep). The calibration statistics of simulated water temperature for both monitoring locations are provided in Table 2 and Table 3.
Table 2.
Calibration Statistics of Hourly Water Temperature at WQ-11.
Table 3.
Calibration Statistics of Hourly Water Temperature at WQ-3.
The Correlation Coefficient (R2) ranged between 0.7 and 0.98, while the Nash–Sutcliffe Correlation Coefficient (NSE) ranged between 0.51 to 0.98, which is very good.
The Correlation Coefficient (R2) ranges between 0.7 and 0.97, and the Nash–Sutcliffe Correlation Coefficient (NSE) ranges between 0.42 and 0.96, which is very good. Overall, and as described in more detail in the Supplemental Material, the simulated results of the HD model for both water levels and temperature predictions mimic observed data. Therefore, of interest is the assessment of the impact of climate change on the temperatures of shallow water bodies such as Fairy Lake.
5. Climate Change Impact Assessment on Fairy Lake
5.1. Introduction
With widespread, ongoing urbanization and as climate change continues, the importance of protecting the water quality of streams and lakes is intensifying. However, while many water quality constituents in lakes and rivers are of overall interest, water temperature is a ‘key’ variable, as temperature influences mixing within a waterbody, influences the acceptability of habitat for flora and fauna, and serves as a guide to the general health of a stream and waterbodies [49]. Figure 7 shows that observation of Cyanobacterial growth occurred when the surface water temperatures exceeded and remained above 20 °C.
The optimal temperature ranges for Cyanobacterial growth and the occurrence of blooms are typically between 20 °C to 30 °C (68 °F to 86 °F) [50,51,52]. A minimal optimal temperature of 20 °C for Cyanobacterial growth and the occurrence of blooms is selected for this analysis based on a review of the literature. For the duration of the ‘Base’ model run (22 April to 22 October 2022), the precipitation and air temperature time series were updated using the future climate change (updated to RCP 4.5 scenario) for 2050 as reported by the Region of Peel [53], which provided seasonal mean temperature changes in °C and seasonal mean increases in precipitation. Moreover, the water temperatures of various incoming creeks (herein called inlets and outfalls) were monitored for the said period. As assessed by McBean et al. (2022) [49], the climate change impacts for a typical dry year indicate that the stream water temperature increased 9% of the time between 1 °C and 2 °C and 2% of the time between 2 °C and 3 °C at distances of 17,000 m downstream with RCP 4.5 Scenario in 2050 in a nearby watershed. Therefore, the incoming water temperature series in the present case were not updated for the modeling period as the output of the catchment model is not available. The temperature, precipitation, and incoming water temperature time series of the base run are assumed to be a typical year for climate change conditions.
The Fairy Lake MIKE-3 model was run for the base period and for the RCP 4.5 scenario for 2050. Lake water temperature was monitored at two monitoring locations, WQ-11 (where Cyanobacteria was visually observed on 22, 24, 25, 26, 29, 30, and 31 August 2022). Cyanobacteria were also observed on 1 and 2 September 2023. The temperatures of the surface water of the Lake were above 20 °C during this period for more than 1744 h.
Therefore, based on the existing condition model run (2022) and the climate change RCP 4.5 scenario, an analysis was conducted to assess the number of hours the Lake temperature is within various ranges and the increase in the number of hours expected to be within those ranges with the climate change RCP 4.5 scenario.
5.2. Number of Hours Temperature Increased or Decreased in Various Temperature Ranges
Table 4 provides summarized information about the surface temperature, frequency, and the number of hours the temperature can be expected to increase or decrease with a specific climate change scenario (RCP 4.5) at monitoring location WQ-11 compared to a base scenario. The results show that the climate change RCP 4.5 scenario will increase by 274 more hours (over six months) when surface water temperature is above 20 °C. For the rest of the temperature ranges, the table is self-explanatory.
Table 4.
Number of Hours Temperature Increased or Decreased with RCP4.5 at the Surface and Various Depths in WQ-11.
Monitoring location WQ-3 is situated in the central basin of Fairy Lake, and the temperature profiles vary across various ranges (Table 5). The table shows that under the climate change RCP 4.5 scenario, the water temperature will increase by 233 more hours when the surface water temperature is above 20 °C (above the minimum optimum temperature for Cyanobacterial bloom). However, the number of hours will decrease in other temperature ranges (Table 5). This decrease in temperature in lower layers suggests that with climate change, there will be greater vertical stratification, which demonstrates a greater likelihood for Cyanobacteria to regulate their buoyancy [51].
Table 5.
Number of Hours Temperature Increased or Decreased with RCP4.5 at the Surface and Various Depths in WQ-3.
5.3. Increase in Duration of Water Temperature above Minimal Optimum Temperature for Cyanobacterial Growth
The duration of the Minimal Optimum Temperature for Cyanobacterial Growth is an important parameter to consider [49]. Table 6 provides a depth-wise breakdown of the increase in the duration of water temperatures above 20 °C at different depths in location WQ-11 in the northern basin under the RCP 4.5 scenario. This provides an indication regarding the duration the water temperature remains above a certain threshold at various depths. Note that WQ-11 is situated on the northern side of Fairy Lake, where Cyanobacterial bloom has been visibly observed. The results indicate increases in water temperature at the surface for an additional 647 h, i.e., from 1628 hours in the base scenario to 2275 h in the RCP 4.5 scenario, representing an increase of 39.7%. It is noteworthy that, as shown in Figure 6, Cyanobacterial blooms were observed in 2022, and this increase with climate change may have a noticeable impact on the northern basin.
Table 6.
Increase in Duration of Water Temperature Above 20 °C in WQ-11 with RCP 4.5 Scenario.
Table 7 provides a depth-wise breakdown of the increase in the duration of water temperatures above 20 °C at different depths in location WQ-3 in the central basin under the RCP 4.5 scenario. This indicates the increased duration of the water temperature above a specific threshold at various depths, indicating that at the surface, the percentage increase is 39.7% due to climate change, resulting in enhanced outbreaks of Cyanobacteria blooms. Note that WQ-3 is in the central basin; hence, this constant increase in water temperature for an additional 221 h at the surface, i.e., from 2060 h in the base scenario to 2281 h in the RCP 4.5 Scenario, represents a 10.7 % increase in the duration of Cyanobacteria blooms.
Table 7.
Increase in Duration of Water Temperature Above 20 °C in WQ-3 with RCP 4.5 Scenario.
6. Conclusions
The fundamental basis for predicting Cyanobacteria growth scenarios lies in understanding temperature responses under climate change conditions, governed in large part by the temperature serving as a key parameter. This critical factor, the duration of minimal optimum temperature for Cyanobacterial growth, is essential for evaluating the potential expansion of Cyanobacteria populations. Unfortunately, such growth often leads to harmful algal blooms, posing serious threats to aquatic ecosystems and water quality, and potentially endangering human and animal health through the production of toxins.
Overall, the MIKE-3 model, in combination with Hydrodynamic, Temperature, and Turbulence modules, was utilized using field studies to accurately calibrate the abovenamed model during 2022 conditions over time for various elevations in a shallow urban lake for existing conditions. Using the calibrated MIKE-3 modeling with its hydrodynamic, Temperature, and Turbulent modules, water temperature conditions were estimated both spatially and temporally for 2050 under RCP 4.5 conditions. In the central basin, increases in water temperature at the surface in RCP 4.5 scenario conditions above 20 °C are projected to increase from 2060 h to 2281 h (involving an additional 221 h of increased temperatures at the surface. This situation indicates there will be a 10.7% increase in the duration of Cyanobacteria blooms in the central area of Fairy Lake. Similarly, in the northern area of Fairy Lake, the MIKE-3 model results indicate that surface water temperature will increase from 1628 h to 2275 h in duration, involving 647 h of additional duration of increased temperatures at the surface in RCP 4.5 scenario conditions when surface water temperatures are above 20 °C, the minimum optimum temperature for Cyanobacterial blooms. This situation indicates there will be a 39.7% increase in the duration of Cyanobacteria blooms in the northern portion of Fairy Lake.
These modeling conditions indicate there will be significantly more habitat amenable to Cyanobacteria growth during periods when surface water temperatures are above 20 °C.
The results show that the global rise in temperatures due to climate change will have important implications—longer durations and deeper depths of water reaching temperatures that will exacerbate the distribution and abundance of blue-green algae due to the increase in the number of hours when the temperature exists for the enhancement of blue-green algae blooms. These changes in temperature patterns must be expected to contribute to the expansion of habitats for these Cyanobacteria affecting water bodies.
Supplementary Materials
The following supporting information can be downloaded at https://www.mdpi.com/article/10.3390/w16040587/s1.
Author Contributions
E.M.—Formal analysis, Funding acquisition, Supervision, Project administration, and Writing—review and editing; A.S.—Conceptualization, Methodology, Funding acquisition, Supervision, Project administration, Writing—review and editing; M.B.—Model development, Data curation, Calibration, Formal analysis, and Writing—review and editing; S.V.—Data Curation, Software, and Formal analysis; A.F.—Data Collection, Investigation, and Data Curation; J.S. Data Collection, Investigation, and Data Curation; L.M.—Data Curation, Investigation, and Resources. All authors have read and agreed to the published version of the manuscript.
Funding
This work was supported by the Natural Sciences and Engineering Research Council of Canada (NSERC) ALLRP #549242-19. DHI provided access to the MIKE-3 model, and MIKE Zero and Temperature Module were made available from DHI. Regional Municipality of Halton, Town of Halton Hills, and Credit Valley Conservation provided guidance and necessary data.
Data Availability Statement
The data presented in this study are available on request from the corresponding author. The data are not publicly available due to privacy concern.
Conflicts of Interest
Authors Amanjot Singh, Alex Fitzgerald, Jan Siwierski and Lorna Murison were employed by the company Credit Valley Conservation. The remaining authors declare that the research was conducted in the absence of any commercial or financial relationships that could be construed as a potential conflict of interest.
References
- Kaloudis, T.; Hiskia, A.; Triantis, T.M. Cyanotoxins in Bloom: Ever-Increasing Occurrence and Global Distribution of Freshwater Cyanotoxins from Planktic and Benthic Cyanobacteria. Toxins 2022, 14, 264. [Google Scholar] [CrossRef] [PubMed]
- Health Canada. Guidelines for Recreational Water Quality Guideline Technical Document Cyanobacteria and Their Toxins; Health Canada: Ottawa, ON, Canada, 2022. [Google Scholar]
- Chorus, I. Cyanobacterial Toxin Research and Its Application in Germany: A Review of the Current Status. Environ. Toxicol. 2002, 17, 358–360. [Google Scholar] [CrossRef] [PubMed]
- Erratt, K.J.; Creed, I.F.; Trick, C.G. Harmonizing science and management options to reduce risks of Cyanobacteria. Harmful Algae 2022, 116, 102264. [Google Scholar] [CrossRef] [PubMed]
- Mitrovic, S.M.; Kobayashi, T.; Roelke, D.L. Cyanobacteria in inland waters: New monitoring, reporting, modelling and ecological research. Mar. Freshw. Res. 2020, 71, i–iv. [Google Scholar] [CrossRef]
- Schmale, D.G., III; Ault, A.P.; Saad, W.; Scott, D.T.; Westrick, J.A. Perspectives on Harmful Algal Blooms (HABs) and the Cyberbiosecurity of Freshwater Systems. Front. Bioeng. Biotechnol. 2019, 7, 128. [Google Scholar] [CrossRef] [PubMed]
- Health Canada. Guidelines for Canadian Drinking Water Quality: Guideline Technical Document—Cyanobacterial Toxins; Catalogue No H144-38/2017EPDF; Water and Air Quality Bureau, Healthy Environments and Consumer Safety Branch, Health Canada: Ottawa, ON, Canada, 2017. [Google Scholar]
- Abbot, M. Resource guide for public health response to harmful algal blooms in Florida: Based on recommendations of the Florida Harmful Algal Bloom Task Force Public Health Technical Panel. In B.C. Drinking Water and Recreational Water; 9 British Columbia, 2018, Decision Protocols for Cyanobacterial Toxins; Health Protection Branch: Victoria, BC, Canada, 2009. [Google Scholar]
- Chen, Q.; Rui, H.; Li, W.; Zhang, Y. Analysis of algal bloom risk with uncertainties in lakes by integrating self-organizing map and fuzzy information theory. Sci. Total Environ. 2014, 482–483, 318–324. [Google Scholar] [CrossRef]
- Uduma, U.A.; McBean, E.A.; Gharabaghi, B. Risk assessment of cyanobacteria-toxins for small drinking water treatment plants with lake water intakes. Int. J. Water Resour. Environ. Eng. 2017, 9, 121–126. [Google Scholar] [CrossRef]
- Dupont, A.; Botrel, M.; St-Gelais, N.F.; Timothée Poisot, T.; Maranger, R. A social–ecological geography of southern Canadian lakes. bioRxiv 2023. [Google Scholar] [CrossRef]
- Council of Canadians. Concerns about Blue-Green Algae on the Rise. Available online: https://canadians.org/analysis/concerns-about-blue-green-algae-rise (accessed on 4 January 2024).
- Favot, E.J.; Holeton, C.; DeSellas, A.M.; Paterson, A.M. Cyanobacterial blooms in Ontario, Canada: Continued increase in reports through the 21st century. Lake Reserv. Manag. 2023, 39, 1–20. [Google Scholar] [CrossRef]
- Nieto, P.J.G.; García-Gonzalo, E.; Lasheras, F.S.; Fernández, J.R.A.; Muñiz, C.M.; Juez, F.J.C. Cyanotoxin level prediction in a reservoir using gradient boosted regression trees: A case study. Environ. Sci. Pollut. Res. 2018, 25, 22658–22671. [Google Scholar] [CrossRef]
- Sorlini, S.; Gialdini, F.; Collivignarelli, C. Removal of Cyanobacterial cells and Microcystin-LR from drinking water using a hollow fiber microfiltration pilot plant. Desalination 2013, 309, 106–112. [Google Scholar] [CrossRef]
- Isenstein, E.M.; Kim, D.; Park, M.-H. Modeling for multi-temporal Cyanobacterial bloom dominance and distributions using landsat imagery. Ecol. Inform. 2020, 59, 101119. [Google Scholar] [CrossRef]
- Beal, M.R.W.; O’Reilly, B.; Hietpas, K.R.; Block, P. Development of a sub-seasonal Cyanobacteria prediction model by leveraging local and global scale predictors. Harmful Algae 2021, 108, 102100. [Google Scholar] [CrossRef] [PubMed]
- Miller, T.R.; Beversdorf, L.J.; Weirich, C.A.; Bartlett, S.L. 201, Cyanobacterial Toxins of the Laurentian Great Lakes, Their Toxicological Effects, and Numerical Limits in Drinking Water. Mar. Drugs 2017, 15, 160. [Google Scholar] [CrossRef] [PubMed]
- Orihel, D.M.; Bird, D.F.; Brylinsky, M.; Chen, H.; Donald, D.B.; Huang, D.Y.; Giani, A.; Kinniburgh, D.; Kling, H.; Kotak, B.G.; et al. High microcystin concentrations occur only at low nitrogen-to-phosphorus ratios in nutrient-rich Canadian lakes. Can. J. Fish. Aquat. Sci. 2012, 69, 1457–1462. [Google Scholar] [CrossRef]
- WHO. Cyanobacterial Toxins: Microcystin-LR in Drinking-Water, Background Document for Development of WHO Guidelines for Drinking-Water Quality; World Health Organization: Geneva, Switzerland, 2003. [Google Scholar]
- Mellios, N.; Papadimitriou, T.; Laspidou, C. Predictive modeling of microcystin concentrations in a hypertrophic lake by means of Adaptive Neuro Fuzzy Inference System (ANFIS). Eur. Water 2016, 55, 91–103. [Google Scholar]
- Reinl, K.L.; Brookes, J.D.; Carey, C.C.; Harris, T.D.; Ibelings, B.W.; Morales-Williams, A.M.; Domis, L.N.D.S.; Atkins, K.S.; Isles, P.D.F.; Mesman, J.P.; et al. Cyanobacterial blooms in oligotrophic lakes: Shifting the high-nutrient paradigm. Freshw. Biol. 2021, 66, 1846–1859. [Google Scholar] [CrossRef]
- O’Keeffe, J. Cyanobacteria and Drinking Water: Occurrence, Risks, Management and Knowledge Gaps for Public Health; Juliette O’Keeffe National Collaborating Centre for Environmental Health: Vancouver, Canada, 2019. [Google Scholar]
- Neilan, B.A.; Pearson, L.A.; Muenchhoff, J.; Moffitt, M.C.; Dittmann, E. Mini review Environmental conditions that influence toxin biosynthesis in Cyanobacteria. Environ. Microbiol. 2013, 15, 1239–1253. [Google Scholar] [CrossRef] [PubMed]
- Woolway, R.I.; Merchant, C.J.; Van Den Hoek, J.; Azorin-Molina, C.; Nõges, P.; Laas, A.; Mackay, E.B.; Jones, I.D. Northern hemisphere atmospheric stilling accelerates lake thermal responses to a warming world. Geophys. Res Lett. 2019, 46, 11983–11992. [Google Scholar] [CrossRef]
- Jane, S.F.; Hansen, G.J.A.; Kraemer, B.M.; Leavitt, P.R.; Mincer, J.L.; North, R.L.; Pilla, R.M.; Stetler, J.T.; Williamson, C.E.; Woolway, R.I.; et al. Widespread deoxygenation of temperate lakes. Nature 2021, 594, 66–70. [Google Scholar] [CrossRef]
- Pick, F.R. Blooming algae: A Canadian perspective on the rise of toxic Cyanobacteria Can. J. Fish. Aquat. Sci. 2016, 73, 1149–1158. [Google Scholar] [CrossRef]
- Lürling, M.; Mendes e Mello, M.; van Oosterhout, F.; de Senerpont Domis, L.; Marinho, M.M. Response of natural Cyanobacteria and algae assemblages to a nutrient pulse and elevated temperature. Front. Microbiol. 2018, 9, 1851. [Google Scholar] [CrossRef] [PubMed]
- Zhao, C.S.; Shao, N.F.; Yang, S.T.; Ren, H.; Ge, Y.R.; Feng, P.; Dong, B.E.; Zhao, Y. Predicting Cyanobacteria bloom occurrence in lakes and reservoirs before blooms occur. Sci. Total Environ. 2019, 670, 837–848. [Google Scholar] [CrossRef] [PubMed]
- Jiang, P.; Huang, Y.; Liu, X.; Zhang, J.; Gin, K.Y.-H. A feature reconstruction-based multi-task regression model for Cyanobacterial distribution forecasting along the water column. J. Clean. Prod. 2021, 292, 126025. [Google Scholar] [CrossRef]
- Li, H.; Qin, C.; He, W.; Sun, F.; Du, P. Improved predictive performance of Cyanobacterial blooms using a hybrid statistical and deep-learning method, Environ. Res. Lett. 2021, 16, 124045. [Google Scholar] [CrossRef]
- Guimarães, A.; da Silva, P.H.; Carneiro, F.M.; Silva, D.P. Using distribution models to estimate blooms of phytosanitary Cyanobacteria in Brazil. Biota Neotrop. 2020, 20, e20190756. [Google Scholar] [CrossRef]
- Iiames, J.S.; Salls, W.B.; Mehaffey, M.H.; Nash, M.S.; Christensen, J.R.; Schaeffer, B.A. Modeling anthropogenic and environmental influences on freshwater harmful algal bloom development detected by MERIS over the central United States. Water Resour. Res. 2021, 57, e2020WR028946. [Google Scholar] [CrossRef]
- Rousso, B.Z.; Bertone, E.; Stewart, R.; Hamilton, D.P. A systematic literature review of forecasting and predictive models for Cyanobacteria blooms in freshwater lakes. Water Res. 2020, 182, 115959. [Google Scholar] [CrossRef]
- Pyo, J.C.; Park, L.J.; Pachepsky, Y.; Baek, S.-S.; Kim, K.; Cho, K.H. Using convolutional neural network for predicting Cyanobacteria concentrations in river water. Water Res. 2020, 186, 116349. [Google Scholar] [CrossRef]
- Inchio, L.; Zhengchao, X.; Ung, W.K.; Mok, K.M. Integrating Support Vector Regression with Particle Swarm Optimization for Numerical Modeling for Algal Blooms of Freshwater. In Advances in Monitoring and Modelling Algal Blooms in Freshwater Reservoirs: General Principles and a Case Study of Macau; Inchio, L., Boping, H., Weiying, Z., Eds.; Imprint Springer: Dordrecht, The Netherlands, 2017; Chapter 8; ISBN 9789402409338. [Google Scholar]
- Zamani, B.; Koch, M. Comparison Between Two Hydrodynamic Models in Simulating Physical Processes of a Reservoir with Complex Morphology: Maroon Reservoir. Water 2020, 12, 814. [Google Scholar] [CrossRef]
- Burn, D.H.; McBean, E.A. Optimization modeling of water quality in an uncertain environment. Water Resour. Res. 1985, 21, 934–940. [Google Scholar] [CrossRef]
- Manivanan, D.R. Water Quality Modelling for Coastal Engineering Projects—A Review. Oceanogr. Fish. Open Access J. 2017, 3, 113–117. [Google Scholar]
- DHI. MIKE-3 Flow Model FM, Hydrodynamic Module User Guide, MIKE 2022. Available online: https://manuals.mikepoweredbydhi.help/2017/Coast_and_Sea/MIKE_FM_HD_3D.pdf (accessed on 24 March 2023).
- DHI. MIKE-3 Flow Model FM ECO Lab/Oil Spill Module User Guide, MIKE 2022; DHI: Hørsholm, Denmark, 2022. [Google Scholar]
- Regional Municipality of Halton. Prospect Park Well Field Re-Rating and Water Purification, Plant Expansion, Class Environmental Assessment; Environmental Study Report; Region of Halton: Oakville, ON, Canada, 2015. [Google Scholar]
- Town of Halton Hills. 2021, Fairy Lake Water Quality Study Update—Project Charter and Terms of Reference; Report NO.: RP-2021-0003, RP-2021-0003, Town of Halton Hills, 2021; Available online: https://pub-haltonhills.escribemeetings.com/filestream.ashx?DocumentId=9545, (accessed on 24 March 2023).
- Town of Halton Hills. Fairy Lake Water Quality Study, Prepared by: AECOM, Project Number: 107983 Date: December 2009. Available online: https://www.haltonhills.ca/en/explore-and-play/resources/Documents/FairLakeWaterQualityStudy.pdf (accessed on 10 January 2024).
- Town of Halton Hills. Personal communication, 2023.
- Town of Halton Hills, 2020, Fairy Lake Water Quality Study Update—Project Terms of Reference, V1—Feb 2020. Available online: https://pub-haltonhills.escribemeetings.com/filestream.ashx?DocumentId=9548 (accessed on 10 January 2024).
- Regional Municipality of Halton. Fairy Lake Mitigation Strategy: Water Balance Analysis, Final Report; XCG File No.: 3-595-55-01; XCG Consultants Ltd.: Kitchener, ON, Canada; Dance Environmental Inc.: Drumbo, ON, Canada, 2016. [Google Scholar]
- McBean, E.; Bhatti, M.; Singh, A.; Mattern, L.; Murison, L.; Delaney, P. Temperature Modeling, a Key to Assessing Impact on Rivers Due to Urbanization and Climate Change. Water 2022, 14, 1994. [Google Scholar] [CrossRef]
- Berg, M.; Sutula, M. Factors Affecting the Growth of Cyanobacteria with Special Emphasis on the Sacramento-San Joaquin Delta; Southern California Coastal Water Research Project Technical Report 869; The Central Valley Regional Water Quality Control Board and The California Environmental Protection Agency State Water Resources Control Board: Sacramento, CA, USA, 2015. [Google Scholar]
- Hu, L.; Wang, H.; Cui, J.; Zou, W.; Li, J.; Shan, K. Temperature-Dependent Growth Characteristics and Competition of Pseudanabaena and Microcystis. Water 2023, 15, 2404. [Google Scholar] [CrossRef]
- Lurling, M.; Eshetu, F.; Faassen, E.J.; Kosten, S.; Huszar, V.L.M. Comparison of Cyanobacterial and green algal growth rates at different temperatures. Freshw. Biol. 2013, 58, 552–559. [Google Scholar] [CrossRef]
- Health Canada. Guidelines for Canadian Drinking Water Quality: Guideline Technical Document—Cyanobacterial Toxins. 2021. Available online: https://www.canada.ca/en/health-canada/services/publications/healthy-living/guidelines-canadian-drinking-water-quality-guideline-technical-document-Cyanobacterial-toxins-document.html (accessed on 24 March 2023).
- Auld, H.; Switzman, H.; Comer, N.; Eng, S.; Hazen, S.; Milner, G. Region of Peel. Climate Trends and Future Projections in Region of Peel; Technical Report; Ontario Climate Consortium: Toronto, ON, Canada, 2016. [Google Scholar]


Disclaimer/Publisher’s Note: The statements, opinions and data contained in all publications are solely those of the individual author(s) and contributor(s) and not of MDPI and/or the editor(s). MDPI and/or the editor(s) disclaim responsibility for any injury to people or property resulting from any ideas, methods, instructions or products referred to in the content. |
© 2024 by the authors. Licensee MDPI, Basel, Switzerland. This article is an open access article distributed under the terms and conditions of the Creative Commons Attribution (CC BY) license (https://creativecommons.org/licenses/by/4.0/).