Article

Pressure Pulsation Characteristics on the Bulb Body of a Submersible Tubular Pump

1
International Shipping Research Institute, GongQing Institute of Science and Technology, Jiujiang 332020, China
2
School of Shipping and Mechatronic Engineering, Taizhou University, Taizhou 225300, China
3
College of Hydraulic Science and Engineering, Yangzhou University, Yangzhou 225009, China
4
Nanjing Nari Water Resources and Hydropower Technology Company Limited, Nanjing 211106, China
5
Ningbo Jushen Pumps Industry Co., Ltd., Ningbo 315100, China
6
State Key Laboratory of Ecohydraulics in Northwest Arid Region, Xi’an University of Technology, Xi’an 710048, China
7
National Research Center of Pumps, Jiangsu University, Zhenjiang 212013, China
8
School of Aerospace and Mechanical Engineering/Flight College, Changzhou Institute of Technology, Changzhou 213032, China
*
Authors to whom correspondence should be addressed.
Water 2024, 16(5), 789; https://doi.org/10.3390/w16050789
Submission received: 20 January 2024 / Revised: 22 February 2024 / Accepted: 25 February 2024 / Published: 6 March 2024
(This article belongs to the Special Issue Hydraulics and Hydrodynamics in Fluid Machinery)

Abstract

:
Submersible tubular pumps are an ideal choice for pump stations that require high flow rates and low lift. These pumps combine the unique features of submersible motors with axial flow pump technology, making them highly efficient and cost-effective. They have found extensive applications in China’s rapidly developing water conservancy industry. In this research, we focus on investigating the pressure pulsation characteristics of the internal bulb body in a specific pump station project in China. To conduct our analysis, we utilize a model of the submersible tubular pump and strategically position 18 monitoring points. These monitoring points cover various sections, including the impeller inlet and outlet, guide vane outlet, as well as the inlet, middle, and outlet sections of the bulb body segment. To calculate the unsteady flow of the system, we employ numerical simulation techniques. By combining the outcomes of model tests, we determine the pressure pulsation characteristics. The comparison of results reveals a remarkable similarity between the efficiency–head curves obtained from the numerical simulation and the model test. While the model test yields slightly higher head results, the numerical simulation indicates slightly higher efficiency values. This finding lends strong support to the reliability of numerical simulation results, which can provide valuable insights for the design and optimization of submersible tubular pumps. Overall, submersible tubular pumps demonstrate their suitability for pump stations with high flow rates and low lift requirements. The study of pressure pulsation characteristics within the bulb body contributes to a better understanding of their performance and facilitates their further application in the field of water conservancy engineering.

1. Introduction

As the use of axial flow pumps continues to expand, the research in this field has become more profound. The primary research methods currently employed include theoretical analysis, numerical simulation, and model experiments. Theoretical analysis is concerned with fundamental principles and system properties. Numerical simulation utilizes Computational Fluid Dynamics (CFD) technology to address intricate fluid problems beyond the scope of theoretical analysis and model experiments. This method stands out as one of the most prevalent approaches in current research practices [1,2,3,4,5,6,7]. Model experiments involve creating a scaled-down model of the actual system and conducting specific research on it to evaluate its hydraulic performance and other aspects.
To improve the hydraulic performance of the submersible axial flow pump system, this research integrates physical model experiments with numerical simulations to explore the pressure pulsation characteristics of the intricate bulbous body structure. The study also considers the significant hydraulic losses and the impact of motor placement on hydrodynamic features. Zhang Rentian [8] and colleagues investigated the operation of a bulbous axial flow pump under varying speeds to optimize a pumping station, focusing on hydraulic performance and control modes. They found that the pump’s performance under variable frequency speed control is constrained by impeller characteristics and flow passage efficiency. Liu Haoran [9] and others utilized CFD numerical simulation with the RNG k-ε turbulence model to examine a bulbous axial flow pump, particularly analyzing the hydraulic performance with a rear guide vane configuration. Dai Jing [10,11] and team studied the rear guide vane setup of a bulbous axial flow pump using CFX14.0 software, emphasizing the impact of blade positioning on hydraulic performance and simulating the “saddle” region flow characteristics. Jin Yan [12] and co-researchers conducted numerical simulations on the front guide vane configuration, focusing on internal turbulent flow and basic flow patterns to predict external characteristics for future optimizations. Dai Qifan [13] and team optimized a bulbous axial flow pump system at a specific pumping station using CFD technology, employing three-dimensional steady-state incompressible Reynolds-averaged Navier–Stokes equations and turbulence models to analyze the internal flow field. By combining model experiments for comparison, they proposed an optimization scheme meeting engineering operation requirements. Liang Haojie [14] and colleagues utilized CFD technology to optimize impeller and guide vane sections of the rear guide vane configuration, studying factors like blade profile, thickness, and number of guide vanes affecting hydraulic performance. Their research outcome offers insights for selecting axial flow pump devices with low specific speeds and high heads in future design planning.
This study delves into a submersible axial flow pump system, contrasting the hydraulic performance of front and rear motor configurations. It deeply analyzes internal flow field characteristics, hydraulic traits, and pressure pulsation patterns under various bulbous body setups [15,16,17]. By scrutinizing and comparing numerical simulation and model experiment results, optimization recommendations are put forward. These findings serve as a reference for similar pump device designs in future pumping station projects, offering practical value. The research is grounded in a pumping station project in Yangzhou City.

2. Numerical Simulation

2.1. Boundary Condition Setting

In the numerical calculation, the “Mass Inlet Boundary” is used, and the value of the mass flow rate is determined by the flow conditions. In addition, the “Outflow” is selected as the outlet boundary, where the benchmark pressure utilized for computations is 1 atm. Moreover, the “No-slip Boundary Condition” is used for the solid wall, which means that the fluid velocity near the wall is zero. Finally, the “Frozen-Rotor Intersection Model” is introduced for the three-dimensional steady numerical calculation, while the “Transient Dynamic and Static Rotor Model” is employed for the unsteady numerical calculation. The static–static intersection interface utilizes the none model [18,19,20,21,22,23,24].

2.2. Computational Domain Modeling and Meshing

Utilizing 3D modeling software, we constructed the computational domain for a submersible mixed-flow pump device. This domain encompasses various components, including the inlet channel, impeller, guide vanes, bulb body, and outlet channel. Within the computational domain, specific dimensions were employed, such as an inlet width of 2.21 D for the inlet channel, an outlet width of 1.175 D for the guide vanes, an outlet width of 1.17 D for the bulb body, and an outlet width of 2.21 D for the outlet channel. The total length of the computational domain measured 14.17 D, with D representing the impeller’s inlet diameter, which was 2.4 m in width. Figure 1 illustrates the computational domain.
This manuscript is based on ANSYS 14.0 software. Firstly, the entire computational domain is partitioned, and the impeller and guide vanes are meshed using Turbo Grid software. The inlet and outlet water channels and the water body are meshed using unstructured grids in ICEM, and the bulbous body is meshed using unstructured grids in Mesh. Finally, the entire model is synthesized and computed in CFX. Figure 2 displays the schematic diagram of each flow component, while Table 1 provides the corresponding grid counts for these components.

2.3. Grid-Independent Analysis

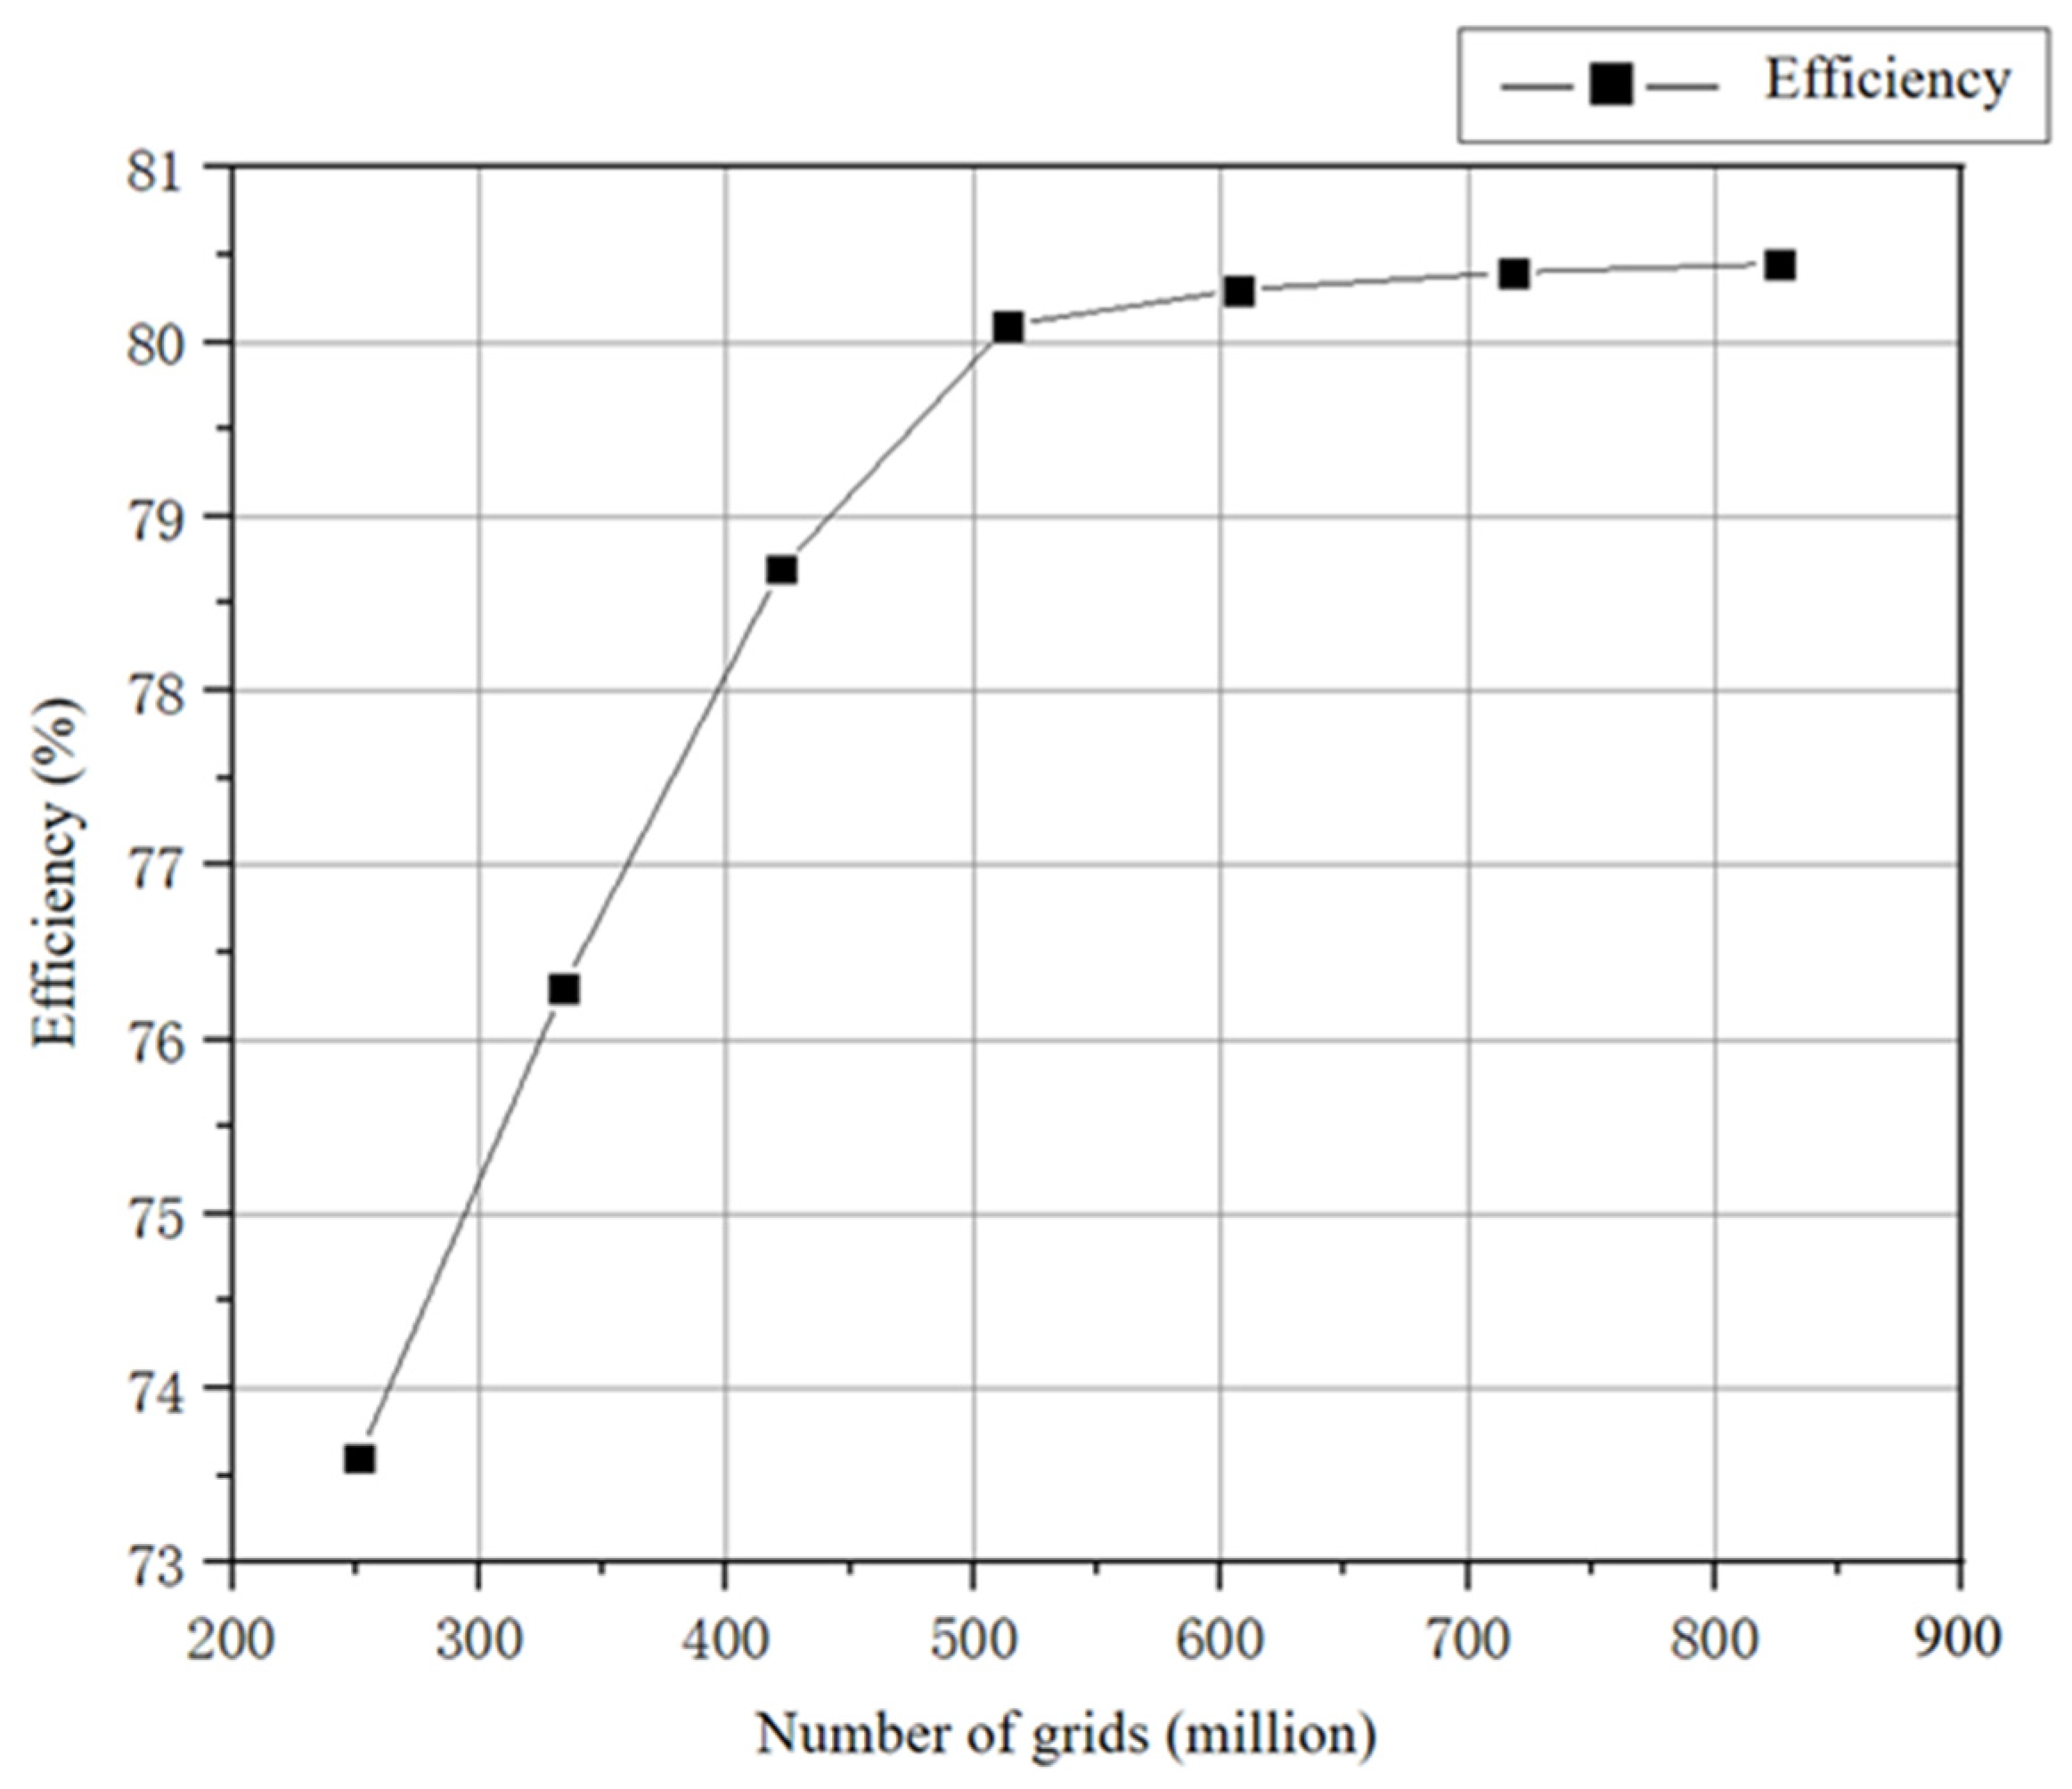
The number of grids has a certain impact on the accuracy of numerical calculation results. For the same model, the more grids and nodes there are, the more accurate the calculation results will be. However, increasing the number of grids also leads to an increase in the computational workload and duration. After surpassing a specific threshold, the enhancement in calculation accuracy becomes less substantial. Therefore, to balance engineering efficiency and calculation precision, this study divided the grids into seven groups. The number of grids for each group is as follows: 2.51 × 10⁶, 3.34 × 10⁶, 4.22 × 10⁶, 5.14 × 10⁶, 6.07 × 10⁶, 7.18 × 10⁶, and 8.26 × 10⁶.
The efficiency of the pump device was selected as the characteristic parameter for grid-independence analysis. As shown in Figure 3, when the number of grids exceeds 5.14 × 10⁶, the efficiency remains relatively unchanged, with a maximum relative error of ±2%. The calculation results tend to stabilize. Therefore, this chapter conducts numerical simulations and analysis using this order of magnitude for the number of grids.

3. Model Test

3.1. Model Test System

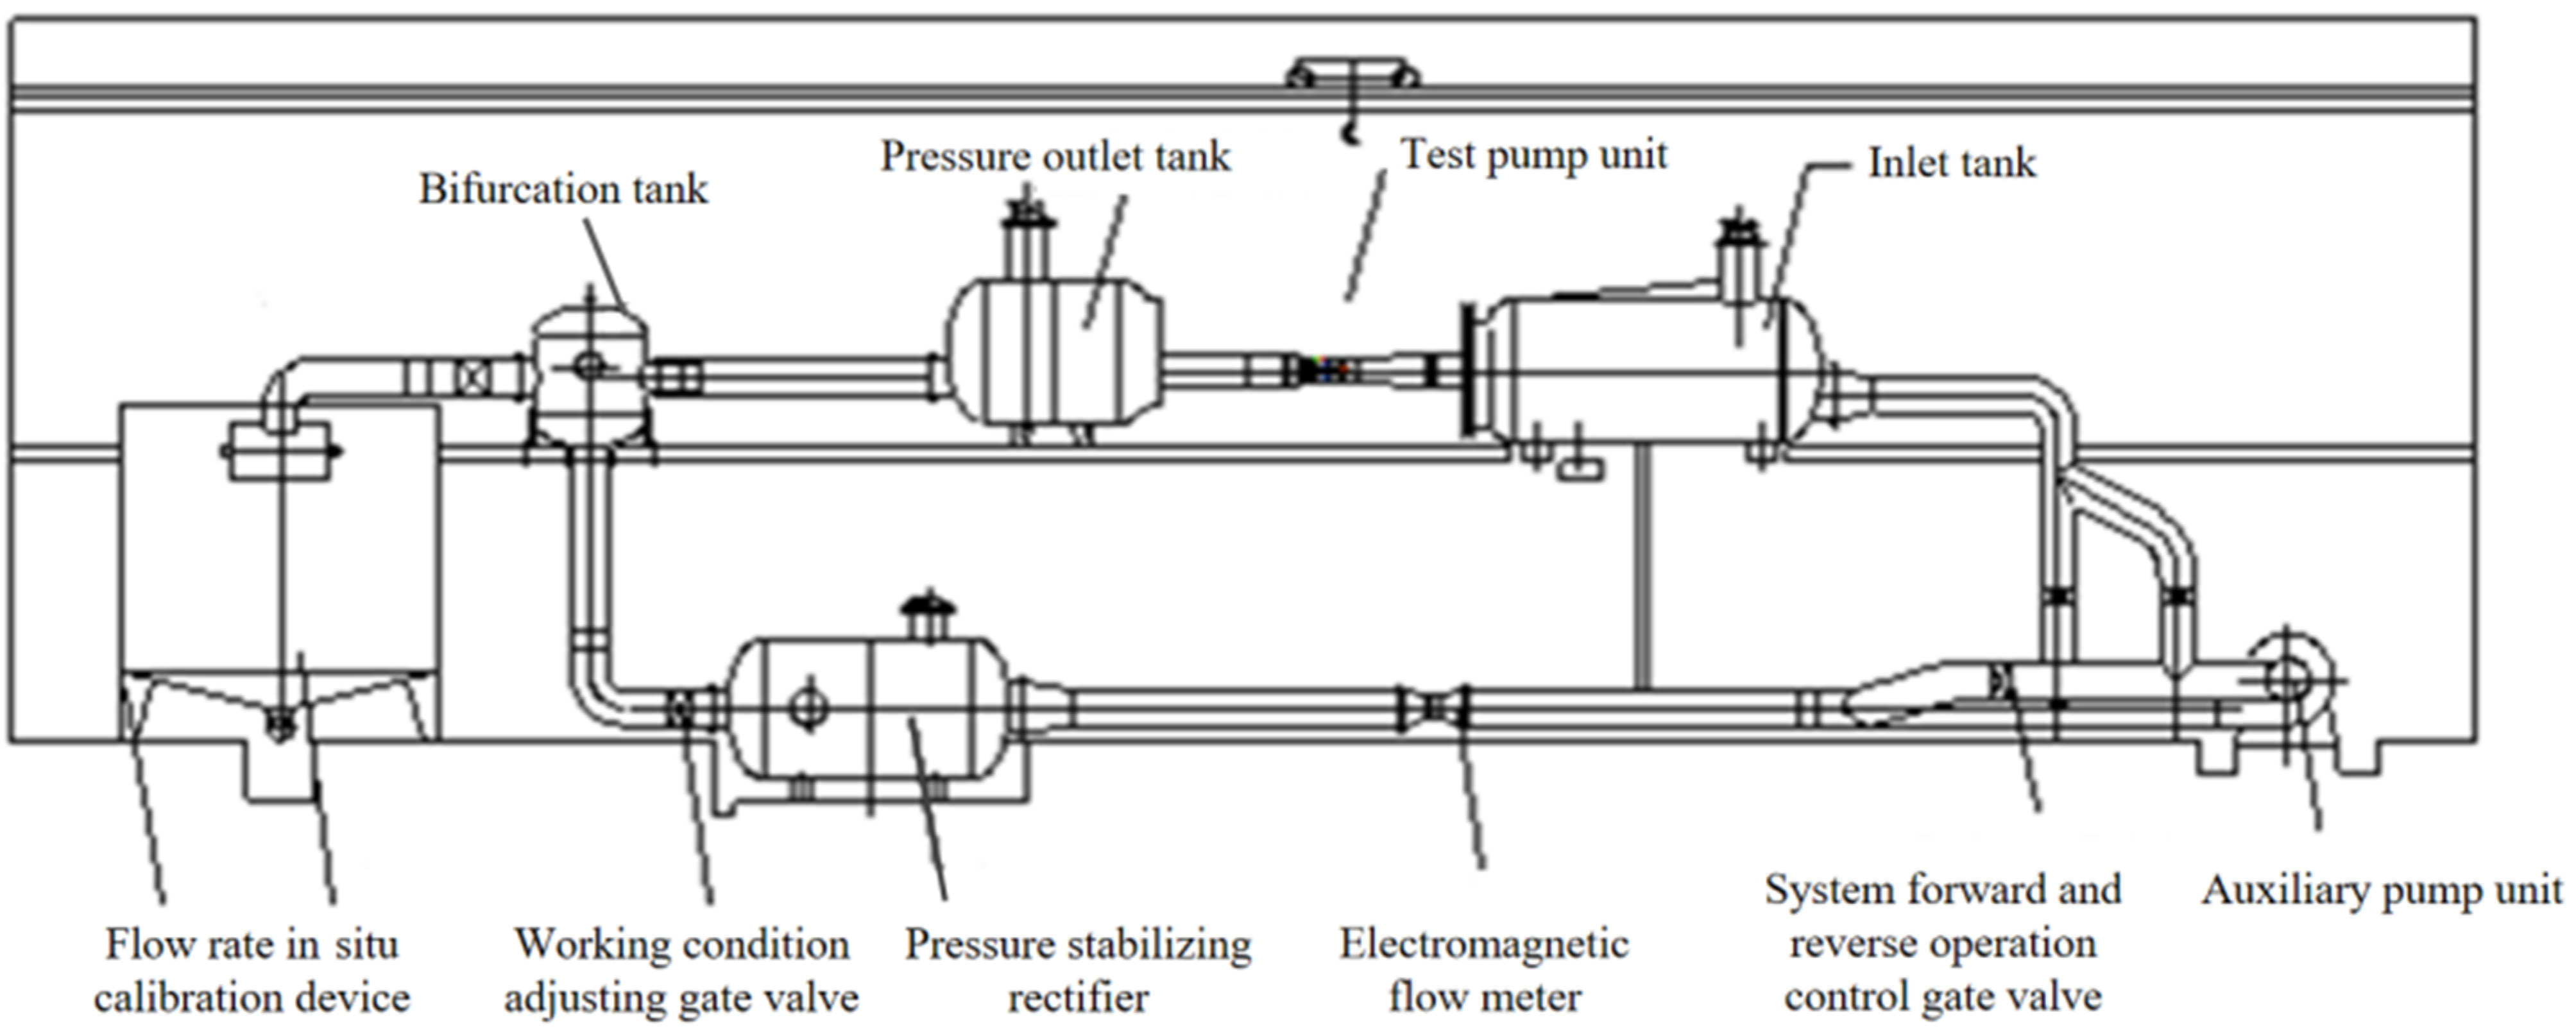
Further model experiments were conducted based on the numerical simulation scheme. The experiments were carried out on the high-precision hydraulic machinery test bed at Yangzhou University, as shown in Figure 4.
Table 2 shows the main instrumentation for the model test as follows:

3.2. Main Parameters of Water Pump

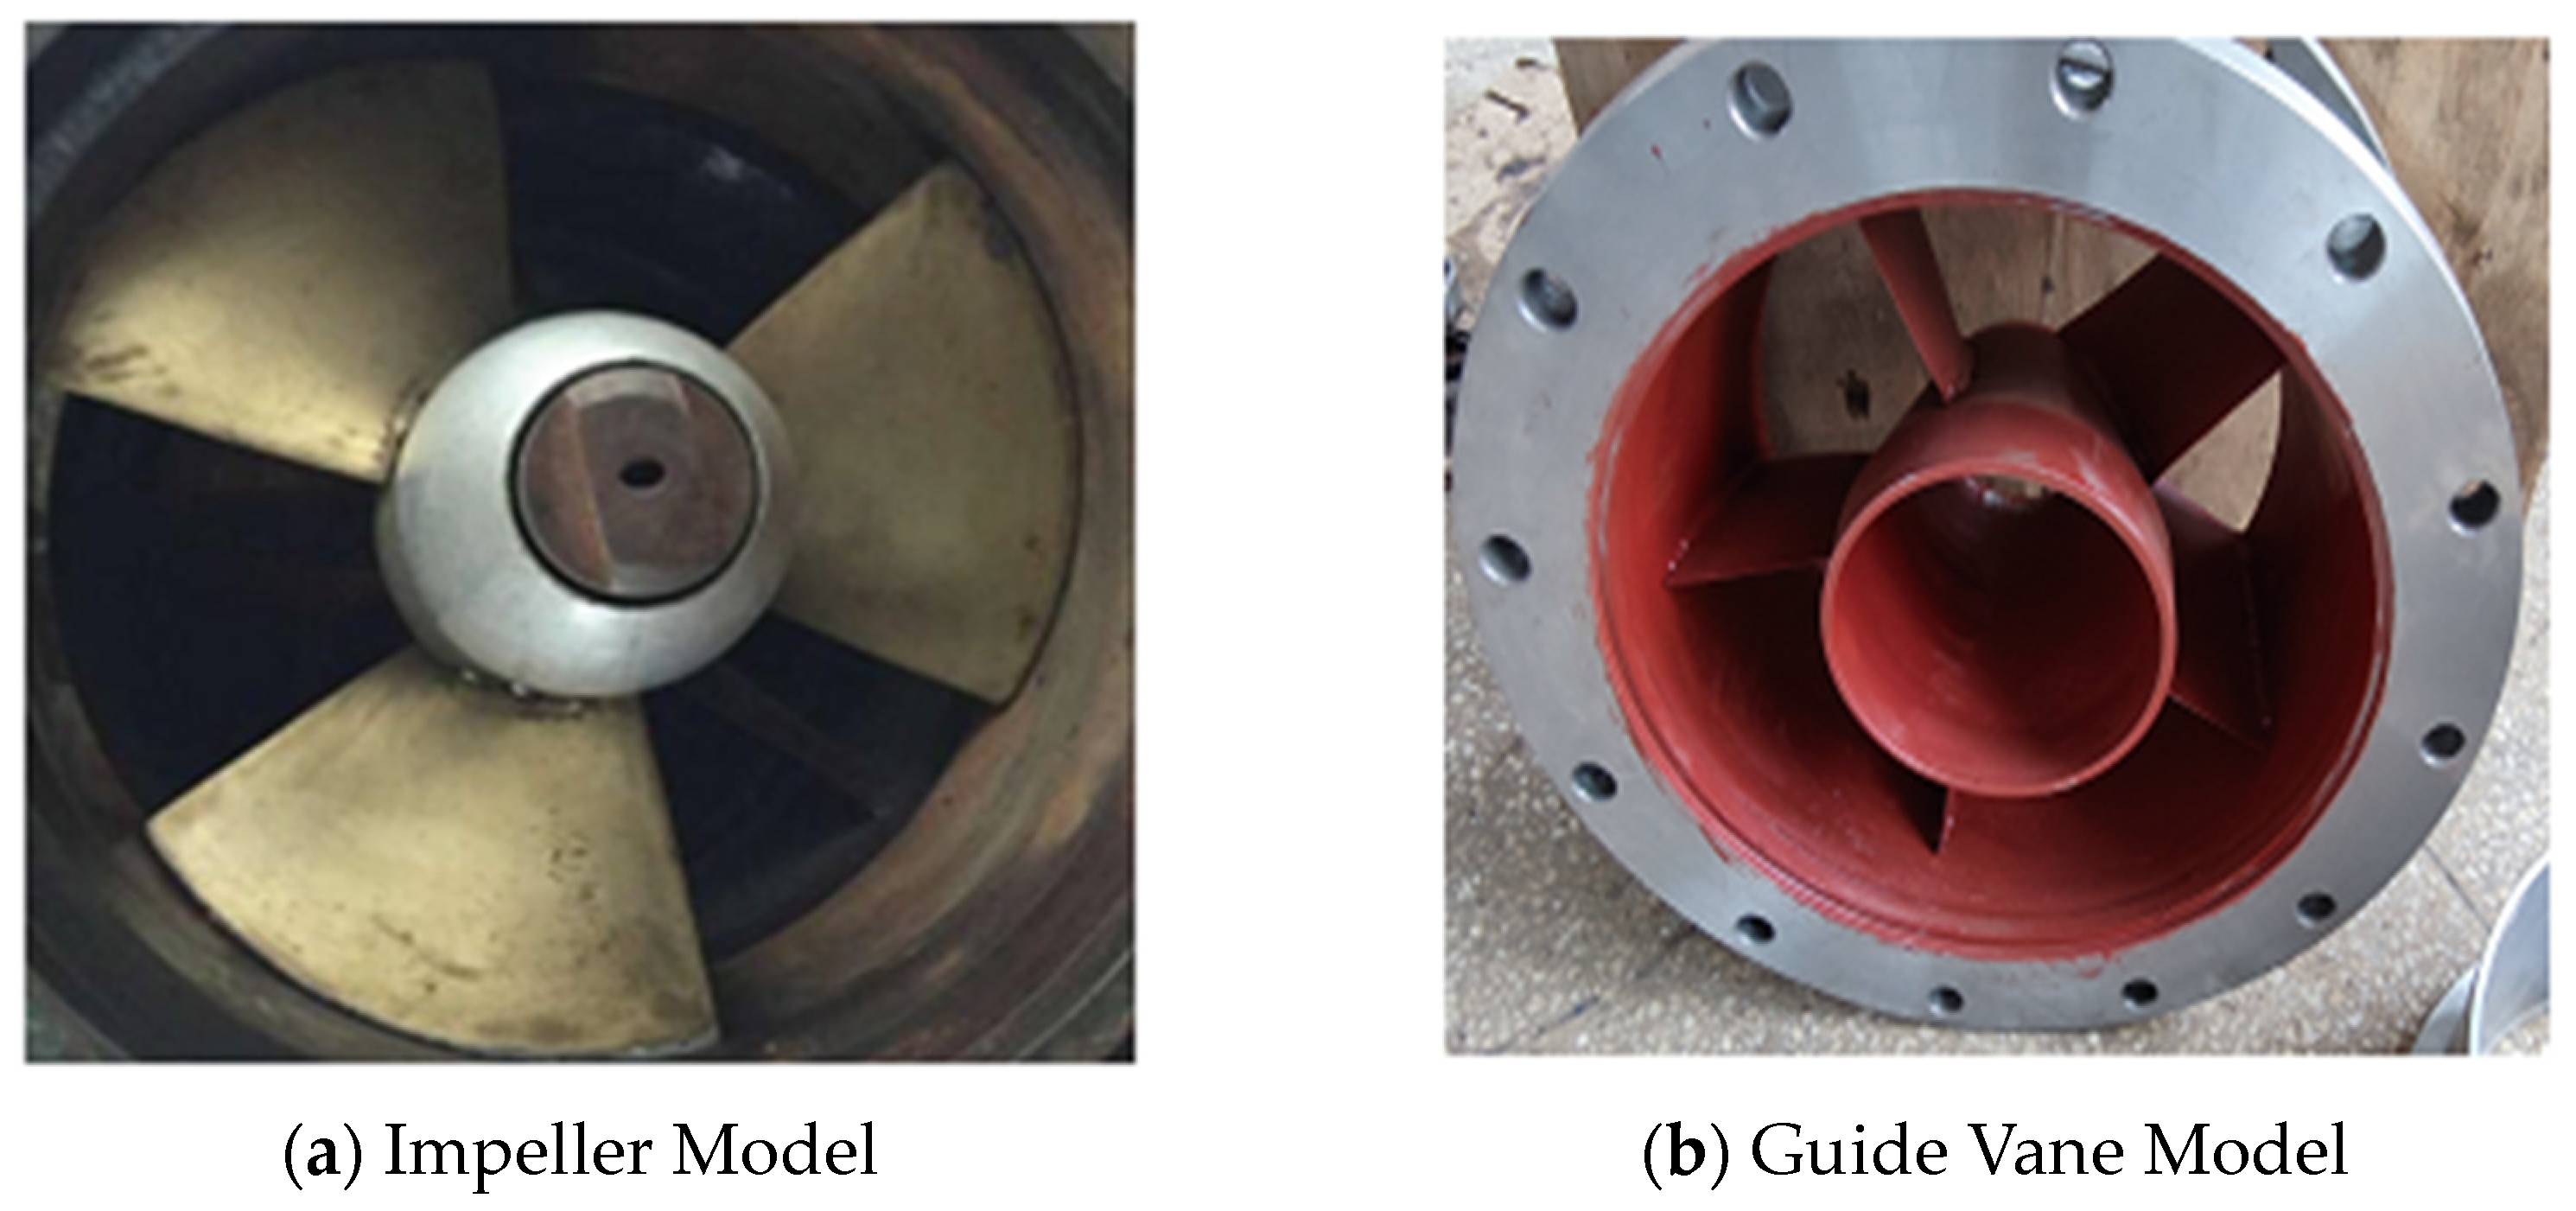
According to the design requirements and comparative numerical simulations, the ZM25 impeller was ultimately selected. The impeller diameter of the model pump is 0.3 m, and the model scale of the pump device is 1:7.67. The ZM25 model impeller is shown in Figure 5a with three blades made of brass material. The diffuser guide vanes for the submersible mixed-flow pump device were designed based on the motor size, as shown in Figure 5b, with five blades welded together using steel material. During installation, a thorough inspection was conducted on the model pump. The positioning surface of the guide vanes and impeller exhibited an axial runout of 0.10 mm, while the outer surface of the hub displayed a radial runout of 0.08 mm. Moreover, precise control ensured that the clearance between the blade tips remained within 0.15 mm.

3.3. Test Methods

(1)
Test Speed:
The model scale of the pump device is 1:7.67. By using the principle of equal nD between the prototype and the model, the test speed of the model pump device was calculated to be 1352 r/min.
(2)
Head Measurement:
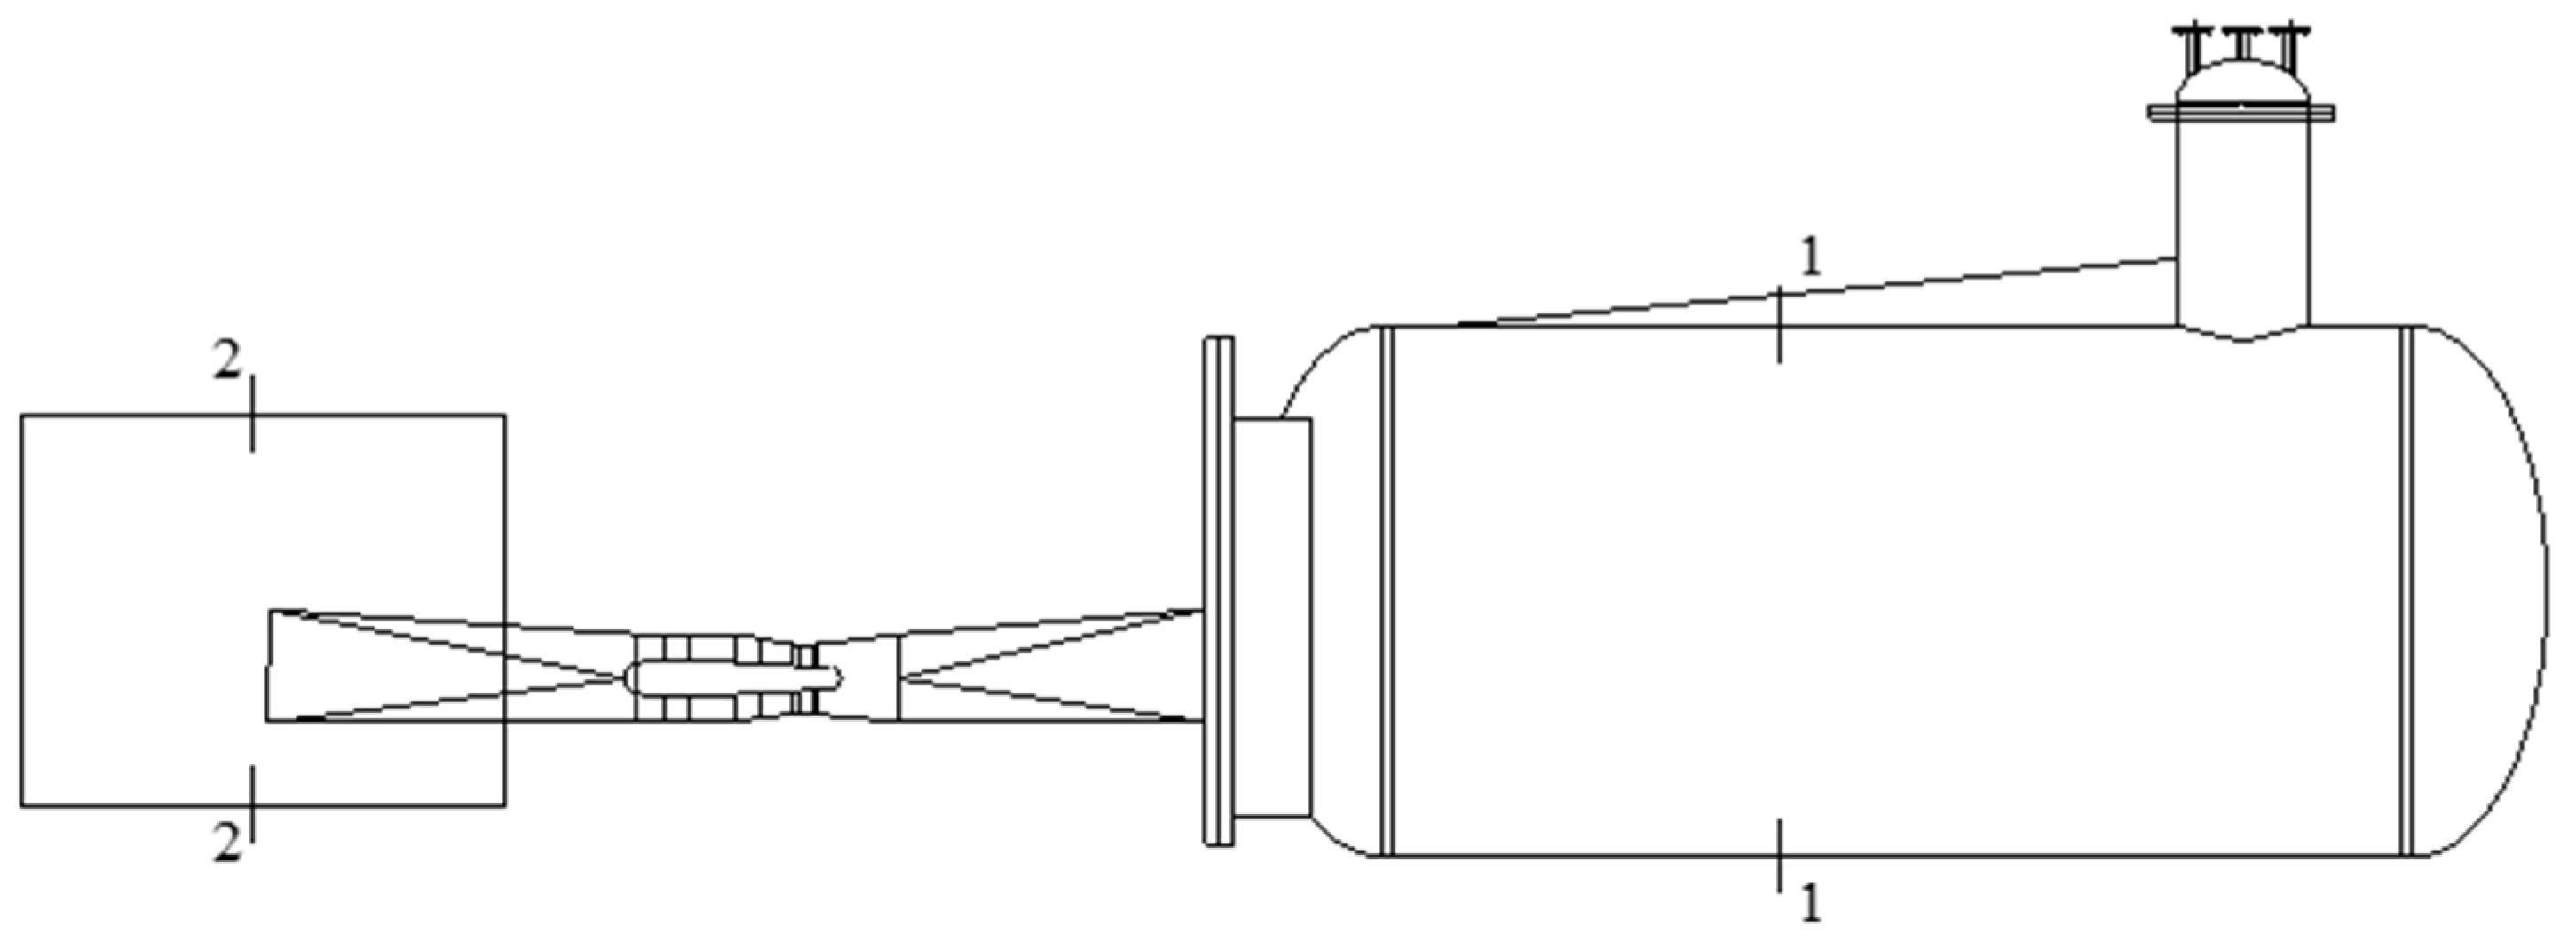
A schematic diagram of the pressure measurement section is shown in Figure 6. The pressure measurement section at the inlet is indicated as Section 1-1, while the pressure measurement section at the outlet is indicated as Section 2-2.
The equation for the total head difference H is as follows:
H = p 2 ρ g p 1 ρ g + z 2 z 1 + ( u 2 2 2 g u 1 2 2 g )
where ( p 2 ρ g p 1 ρ g + z 2 z 1 ) represents the static pressure difference; ( u 2 2 2 g u 1 2 2 g ) represents the dynamic. Considering that the cross-sectional area of the pressure measurement section at the inlet and outlet is basically the same and the flow velocity is small, the dynamic pressure difference can be approximately considered as zero.
(3)
Flow Measurement:
The DN400 electromagnetic flowmeter was used to directly measure the test flow rate.
(4)
Shaft Power Measurement:
The experimental mechanical loss torque was measured when the unit was unloaded. The pump shaft speed and input torque were directly measured by a ZJ type speed-torque sensor. The formula for shaft power is as follows:
N = π 30 n ( M M )
In the equation, M represents the input torque of the model pump, measured in N·m; M′ represents the mechanical loss torque of the model pump, measured in N·m; and n represents the test speed of the model pump, measured in r/min.

4. Comparative Analysis of Results

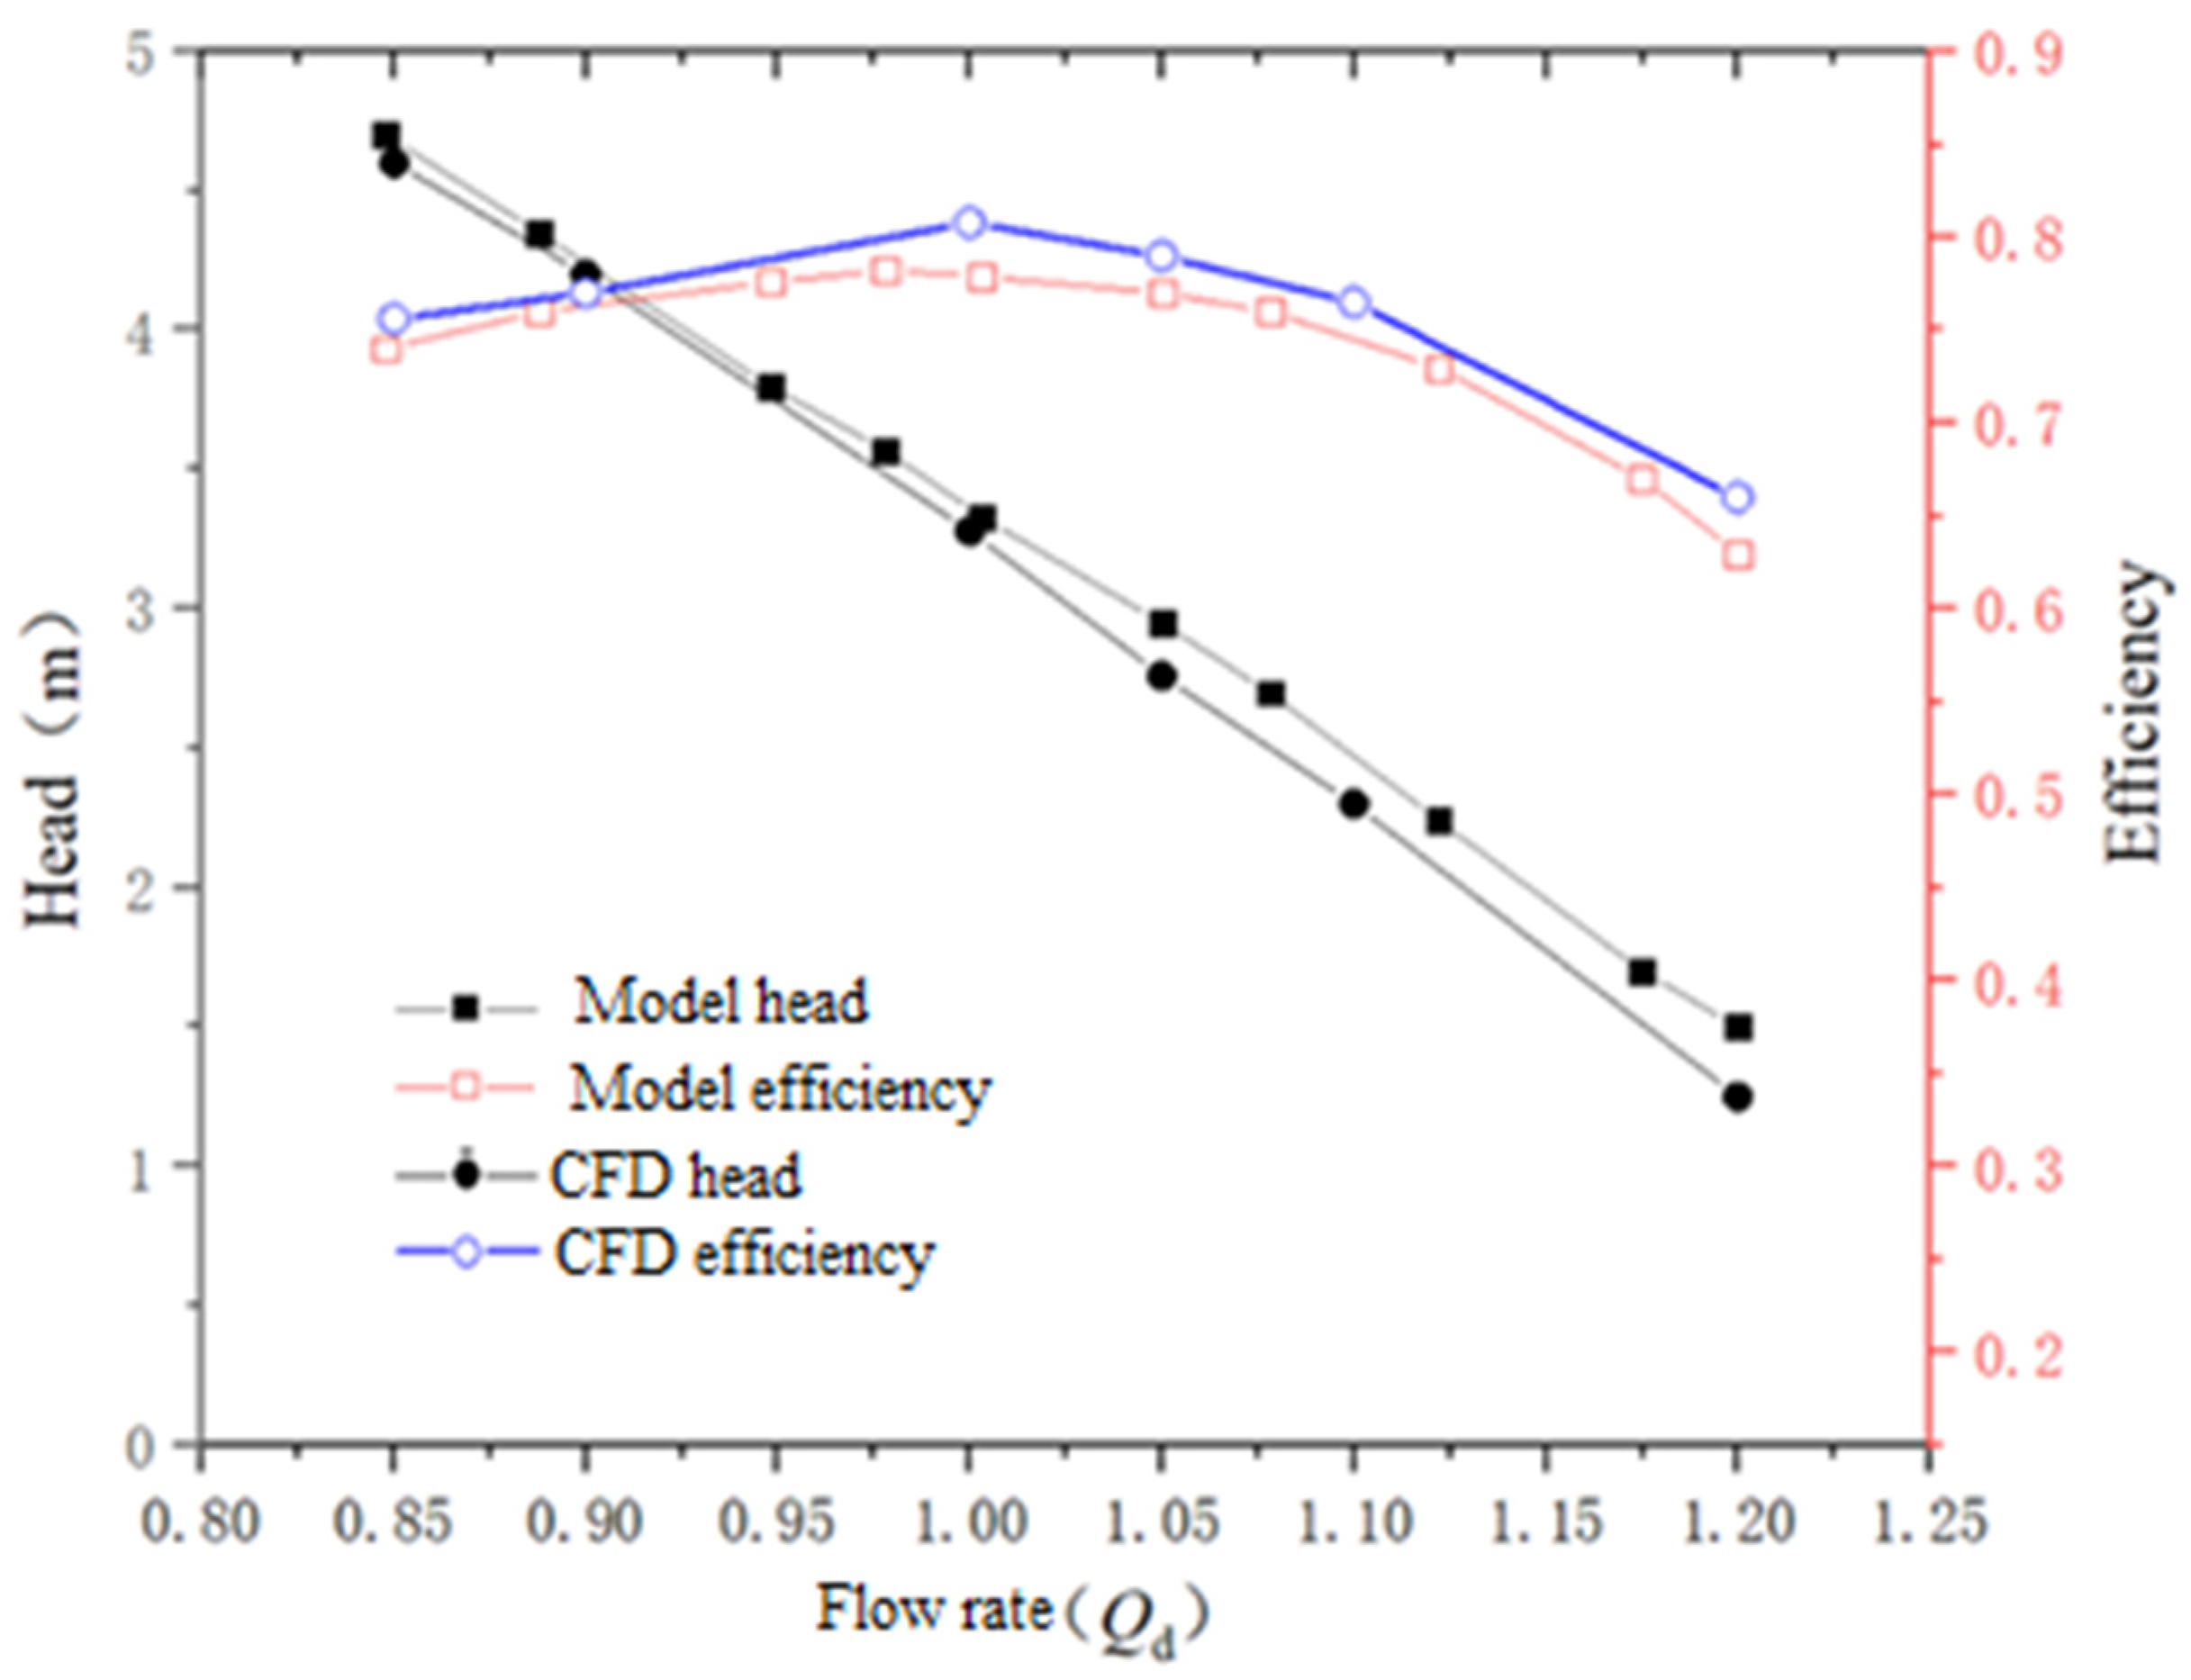
By conducting model tests on the pump device, the accuracy of the numerical simulation results was further validated. The comparison between the numerical simulation and model test results is shown in Figure 7.
From the curves in the figure, it can be observed that the simulation results of efficiency and head based on the six selected operating conditions are in good agreement with the experimental model results. The peaks of the two efficiency curves are located near the rated flow condition (1.0 Qd), indicating that the performance curve of this pump is very good and exactly as expected. Moreover, the overall efficiency measurement from the experimental model is slightly lower than the simulation results; due to that, the leakage loss of the pump is not considered in the simulation. The head curve shows that the experimental model’s head is slightly higher than the simulated head. It should be noted that at rated flow condition, the difference between the experimental and numerical head value is small, while the difference is large at high flow conditions. In conclusion, the two sets of curves are in basic alignment, and the deviation falls within the normal range, indicating that the numerical simulation experiment coincides with the physical model test.

5. Pressure Pulsation Analysis of the Bulb Body

5.1. Layout of Monitoring Points

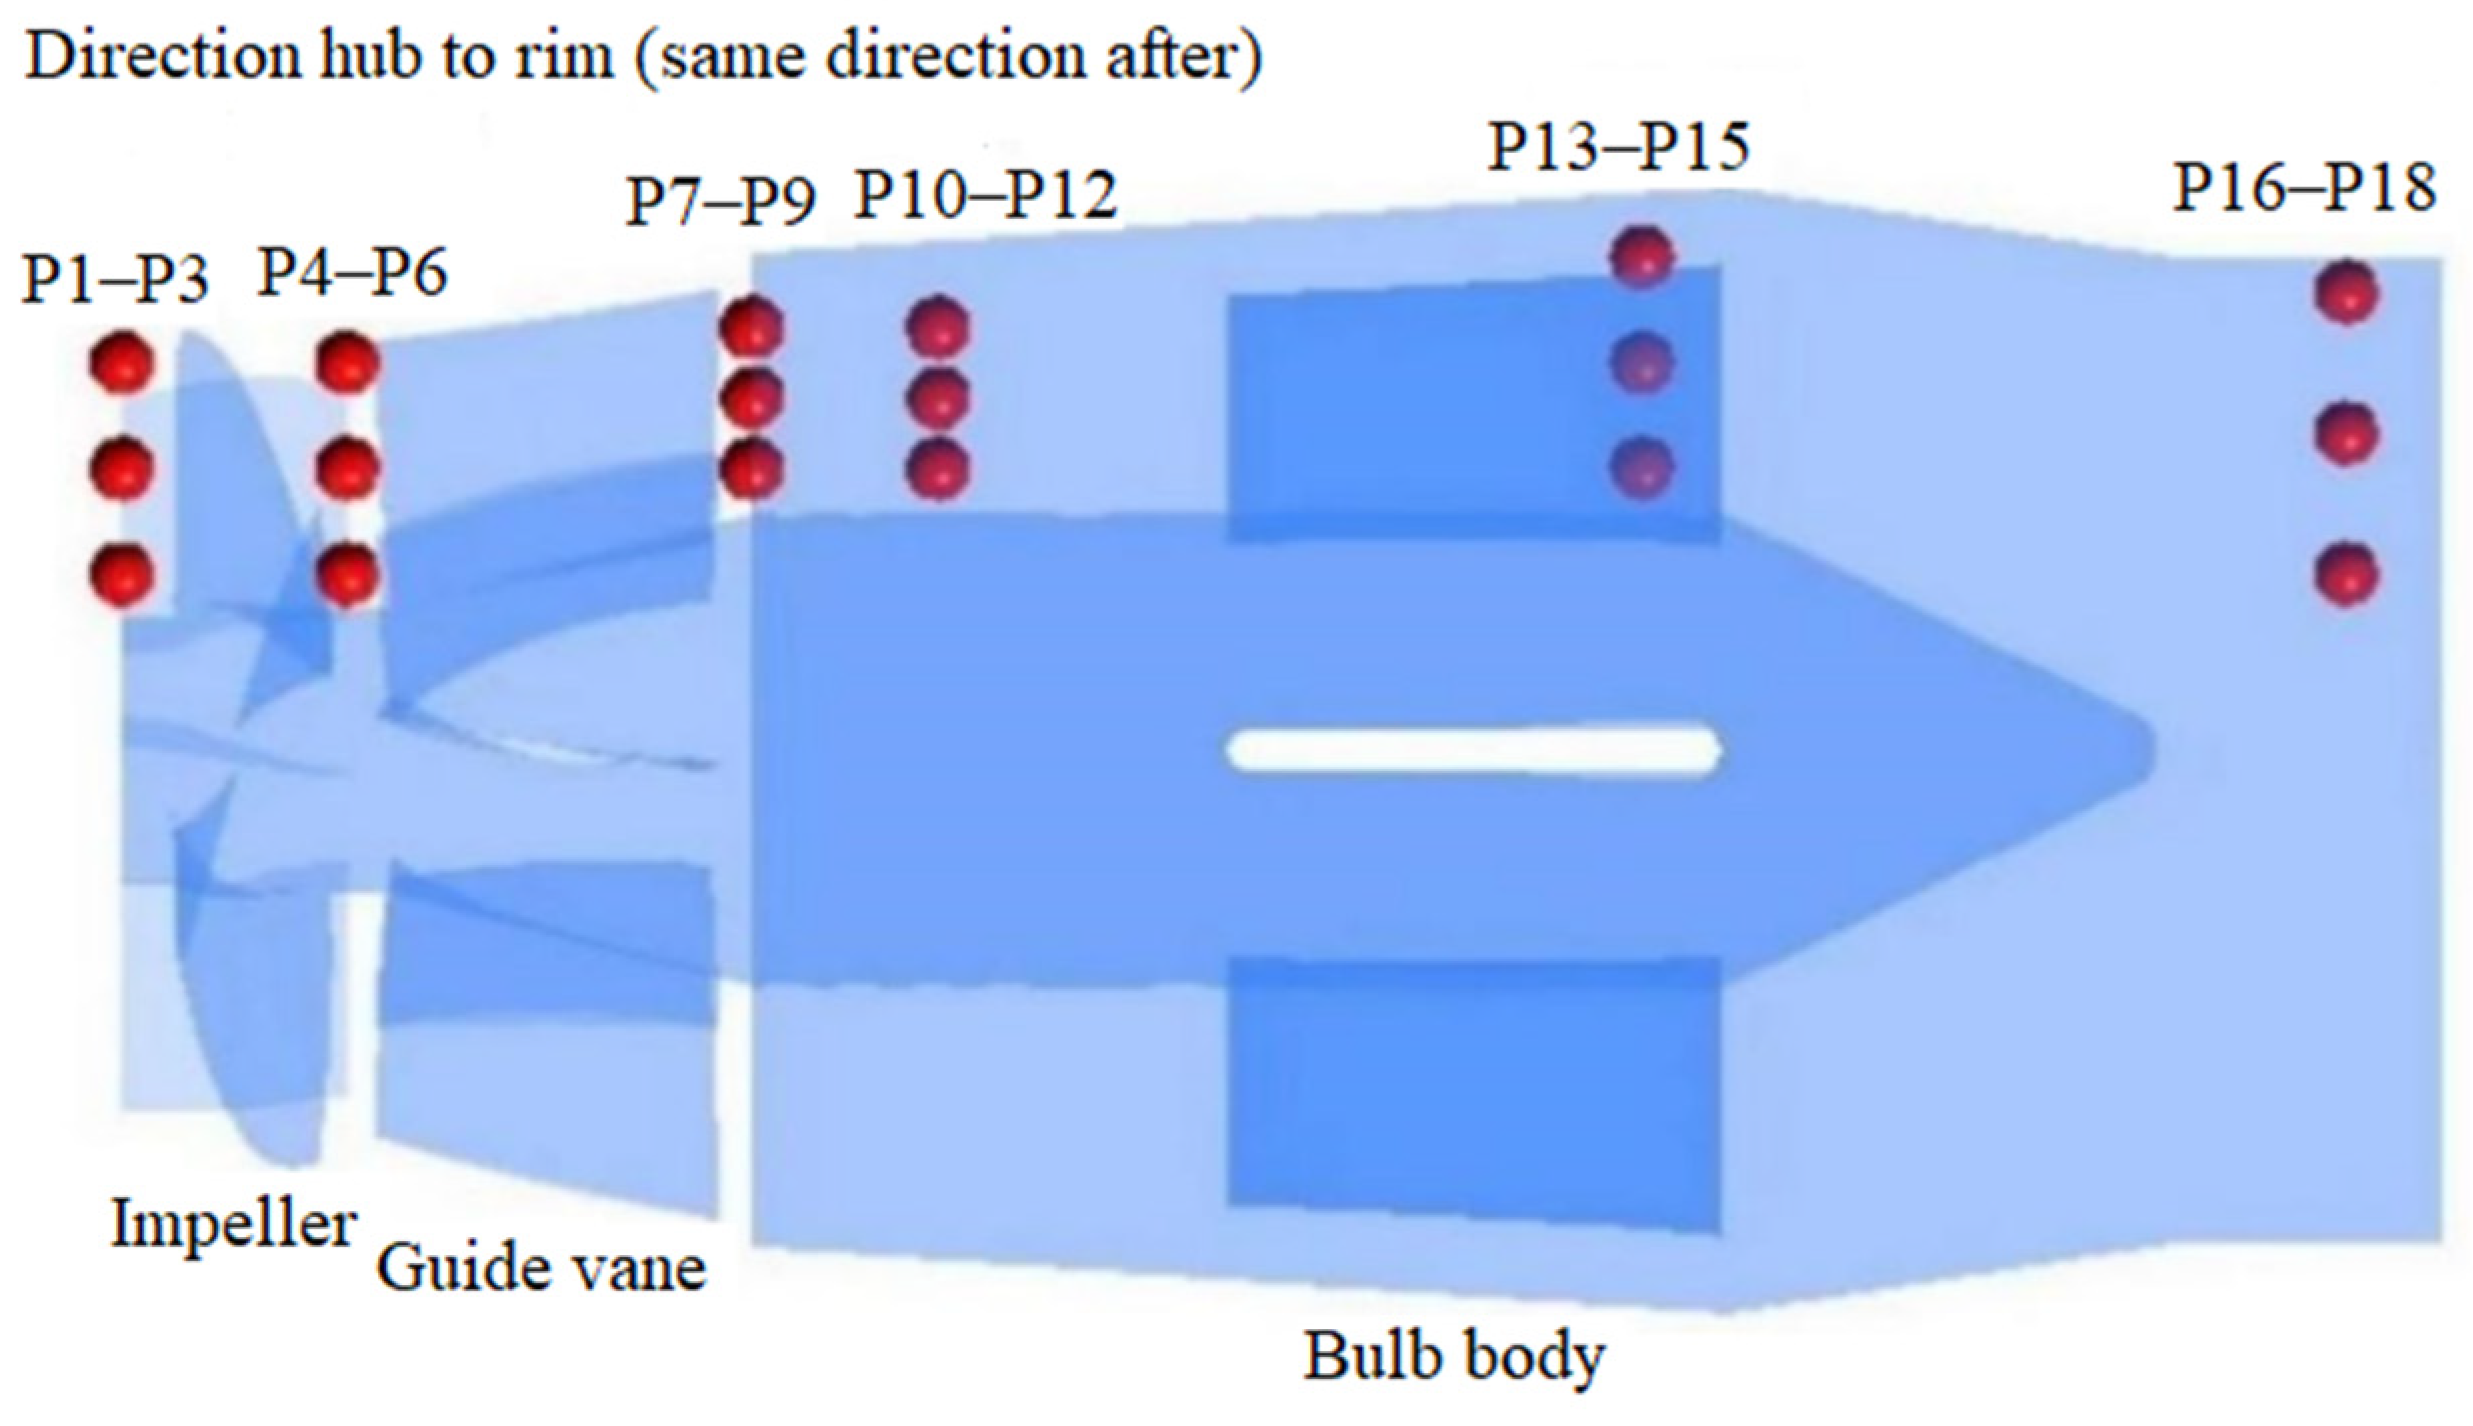
The transient pressure pulsation numerical simulation calculations were performed on the optimal solution of the submersible mixed-flow pump under three operating conditions: low flow rate (0.9 Qd), design flow rate (1.0 Qd), and high flow rate (1.1 Qd). The transient frozen rotor model was used for the interface between the inlet flow channel and the impeller, and the turbulence model was set the same as the steady-state model. The time step was set at every 3°, with a time step of 0.00296 s. The maximum iteration steps per unit time step were set to 10, with a convergence accuracy of 1 × 10⁻⁵ s. The impeller rotation period was set as six, which corresponds to a full rotation of 360°, requiring a total time of 0.35503 s. The pressure pulsation analysis was conducted using the results of the last two cycles in the simulation calculations.
For a thorough and detailed analysis of pressure pulsations within the bulb body, 18 monitoring points were strategically placed. These monitoring points included locations such as the impeller inlet, impeller outlet, guide vane outlet, bulb body inlet, middle section, and outlet, ensuring comprehensive data collection for analysis. The monitoring points at the impeller inlet are denoted as p1–p3, with the direction of hub to shroud. The same direction applies to the monitoring point layout in the guide vane section and bulb body section. The specific layout of the pressure pulsation monitoring points is shown in Figure 8.
To analyze the frequency domain components of pressure pulsation, it is necessary to perform a Fast Fourier Transform on the time-domain signal. This will yield the frequency domain spectrum of the pump pressure pulsation. The corresponding formula is as follows:
N F = 60 z F n = F F n
C p = p 0.5 ρ u 2
where NF is the blade frequency multiplier; Cp is the pressure coefficient; F is the actual frequency, obtained after performing the Fast Fourier Transform, in Hz; Fn is the blade passing frequency at the corresponding rotational speed, in Hz; Δp is the pressure difference in Pa; and u is the circumferential velocity of the impeller in m/s.

5.2. Analysis of Pulsation Characteristics in the Bulb Body Section

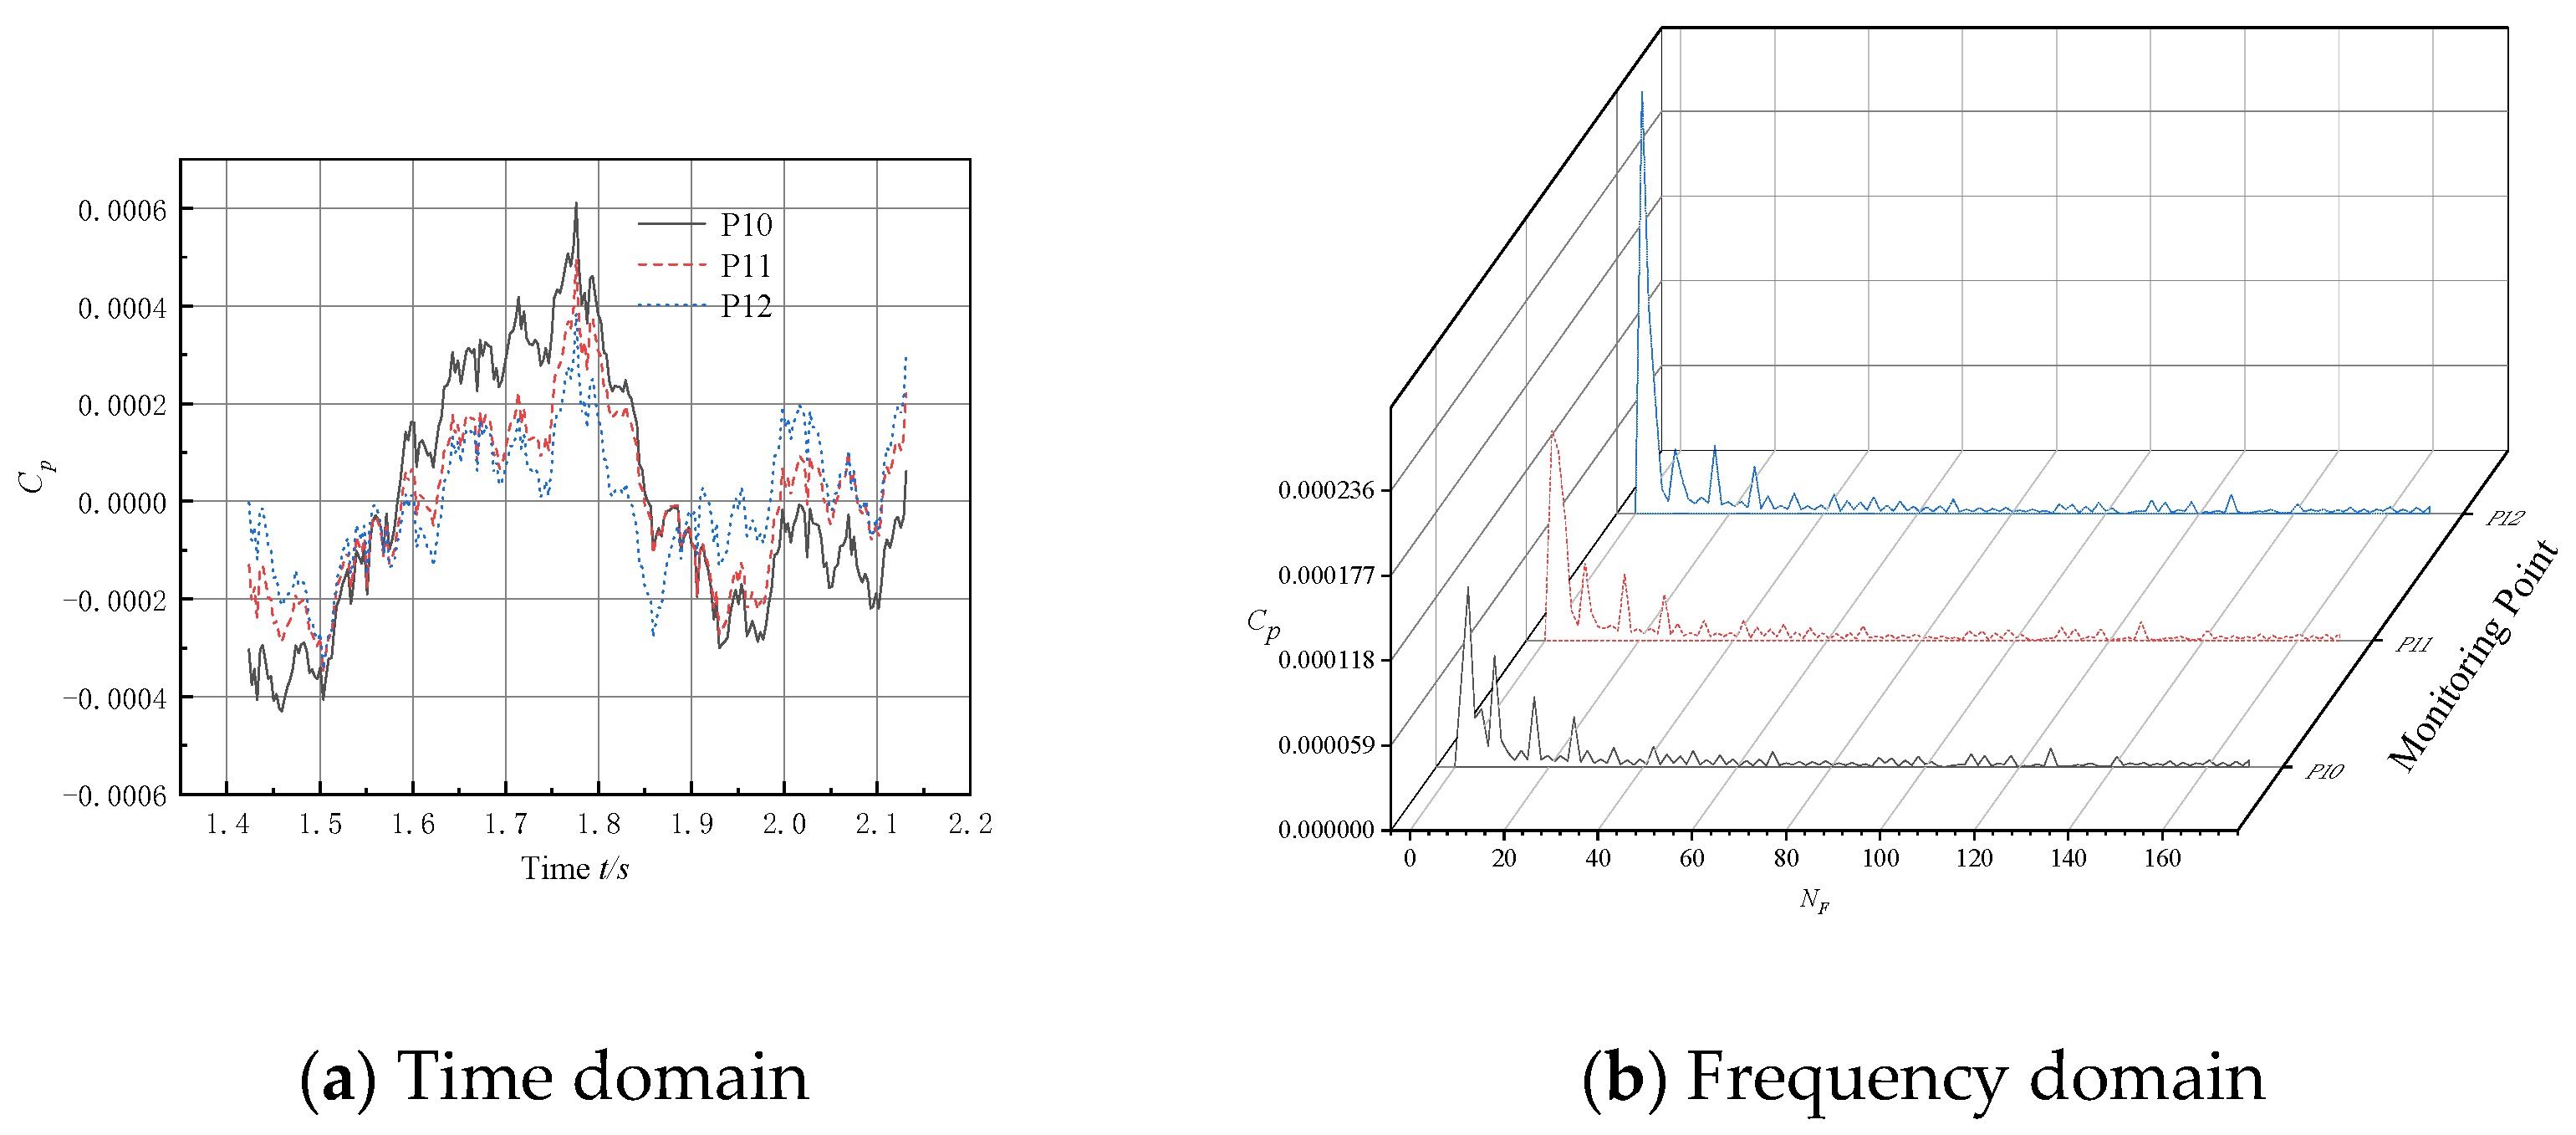
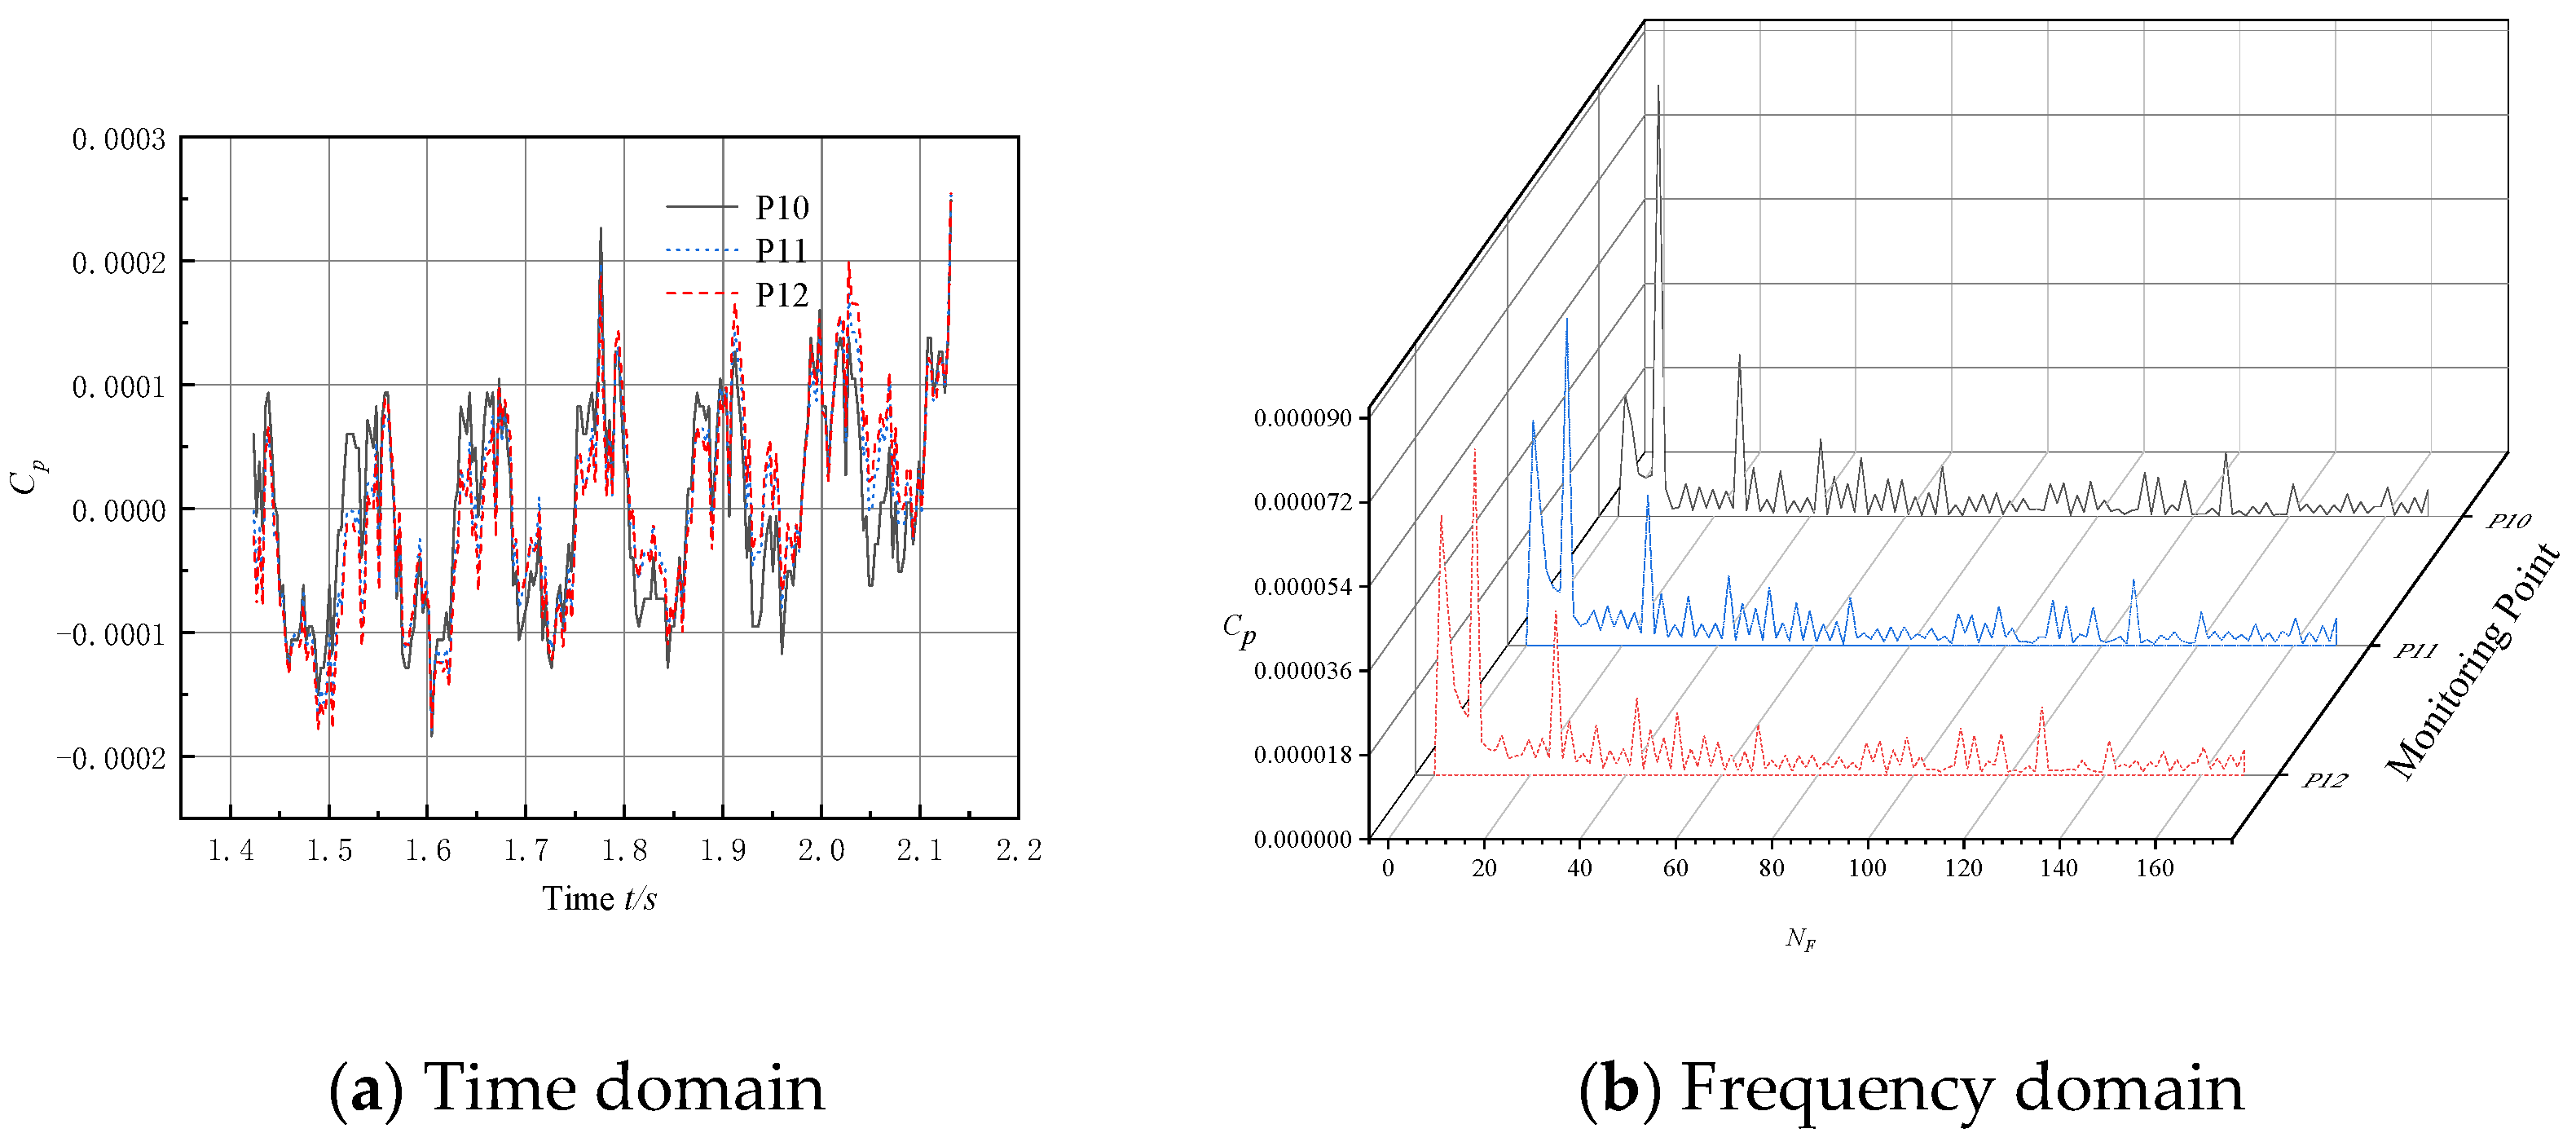
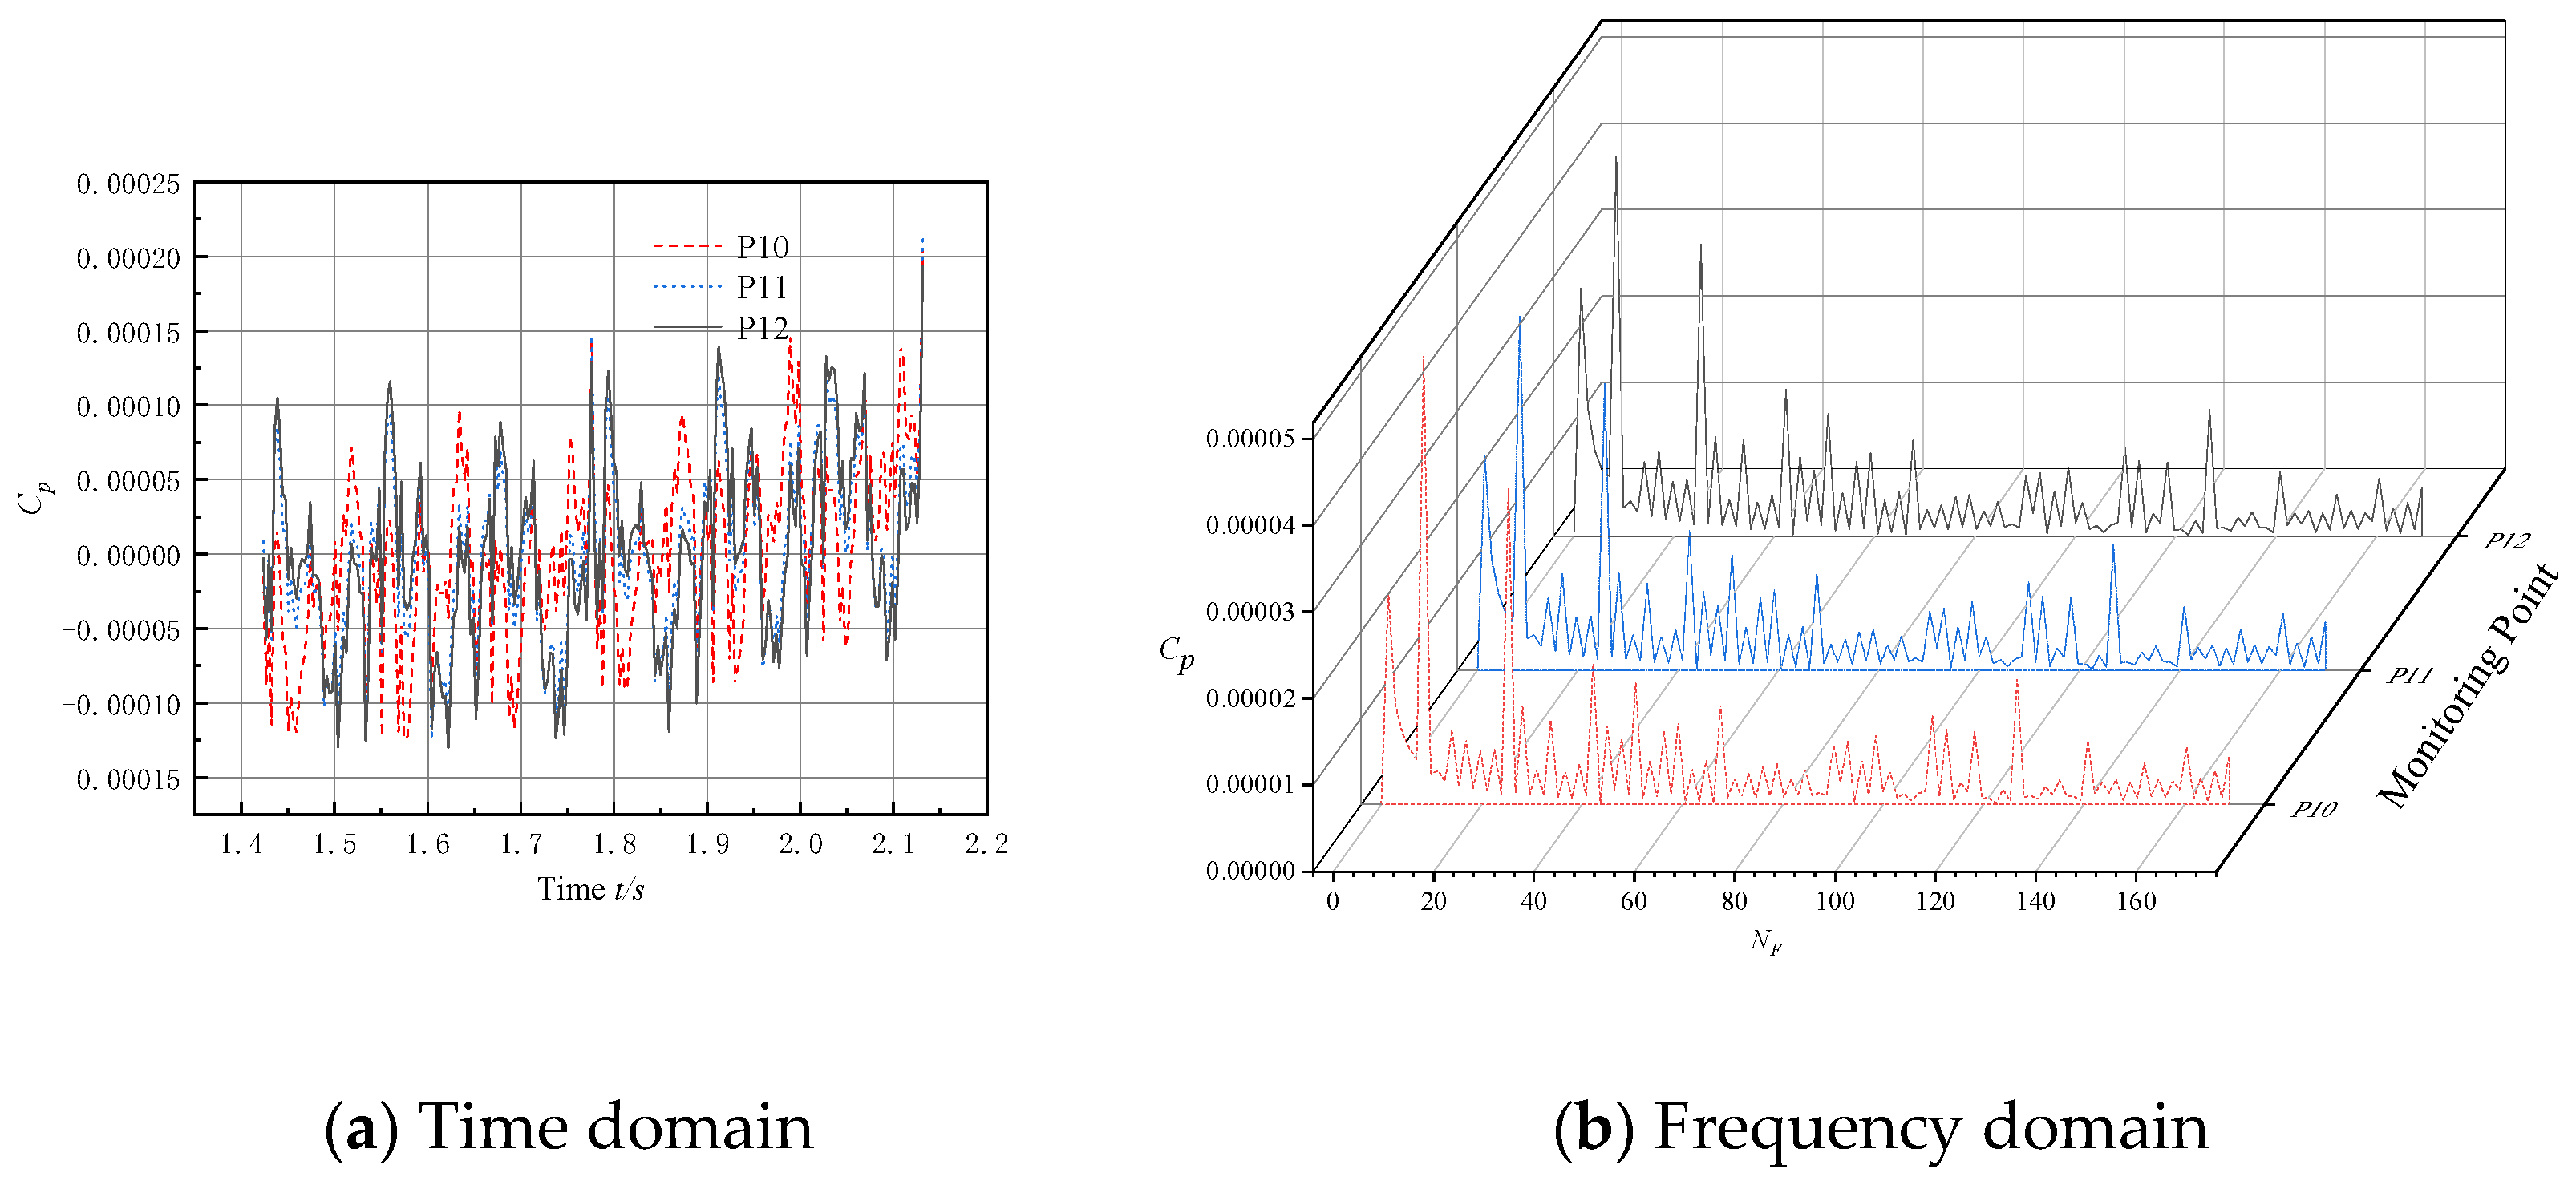
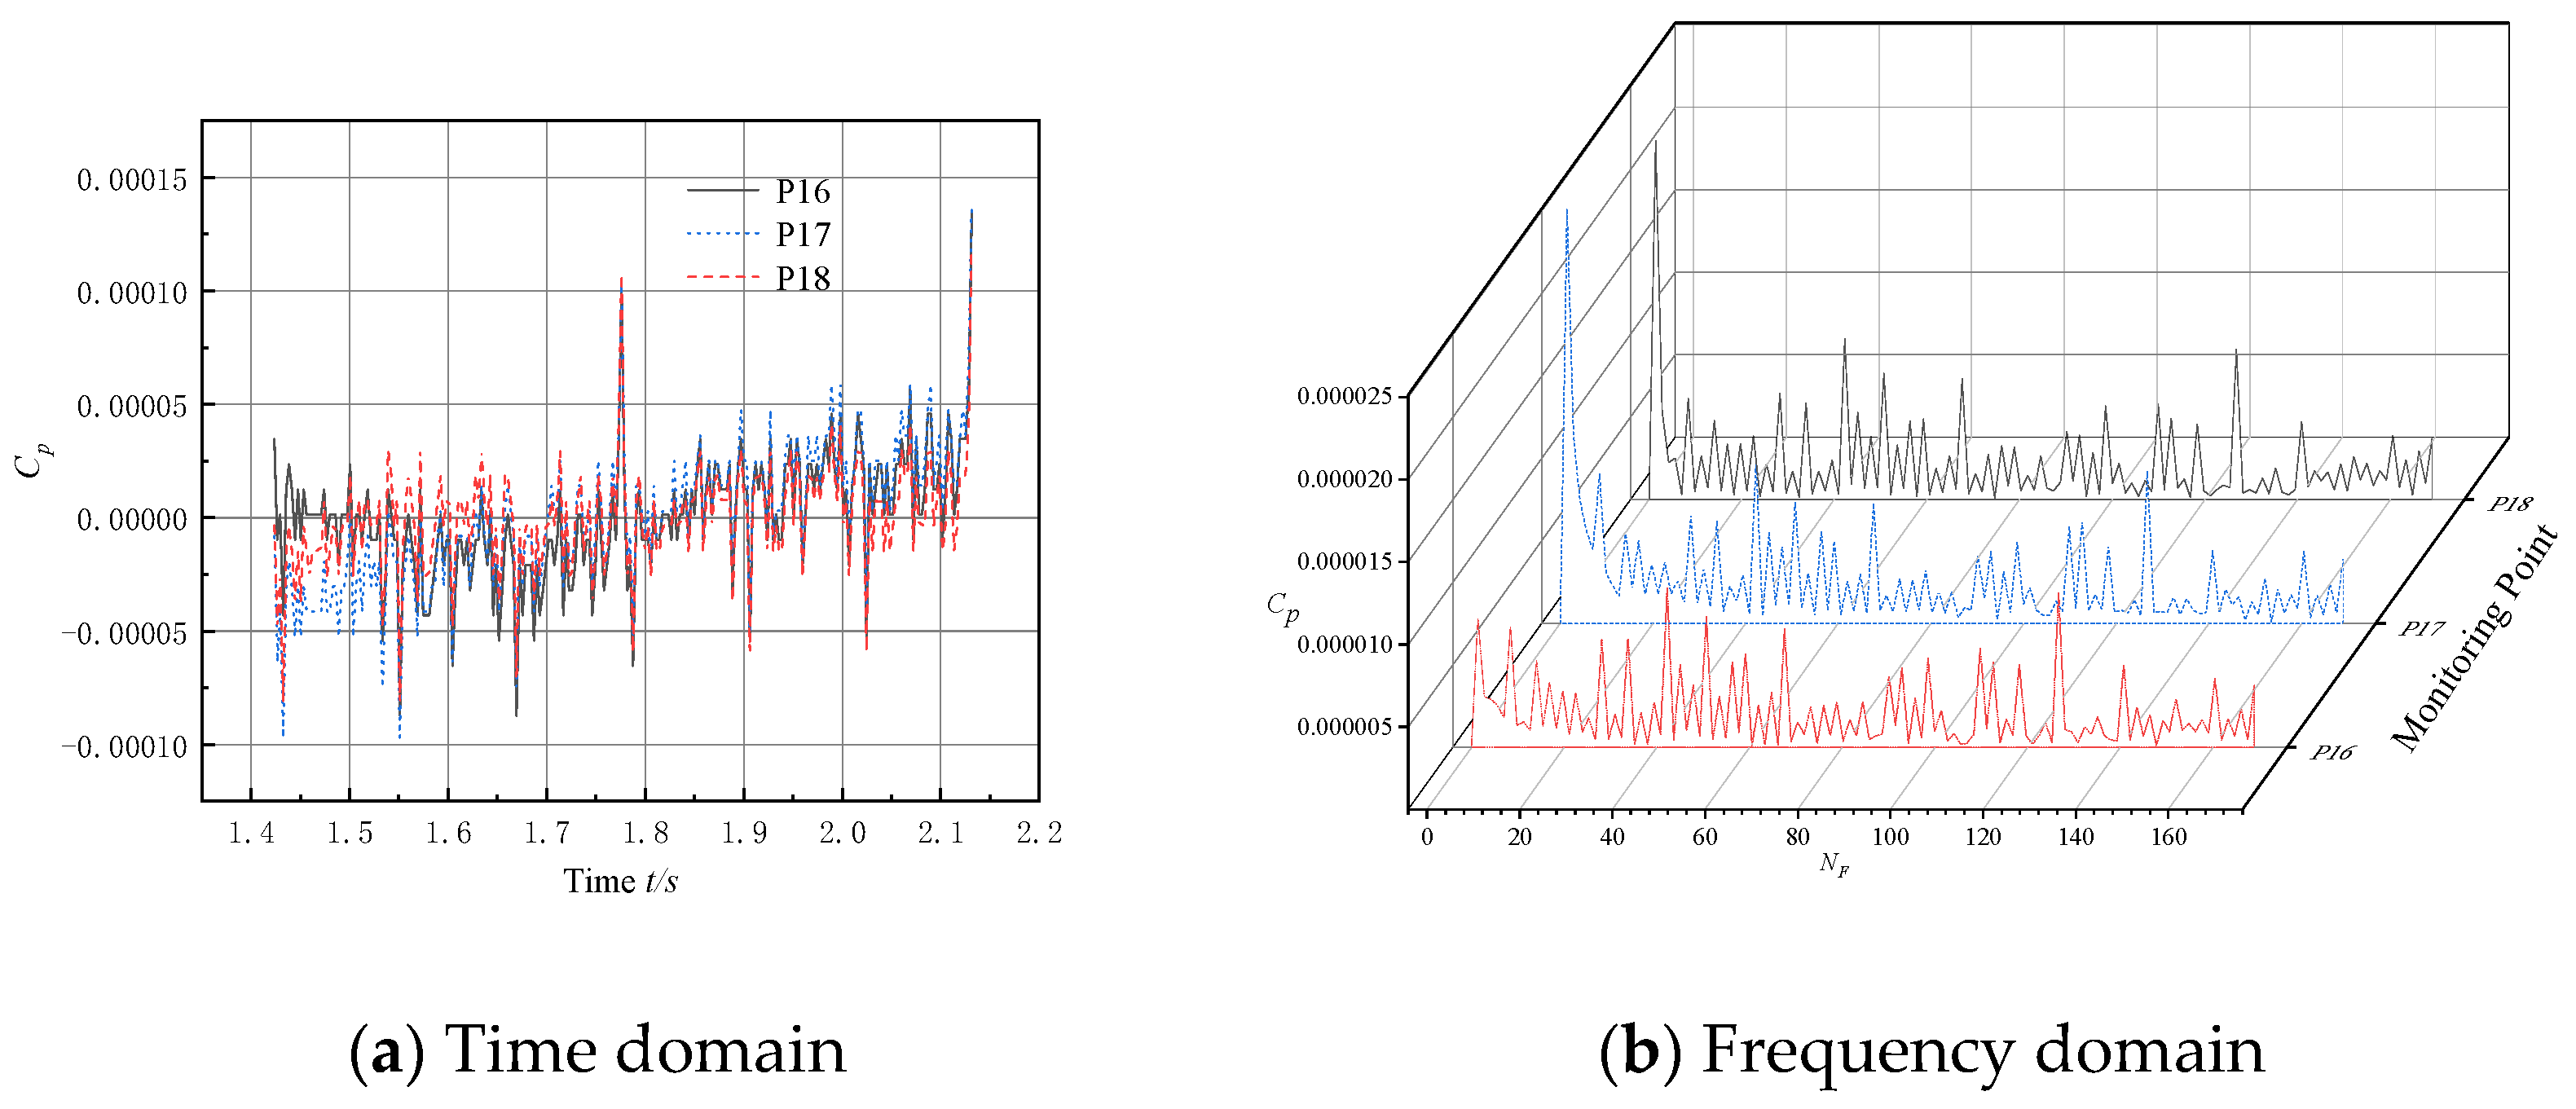
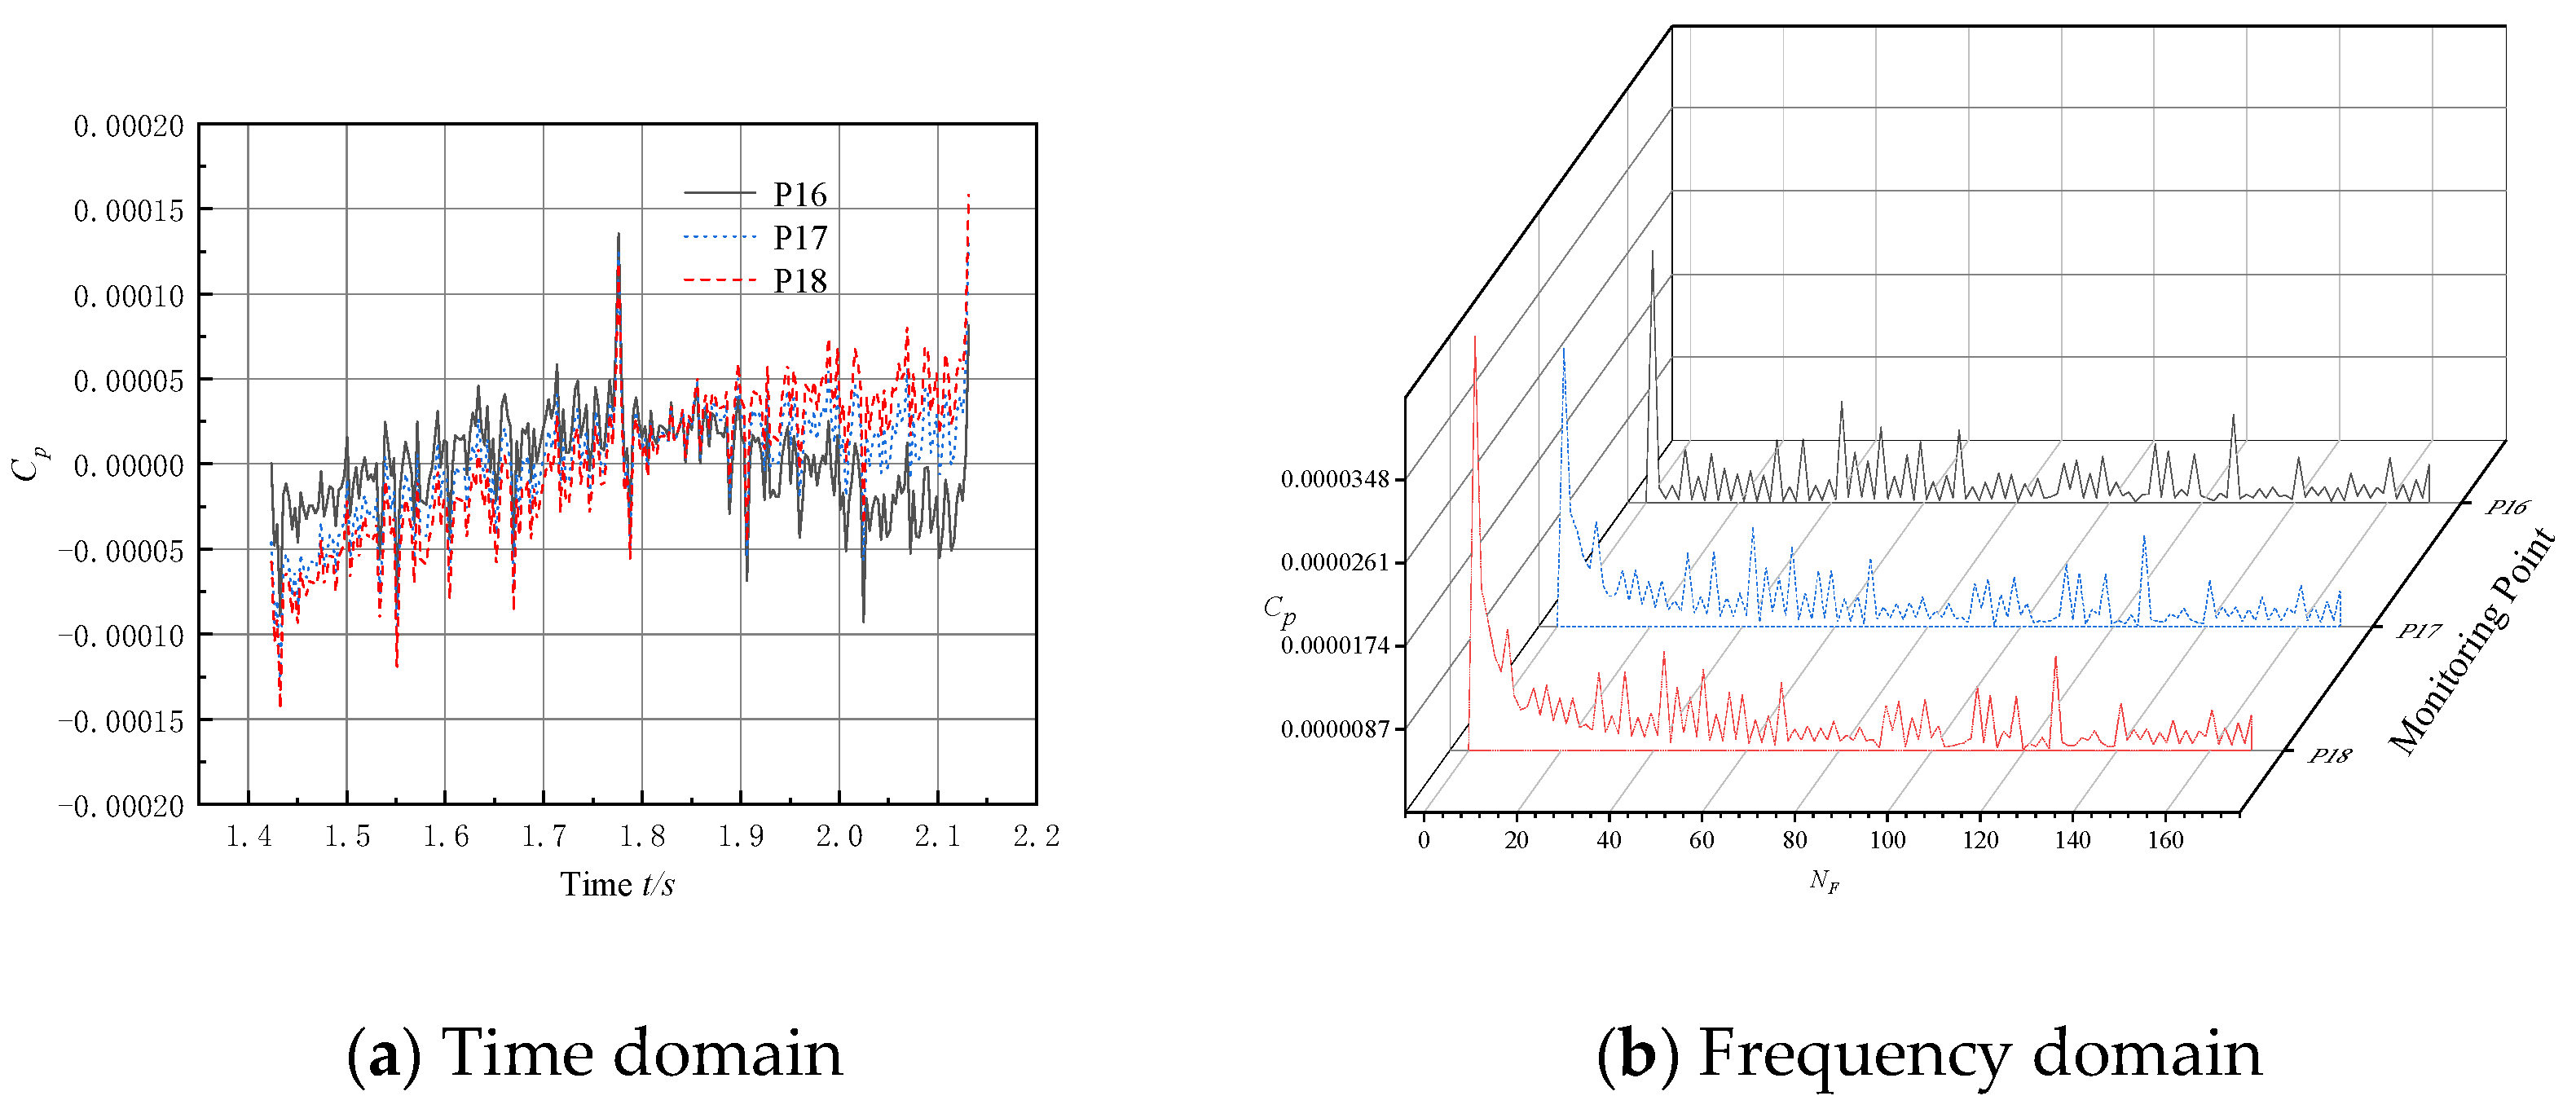
Fast Fourier Transform analysis was performed on the data from the pressure pulsation monitoring points in the bulb body section to obtain the corresponding time domain and frequency domain plots, as shown in Figure 9, Figure 10 and Figure 11.
Examining the time-domain plot displayed in Figure 9 reveals that at an operating condition of 0.9 Qd, the presence of a clear periodic pattern within the bulb body section is not readily discernible. The overall amplitude fluctuations at the three monitoring points exhibit a heightened level of disorder. Notably, monitoring point p10, situated closer to the bulb body’s center, displays larger positive and negative amplitudes in comparison to p11 and p12. It is evident that, as the monitoring points approach the bulb body’s periphery, the amplitude fluctuations diminish.
Turning to the frequency domain plot in Figure 9, it is apparent that the low-frequency pulsations at monitoring points p10–p12 showcase significant amplitudes, highlighting the dominance of low-frequency pulsations. The main frequency amplitudes at the three monitoring points exhibit similarity. In contrast to the pressure pulsation amplitudes observed in the pump section, the amplitudes in the bulb body section are notably reduced. This reduction can be attributed to the supportive components within the bulb body enhancing flow dynamics, consequently leading to a decrease in pressure pulsation intensity at the monitoring points.
An analysis of Figure 10’s time domain plot reveals that at an operating condition of 1.0 Qd, the bulb body section displays a discernible periodic pattern, presenting a sinusoidal waveform. Within two impeller rotation cycles, monitoring points p10–p12 exhibit a total of six peaks and six valleys. Monitoring point p10, positioned closer to the bulb body’s center, demonstrates slightly larger fluctuations in pressure pulsation amplitudes compared to the other monitoring points. Furthermore, positive and negative amplitude values at all three monitoring points are more uniformly distributed and reduced when compared to the low-flow operating condition.
Upon examination of the frequency domain plot in Figure 10, it becomes evident that the rotational frequency of the impeller and its harmonics at the three monitoring points displays significant amplitudes. Notably, all three monitoring points reach their maximum amplitudes at the third harmonic frequency. Among these points, the monitoring point located nearer to the bulb body’s edge exhibits a greater maximum amplitude. Meanwhile, the disparity between the maximum amplitudes at monitoring points p11 and p10 is negligible. Furthermore, under the designed flow rate operating condition, the main frequency amplitudes at all three monitoring points are notably reduced compared to the low-flow operating condition.
According to the time-domain plot displayed in Figure 11, it is evident that at an operating condition of 1.1 Qd, the bulb body section lacks a clear periodic pattern and exhibits a more chaotic amplitude distribution. Furthermore, negative amplitude values at all three monitoring points display further increments under high-flow operating conditions, with no positive amplitude values present. The amplitude fluctuations also show an upward trend, indicating a potential issue.
Meanwhile, the frequency-domain plot in Figure 11 indicates relatively large amplitudes of low-frequency pulsations at the three monitoring points, p10–p12, signifying their dominance in the system. Additionally, the main frequency amplitudes are comparable across all three monitoring points. However, compared to the designed flow rate operating condition, the low-frequency pulsations are substantially larger, hinting at a potential problem. Overall, the pressure pulsation distribution appears satisfactory under the designed flow rate operating condition.
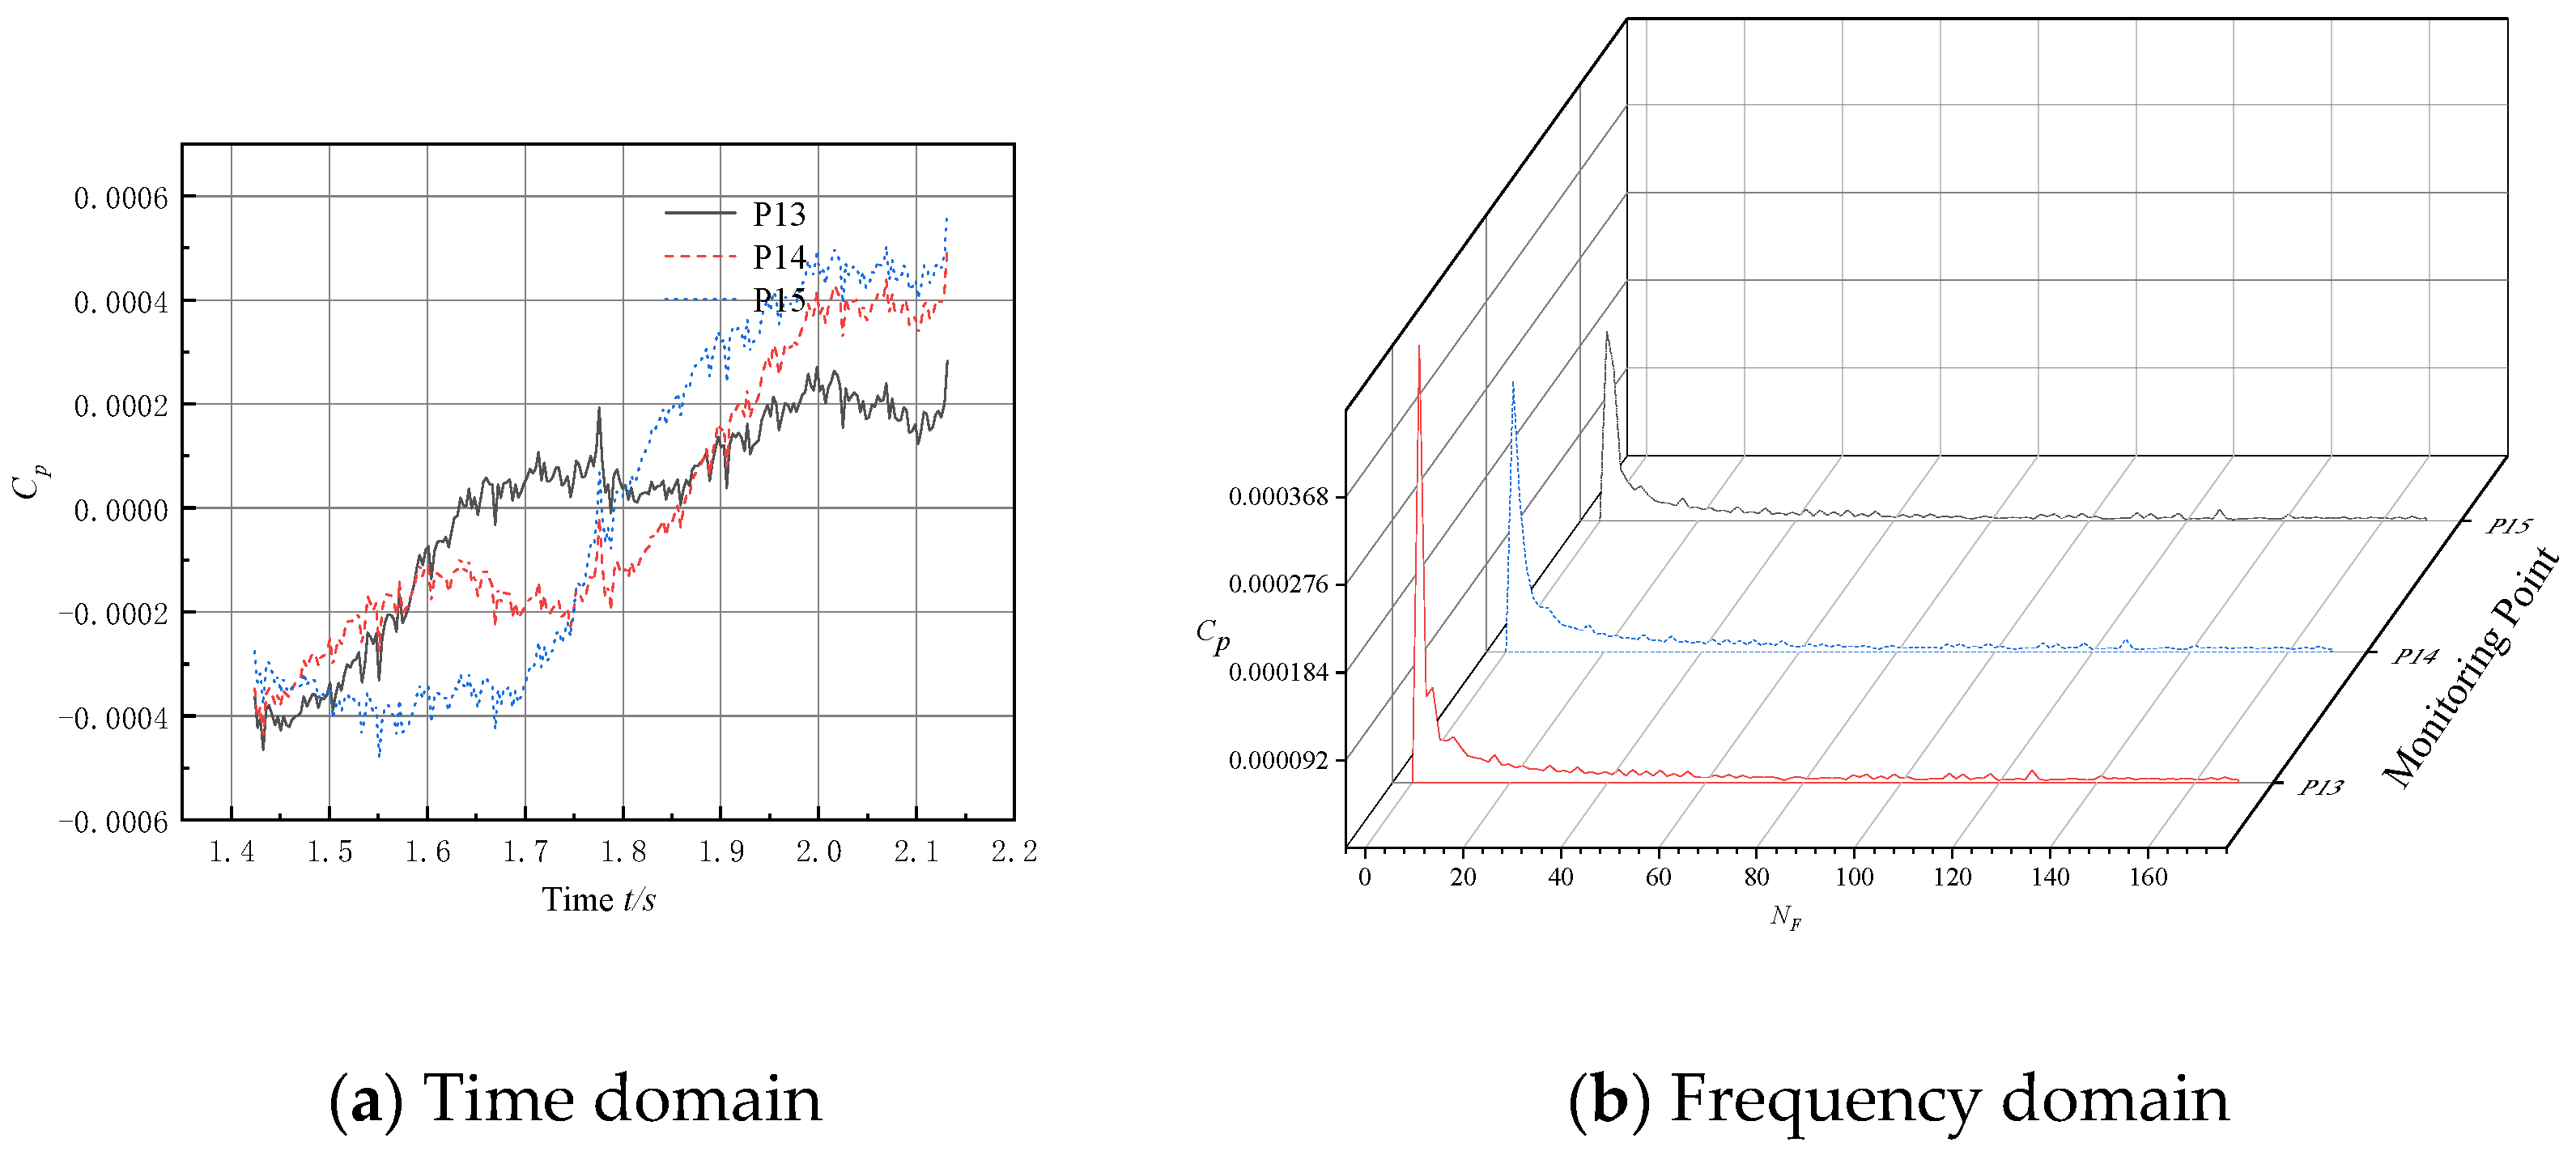
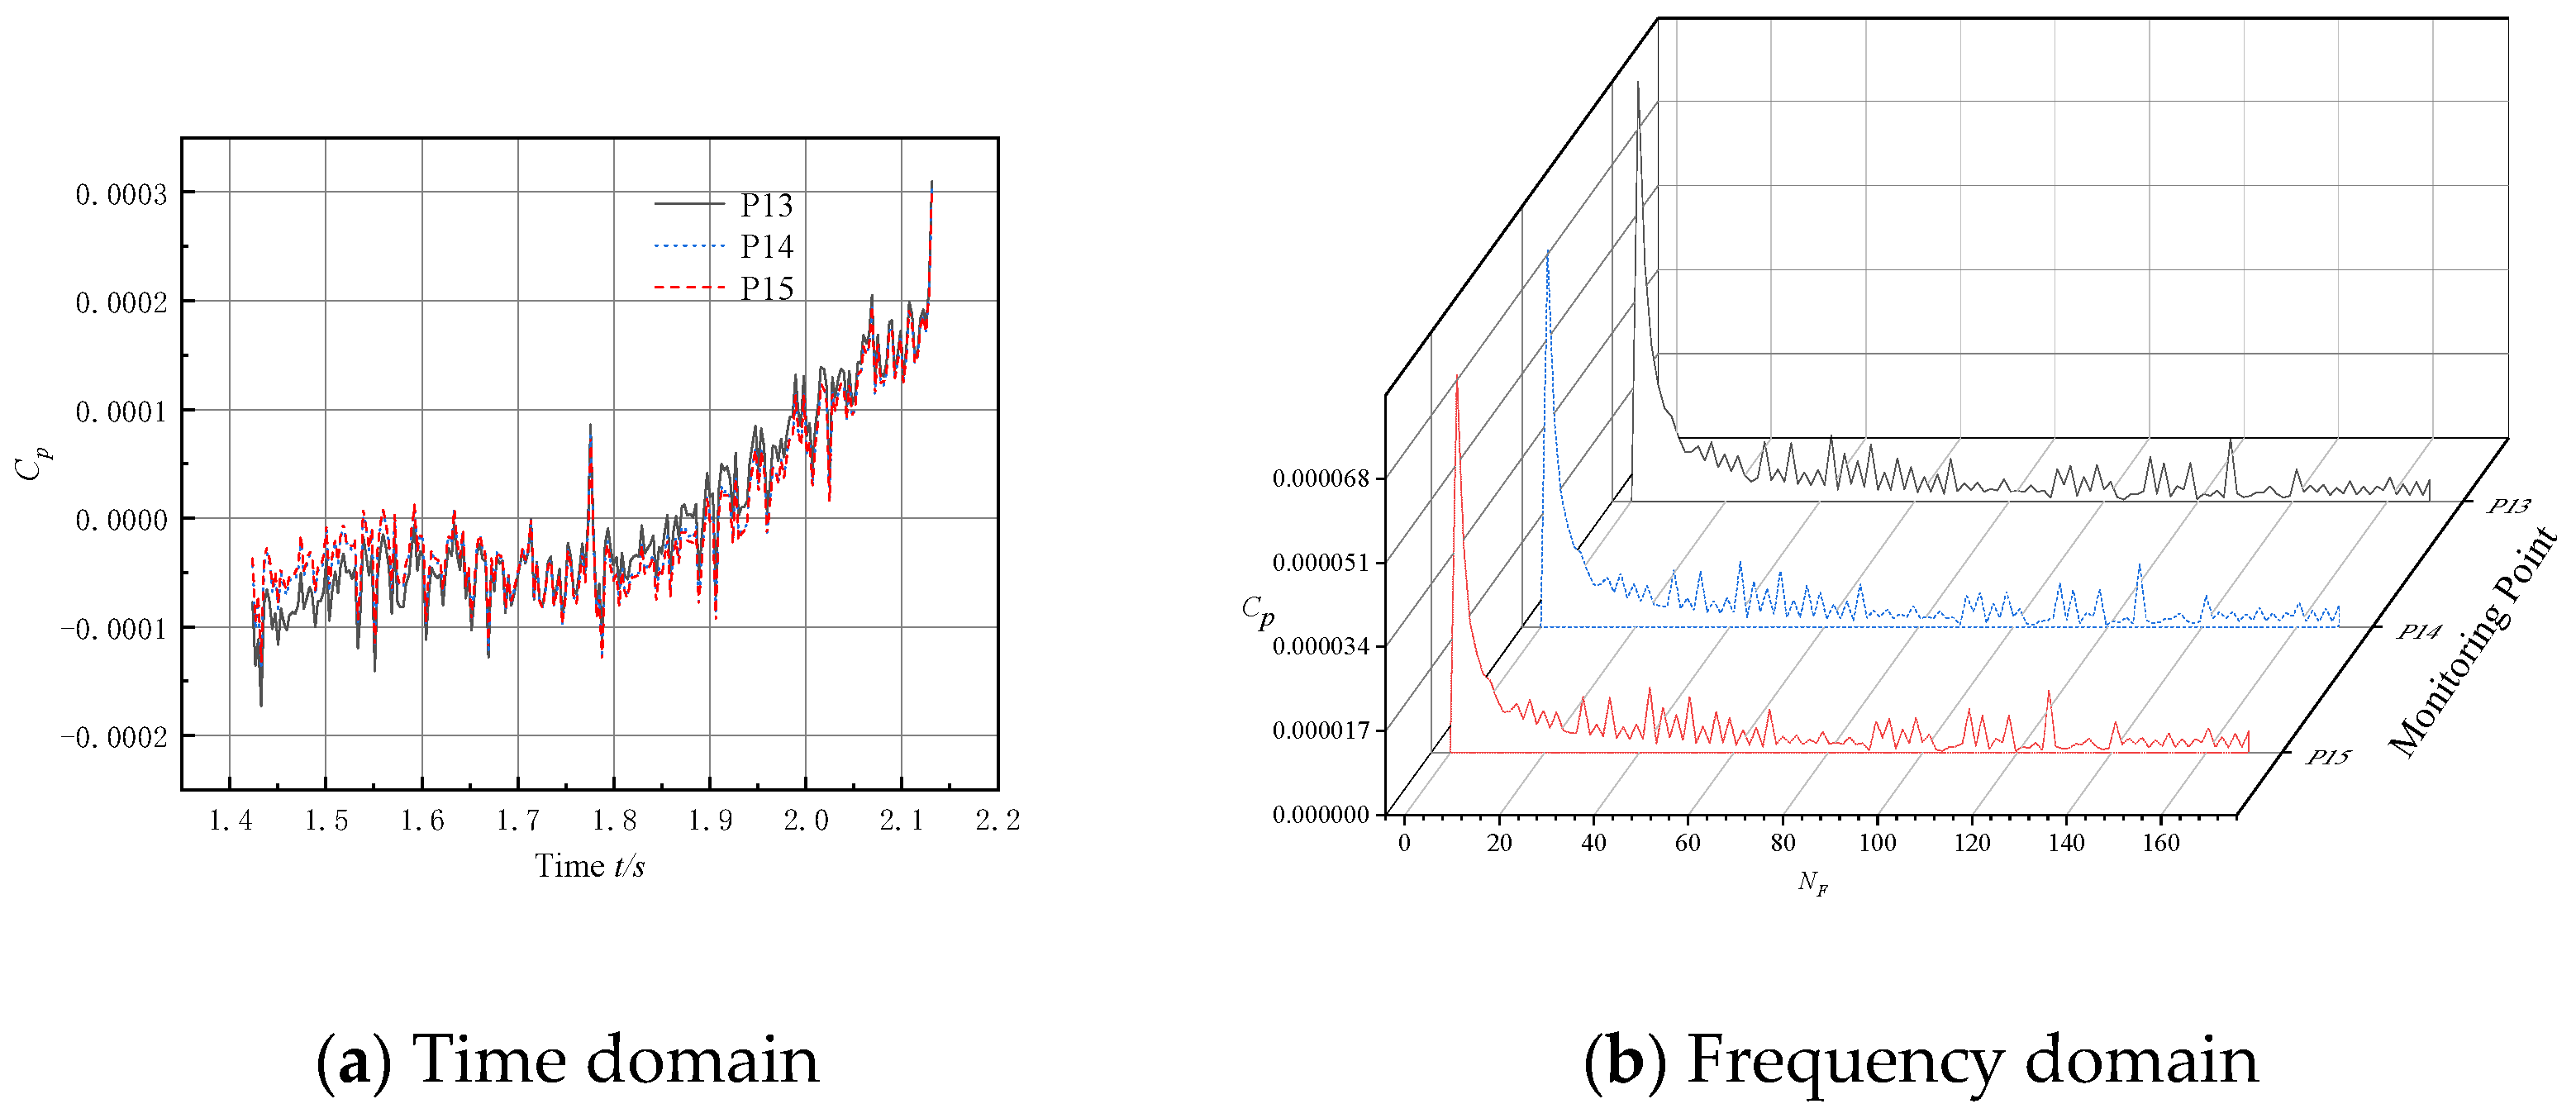
The data from the pressure pulsation monitoring points in the middle section of the bulb body of the submersible mixed-flow pump device were exported and subjected to Fast Fourier Transform analysis, resulting in corresponding time domain plots and frequency domain plots for each monitoring point, as shown in Figure 12, Figure 13 and Figure 14.
Figure 12 reveals that at an operating condition of 0.9 Qd, the bulb body’s middle section does not display a distinct periodic pattern, and the amplitude fluctuations at the three monitoring points appear to be comparatively chaotic. Notably, monitoring point p13, positioned closer to the bulb body’s center, exhibits slightly smaller amplitude fluctuations in comparison to monitoring points p14 and p15.
Examining the frequency-domain plot in Figure 12, it becomes apparent that the three monitoring points—p13, p14, and p15—demonstrate relatively significant low-frequency pulsation amplitudes, suggesting the prevalence of low-frequency pulsations. Among these points, monitoring point p15 exhibits the highest amplitude of low-frequency pulsations. Moreover, the main frequency amplitudes at the three monitoring points show a general similarity.
From the time domain plot in Figure 13, it can be seen that under the operating condition of 1.0 Qd, the middle section of the bulb body does not exhibit a clear periodic pattern, and the overall amplitude fluctuations at the three monitoring points are relatively chaotic, with similar amplitudes. Compared to the low-flow operating condition, the overall range of amplitudes under the design flow rate operating condition is slightly reduced.
From the frequency domain plot in Figure 13, it can be seen that the low-frequency pulsations at the three monitoring points, p13–p15, have relatively large amplitudes, indicating that low-frequency pulsations dominate. Among them, monitoring point p15 has the largest amplitude of low-frequency pulsations. Overall, the main frequency amplitudes at the three monitoring points do not differ significantly. Compared to the low-flow operating condition, there is a decreasing trend in amplitude under the design flow rate operating condition.
Through an analysis of the time domain plot in Figure 14, it is observable that the bulb body’s central segment does not display a distinct periodic pattern under the operational setting of 1.1 Qd, causing relatively disordered amplitude fluctuations at the three monitoring sites with comparable magnitudes.
From the frequency-domain plot in Figure 14, it can be seen that the low-frequency pulsations at the three monitoring points, p13–p15, have relatively large amplitudes, indicating that low-frequency pulsations dominate. Overall, the main frequency amplitudes at the three monitoring points do not differ significantly. Compared to the design flow rate operating condition, the low-frequency pulsation amplitudes are relatively larger under the high-flow condition.
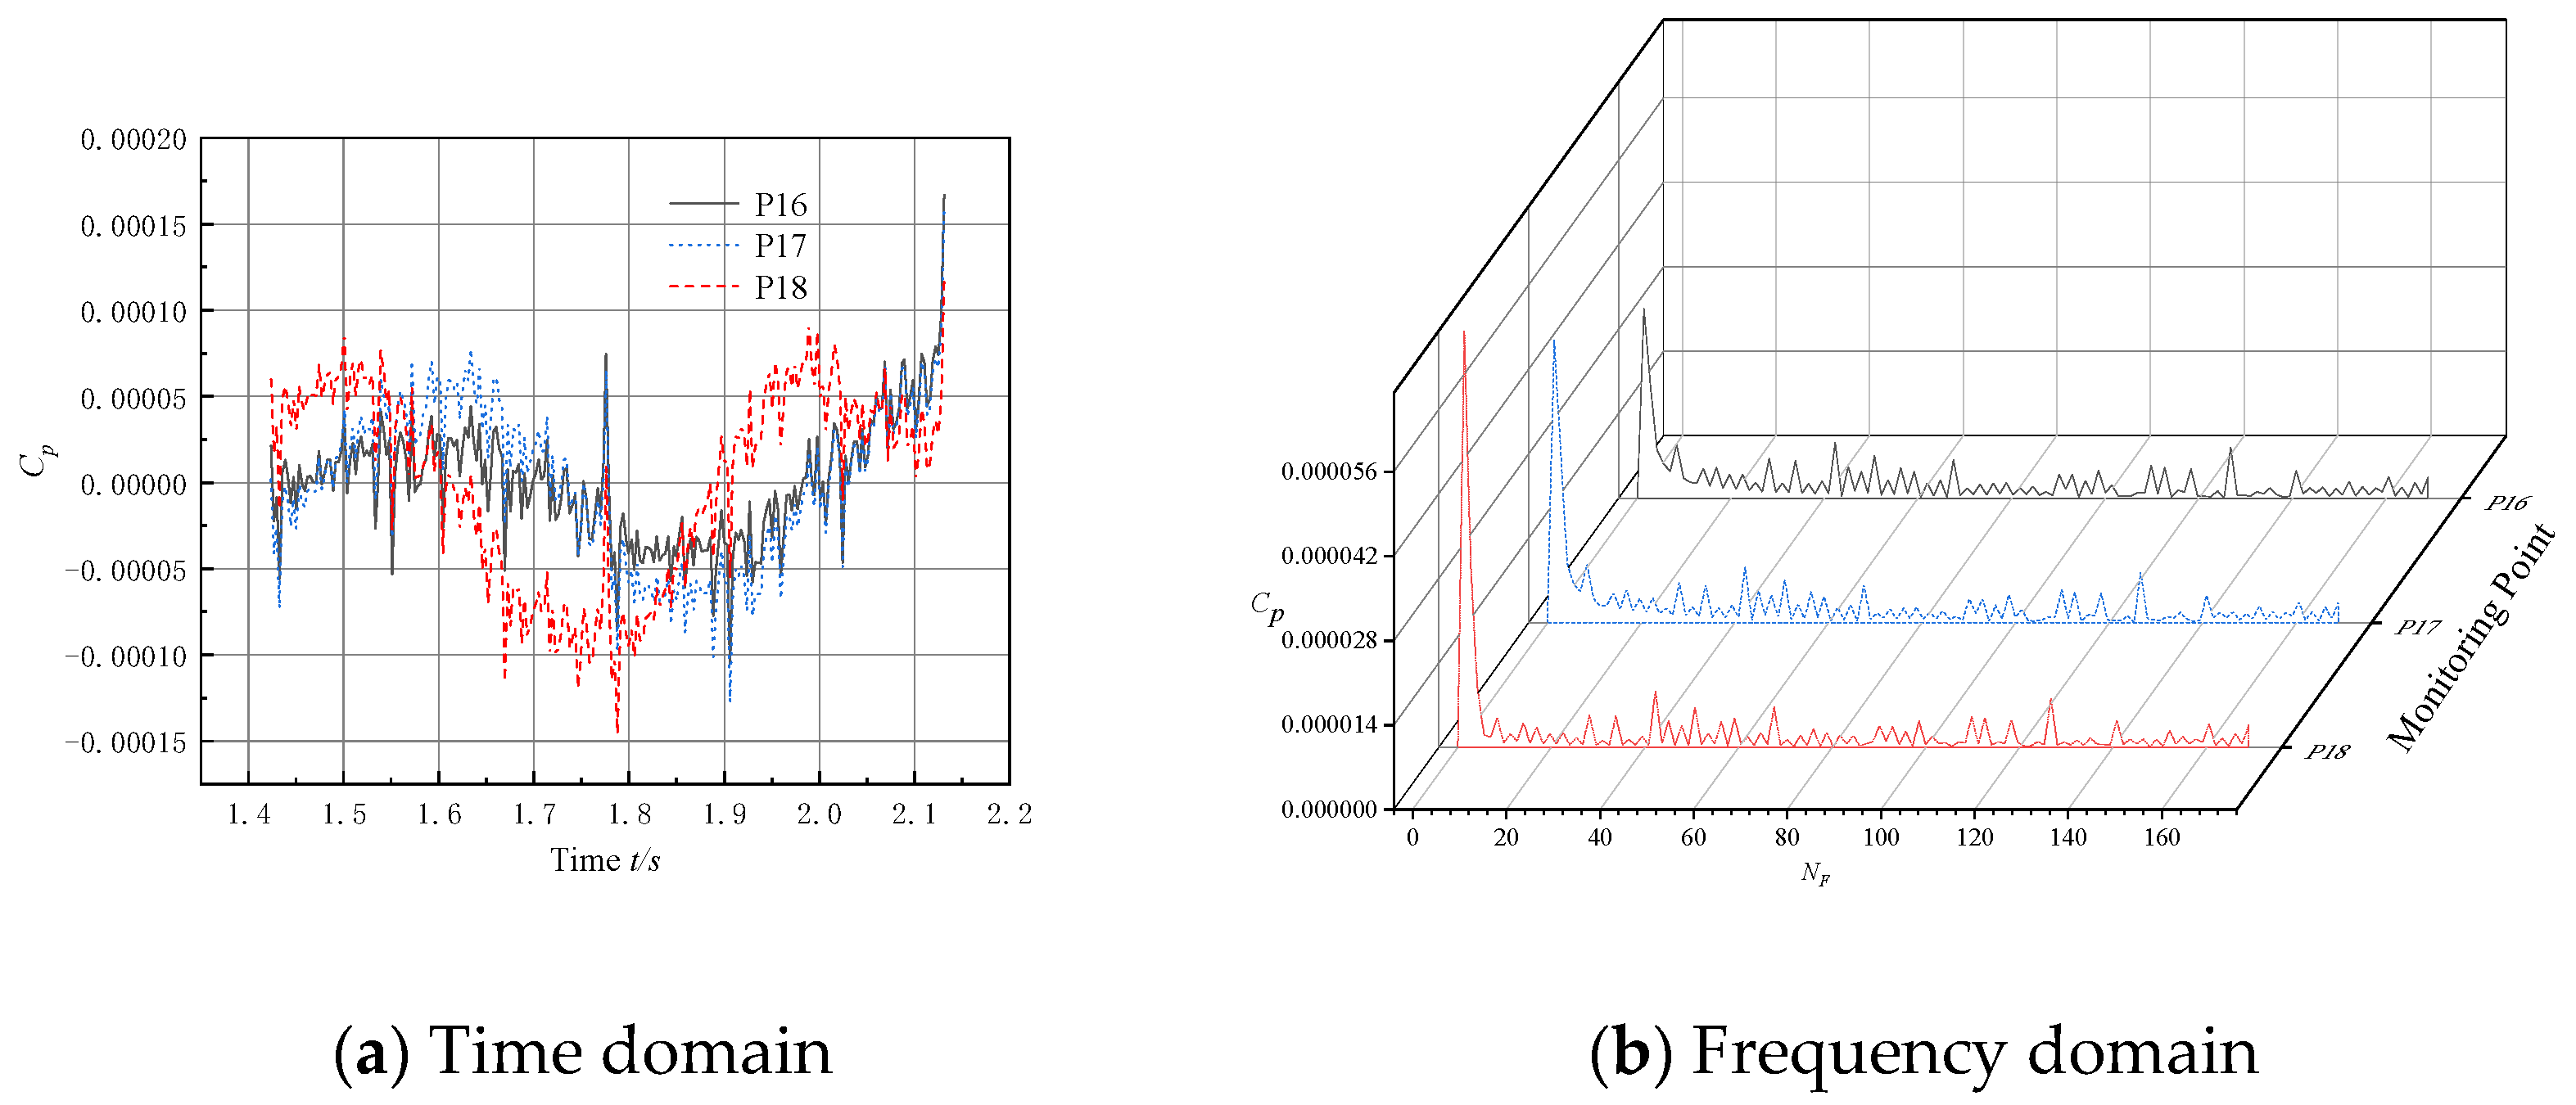
Fast Fourier Transform analysis was performed on the data of the pulsation monitoring points at the outlet section, and the corresponding time domain and frequency domain plots of each monitoring point were obtained as shown in Figure 15, Figure 16 and Figure 17.
From the time-domain plot in Figure 15, it can be seen that under the operating condition of 0.9 Qd, the outlet section of the bulb body does not exhibit a clear periodic pattern, and the overall amplitude fluctuations at the three monitoring points are relatively chaotic. Monitoring point p18 is located near the edge of the bulb body, and its amplitude fluctuation is slightly larger than that of monitoring points p16 and p17.
From the frequency-domain plot in Figure 15, it can be seen that the low-frequency pulsations at the three monitoring points, p16–p18, have relatively large amplitudes, indicating that low-frequency pulsations dominate. Monitoring point p18, located near the edge of the bulb body, has the largest amplitude of low-frequency pulsations and the smallest main frequency amplitude. Compared to the inlet and middle sections of the bulb body, the pressure pulsation amplitude is further reduced at the outlet section.
Based on the time-domain plot depicted in Figure 16, it is evident that, at the operating condition of 1.0 Qd, the outlet section of the bulb body lacks a distinct periodic pattern. The overall amplitude fluctuations at the three monitoring points exhibit relative irregularity. Notably, in comparison to the low-flow operating condition, there is a decreasing trend in the range of pressure pulsation amplitude fluctuations.
Furthermore, the frequency-domain plot in Figure 16 reveals that both monitoring points, p16 and p17, showcase notable amplitudes of low-frequency pulsations, signifying the prevalence of low-frequency pulsations. The pressure pulsation distribution at the three monitoring points appears more intricate. However, in contrast to the low-flow operating condition, there are no significant alterations in the main frequency amplitude at the three monitoring points.
Figure 17 presents the time-domain plot, revealing that at the operating condition of 1.1 Qd, the outlet section of the bulb body does not demonstrate a distinct periodic pattern. The amplitude fluctuations at the three monitoring points appear relatively disordered. Additionally, there is a decreasing trend in the range of pressure pulsation amplitude fluctuations when compared to the inlet section of the bulb body.
Furthermore, the frequency-domain plot in Figure 17 illustrates that the low-frequency pulsations at the three monitoring points exhibit relatively large amplitudes, indicating the dominance of low-frequency pulsations. Notably, compared to the design flow rate operating condition, the low-frequency pulsation amplitudes at the three monitoring points are notably higher.

6. Summary

In conclusion, this manuscript details a study on the pressure pulsation distribution characteristics of a submersible tubular pump. Based on the test results, the distribution characteristics of pressure pulsation under different flow conditions are obtained, providing theoretical support for optimization and improvement measures for each section of the bulb body.
(1)
The intensity of the pressure pulsation at the monitoring point on the bulb body is significantly lower compared to the pump section, while the amplitude of the pressure pulsation at the outlet section of the bulb body is significantly lower than that at the inlet section. It is shown that the bulb body support improves the flow field structure and reduces the pressure pulsation intensity of the fluid, thus validating the need to install bulb body components in submersible tubular pumps.
(2)
The simulation results of efficiency and head, based on six selected operating conditions, are in good agreement with the experimental model results, indicating the accuracy of numerical simulation on the submersible tubular pump. It is necessary and credible to predict the pump’s external characteristics and internal flow in advance of the pump design process.
(3)
The peaks of the two efficiency curves are located near the rated flow condition (1.0 Qd), which indicates that the performance curve of this pump is very good and is exactly as expected. It is shown that the scaling effect of the experimental model of the pump does not affect the change law of the pump’s external characteristics, despite the 7.67-fold reduction.

Author Contributions

Conceptualization, J.W. and J.Z.; methodology, Z.C.; software, S.L., W.C., X.W. and H.W.; writing—original draft preparation, L.L.; writing—review and editing, C.W.; visualization, K.T. and Q.H. All authors have read and agreed to the published version of the manuscript.

Funding

This research was funded by the China Postdoctoral Science Foundation (No. 2023M732828), the Science and Technology Program of Jiangxi Education Department (GJJ2209004), the Jiujiang Technological Project (S2022QNZZ075), the National Natural Science Foundation of China (No. 52009013) and the Open Research Foundation of the GongQing Institute of Science and Technology.

Data Availability Statement

Data are contained within the article.

Conflicts of Interest

The authors declare no conflicts of interest.

References

  1. Qin, L.; Yan, W. A fluid mechanical design based on CFD method. J. Heilongjiang Inst. Technol. 2021, 35, 28–32. [Google Scholar]
  2. Jiang, D.; Yang, F.; Lu, M.; Tang, F.; LYU, Y. Numerical and experimental analysis of flow and hydraulic noise in conduit of a vertical axial-flow pump device. J. Drain. Irrig. Mach. Eng. 2023, 41, 1007–1014. [Google Scholar]
  3. Ai, Y.; Mao, Y.; Liu, Y.; Tan, X.; Su, S. Simulation optimization and experiment for low flow-resistance mixed-flow pump of artesian water circulation system in marine ship. J. Drain. Irrig. Mach. Eng. 2023, 41, 999–1006. [Google Scholar]
  4. Gu, Y.; Sun, H.; Wang, C.; Lu, R.; Liu, B.; Ge, J. Effect of trimmed rear shroud on performance and axial thrust of multi-stage centrifugal pump with emphasis on visualizing flow losses. J. Fluids Eng. 2024, 146, 011204. [Google Scholar] [CrossRef]
  5. Wang, Y.; Xiong, W.; Ding, Z.; Pi, Q.; Yuan, X.; Liu, H.; Li, M. Analysis of water hammer characteristics in pressurized pipeline based on CFD. J. Drain. Irrig. Mach. Eng. 2023, 41, 1156–1162. [Google Scholar]
  6. Jiang, X.; Zeng, J.; Huang, H. Application and Development of CFD Technology in Fluid Machinery. Light Ind. Mach. 2014, 32, 108–111. [Google Scholar]
  7. Zhang, X.; Liu, C.; Rong, Y.; Feng, X.; Fu, T.; Sun, Y. Numerical simulation and experimental verification of forward feed array diaphragm rectifier for multi-unit pumping station. J. Drain. Irrig. Mach. Eng. 2022, 41, 378–384. [Google Scholar]
  8. Zhang, R.; Zhu, F.; Liu, X.; Liang, Y. Performances and control mode for bulb tublar pumps with VFDs. J. Drain. Irrig. Mach. Eng. 2022, 40, 136–143. [Google Scholar]
  9. Liu, H.; Ding, J. Numerical simulation of hydraulic performance and flow pattern of low-lift bulb tubular pump. Yangtze River 2017, 48, 97–100. [Google Scholar]
  10. Dai, J.; Dai, Q.; Wang, J. Effect of Diffuser Blade Position on Hydraulic Performance of Bulb Tubular Pump. Water Resour. Power 2017, 35, 168–171. [Google Scholar]
  11. Dai, J.; Dai, Q.; Liang, H.; Wang, W.; Li, H.; Guo, Z. Numerical simulation of saddle interval of post-positional bulb tubular pump. Yangtze River 2017, 48, 83–88. [Google Scholar]
  12. Jin, Y.; Liang, H.; Liu, C.; Zhou, J. Numerical simulation of the internal flow of prepositive bulb tubular pumping system. J. Yangzhou Univ. Nat. Sci. Ed. 2013, 16, 71–74. [Google Scholar]
  13. Dai, Q.; Liang, H.; Meng, X.; Wang, W. Study on the optimization of bulb tubular pump system in Huaian 3rd station. Jiangsu Water Resour. 2016, 38–41+53. [Google Scholar]
  14. Liang, H.; Dai, Q.; Hua, X.; Wang, H. Optimization design and experimental research on low-speed high-efficiency tubular pump. Yangtze River 2018, 49, 84–89. [Google Scholar]
  15. Vasel-Be-Hagh, A.R.; Carriveau, R.; Ting, D.S.-K. A balloon bursting underwater. J. Fluid Mech. 2015, 769, 522–540. [Google Scholar] [CrossRef]
  16. Wang, X.; Zhai, L.; Tang, F.; Shi, L.; Sun, Z.; Zhang, W.; Liu, H. Influence of different guide vane parameters on hydraulic performance of box-culvert axial-flow pump. J. Drain. Irrig. Mach. Eng. 2022, 27, 440–446. [Google Scholar]
  17. Chen, Y.; Tang, F.; Zhang, X.; Wang, L.; Liu, Y.; Dai, J.; Wang, H. Modification and experimental verification of guide vanes hydraulic model for large vertical axial-flow pumps. J. Drain. Irrig. Mach. Eng. 2023, 41, 655–662. [Google Scholar]
  18. Dijksman, J.F. Hydrodynamics of small tubular pumps. J. Fluid Mech. 1984, 139, 173–191. [Google Scholar] [CrossRef]
  19. Wang, W.; Dai, Y.; Tan, X.; Wu, D.; Wang, L.; Chen, D. Unsteady flow and vibration characteristics in micro high-speed fuel pump. J. Drain. Irrig. Mach. Eng. 2023, 41, 1096–1103. [Google Scholar]
  20. Liu, C. Researches and Developments of Axial-flow Pump System. Trans. Chin. Soc. Agric. Mach. 2015, 46, 49–59. [Google Scholar]
  21. Zhang, R.; Zhang, J.; Guo, G. Influence of blade shape of liquid-ring pump on inlet reverse flow and its hydraulic characteristics. J. Drain. Irrig. Mach. Eng. 2023, 41, 865–872. [Google Scholar]
  22. Li, Y.; You, X.; Xu, H.; Zheng, F. Optimization design of compound impeller based on orthogonal experiment. J. Drain. Irrig. Mach. 2023, 41, 556–561. [Google Scholar]
  23. Zhang, R.; Chen, H. Numerical simulation and flow diagnosis of axial-flow pump at part-load condition. Int. J. Turbo Jet-Engines 2012, 29, 1–7. [Google Scholar]
  24. Kim, J.H.; Ahn, H.J.; Kim, K.Y. High-efficiency design of a mixed-flow pump. Sci. China Ser. E Technol. Sci. 2010, 53, 24–27. [Google Scholar] [CrossRef]
Figure 1. Schematic diagram of the computational domain.
Water 16 00789 g001
Figure 2. Schematic diagram of overcurrent component grids.
Water 16 00789 g002
Figure 3. Variation curve of the number of grids and the efficiency of the pumping unit.
Water 16 00789 g003
Figure 4. Schematic diagram of the test bench.
Water 16 00789 g004
Figure 5. Model test components diagram (a) Impeller Model and (b) Guide Vane Model.
Water 16 00789 g005
Figure 6. Schematic diagram of pressure measurement section.
Water 16 00789 g006
Figure 7. Efficiency head curve.
Water 16 00789 g007
Figure 8. Arrangement of pressure pulsation monitoring points.
Water 16 00789 g008
Figure 9. Pressure pulsation distribution in inlet section of 0.9 Qd bulb body.
Water 16 00789 g009
Figure 10. Pressure pulsation distribution in inlet section of 1.0 Qd bulb body.
Water 16 00789 g010
Figure 11. Pressure pulsation distribution in inlet section of 1.1 Qd bulb body.
Water 16 00789 g011
Figure 12. Pressure pulsation distribution in middle section of 0.9 Qd bulb body.
Water 16 00789 g012
Figure 13. Pressure pulsation distribution in middle section of 1.0 Qd bulb body.
Water 16 00789 g013
Figure 14. Pressure pulsation distribution in middle section of 1.1 Qd bulb body.
Water 16 00789 g014
Figure 15. Pressure pulsation distribution in outlet section of 0.9 Qd bulb body.
Water 16 00789 g015
Figure 16. Pressure pulsation distribution in outlet section of 1.0 Qd bulb body.
Water 16 00789 g016
Figure 17. Pressure pulsation distribution in outlet section of 1.1 Qd bulb body.
Water 16 00789 g017
Table 1. Number of grids for each overcurrent component.
Inlet Runner GridImpellerGuide VaneBulb BodyOutflow Runner
693,9521,422,2521,366,5601,151,179506,016
Table 2. List of major instrumentation.
Measurement ItemsMeasuring Instruments
Equipment Name
ModelScope of WorkCalibration AccuracyCalibration Time
HeadDifferential Pressure TransmitterEJA110A0~200 kPa±0.1%10 August 2020
Flow rateElectromagnetic flow meterE-mag DN400 mm±0.2%2 March 2021
Torque
Rotation speed
Rotational speed and Torque sensorJC2C200 N·m±0.1%8 August 2020
Digital torque speed
Algorithmic Indicator
TS-3200B
Cavitation marginAbsolute Pressure TransmitterEJA310A0~130 kPa±1%10 August 2020
Disclaimer/Publisher’s Note: The statements, opinions and data contained in all publications are solely those of the individual author(s) and contributor(s) and not of MDPI and/or the editor(s). MDPI and/or the editor(s) disclaim responsibility for any injury to people or property resulting from any ideas, methods, instructions or products referred to in the content.