Article

Comparison of Load Transfer Law of Pipe Pile between O-Cell Test and Traditional Static Load Test

1
Chaozhou Power Supply Bureau of Guangdong Power Grid Co., Ltd., Chaozhou 521051, China
2
Guangdong Tianxin Electric Power Engineering Testing Co., Ltd., Guangzhou 510663, China
*
Author to whom correspondence should be addressed.
Water 2024, 16(6), 826; https://doi.org/10.3390/w16060826
Submission received: 18 February 2024 / Revised: 1 March 2024 / Accepted: 6 March 2024 / Published: 12 March 2024
(This article belongs to the Special Issue Research Advances in Hydraulic Structure and Geotechnical Engineering)

Abstract

:
In recent years, the detection of offshore pile foundations has received wide attention in engineering. Compared with traditional methods, the O-cell test has unique advantages in offshore pile foundation detection. To study the load transfer characteristics of the O-cell method for pile testing in coastal soft soil foundation, this paper established the pile–soil numerical model to simulate the O-cell and traditional testing processes. The finite element method and equal displacement method are combined to calculate the conversion coefficient and ultimate bearing capacity, and the distribution forms of axial force, side friction resistance, and tip resistance are discussed. The research results show that the O-cell test method and the traditional method have different load transfer forms. By introducing the equal displacement method into the O-cell pile–soil model, the error between the equivalent conversion ultimate bearing capacity and the calculation result of the surcharge method is less than 0.5%, and the O-cell conversion coefficient can be accurately calculated.

1. Introduction

The sustainable development of offshore engineering has attracted great attention from various countries. The coastal pile foundation is also developing towards a large diameter, high bearing capacity, and deep water. Figure 1 shows the typical applications of pile foundations for offshore structures [1]. Soft clay with weak bearing capacity is widely distributed in many coastal areas of the world. The detection and bearing capacity judgment of pile foundation in marine soft soil are very important to the safety of engineering foundation [2].
Traditional static load test methods (including anchor pile method, surcharge method and anchor pile-surcharge method) are the most commonly used and reliable methods to check the bearing capacity of pile foundation, but they have disadvantages such as a high test cost, long test preparation time, and large quantity of works, and are also subject to constraints such as construction site and tonnage of test piles. Especially for offshore pile foundation detection, the site is special and the tonnage is large [3]. The O-cell test method has the advantages of low requirements for site conditions, wide applicability, short detection time, good safety, and low detection cost. At present, the O-cell test method has matured and is increasingly widely used in engineering [4,5,6,7,8,9]. However, due to the test principle of the O-cell test method, the results of the O-cell test need to be converted to the results of traditional static load test. Therefore, the accuracy of O-cell test results is greatly affected by the position of the equilibrium point, the conversion method, and the value of conversion coefficient. The position of the balance point is generally determined by engineering experience, and the value of the conversion coefficient is also affected by soil quality [10,11,12,13,14]. Many scholars have carried out some research on this issue. Through in situ test or indoor model test, the self-balancing test foundation piles are compared with the traditional static load test foundation piles. By comparing and analyzing the similarities and differences of the results of the two test methods, the reliability of the O-cell test method and the recommended values of the conversion coefficient in different soils are obtained [15,16,17,18]. With the development of computer technology, many scholars have studied the bearing characteristics of piles in O-cell test by numerical simulation O-cell test and traditional static load test from the perspective of computer simulation. By comparing and analyzing the results of two test methods, the recommended values of the conversion coefficient and the exact positions of equilibrium points for various soils are obtained [19,20,21,22]. However, the above research did not compare and verify the O-cell test and traditional methods, nor did it deeply analyze the transmission laws of side friction and tip resistance during the O-cell testing process.
In this paper, ABAQUS 6.14 finite element software is used to simulate the O-cell pile test and the traditional static load test, respectively. By reasonably determining the mechanical parameters of pile and soil and the interaction between pile and soil, the bearing characteristics of piles in the two types of pile test methods are compared and analyzed, the load transfer law of the pipe pile O-cell pile test method in marine soft soil foundation is studied, the equivalent conversion law is analyzed, and the accurate value range of the O-cell conversion coefficient is calculated, the finite element calculation method of O-cell test is established. The method in this paper can be used to calculate the in situ O-cell conversion coefficient and ultimate bearing capacity, which provides a theoretical guidance for the engineering application of O-cell test.

2. Test Principle of O-Cell Method

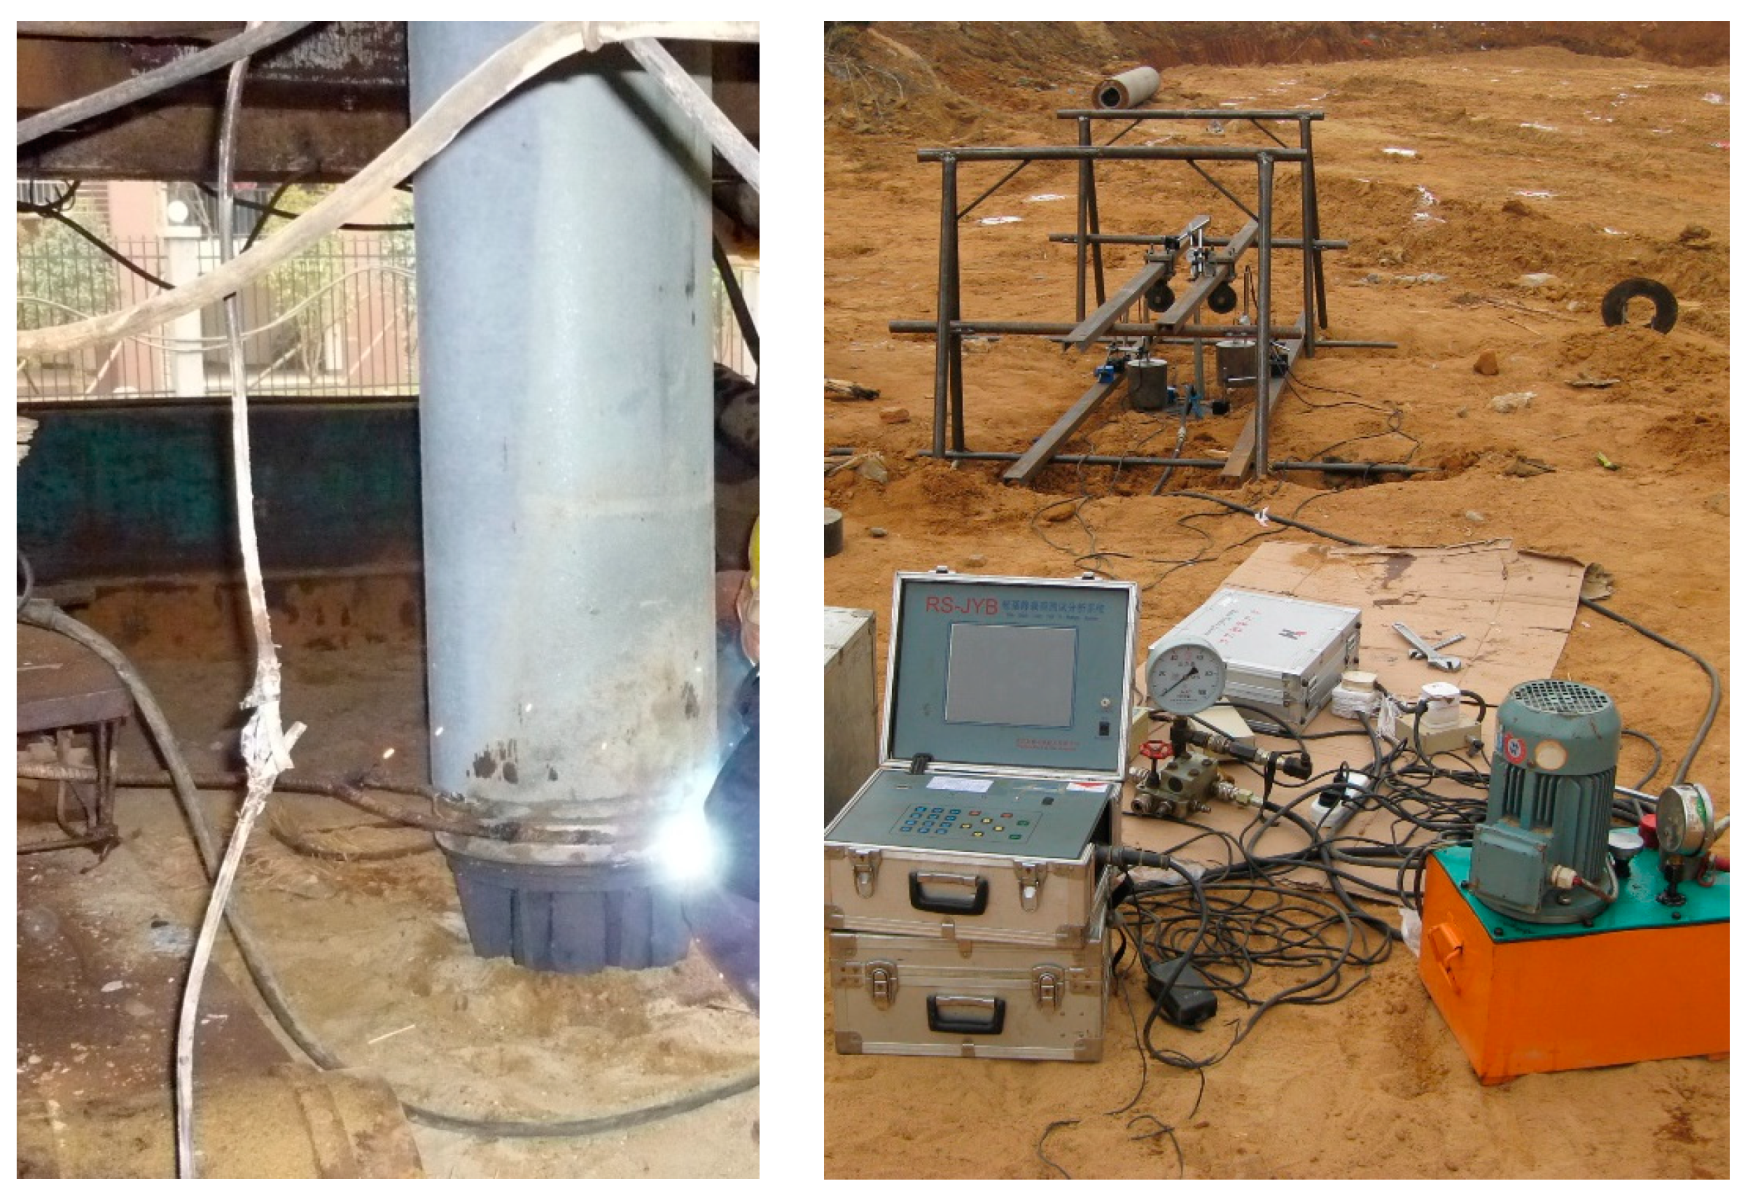
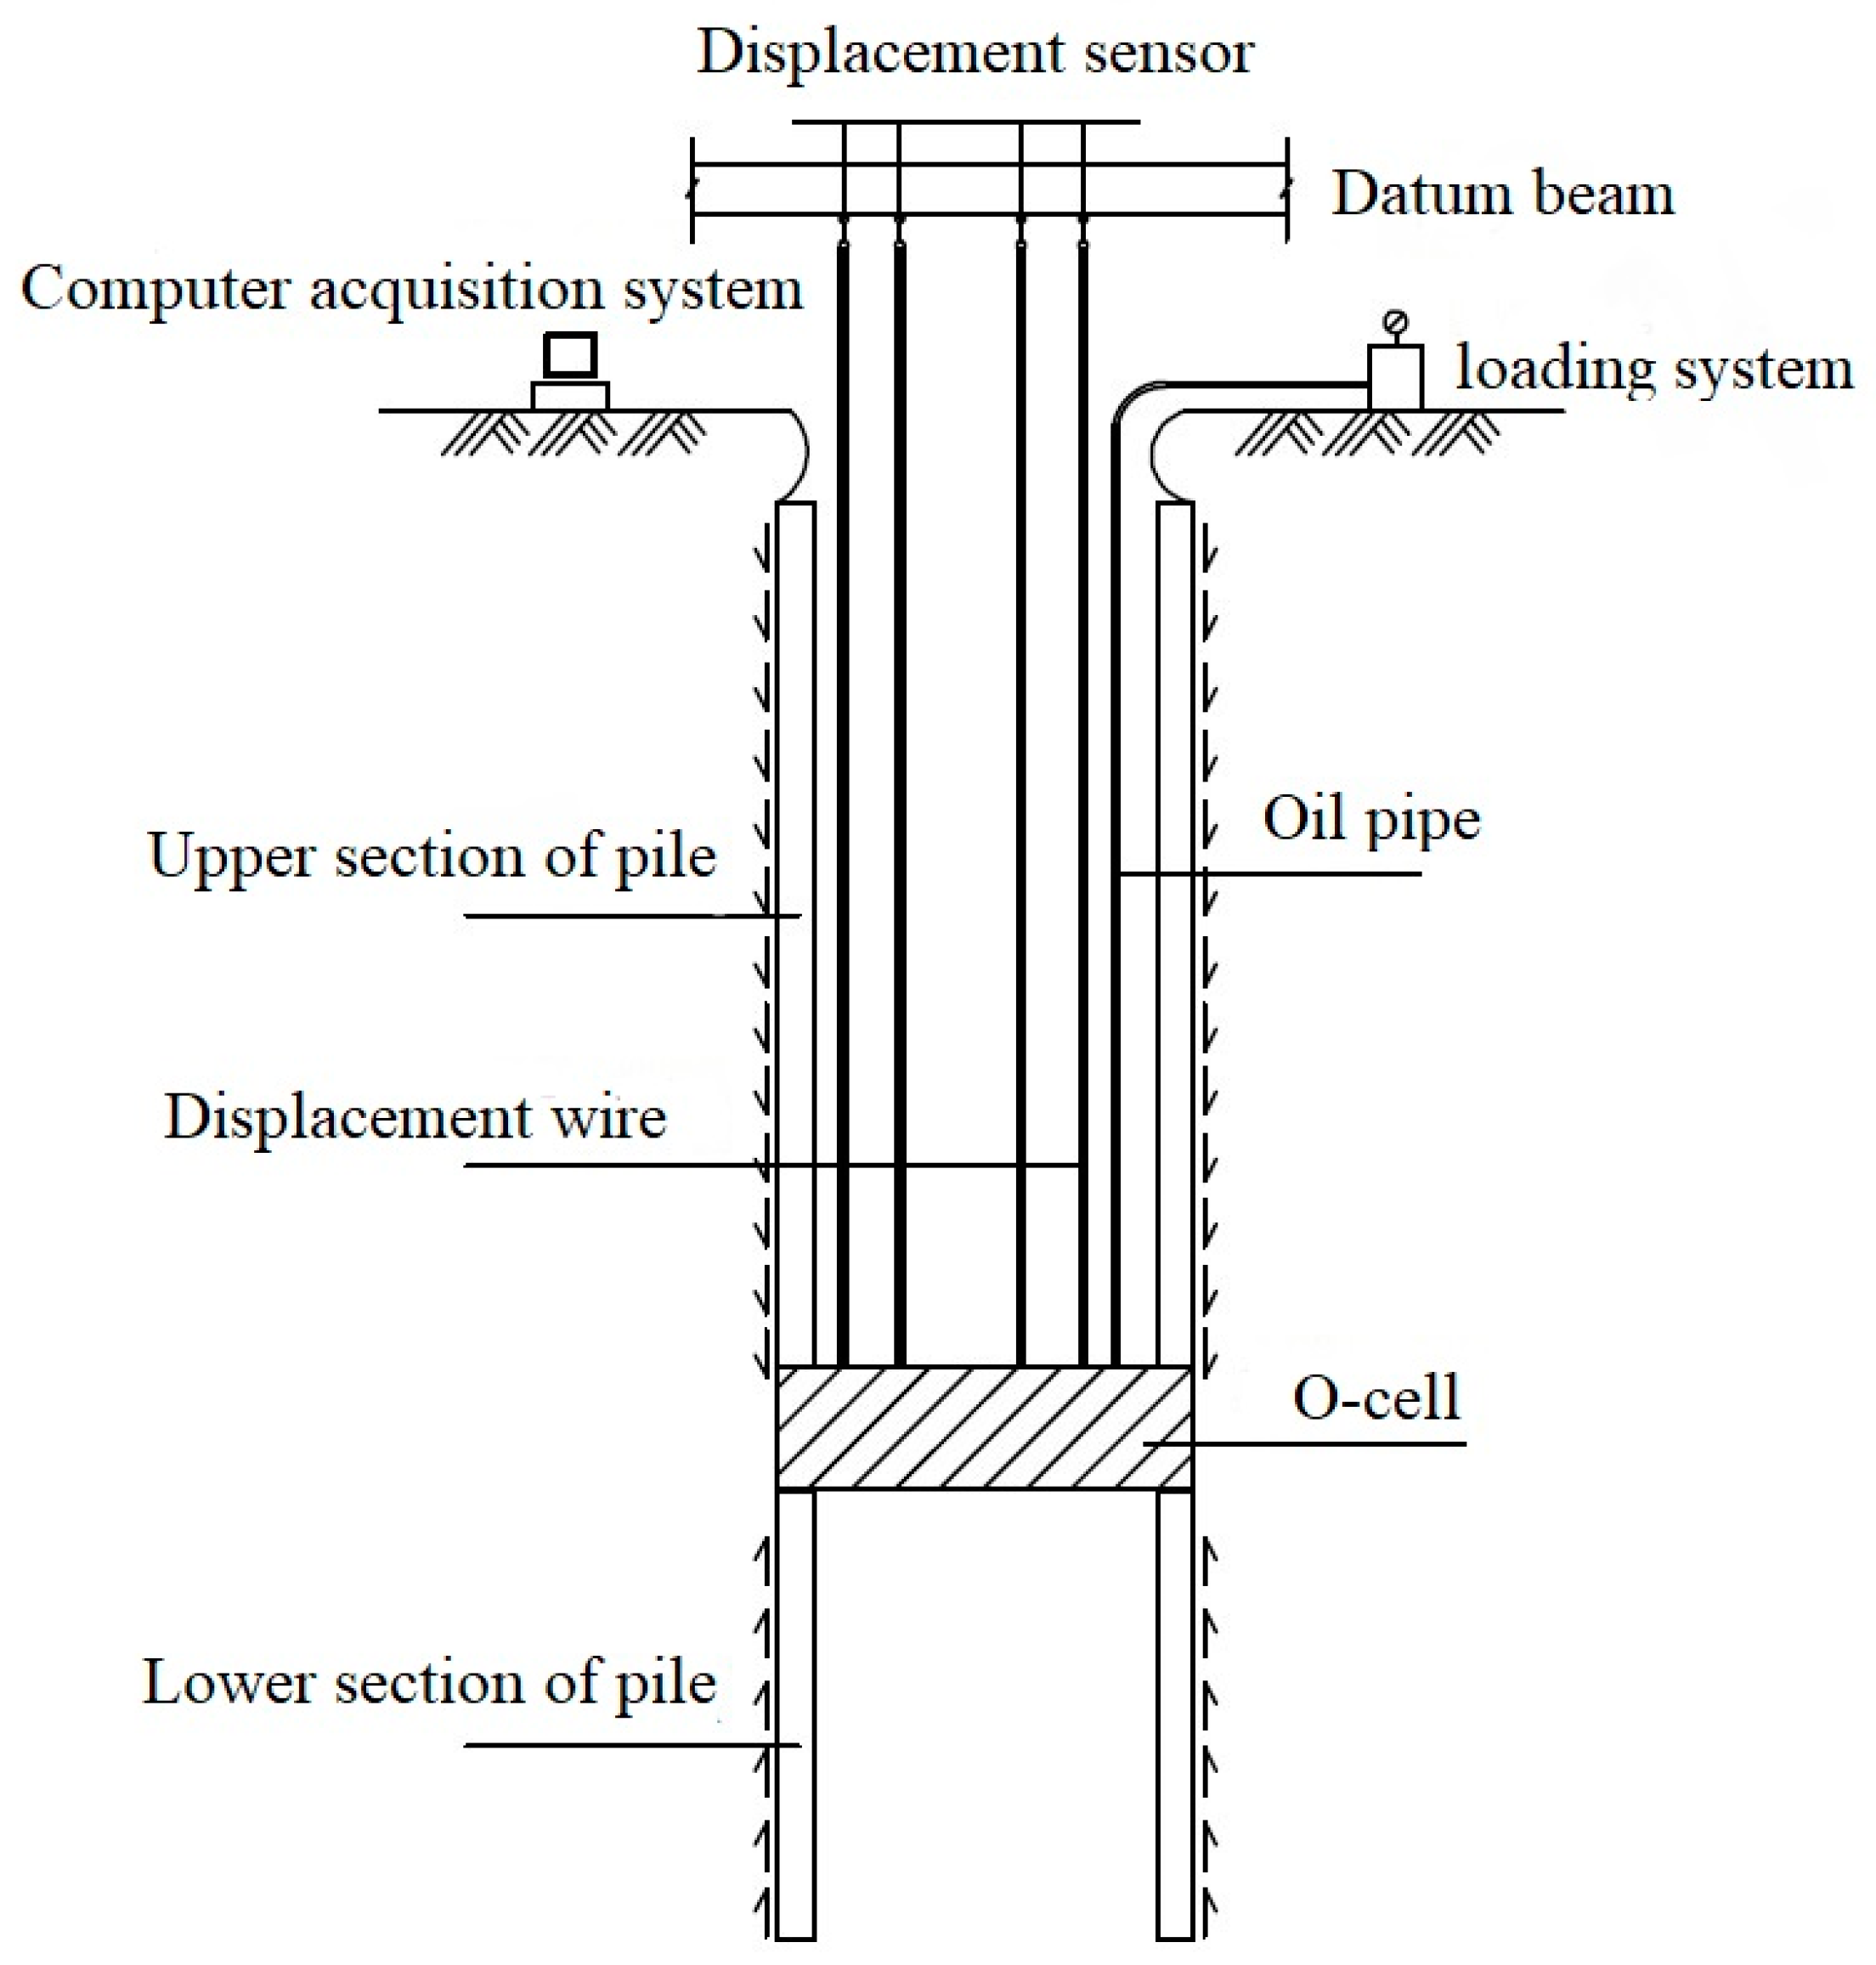
The principle of the O-cell test method is to install a hydraulic load cell at the end of the pile or between the piles. The complete pile is divided into two parts through the load cell, namely the upper pile and the lower pile, which are located above and below the load cell, respectively [1,19]. During the pile test, stress sensors and displacement sensors are installed at the top and bottom of the load cell, and hydraulic oil is pumped into the load cell through the high-pressure oil pump on the ground to apply load to the upper and lower sections of the pile. After vertical loading, the load is maintained by balancing the negative friction resistance of the upper pile side and the self-weight with the help of the lower pile end and the side friction resistance. The top and bottom of the load cell will produce upward and downward displacement, respectively, and the bearing capacity and displacement of the load cell can be measured by the corresponding sensors. The welding and testing process of the O-cell is shown in Figure 2.
By recording the pressure and displacement after loading, the corresponding load–displacement curves (Q-s) of upper and lower piles can be drawn, respectively. According to two Q-s curves and their corresponding s-lgt and s-lgQ curves, the ultimate bearing capacity of upper and lower piles can be obtained, respectively. As the bearing mechanism and bearing characteristics of the lower pile are the same as those of the traditional static load test, but the working mechanism of the upper pile is quite different from that of the traditional static load test, it is necessary to add up the negative friction resistance of the upper pile with the ultimate bearing capacity of the lower pile to obtain the ultimate bearing capacity of the pile. The test principle is shown in Figure 3.
In order to better analyze the bearing characteristics of O-cell test piles, it is necessary to transform the two Q-s curves obtained from O-cell test piles into the results of traditional static load tests. When there is no internal force testing element in the pile body, the calculation formula of equivalent load on the top of the pile is shown in Formula (1) and the calculation formula of equivalent displacement on the top of the pile is shown in Formula (2) [23,24].
Q = Q u W γ 1 + Q d
s = s d + s
s = Q u W / γ 1 + 2 Q d L u 2 E p A p
where: Q is the equivalent load of pile top; Qu and Qd are the upward and downward loads at the balance point, respectively; γ1 is the conversion coefficient; W is the dead weight of the upper pile; s is the equivalent displacement of the pile top; sd is the displacement of the bottom of the load cell; ∆s is the pile shaft compression; Lu is the pile length of the upper section; Ep is the elastic modulus of the pile; Ap is cross-sectional area of the pile.

3. Numerical Simulation of O-Cell Test

In this paper, finite element software ABAQUS 6.14 is used to carry out numerical simulation of O-cell test pile method, and the results are compared with static load test under the same conditions. The bearing characteristics of the O-cell test pile are studied and the equivalent conversion coefficient γ1 of O-cell method is determined.

3.1. Model Assumptions

  • The pile body is a continuous homogeneous ideal elastic body, and no bending deformation and failure will occur during the whole loading process. The soil mass is an ideal homogeneous elastic-plastic material, regardless of the shear dilatancy of soil, and the soil mass on the side of pile is the same homogeneous rock-soil layer in the range of pile length.
  • Total stress analysis is used for soil mass, without considering fluid–solid coupling and without considering rock dip.
  • The contact characteristics between pile and soil are considered. A contact unit is set up at the interface between pile and soil. The friction coefficient between the pile and soil remains unchanged during the analysis.

3.2. Parameters of the Numerical Model

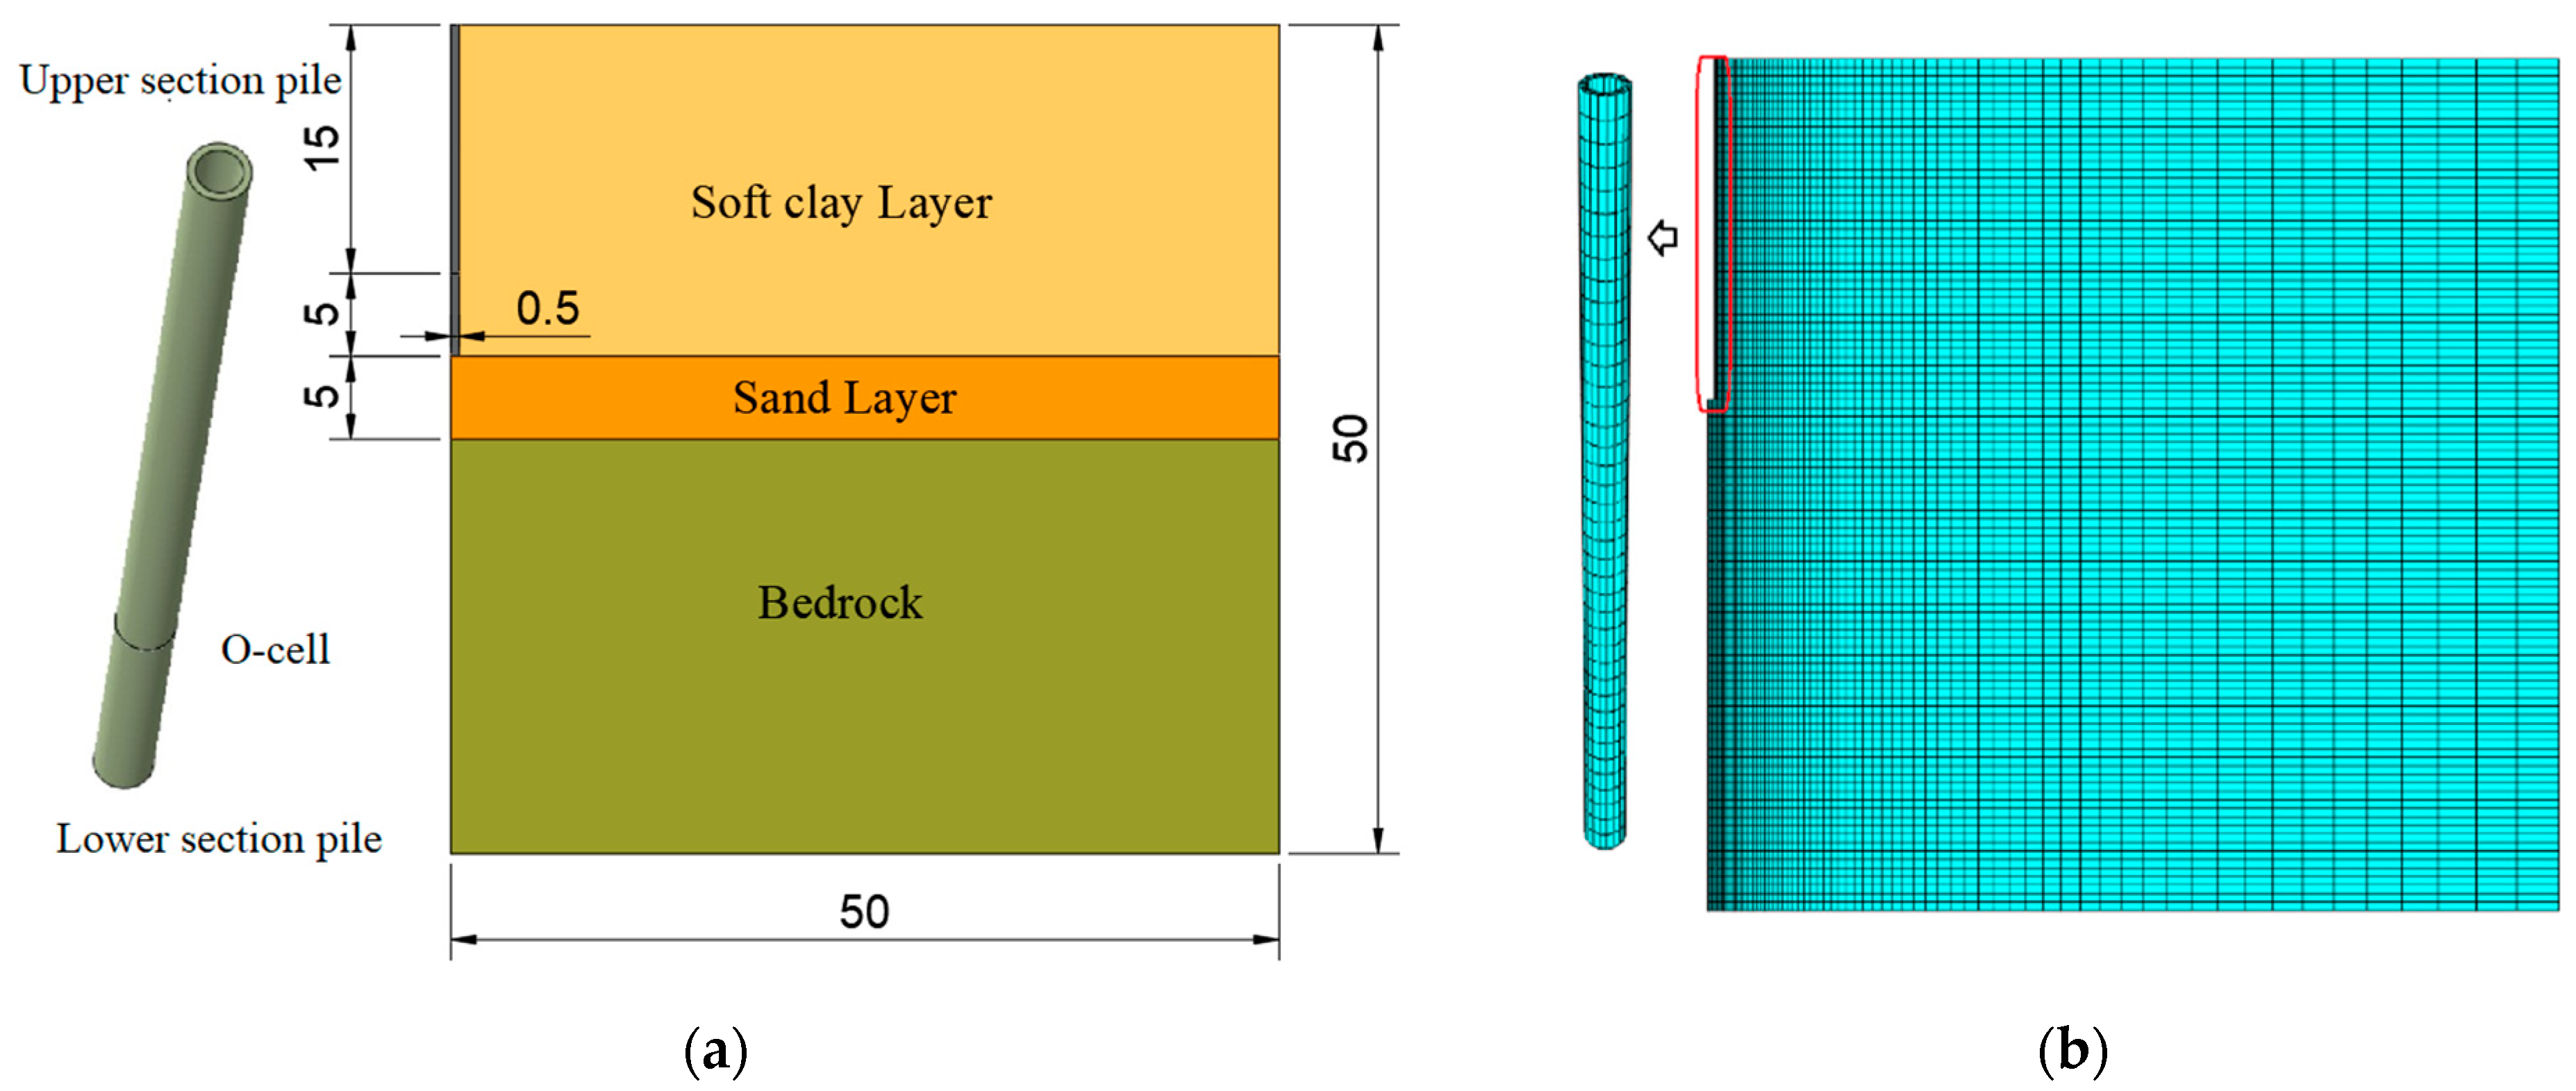
In this paper, considering the axial symmetry of pile soil structure and applied load, an axisymmetric model with symmetrical axis of pile center is selected for numerical simulation. The pile–soil model structure is shown in Figure 4a. According to the specification, the pipe pile model is the PHC pipe pile (open-end) with an outer diameter of 1 m and a wall thickness of 0.13 m. The length of the entire pile is 20 m. In order to better utilize the frictional resistance on the pile side and achieve the ultimate state of the upper and lower piles simultaneously, the position of the load cell is 5 m away from the bottom of the pile. In order to eliminate size effect, the height of the soil structure is more than 2 times the length of pile (50 m height) and the width is more than 20 times the diameter of pile (50 m width).
Pile and soil adopt a solid unit, in which the top of the soil model is free edge unconstrained, the bottom is a fixed constraint and the outside is radial displacement constraint. Freedom at the top of the pile is unconstrained. For mesh generation, soil close to the pile body is divided into dense areas and sparse areas away from the pile body to accurately capture the deformation of the pile body and soil around the pile, as shown in Figure 4b. CAX4 is used for pile and soil unit type, which is more accurate for the solution of displacement. Elastic plastic model is adopted for rock and soil mass, linear elastic model is adopted for elastic part, the Mohr–Coulomb model is adopted for plastic part, and linear elastic model is adopted for pile. The soft clay layer is saturated, and the limit state is controlled by the undrained strength. The pile–soil characteristics of the undrained clay foundation are simulated. The specific parameters are shown in Table 1.

3.3. Pile–Soil Interaction and Initial Geostress Balance

The pile–soil contact problem is simulated by setting contact pairs and defining contact properties. The contact properties in this model achieve uniform undrained shear strength (80 kPa) above and below the contact surface by defining the interface bonding model. The stiffness coefficients knn, kss, and ktt are set to 100,000, which means that the displacement required for the frictional stress to reach 80 kPa is 0.0008 m. The contact alignment, the contact between the pile side and the soil and bedrock, and the contact between the pile bottom and bedrock all adopt the face-to-face contact type. Due to the large rigidity of the pile relative to the rock and soil, the pile is taken as the main control surface, and the rock and soil are taken as the subordinate surface. The contact tracking method between the pile and the soil is limited slip. The contact between pile and soil in this model starts from the initial analysis step.
The deformation of soil mass caused by self-weight stress is stable before pile sinking, and the friction between pile and soil is closely related to the lateral pressure caused by self-weight. Therefore, by establishing the initial geostress balance, the self-weight effect is included in the model to eliminate the soil mass displacement caused by self-weight.

3.4. Loading Method

Loading methods generally include the displacement control method and load control method. The former obtains the load–displacement curve by controlling the change of displacement. The latter is loaded directly to obtain displacement. In practical engineering, the bearing capacity of pile foundation is analyzed by applying graded load to test piles. However, since graded loading is carried out by load control method, it is difficult to determine the relationship between physical index of soil and bearing capacity parameters only on the basis of experience without field measured data.
In order to make the bearing capacity of both upper and lower piles reach the ultimate state and facilitate comparison with static load test, the displacement control method is used to simulate the loading of upper and lower piles to obtain the ultimate bearing capacity of upper and lower piles, and the loading of static load test piles is simulated to obtain the ultimate bearing capacity of static load test piles. Then, the conversion coefficient is determined by comparison and analysis, and the ultimate bearing capacity of single pile of O-cell pile is calculated. Based on this, the load grade of step loading is designed and the transfer law of axial force, side friction resistance and tip resistance is studied.

4. Calculation Results and Analysis

4.1. Load–Displacement Curve Analysis

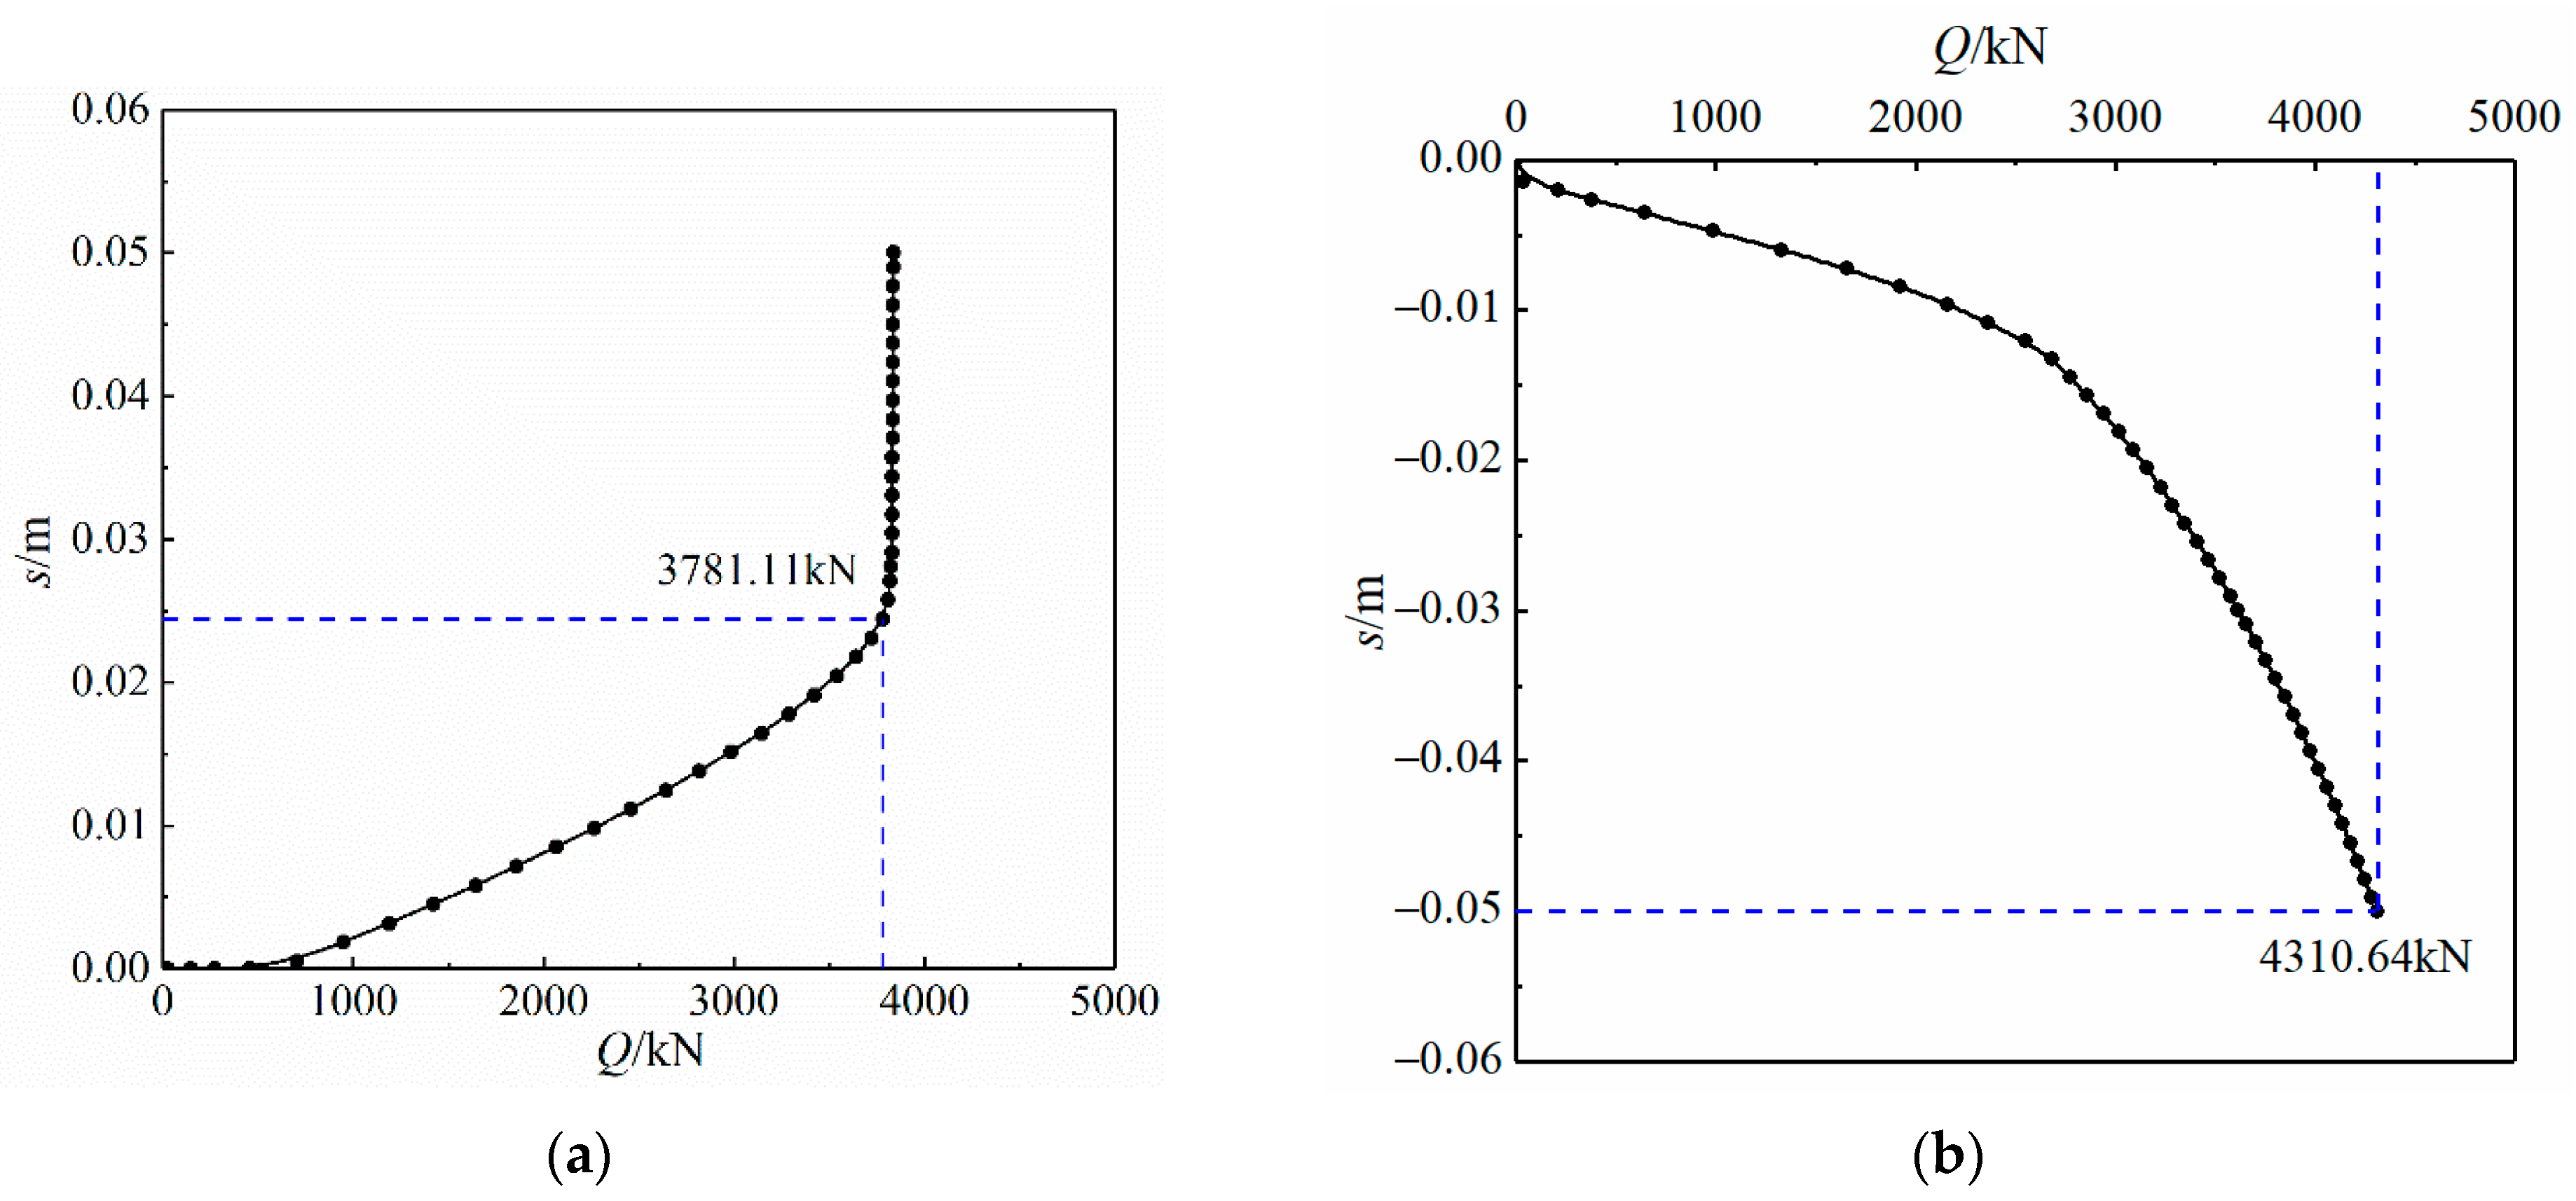
Figure 5 shows Q-s curve of upper pile and lower pile, where Figure 5a shows displacement–load curve of upper section of pile bottom and Figure 5b shows displacement–load curve of lower section of pile top. For curves with steep variations, the load value corresponding to the starting point of steep curve change should be taken as the ultimate loading value. For the gradual curve, since the diameter of the pile in this case is 1 m, the corresponding load value of the downward displacement of the load cell is 0.05 times the diameter of the pile (i.e., at 50 mm).
For Figure 5a, there is an obvious abrupt point in the Q-s curve of the upper pile. When the displacement of the upper pile is 0 mm~24 mm, the load on the pile increases gradually with the increase of displacement. When the displacement reaches 24.5 mm, the load value almost does not change with the increase of displacement, which indicates that the bearing capacity of the upper pile reaches the limit value when the displacement reaches 24.5 mm, Qu = 3781.11 kN. From Figure 5b, it can be seen that the displacement–load curve of the lower section of the pile is a typical gradual curve. The load on the top of the pile gradually increases with the increase of the displacement. The ultimate bearing capacity of the pile is the load corresponding to the final displacement (50 mm), i.e., Qd = 4310.64 kN.
From the two Q-s curves obtained by the O-cell method, it can be seen that when the O-cell method is used for test loading, the upper pile will produce an upward displacement and the lower pile will produce a downward displacement. During the loading process, the load applied to the upper section of the pile to achieve the same displacement is smaller than the lower section of the pile. This is because the tip of the lower section of the pile reaches a hard rock layer with a large modulus, which is not easy to produce elastic deformation. The side friction of the lower section of the pile and the larger tip resistance jointly resist the load, while the upper section of the pile mainly resists the load by the side friction and the pile weight, which is more likely to produce displacement compared with the lower section of the pile.
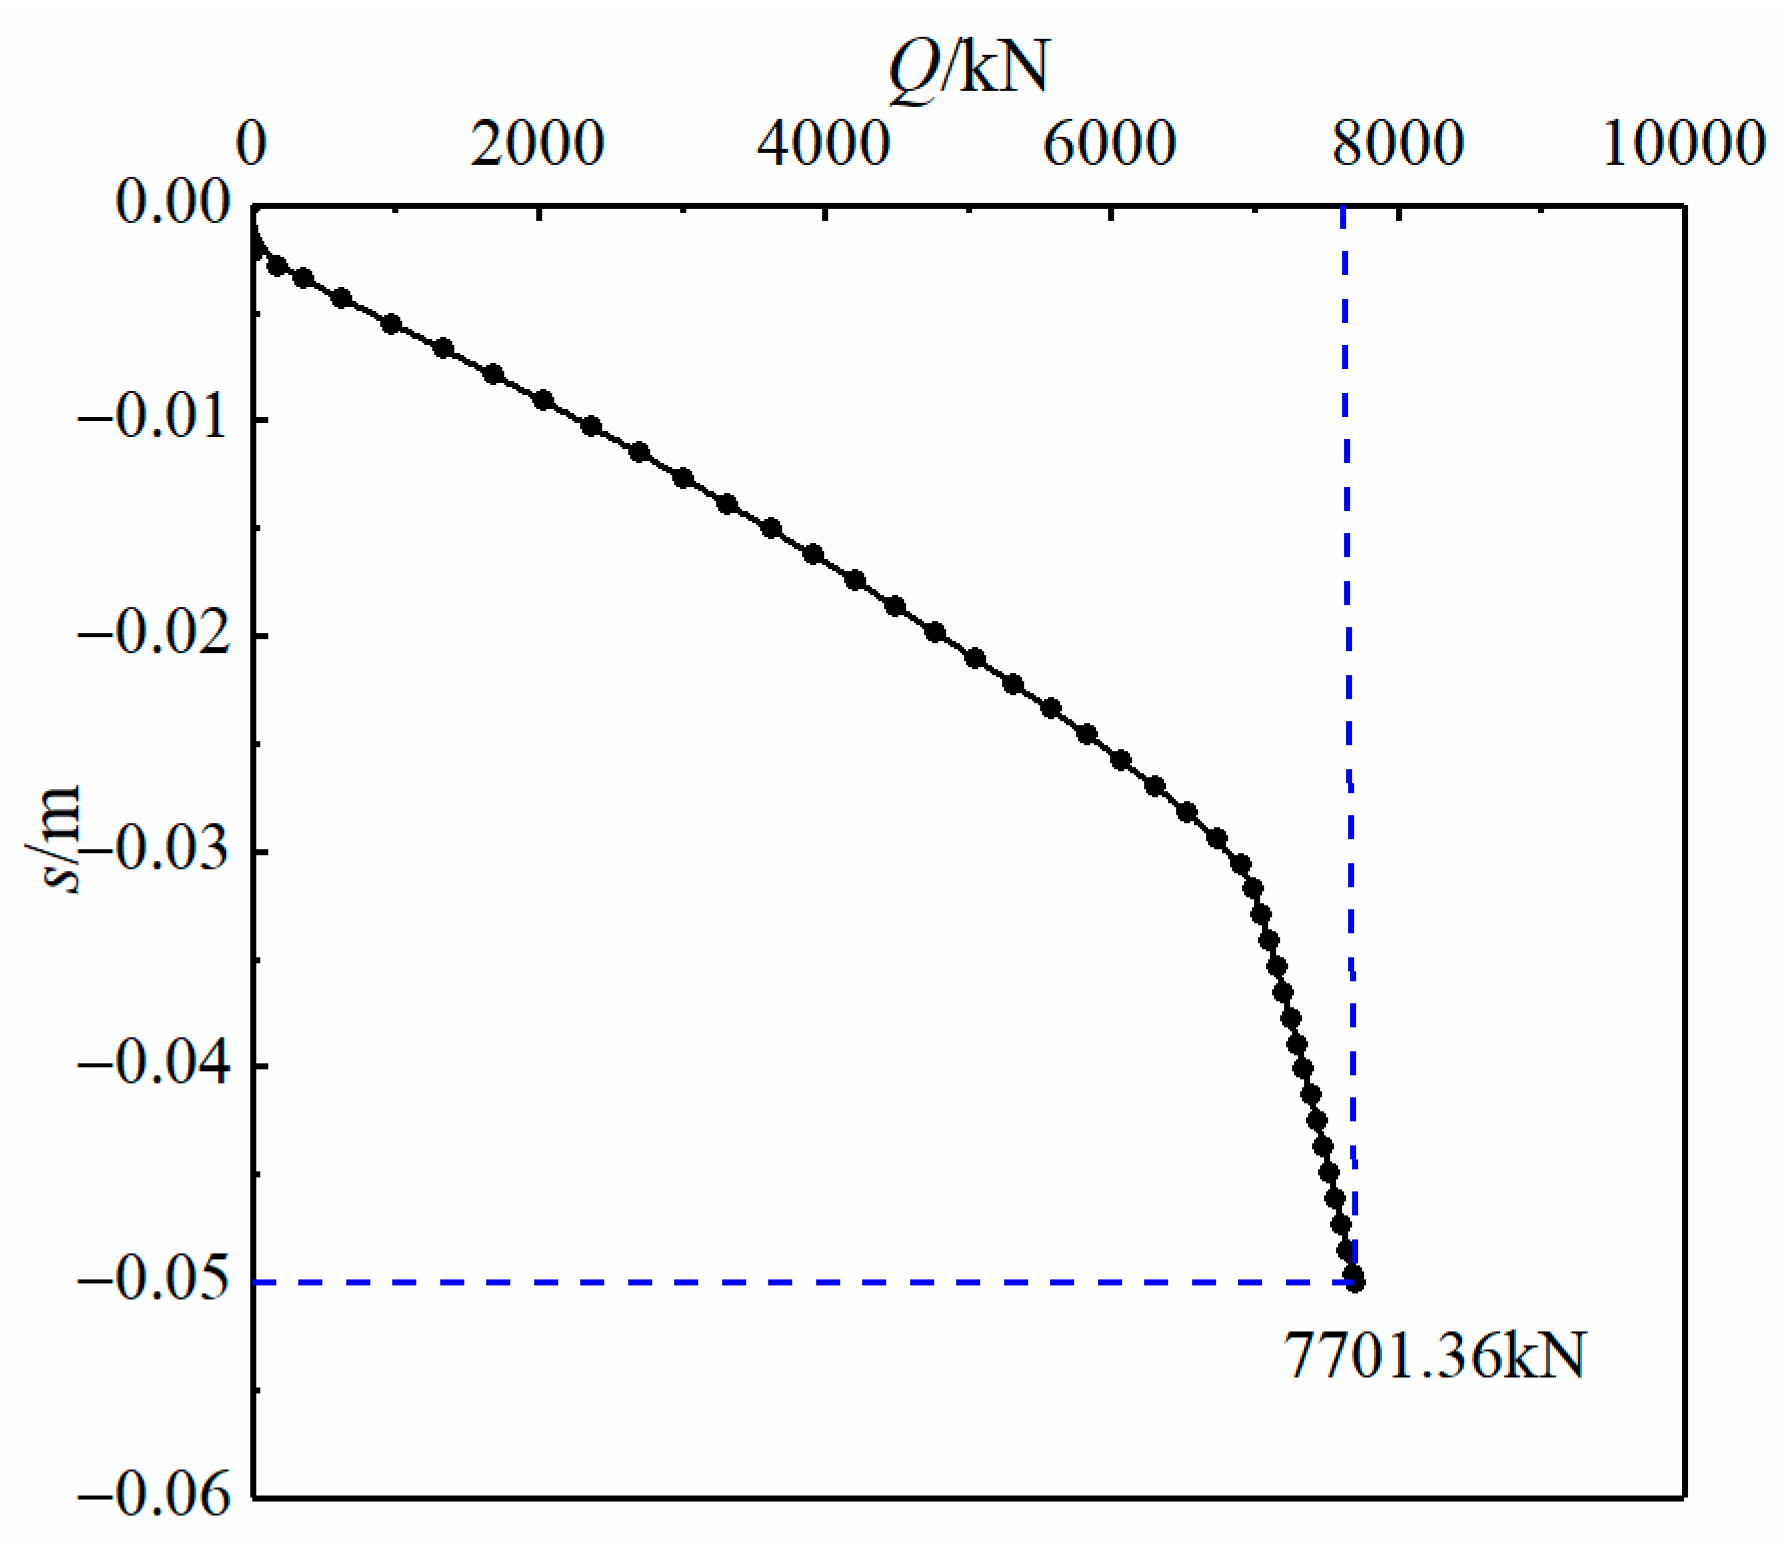
Figure 6 shows the Q-s curve of the traditional static load test under the same conditions. The load increases gradually with the increase of the displacement of the top of the pile, and the whole curve shows a slow tendency without obvious catastrophe points. Therefore, the ultimate vertical bearing capacity of the pile is the load corresponding to the final applied displacement (50 mm), i.e., Q = 7701.36 kN.
From the Q-s curve of static load test, it can be seen that in the early stage of displacement change, the Q-s curve changes in a straight line, which indicates that the friction resistance of the upper part of the pile side starts to excite, the relative displacement of pile and soil is less than the limit slip value, and the soil is elastically deformed. As the load increases, the side friction resistance of the pile is gradually excited along the pile body, and the relative displacement of the pile and soil is larger than the limit slip value. At this time, the soil body undergoes plastic deformation and the Q-s curve changes in a curve. The tip resistance at the bottom of the pile and the side friction resistance jointly bear the load of the pile body.

4.2. Comparison of O-Cell and Traditional Static Load Methods and Determination of Conversion Coefficient

When determining the bearing capacity of pile foundation, it is necessary to convert the O-cell test results into the results of traditional static load test method. Although the proportion of friction and tip resistance of traditional static load test pile and O-cell test pile in similar soil layer is not consistent before loading, when it is close to the limit state of pile bearing capacity, the load transfer behavior of the pile will be more consistent, and the equivalent transfer curve of O-cell test pile measured from this will be more consistent with the traditional static load curve.
Based on the principle that the displacement of the top cover and bottom cover of the load cell is equal, the simplified method is theoretically optimized through numerical analysis. Comodomos et al. [13] believed that when calculating the ultimate bearing capacity of pile foundation, the influence of pile length-diameter ratio should be considered, and the resistance coefficient will increase with the increase of length–diameter ratio or pile tip depth (especially when L:D ≥ 5, the value has an obvious increasing trend). The specification [23] stipulates that when there is no reliable comparison test data and regional experience, 0.8~1.0 can be taken, 1.0 for long piles or cohesive soil, and 0.8 for short piles or sandy soil. Li et al. [17,18] considered that the conversion coefficient of sandy soil is 0.42~0.71 and that of cohesive soil is 0.7~0.8 according to the field test results.
Conversion coefficient has a great influence on O-cell test results, and the values of conversion coefficient are different under different engineering situations. In this paper, γ1 = 0.81, 0.89, 0.97, and 1.05, respectively. Equivalent loads and displacements are calculated by Formulas (1) and (2). The converted Q-s curve is obtained and compared with the Q-s curve of traditional static load test. The results are shown in Figure 7. From Figure 7, it can be seen that the ultimate bearing capacity of O-cell test piles decreases with the increase of γ1. When γ1 = 0.97, the Q-s curve after equivalent conversion has a higher overall fitting with the Q-s curve obtained from traditional static load test. This is because the soft clay layer in the model is completely undrained, and the pile length-diameter ratio L: D is large, the calculated ultimate bearing capacity of the pile is 7719.68 kN, and the error with the static load test result is within 0.5%, It shows that it is reasonable, feasible and more accurate to select the appropriate conversion coefficient to calculate the ultimate bearing capacity of O-cell piles by improving the theory of empirical conversion method through numerical simulation.

4.3. Analysis of Load Transfer Law by O-Cell Method

Dividing the ultimate bearing capacity obtained by equivalent conversion by safety factor K (usually K = 2), the characteristic value Ra = 3859.84 kN of bearing capacity is obtained, i.e., the design service value of the bearing capacity of foundation and the bearing capacity of single pile used in calculation of normal service limit state, which means the allowable design value of resistance when performing normal service function.
According to Ra, the loading schemes of each level are designed as follows:
640 kN, 960 kN, 1280 kN, 1600 kN, 1920 kN, 2240 kN, 2560 kN, 2880 kN, 3200 kN.
The slow maintenance load method is adopted. The load of each level is 1/10 of the maximum load value, that is, 320 kN. The first level is twice the load value of the level. There are nine levels in total. The ultimate bearing capacity of the upper and lower sections of the pile in the O-cell method shall be considered when the graded loading scheme is designed according to Ra.

4.3.1. Axial Force Analysis

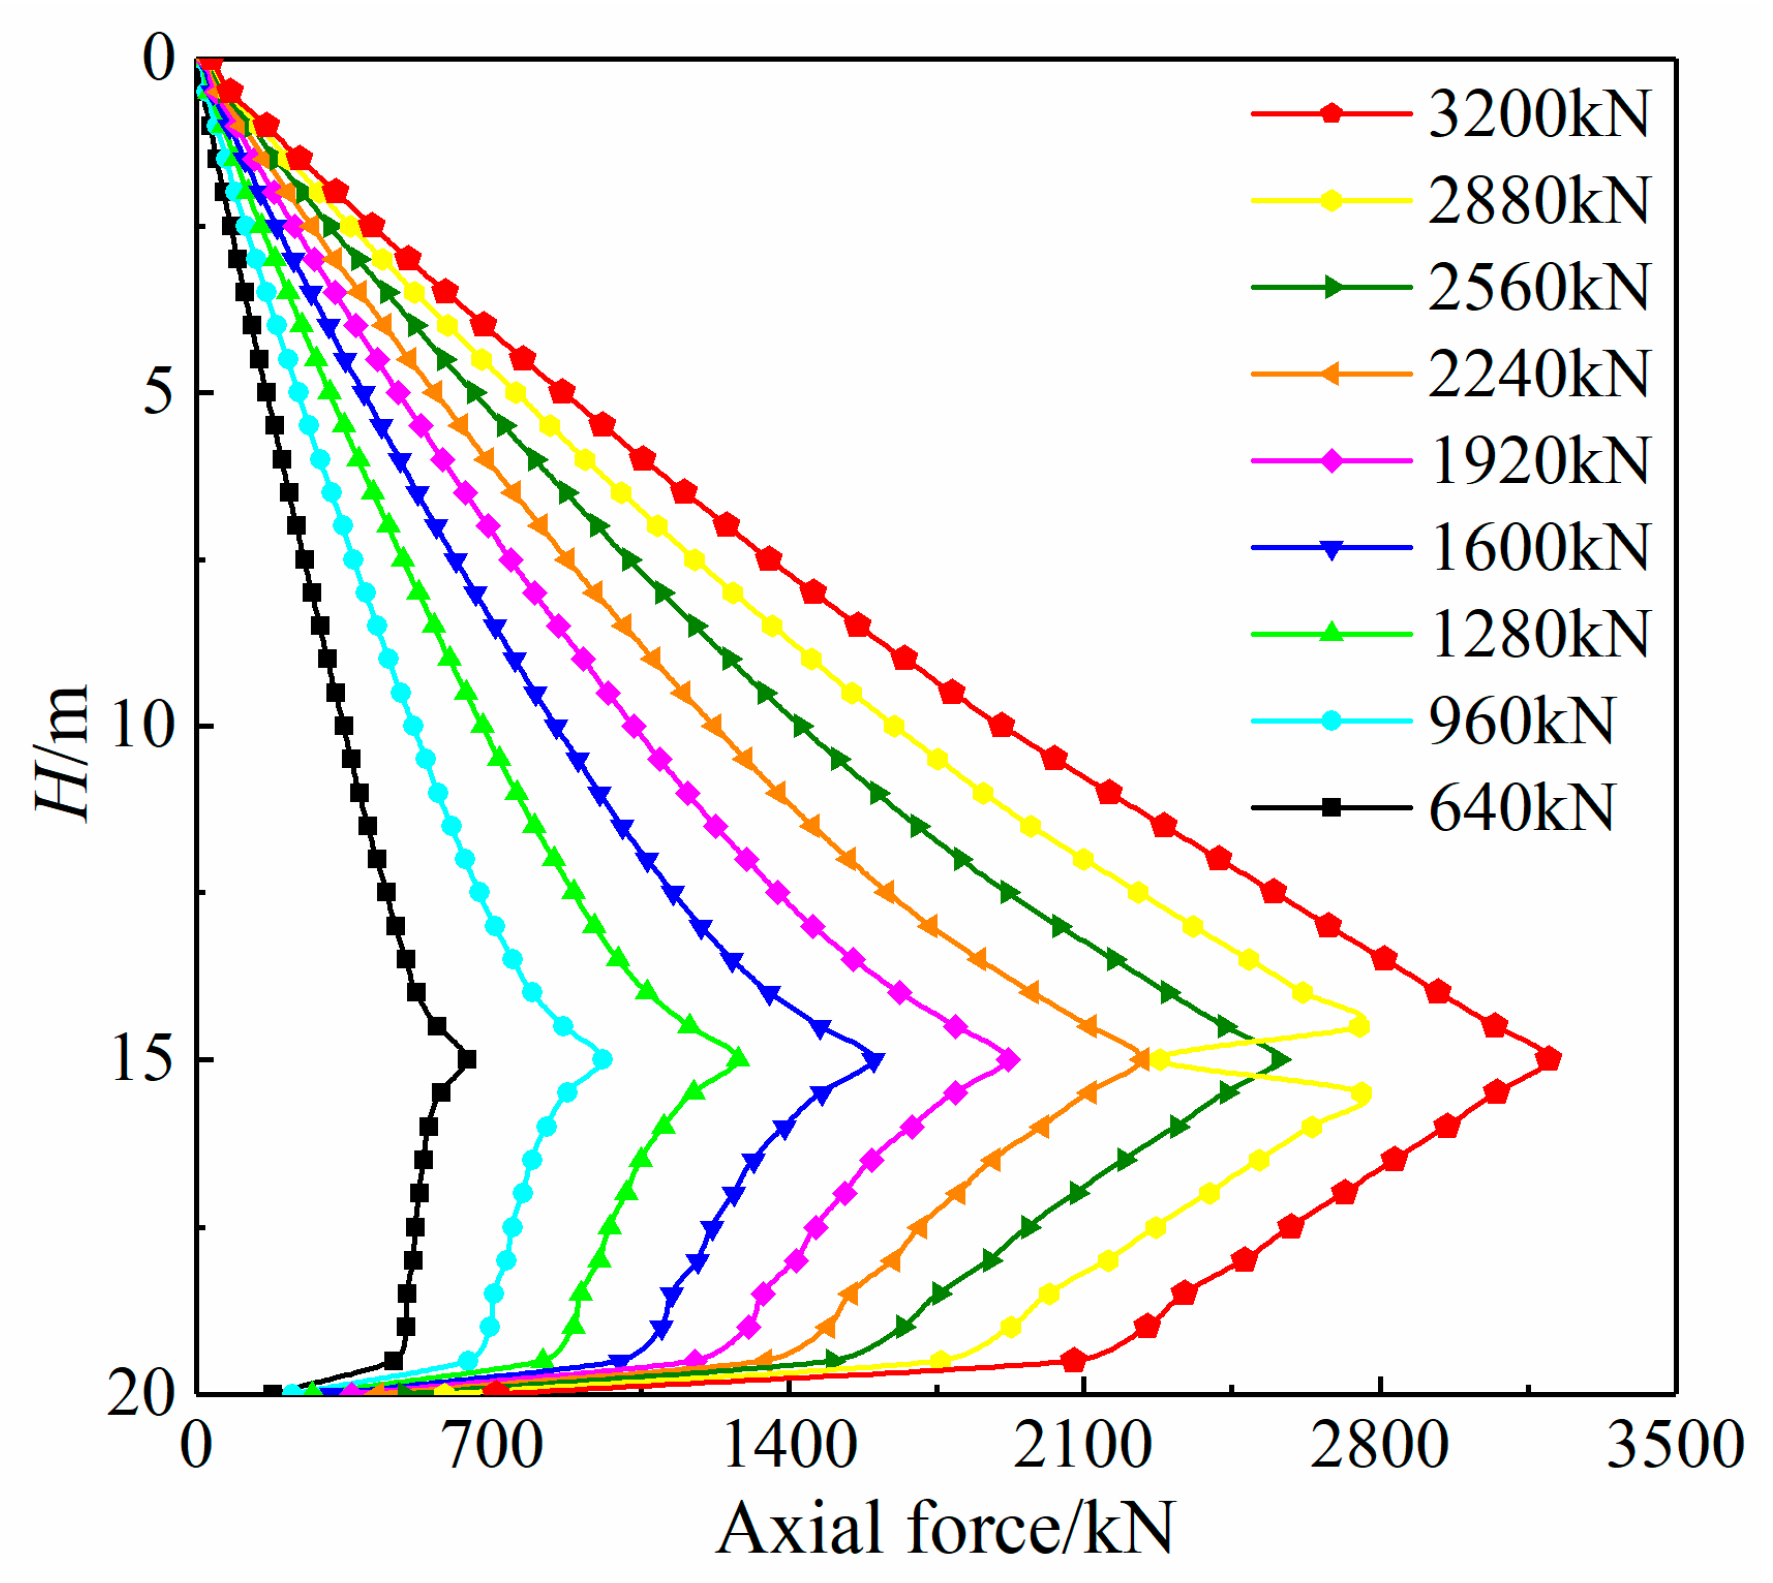
Figure 8 shows the distribution law of axial force of pile body under various loads. The balance point is located at 15 m depth of pile. The upper pile is supported by the upper bottom, and the load is transferred from bottom to top. Under the same load, the closer to the balance point, the greater the axial force is, and gradually attenuates toward the pile top. The axial force curve shows an inverted triangle, protruding to the right as a whole. At the same pile depth, the axial force increases with the increase of load, and the axial force curves under different load levels have similar development patterns. The lower section of the pile is subjected to downward jacking pressure, and the load is transmitted from top to bottom. When the load is small, the difference between the pile top load and the pile end load is small. At this time, the pile side friction is small. With the increase of load, the pile tip resistance increases significantly, and gradually bear more load.

4.3.2. Analysis of Side Friction Resistance

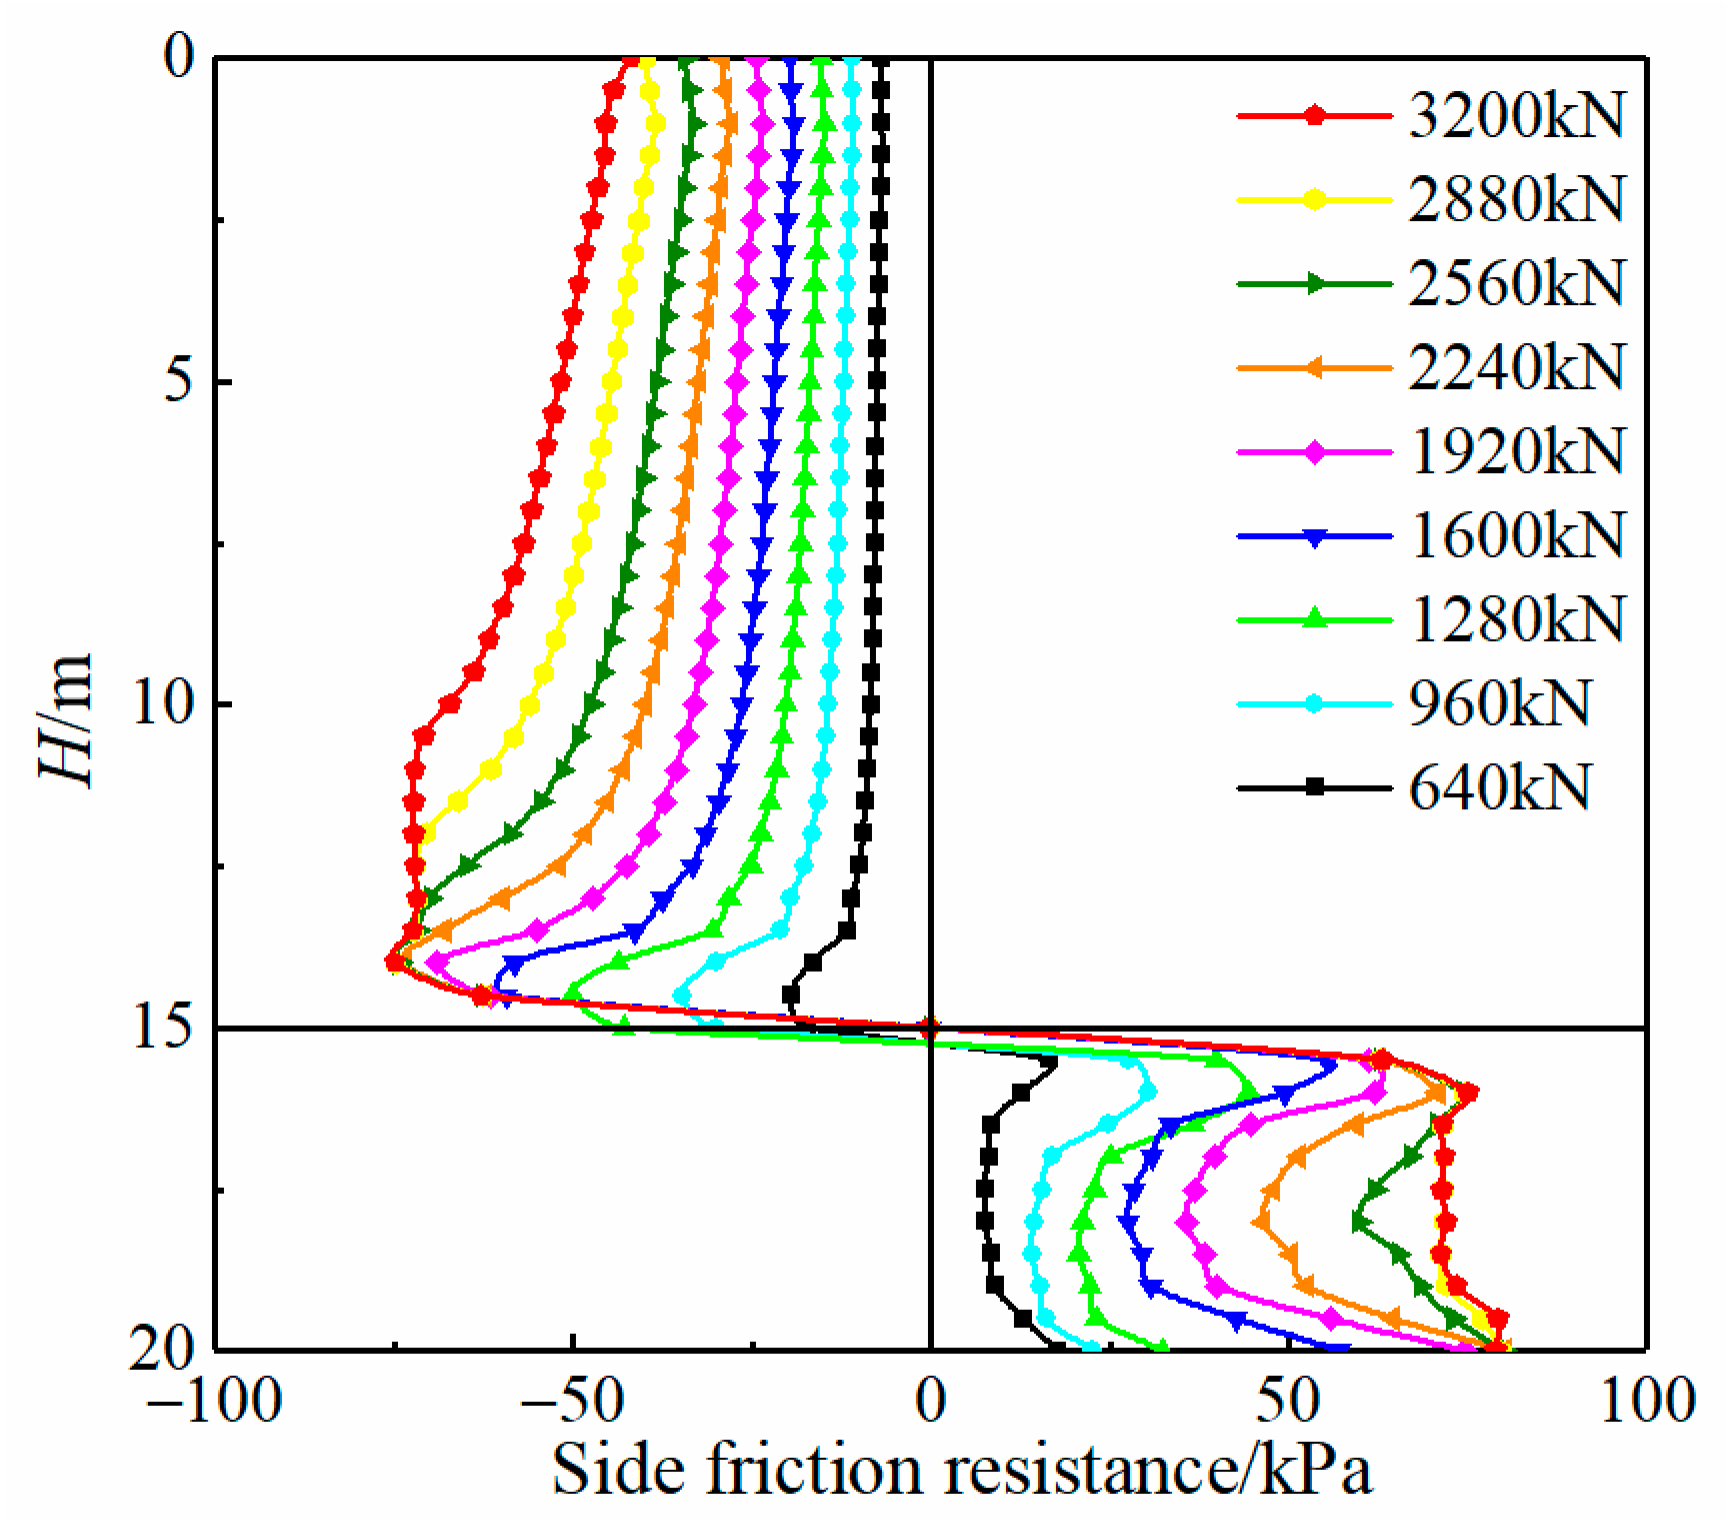
Figure 9 shows the distribution law of side friction resistance of pile body under various load levels. Under the same load level, for the upper section of pile, the side friction resistance is large near the load cell and transfers upward along the pile. When the load level is small, the difference between the load near the loading position and the pile top is relatively small. With the increase of the load level, the pile side friction resistance also increases, and the difference between the load at the loading position and the pile top load also gradually increases. When the load level increases to 2240 kN, the peak value of the side friction curve will not increase with the continuous increase of the load level, but the side friction generated by the upper pile as a whole is still increasing (that is, the curve coverage area). The statistics of the proportion of the bearing capacity of the upper pile is shown in Table 2. It can be seen that with the increase of the load level, the side friction gradually bears more load.
For the lower section of the pile, the load is mainly borne by the side friction and tip resistance. It can be seen from the figure that the side friction increases with the increase of the load level, but the extent of the increase decreases, which indicates that more load will be gradually shared by the tip resistance.

4.3.3. Analysis of Tip Resistance of Lower Pile

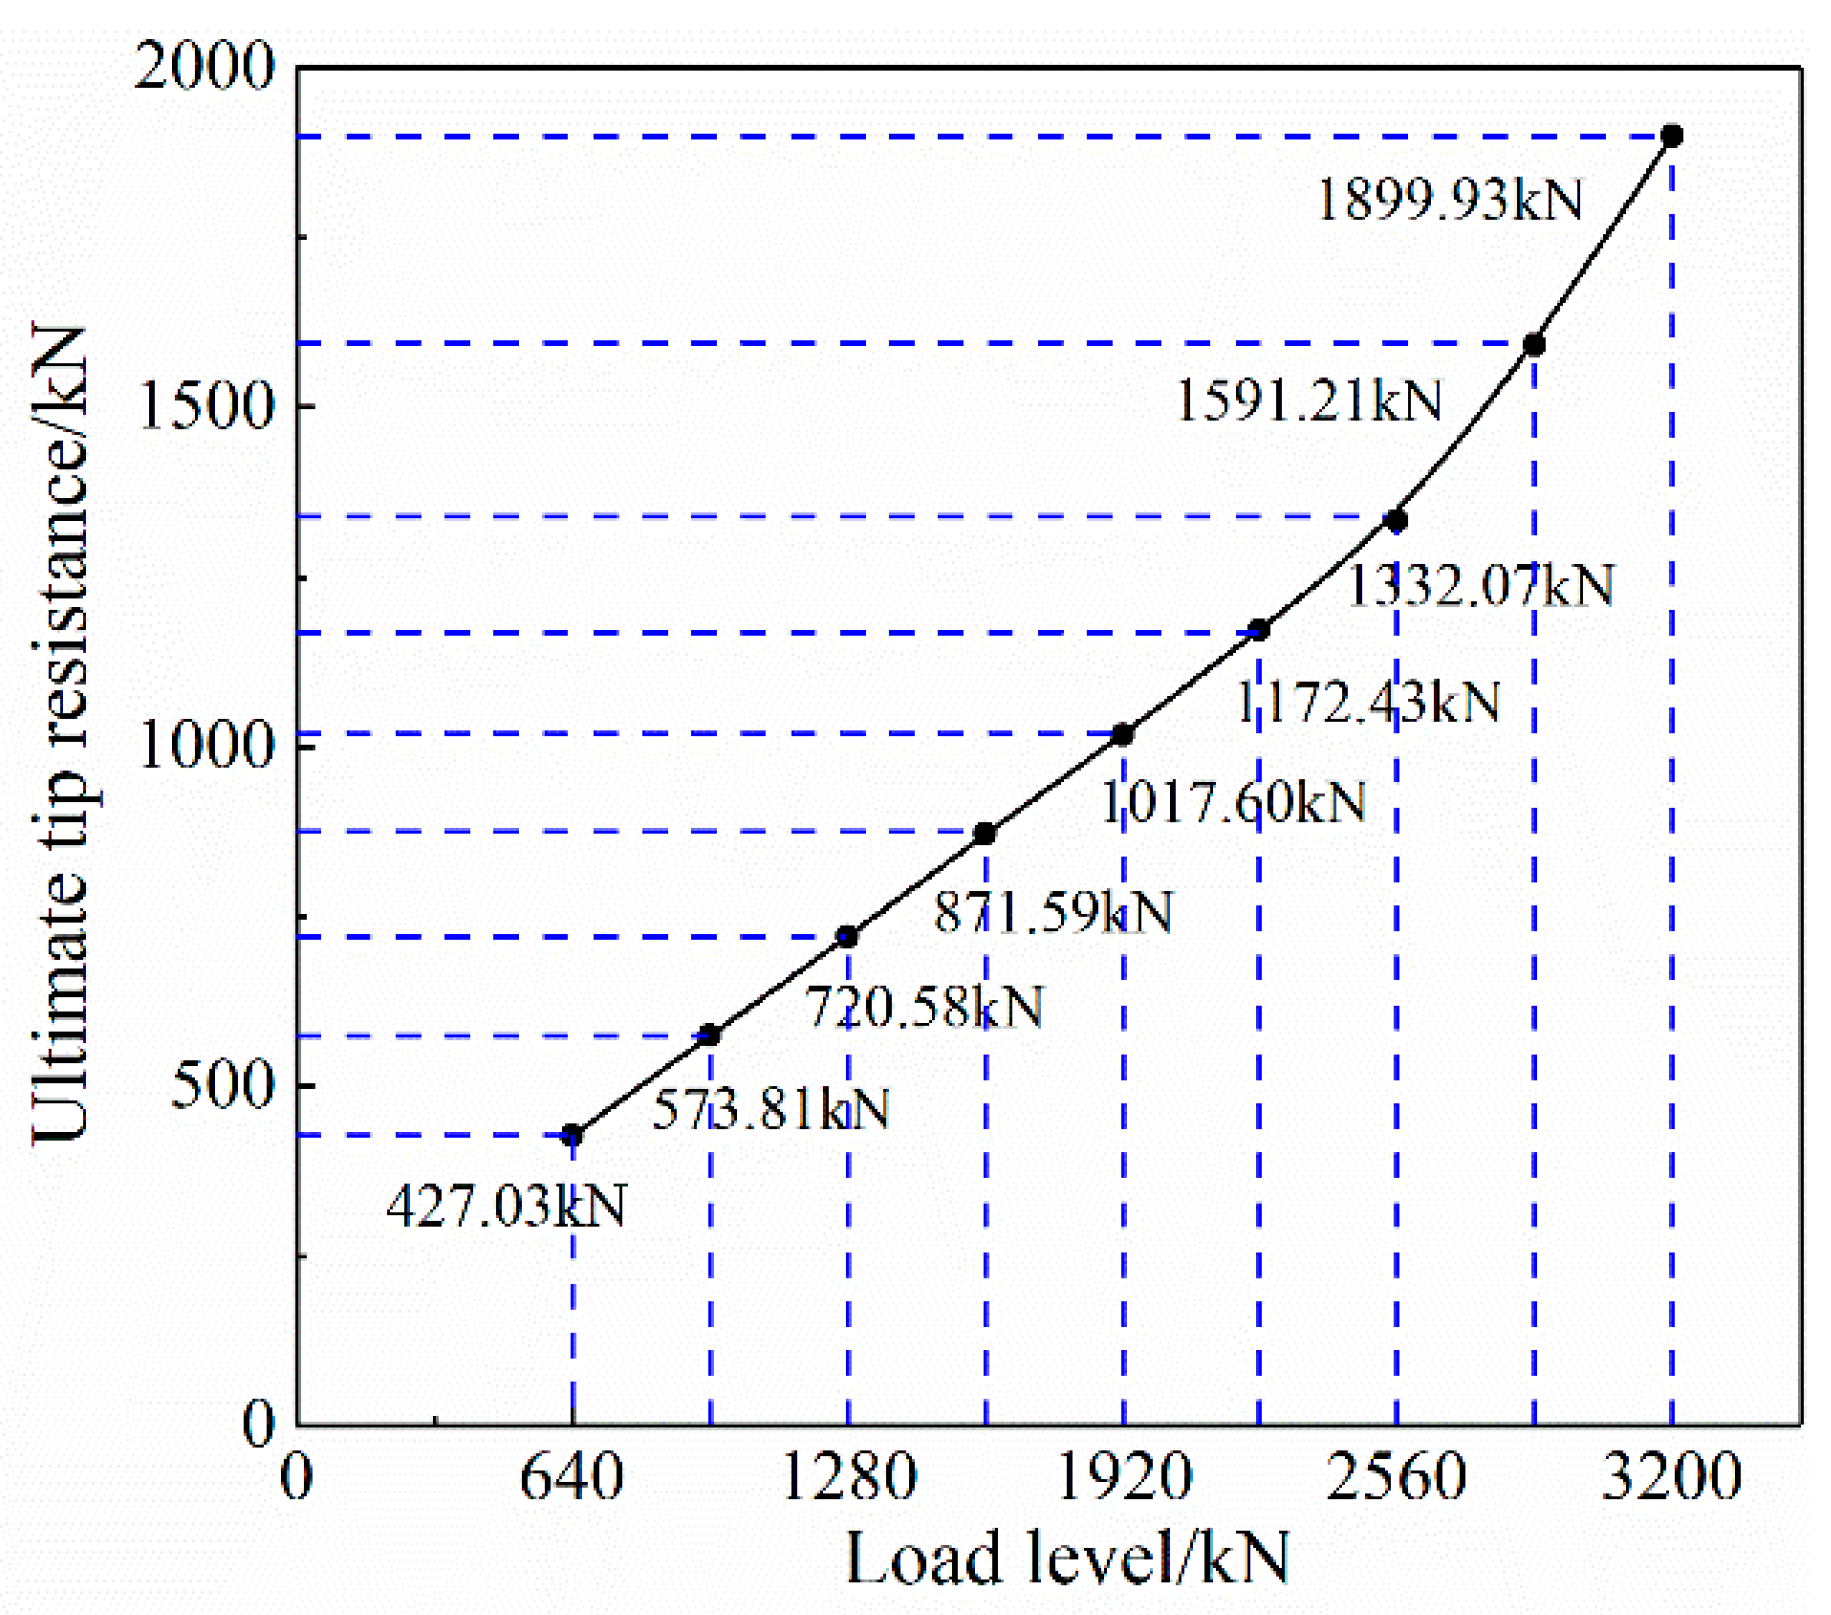
Figure 10 shows the change rule of the ultimate tip resistance of the lower section pile with the increase of the load grade. It can be seen that when the load grade is small, the slope of the limit tip resistance curve with the increase of load grade basically remains unchanged, approximating a straight line. When the load level increases to 2240 kN, the slope of the curve increases and the growth rate of the ultimate tip resistance increases, which indicates that when the load level increases to a certain extent, the tip resistance will gradually share more load. Table 3 shows the statistics of the proportion of the side friction and tip resistance of the lower section of the pile under all levels of load. It can be seen that the proportion of the tip resistance first decreases and then increases, and the side friction first increases and then decreases. This is because as the loading process progresses, the side friction resistance between the soil layer near the load cell and the pile body will play a role first, then gradually reaches “saturation”. At the later stage of loading (load level increases), the tip resistance will bear more loads.

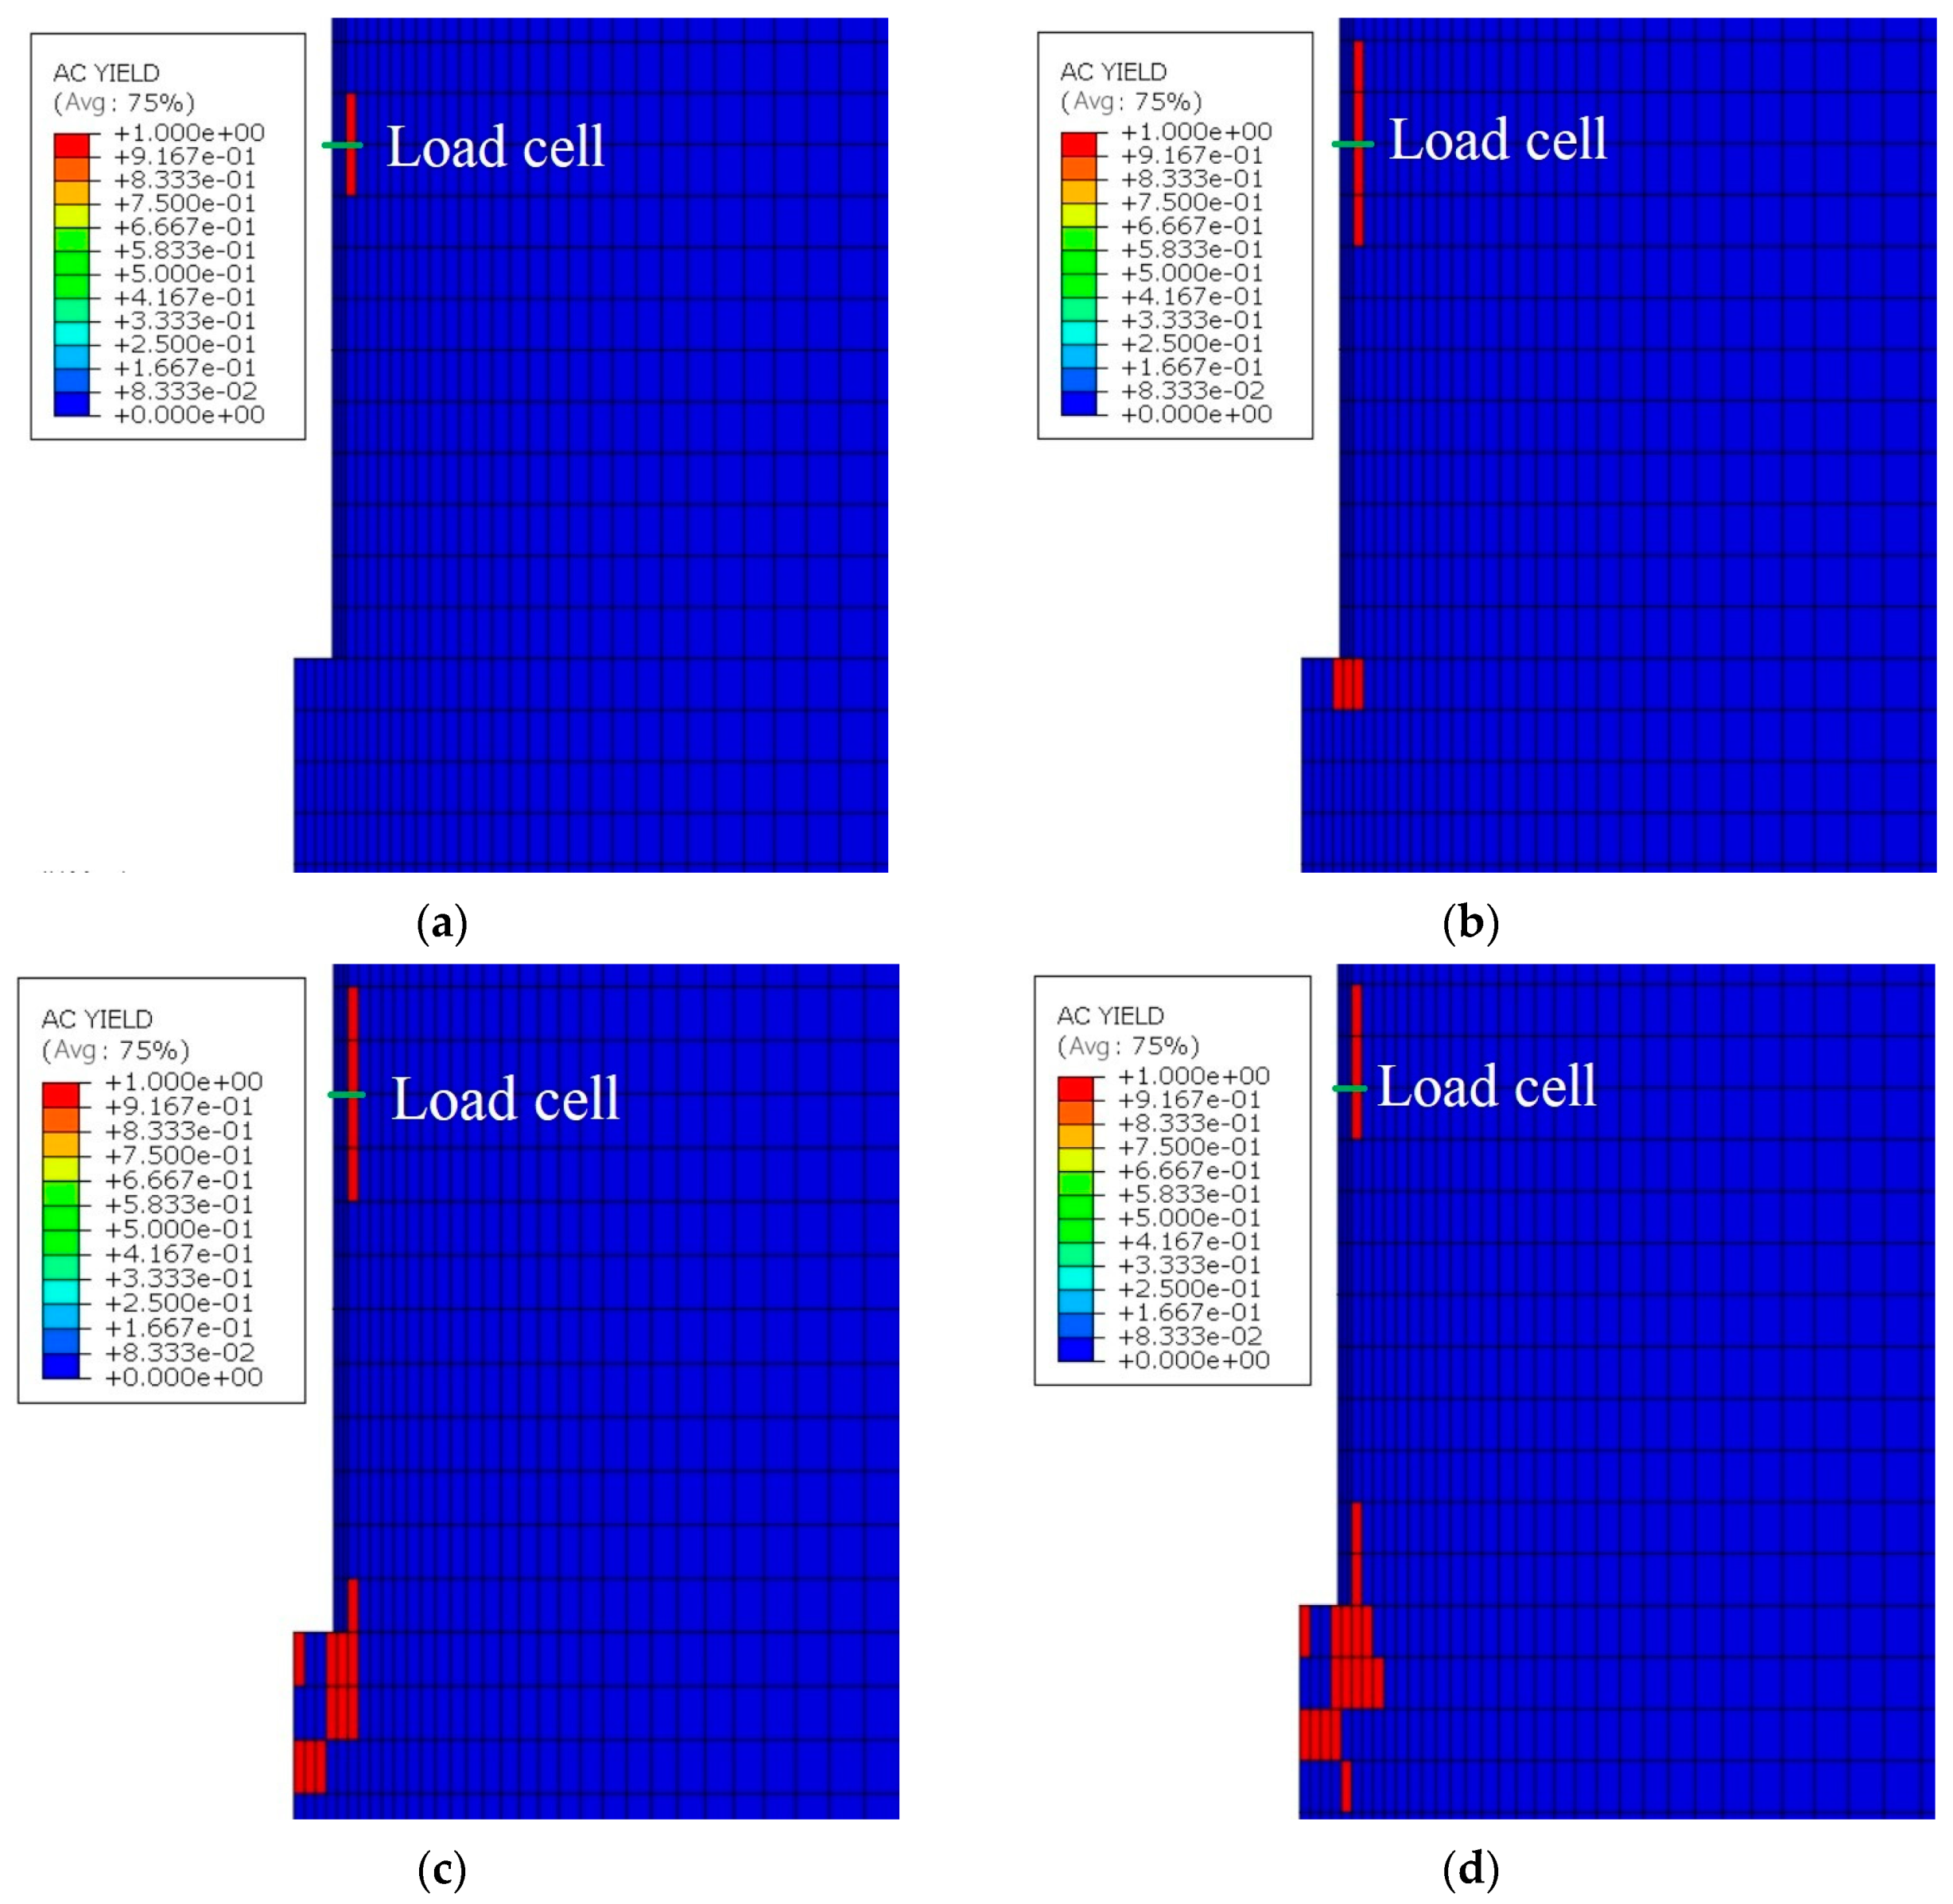
4.4. Distribution of Yield Region during Loading Process

Figure 11 shows the yield region distribution of the soil mass on pile side at each time along with the loading process.
AC Yield is the yield mark, which is one when yielding occurs, and zero when not yielding. The calculation results show that the yield mainly occurs in the soil layer near the load cell at the initial stage of loading, and the yield of the soil layer at the pile end mainly occurs at the later stage with the loading process. This shows that the pile side resistance is developed first and the tip resistance is developed later. At the initial stage of loading, large pile–soil relative displacement will occur near the load cell, and the friction resistance will begin to play at the earliest time. As loading progresses, friction resistance develops from the load cell along the pile body to the far end until the limit value is reached. The development of pile tip resistance lags behind the lateral resistance. For the lower section of pile, under the condition of short pile length and high pile modulus, the pile–soil relative displacement at the pile end will also be relatively more, and the load shared by the tip resistance will also be more, so the yield will mainly occur in the soil layer at the pile end in the later stage of loading.

5. Conclusions

In this paper, the bearing mechanism and numerical model of static load test and O-cell test are compared, and the load transfer rule of single pile of O-cell test is analyzed. The conclusions are as follows:
  • The pile end of the lower section reaches the hard rock layer with a large modulus, which is not easy to generate elastic deformation. The Q-s curve of the upper section of the pile is steep, and the Q-s curve of the lower section of the pile is slow At the same displacement, the load required by the upper section of the pile is smaller than that of the lower section;
  • The Q-s curve of the O-cell pile test method after equivalent conversion has a high fitting degree with the results of the static load test, and the error is within 0.5%. The method in this paper is feasible to judge the bearing capacity of the foundation pile. The conversion coefficient value calculated using the method in this article is 0.97;
  • In practical engineering, it is often difficult for the upper and lower sections of piles to reach their ultimate state simultaneously. When designing loading schemes, it is not only necessary to consider the overall vertical bearing capacity of the pile, but sometimes it is also necessary to consider the individual bearing capacity of the upper or lower sections of the pile;
  • For the upper section of the pile, as the pile weight remains unchanged, the side friction resistance will gradually bear more loads. For the lower section of pile, the side friction resistance increases rapidly at the initial stage of loading, and plays a role first. As the load continues to increase, the side friction resistance gradually decreases and the pile tip resistance will bear more loads;
  • It is worth noting that this article only studies the load transfer behavior of O-cell test based on numerical methods, and compares their similarities and differences with traditional methods. In subsequent research, more influencing factors need to be considered, and further in-depth research should be conducted in combination with practical engineering applications.

Author Contributions

Conceptualization, X.X. and W.C.; methodology, P.Z.; software, J.W.; formal analysis, Y.S.; investigation, T.X.; resources, L.C.; data curation, P.Z.; writing—original draft preparation, Y.S. and Y.W.; writing—review and editing, X.X. and Y.W.; supervision, W.C. and Y.S. All authors have read and agreed to the published version of the manuscript.

Funding

This research was funded by the Southern Power Grid Technology Project (035100KK52220024/GDKJXM20220843).

Data Availability Statement

Some or all data, models, or code that support the findings of this study are available from the corresponding author upon reasonable request.

Conflicts of Interest

Author Xu, X.; Chen, W.; Chen, L.; Weng, J.; Xu, T. was employed by the company Chaozhou Power Supply Bureau of Guangdong Power Grid Co., Ltd. Author Zhu, P.; Song, Y. was employed by the company Guangdong Tianxin Electric Power Engineering Testing Co., Ltd. The remaining authors declare that the research was conducted in the absence of any commercial or financial relationships that could be construed as a potential conflict of interest.

References

  1. Eslami, A.; Heidarie Golafzani, S. Relevant data-based approach upon reliable safety factor for pile axial capacity. Mar. Georesources Geotechnol. 2021, 39, 1373–1386. [Google Scholar] [CrossRef]
  2. Hu, L.; Lou, X.; Zhou, M.; Xu, W. Static load study on in-situ steel pipe pile for offshore wind farm using self-balancing method. Ocean. Eng. 2023, 41, 407–412. [Google Scholar] [CrossRef]
  3. Zhang, G.; Ji, T.; Li, Z. Comparison of load test results between self-balanced method and static pressure method. Chin. J. Geotech. Eng. 2011, 33, 471–474. [Google Scholar]
  4. Dong, J.; Liu, Z.; Wang, G.; Li, P.; Liu, Z. Application of self-balance experimental method on pile bearing capacity in a pile foundation engineering. J. North China Univ. Water Resour. Electr. Power Nat. Sci. Edit. 2015, 36, 55–60. [Google Scholar]
  5. Wu, P.; Gong, W.; Liang, S. Reliability of O-cell test method for determining bearing capacity of piles. Chin. J. Geotech. Eng. 2005, 545–548. [Google Scholar]
  6. Zhou, J.; Yu, J.; Gong, X.; El Naggar, M.H.; Zhang, R. Field study on the behavior of pre-bored grouted planted pile with enlarged grout base. Acta Geotech. 2021, 16, 3327–3338. [Google Scholar] [CrossRef]
  7. Niazi, F.S.; Mayne, P.W. Axial pile response of bidirectional O-cell loading from modified analytical elastic solution and downhole shear wave velocity. Can. Geotech. J. 2014, 51, 1284–1302. [Google Scholar] [CrossRef]
  8. Bach, D.; van Gelder, P. Incorporating set-up into LRFD method for drilled shafts. Georisk 2014, 8, 81–91. [Google Scholar] [CrossRef]
  9. Xing, H.; Wu, J.; Luo, Y. Field tests of large-diameter rock-socketed bored piles based on the O-cell method and their resulting load bearing characteristics. Eur. J. Environ. Civ. Eng. 2019, 23, 1535–1549. [Google Scholar] [CrossRef]
  10. Li, X.; Dai, G.; Zhu, M.; Gong, E. Application of static loading tests to steel pipe piles with large diameters in Chinese offshore wind farms. Ocean Eng. 2019, 186, 106041. [Google Scholar] [CrossRef]
  11. Xin, Y.; Yue, F.; Li, P.; Wang, G. Experimental study on the position of balanced point of large-tonnage pile with O-cell load method in the northwest region. Appl. Mech. Mater. 2014, 580–583, 78–82. [Google Scholar] [CrossRef]
  12. Ou, X.; Chen, G.; Bai, L.; Jiang, J.; Zeng, Y.; Chen, H. Research on the analytical conversion method of Q-s curves for O-cell test piles in layered soils. Appl. Sci. 2022, 12, 8435. [Google Scholar] [CrossRef]
  13. Comodromos, E.M.; Papadopoulou, M.C.; Randolph, M.F. Improved relationships for the pile base response in clayey soils. J. Geotech. Geoenviron. Eng. 2021, 147, 10. [Google Scholar] [CrossRef]
  14. Lee, J.S.; Park, Y.H. Equivalent pile load–head settlement curve using a bi-directional pile load test. Comput. Geotech. 2008, 35, 124–133. [Google Scholar] [CrossRef]
  15. Chunlin, H.; Chengzhong, G. Comparison and analysis on O-cell method and anchored pile method in Qingdao Gulf Bridge. Adv. Mater. Res. 2014, 838–841, 1024–1027. [Google Scholar] [CrossRef]
  16. Cai, Y.; Xu, L.; Zhou, D.; Deng, C.; Feng, C. Model test research on method of self-balance and traditional static load. Rock Soil Mech. 2019, 40, 3011–3018. [Google Scholar] [CrossRef]
  17. Li, X.; Chen, X.; Dai, G.; Gong, W. Research on conversion coefficient of cast-in-situ pile in clay in O-cell loading test. Rock Soil Mech. 2016, 37, 226–232, 262. [Google Scholar] [CrossRef]
  18. Li, X.; Dai, G.; Gong, W.; Xu, X.; Wang, L. Research on conversion factor of self-balanced loading test in sandy soil. Rock Soil Mech. 2016, 37, 659–668. [Google Scholar] [CrossRef]
  19. Yang, J. Study on numerical simulation of Self-balancing test method for bearing capacity of expressway pile foundation. West. Chin. Commun. Sci. Technol. 2017, 87–90, 98. [Google Scholar] [CrossRef]
  20. Liu, J.; Shao, X.; Huang, X.; Cao, G. Study on behavior and bearing capacity computation method of shallow rock-socketed short piles based on the O-cell loading test. Comput. Intell. Neurosci. 2022, 2022, 7272219. [Google Scholar] [CrossRef]
  21. Su, H.; Li, R.; Lv, Y. Research on self balance test method and numerical simulation of bearing capacity of pile foundation. J. Phys. Conf. Ser. 2020, 1549, 032127. [Google Scholar] [CrossRef]
  22. Fang, Q.; Wang, J.; Wang, G.; Li, Q.; Ma, W. Intelligent back analysis using clonal selection algorithm in calculating equivalent top loading curve using O-cell test data. J. Cent. South Univ. 2023, 30, 3481–3498. [Google Scholar] [CrossRef]
  23. JGJ/T 403-2017; Technical Specification for Static Loading Test of O-Cell Method of Building Foundation Piles. China Architecture & Building Press: Beijing, China, 2017.
  24. JT/T 738-2009; Static Loading Test of Foundation Pile-O-Cell Method. China Communications Press: Beijing, China, 2009.
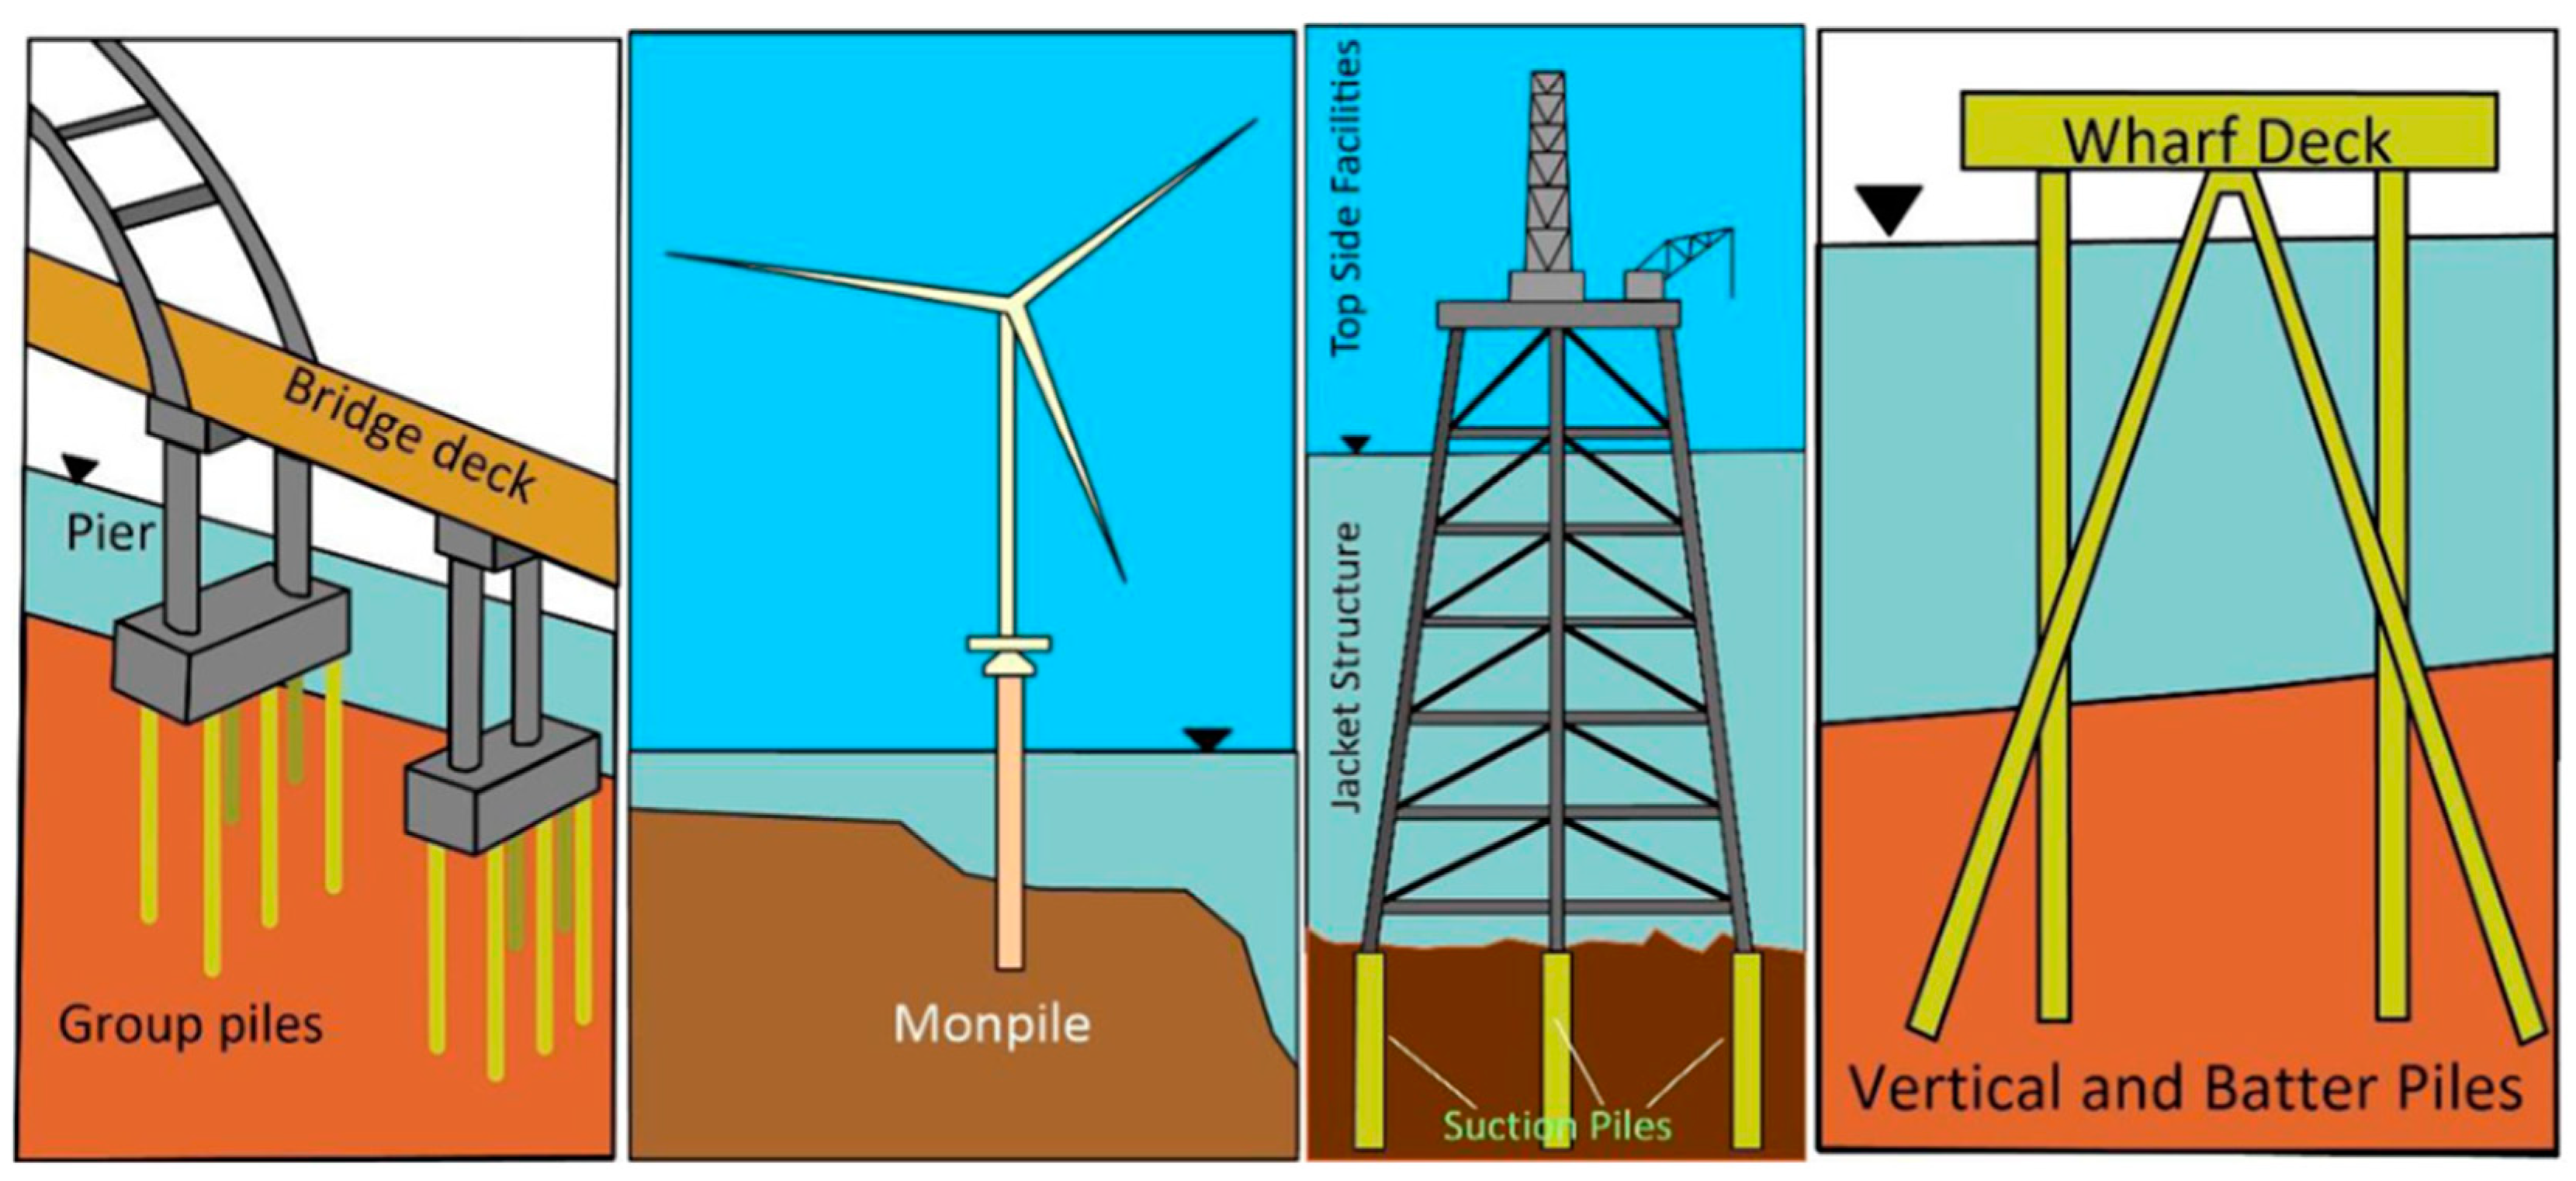
Figure 1. Typical applications of pile foundations in offshore engineering.
Water 16 00826 g001
Figure 2. Welding and testing of O-cell.
Water 16 00826 g002
Figure 3. Schematic of O-cell test method.
Water 16 00826 g003
Figure 4. Finite element model and mesh. (a) Pile–soil model; (b) Mesh generation.
Water 16 00826 g004
Figure 5. Q-s curve diagram of O-cell test. (a) Q-s curve of upper section pile; (b) Q-s curve of lower section pile.
Water 16 00826 g005
Figure 6. Q-s curve diagram of traditional static load test.
Water 16 00826 g006
Figure 7. Comparison of Q-s curves at different conversion coefficients.
Water 16 00826 g007
Figure 8. Axial force distribution under various load levels.
Water 16 00826 g008
Figure 9. Side friction resistance distribution under various load levels.
Water 16 00826 g009
Figure 10. Ultimate tip resistance at each load level.
Water 16 00826 g010
Figure 11. Distribution of yield region during loading process. (a) Step time = 3.75; (b) Step time = 4.95; (c) Step time = 6.95; (d) Step time = 8.00.
Water 16 00826 g011
Table 1. Calculation parameters of pile and soil.
MaterialElastic Modulus (kPa)Poisson’s RationUnit Weight (kN/m3)Cohesion (kPa)Friction Angle (°)
Soft clay layer15,0000.4718.5800
Sand layer150,0000.35203025
Bedrock1,200,0000.2523.540034
pile35,000,0000.1525--
Table 2. Proportion of bearing capacity of upper pile.
Load Level (kN)Self-Weight (kN)Side Friction Resistance (kN)
ValueProportionValueProportion
640133.2420.82%506.7679.18%
960133.2413.88%826.7686.12%
1280133.2410.41%1146.7689.59%
1600133.248.33%1466.7691.67%
1920133.246.94%1786.7693.06%
2240133.245.95%2106.7694.05%
2560133.245.20%2426.7694.80%
2880133.244.63%2746.7695.37%
3200133.244.16%3066.7695.84%
Table 3. Proportion of bearing capacity of lower pile.
Load Level (kN)Tip Resistance (kN)Side Friction Resistance (kN)
ValueProportionValueProportion
640427.0366.72%212.9733.28%
960573.8159.77%386.1940.23%
1280720.5856.30%559.4243.70%
1600871.5954.47%728.4145.53%
19201017.6053.00%902.4047.00%
22401172.4352.34%1067.5747.66%
25601332.0752.03%1227.9347.97%
28801591.2155.25%1288.7944.75%
32001899.9359.37%1300.0740.63%
Disclaimer/Publisher’s Note: The statements, opinions and data contained in all publications are solely those of the individual author(s) and contributor(s) and not of MDPI and/or the editor(s). MDPI and/or the editor(s) disclaim responsibility for any injury to people or property resulting from any ideas, methods, instructions or products referred to in the content.