Abstract
The efficient management of slurry, which is a by-product rich in nutrients derived from feces, urine, cleaning water, and animal waste that stands out for its high concentration of nutrients such as nitrogen, phosphorus, and potassium, is of vital importance, highlighting the importance of slurry management in storage ponds, which. The Murcia–Spain region has an important number of pig farms. Hence, infrastructures dedicated to managing by-products are necessary to prevent environmental pollution and eutrophication of groundwater. The aim of a recent study was to evaluate the relationship between electrical values and geochemical parameters of pig slurry stored in a pond using ERT and geochemical analysis. In addition, the study was designed to monitor the pond to determine the geochemical characteristics of the slurry and to assess the risk of lateral contamination. The study results indicate a noticeable decrease in electrical resistivity values at 0.4 and 1.6 m depth in surveys 1 and 2. The reduction ranges from 50 to 100 percent. This paper presents a new method for monitoring slurry ponds using electrical resistivity tomography. This non-invasive method provides detailed information on the distribution and characteristics of the fluids, as well as a clear picture of the electrical resistivity of the subsurface.
1. Introduction
Pig slurry is a nutrient-rich byproduct composed of pig feces, urine, cleaning water, feed remnants, and other animal waste [1]. This by-product material has crucial nutrients, including nitrogen, phosphorus, potassium, and various inorganic compounds (ammonia (NH3), carbon dioxide (CO2)) and organic compounds (methane (CH4), oil acids, phenolic compounds, proteins and peptides, organic phosphorus, humic and fulvic acids, and volatile organic compounds (VOCs)) [2]. The elevated concentration of these nutrients (N, P, K) underscores the highest importance of effective management of pig slurry, serving as a critical measure to mitigate environmental pollution concerns, notably the risk of groundwater quality deterioration due to eutrophication [3]. In the 2022 Global Pig Production ranking, Spain ranked third place due to a remarkable number of 88,437 pig farms located in the country [4]. Notably, the region of Murcia emerged as a prominent contributor, housing a notable 7% of the total pig farms, with a comprehensive count of 1444 farms and an approximate production of 72,000 m3 of slurry per year. The substantial presence of pig farms in this region underlines the essential need for dedicated infrastructure to efficiently manage and store the by-products generated by these porcine operations.
Presently, different legislation has been established to construct slurry storage ponds, such as the Water Resources (Control of Pollution. Silage, Slurry and Fuel Oil, England, Regulations 2010) [5], which aims to minimize water pollution risks. According to these regulations, slurry stores must be constructed at a minimum distance of 10 m from watercourses. They must also be adequately waterproofed and have sufficient capacity to accommodate four months of slurry production. An additional United States Department of Agriculture (USDA) regulation requires that the construction of slurry ponds be located in soils that meet permeability standards to prevent groundwater contamination, according to the Natural Resources Conservation Service—Conservation Practice Standard Code 313 (NRCS-CPS) [6]. To accomplish this, it is necessary to perform a thorough analysis of the pond sealing or lining through various geotechnical tests, including compacted soil treatment (Code 520), geomembrane or geosynthetic clay liner (Code 521), or concrete (Code 522). In Spain, RD 306/2020 [7] regulations require that storage facilities be closed and waterproofed by their natural structure or artificial conditioning. Similarly, the Council Directive of 12 December 1991 (91/676/EEC) [8] states that storage containers for pig slurry must have a capacity more significant than the amount of waste produced on the farm during its most extended period. The calculation of this capacity depends on the location of the farm and whether it is in an area vulnerable to nitrate pollution caused by nitrates used in agriculture. However, in the past, waste storage consisted of depositing by-products in open pits excavated in the ground, using in situ material as a sealing method. The environmental risks associated with possible slurry seepage from storage ponds are closely related to nitrate (NO3−) leaching, which can contaminate surface and groundwater in case of infiltration [9,10]. Non-destructive techniques are required to make measurements to ensure the stability and security of the slurry pond. These techniques should also provide a representation of the distribution of pig slurry in the storage pond and its infiltration into the surrounding soil, which can be obtained through the use of electrical resistivity tomography (ERT).
The electrical resistivity tomography (ERT) method is a geophysical technique with many applications, including marine [11], geotechnical, environmental [12], and composition of the soil, including building foundation prospecting, archaeological prospecting [13], landfill delineation [14], contamination [15], and chemical tracer studies [16,17]. This technique is based on measuring the electrical resistivity of soil [18], which is dependent on the geometry, pore size, and total porosity of the soil [19]. Therefore, ERT provides fast, low-cost, and accurate results in the subsurface [20]. Several studies have highlighted the effectiveness of ERT in identifying and determining the extent of leachate contamination in urban waste [21,22]. For instance, Akiang et al. [23] applied ERT to identify the infiltration zones of leachate and map out the surface areas contaminated by leachate in an urban waste site. Similarly, Morita et al. (2022) [24] demonstrated the successful use of ERT in identifying covered and uncovered zones and boundary zones within an exposed landfill. Moreover, Zaini et al. (2022) [25] established that ERT is one of the most effective methods for evaluating the existence and extent of leachate in urban landfills. Additionally, Udosen et al. (2022) [26] conducted geoelectrical modeling using ERT to determine the extent of leachate contamination at a landfill site in southeastern Nigeria. A few studies have explored the impact of slurry on soil and groundwater. Capa-Camacho et al. [27,28] used geophysical and geochemical techniques to identify areas affected by slurry and found that the most significant accumulation of contaminants occurs at two meters depth. Martínez-Pagán et al. [29,30] demonstrated the effectiveness of electrical resistivity tomography (ERT) in assessing the impact of slurry ponds on the subsoil. These studies show the potential of ERT to delimit the subsoil areas affected by slurry ponds and to characterize the physicochemical properties of these areas. Conversely, monitoring the development of the possible infiltration plume in slurry ponds has not been carried out.
With ERT, one of the ways to corroborate the results can be by geochemical techniques, which are crucial to studying the composition of fluids, soils, and rocks in various environmental contexts [31]. However, conventional geochemical methods to analyze the possibility of slurry seepage into a storage pond intended for containment require the collection of samples at specific locations in the pond. These methods, while valuable, do not provide a global understanding of the subsurface conditions throughout the pond. In contrast, tomographic techniques, such as the ERT method, offer a unique advantage by allowing continuous and noninvasive global subsurface monitoring of the subsoil. ERT generates a subsurface image consisting of spatially distributed apparent electrical resistivity values, facilitating a more holistic and dynamic assessment of the entire storage pond [32,33]. This approach is advantageous when investigating potential slurry infiltration, as the tomographic technique can effectively identify preferential pathways and areas vulnerable to slurry infiltration without the limitations of discrete sampling points [27,29,34].
Using the ERT method to monitor a slurry pond is a novel approach. This non-invasive technique provides detailed information on the distribution and characteristics of the fluids in the pond. It offers a clear image of the electrical resistivity of the subsurface materials, which helps to identify the composition and concentration of fluids present in the pond. This is crucial for understanding slurry dynamics and making informed decisions around waste management. Furthermore, ERT allows for the detection of changes in the electrical resistivity of the soil. This information can be used to identify the presence and movement of liquids, which is essential in predicting and preventing environmental issues related to slurry management. Implementing ERT is essential in promoting sustainability and minimizing negative impacts on the surrounding environment [35].
The main objective of this work was to evaluate the relationship between the electrical values and geochemical parameters of pig slurry stored in a pond using ERT and geochemical analysis. ERT was used as a proxy to understand the different conditions of the pig slurry inside the slurry pond. Additionally, the analysis aimed to monitor the pond to determine the geochemical characteristics of the pig slurry and assess the risk of contamination through lateral and vertical seepage.
2. Materials and Methods
2.1. Study Area
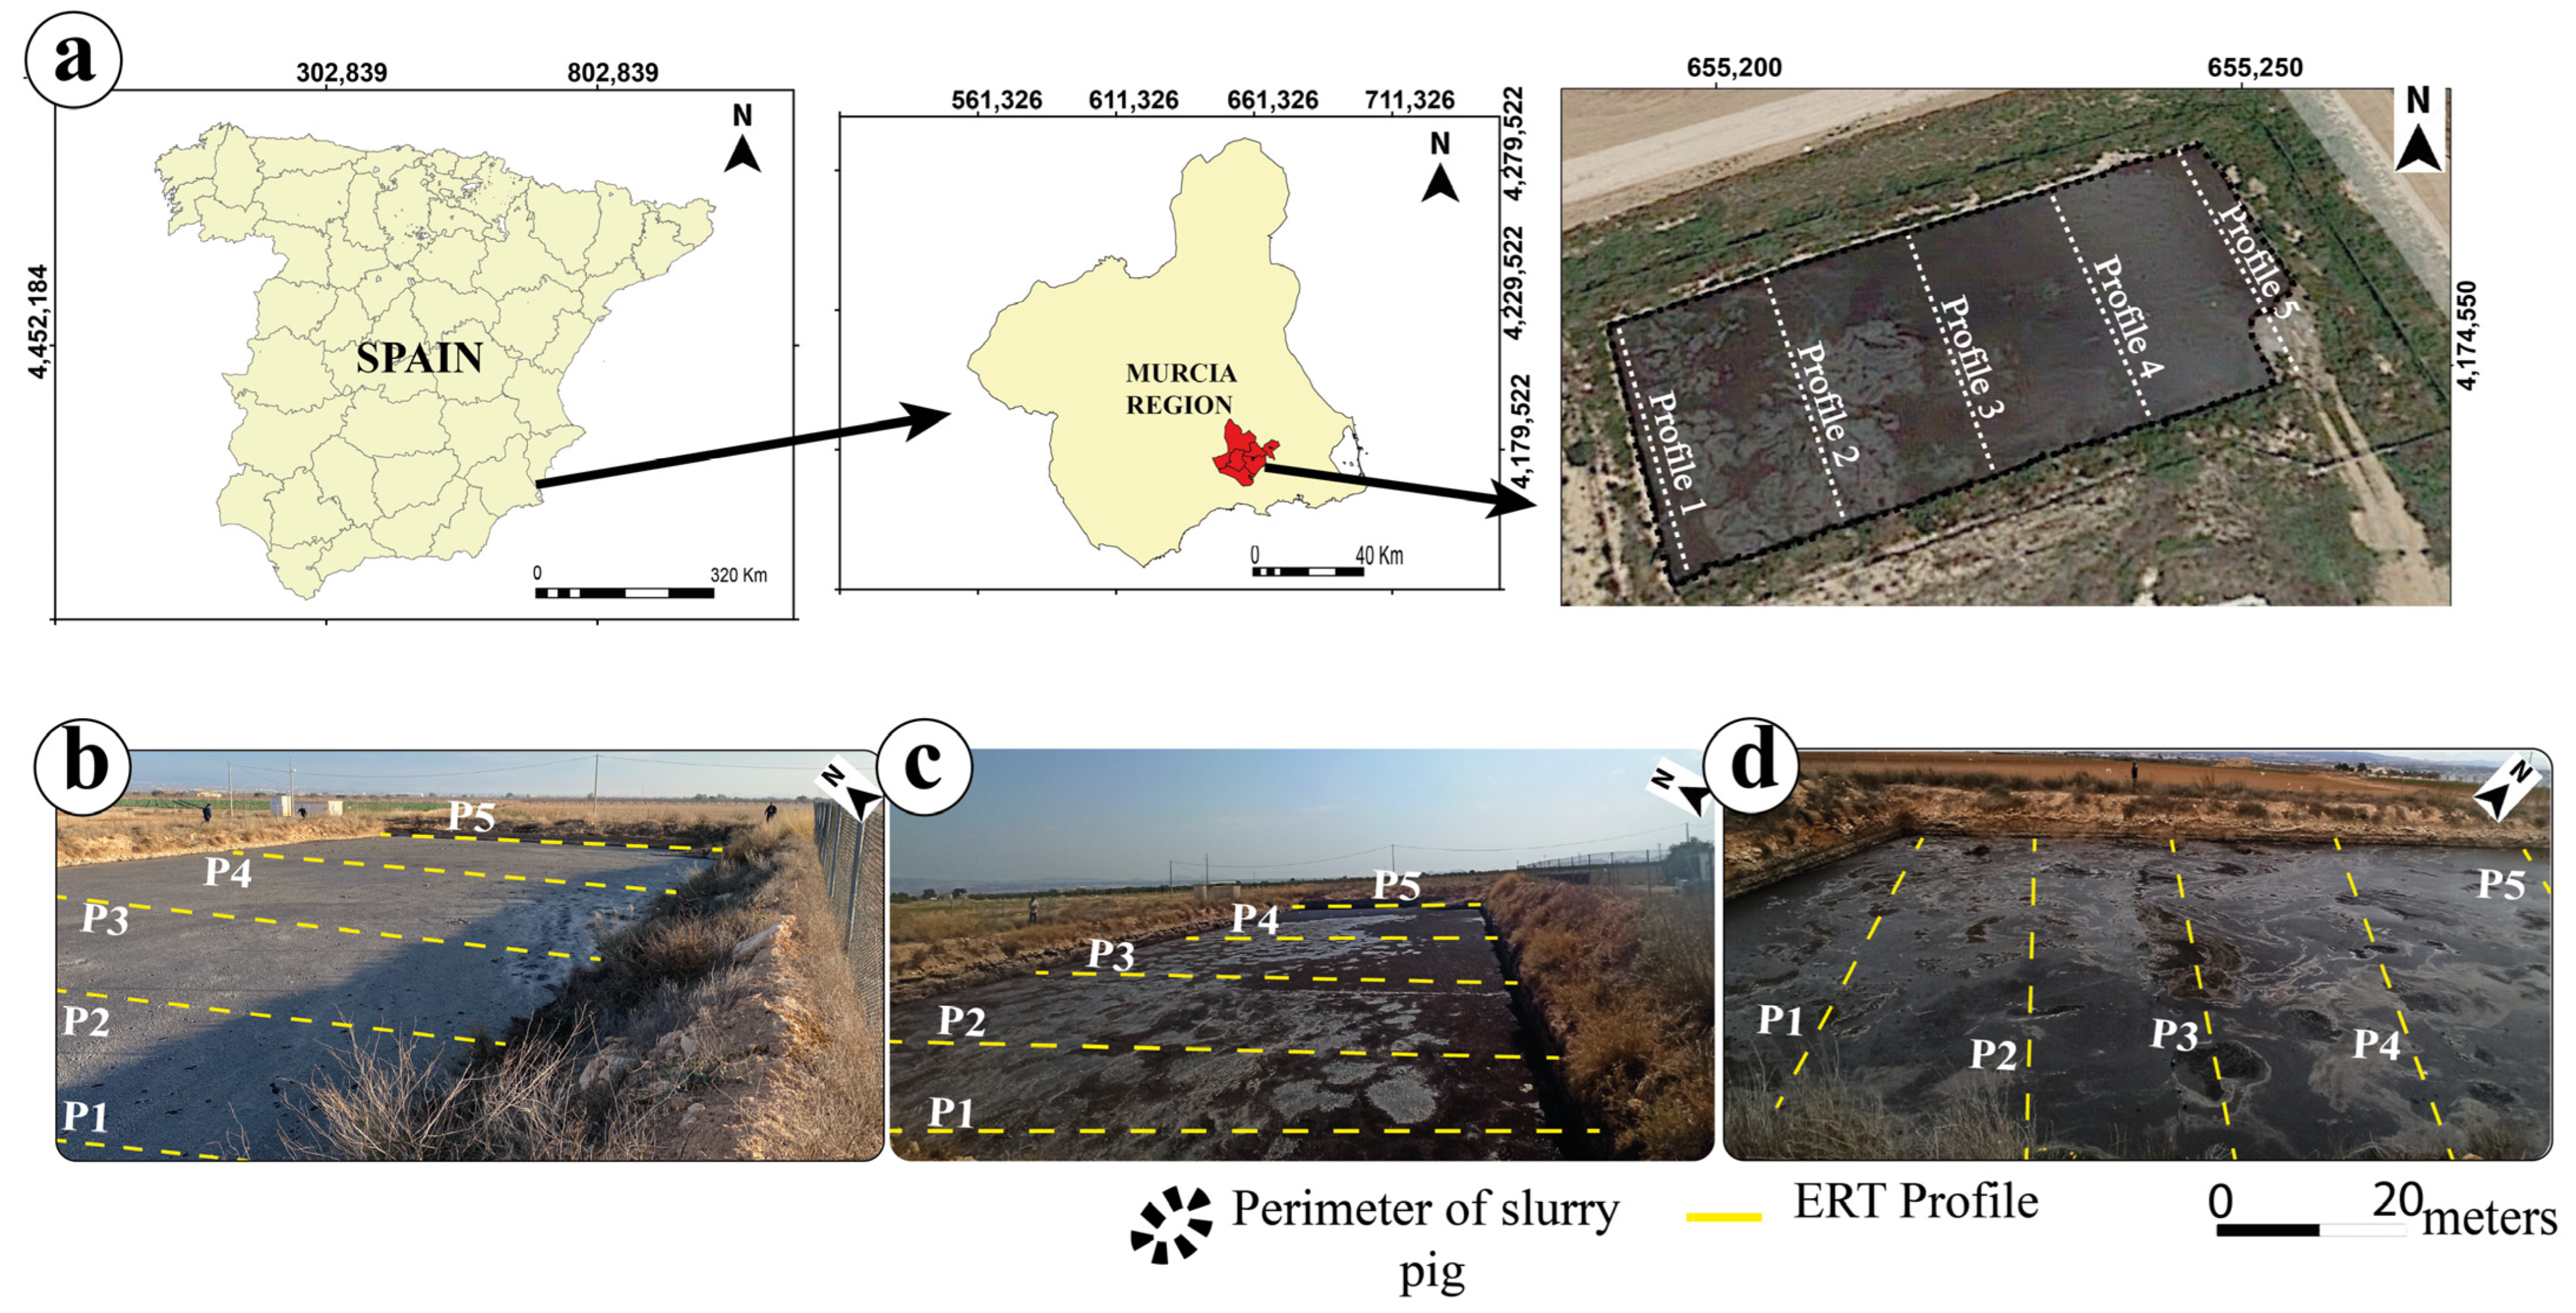
Fuente Álamo is a municipality (Region of Murcia, SE Spain) (Figure 1a) with 244 pig farms annually producing around 12,000 cubic meters of slurry. Moreover, Fuente Álamo is located near the Mar Menor coastal lagoon, where nitrates from agriculture and cattle raising can cause contamination [36,37]. This zone has an average annual temperature of 17.3 °C and receives a yearly rainfall of 321 mm [38]. The geological composition of the Fuente Álamo municipality can be found on sheet 955 of the National Geological Map (MAGNA) 1:50,000 [39]. The northern part is characterized by gravel, conglomerates, sands, and silts, while the southern region is composed of undifferentiated Quaternary. Regarding hydrogeological characteristics, Fuente Álamo is located in the “Campo de Cartagena” region, a complex and huge hydrogeological unit comprising several aquifers. These aquifers are characterized by Neogene Quaternary materials, primarily consisting of loamy soils with dendritic and calcareous intercalations from the Miocene to the Quaternary, resulting in various aquifer levels [40]. Remarkably, the “Quaternary” aquifer is prominent within the study area, composed of 20–150 m of gravels, sands, silts, clays, and caliches deposited on tertiary marls, which act as an impermeable base.
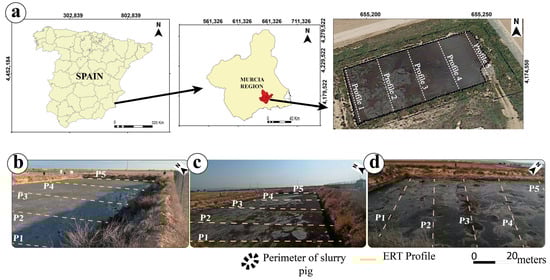
Figure 1.
Location and schema of the selected slurry pond. (a) Geographical location of the studied pond in southeast Spain; layout of ERT profiles in the slurry pond (b) in survey 1, (c) in survey 2, (d) in survey 3.
Consequently, a slurry pond in this municipality was chosen as a point to employ the ERT method to monitor potential slurry (Figure 1a). The year of construction of the slurry pond corresponds to the year 2001; the type of production system of the farm is intensive (fattening) with a maximum capacity of 4000 animals per year with an average weight of 120 kg and an approximate annual slurry production of 2830 m3/year. The type of waterproofing used in the slurry pond construction is natural, i.e., soil from the area was used. The pig slurry pond has a storage capacity of 2867 m3 with dimensions of 64 m in length, 28 m in width, and 1.6 m in depth (Figure 1a).
2.2. Electrical Resistivity Tomography
During the ERT measurement process, an electrical current (I) is injected into the soil through a pair of electrodes, and the resulting difference of potential (V) is measured between another pair of potential electrodes. By comparing the voltage measured at the potential electrodes to the current input at the current electrodes, an apparent resistivity value (ρa) is obtained in Ohm·m. The resistivity mapping of the area of study is presented in 2D and 3D pseudo sections after an inversion process [16]. Different electrode arrangements can be used to determine the apparent resistivity at varying depths and lateral positions [41].
ERT was conducted within the slurry pond using a modified marine cable from Advanced Geosciences Inc (AGI). The modifications involved adding polyethylene floats and plastic clamps to the line, which allowed the graphite electrodes to float on the surface of the slurry pond. We employed a 28-electrode dipole–dipole array with one-meter spacing between electrodes for the measurements, providing acceptable penetration and horizontal resolution. This array also enabled 2D modeling by producing pseudo sections that yielded insightful information [18,42]. The AGI SuperSting R4 resistivity meter was used for field data collection. Five profiles were performed to monitor the slurry pond with a 15 m separation between each profile (Figure 1a). The pond was measured three times—the control measurement was conducted in December 2020 (Figure 1b), named survey 1, while the second and third field measurements were carried out in July 2021 (Figure 1c) and January 2022 (Figure 1d), named survey 2 and 3, respectively. EarthImager 2D v. 2.4.2 software was employed to process the raw electrical data. Firstly, a post-processing stage was undertaken to eliminate outliers and perform static correction to normalize the resistivity variations caused by the difference in electrode elevation. Then, smooth inversion was carried out on the apparent electrical resistivity values obtained from the control pond. Smooth model inversion, also known as inversion of Occam, is a mathematical technique determining the smoothest possible model that can fit the data while adhering to an a priori Chi-square statistic. This approach is predicated on assuming a Gaussian distribution of data errors. By minimizing the roughness of the model, smooth model inversion aims to generate a model that is most representative of the data without overfitting. The percentage value of the root mean square error (RMS), which indicates the mismatch between the field measurements and model data [43], was less than 10% for the modeling of each ERT profile section. The interpolation of 2D sections to 2D models at different depths was calculated using the commercial software Surfer v. 25.4.320 by Golden Software.
2.3. Pig Slurry Sampling
The selected slurry pond was examined three times, with three samples collected during each survey. The first survey was conducted in December 2020, with samples taken at different points along the pond. The second and third surveys were conducted in July 2021 and January 2022, respectively. As soon as the laboratory received the slurry samples, they were promptly stored at 4 °C to prevent any probable chemical or biological reactions.
The sample pH and electrical conductivity (EC) measurements were carried out using the HANNA Instrument portable equipment model HI 9025(Hanna Instruments S.L. Eibar, Spain). The measurement is taken directly from a homogenized sample. The pH and EC values are read once the reading stabilizes in the values parameter with a standard temperature of 25 °C [41]. To determine the total suspended solids (TSS), 1 mL of the homogenized sample was filtered through a glass fiber filter and dried at 60 °C for 24 h. The sample was filtered using a Watman filter with a 0.45 µm pore size and a Vacuum Brand vacuum pump (method 2440-D, APHA-AWWA-WEF, 2012) [44]. The TSS units of measurement are expressed in g L−1. Total nitrogen (TN) is the collective amount of all forms of nitrogen in a sample. Furthermore, Kjeldahl nitrogen (NK) is a subset of TN encompassing organic and ammoniacal nitrogen and nitrates and nitrites. Measuring NK involves treating the sample with a combination of sulfuric acid and catalyst at 400 °C for 40 min. The distilled sample is then titrated using 0.1 N hydrochloric acid [45]. Ammoniacal nitrogen (N-NH4+) is measured without treatment, while organic nitrogen (NO) is calculated by subtracting N-NH4+ from NK. Lastly, nitrate (NO3−) and nitrite (NO2) are measured separately using ion exchange chromatography.
2.4. Statistical Analyses
The IMB SPSS 23 program was used to analyze the data for descriptive statistics. To identify significant differences in the chemical compositions of the slurry during the three surveys, a one-way analysis of variance (ANOVA) was performed, followed by Tukey’s post hoc test at p < 0.05. The different letters assigned by Tukey’s post hoc test (a, b) indicate statistically significant differences among the means of each parameter. The same test was also used to determine statistical differences between the resistivity values obtained through ERT during each survey and at different depths.
3. Results and Discussion
3.1. Electrical Resistivity Tomography of Pig Slurry
The average resistivity of the slurry during the three surveys was 0.97 Ohm·m, 1.42 Ohm·m, and 3.18 Ohm·m for surveys 1 in 2020, 2 in 2021, and 3 in 2022, respectively. A comparison between the 2D ERT sections from the ERT in each of the periods in the selected slurry storage pond shows the changes in the resistivity of the slurry accumulated in the pond and the variations of these resistivities at depth (Figure 2). The depth of the slurry pond is 1.6 m, which was confirmed by using ERT during each survey. The 2D ERT sections showed variations in the resistivity values from survey to survey, evidencing the aging of the slurry reflected in the three layers that were distinguished in each survey. The formation of these three layers within the slurry pond is consistent with the pig slurry behavior, which, in natural decantation, separates 45–57% of the suspended particles with a diameter greater than 400 µm, forming three distinct layers: the crust zone, the most liquid part, and the sedimentation zone [46].

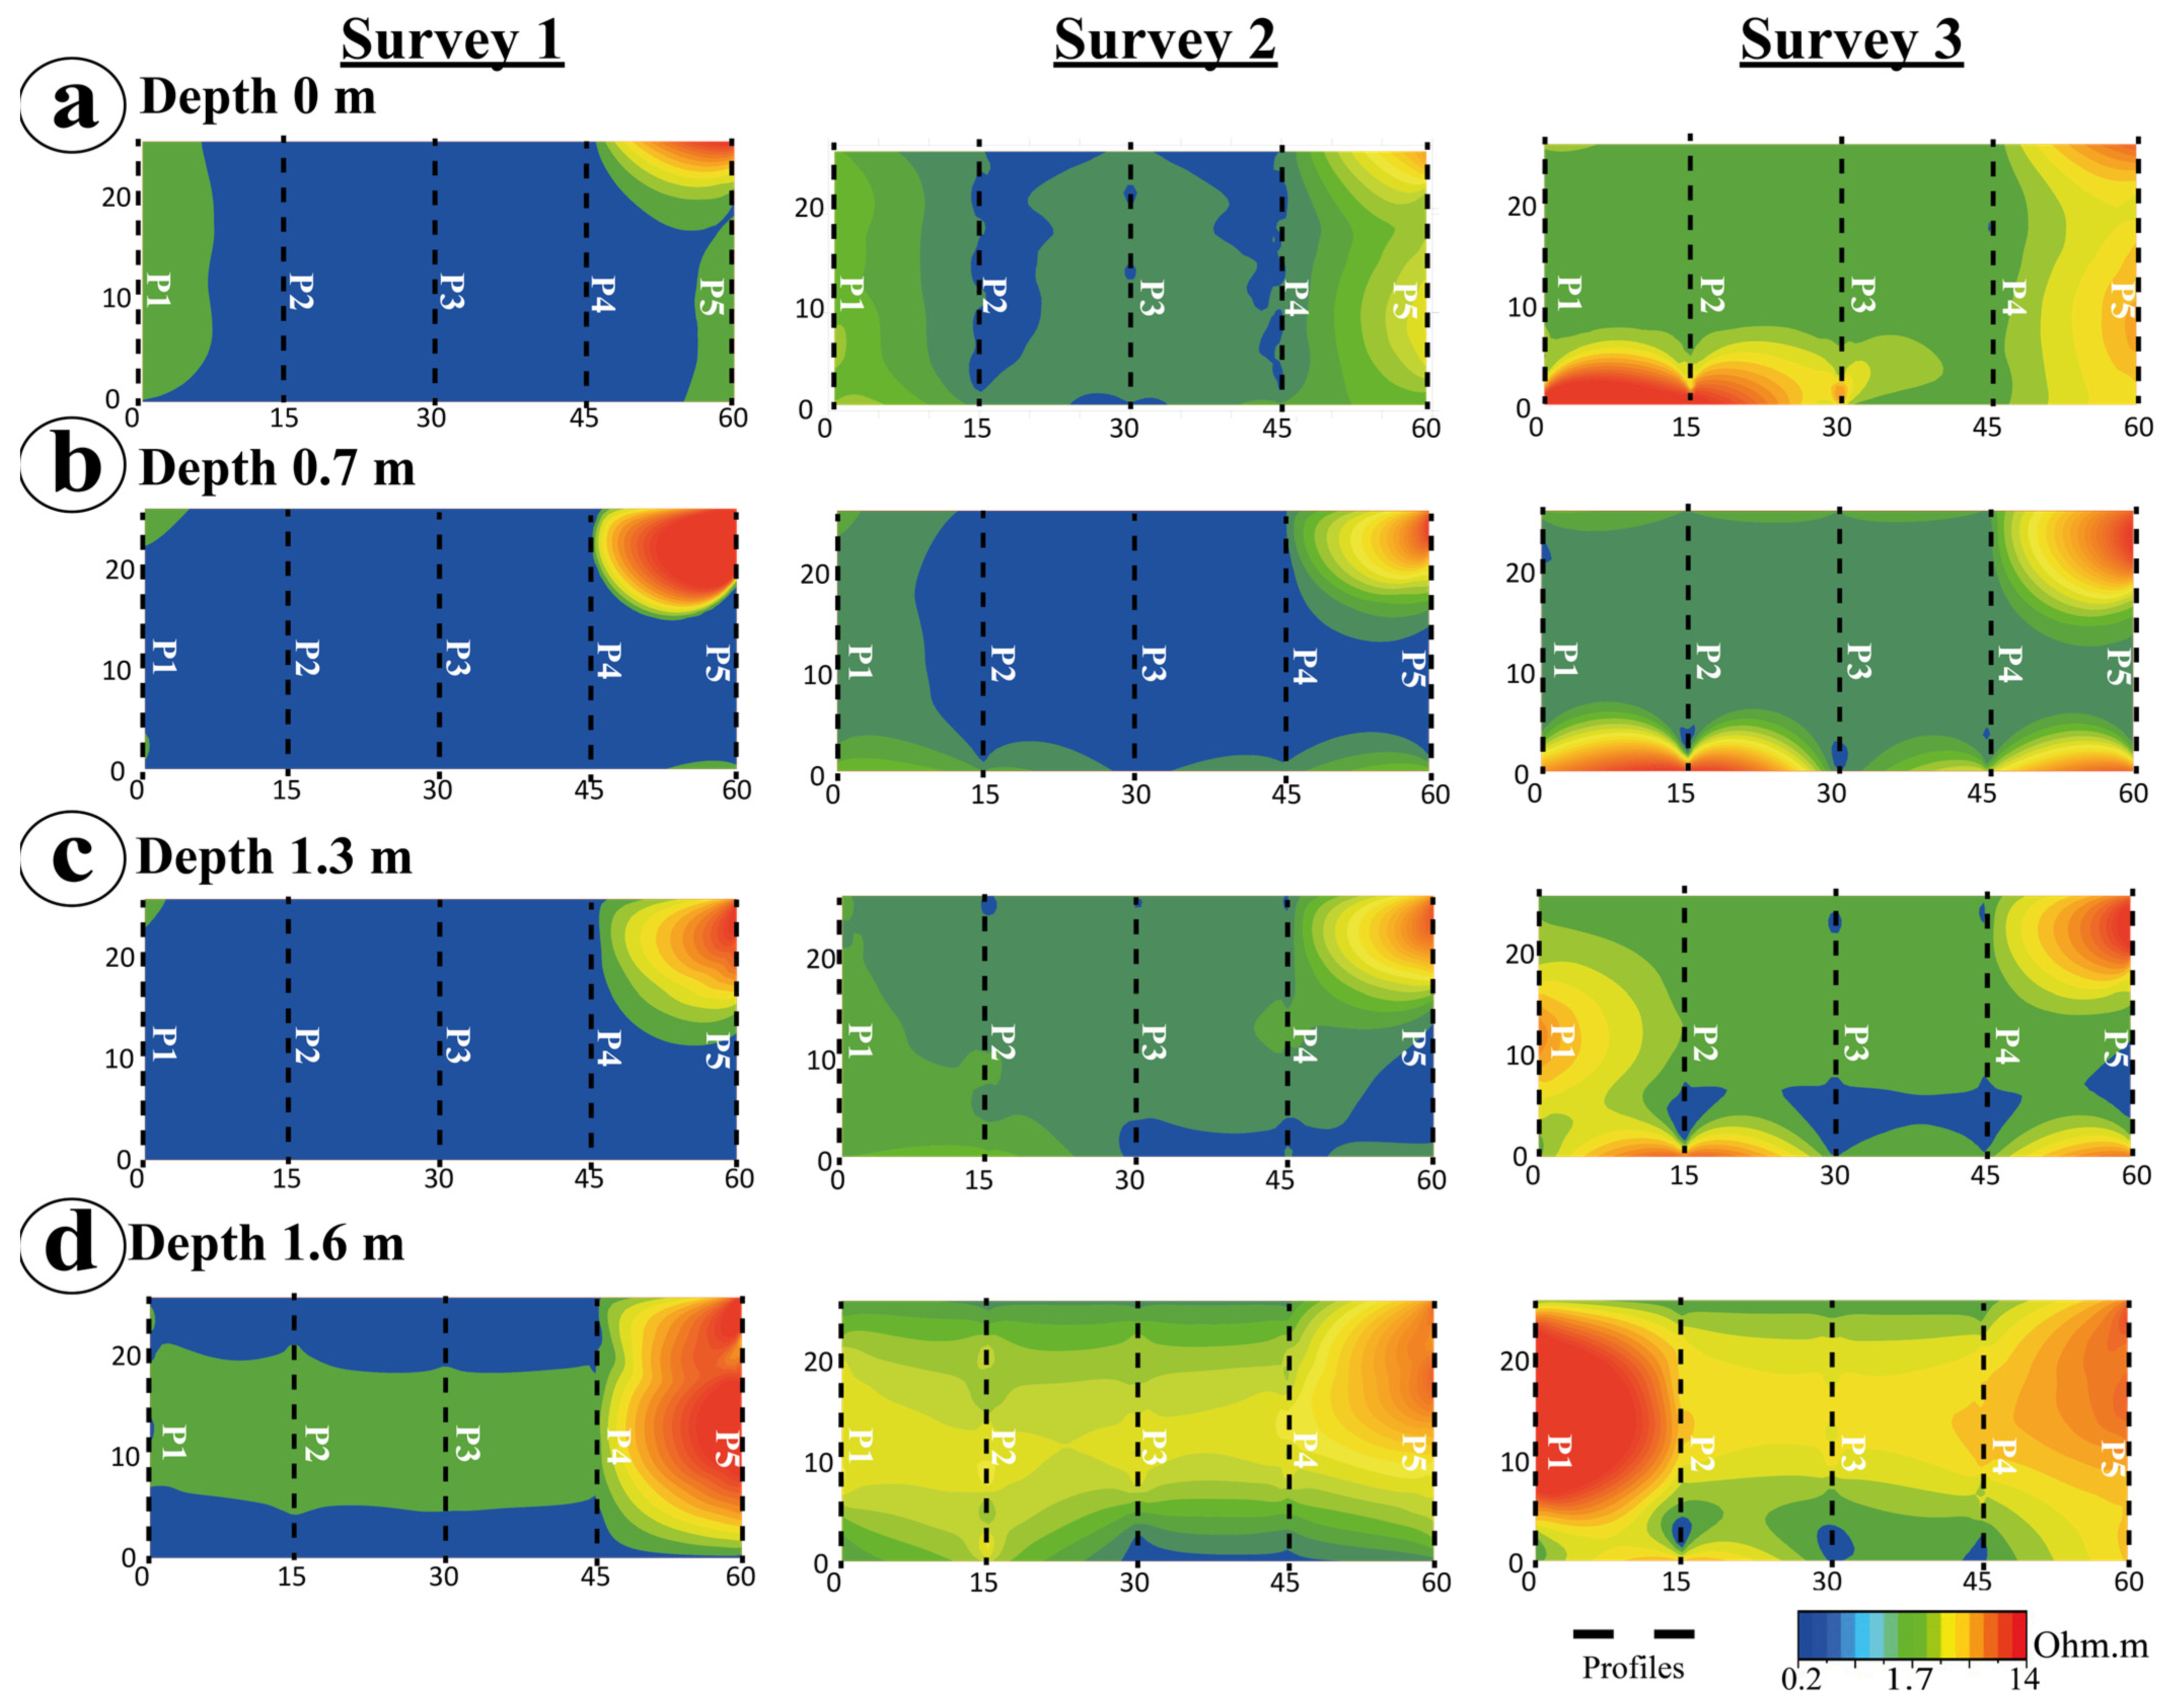
Figure 2.
Horizontal sections of the resistivity model of the pig manure pond. The resistivity distribution is represented for the following depths: (a) surface (0 m), (b) 0.7 m, (c) 1.3 m, (d) 1.6 m. The depth of 1.6 m represents the bottom of the pond.
Figure 3 shows an increase in resistivity values from one survey to the next. Furthermore, the resistivity values also exhibit variability based on the depth within the slurry pond, which can be categorized into three distinct layers. In survey 1, the average resistivity value is 0.97 Ohm·m. However, at a depth of 0.7 m, the average resistivity value rises to 1.97 Ohm·m, and at the bottom of the pond, it further increases to 3.08 Ohm·m. For survey 2, the average surface value of the slurry increases to 1.42 Ohm·m; this is attributed to the formation of the crust. In the center of the pond, the average value of the slurry decreases to 0.81 Ohm·m, corresponding to the liquid part of the slurry, and at depth, this value increases to an average value of 3.02 Ohm·m. The same behavior is observed in survey 3, where the surface crust zone shows a value of 3.18 Ohm·m, the liquid slurry zone shows an average value of 1.65 Ohm·m, and the bottom of the pond shows a remarkable increase with an average value of 7.13 Ohm·m (Figure 2).
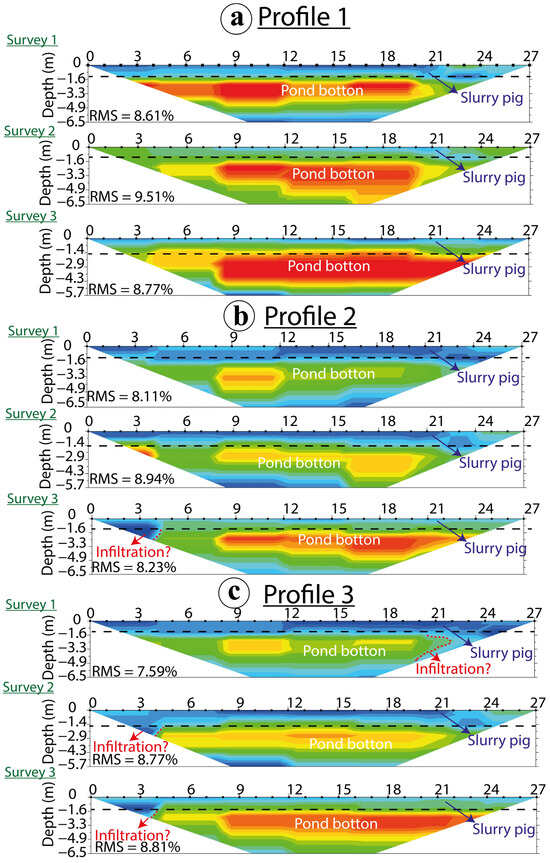
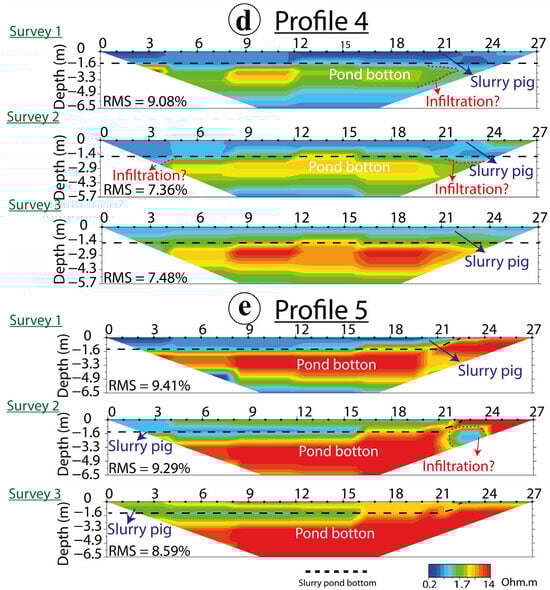
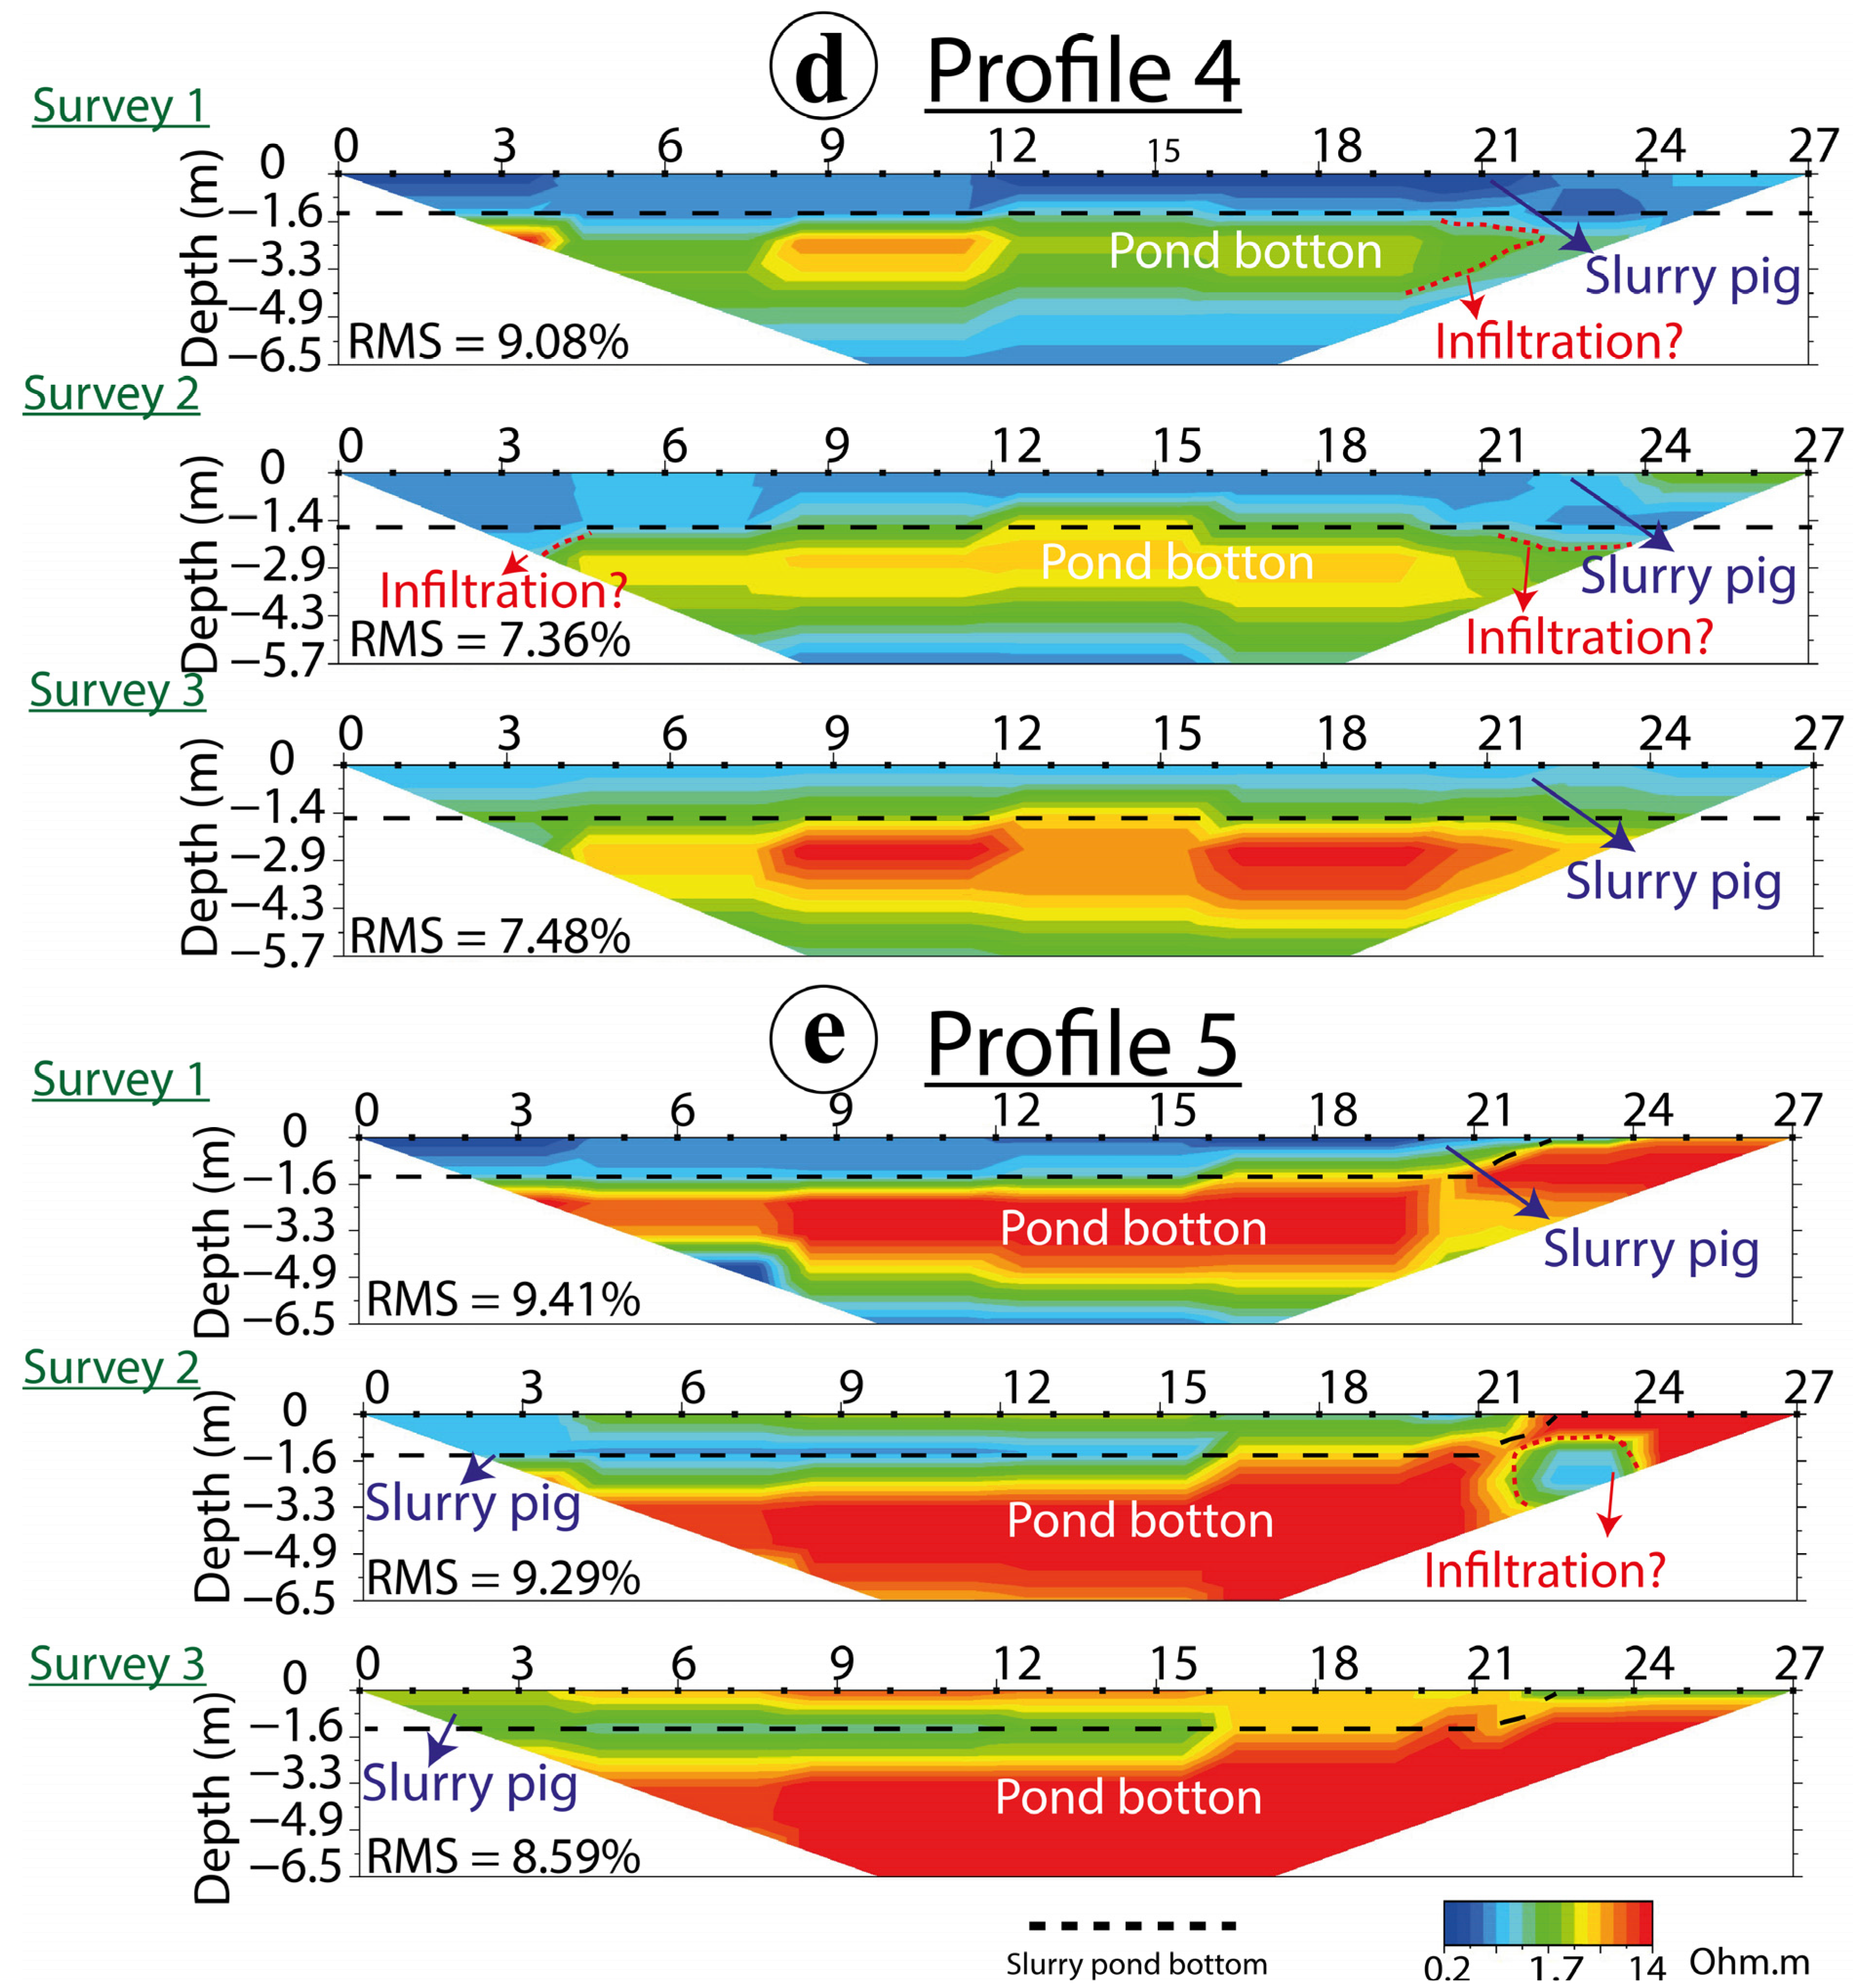
Figure 3.
ERT 2D electrical section comparison of (a) profile 1, (b) profile 2, (c) profile 3, (d) profile 4, and (e) profile 5; retrieved from surveys 1, 2, and 3.
The resistivity values obtained in the three ERT surveys are consistent with similar values reported in other studies for pig slurry [27,29,34]. The superficial electrical resistivity values of each profile with respect to survey 1 (0.97 Ohm·m) indicated an increase of 146% (1.42 Ohm·m) for survey 2 and a further increase of 328% (3.18 Ohm·m) for survey 3 (Figure 2). The increase is attributed to the elevated crustal content at the surface. The crustal content corresponds to the solid surface layer that develops on top of pig slurry ponds, commonly referred to as the pig slurry crust. This crust results from several physical and chemical factors and environmental conditions, such as temperature. However, the increase in resistivity values was higher at the bottom of the pond. All profiles from the first survey showed a lower resistivity at depth (3.08 Ohm·m), indicating less sediment accumulation of the slurry at the time of measurement at the bottom of the pond. In contrast, the resistivity value in the pig slurry pond profiles from the second survey at the base was similar with a value of 3.02 Ohm·m, and the slurry in this survey had a higher crust concentration on the slurry surface (Figure 3). Likewise, survey 3 revealed an increase in resistivity values compared to previous surveys, indicating a higher accumulation of slurry sediment at the bottom of the pond than the first and second. Survey 3 was conducted six months after the second and eleven months after the first. The 2D ERT sections at the depth of the bottom showed a 236% (7.13 Ohm·m) increase in ground electrical resistivity compared to the second survey (3.02 Ohm·m) and an increase of 232% (7.13 Ohm. m) compared to the first survey (3.08 Ohm·m).
The results of the three surveys conducted on the slurry pond are displayed in Figure 3. The profiles show that the slurry had a more liquid consistency in the first survey, resulting in lower resistivity values. However, the resistivity values increased in subsequent surveys, leading to higher values. In fact, we also noticed more crust on the surface of the pig slurry than in previous surveys (Figure 1). This is attributed to the fact that during storage in the slurry pond, the particles settle by natural gravity, resulting in a solid–liquid separation process. Thus, this separation process causes an increase in the resistivity value at the bottom of the pond by sediment accumulation [47]. These waste materials, with higher resistivity values, may suggest lower water content [40], while on the surface, the slurry forms that hard crust covering the liquid part, which is observed in contrast obtained in the 2D ERT sections for the first, second, and third surveys.
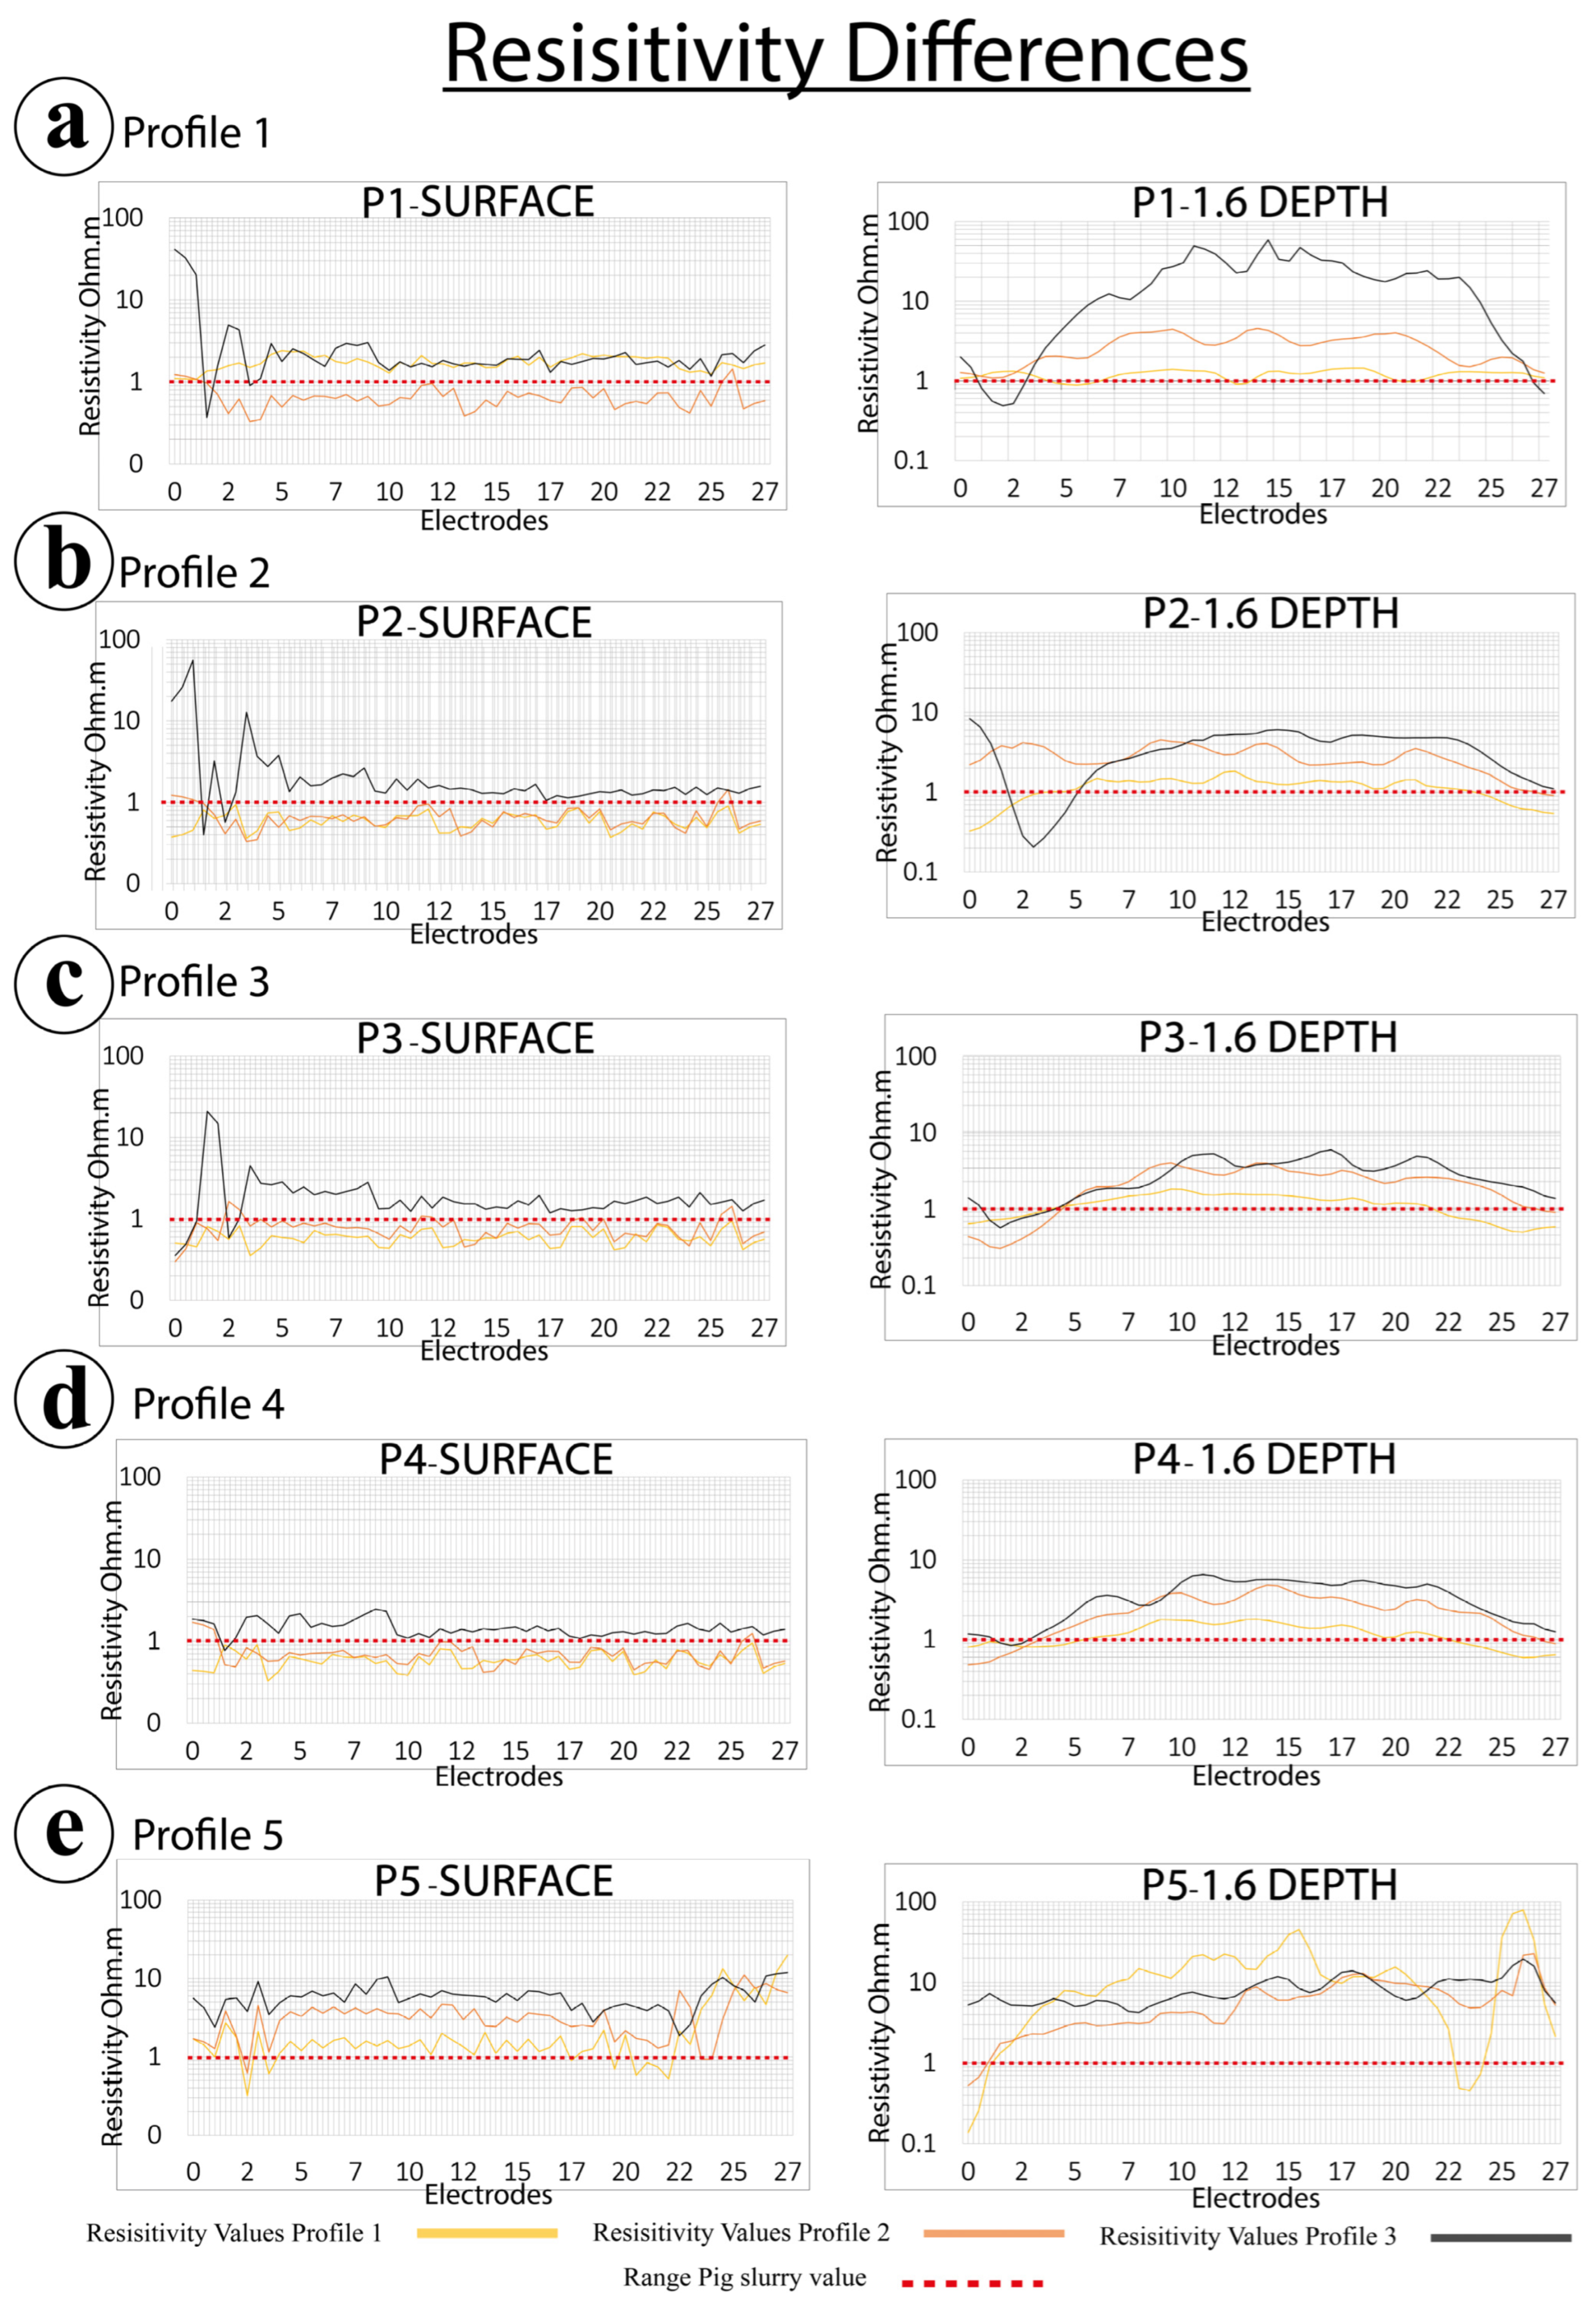
Overall, the resistivity values tended to increase during the ERT analysis. However, interestingly, the ERT identified specific areas in the pond at a depth of 1.6 m where the resistivity values decreased. Figure 3 depicts this resistivity difference, which was primarily concentrated in profiles 2, 3, 4, and 5, specifically between electrodes 1 and 3, located at the edge of the pond.
The resistivity values of profile 1 increased from one survey to the next. However, the third survey showed a decrease in resistivity values to less than 1 Ohm·m for the first three electrodes at depth. This behavior is consistent across profiles 2, 3, and 4 and coincides with electrodes 1 and 3 (Figure 3). This decrease in the resistivity value could be attributed to the different degrees of saturation of the soil, probably due to the introduction of the slurry, which includes the infiltration of salts prevalent in slurry [48], allowing a reduction in the resistivity, making the soil more conductive [49,50]. In addition, the findings above indicate that the slurry may have spread laterally due to the soil composition in this region [51], because the decrease in electrical resistivity values was observed under the electrodes situated adjacent to the slurry pond side.
Also, analyzing surveys 1 and 2, it becomes apparent that the electrical resistivity values differ from those of survey 3. This disparity is especially noticeable in the electrodes where no decrease in resistivity value was detected during survey 3. To highlight, the resistivity values at the bottom for surveys 1 and 2 closely align with the 1 Ohm·m range commonly associated with pig slurry (Figure 4). This can be attributed to the composition of the slurry. The slurry in surveys 1 and 2 exhibited a more fluid consistency, which may have facilitated throwing into the soil. This finding suggests that the fluidity of the slurry plays a crucial role in the ability to penetrate the soil and also emphasizes the significance of monitoring the pond from the interior and the perimeter of the pond for potential external contamination [51]. In cases where low resistivity values are observed, it could be an indication of pig slurry seeping into the soil. This is because the presence of dissolved salts in the pig slurry initially causes an increase in electrical conductivity, which consequently lowers the resistivity of the soil [52]. However, as the soil dries up and the salts become more concentrated, the resistivity may increase due to a higher concentration of dissolved salts in the dry soil [53]. This is evidenced by the increase in the resistivity value from survey to survey at the bottom of the pond.
Figure 4.
Differences in the electrical resistivity values on the surface and at the bottom of the slurry pond measured at each electrode between studies 1, 2, and 3 for (a) profile 1, (b) profile 2, (c) profile 3, (d) profile 4, and (e) profile 5.
In addition, a noticeable decrease in electrical resistivity values was observed under the electrodes located outside the pond, specifically in profile 5, from electrodes no. 22 to no. 27, at a depth of 0.4 m and 1.6 m in surveys 1 and 2 (Figure 3). This decrease in resistivity values was more pronounced in Figure 4, which showed values below 1 Ohm in survey 2. This reduction can be attributed to an external infiltration that may compromise the efficacy of the slurry containment system [54].
3.2. Pig Slurry Characterization and Statistical Analysis
As a result of the differences obtained by the ERT for each level within the slurry pond, the average resistivity values at three different depths were examined. The surface, middle, and depth resistivity values of the slurry showed no significant differences in profiles 1 to 5; therefore, the mean value of the pig slurry was analyzed for each survey. The analysis determined that surveys 1 and 2 differ statistically from survey 3 (Figure 4).
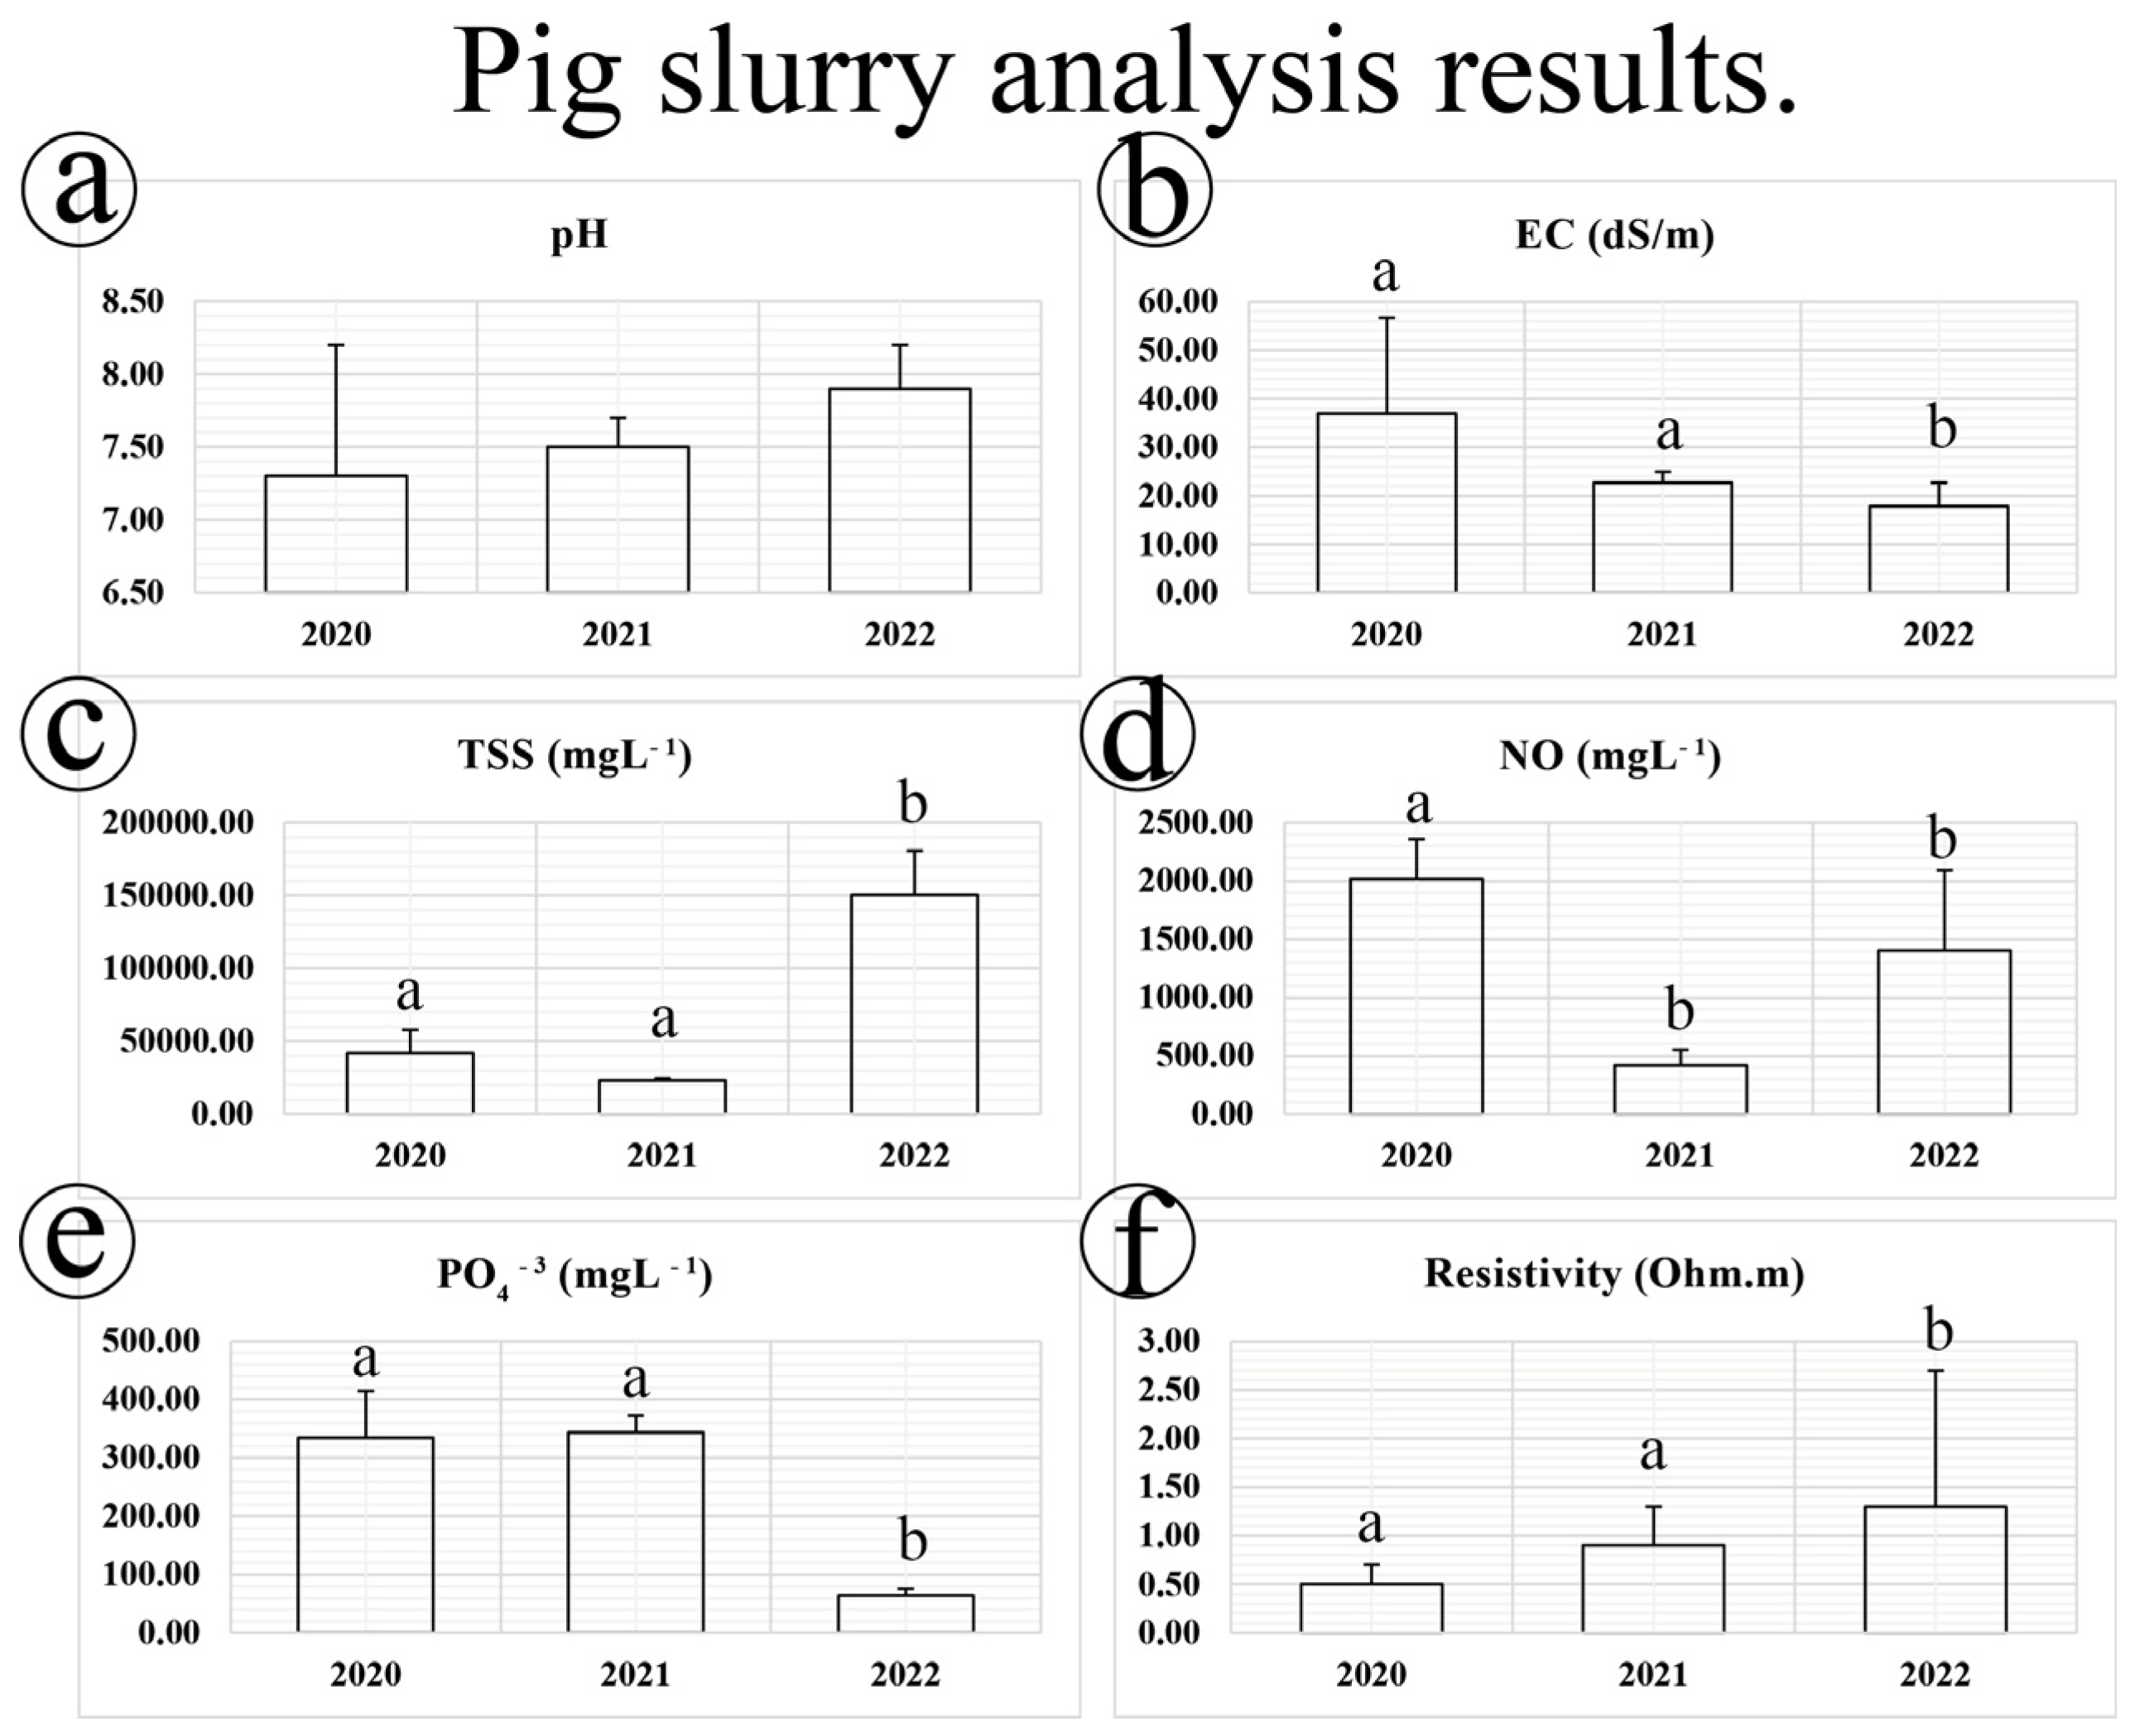
For the chemical characterization of the pig slurry, the initial survey yielded an average pH of 7.3, and subsequent surveys showed a marginal increase that did not reach statistical significance. The fluctuations in pH levels across the analyzed slurry samples can be attributed to variances in salt intake through the feed and changes in water volume added during cleaning procedures [1]. The EC values ranged from 37 dS/m to 17.9 dS/m; the results indicated significant differences in the values obtained from surveys 1 and 2 compared to survey 3, consistent with the resistivity values (Figure 4). This could be attributed to the slurry storage time, since an influential factor in the electrical conductivity value is the organic matter content [55], which can be reduced by the storage time of the pig slurry in the pond [56]. Over time, the TSS values in the surveys increased, with notable disparities between the first and second surveys compared to the third. The gradual rise in TSS levels suggested a progressive buildup of solid particles in the pond; this could be attributed to the fact that the TSS amount was considerably more significant for the third survey, which increased the slurry resistivity value, as suspended particles within the fluid act as insulators, increasing resistivity [57].
Additionally, significant differences were observed between the PO4−3 values of surveys 1 and 2 compared to survey 3 (Figure 5). The variances in the PO4−3 concentrations found in the slurry pond result from biogeochemical occurrences [58]. Inorganic phosphate is one of the different types of phosphorus present in pig slurry. This is because around 50–60% of the phosphorus in their food is excreted by pigs through their feed and urine, as their digestive system cannot fully absorb it [59]. As organic matter decomposes in the slurry, specific chemical reactions may cause phosphate to be released or retained on the surface. According to research by Masse et al. [60] and Christensen et al. [61], approximately 70% of the undissolved phosphorus in swine manure is bound to particles ranging from 0.45 µm to 10 µm or colloids; this is because these small particles contain a significant portion of the total phosphorus in swine manure, which could indicate a relationship between the decrease in PO4−3 and the increase in the amount of solids in the slurry. This suggests that the solid particles in the slurry may contain a significant amount of PO4−3, which could lead to a lower PO4−3 value during laboratory analysis in liquid slurry. Additionally, it implies that more PO4−3 might be trapped in the sediment at the bottom of the pond, explaining why the PO4−3 level decreases from one survey to another at the surface [62]. Organic nitrogen showed significant differences between survey 1, survey 2, and survey 3 (Figure 5). The NO concentrations were highest during survey 1 compared to surveys 2 and 3. This can be attributed to the fact that organic nitrogen in pig slurry is usually associated with organic matter [56]. Organic matter is the primary nitrogen source in the slurry that is broken down by microorganisms through biological decomposition processes. This results in the breakdown of nitrogen into different forms, meaning that some organic nitrogen can be converted into ammonia nitrogen through microbial activity [63]. Moreover, it is essential to note that the amount of time slurry is stored can impact the levels of organic nitrogen. When slurry is stored in an anaerobic environment, ammonia nitrogen levels increase while NO levels decrease. This can explain why longer storage times result in lower NO levels, as observed in all three surveys. Nonetheless, external environmental conditions, like temperature and precipitation, can also affect nutrient dynamics in the slurry pond. Temperature fluctuations can influence microbial activity rates, affecting nutrient transformation processes [64]. But also, the significant fluctuations observed in the TN and PO4−3 values in the slurry storage pond highlight the complex interplay of biogeochemical cycles, microbial activity, and external environmental factors in shaping the dynamic nature of nutrient content within the system.
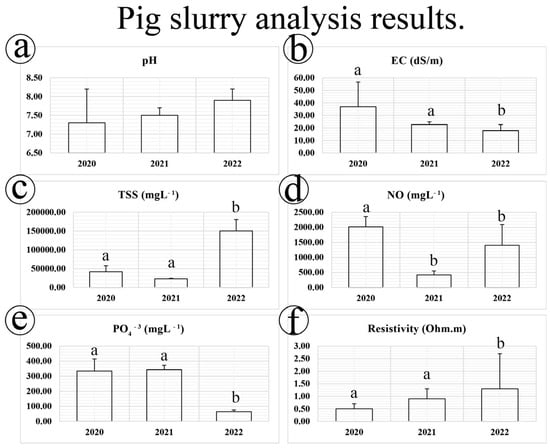
Figure 5.
Bar graph of the slurry analysis results. (a) pH results, (b) EC (electrical conductivity) results, (c) TSS (total solid suspension) results, (d) NO (organic nitrogen) results, (e) PO4−3 (Phosphate ion) results, (f) resistivity values. Different letters (a, b) indicate statistically significant differences (p < 0.05) among the means of each parameter.
4. Conclusions
This study revealed that slurry composition varied significantly over time. This variation can be attributed to several factors, including changes in diet, environmental conditions such as temperature and humidity, farm management practices, and the type and amount of cleaning water used for slurry handling and storage.
Regarding the pig slurry, the electrical resistivity values obtained from the ERT method showed significant differences from those values obtained for EC, TSS, PO4−3, and NO. This suggests that the use of ERT in pig slurry ponds can be used as a proxy for estimating these concentrations; however, a more exhaustive study should be carried out to confirm if there is a direct correlation between slurry composition and electrical resistivity values.
The variations in resistivity values observed during the time-lapse studies were found to be associated with the consistency of the slurry. Therefore, we can conclude that electrical resistivity tomography (ERT) can be used to accurately identify different layers of the slurry, such as the crust zone, more fluid part, and sedimentation zone. The research findings indicate that the utilization of electrical resistivity can be a valuable means of monitoring slurry storage systems in real time while also providing insight into the internal variability of the slurry.
The effectiveness of ERT In detecting and monitoring possible horizontal and vertical infiltrations in a slurry pond has been demonstrated. This highlights the ability of ERT to pinpoint areas that may be susceptible to the migration of slurry components into the surrounding environment. Consequently, ERT can be a valuable tool in mitigating environmental risks by aiding in informed decision-making regarding the location and design of storage ponds and implementing practices that reduce the likelihood of contamination, therefore helping to ensure more effective environmental management of pig slurry.
Author Contributions
Conceptualization, X.C.-C.; methodology, J.A.A.; software, M.A.M.-S.; validation, P.M.-P. and M.V.-M.; data curation, J.A.A.; writing—original draft preparation, X.C.-C.; writing—review and editing, J.A.A., P.M.-P. and M.V.-M.; visualization, M.A.M.-S. and Á.F. All authors have read and agreed to the published version of the manuscript.
Funding
This work was supported by the research grant 21583/FPI/21. Fundación Séneca. Región de Murcia (Spain), and the Sustainable Use, Management, and Reclamation of Soil and Water research group.
Data Availability Statement
The data that support the findings of this study are available upon request from the corresponding author M.A.M.-S.
Conflicts of Interest
The authors declare no conflicts of interest.
References
- Suresh, A.; Choi, H.L.; Oh, D.I.; Moon, O.K. Prediction of the nutrients value and biochemical characteristics of swine slurry by measurement of EC–Electrical conductivity. Bioresour. Technol. 2009, 100, 4683–4689. [Google Scholar] [CrossRef] [PubMed]
- Martinez, J.; Burton, C.H.; Sneath, R.W.; Farrent, J.W. A study of the potential contribution of sedimentation to aerobic treatment processes for pig slurry. J. Agric. Eng. Res. 1995, 61, 87–96. [Google Scholar] [CrossRef]
- Venglovsky, J.; Sasakova, N.; Gregova, G.; Papajova, I.; Toth, F.; Szaboova, T. Devitalisation of pathogens in stored pig slurry and potential risk related to its application to agricultural soil. Environ. Sci. Pollut. Res. 2018, 25, 21412–21419. [Google Scholar] [CrossRef] [PubMed]
- Ministerio de Agricultura Pesca y Alimentación. El Sector de la Carne de Cerdo en Cifras: Principales Indicadores Económicos. In The Pig Sector in Numbers: Main Economic Indicators; Subdirección General de Producciones Ganaderas y Cinegéticas, Dirección General de Producciones y Mercados Agrarios: Madrid, Spain, 2022. [Google Scholar]
- Williams, J.; Jones, R. Work Package 1. The Contribution of Slurry Management Practices to Diffuse Pollution from Agriculture. Available online: https://assets.publishing.service.gov.uk/media/5a7ca2dc40f0b6629523ad27/pb14045-slurry-management-storage-report-appendix.pdf#page=4 (accessed on 26 October 2023).
- Nrcs, U. Conservation Practice Standard Waste Storage Facility (Code 313). Available online: https://www.nrcs.usda.gov/ (accessed on 26 October 2023).
- Real Decreto 306/2020, de 11 de febrero; Boletín Oficial del Estado: Madrid, Spain, 2019; Volume 2014, pp. 18987–19106.
- Council Directive 91/676/EEC of 12 December 1991 Concerning the Protection of Waters against Pollution Caused by Nitrates from Agricultural Sources. Available online: https://eur-lex.europa.eu/legal-content/EN/ALL/?uri=celex%3A31991L0676 (accessed on 26 October 2023).
- Díez López, J.A.; Hernáiz, P.J.; Muñoz, M.J.; Torre, A.; Vallejo, A. Impact of pig slurry on soil properties, water salinization, nitrate leaching and crop yield in a four-year experiment in Central Spain. Soil Use Manag. 2004, 20, 444–450. [Google Scholar]
- Frey, L.; Tanunchai, B.; Glaser, B. Antibiotics residues in pig slurry and manure and its environmental contamination potential. A meta-analysis. Agron. Sustain. Dev. 2022, 42, 31. [Google Scholar] [CrossRef]
- Alcalá, F.J.; Paz, M.C.; Martínez-Pagán, P.; Santos, F.M. Integrated Geophysical Methods for Shallow Aquifers Characterization and Modelling. Appl. Sci. 2022, 12, 2271. [Google Scholar] [CrossRef]
- Martín-Crespo, T.; Gómez-Ortiz, D.; Martínez-Pagán, P.; De Ignacio-San José, C.; Martín-Velázquez, S.; Lillo, J.; Faz, A. Geoenvironmental characterization of riverbeds affected by mine tailings in the Mazarrón district (Spain). J. Geochem. Explor. 2012, 119, 6–16. [Google Scholar] [CrossRef]
- Capozzoli, L.; Giampaolo, V.; De Martino, G.; Perciante, F.; Lapenna, V.; Rizzo, E. ERT and GPR prospecting applied to unsaturated and subwater analogue archaeological site in a full scale laboratory. Appl. Sci. 2022, 12, 1126. [Google Scholar] [CrossRef]
- Babaiwa, D.A.; Ikponmwen, M.O. Application of 2D and 3D Electrical Resistivity Tomography (ERT) in Predicting Soil Erodibility in Oredide Village, Auchi in Etsako West LGA of Edo State, Southern Nigeria. J. Appl. Sci. Environ. Manag. 2021, 25, 1073–1079. [Google Scholar]
- Yan, Z.; Song, X.; Wu, Y.; Gao, C.; Wang, Y.; Yang, Y. Fingerprinting Organochlorine Groundwater Plumes Based on Non-Invasive ERT Technology at a Chemical Plant. Appl. Sci. 2022, 12, 2816. [Google Scholar] [CrossRef]
- Bondo Medhus, A.; Klynkby, L. Engineering Geophysics, 1st ed.; CRC Press: London, UK, 2022; p. 324. [Google Scholar]
- Farzamian, M.; Santos, F.A.M.; Khalil, M.A. Application of EM38 and ERT methods in estimation of saturated hydraulic conductivity in unsaturated soil. J. Appl. Geophys. 2015, 112, 175–189. [Google Scholar] [CrossRef]
- Butler, D.K. Near-Surface Geophysics; Society of Exploration Geophysicists: Tulsa, OK, USA, 2005; Volume 1. [Google Scholar]
- Rosales, R.M.; Martínez-Pagán, P.; Faz, A.; Bech, J. Study of subsoil in former petrol stations in SE of Spain: Physicochemical characterization and hydrocarbon contamination assessment. J. Geochem. Explor. 2014, 147, 306–320. [Google Scholar] [CrossRef]
- Song, W.; Wang, Y.; Shao, Z. Categorical modeling on electrical anomaly of room-and-pillar coal mine fires and application for field electrical resistivity tomography. J. Appl. Geophys. 2017, 136, 474–483. [Google Scholar] [CrossRef]
- Ezeh, C.C.; Maike, S.M. Using vertical electrical sounding and 2D resistivity tomography to investigate Osogbo central waste dumpsite, Osun State, Nigeria. Int. J. Phys. Sci. 2023, 18, 25–37. [Google Scholar]
- Arifin, M.H.; Kayode, J.S.; Ismail MK, I.; Abdullah, A.M.; Embrandiri, A.; Nazer NS, M.; Azmi, A. Environmental hazard assessment of industrial and municipal waste materials with the applications of RES2-D method and 3-D Oasis Montaj modeling: A case study at Kepong, Kuala Lumpur, Peninsula Malaysia. J. Hazard. Mater. 2021, 406, 124282. [Google Scholar] [CrossRef]
- Akiang, F.B.; Emujakporue, G.O.; Nwosu, L.I. Leachate delineation and aquifer vulnerability assessment using geo-electric imaging in a major dumpsite around Calabar Flank, Southern Nigeria. Environ. Monit. Assess. 2023, 195, 123. [Google Scholar] [CrossRef] [PubMed]
- Morita, A.K.; Pelinson, N.S.; Bastianon, D.; Saraiva, F.A.; Wendland, E. Using Electrical Resistivity Tomography (ERT) to assess the effectiveness of capping in old unlined landfills. Pure Appl. Geophys. 2023, 180, 3599–3606. [Google Scholar] [CrossRef]
- Zaini MS, I.; Hasan, M.; Zolkepli, M.F. Urban landfills investigation for leachate assessment using electrical resistivity imaging in Johor, Malaysia. Environ. Chall. 2022, 6, 100415. [Google Scholar] [CrossRef]
- Udosen, N.I. Geo-electrical modeling of leachate contamination at a major waste disposal site in south-eastern Nigeria. Model. Earth Syst. Environ. 2022, 8, 847–856. [Google Scholar] [CrossRef]
- Capa-Camacho, X.; Martínez-Pagán, P.; Martínez-Segura, M.A.; Gabarrón, M.; Faz, Á. Delimiting pig slurry affected subsurface areas by combining geophysical and geochemical techniques. Water 2022, 14, 1872. [Google Scholar] [CrossRef]
- Capa-Camacho, X.; Martínez-Pagán, P.; Martínez-Segura, M.; Gabarrón, M.; Faz, Á. Electrical resistivity tomography (ERT) and geochemical analysis dataset to delimit subsurface affected areas by livestock pig slurry ponds. Data Brief 2022, 45, 108684. [Google Scholar] [CrossRef] [PubMed]
- Martínez-Pagín, P.; Faz, A.; Aracil, E. The use of 2D electrical tomography to assess pollution in slurry ponds of the Murcia region, SE Spain. Near Surf. Geophys. 2009, 7, 49–61. [Google Scholar] [CrossRef]
- Martínez-Pagán, P.; Cano, Á.F.; Ramos da Silva, G.R.; Olivares, A.B. 2-D electrical resistivity imaging to assess slurry pond subsoil pollution in the southeastern region of Murcia, Spain. J. Environ. Eng. Geophys. 2010, 15, 29–47. [Google Scholar] [CrossRef]
- Gabarrón, M.; Martínez-Pagán, P.; Martínez-Segura, M.A.; Bueso, M.C.; Martínez-Martínez, S.; Faz, Á.; Acosta, J.A. Electrical resistivity tomography as a support tool for physicochemical properties assessment of near-surface waste materials in a mining tailing pond (El Gorguel, SE Spain). Minerals 2020, 10, 559. [Google Scholar] [CrossRef]
- Chen, W.; Nover, D.; Xia, Y.; Zhang, G.; Yen, H.; He, B. Assessment of extrinsic and intrinsic influences on water quality variation in subtropical agricultural multipond systems. Environ. Pollut. 2021, 276, 116689. [Google Scholar] [CrossRef] [PubMed]
- Martinez-Pagan, P.; Gomez-Ortiz, D.; Martin-Crespo, T.; Martin-Velazquez, S.; Martinez-Segura, M. Electrical resistivity imaging applied to tailings ponds: An overview. Mine Water Environ. 2021, 40, 285–297. [Google Scholar] [CrossRef]
- Martínez Pagán, P. “Aplicación de diferentes técnicas no destructivas de prospección geofísica a problemas relacionados con contaminación ambiental producidas por diferentes actividades antrópicas en la Región de Murcia.” (2006).
- Alshuwaikhat, H.M.; Abubakar, I. An integrated approach to achieving campus sustainability: Assessment of the current campus environmental management practices. J. Clean. Prod. 2008, 16, 1777–1785. [Google Scholar] [CrossRef]
- BORM-s-2021-90328 Decreto-Ley 5/2021, de 27 de Agosto, de Modificación de la Ley 3/2020, de 27 de Julio, de Recuperación y Protección del Mar Menor. Available online: https://www.boe.es/buscar/doc.php?id=BORM-s-2021-90328 (accessed on 21 November 2023).
- Boletín Oficial de la Región de Murcia. Publicación Número 8097 del BORM Número 298 de 27/12/2019. Available online: https://www.borm.es/services/anuncio/ano/2019/numero/8097/pdf?id=782214 (accessed on 21 November 2023).
- Fuente Álamo de Murcia Climate: Temperature Fuente Álamo de Murcia & Weather by Month. Available online: https://en.climate-data.org/europe/spain/region-de-murcia/fuente-alamo-de-murcia-31093/ (accessed on 20 September 2023).
- Marín Lechado, C.; Roldán García, F.J.; Pineda Velasco, A.; Martinez Zubieta, P.; Rodero Pérez, J.; Diaz Pinto, G. Mapa Geológico Continuo de España1:50 000 Zonas Internas de las Cordilleras Béticas (Zona, -2.2.1.0.). in, G.E.O.D.E. Mapa Geológico Digital Continuo de España. [En Linea]. 2008. Available online: https://info.igme.es/cartografiadigital/geologica/geodezona.aspx?ld=Z1800 (accessed on 23 November 2023).
- Romero Díaz, A.; Belmonte Serrato, F.; Hernández Bastida, J.A. El Campo de Cartagena una visión global. Recorridos por el Campo de Cartagena. Control de la degradación y uso sostenible del suelo; Instituto Mediterráneo del Agua: Murcia, Spain, 2011; pp. 17–48. [Google Scholar]
- Everett, M.E. Near-Surface Applied Geophysics; Cambridge University Press: Cambridge, UK, 2013. [Google Scholar]
- de la Vega, M.; Osella, A.; Lascano, E. Joint inversion of Wenner and dipole–dipole data to study a gasoline-contaminated soil. J. Appl. Geophys. 2003, 54, 97–109. [Google Scholar] [CrossRef]
- I. (AGI) Advanced Geosciences,” Instruction Manual for EarthImager 2D Version 2.4.0 Resistivity and IP Inversion Software”, no. 512, p. 139, 2009. Available online: https://geophysicalequipmentrental.com/files/2020/01/EarthImager2DManual.pdf. (accessed on 6 December 2023).
- APHA; AWWA; WEF. Standard Methods for Examination of Water and Wastewater, 22nd ed.; American Public Health Association: Washington, DC, USA, 2012; p. 1360. [Google Scholar]
- Hoegger, R. Training Papers Nitrogen Determination According to Kjeldahl; Büchi Labortechnik AG: Flawil, Switzerland, 1998; Volume 1, p. 18. [Google Scholar]
- González Martínez, A. Problemática Medioambiental de los Distintos Tipos de Explotaciones Ganaderas; 1995. Available online: https://helvia.uco.es/bitstream/handle/10396/3831/08-1995-04.pdf?sequence=1&isAllowed=y. (accessed on 14 December 2023).
- Popovic, O.; Hjorth, M.; Stoumann Jensen, L. Phosphorus, copper, and zinc in solid and liquid fractions from full-scale and laboratory-separated pig slurry. Environ. Technol. 2012, 33, 2119–2131. [Google Scholar] [CrossRef]
- Turki, N.; Elaoud, A.; Gabtni, H.; Trabelsi, I.; Khalfallah, K.K. Agricultural soil characterization using 2D electrical resistivity tomography (ERT) after direct and intermittent digestate application. Arab. J. Geosci. 2019, 12, 423. [Google Scholar] [CrossRef]
- Dumont, G.; Pilawski, T.; Dzaomuho-Lenieregue, P.; Hiligsmann, S.; Delvigne, F.; Thonart, P.; Hermans, T. Gravimetric water distribution assessment from geoelectrical methods (ERT and EMI) in municipal solid waste landfill. Waste Manag. 2016, 55, 129–140. [Google Scholar] [CrossRef] [PubMed]
- Bichet, V.; Grisey, E.; Aleya, L. Spatial characterization of leachate plume using electrical resistivity tomography in a landfill composed of old and new cells (Belfort, France). Eng. Geol. 2016, 211, 61–73. [Google Scholar] [CrossRef]
- Rey, J.; Martínez, J.; Hidalgo, M.C.; Mendoza, R.; Sandoval, S. Assessment of tailings ponds by a combination of electrical (ERT and IP) and hydrochemical techniques (Linares, southern Spain). Mine Water Environ. 2021, 40, 298–307. [Google Scholar] [CrossRef]
- Kusim, A.S.; Abdullah, N.E.; Hashim, H.; Kutty, S.B. Effects of salt content on measurement of soil resistivity. In Proceedings of the 2013 IEEE 7th International Power Engineering and Optimization Conference (PEOCO), Langkawi, Malaysia, 3–4 June 2013. [Google Scholar]
- Zhang, D.; Liu, S.; Fan, L.; Deng, Y. Effect of salt concentrations on the electrical resistivity of cement-treated soils. In GeoCongress 2012: State of the Art and Practice in Geotechnical Engineering; ASCE: Reston, VA, USA, 2012; pp. 1016–1025. [Google Scholar]
- Igbal, M.Z.; Krothe, N.C. Infiltration mechanisms related to agricultural waste transport through the soil mantle to karst aquifers of southern Indiana, USA. J. Hydrol. 1995, 164, 171–192. [Google Scholar] [CrossRef]
- Lukas, V.; Neudert, L.; Novák, J.; Kren, J. Estimation of Soil Physico-chemical Properties by On-the-go Measurement of Soil Electrical Conductivity. Agric. Conspec. Sci. 2018, 83, 93–98. [Google Scholar]
- Petersen, S.O.; Lind, A.M.; Sommer, S.G. Nitrogen, and organic matter losses during storage of cattle and pig manure. J. Agric. Sci. 1998, 130, 69–79. [Google Scholar] [CrossRef]
- Helene LP, I.; Moreira, C.A.; Bovi, R.C. Identification of leachate infiltration and its flow pathway in landfill by means of electrical resistivity tomography (ERT). Environ. Monit. Assess. 2020, 192, 249. [Google Scholar] [CrossRef] [PubMed]
- Hanief, A. Phosphorus Fractions in Biosolids, Biosolid-Amended Soils, Runoffs, and Its Impact on Primary Productivity in Aquatic Ecosystems. Master’s Thesis, Ryerson University, Toronto, ON, Canada, 2011. [Google Scholar]
- Samanta, P.; Schwark LV, U.S.; Horn, H.; Saravia, F. Nutrient recovery and ammonia-water production by MF-vacuum evaporation treatment of pig manure. J. Environ. Chem. Eng. 2022, 10, 106929. [Google Scholar] [CrossRef]
- Masse, L.; Massé, D.I.; Beaudette, V.; Muir, M. Size distribution and composition of particles in raw and anaerobically digested swine manure. Trans. ASAE 2005, 48, 1943–1949. [Google Scholar] [CrossRef]
- Christensen, M.L.; Hjorth, M.; Keiding, K. Characterization of pig slurry with reference to flocculation and separation. Water Res. 2009, 43, 773–783. [Google Scholar] [CrossRef] [PubMed]
- Peters, K.; Hjorth, M.; Jensen, L.S.; Magid, J. Carbon, nitrogen, and phosphorus distribution in particle size–fractionated separated pig and cattle slurry. J. Environ. Qual. 2011, 40, 224–232. [Google Scholar] [CrossRef] [PubMed]
- FOG, K. The effect of added nitrogen on the rate of decomposition of organic matter. Biol. Rev. 1988, 63, 433–462. [Google Scholar] [CrossRef]
- Zhu, B.; Wang, T.; Dzakpasu, M.; Li, X. Nutrient dynamics and retention in a vegetated drainage ditch receiving nutrient-rich sewage at low temperatures. Sci. Total Environ. 2020, 741, 140268. [Google Scholar]

Disclaimer/Publisher’s Note: The statements, opinions and data contained in all publications are solely those of the individual author(s) and contributor(s) and not of MDPI and/or the editor(s). MDPI and/or the editor(s) disclaim responsibility for any injury to people or property resulting from any ideas, methods, instructions or products referred to in the content. |
© 2024 by the authors. Licensee MDPI, Basel, Switzerland. This article is an open access article distributed under the terms and conditions of the Creative Commons Attribution (CC BY) license (https://creativecommons.org/licenses/by/4.0/).