Abstract
The integration of various geophysical methodologies is considered a fundamental tool for accurately reconstructing the extent and shape of a groundwater body and for estimating the physical parameters that characterize it. This is often essential for the management of water resources in areas affected by geological and environmental hazards. This work aims to reconstruct the pattern and extent of two groundwater bodies, located in the coastal sectors of the North-Eastern Sicily, through the integrated analysis and interpretation of several geoelectrical, seismic and geological data. These are the Sant’Agata-Capo D’Orlando (SCGWB) and the Barcelona-Milazzo (BMGWB) Groundwater Bodies, located at the two ends of the northern sector of the Peloritani geological complex. These two studied coastal plains represent densely populated and industrialized areas, in which the quantity and quality of the groundwater bodies are under constant threat. At first, the resistivity models of the two groundwater bodies were realized through the inversion of a dataset of Vertical Electrical Soundings (VES), constrained by stratigraphic well logs data and other geophysical data. The 3D resistivity models obtained by spatially interpolating 1D inverse VES models have allowed for an initial recognition of the distribution of groundwater, as well as a rough geological framework of the subsoil. Subsequently, these models were implemented by integrating results from active and passive seismic data to determine the seismic P and S wave velocities of the main lithotypes. Simultaneous acquisition and interpretation of seismic and electrical tomographies along identical profiles allowed to determine the specific values of seismic velocity, electrical resistivity and chargeability of the alluvial sediments, and to use these values to constrain the HVSR inversion. All this allowed us to recognize the areal extension and thickness of the various lithotypes in the two investigated areas and, finally, to define the depth and the morphology of the base of the groundwater bodies and the thickness of the filling deposits.
1. Introduction
The integration of geological and geophysical data for the reconstruction of subsurface models is a widespread practice nowadays. In numerous research fields, direct investigations, such as trenches and boreholes, are associated with data obtained by geophysical acquisitions to expand the available dataset and improve the subsurface characterization. Furthermore, the net of the actual cost of geophysical instrumentation, the relationship between the amount of data acquired and the economic evaluation of a geophysical survey make geophysical methodologies quite economical when compared to direct investigations. This approach had been often used in many studies regarding stratigraphic [1,2,3] and structural geology [4,5,6,7], the analysis of depositional sequences [8,9,10], archaeological [11,12,13] and civil engineering research [14,15,16]. In these studies, acquired geophysical data constrained by the information derived from direct investigation provide a fundamental tool for the integration and definition of subsurface models. Even hydrogeology research exploits this workflow for numerous purposes: the description of groundwater depth and thickness [17,18,19], definition of the physical–chemical characteristics of an aquifer [20,21,22], assessment of marine ingression in coastal areas [23,24,25] and evaluation of water quality and degree of pollution [26,27,28].
In recent years, several studies based on integrated approaches of geological and geophysical datasets have focused on coastal areas that host floodplains [29,30,31]. These flat areas are often critically important for different reasons. They are usually densely populated and, considering their proximity to the sea, host strategic harbors; seaside tourism causes a clear increase in the population during the warm months. Moreover, the gentle morphology favors the development of numerous road and railway communication routes and, consequently, of industrialized areas adjacent to the main towns.
Unfortunately, coastal alluvial plains are often subjected to various risks, both natural, such as floods and paroxysmal events linked to wave motion, and those linked to the development of anthropic activities. Furthermore, the human impact on these areas causes excessive exploitation and contamination of aquifers. All this can lead to serious damage to infrastructure, negatively affecting industrial, tourism, fishing, and agricultural activities. Knowledge of the subsoil is, therefore, fundamental to effectively addressing all these problems.
This work presents the 2D modelling of two coastal alluvial plains, present in North-Eastern Sicily, hosting groundwater bodies: the Barcellona–Milazzo (BMGWB) and the S. Agata–Capo D’Orlando plain (SCGWB). The characterization of the alluvial geometries present in these two sectors have been defined by combining the boreholes data and several data collected by geophysical acquisition campaigns carried out at different times. Firstly, Vertical Electrical Soundings (VES) and Seismic Refraction (SR) profiles were realized in the 1970s by a project sponsored by a public entity named “Cassa per il Mezzogiorno” (CASMEZ), created by the Italian government to finance industrial initiatives aimed at the economic development of Southern Italy [32]. Subsequently, in 2019, these data were partly reinterpreted and integrated by other both active and passive seismic methods as part of a project conducted by the INGV (National Institute of Geophysics and Volcanology—Palermo Section) and DAR (Regional Water and Waste Department) [33]. Through the integration of all the data, the thickness of the alluvial deposit and the depth of the bottom were defined.
The subsoil models produced are a basic tool for evaluating the water resources of the area and the possibilities of exploiting them. Moreover, these study results should be a useful tool to define the geological hazards of the two sectors analyzed and to identify any areas that may be subject to environmental pollution. In conclusion, for all these reasons, the models created can also be considered fundamental to follow for basic studies in defining the city’s master plans.
2. Geology and Hydrogeology
2.1. Geomorphological and Geological Setting
The Sant’Agata–Capo D’Orlando and Barcellona–Milazzo plains are in the Tyrrhenian coastal sector of the Peloritani Mountains (North-Eastern Sicily). In particular, the two areas studied are spread over an area of about 40.70 km2 for the Sant’Agata–Capo D’Orlando plain and of about 1319 km2 for the Barcellona–Milazzo one.
Several towns and villages lie in these two coastal plains, among which Sant’Agata di Militello, Capo D’Orlando, Barcellona Pozzo di Gotto and Milazzo are the main municipalities. Strategical infrastructures like harbors, highways, and railway lines, as well as industrial plants and several farms, are present in these sectors. Noteworthy is the site of national interest (SIN) represented by the petroleum refinery and chemical industries located east of Milazzo, at the mouth of the Corriolo Stream.
From a geo-structural point of view, the North-Eastern Sicily lies in a crucial sector of the central Mediterranean region in correspondence of the African and European plates boundary, characterizing the Sicilian foreland–foredeep–chain system (Figure 1c) [34,35,36]. The Peloritani Mountains’ geological complex (hereafter, Peloritani Complex; PC) constitutes the innermost and structurally highest sector of the Sicilian Fold and Thrust Belt (SFTB) [36,37,38], (Figure 1b). In particular, the PC represents the southern termination of the Calabrian–Peloritan Arc (CPA), as well as the linking element between the Southern Appennines and the Sicilian Maghrebian Chain [39]. The PC is formed by different south-verging tectonic units (nappes), mainly composed by high-to-low-grade metamorphites, deriving from the deformation of an ancient Hercynian basement (Kabilo-Calabride Units) and related carbonate–clastic Meso-Cenozoic sedimentary covers [35,40,41,42,43,44]. The piling up of the tectonic units belonging to the PC and its incorporation into the SFTB began in the upper Oligocene and continued up to the Upper Miocene [45]. During the Plio-Pleistocene, extensional and transcurrent tectonic regimes affected the PC, producing an articulate dip-slip and strike-slip faults pattern, with NW-SE/W-E and NE-SW/N-S orientation [35,46,47,48,49,50]. Lastly, one of the most important tectonic structures of North-Eastern Sicily is represented by the fault zone known as “Taormina line”, constituting the outer front of the PC [35,51]. Furthermore, through this latter tectonic structure, the PC overlaps on the Apennine–Maghrebidi Units (Figure 1c); more precisely, on those deriving from the deformation of the Sicilide complex, widely outcropping in the Nebrodi Mountains [40,41,42,43,44].
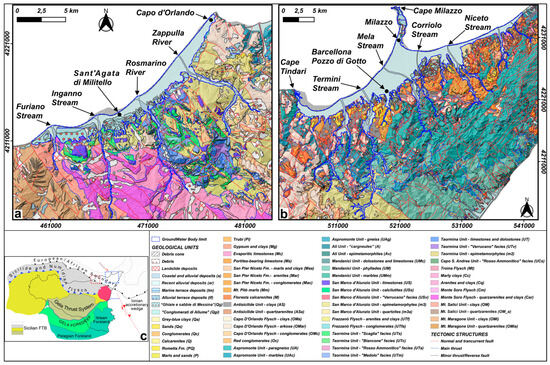
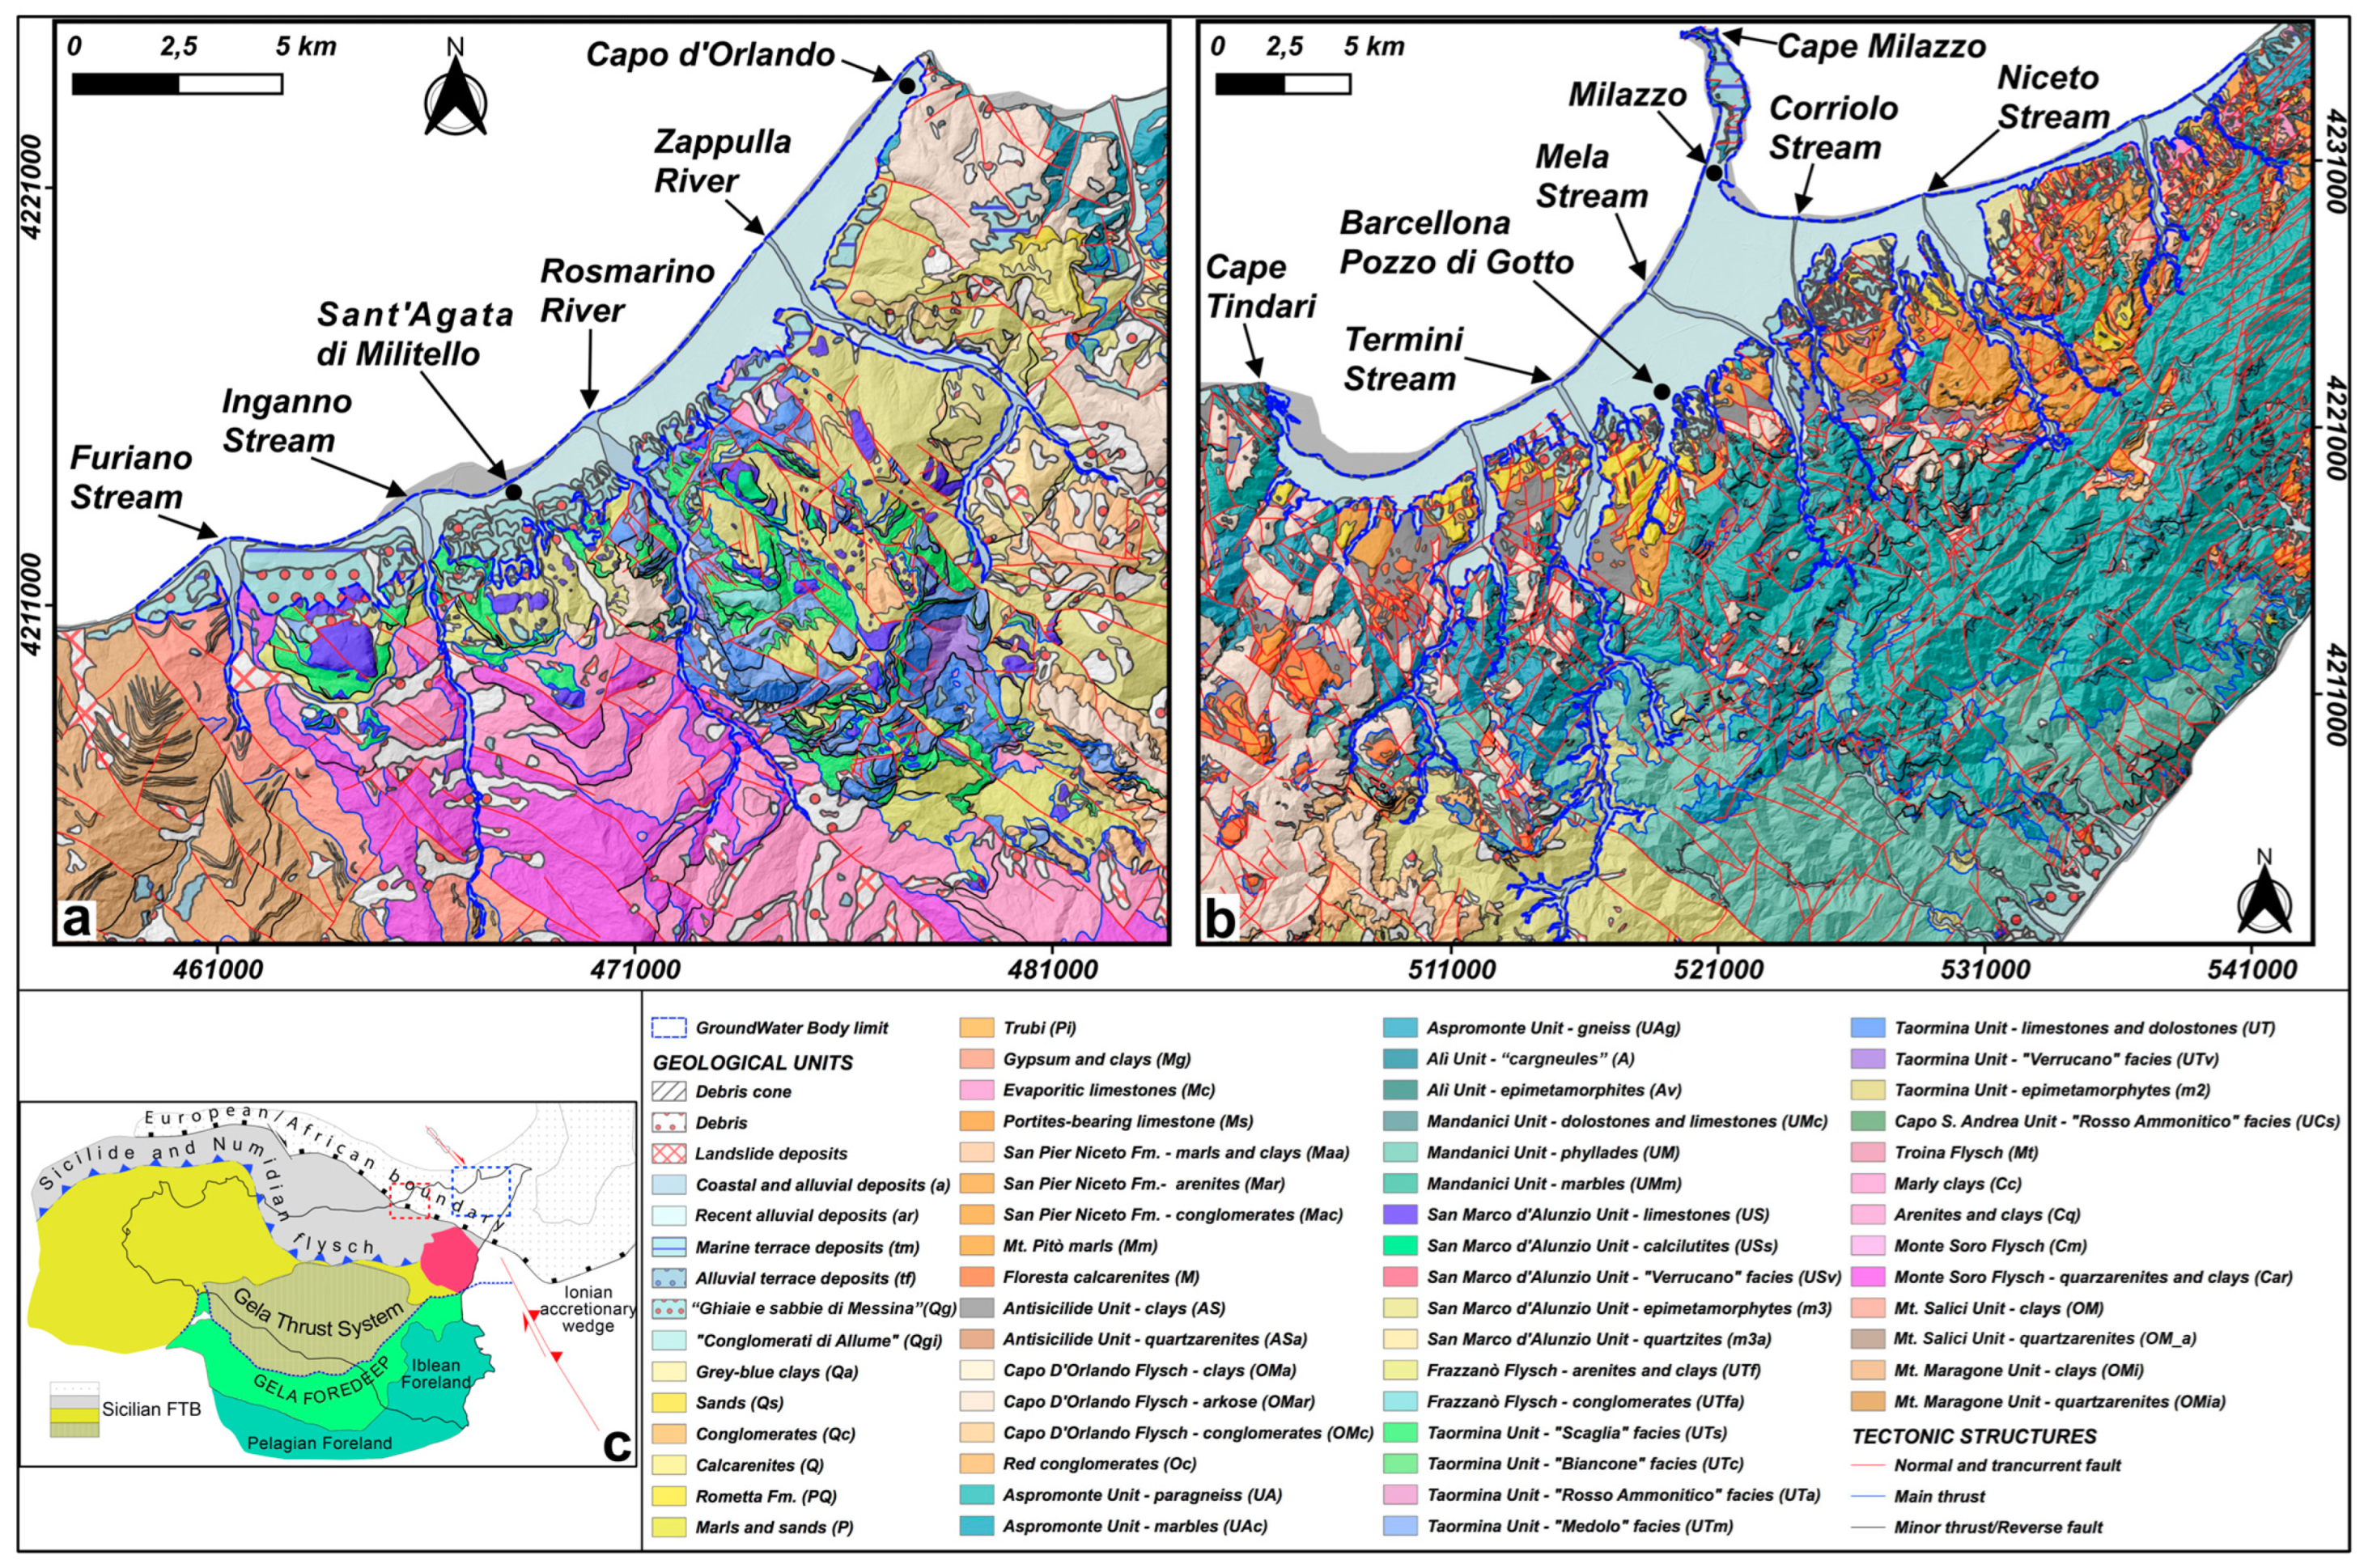
Figure 1.
Geological sketch maps of the two investigated areas: the SCGWB on the left (a) and the BMGWB on the right (b). In the bottom left, (c) the structural map of Sicily, illustrating the main elements of the foreland–foredeep–chain system, is shown (modified from [52]). The location of the study areas of SCGWB (red dashed line) and BMGWB (blue dashed line) is highlighted in this latter map. The geological sketch maps (a,b) were drawn with the QuantumGIS 3.16 software, provided by Open Source Geospatial Foundation (OSGeo), adopting a DEM image as a topographic base. Polygons and lines present in these two maps are referred to the outcropping geological units and tectonic structures, based on geological chart [53] and explanatory notes [40]. The description of the geological units and tectonic structures of the two geological sketch maps is shown in the bottom-right panel.
The tectono-stratigraphic sequence outcropping in the investigated sectors is composed, from the bottom to the top, by the Numidian Flysch, Sicilide and Kabilo–Calabride Units, unconformably covered by syn- and post-orogenic sedimentary sequences [40,44].
In particular, the Numidian Flysch and Sicilide (Figure 1a) complexes are composed of the following:
- the Upper Oligocene–Lower Miocene clays and quartzarenites of the Mt. Maragone and Mt. Salici Units;
- the clays and quartzarenites of the Monte Soro and the marly clays unit, Lower Cretaceous in age.
Tectonically superimposed to the Numidian Flysch and Sicilide Units, the Kabilo–Calabride Units and related Meso-Cenozoic sedimentary covers (Figure 1b) are present [40,44]. This latter sequence is composed of the following, from the bottom to the top:
- Capo Sant’Andrea, Longi-Taormina and San Marco d’Alunzio Units, comprising epimetamorphites deriving from an ancient Hercynian basement and Meso-Cenozoic carbonate covers;
- low- to high-grade metamorphic rocks belonging to the Mandanici and Aspromonte Units, derived from the deformation of the innermost sectors of the Kabilo–Calabride domain (Paleozoic);
- the Upper Oligocene–Lower Miocene syntectonic terrigenous deposit of the Capo d’Orlando Flysch;
- the Upper Cretaceous clays and quartzarenites of the Antisicilide Unit, overthrusting the Capo d’Orlando Flysch;
- the Lower-Middle Miocene Floresta calcarenites and the Mt. Pitò marls, unconformably lying on the deposits of the Antisicilide Unit;
- the Middle-Upper Miocene post-orogenic deposits belonging to the San Pier Niceto Fm. and to the evaporitic series upward.
The tectono-stratigraphic units described are unconformably covered by the Plio-Quaternary marine, fluvio-deltaic and alluvial sequences. These marine deposits, mainly outcropping toward the Tyrrhenian and Ionian coastal sectors, are composed of the Trubi unit (Lower Pliocene), the Upper Pliocene marls and sands, and the Rometta Fm. deposits (Upper Pliocene–Lower Pleistocene), passing laterally and upward to the conglomerates, sands and marly clays of Lower–Middle Pleistocene age. This sedimentary sequence ends with late Quaternary fluvio-deltaic (“Conglomerati di Allume” and “Ghiaie e sabbie di Messina”), marine and alluvial terrace, and alluvial and coastal plain deposits.
The Sant’Agata-Capo d’Orlando and Barcellona-Milazzo plains arise in two wide coastal sectors with peculiar NE-SW orientation. Several rivers and streams, arising further south in the central mountain areas of the PC, are characterized by articulated hydrographic patterns with predominant NW-SE and N-S direction of the river courses [41,42,43]. Furthermore, the orientation and development of the drainage direction of these streams appears orthogonal to the strike of the belts from which they arise [54]. Their northward flowing into the Sant’Agata-Capo d’Orlando and Barcellona-Milazzo coastal plains guarantees a considerable contribution in terms of freshwater recharge and sediments supply to these sectors.
Therefore, both the rivers and stream drainage patterns and the geometry and orientation of the two coastal plains appear directly controlled by the tectonic setting of these sectors of the PC. Normal and transtensional faults with predominant NW-SE and NE-SW trends characterize the geometry of the Sant’Agata-Capo d’Orlando and Barcellona-Milazzo coastal plains and the thickness of the sedimentary infill. The coastal plains infill is composed by the Middle-Late Pleistocene to Holocene fluvio-deltaic, marine and alluvial terrace deposits, recent alluvial and coastal deposits, reaching the thickness of even more than 100 m, as in the case of the central portion of the Barcellona-Milazzo plain [41,55,56,57].
2.2. Hydrogeological Setting
The lithology and stratigraphic setting of the sedimentary infill directly influence the groundwater circulation and its storage in the SCGWB and BMGWB. The Potential Infiltration Coefficient (CIP [19,58,59]) can be considered as the parameter through which the permeability of rocks and sedimentary deposits is quantified. As regards the Groundwater Bodies characterising the Sant’Agata-Capo d’Orlando and Barcellona-Milazzo coastal plains and related rivers and all tributaries, the CIP reaches the highest values (0.8–0.9%) estimated in the PC [33]. In these coastal sectors the groundwater bodies are composed by different Middle-Late Quaternary geological units mainly consisting of alternations of gravels, sands and clayey-silts, which are characterized by high permeability for primary porosity [60,61]. Therefore, due to the high porosity and thickness, generally increasing in correspondence of the river and stream mouths, and to the shoreline, SCGWB and BMGWB host significant unconfined aquifers [55,62,63]. The freshwater input on the SCGWB and BMGWB occurs with direct charging or, locally, through exchanges with the adjacent groundwater bodies and aquifers.
In particular, the SCGWB consists of the “Ghiaie e sabbie di Messina”, marine and alluvial terrace deposits, alluvial and coastal plain [40,42,43], characterized by high-to-very high permeability for porosity. The SCGWB lower boundary is characterized by the presence of the flyschoid deposits of the Numidian Flysch and Monte Soro Flysch Units in the westernmost portion, the epimetamorphites and limestones of the San Marco d’Alunzio and Longi-Taormina Units in the central sector, and the Aspromonte Unit and Capo d’Orlando Flysch deposits in the north-easternmost portion. All these lithologies are characterized by medium-low-to-low fracture permeability [61].
The BMGWB is formed by the “Ghiaie e sabbie di Messina”, marine and alluvial terrace deposits, alluvial and coastal plain [40,41,56,57], characterized by high-to-very high permeability for porosity. The BMGWB is superimposed on the Upper Pliocene–Pleistocene marly sandy sequences, the post- and syn-orogenic deposits in the western and central portion and the metamorphites of the Aspromonte Unit in the north-easternmost part of it. All the described units are characterized by medium-low-to-low permeability for porosity and fracturing [61].
3. Materials and Methods
3.1. Previous Geognostic and Geophysical Investigation
Litho-stratigraphic logs of several boreholes, lying in the two study areas, have been collected and analyzed to obtain information about the main sedimentological and stratigraphic features of the deposits. In total, 151 boreholes, lying in the two investigated sectors, were collected. In particular, as shown in Figure 2, 11 of these boreholes were located in the area of the SCGWB and 140 in the BMGWB one.
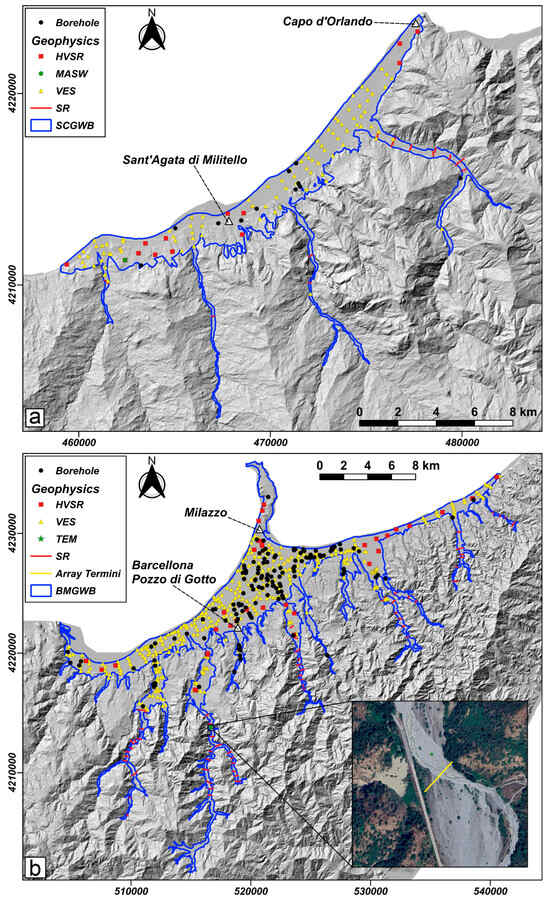
Figure 2.
Charts illustrating the location of the boreholes and geophysical surveys analyzed for the study areas. DEM images were used as a topographic base. On the map at the top (a), the data available for the SCGWB are shown, while on the map at the bottom (b), the dataset for the BMGWB is described. As regards the (b) map, in the bottom-right satellite image, the location of the array (yellow line) carried out in the Termini Stream is shown. This array is referred to as the ERT and the SRT realized in this portion of the stream valley.
Most of the analyzed boreholes were drilled using the non-coring drilling method, mainly for groundwater research, while the remaining were drilled using the continuous coring method. The data obtained through the analysis of the boreholes have been reinterpreted and validated, homogenizing the lithologies described with those related to the litho-stratigraphic units present in the geological cartography [53] and the related explanatory notes [40] used for this work. The litho-stratigraphic information provided by these surveys has been used to constrain the inversion of the available geophysical data.
Both the previous SR and VES surveys, as shown in Figure 2, were carried out in the seventies in the two coastal plains for water research activities foreseen by a CASMEZ project [32]. In total, 90 VES and 12 SR profiles were selected within SCGWB, while BMGWB hosted 376 VES and 69 SR. The latter were carried out perpendicular to the axes of rivers present within the two alluvial plains.
3.2. New Processing and Interpretation of Vertical Electrical Soundings
Vertical Electrical Soundings (VES) are a geophysical methodology that usually provides a one-dimensional electrical resistivity model [64]. VES have often been used with good results for studying the physical properties of aquifers and their geometric characterization [65,66]. Despite all this, these surveys can also be useful to describe three-dimensional resistivity models. Indeed, within a studied area, several 1D resistivity data close to each other can be used to constrain the values of each VES. This approach, suitable when the studied area is characterized by a not-too-high resistivity gradient, is useful when large sectors need to be investigated, considering that electrical resistivity tomography appears impractical and expensive.
All vertical electrical soundings considered were performed using the Schlumberger array, with AB current dipole lengths increasing exponentially, so as to obtain roughly equally spaced values in a graph with logarithmic axes. Generally, 10 measurements were performed per logarithmic decade, with maximum AB/2 lengths ranging from 300 m for the shortest soundings up to 500 m for the longest ones, allowing maximum depths of investigation of about 250 m. Among all the VES carried out in the two groundwater bodies, we chose only those whose apparent resistivity vs. AB/2 curves presented a trend compatible with a one-dimensional layered modeling so as to be able to obtain from them 1D layered inverse models with a misfit not exceeding 5%.
For each VES, starting from analog data, the plot of the measured apparent resistivity ρa as a function of the half-distance AB/2 between the current electrodes has been digitalized and saved in ASCII files also containing topographic information and the array type.
The digitalized VES were inverted by ZondIP1D (v. 5.2), provided by Zond Software Ltd., Republic of Cyprus (EU) using the least squares method to constrain the inverse models with boreholes data where available. Considering that the studied areas present a fairly regular stratigraphy, a 1.5D inversion algorithm was used, according to which the deepest layer of the resistivity section is considered almost horizontal, while the more superficial layers may be affected by lateral variations in resistivity, albeit slight [67]. Therefore, given these assumptions, inverse models from contiguous VES are mutually constrained (Figure 3a). Consequently, the data were inverted by considering some VES alignments within the study areas, based on the mutual distance between VES points and the alleged geometric features of the geological bodies present in the substrate. The mutually constrained inverse models were laterally interpolated in order to construct two-dimensional electrical resistivity sections along the chosen alignments (Figure 3b). These vertical sections proved useful for providing an initial geological characterization of the two water bodies and as starting data for the subsequent creation of 3D electrical resistivity models.
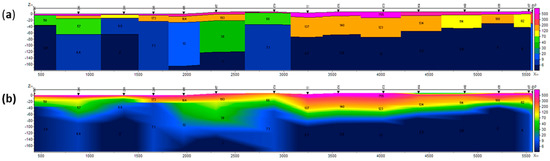
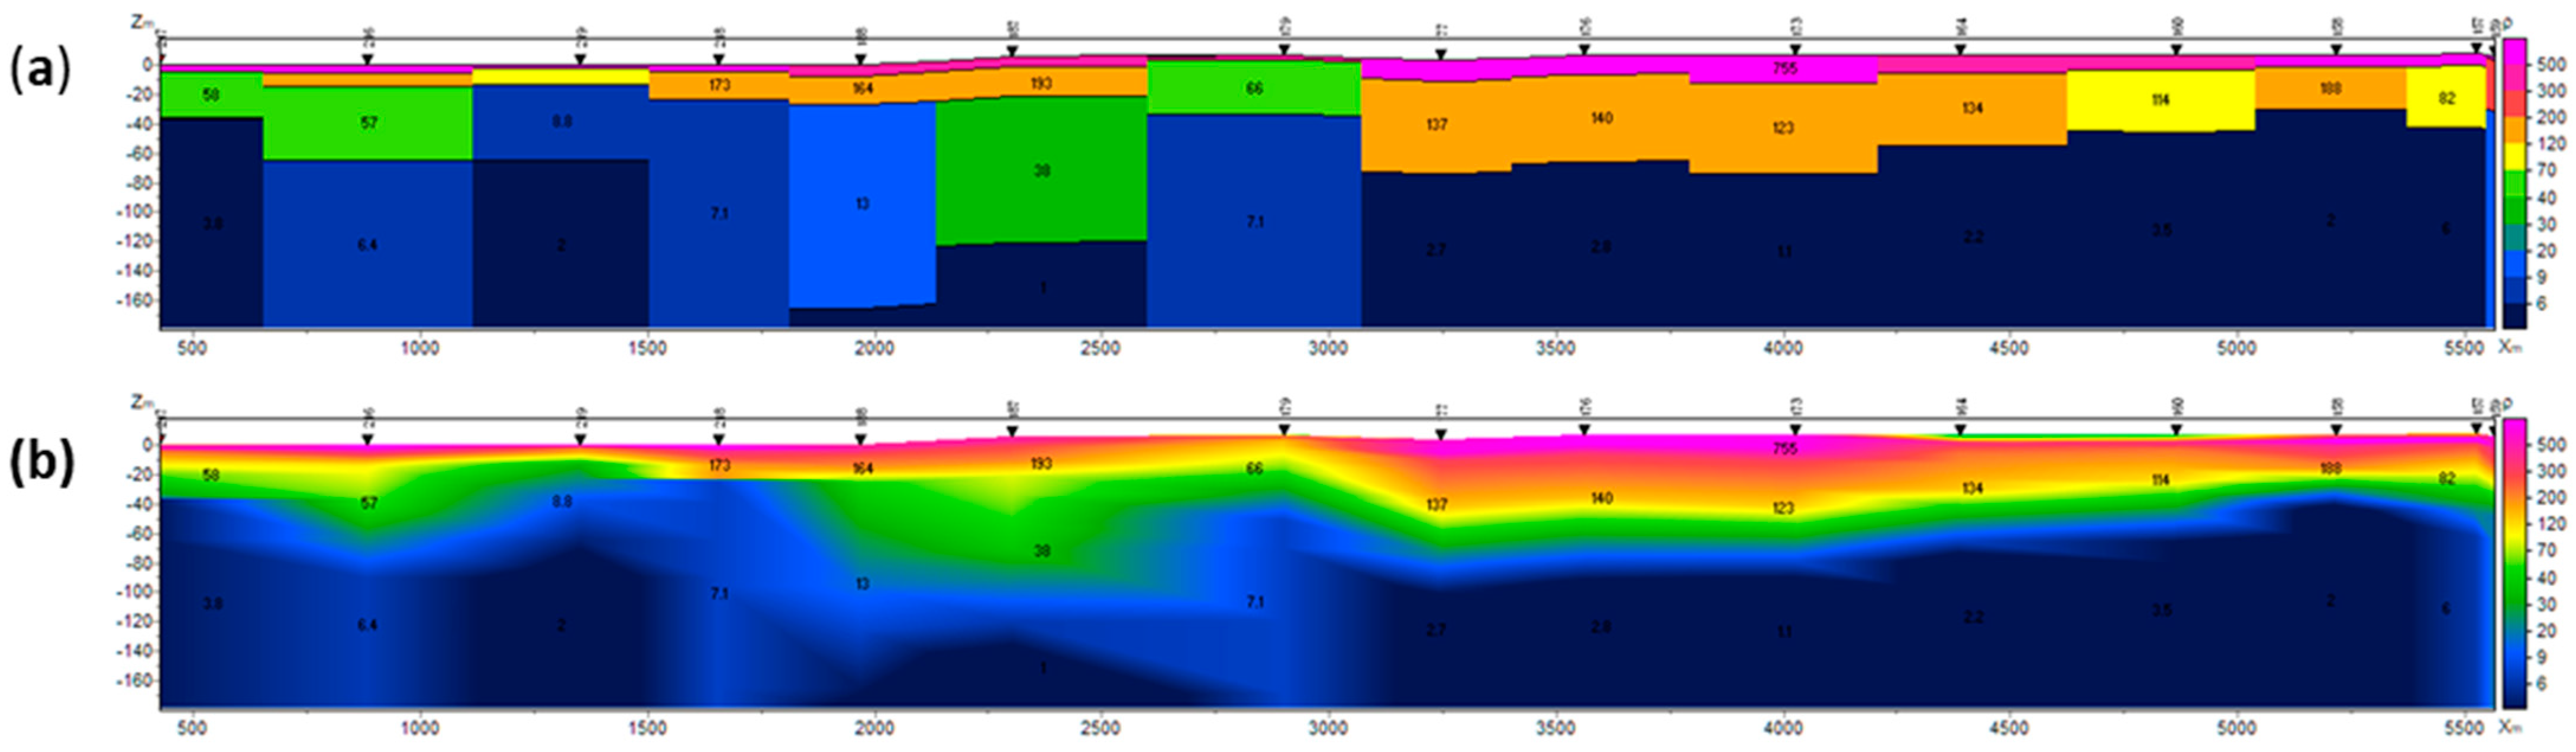
Figure 3.
(a) Example of aligned 1D inverse electrical resistivity models obtained from the VES soundings; (b) corresponding 2D resistivity section by lateral interpolation.
3.3. New Geophysical Surveys
A new geophysical acquisition campaign was realized during the DAR project to better describe the geometrical features of SCGWB and BMGWB. For these reasons, both passive and active seismic surveys were performed with the aim of describing the volumes of deposits that could host groundwater.
In detail, 13 recordings of microtremor were acquired for the SCGWB and 50 for the BMGWB, as shown in Figure 2. The environmental noise records were acquired by a 3D velocimeter along the two plains and analyzed according to the HVSR (Horizontal-to-Vertical Spectral Ratio) methodology [68,69].
The inversion of an HVSR curve is subject to significant equivalence limitations and, thus, must be constrained by other geophysical data, mainly for shallower layers, to be considered reliable [70,71]. To this end, it was beneficial to consider the obtained 3D electrical resistivity models and the results of refraction seismic profiles. However, for a more detailed characterization of the vp and vs. values of lithotypes and the correlation with other observed geophysical parameters, a joint survey Seismic Refraction Tomography (SRT), Electrical Resistivity Tomography (ERT), and Induced Polarization Tomography (IPT) were carried out in coincident position [13]. Furthermore, a Transient Electromagnetic (TEM) survey was performed nearby. Finally, a Multichannel Analysis of Surveys Waves (MASW) survey [72] was performed in SCGWB, close to the Acquedolci Town. These surveys were situated in areas where geological knowledge allowed for their joint and detailed interpretation. The geophysical models derived from such surveys, along with other available geophysical models, were used to better constrain HVSR curve inversions, thereby obtaining layered models of seismic velocities. The latter, together with electrical resistivity models and seismic refraction sections, were crucial for determining the thickness of the affected alluvial sediments and the aquifer base.
The ERT, IPT and SRT surveys were carried out in coincident position within the Termini Stream (see Array Termini in Figure 2b). The SRT technique uses a series of aligned and equidistant geophones and a high number of shot records in order to obtain detailed sections of the trend of P-wave velocity in the subsurface [73]. Analogously, ERT and IPT methodologies allow us to obtain detailed 2D sections of electrical resistivity and chargeability using several aligned and equally spaced electrodes, and are often utilized in hydrogeological applications [74,75,76]. The aim of performing seismic and electrical tomographies along the same alignment in a noticeably area is to characterize the main lithologies in detail from a geophysical point of view, through the joint interpretation of the tomographic sections.
TEM is based on the study of a transient electromagnetic field artificially induced underground in order to reconstruct the trend of electrical conductivity in the investigated volumes. In addition to the mapping of aquifers, this methodology had been used for several applications and studies, such as the characterization of the thickness of volcanic covers [77], the identification of hydrocarbon reservoirs [78] and the identification of geothermal areas [79].
The MASW survey was performed close to the Acquedolci Town. A multichannel seismograph was used to acquire the data, using 48 vertical geophones (central frequency of 16 Hz) for the SRT and 24 vertical geophones (4.5 Hz frequency) for MASW.
4. Results and Discussion
4.1. Litho-Stratigraphic Interpretation of the Boreholes
The analysis of all the boreholes data for the SCGWB has allowed us to distinguish different kinds of geological substrates, characterized by different lithofacies and units, covered by the recent alluvial deposits. In the western part of the SCGWB, the alluvial deposits cover predominantly clayey–marly layers belonging to the Monte Maragone (OMi) and Monte Soro Flysch (Car) or the limestones and marly limestones of the San Marco (US) and Longi-Taormina Units (UTs). In the eastern part of the SCGWB, however, the geological substrate consists of the metamorphic lithofacies of the San Marco (m3), Longi-Taormina (m2) and Aspromonte Units (UA). Finally, in the North-Eastern sector of the SCGWB, under the coastal plain and alluvial deposits, the arkoses (OMar) and clays (OMa) of the Capo D’Orlando Flysch unit are present.
As regards the boreholes falling in the BMGWB, below the coastal plain and alluvial deposits, gray-blue clays (Qa), the calcarenites of the Rometta Fm. (PQ) and the clays (Maa), arenites (Mar) and conglomerates (Mac) belonging to the San Pier Niceto Fm. are present.
4.2. Results from SR Profiles and New Geophysical Surveys
As regards the SR profiles carried out during the CASMEZ project [32], although the original dataset is no longer available, several interpretative models have been evaluated. According to these models, the P-wave velocities in the SCGWB show values of about 2200–3000 m/s for the substrate; beneath the alluvial materials and altered portions of the substrate, the velocities are characterized by values of about 500 and 1300 m/s. The seismic velocity model concerning BMGWB describes a lower substrate and alluvial covers above characterized by 2200–3000 and 1000–1300 m/s, respectively.
The results of the joint-acquired SRT, ERT and IPT (Array Termini) carried out within the BMGWB are shown in Figure 4 and Figure 5. SRT (Figure 4) shows a constant increase in velocities from the top to the bottom of the tomography. Values that characterize the upper 15–18 m vary from 400 to 1000 m/s. Velocities increasing from 1000 m/s to 3000 m/s are described from 20 to 40 m of depth. The deepest part of the section shows the highest P-wave velocity values by a maximum of 4500 m/s found at 60 m depth. Considering the data from the geologic map and from the boreholes located near the SRT, the lower velocities were attributed to recent alluvial sediments; the increase in the velocities of the intermediate layers could be related to the saturated part of these deposits. The highest values have been attributed to the metamorphic rocks of the Aspromonte Unit (UA) that constitute the substrate of this portion of the stream course, also outcropping at the banks.
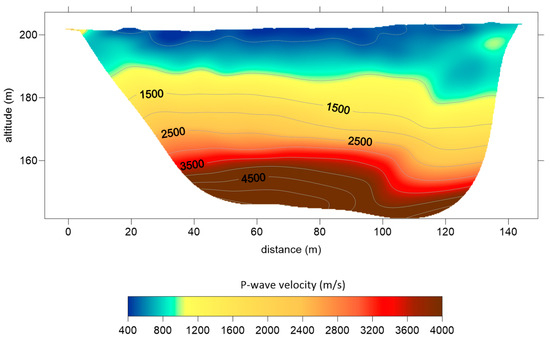
Figure 4.
Results of seismic refraction tomography carried out inside the Barcelona–Milazzo Plain, within Termini Stream.

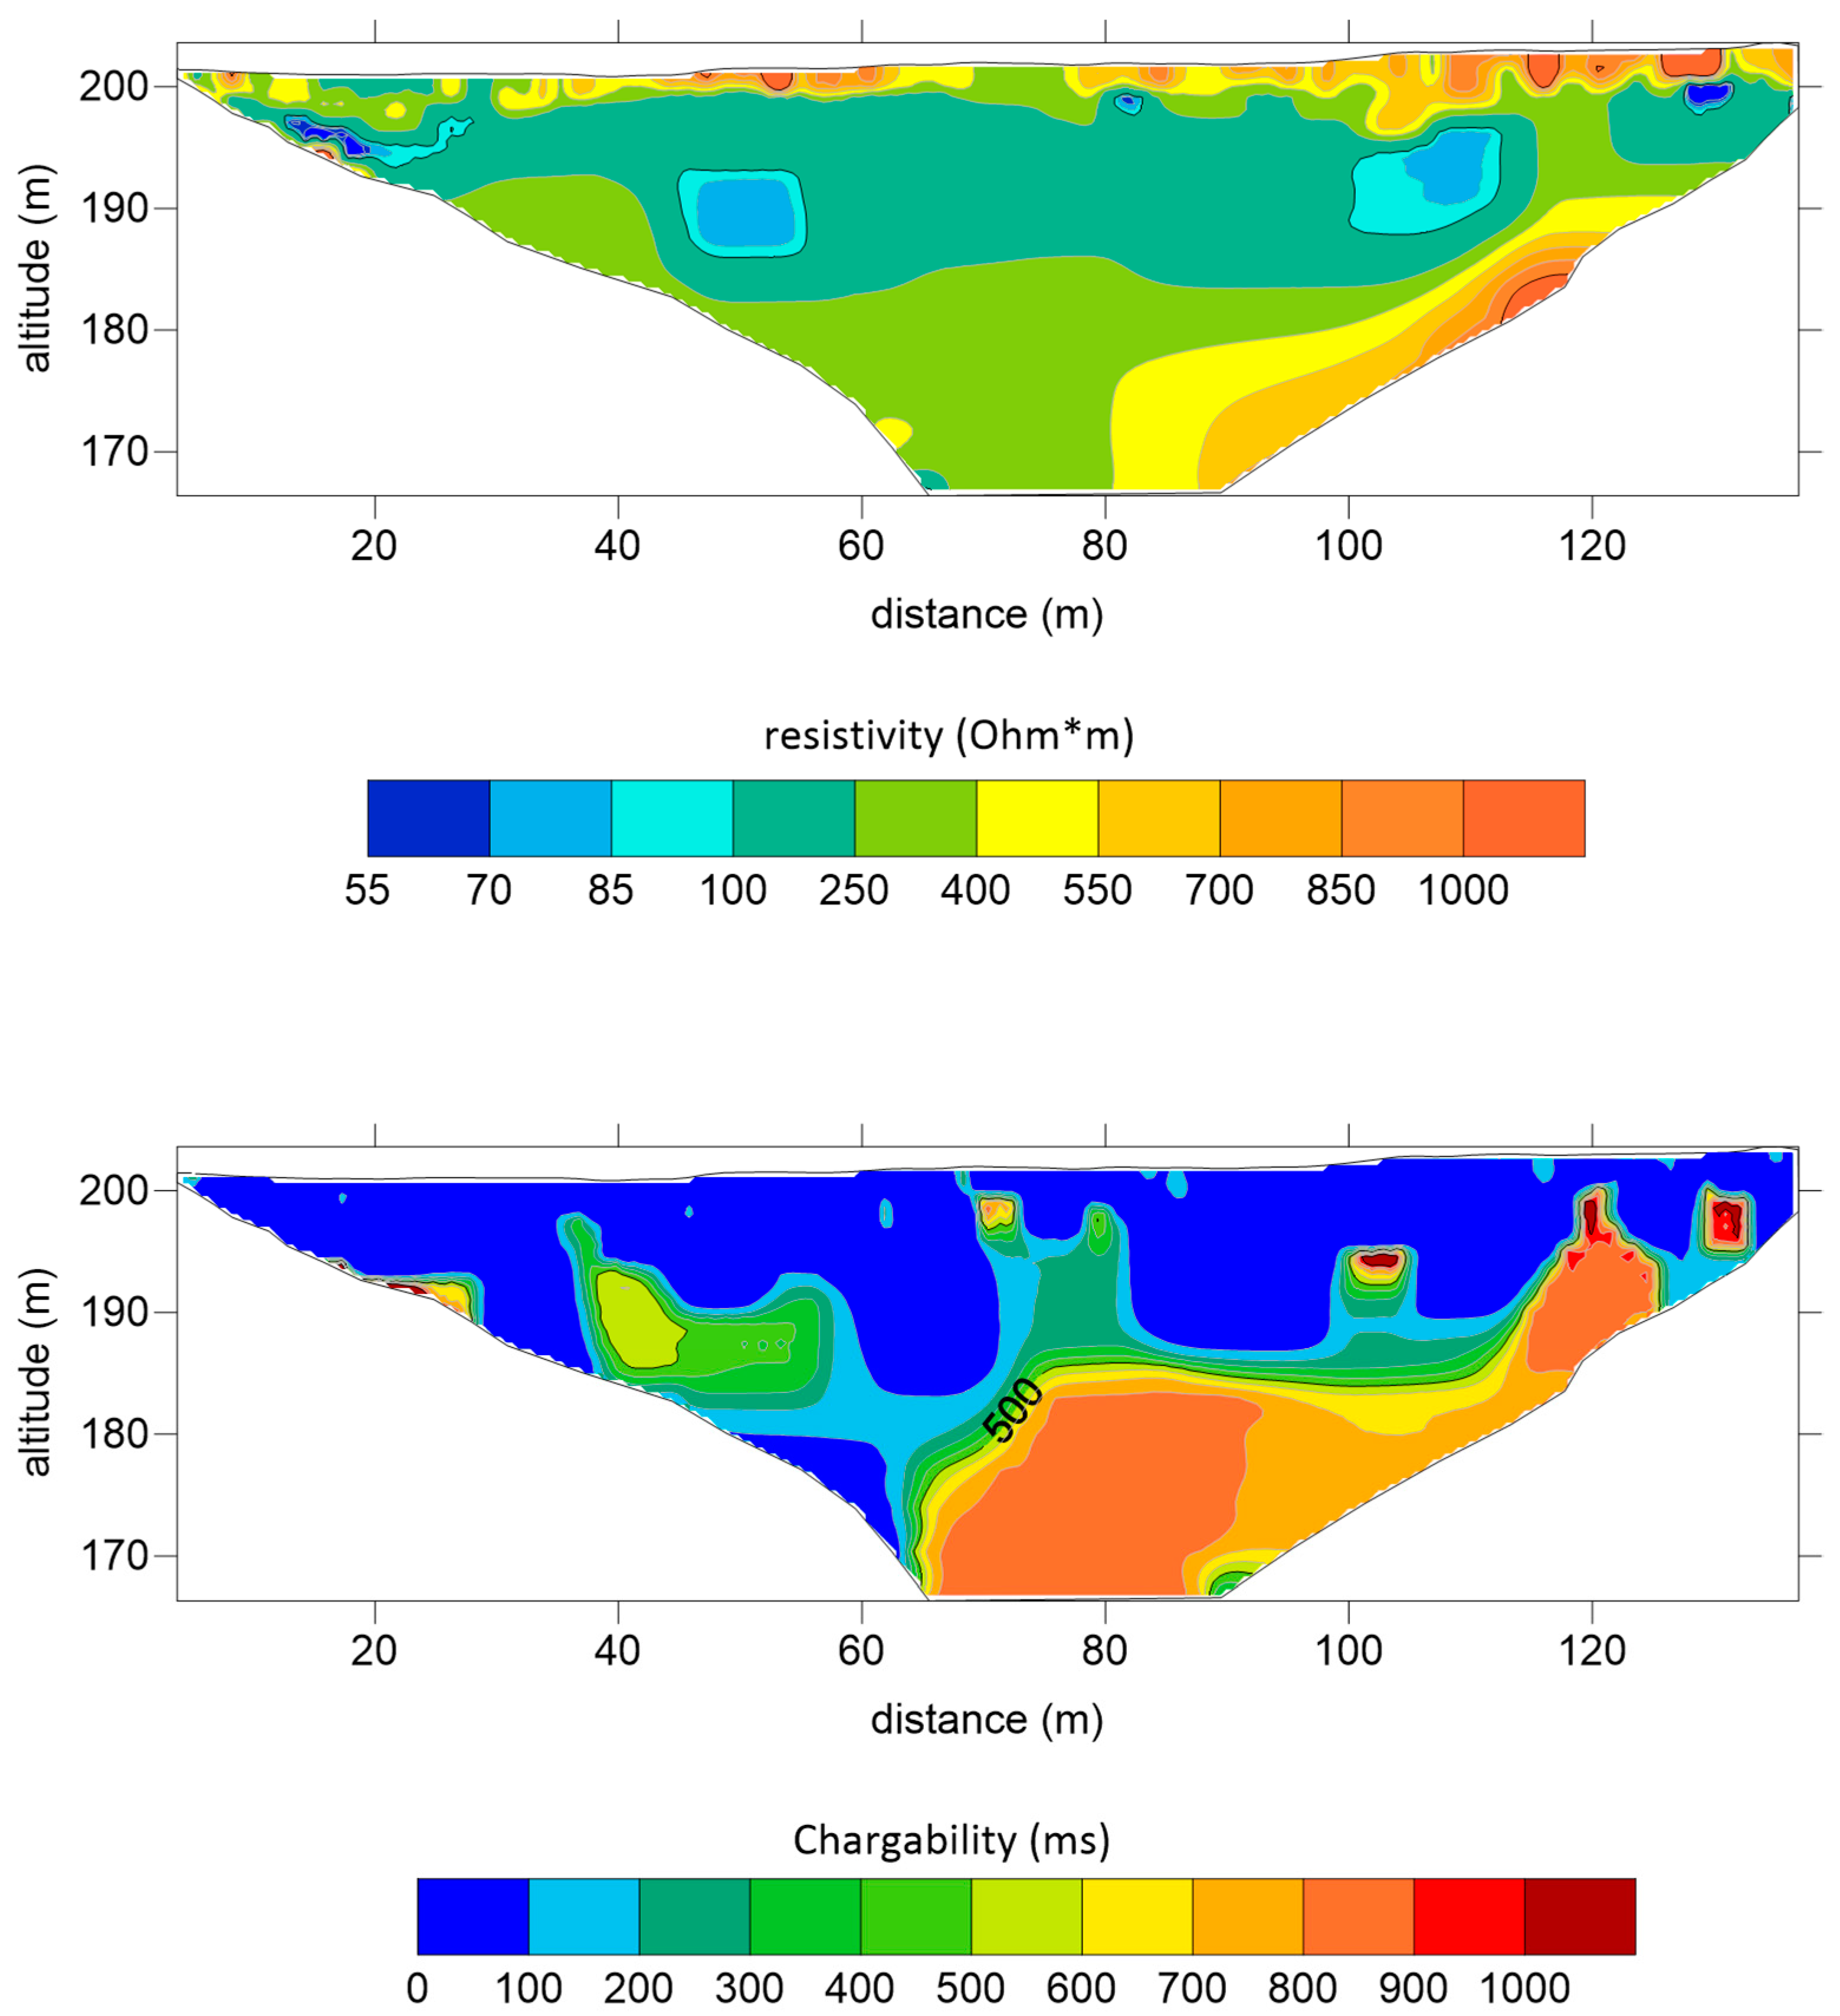
Figure 5.
2D models of resistivity (above) and chargeability (below) derived from the ERT and IPT carried out in the Plain of Barcelona–Milazzo, within Termini Stream (Array Termini).
Results of ERT and IPT are shown in Figure 5. The highest values of resistivity and chargeability have been identified mainly in the lower sections of the profile and are associated with the metamorphic basement. Low values in chargeability are, instead, present in the subsurface. These values, associated with medium-low resistivity values, should indicate the presence of alluvial deposits. These superficial deposits present lower values of resistivity where they are affected by the fluid presence.
The 1D resistivity model obtained by inverting the TEM survey provided a vertical model of resistivity values comparable with those derived from ERT near-realized. The TEM model shows resistivity values ranging from about 100 Ωm to 500 Ωm, according to the layers described in ERT as water-saturated.
The simultaneous acquisition and interpretation of SRT, ERT and IPT allowed for characterizing the alluvial deposits for their typical values of P-wave velocity, electrical resistivity and chargeability. These values were used for lithotype recognition and the identification of their thickness in both 3D resistivity models and HVSR inverse models.
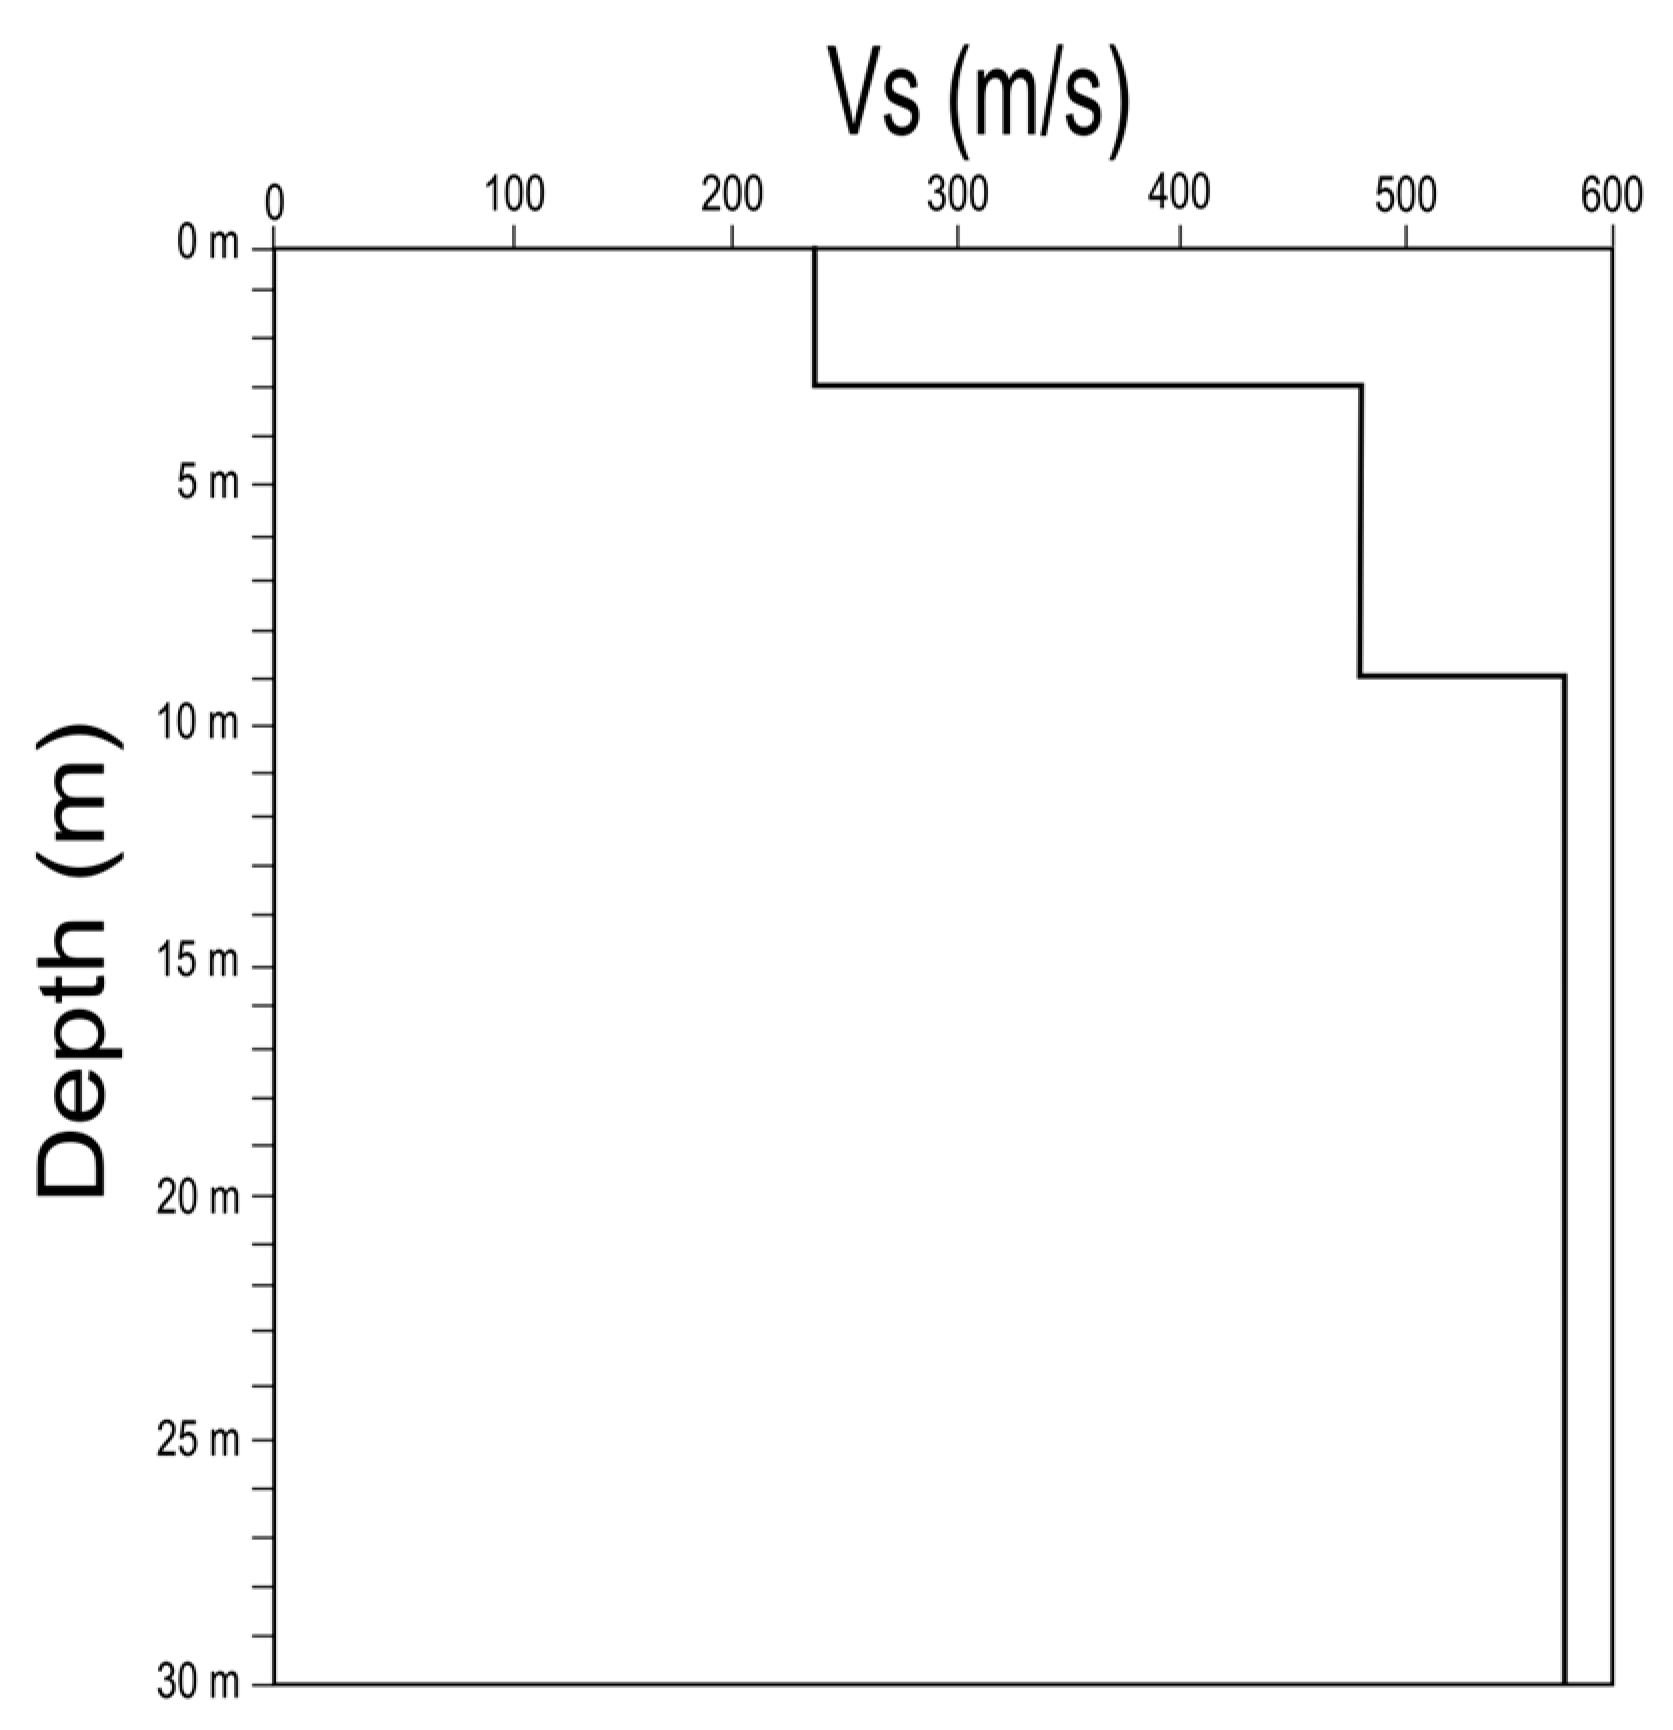
The MASW realized close to Acquedolci Town, within the SCGWB, provides a seismic–stratigraphic model (Figure 6) composed of a 250 m/s upper superficial cover followed by a 6 m thick layer characterized by a shear waves velocity of 480 m/s. Based on the outcropping rock and information taken from lithologic logs, these values are correlated to the alluvial deposits overlying the “Ghiaie e sabbie di Messina” (Qg) unit.

Figure 6.
Inverse model resulting from the MASW survey performed in the S. Agata–Capo D’Orlando plain.
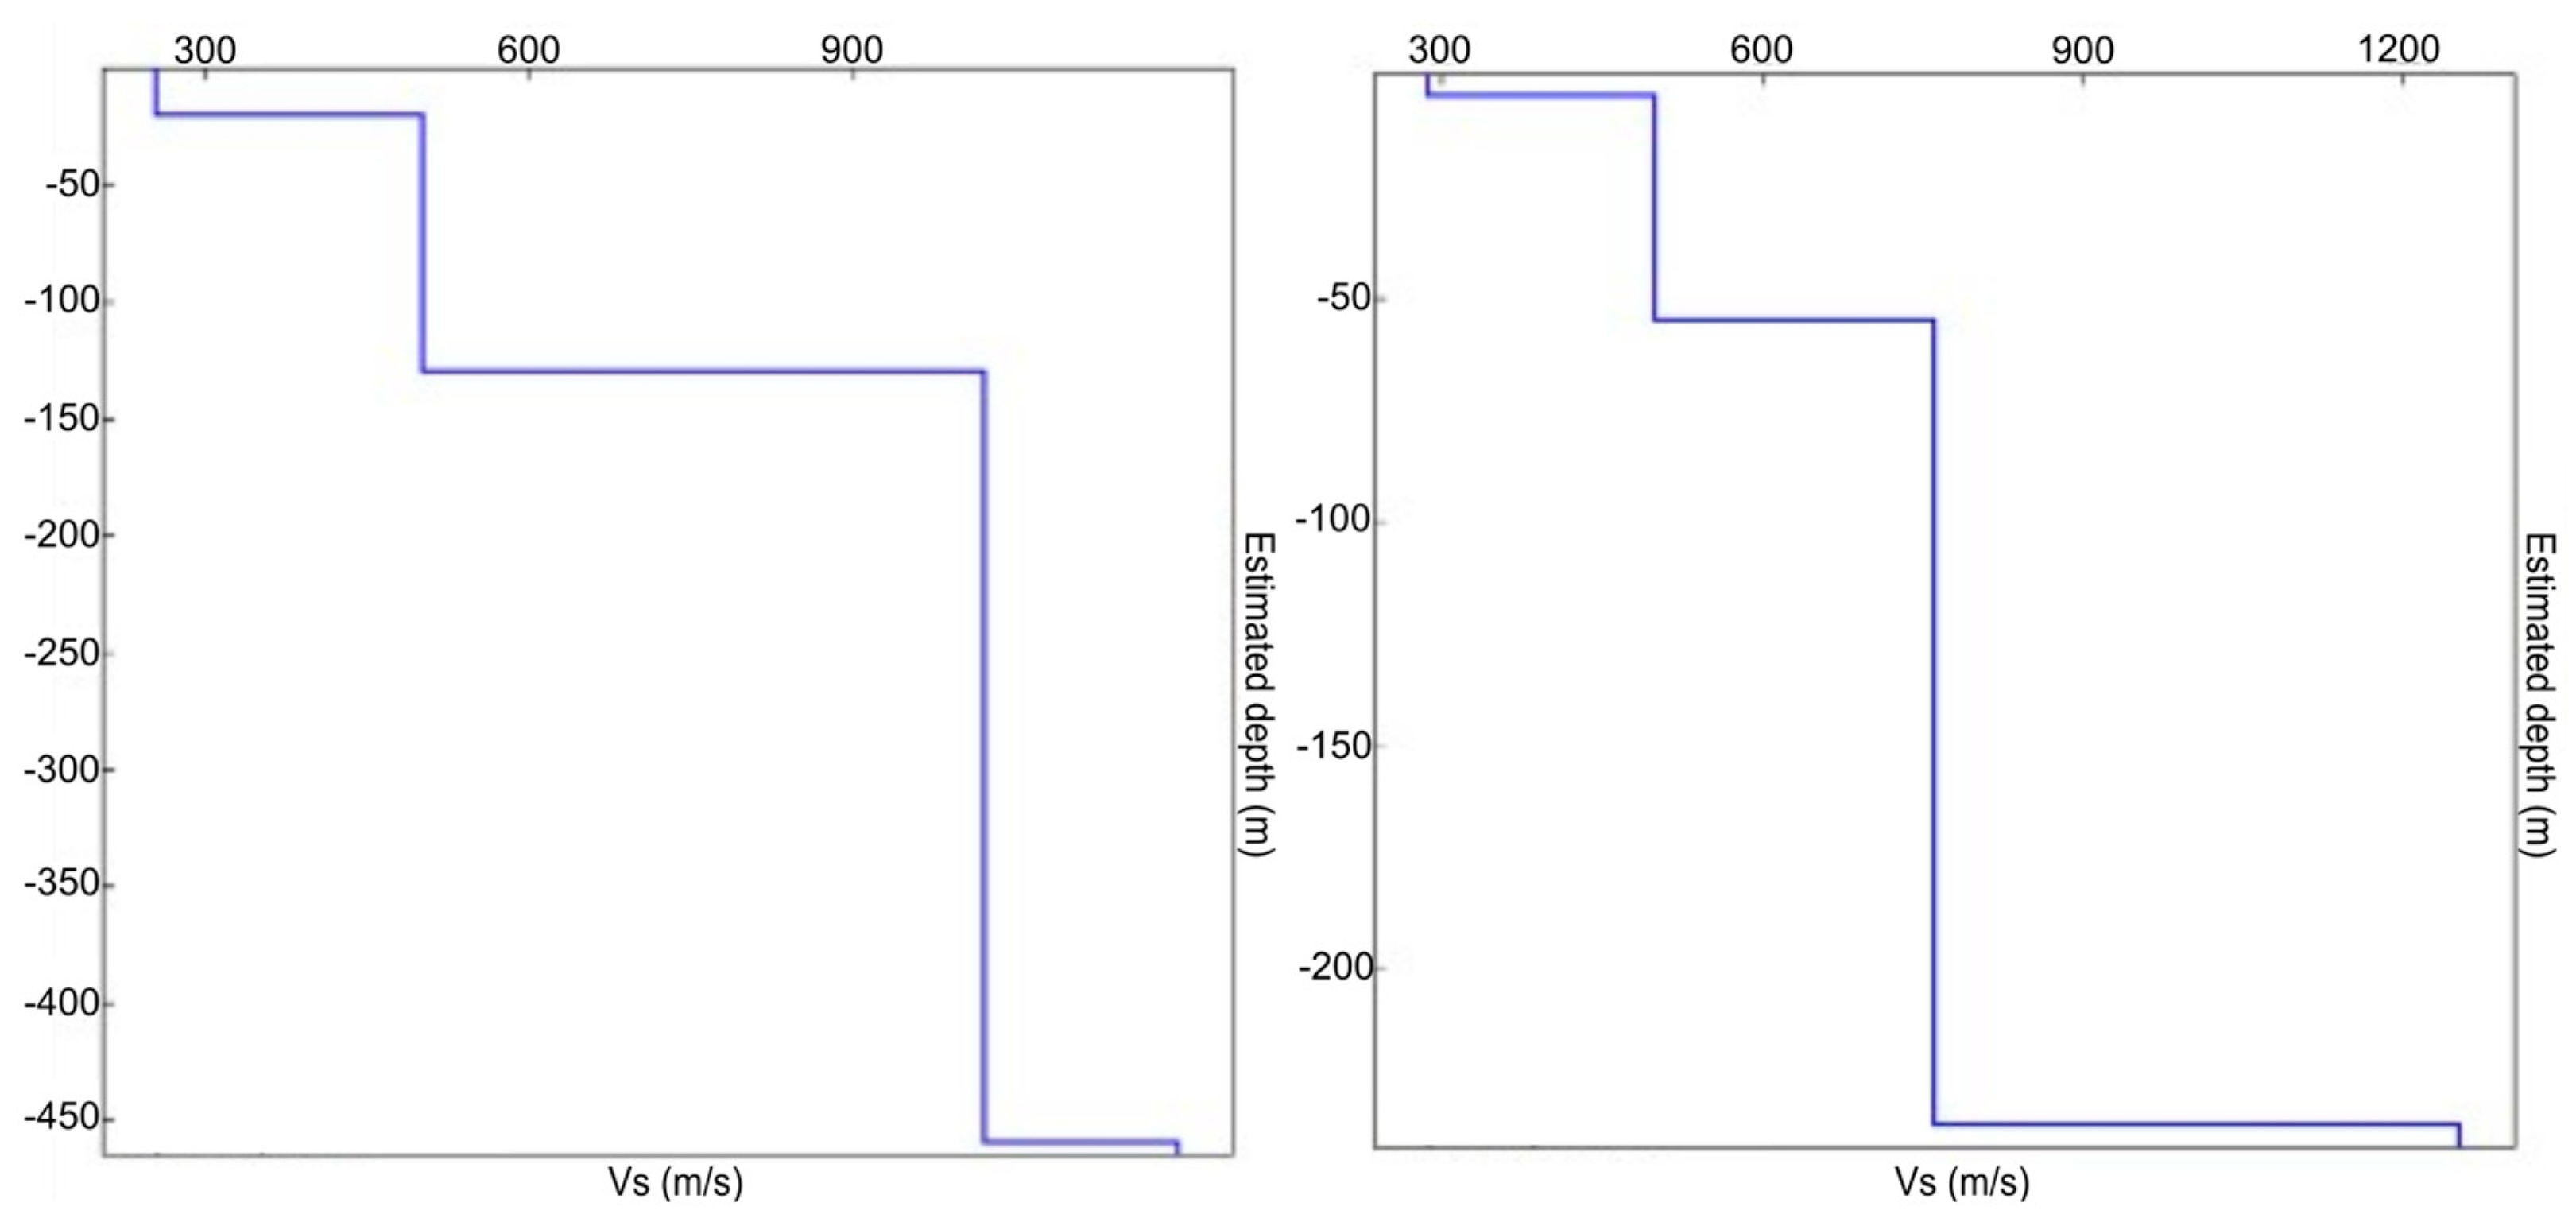
All the HVSR curves have been inverted, providing inverse shear wave velocity models constrained by all the geophysical and geological data discussed above [80]. Some example results are shown in Figure 7 and Figure 8.
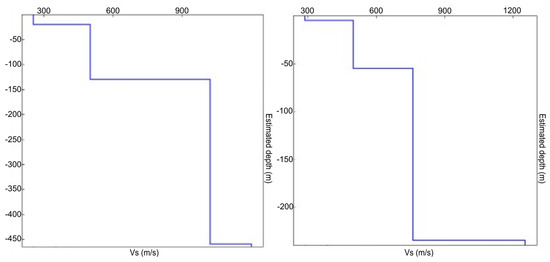
Figure 7.
Examples of inverse models related to the HVSR carried out within the Sant’Agata–Capo D’Orlando Plain.
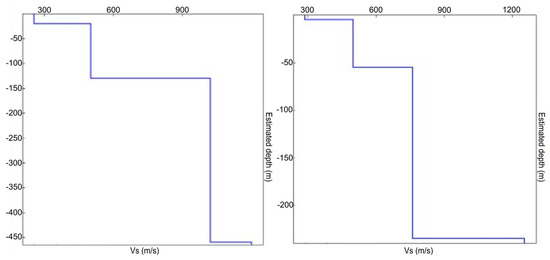
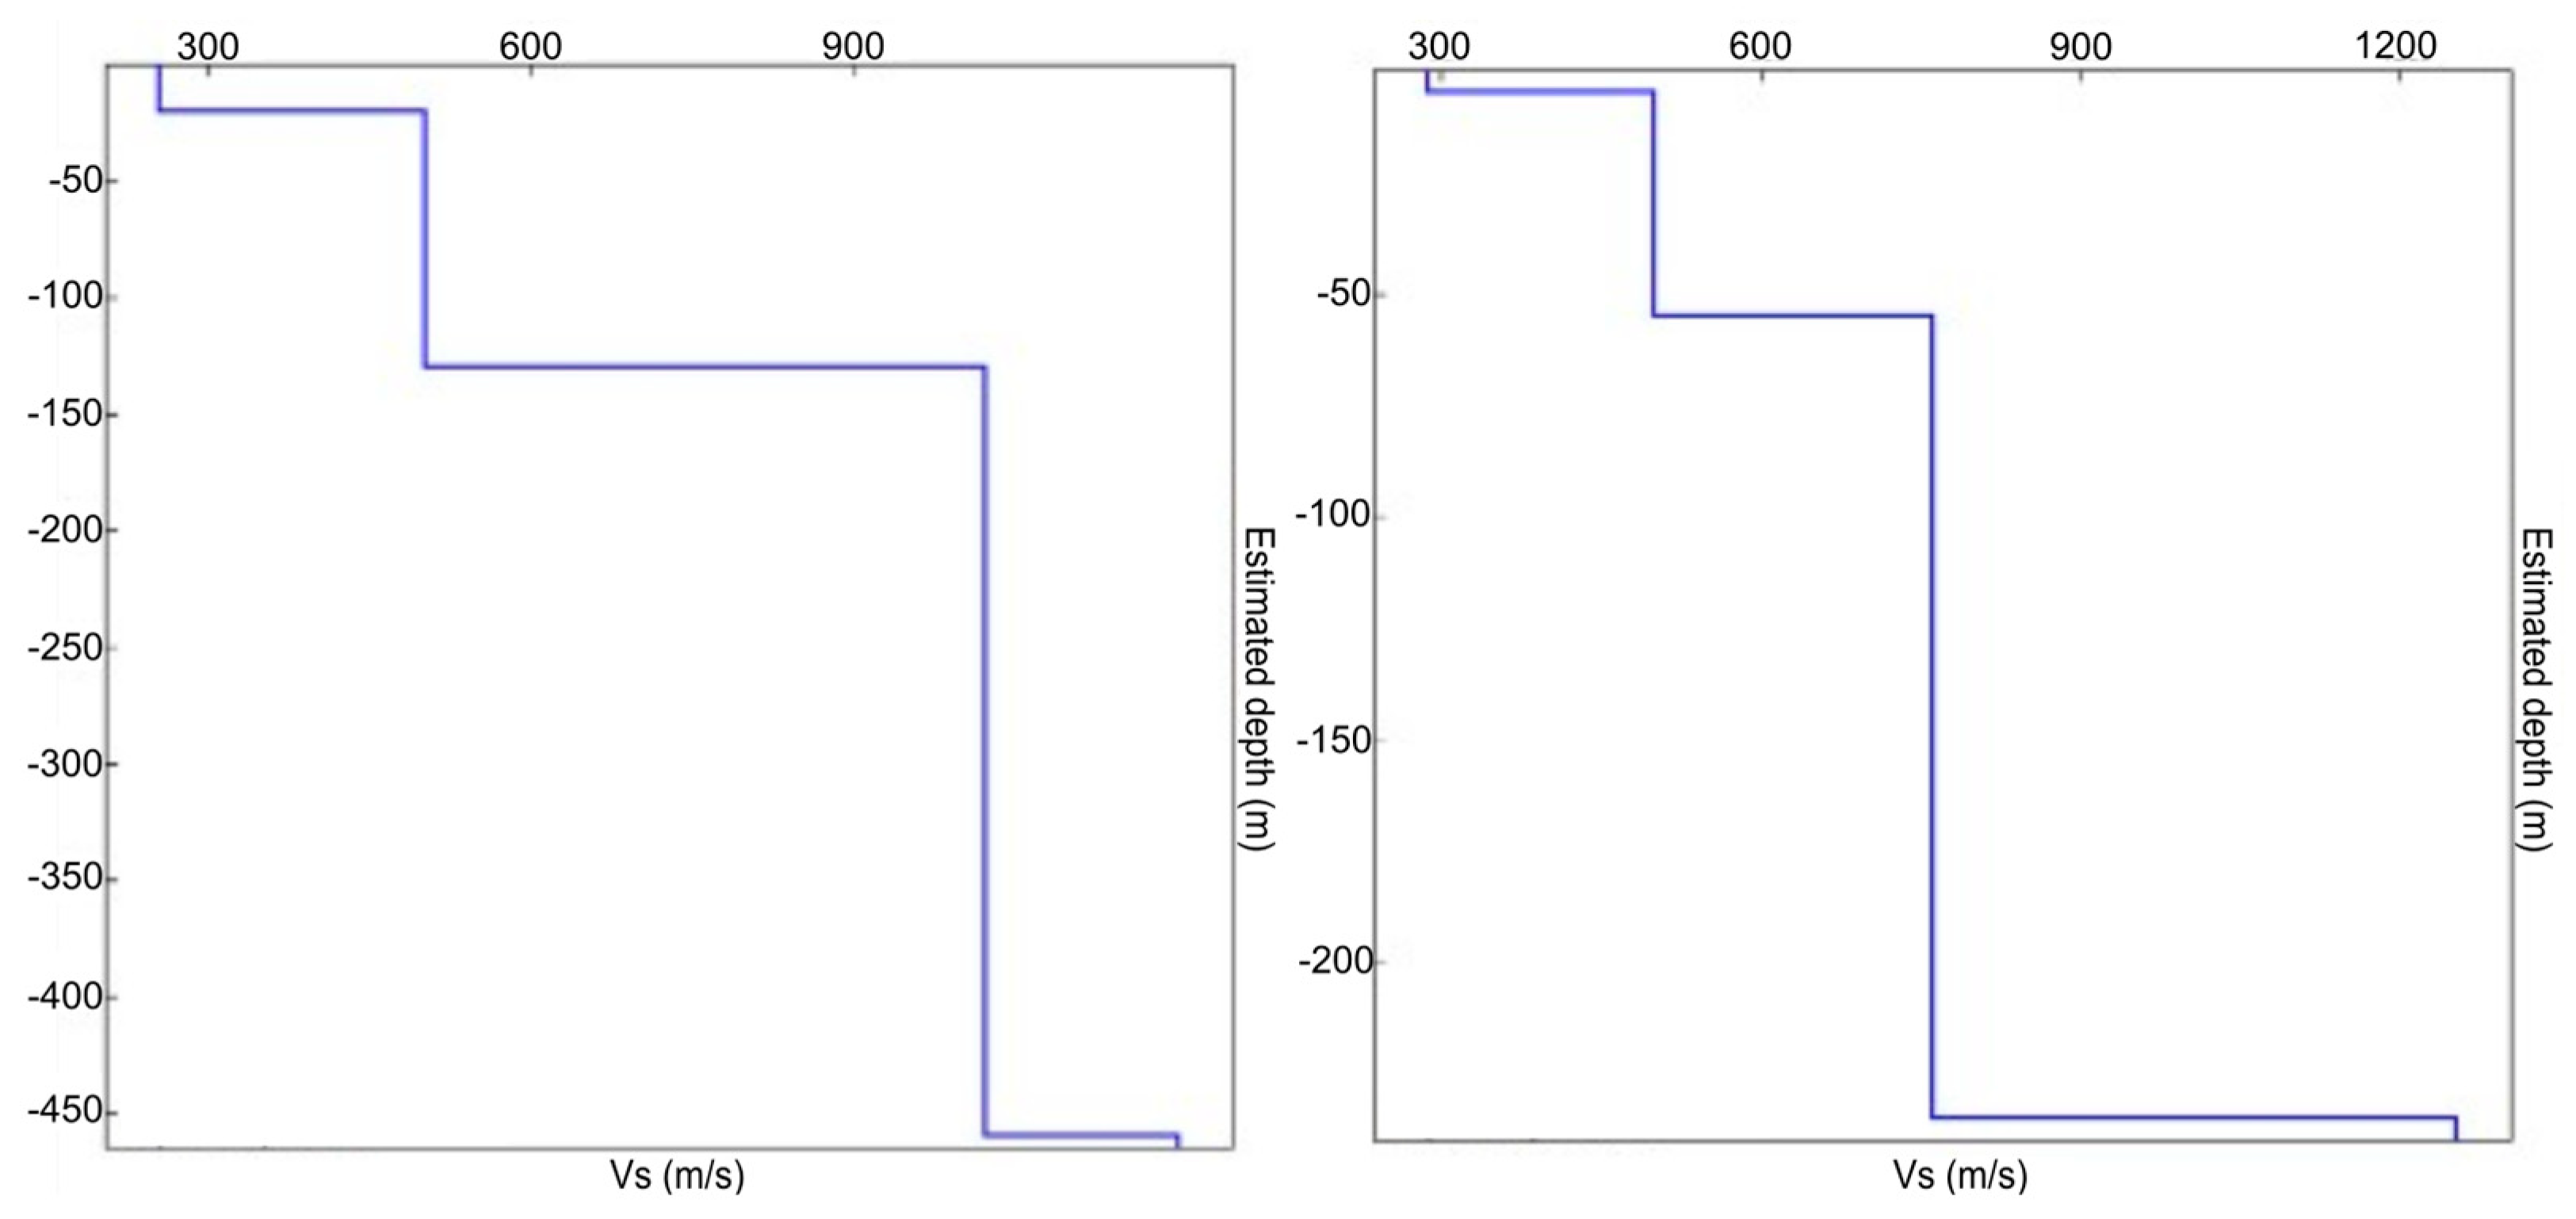
Figure 8.
Examples of inverse models related to the HVSR carried out in the BMGWB.
The HVSR inverse models regarding the SCGWB (Figure 7) are generally subdivided into layers varying from two to four. The shallower layers, characterized by an average value of 350 m/s and thickness varying from 5 to 30 m, should represent the alluvial and coastal deposits that predominantly outcrop along the plain. Several previous studies [19,81,82] attributed these velocities to sediments from coarse- to fine-size that usually fill the alluvial plains. The layers, with an average value of 600 m/s, correspond to the intermediate portions of the Vs-profiles. These show a maximum thickness of about 60 m and are associated with “Ghiaie e sabbie di Messina” (Qg). The deeper sections of the models represent high velocities, ranging from 800 to 1100 m/s. These values should describe the presence of different units that do not outcrop in the plain. In the west area of the SCGWB, the flyschoid deposits of Mt. Salici Unit (OM) and the limestones of San Marco d’Aluzio Unit (US) should cause these velocities. High values are, instead, attributed to the Frazzanò Flysch unit (UTf) and to the epimetamorphic rocks of the Longi-Taormina Unit (m2) for the easter sector. Finally, in the subsoil present between the Inganno and Rosmarino Streams, the overlapping of layers of the Marly clays (Cc) and the Flsych of Monte Soro Unit (Cm and Car) could be responsible for these elevated velocities computed.
The HVSR surveys realized in the BMGWB, shown in Figure 8, provide similar results about the near surface layers; inside also this waterbody, the superficial alluvial cover shows average Vs values of 300 m/s. Analyzing several single models, the increase of Vs within these first layers is noted, reaching values of 450 m/s, where alluvial deposits present the maximum thickness. This occurs, for example, south of the Milazzo Cape where 80 m of the alluvial deposits are described. Going deeper in the models, a Vs value from 500 to 700 m/s is often present; these values could both be referred to the following formation: “Ghiaie e sabbie di Messina” (Qg), Grey-blue clays (Qa), Rometta (PQ), Trubi (Pi), San Pier Niceto (Maa; Mar; Mac) and Capo d’Orlando Flysch (OMar; OMc). The highest values are found, also for BMGWB, at the base of the HVSR models. The Antisicilide Unit (AS) clays and the metamorphic rocks of the Peloritani Mountains, such as those from the Aspromonte units (UA), have been linked to velocities that exceed 800 m/s.
4.3. Tridimensional Models of the Electrical Resistivity
Three-dimensional models related to the variation of electrical resistivity were realized for SCGWB and BMGWB. These models were produced through the Voxler software v.4, provided by Golden Software (Golden Software, LLC, Golden, CO, USA), LLC, that allowed to laterally interpolate the inverse models of electrical resistivity, obtained from the new reanalyzes of the VES. The lower boundary of the models is given by the depth of investigation of VES while the lateral confinement is provided by the perimeters of the two groundwater bodies examined. The logarithm of electrical resistivity was chosen to be represented due to the high parameter contrasts found in the two areas.
The model realized for SCGWB, represented in Figure 9, shows areas characterized by different resistivity patterns. In the eastern side of the plain, higher values (200–500 Ω m) have been observed. Within the Furiano water stream, these values should be attributed to the presence of Monte Soro Flysch (Car) and Mt. Maragone Unit (OMia) at shallow depth, below the deposits of SCGWB. The alluvial deposits are, indeed, thin in this area and cover the aforementioned units, mainly composed of the alternations of quartzarenites and clays. Eastwards, in the mouth sector of the Rosmarino River, the resistivity values are high, probably due to the amount of fresh water flowing within alluvial deposits. Furthermore, in this sector of the Rosmarino River, these deposits reach the highest thickness. Lastly, around the Zappula River, the high values of resistivity can be linked to the presence of phyllades and metamorphosed arenites, rich in quartz. These deposits belong to the Longi-Taormina Unit (m2) and are covered by thin alluvial bodies.
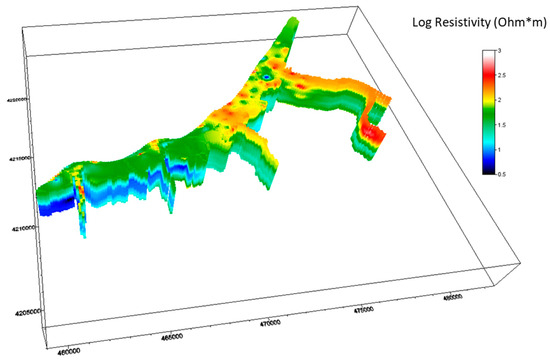
Figure 9.
3D model of the distribution of the logarithm of the electrical resistivity of the water body of the Sant’Agata–Capo D’Orlando Plain (SCGWB).
Medium resistivity values, comprising between 35 and 70 Ω m, are present in several areas of the SCGWB floodplain. In the area between the Furiano and Inganno streams, the abovementioned resistivity values are related to sands, silt and sandy matrix conglomerates, largely outcropping in this sector and also found in the borelogs. These latter sediments are ascribed to the “Ghiaie e sabbie di Messina” (Qg) unit and to the marine terrace deposits (tm). Moreover, the presence of gravels, pebbles and sands in a clayey matrix, identifying recent alluvial (ar), coastal, and stream deposits (a), may be the cause of the not elevated resistivity recognized along the coastline.
Low resistivity values (5–20 Ω m) are observable in the eastern sector of the SCGWB 3D model. The sea water intrusion could be considered one of the causes that produce this decrease in resistivity. Alluvial (ar) and coastal sediments (a) are partly composed of coarser deposits such as polygenic blocks, gravel, and coarse sands. An increase in grain size is often present in the lower portions of these deposits. Due to the sedimentological features, these deposits can be affected by strong sea water intrusion and the formation of a salt wedge below the plain. Moreover, not outcropping conductive rocks, such as those of the Marly clays (Cc) unit and the fractured limestones of the San Marco d’Alunzio Unit (US), should be responsible for the decrease in the resistivity values, as observed in the deeper part of the model.
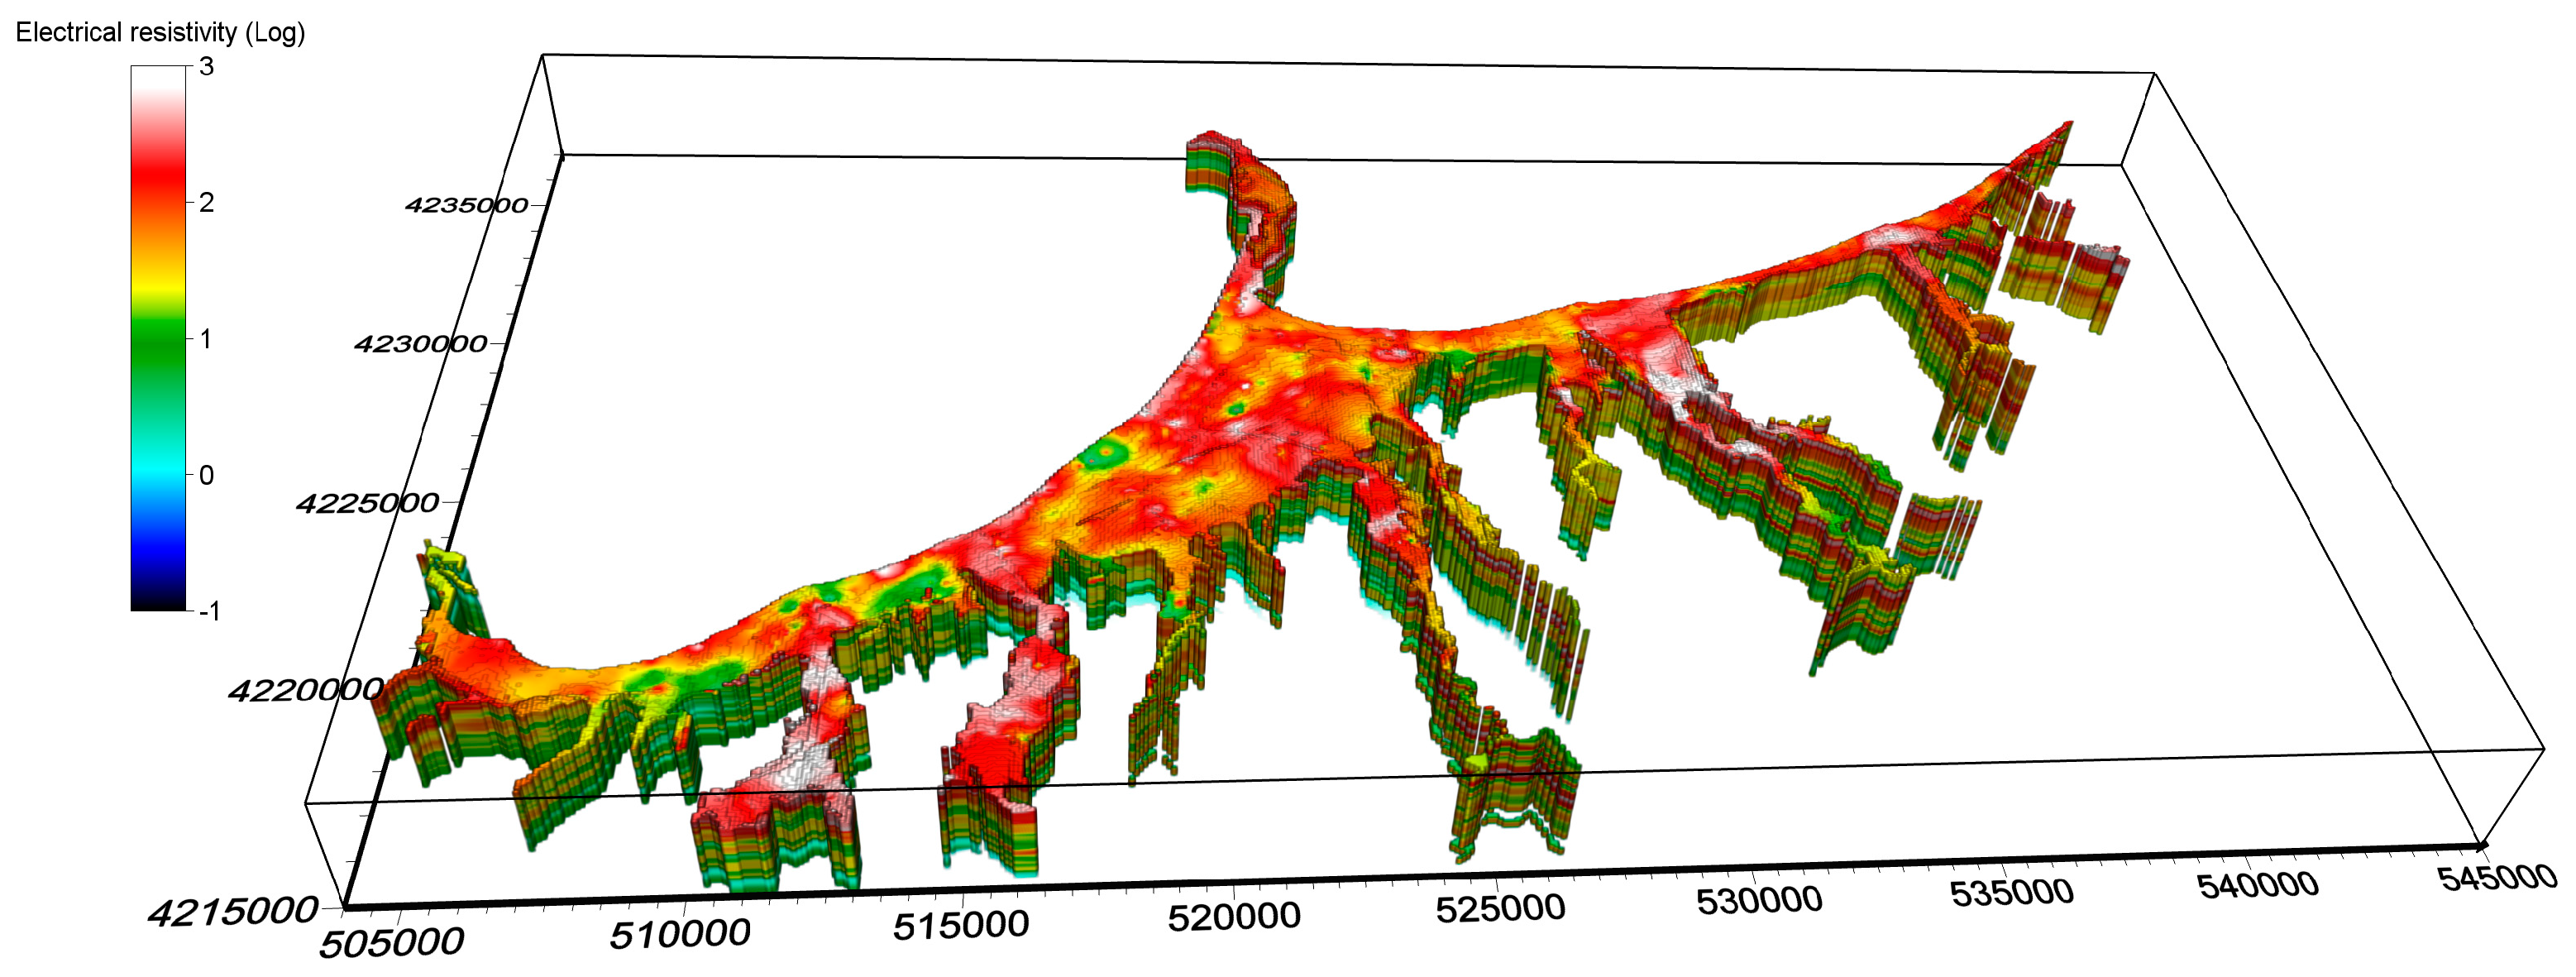
The 3D resistivity model of the BMGWB, shown in Figure 10, describes different resistivity trends. Resistivity values from 80 Ω m to 1000 Ω m are represented in different sectors of the BMGWB; most of the river arms, the central sector of the plain and the area of the Cape Milazzo promontory are characterized by these high values. The highest values, represented in white in Figure 10, are generally located in some sectors of the river arms in which the presence of fresh water causes an increase in resistivity, such as along the Termini and Niceto Streams. Resistivity values of about 80 Ω m are widely present in all river courses, both along the plain and in the areas located to the south, closer to the reliefs. In several areas around the mouths of the watercourses, these values are probably linked to the presence of thick alluvial deposits, such as in the coastal sectors of the Termini, Mela, Corriolo and Niceto Streams. Lastly, in the Cape Milazzo promontory, the outcropping metamorphic rocks of the Aspromonte Unit (UA; UAg) induce these medium-high values of resistivity.
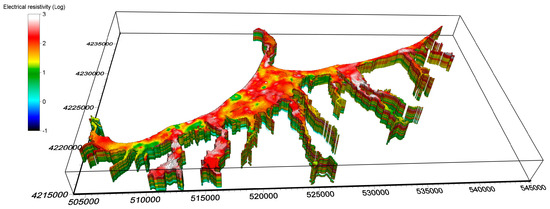
Figure 10.
3D model of the distribution of the logarithm of the electrical resistivity of the BMGWB.
Other areas of the BMGWB are affected by mean resistivity values of about 10–30 Ωm; these resistivities characterize the westernmost sector of the coastal plain, along some stream courses and in some areas between them. These values could be linked to portions of the BMGWB hosting alluvial sediments with less thickness. The lowest values described by the model are visible in the deepest parts of the plain, at depths between 40 and 120 m. As an example, the area between the towns of Barcelona P.G. and Milazzo, where the plain presents its greatest extension in N-S direction, is characterized by values less than 10 Ω m. This feature should be attributed to the presence of clays in the subsurface, as described by other studies performed in this area [57]. Moreover, for the lower values that appear quite shallow and close to the coast, marine ingression phenomena should not be excluded.
By analyzing the two resistivity models, we can notice the different contributions made by the floods and deposits that make up the water body. In the coastal plain areas, the resistivity model is, in fact, more influenced by the deposits of the SCGWB and BMGWB. In these areas, these deposits reach higher volumes. Within the mountain sector, represented in the models by the several arms of the rivers, the variation of resistivity is more linked to the characteristics of the rocks of the substrate, considering the thin thickness of the alluvial cover.
4.4. Estimate of the Bottom of the SCGWB and BMGWB
The thickness of the deposits that constituted SCGWB and BMGWB has been computed by a two-step workflow. Firstly, the deposits’ thickness and depth were estimated at several points of the groundwater bodies, considering the results of HVSR inverse models. These were compared with 3D electrical resistivity models and other available geophysical data; additionally, this information was integrated, compiled and interpreted using data from several available boreholes in order to identify the main lithotypes and their thicknesses, as appropriate. Subsequently, all punctual thickness and depth data were spatially interpolated using a kriging algorithm available in the Surfer software v.16, provided by Golden Software, LCC (Golden Software, LLC, Golden, CO, USA). In this way, maps of both the bottom of the two water bodies and the thicknesses of the deposits were created (Figure 11 and Figure 12).
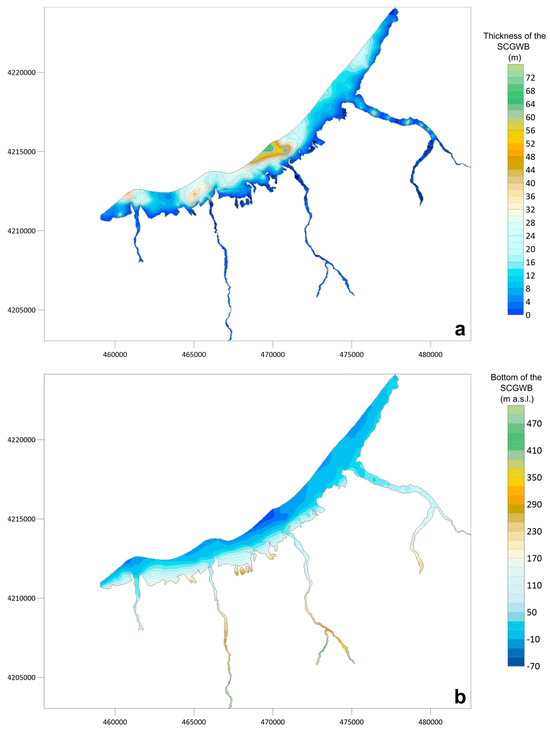
Figure 11.
Maps of the thickness of the floods (a) and the depth of the flood bed (b) reconstructed through the integration of geophysical and geological data available within the water body of Sant’Agata–Capo D’Orlando (SCGWB).

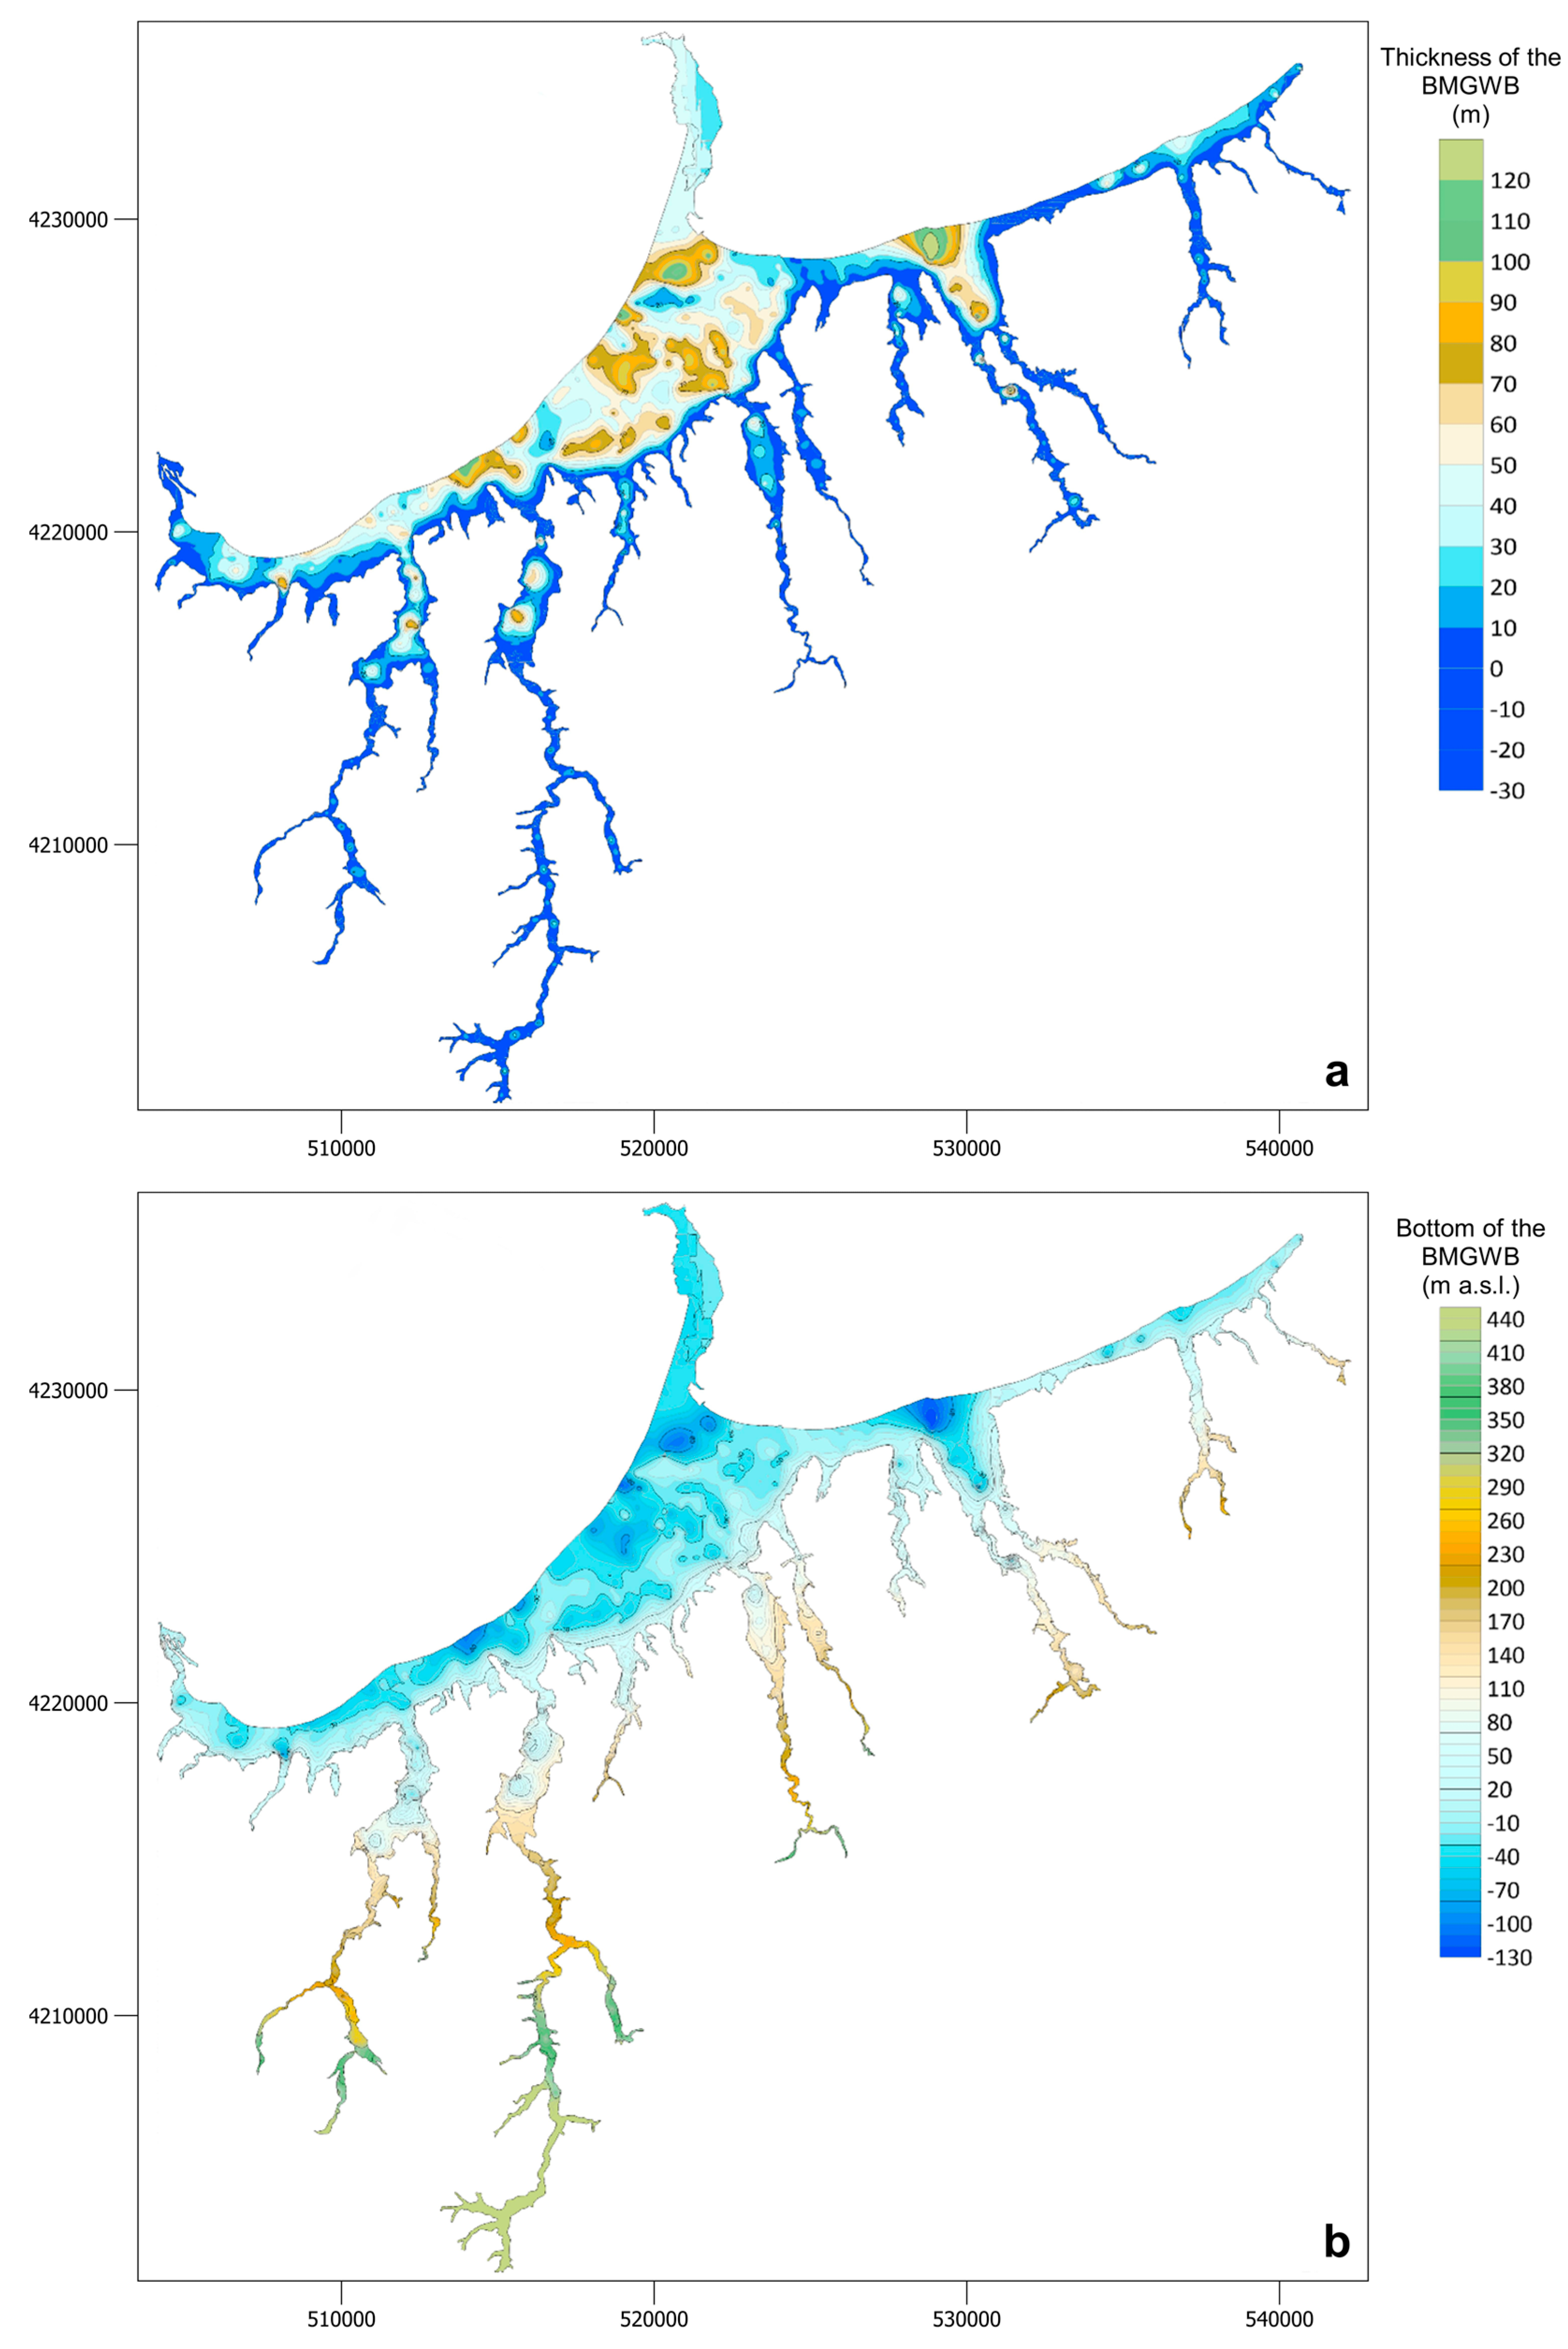
Figure 12.
Maps of the thickness of the floods (a) and the depth of the flood bed (b) reconstructed through the integration of geophysical and geological data available within the water body of Barcellona P.G.–Milazzo (BMGWB).
Significant deposit volume variation in the different sectors of SCGWB and BMGWB can be noticed by analyzing the two thickness maps.
With regard to SCGWB (Figure 11a), the largest thicknesses are found in the coastal sector. A maximum depth of about 70 m b.s.l. is noted at the mouth of the Rosmarino river. Other large thicknesses are defined at the mouth of the Furiano Stream. About 30–40 m of floods are, instead, described on the left of the Inganno Stream, in a position slightly decentralized from the current estuary. In the eastern part of the SCGWB, the thicknesses are not large, as seen on the sides of the Zappula Stream. Along the mountain river paths of the SCGWB streams, the floods have been described with thicknesses that generally do not exceed 4–8 m. The same values are present in the plain areas close to the hilly and mountainous areas.
The area described within the BMGWB, shown in Figure 12a, shows the highest flood thicknesses in the northern parts of the plain. In particular, proceeding from West to East, a thickness of the surface coulters of more than 100 m and maximum values of about 120–130 m were obtained for these areas: near the mouth of the Termini Stream, in a coastal area close to the Mela Stream, inside the sector situated in the south of Milazzo Cape, in the area of the mouth of the Niceto stream. Moreover, 70–80 m of deposits were found within the central section of the plain, between Barcelona P.G. and Milazzo towns and in some small areas along the mountain river rods. This occurs, for example, along the Termini stream and along other river courses situated in the east sector of the coastal plain. Thicknesses of 30–50 m are widely present in the coastal areas of the plain, as well as in some small parts of the mountain arms of the rivers. These higher sectors of the BMGWB are mainly characterized by minimum thicknesses, which do not exceed 10 m.
5. Conclusions
The integrated analysis of geological and geophysical data allowed us to reconstruct the thickness of the alluvial deposits present in the two water bodies of the North-Eastern sector of Sicily, exploiting all the stratigraphic and geophysical data available for the two coastal floodplains. In particular, VES data were re-interpreted using a laterally constrained joint inversion algorithm and a 3D interpolation of the inverse models to provide 3D models of the electrical resistivity for the studied areas. Further active and passive seismic surveys, distributed in the study areas, allowed us to characterize the water bodies also with regard to the seismic P- and S-wave velocity of the different lithotypes and alluvial sediments.
The joint performing and interpretation of seismic and electrical tomographies along the same alignment helped to identify, in detail, the seismic velocity, electrical resistivity and chargeability values for the most common lithotypes.
Using all stratigraphic data collected and the geophysical models achieved, maps of the bottom and of the thickness of the deposits filling SCGWB and BMGWB were reconstructed.
These maps are tools that can be used to quantify the water flow rates possibly present in the subsoil. With an appropriate monitoring network, the hydrogeological flow model for these coastal plains could be indeed defined. The latter is a useful elaboration to indicate the opportunity for aquifer exploitation and to individuate the possible causes that could deplete the wealth of the aquifer by forced emulation or pollution.
Furthermore, the geophysical models obtained can be used for stratigraphic studies since the geometric characteristics of deposits can be better defined. Moreover, the variation of the thickness of the alluvial sediments can be correlated with the recent tectonic activity and the rates of uplift experienced by the northern coast of Sicily.
Finally, using such detailed subsurface models is of great interest for studies addressing the characterization of the geological hazards of the two areas that were often affected, in the past, by floods and earthquakes. Furthermore, the models and maps obtained can be a valid aid for identifying and analyzing areas subject to flooding or liquefaction phenomena, and can constitute the starting models for local seismic response studies.
The illustrated research approach, conducted on the North-Eastern coast of Sicily, can be used in similar hydrogeological contexts with a shallow groundwater body, mainly constituted by alluvial deposits. The study shows that the integration of the results of multiple geophysical surveys, supported by the constraint of boreholes, is a useful instrument to define more detailed and accurate subsoil models. Therefore, the different geophysical techniques adopted allow us to reduce the uncertainties related to the results and models derived from the use of geophysical individual surveys.
Author Contributions
Conceptualization, P.C., R.M. and R.F.; methodology, P.C. and R.M.; software, P.C., R.M., A.C. and A.B.; validation, P.C. and R.M.; formal analysis, P.C., R.M. and R.F.; investigation, P.C., A.C. and A.B.; resources, P.C., R.M. and R.F.; data curation, P.C. and R.M.; writing—original draft preparation, A.C. and A.B.; writing—review and editing, R.M.; visualization, P.C. and R.M.; supervision, P.C.; project administration, R.F.; funding acquisition, R.F. All authors have read and agreed to the published version of the manuscript.
Funding
This research was funded by Regione Siciliana, Commissario Delegato per l’Emergenza Bonifiche e la tutela delle Acque in Sicilia.
Data Availability Statement
The data presented in this study are available on request from the corresponding author. The data are not publicly available due to funder restrictions.
Conflicts of Interest
The authors declare no conflicts of interest.
References
- Cacas, M.C.; Laigle, J.M.; Albouy, E.; Sulzer, C. Integrating stratigraphic modelling and seismic interpretation: Two practical examples. Pet. Geosci. 2008, 14, 253–261. [Google Scholar] [CrossRef]
- Villa, V.; Virmoux, C.; Chaussé, C.; Degeai, J.P.; Robert, V.; Kuzucuoglu, C.; Boschian, G.; Agostini, S.; Aureli, D.; Pagli, M.; et al. The long sedimentary succession of the Valle Giumentina basin (Abruzzo, Central Italy): New evidence from stratigraphic studies and Electrical Resistivity Tomography (ERT). Alp. Mediterr. Quat. 2016, 29, 193–199. [Google Scholar]
- Martorana, R.; Agate, M.; Capizzi, P.; Cavera, F.; D’Alessandro, A. Seismo-stratigraphic model of “La Bandita” area in the Palermo Plain (Sicily, Italy) through HVSR inversion constrained by stratigraphic data. Ital. J. Geosci. 2018, 137, 73–86. [Google Scholar] [CrossRef]
- Caputo, R.; Salviulo, L.; Piscitelli, S.; Loperte, A. Late Quaternary activity along the Scorciabuoi Fault (Southern Italy) as inferred from electrical resistivity tomographies. Ann. Geophys. 2007, 50, 213–224. [Google Scholar] [CrossRef]
- Imposa, S.; Mele, G.; Corrao, M.; Coco, G. Borehole seismic surveys for the mechanical characterization of a calcarenite cliff in the area of Ispica (southern Sicily). Bull. Eng. Geol. Environ. 2015, 74, 971–980. [Google Scholar] [CrossRef]
- Drahor, M.G.; Berge, M.A. Integrated geophysical investigations in a fault zone located on southwestern part of İzmir city, Western Anatolia, Turkey. J. Appl. Geophys. 2017, 136, 114–133. [Google Scholar] [CrossRef]
- Wang, Z.; Cai, X.; Yan, J.; Wang, J.; Liu, Y.; Zhang, L. Using the integrated geophysical methods detecting active faults: A case study in Beijing, China. J. Appl. Geophys. 2018, 156, 82–91. [Google Scholar] [CrossRef]
- Abbas, A.; Zhu, H.; Zeng, Z.; Zhou, X. Sedimentary facies analysis using sequence stratigraphy and seismic sedimentology in the paleogene Pinghu Formation, Xihu depression, east China sea shelf basin. Mar. Pet. Geol. 2018, 93, 287–297. [Google Scholar] [CrossRef]
- Ni, J.; Zhao, D.; Liao, X.; Li, X.; Fu, L.; Chen, R.; Xia, Z.; Liu, Y. Sedimentary Architecture Analysis of Deltaic Sand Bodies Using Sequence Stratigraphy and Seismic Sedimentology: A Case Study of Jurassic Deposits in Zhetybay Oilfield, Mangeshrak Basin, Kazakhstan. Energies 2022, 15, 5306. [Google Scholar] [CrossRef]
- Todaro, S.; Sulli, A.; Spatola, D.; Basilone, G.; Aronica, S. Seismic stratigraphy of the north-westernmost area of the Malta Plateau (Sicily Channel): The Middle Pleistocene-Holocene sedimentation in a tidally influenced shelf. Mar. Geol. 2022, 445, 106740. [Google Scholar] [CrossRef]
- Abu Zeid, N.; Corradini, E.; Bignardi, S.; Nizzo, V.; Santarato, G. The Passive Seismic Technique ‘HVSR’ as a Reconnaissance Tool for Mapping Paleo-soils: The Case of the Pilastri Archaeological Site, Northern Italy. Archaeol. Prospect. 2017, 24, 245–258. [Google Scholar] [CrossRef]
- Bottari, C.; Martorana, R.; Scudero, S.; Capizzi, P.; Cavallaro, D.; Pisciotta, A.; D’Alessandro, A.; Coltelli, M.; Lodato, L. Coseismic damage at an archaeological site in sicily, italy: Evidence of roman age earthquake surface faulting. Surv.Geophys. 2018, 39, 1263–1284. [Google Scholar] [CrossRef]
- Cafiso, F.; Canzoneri, A.; Capizzi, P.; Carollo, A.; Martorana, R.; Romano, F. Joint interpretation of electrical and seismic data aimed at modelling the foundation soils of the Maredolce monumental complex in Palermo (Italy). Archaeol. Prospect. 2023, 30, 69–85. [Google Scholar] [CrossRef]
- Butchibabu, B.; Khan, P.K.; Jha, P.C. Foundation evaluation of underground metro rail station using geophysical and geotechnical investigations. Eng. Geol. 2019, 248, 140–154. [Google Scholar] [CrossRef]
- Liu, B.; Wang, C.; Liu, Z.; Xu, Z.; Nie, L.; Pang, Y.; Wang, N.; Feng, S. Cascade surface and borehole geophysical investigation for water leakage: A case study of the Dehou reservoir, China. Eng. Geol. 2021, 294, 106364. [Google Scholar] [CrossRef]
- Polonia, A.; Albertazzi, S.; Bellucci, L.G.; Bonetti, C.; Bonetti, J.; Giorgetti, G.; Giuliani, S.; López Correa, M.; Mayr, C.; Peruzza, L.; et al. Decoding a complex record of anthropogenic and natural impacts in the Lake of Cavazzo sediments, NE Italy. Sci. Total Environ. 2021, 787, 147659. [Google Scholar] [CrossRef]
- Chaudhuri, A.; Sekhar, M.; Descloitres, M.; Godderis, Y.; Ruiz, L.; Braun, J.J. Constraining complex aquifer geometry with geophysics (2-D ERT and MRS measurements) for stochastic modelling of groundwater flow. J. Appl. Geophys. 2013, 98, 288–297. [Google Scholar] [CrossRef]
- Kumar, D.; Rao, V.A.; Sarma, V.S. Hydrogeological and geophysical study for deeper groundwater resource in quartzitic hard rock ridge region from 2D resistivity data. J. Earth Syst. Sci. 2014, 123, 531–543. [Google Scholar] [CrossRef]
- Canzoneri, A.; Capizzi, P.; Martorana, R.; Albano, L.; Bonfardeci, A.; Costa, N.; Favara, R. Geophysical Constraints to Reconstructing the Geometry of a Shallow Groundwater Body in Caronia (Sicily). Water 2023, 15, 3206. [Google Scholar] [CrossRef]
- Gondwe, B.R.; Lerer, S.; Stisen, S.; Marín, L.; Rebolledo-Vieyra, M.; Merediz-Alonso, G.; Bauer-Gottwein, P. Hydrogeology of the south-eastern Yucatan Peninsula: New insights from water level measurements, geochemistry, geophysics and remote sensing. J. Hydrol. 2010, 389, 1–17. [Google Scholar] [CrossRef]
- Zouhri, L.; Lutz, P. Hydrogeophysical characterization of the porous and fractured media (chalk aquifer in the Beauvais, France). Environ. Earth. Sci. 2016, 75, 343. [Google Scholar] [CrossRef]
- Muhammad, S.; Ehsan, M.I.; Khalid, P.; Sheikh, A. Hydrogeophysical modeling and physio-chemical analysis of quaternary aquifer in central part of Bari Doab, Punjab, Pakistan. Model. Earth Syst. Environ. 2023, 9, 1427–1443. [Google Scholar] [CrossRef]
- Hasan, M.; Shang, Y.; Jin, W.; Shao, P.; Yi, X.; Akhter, G. Geophysical Assessment of Seawater Intrusion into Coastal Aquifers of Bela Plain, Pakistan. Water 2020, 12, 3408. [Google Scholar] [CrossRef]
- Sendrós, A.; Urruela, A.; Himi, M.; Alonso, C.; Lovera, R.; Tapias, J.C.; Rivero, L.; Garcia-Artigas, R.; Casas, A. Characterization of a shallow coastal aquifer in the framework of a subsurface storage and soil aquifer treatment project using electrical resistivity tomography (Port de la Selva, Spain). Appl. Sci. 2021, 11, 2448. [Google Scholar] [CrossRef]
- Tarallo, D.; Alberico, I.; Cavuoto, G.; Pelosi, N.; Punzo, M.; Di Fiore, V. Geophysical assessment of seawater intrusion: The Volturno Coastal Plain case study. Appl. Water. Sci. 2023, 13, 234. [Google Scholar] [CrossRef]
- Matias, M.S.; Da Silva, M.M.; Ferreira, P.; Ramalho, E. A geophysical and hydrogeological study of aquifers contamination by a landfill. J. Appl. Geophys. 1994, 32, 155–162. [Google Scholar] [CrossRef]
- Ciampi, P.; Esposito, C.; Cassiani, G.; Deidda, G.P.; Flores-Orozco, A.; Rizzetto, P.; Chiappa, A.; Bernaberi, M.; Gardon, A.; Papini, M.P. Contamination presence and dynamics at a polluted site: Spatial analysis of integrated data and joint conceptual modeling approach. J. Contam. Hydrol. 2022, 248, 104026. [Google Scholar] [CrossRef] [PubMed]
- Mohammed, M.A.; Szabó, N.P.; Szűcs, P. Exploring hydrogeological parameters by integration of geophysical and hydrogeological methods in northern Khartoum state, Sudan. Ground. Sustain. Dev. 2023, 20, 100891. [Google Scholar] [CrossRef]
- Dochartaigh, B.E.O.; Archer, N.A.L.; Peskett, L.; MacDonald, A.M.; Black, A.R.; Auton, C.A.; Merritt, J.E.; Gooddy, D.C.; Bonell, M. Geological structure as a control on floodplain groundwater dynamics. Hydrogeol. J. 2019, 27, 703–716. Available online: https://nora.nerc.ac.uk/id/eprint/521927 (accessed on 23 February 2024). [CrossRef]
- Cianflone, G.; Vespasiano, G.; De Rosa, R.; Dominici, R.; Apollaro, C.; Vaselli, O.; Pizzino, L.; Tolomei, C.; Capecchiacci, F.; Polemio, M. Hydrostratigraphic framework and physicochemical status of groundwater in the Gioia Tauro Coastal Plain (Calabria—Southern Italy). Water 2021, 13, 3279. [Google Scholar] [CrossRef]
- von Suchodoletz, H.; Pohle, M.; Khosravichenar, A.; Ulrich, M.; Hein, M.; Tinapp, C.; Shultz, J.; Ballasus, E.; Veit, U.; Ettel, P.; et al. The fluvial architecture of buried floodplain sediments of the Weiße Elster River (Germany) revealed by a novel method combination of drill cores with two-dimensional and spatially resolved geophysical measurements. Earth Surf. Process. Landf. 2022, 47, 955–976. [Google Scholar] [CrossRef]
- CASMEZ (CASsa per il MEZzogiorno)—Direzione Generale Progetti Speciali. Progetto Speciale n. 30: Utilizzazione delle acque degli schemi idrici intersettoriali della Sicilia. In Indagini Idrogeologiche e Geofisiche per il Reperimento di Acque Sotterranee per L’approvvigionamento Idrico del Sistema IV Zona Nord Orientale Della Sicilia (Messinese); CASMEZ: Palermo, Italy, 1978. [Google Scholar]
- Granata, A.; Castrianni, G.; Pasotti, L.; Favara, R.; Gagliano Candela, E.; Scaletta, C.; Madonia, P.; Morici, S.; Bellomo, S.; La Pica, L.; et al. Studio per la definizione dei modelli concettuali dei corpi idrici sotterranei di Peloritani, Nebrodi e ragusano e indagini geofisiche correlate. In Proceedings of the 37 Convegno del Gruppo Nazionale di Geofisica della Terra Solida-GNGTS, Roma, Italy, 19–21 November 2018; Volume 37, pp. 104–108. Available online: https://hdl.handle.net/10447/316230 (accessed on 10 January 2024).
- Catalano, R.; Di Stefano, P.; Sulli, A.; Vitale, F. Paleogeography and structure of the central Mediterranean: Sicily and its offshore area. Tectonophysics 1996, 260, 291–323. [Google Scholar] [CrossRef]
- Giunta, G.; Luzio, D.; Agosta, F.; Calò, M.; Di Trapani, F.; Giorgianni, A.; Oliveri, E.; Orioli, S.; Perniciaro, M.; Vitale, M.; et al. An integrated approach to investigate the seismotectonics of northern Sicily and southern Tyrrhenian. Tectonophysics 2009, 476, 13–21. [Google Scholar] [CrossRef]
- Catalano, R.; Valenti, V.; Albanese, C.; Accaino, F.; Sulli, A.; Tinivella, U.; Gasparo Morticelli, M.; Zanolla, C.; Giustiniani, M. Sicily’s fold/thrust belt and slab rollback: The SI.RI.PRO. seismic crustal transect. J. Geol. Soc. 2013, 170, 451–464. [Google Scholar] [CrossRef]
- Morticelli, M.G.; Valenti, V.; Catalano, R.; Sulli, A.; Agate, M.; Avellone, G.; Albanese, C.; Basilone, L.; Gugliotta, C. Deep controls on foreland basin system evolution along the Sicilian fold and thrust belt. BSG-Earth Sci. Bull. 2015, 186, 273–290. [Google Scholar] [CrossRef]
- Basilone, L.; Bonfardeci, A.; Romano, P.; Sulli, A. Natural Laboratories for Field Observation About Genesis and Landscape Effects of Palaeo-Earthquakes: A Proposal for the Rocca Busambra and Monte Barracù Geosites (West Sicily). Geoheritage 2018, 11, 821–837. [Google Scholar] [CrossRef]
- Amodio-Morelli, L.; Bonardi, G.; Colonna, V.; Dietrich, D.; Giunta, G.; Ippolito, F.; Liguori, V.; Lorenzoni, F.; Paglionico, A.; Perrone, V.; et al. L’Arco Calabro-Peloritano nell’orogene Appenninico-Maghrebide. Mem. Soc. Geol. Ital. 1976, 17, 1. Available online: https://arpi.unipi.it/handle/11568/1278 (accessed on 10 January 2024).
- Lentini, F.; Catalano, S.; Carbone, S. Note Illustrative Della Carta Geologica Della Provincia di Messina, Scala 1:50.000: S.EL.CA, Firenze. 2000; pp. 1–70. Available online: https://www.isprambiente.gov.it/Media/carg/note_illustrative/601_Messina_Reggio_Calabria.pdf (accessed on 1 February 2024).
- Carbone, S.; Messina, A.; Lentini, F. Note Illustrative dei F. 587–600 “Milazzo–Barcellona Pozzo di Gotto” della Carta Geologica d’Italia Alla Scala 1:50.000; S.EL.CA., 2011; 262, pp. 146 ff., 5 tavv., 4 tabb. ISPRA—Regione Siciliana—Università di Catania; Servizio Geologico d’Italia: Rome, Italy.
- Servizio Geologico d’Italia. Carta Geologica d’Italia Alla Scala 1:50.000, F. 599 Patti; Servizio Geologico d’Italia: Rome, Italy, 2023. [Google Scholar] [CrossRef]
- Giunta, G.; Giorgianni, A. Note Illustrative del F.598 “S. Agata di Militello” Della Carta Geologica d’Italia Alla Scala 1:50.000; SystemCart; ISPRA—Università degli Studi di Palermo: Rome, Italy, 2013. Available online: https://www.isprambiente.gov.it/Media/carg/note_illustrative/598_S_Agata_di_Militello.pdf (accessed on 1 February 2024).
- Lentini, F.; Carbone, S. Geologia della Sicilia (Geology of Sicily). Mem. Descr. Carta Geol. d’It. 2014, XCV, 7–414. [Google Scholar]
- Giunta, G.; Nigro, F. Tectono-sedimentary constraints to the Oligocene-to-Miocene evolution of the Peloritani thrust belt (NE Sicily). Tectonophysics 1999, 315, 287–299. [Google Scholar] [CrossRef]
- Nigro, F.; Sulli, A. Plio-Pleistocene extensional tectonics in the Western Peloritani area and its offshore (northeastern Sicily). Tectonophysics 1995, 252, 295–305. [Google Scholar] [CrossRef]
- Giunta, G.; Nigro, F.; Renda, P. Extensional tectonics during Maghrebides chain building since Late Miocene: Examples from Northern Sicily. Ann. Soc. Geol. 2000, 70, 81–89. [Google Scholar]
- Giunta, G.; Nigro, F.; Renda, P.; Giorgianni, A. The Sicilian–Maghrebides Tyrrhenian Margin: A neotectonic evolutionary model. Mem. Soc. Geol. 2000, 119, 553–565. [Google Scholar]
- Renda, P.; Tavarnelli, E.; Tramutoli, M.; Gueguen, E. Neogene deformations of Northern Sicily, and their implications for the geodynamics of the Southern Tyrrhenian Sea margin. Mem. Soc. Geol. 2000, 55, 53–59. [Google Scholar]
- Nigro, F.; Renda, P. Plio-Pleistocene stike-slip deformation in NE Sicily: The example of the area between Capo Calavà and Capo Tindari. Boll. Soc. Geol. 2005, 124, 377–394. [Google Scholar]
- Giunta, G.; Bellomo, D.; Carnemolla, S.; Pisano, A.; Profeta, R.; Runfola, P. La “Linea di Taormina”: Residuo epidermico di una paleostruttura crostale del fronte cinematico maghrebide? Acts 8◦ GNGTS Congr. 1989, 8, 1197–2013. [Google Scholar]
- Gasparo Morticelli, M.; Avellone, G.; Sulli, A.; Agate, M.; Basilone, L.; Catalano, R.; Pierini, S. Mountain building in NW Sicily from the superimposition of subsequent thrusting and folding events during Neogene: Structural setting and tectonic evolution of the Kumeta and Pizzuta ridges. J. Maps 2017, 13, 276–290. [Google Scholar] [CrossRef]
- Lentini, F. Carta Geologica della Provincia di Messina, Scala 1:50.000: S.EL.CA, Firenze. 2000. Available online: https://www2.regione.sicilia.it/beniculturali/dirbenicult/bca/ptpr/documentazione%20tecnica%20messina/CARTOGRAFIA/ANALISI/03_Geologia.pdf (accessed on 1 February 2024).
- Arisco, G.; Arnone, G.; Favara, R.; Nigro, F.; Perricone, M.; Renda, P.; Mondello, C. Integrated neotectonic and morphometric analysis of northern Sicily. Boll. Soc. Geol. 2006, 125, 221–244. Available online: http://hdl.handle.net/2122/2497 (accessed on 10 January 2024).
- Ferrara, V. Vulnerabilità all’inquinamento degli Acquiferi dell’area Peloritana (Sicilia Nord-Orientale), Studi Sulla Vulnerabilità Degli Acquiferi 14. In Quaderni di Tecniche di Protezione Ambientale: Edizione Pitagora; Pitagora Editrice Srl.: Bologna, Italy, 1999. [Google Scholar]
- Cangemi, M.; Madonia, P.; Albano, L.; Bonfardeci, A.; Di Figlia, M.G.; Di Martino, R.M.R.; Nicolosi, M.; Favara, R. Heavy Metal Concentrations in the Groundwater of the Barcellona-Milazzo Plain (Italy): Contributions from Geogenic and Anthropogenic Sources. Int. J. Environ. Res. Public Health 2019, 16, 285. [Google Scholar] [CrossRef] [PubMed]
- Capizzi, P.; Martorana, R.; Favara, R.; Albano, L.; Bonfardeci, A.; Catania, M.; Costa, N.; Gagliano, A. Geophysical Contribution to the Reconstruction of the Hydrological Model of “Barcellona-Milazzo Plain” Groundwater Body, Northen Sicily. In Proceedings of the 25th European Meeting of Environmental and Engineering Geophysics; European Association of Geoscientists & Engineers, Moscow, Russia, 8–12 September 2019; pp. 1–5. [Google Scholar] [CrossRef]
- Celico, P. Prospezioni Idrogeologiche, Vol. I e Vol. II; Liguori Editore Napoli: Naples, Italy, 1988. [Google Scholar]
- Allocca, V.; De Vita, P.; Manna, F. La variabilità climatica in Italia meridionale e gli effetti sulla ricarica degli acquiferi carbonatici. EHE Geol. 2012, 14, 9–10. Available online: https://hdl.handle.net/11588/425079 (accessed on 23 February 2024).
- Castany, G. Idrogeologia. In Principi e Metodi: Edizione Flaccovio Dario, Palermo; Pitagora Editrice Srl.: Bologna, Italy, 1985. [Google Scholar]
- Civita, M. Idrogeologia Applicata e Ambientale; CEA Editore: Rozzano, Italy, 2005; p. 800. ISBN 8808087417. [Google Scholar]
- Cimino, A.; Cosentino, C.; Oieni, A.; Tranchina, L. A geophysical and geochemical approach for seawater intrusion assessment in the Acquedolci coastal aquifer (Northern Sicily). Environ. Geol. 2007, 55, 1473–1482. [Google Scholar] [CrossRef]
- Pantaleone, D.V.; Vincenzo, A.; Fulvio, C.; Silvia, F.; Cesaria, M.; Giuseppina, M.; Ilaria, M.; Vincenzo, P.; Rosa, S.A.; Gianpietro, S.; et al. Hydrogeology of continental southern Italy. J. Maps 2018, 14, 230–241. [Google Scholar] [CrossRef]
- Kosinski, W.K.; Kelly, W.E. Geoelectric Soundings for Predicting Aquifer Properties. Groundwater 1981, 19, 163–171. [Google Scholar] [CrossRef]
- Heigold, P.C.; Gilkeson, R.H.; Cartwright, K.; Reed, P.C. Aquifer Transmissivity from Surficial Electrical Methods. Groundwater 1979, 17, 338–345. [Google Scholar] [CrossRef]
- Van Overmeeren, R.A. Aquifer boundaries explored by geoelectrical measurements in the coastal plain of Yemen: A case of equivalence. Geophysics 1989, 54, 38–48. [Google Scholar] [CrossRef]
- Auken, E.; Christiansen, A.V. Layered and laterally constrained 2D inversion of resistivity data. Geophysics 2004, 69, 752–761. [Google Scholar] [CrossRef]
- Nogoshi, M.; Iragashi, T. On the propagation characteristic of the microtremors. J. Seismol. Soc. Jpn. 1970, 24, 24–40. [Google Scholar]
- Nakamura, Y. A method for dynamic characteristics estimation of subsurface using microtremor on the ground surface. Quat. Rep. Railw. 1989, 30, 25–33. Available online: https://worldcat.org/oclc/3127232 (accessed on 23 February 2024).
- Castellaro, S.; Mulargia, F. VS30 estimates using constrained H/V measurements. Bull. Seismol. Soc. Am. 2009, 99, 761–773. [Google Scholar] [CrossRef]
- Castellaro, S. The complementarity of H/V and dispersion curves. Geophysics 2016, 81, T323–T338. [Google Scholar] [CrossRef]
- Park, C.B.; Miller, R.D.; Xia, J. Multichannel analysis of surface waves. Geophysics 1999, 64, 800–808. [Google Scholar] [CrossRef]
- White, D.J. Two-Dimensional Seismic Refraction Tomography. Geophys. J. Int. 1989, 97, 223–245. [Google Scholar] [CrossRef]
- Koch, K.; Wenninger, J.; Uhlenbrook, S.; Bonell, M. Joint interpretationof hydrological and geophysical data: Electrical resistivityn tomography results from a process hydrological research site in the Black Forest Mountains, Germany. Hydrol. Process. Int. J. 2009, 23, 1501–1513. [Google Scholar] [CrossRef]
- Robert, T.; Dassargues, A.; Brouyère, S.; Kaufmann, O.; Hallet, V.; Nguyen, F. Assessing the contribution of electrical resistivity tomography (ERT) and self-potential (SP) methods for a water well drilling program in fractured/karstified limestones. J. Appl. Geophys. 2011, 75, 42–53. [Google Scholar] [CrossRef]
- Martorana, R.; Lombardo, L.; Messina, N.; Luzio, D. Integrated geophysical survey for 3D modelling of a coastal aquifer polluted by seawater. Near Surf. Geophys. 2014, 12, 45–59. [Google Scholar] [CrossRef]
- Frischknecht, F.C.; Raab, P.V. Time-domain electromagnetic soundings at the Nevada Test Site, Nevada. Geophysics 1984, 49, 981–992. [Google Scholar] [CrossRef]
- Wightman, W.E.; Kaufman, A.A.; Hoekstra, P. Mapping gas-water contacts in shallow producing formations with transient EM. In SEG Technical Program Expanded Abstracts. Soc. Explor. Geophys. 1983, 0059, 59–60. [Google Scholar] [CrossRef]
- Fitterman, D.V.; Stanley, W.D.; Bisdorf, R.J. Electrical structure of Newberry volcano, Oregon. J. Geophys. Res. Solid Earth 1988, 93, 10119–10134. [Google Scholar] [CrossRef]
- Martorana, R.; Capizzi, P.; Avellone, G.; D’Alessandro, A.; Siragusa, R.; Luzio, D. Assessment of a geological model by surface wave analyses. J. Geophys. Eng. 2017, 14, 159–172. [Google Scholar] [CrossRef]
- Di Capua, G.; Peppoloni, S.; Amanti, M.; Cipolloni, C.; Conte, G. Site classification map of Italy based on surface geology. Geol. Soc. Lond. Eng. Geol. Spec. Publ. 2016, 27, 147–158. [Google Scholar] [CrossRef]
- Forte, G.; Chioccarelli, E.; De Falco, M.; Cito, P.; Santo, A.; Iervolino, I. Seismic soil classification of Italy based on surface geology and shear-wave velocity measurements. Soil Dyn. Earthq. Eng. 2019, 122, 79–93. [Google Scholar] [CrossRef]


Disclaimer/Publisher’s Note: The statements, opinions and data contained in all publications are solely those of the individual author(s) and contributor(s) and not of MDPI and/or the editor(s). MDPI and/or the editor(s) disclaim responsibility for any injury to people or property resulting from any ideas, methods, instructions or products referred to in the content. |
© 2024 by the authors. Licensee MDPI, Basel, Switzerland. This article is an open access article distributed under the terms and conditions of the Creative Commons Attribution (CC BY) license (https://creativecommons.org/licenses/by/4.0/).