Abstract
Anthropogenic development can strongly influence natural river processes, leading to environmental changes that negatively affect important habitats and biodiversity and consequently reduce economically important natural resources. This study investigated the effects of salinity intrusion on the habitat of the clam Corbicula japonica in the Seomjin River estuarine zone. We employed the Environmental Fluid Dynamics Code (EFDC) model, which incorporates topographic data and hydrological changes, to simulate salinity. Two salinity measurement facilities were installed in Seomjin River estuarine and operated to optimize the EFDC model. The results show that reduced flow rates due to intake have a negligible impact on the increased salinity. Maintaining optimal salinity (15–20 psu) during neap tides at the Seomjin River Bridge requires constant high flow rates, which poses significant challenges. Saltwater stratification is identified as the primary cause of pronounced salinity stratification, particularly during neap tides. Addressing this issue through river discharge and intake facility operation is challenging. Structural measures, including riverbed restoration and underwater barriers, are recommended to improve resistance to seawater intrusion. Future research should aim to develop scenarios to reduce salinity, quantify the reduction efficiency, and propose region-specific measures.
1. Introduction
The Seomjin River, ranking fourth among South Korea’s five major rivers, remained largely unaffected by man-made interventions, such as estuary embankments or riverside development. However, since 1980, the construction and operation of key structures, such as the Seomjin River Dam, Juam Dam, Suo Dam, and Daap Water Intake in the upper reaches of the Seomjin River, coupled with landfill of Gwangyang Bay, have led to a reduction in freshwater inflow owing to the rise in sea level and the counterflow of seawater. This has caused a substantial influx of seawater into inland areas, resulting in estuarine marinization and posing a significant environmental challenge in the region [1]. Major facilities such as the Seomjin River Dam and Juam Dam on the Boseong River are situated in the upper reaches of the Seomjin River mainstream. The downstream flow was altered and discharge decreased owing to the construction of the expanded Seomjin River Dam in 1965 and the completion of the Juam Dam in 1992, in line with the government’s economic development plan [2]. Additionally, various impacts, such as estuarine dredging and landfilling, have resulted in saline water inflow into the upper reaches of the estuary, causing gradual expansion [3]. Consequently, the marinization of the Seomjin River has occurred, and the habitat and resource quantity and quality of clams (genus Corbicula) inhabiting the Seomjin River estuary have significantly diminished. This emerging trend poses serious local issues, such as aquaculture industry and agricultural damages; however, there is a lack of information on the causes of these problems. As for aquaculture industry and agricultural damages, there are some international literature sources available. Gaiolini et al. [4] studied seawater intrusion along the Volturno River (Italy) by assessing it via numerical modeling and spectral analysis. In light of the negative impacts of surface and groundwater salinization on coastal communities and ecosystems causing actual losses to industries, this study highlights the need for alternative solutions through hydrological modeling to analyze salt distribution and seawater intrusion distances. Moreover, Moreira et al. [5] investigated the effects of salinization in freshwater upon non-halophyte aquatic plants for salty freshwater macrophytes. This study analyzed the salt tolerance of freshwater-dwelling macrophytes through experiments and quantified the negative impacts on plants with increasing salinity, providing future aquatic ecosystem management strategies for climate change adaptation.
Aside from being a commercially valuable and essential aquatic resource for human consumption, corbicula species play a crucial role in the purification of aquatic ecosystems as filter-feeding bivalves. In particular, the Seomjin River constitutes approximately 30% of South Korea’s clam production. However, marinization in the Seomjin River has led to an increase in salinity, resulting in the intrusion of saline water into upstream areas of the estuary, including the upper reaches of the Ha River. This intrusion is anticipated to have adverse effects on clams, such as a reduction in suitable habitat and a decline in average clam size, growth rate, and flesh quality [6].
The decrease in corbicula resources can be attributed to the aforementioned factors, such as reduced freshwater inflow, which led to increased salinity and deteriorated water quality in the Seomjin River. Most studies focus on changes in salinity due to variations in flow rates. Among them, the Caloosahatchee River estuary study in Florida, the USA, serves as a relevant case for this study, as it shares similarities in study areas and hydraulic conditions. The Caloosahatchee River study in Florida, the USA, focused on controlling flow rate and salinity using locks [7]. In this study of the Caloosahatchee River estuary, as a result of dam gate adjustments, changes in river flow rates, both increases and decreases, were directly measured to evaluate water quality changes along the coast in response to artificial flow regulation. However, research providing a simulation of flow patterns and salinity changes in the estuarine system, along with the identification of the causes of these changes and optimal salinity for corbicula habitats, remains insufficient. The Environmental Fluid Dynamics Code (EFDC) is a representative model capable of simulating river flows and substance dynamics. The EFDC model has been applied globally in various studies, focusing primarily on tide and water quality analyses of estuarine coastal areas [8,9]. In South Korea, several studies have been completed on the use of models to understand flow dynamics and improve the management of saltwater intrusion. For example, Son [10] reevaluated saltwater intrusion and the prevention of salinity-induced damage in the Nakdong River Estuary using the EFDC model, Han [11] conducted numerical model experiments using finite-difference grid systems to investigate the characteristics of average tides in Gwangyang and Jinju Bays, Kwak [12] utilized the EFDC model to study the spatiotemporal mixing characteristics of Seomjin River discharge water, and Kang et al. employed the EFDC model to reproduce three-dimensional circulation patterns considering tides, water temperature, and salinity in the Gwangyang and Jinju Bays [13]. Kang et al. also investigated changes in the density-driven layer due to discharge from the Seomjin and Nam River dams. Although studies have been conducted on the formation and destruction processes of stratification due to freshwater inflow [14] and the behavioral characteristics and residence time of discharge water from the Nam River dam [15], there has been a lack of modeling for analyzing the causes and impacts of salinity intrusion in the Seomjin River estuary.
Therefore, this study aimed to elucidate the causes of salinity intrusion and increased high-salinity penetration distance in the Seomjin River estuarine zone, inhabited by Corbicula japonica, by simulating changes in salinity based on past river environmental variations. To achieve this aim, a three-dimensional numerical model, specifically the EFDC, was developed for the mainstream and estuarine areas of the Seomjin River. In addition, actual tide and water level measurements were recorded, and salinity sensors were strategically placed within the target areas to establish a salinity dataset. This dataset was used as the basis for the model calibration and validation.
The results of the study will be used to ultimately establish management measures that can sustain the corbicula fishery by identifying and presenting the causes of clam damage for national and local governments.
2. Materials and Methods
2.1. Study Area
The Seomjin River Basin, located in the central-western region of the southern coast of South Korea, is one of the five major river basins in South Korea. Geographically, it is situated between approximately 126° 51′50″ and 127° 53′05″ E and 34° 40′26″ and 35° 50′0″ N. The Seomjin River Basin covers an area of 4,913.22 km2 with a river length of 222.14 km [16] (Figure 1). The mean elevation level (EL) was recorded as 301.58 m (Figure 2) [16]. The land-use distribution comprises 876.29 km2 of arable land, 3400.61 km2 of forested area, and 67.12 km2 of developed land. Approximately 69.2% of the total watershed area consists of forested land [16]. Upstream of the Seomjin River main stream, key facilities such as the Seomjin and Juam dams on the Boseong River are strategically located. Owing to the expansion of the Seomjin Dam in 1965 and the completion of the Juam Dam in 1992, downstream sulfur fluctuations and reduced discharge water occurred, primarily to supply a substantial amount of water outside the watershed, in line with the government’s economic development plan. Concurrently, various impacts such as sand mining and landfilling in the estuary have led to an influx of saline water into the upstream estuary, causing long-term ecological changes in the watershed [16].
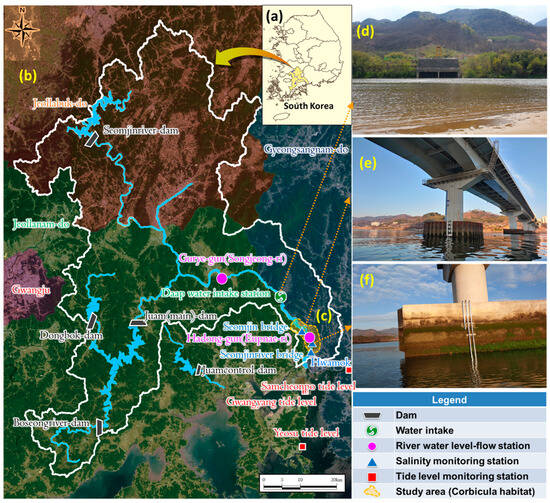
Figure 1.
The study area and monitoring sites. (a) From map of South Korea, the study area has been zoomed out including Seomjin Rive Basin, (b) map of the whole Seomjin River Basin, (c) monitoring sites (water level, tide level, and dam) and corbicular habitat area, (d) Daap water intake facility, (e) salinity monitoring site at Seomjin bridge, (f) salinity monitoring site at Seomjin River bridge.
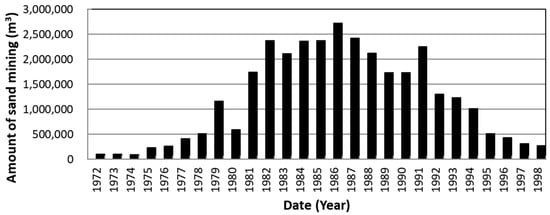
Figure 2.
Annual quantity of sand mined (m3) from the Seomjin River between 1972 and 1998.
The study area represents tide river zone located approximately 10–15 km away from the open estuary. Corbicula mainly inhabit this region and are predominantly harvested by local fishermen. However, since the early 2000s, there have been persistent complaints from fishermen owing to the intrusion of high-salinity seawater into corbicula habitats, resulting in reduced abundance, size, and quality of the resource [17]. The reports of damage suffered by fishermen were brought to the attention through direct complaints submitted by fishermen to the Ministry of Environment and were raised through various media outlets. In this study, we aimed to quantify the penetration amount and intrusion distance of high-salinity seawater that affects corbicula. To achieve this, we selected the optimal salinity for corbicula habitat based on the available literature, specifically choosing 15 to 20 psu as the suitable salinity range [18].
2.2. Description of the EFDC Model
The Environmental Fluid Dynamics Code (EFDC) is a three-dimensional numerical model developed by the Virginia Institute of Marine Science in the United States. It was designed to simulate the fluid dynamics and material transport in coastal, estuarine, reservoir, wetland, and lake environments. The model facilitates the reproduction of seawater flow and material movement, offering the ease of two-dimensional and three-dimensional vertical and horizontal modeling. The EFDC is a comprehensive model applicable to marine and freshwater environments for predicting water flow and water quality changes. It comprises four main components: hydrodynamics, water quality, sediment transport, and toxicological analysis. The hydrodynamic component employs a three-dimensional equation that considers temperature and salinity. It models 22 state variables, including temperature, salinity, dissolved oxygen, three groups of phytoplankton, and carbon, nitrogen, phosphorus, and silica cycles [19]. Because the EFDC model is widely used worldwide, it is recommended that users of the model refer to the published literature, for example, Kim et al., for a comprehensive understanding of the model’s hydraulic and water quality analysis structure [20].
2.3. Data Setup for Simulation Model
2.3.1. Environmental Changes Data at Daap Water Intake and Sand Mining Works
The Daap Water Intake Facility is located in Gosari, Gwangyang City, Jeollanam-do, approximately 26 km upstream from the mouth of the Seomjin River (Figure 1a). It supplies up to 400,000 tons of water daily (including 178,000 tons from the Seomjin Dam, 160,000 tons from the Juam Dam, and 62,000 tons from the Seomjin River) to support residential and industrial water requirements in the Jeonnam Eastern Region, including the Yeosu National Industrial Complex. Since water extraction commenced in 1978, challenges have arisen owing to the lowering of riverbed levels at the intake location by approximately 2.0 m in 1994 owing to sand mining activities in rivers, raising concerns about seawater intrusion and complications in water extraction. To overcome these issues, the intake location was relocated 4.2 km upstream in 2005, and the facility’s capacity increased to its current state.
Sand mining in Seomjin River persisted between 1972 and 1998. In 1999, to protect the Seomjin River, the government imposed a ban on sand mining permits [21]. Figure 2 shows the annual quantity of sand mined from the Seomjin River Basin. From 1981 to 1994, sand mining exceeded one million m3 annually, reaching a maximum of 2.7 million m3 in 1994 (2.5 times that of 1978) [22]. Figure 3 illustrates the changes in riverbed elevation due to sand mining over a 40-year period (1978–2017). As shown in Figure 3, significant sand mining occurred from 1978 to 1989 in the primary corbicula habitat zone extending from the Seomjin River Bridge to Seomjin Bridge. During this period, the maximum decrease in riverbed elevation was 12.58 m, with an average reduction of 4.94 m throughout the habitat zone, directly contributing to an increase in salinity intrusion.
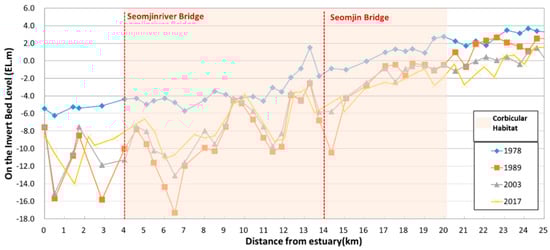
Figure 3.
Riverbed elevation level (EL. m) changes in corbicula habitat in the Seomjin River over a 40-year period (1978–2017).
Although sand mining has been discontinued since 1999, the indiscriminate use over approximately past 30 years has led to ongoing degradation of the riverbed, which has yet to be restored. Therefore, this study aimed to elucidate the relationship between riverbed degradation and salinity intrusion by analyzing pre- and post-sand mining riverbed profiles to assess salt intrusion distances.
2.3.2. Measured Hydrological Data for Simulation of EFDC Model
This section focuses on the measured data required for calibrating the EFDC model, as shown in Figure 4. The goal of this study was to measure the salinity in the Seomjin River estuary and explore its correlation with factors such as river discharge, riverbed change, and tide level. Fixed salinity gauges were installed at two locations (Seomjin Bridge and Seomjin River Bridge) to construct a time-series dataset of salinity (Figure 1). Fixed salinity gauges, operational since 15 February 2020, were installed at three intervals (upper, middle, and bottom) at each location on the riverbed to continuously monitor salinity. The salinity data utilized the lower-layer (bottom) data from the Seomjin River Bridge and Seomjin River Bridge, considering the density current measurements. The salinity range at Seomjin Bridge was 0.0 to 23.8 psu, with an average of 3.3 psu. Closer to the estuary, the Seomjin River Bridge exhibited a salinity range of 0.0 to 29.7 psu, averaging 14.3 psu. Typically, the average salinity of seawater is defined as more than 30 psu [23]. Thus, during neap tides, the Seomjin River Bridge experiences river water transforming into seawater, maintaining a high salinity, influenced by tide variations from EL.m −2.36 to EL.m 2.0 at the Gwangyang station. The stream flow in Guryegun (Songjeong-ri) varies and increases with precipitation. In the absence of rainfall, the flow rate was maintained between 17 and 20 m3/s, including an artificial dam supply (Figure 4).
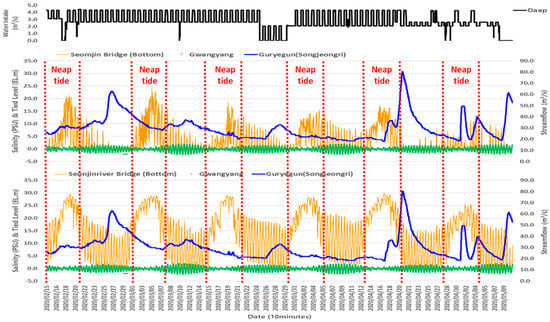
Figure 4.
Graphs representing the measured hydrological data; (Top) Observed salinity graph at Seomjin Bridge and (Bottom) Seomjin River Bridge.
2.4. Model Application for Salinity Simulation
This study focused on the modeling and simulation of the Seomjin River estuary, incorporating downstream rivers and adjacent estuarine regions. To accurately represent the downstream flow dynamics of the Seomjin River, the Guryegun (Songjeong-ri) and Hadonggun (Eupnaeri) streamflow observation stations were designated as upstream boundary conditions. Downstream boundary conditions were established by including tide-level observation stations located south and east of Gwangyang Bay, extending from Yeosu to Samcheonpo (Figure 5a). The modeling domain included facilities related to river flow, with an intake facility extracting a constant daily flow from the river. The water temperature of the river and meteorological data were recorded in real time at the Hadonggun observation stations (Figure 1).
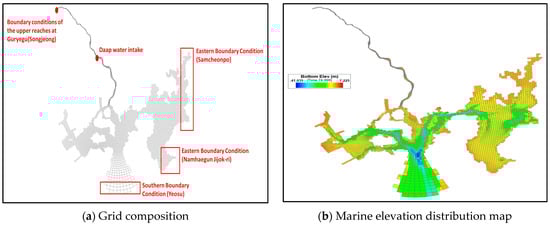
Figure 5.
Environmental fluid dynamics code (EFDC) model setup for this study; (a) the grids used to determine marine and river flows, (b) the bottom elevation range of the study area.
Topographic and bathymetric data for the Seomjin River were obtained from the Seomjin River Basic Plan, 2021 [16] and included approximately 41 km of river from the Seomjin River Estuary to Guryegun (Songjeong-ri). Marine data were extracted from the numerical bathymetric data of the National Maritime Institute (https://www.kmi.re.kr accessed on 1 Feburary 2020) and adjusted based on mean sea level (MSL) standards (Figure 5a). In addition, this study used input data for the model that utilized optical satellite images and Synthetic Aperture Radar (SAR) satellite data, obtained through marine research, to create a digital elevation model (DEM) and bathymetric model from the Korea Institute of Ocean Science and Technology (KIOST). A curvilinear grid was implemented to construct the grid, allowing for appropriate reflection of the river and sea flows. The grid consisted of 8088 cells with 20 vertical layers. River grids were set with a width of seven cells and variable lengths between 50 to 100 m, whereas marine grids were approximately 200 m (Figure 5a). River and marine elevations were interpolated using the Seomjin River Basic Plan, 2021, and numerical bathymetric data (Figure 5b). The marine elevation was converted from digital low (DL) to elevation low (EL). The bottom elevation ranged from −41.035 to 7.225 m, showing an increasing trend upstream. River and marine depths ranged from 0.05 to 41.908 m (Figure 5b).
To set the initial hydrological input conditions, water level and discharge information from the Water Resources Management Integrated Information System in Guryegun (Songjeong-ri) and Gwangyangsi (Namdo Bridge) were analyzed and used as input data. Additionally, hourly abstraction quantity data from the Daap Water Intake Facility were incorporated. Water temperature data were obtained from real-time water temperature measurements in Guryegun and the water temperature observed at the Gwangyang monitoring station (Figure 1).
2.5. Salinity Stratification Phenomenon
Estuaries form unique environments and maintain equilibrium states based on the long-term and periodic mixing of two water bodies with distinct physical and chemical properties. Therefore, in estuarine research, the behavior of saltwater intrusion varies according to changes in the influences of river discharge, tide movements, and their dynamic equilibrium. Tides driven by celestial forces occur approximately every 12.3 h (semidiurnal). Tides are a major source of saltwater intrusion and a mixed energy supply for estuaries, influencing salinity stratification. Neap and spring tides have different effects on salinity, causing variations in stratification characteristics. Stratification is prominent when there is minimal turbulence within the estuary and mixing by tide advection is weak. In such cases, a distinct two-layer flow forms between freshwater and seawater, creating a salt wedge where denser seawater intrudes into the estuary in a wedge shape. When turbulence causes mixing between freshwater and seawater, the density lines tilt, resulting in partially mixed conditions. In cases of strong turbulence and significant mixing, intense vertical mixing occurs, creating a well-mixed estuary with almost no difference in depth density [24].
3. Results
3.1. Model Calibration and Validation
Model calibration and validation processes are essential for assessing the suitability of numerical models. In this study, for the model calibration and validation, river water levels observed at the Hadong water observation station and the Gwangyang tide observation station and salinity measurement data obtained through salinity sensors at locations relevant to corbicula habitat, specifically, the Seomjin Bridge and Seomjin River Bridge, were utilized.
In hydrology, the Nash–Sutcliffe efficiency (NSE) is a widely used metric for assessing the performance of hydrological models. It quantifies the accuracy of a model by comparing its simulated values to the observed values, with a range of −∞ to 1. A value closer to 1 indicates a better match between model predictions and actual observations [25]. The model calibration utilized time-series data from 10 March 2020 to 10 April 2020 (one month). The model performance, evaluated using various indices, was deemed acceptable. Notably, the Nash–Sutcliffe efficiency (NSE) for tide levels and water levels showed values of 0.98 and 0.95, respectively. Salinity was corrected using observed data from the Seomjin River Bridge and Seomjin Bridge for the same period, and the NSE values were 0.75 and 0.46, respectively, in the model results, indicating a satisfactory level of model calibration (Figure 6). Model validation utilized time-series data from 10 April 2020 to 10 May 2020 (one month), with tide levels verified using data from the Gwangyang tide station and water levels verified using data from the Guryegun (Songjeong-ri) water level observation station. The validation results for the tide and water levels are shown in Figure 6. The NSE values of 0.98 and 0.95 for the tide and water level data, respectively, indicate that the model was successfully validated.
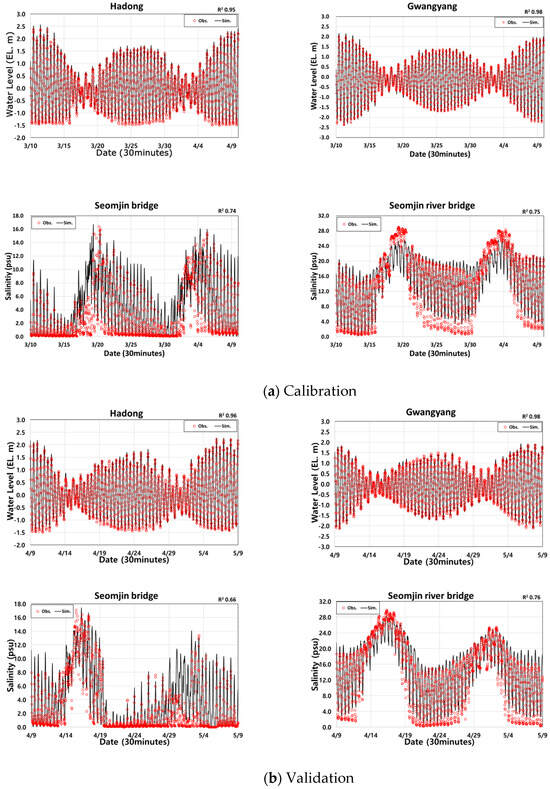
Figure 6.
Comparison graphs of results between (a) observed (calibration) and (b) simulated (validation) results: Hadong river water level, Gwangyang River water level, Seomjin Bridge salinity, and Seomjin River Bridge salinity.
The salinity measurements had NSE values of 0.46 (Seomjin Bridge) and 0.75 (Seomjin River Bridge), indicating good and satisfactory performance, respectively. The observed errors in the salinity data were mitigated by initially calibrating the sensors during installation using standard reagents of 5, 10, 15, 20, 25, 30, and 40 psu for sensor settings. Ensuring reliability in salinity observations below 5 psu was challenging, particularly from Seomjin Bridge, where a significant number of days exhibited salinity below 5 psu, resulting in increased errors. Therefore, for observations with salinity above 10 psu, the NSE value of 0.85 was high, indicating that the errors were mitigated, especially considering that this study used salinity values of 10 psu or higher in the model results.
3.2. Impact Analysis Using Daap Water Intake with River Flow
To simulate the salinity dynamics and intrusion distance due to the Daap Water Intake facility, the cross-sectional data measured in 2017, as part of the basic river plan, were fixed in the model. The flow input conditions were set at the Guryegun (Songjeong-ri) location, applying the range of maximum and minimum flows (5 to 35 m3/s) from March to May averaged over the past 10 years. The actual withdrawal rates measured from past to present for each flow range (2.523, 3.125, 3.912, and 4.630 m3/s) were simulated separately using the EFDC model. In particular, the salinity dynamics based on tide levels during spring and neap tides were distinctly different. Therefore, the simulation results were analyzed separately for spring and neap tides.
For the Guryegun (Songjeong-ri) flow rates of 5 to 35 m3/s during the spring tide, the salinity differences at the Seomjin Bridge, Seomjin River Bridge, and Hwamok points were 15.5, 11.8, and 8.4 psu, respectively, at a water intake of 2.523 m3/s. For the Daap water intake of 3.125 m3/s, these values (the salinity differences) were 15.8, 11.8, and 8.4 psu, and for the Daap water intake of 3.912 m3/s, they were 16.3, 12.2, and 8.6 psu. Finally, at the Daap water intake of 4.630 m3/s, the values were 16.7, 12.4, and 8.7 psu. As the Daap water intake rates increased, the salinity at each location increased, and higher river flow rates during spring tides resulted in decreased salinity differences. During neap tides, at Guryegun (Songjeong-ri) flow rates of 5 and 35 m3/s, the salinity differences at the Seomjin Bridge, Seomjin River Bridge, and Hwamok points were 6.8, 2.7, and 2.2 psu, respectively, at the Daap water intake of 2.523 m3/s. For the Daap water intake of 3.125 m3/s, these values were 6.8, 2.7, and 2.1 psu, and for the Daap water intake of 3.912 m3/s, they were 6.6, 2.5, and 2.1 psu. Finally, at the Daap water intake of 4.630 m3/s, the values were 6.5, 2.5, and 2.1 psu. Similar to the spring tide conditions, increasing Daap water intake rates led to higher salinity at each location (Figure 7).
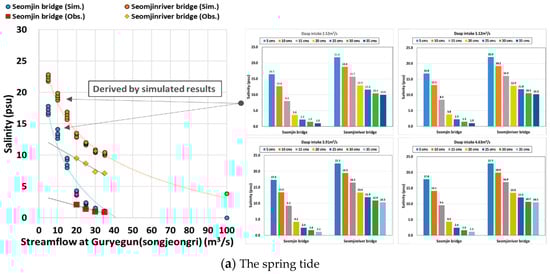
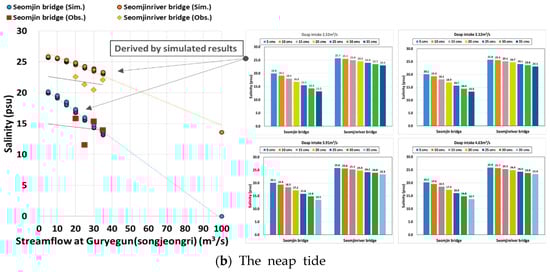
Figure 7.
Estimation of relationship between reduction of salinity using Daap water intake and with streamflow at Guryegun (Songjeong-ri) station during (a) spring and (b) neap tides.
However, during the low-flow season from the November to March season, despite an increase in river discharge up to 35 m³/s, the salinity did not significantly decrease due to the phenomenon of saltwater retention even during neap tides. In contrast, during the high-flow season from June to September, the substantial tide range caused the pronounced inflow and outflow of seawater, resulting in a lack of salinity stratification. This allowed the river discharge to significantly reduce salinity.
3.3. Estimation of Salinity Intrusion Distance by Downstream and River Bed Variation
Riverbed changes were applied to river sections in 1978, 1989, 2003, and 2017. An analysis of the intrusion distances was conducted by applying river flows to Q95 (95th high flow), Q185 (185th high flow), Q275 (275th high flow), and Q355 (355th high flow) by analyzing the flow duration. For the analysis of salinity and penetration distance variations in the lower reaches according to flow changes, cross-sectional profiles of the EFDC model were applied based on measurements taken in 1978, 1989, 2003, and 2017. The river discharge was fixed at the 1978 flow rate (Q355) of 12.2 m³/s to conduct a one-month simulation incorporating both spring and neap tides twice each. The results indicate that the penetration distance of the optimal salinity for the clam habitat, ranging from 15 to 20 psu, increased from 12.5 km in 1978 to 20.9 km in 2017 (Figure 8a). This suggests that the suitable salinity range for clam habitats, primarily in the estuarine segment 10 to 15 km downstream of the Seomjin River estuary, has shifted upstream, causing potential harm owing to the intrusion of high-salinity water into the existing corbicula habitat and the displacement of corbicula populations.
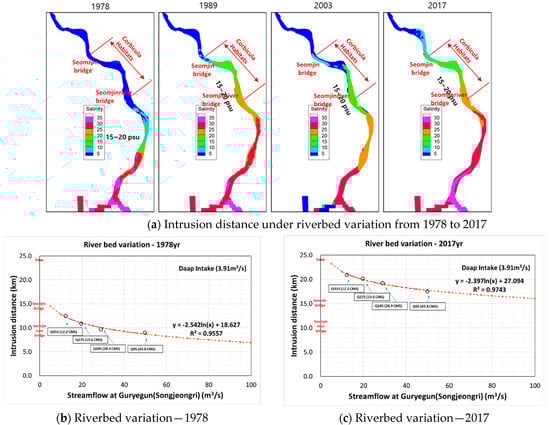
Figure 8.
Final EFDC results of intrusion distance by riverbed variation with streamflow and water intake; (a) spatial distribution of salinity, (b,c) modelled relationship between intrusion distance and streamflow.
Finally, by applying cross-sectional profiles from 1978 and 2017, along with an average intake rate of 3.91 m³/s from the Daap Water Intake facility, this study estimated the correlation between Guryegun (Songjeong-ri) river discharge and salinity intrusion distance (Figure 8b). As depicted in Figure 8b, the salinity intrusion distance in 2017 is deemed impractical to maintain the optimal salinity range (15 to 20 psu) during both spring and neap tides, even with a river discharge of 100 m³/s in Gurye County (Songjeong-ri). Therefore, it is anticipated that structural management measures, rather than solely securing river flow, are necessary for the rehabilitation and preservation of suitable clam habitats.
4. Discussion
In this study, the effects of salinity intrusion on the habitat of corbicula were investigated by employing EFDC modeling with topographic data (river cross–sections) and hydrological changes (flow rates and intake rates). Additionally, to observe the salinity in the corbicular habitat, two salinity measurement facilities were installed and operated, and the collected data were utilized to optimize the EFDC salinity movement analysis model and ensure its reliability. The results indicated that the increase in salinity owing to a decrease in flow rates corresponding to the intake quantity was negligible. However, the salinity varied based on the flow rate in Guryegun (Songjeong-ri). In particular, to maintain an optimal salinity range of 15 to 20 psu for corbicula at the Seomjin River Bridge during neap tides, a constant flow rate ranging from 20 to 40 m3/s was required. This was deemed an extremely challenging requirement even with the inclusion of artificial dam supply quantities. Furthermore, it was found that, during neap tides, maintaining the optimal salinity would be impractical, even with a high flow rate.
The analysis attributed this difficulty to the occurrence of saltwater stratification due to salinity stagnation, which is considered the primary cause. This salinity stagnation phenomenon can adversely affect corbicular habitats. In the Seomjin River estuary, the salinity in the lower layer was notably higher owing to saltwater stratification, with a significant difference between the upper and lower layer salinity, particularly downstream. Additionally, during neap tides, a substantial difference in salinity between the upper and lower layers was observed, indicating a pronounced salinity stratification phenomenon during neap tides compared with spring tides (Figure 9). This result is the average salinity profile with each tide for total periods from 10 March 2020 to 10 May 2020 (two months). In addition, for that period, the spring and neap tides happen two times, respectively. Figure 9 does not mean water level. During the spring tide, the water level ranges from a maximum of 2.19 EL.m to a minimum of −1.49 EL.m, while during the neap tide, it ranges from a maximum of 1.82 EL.m to a minimum of −1.42 EL.m. Although the water levels differ between the spring and neap tides, encompassing the transitional periods (from spring to neap tide), the water level remains constant up to the tide flat.
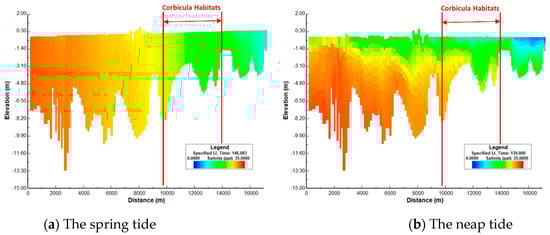
Figure 9.
Vertical spatial distribution of salinity in the study area for describing the salinity stratification phenomenon.
As seen from Figure 9, during neap tide, distinct phenomena of high salinity and stratification are clearly observable. According to the spatial distribution of the tidal mean salinity, during neap tide, the salinity difference between the surface and bottom layer is significant, and the distribution of salinity is characterized by a highly stratified estuary. During mean and spring tide, there are vertical and longitudinal gradients of the salinity, but the vertical salinity gradient is much smaller than that in the neap tide; the distribution of salinity is characterized as a partially mixed estuary. The stratification and mixing of the water column are important physical processes in estuaries, which have important effects on the exchange and transport of various substances, e.g., salt, sediments, nutrients, pollutant, and benthos organisms, such as polychaetes, clams, and crabs [26]. Numerous studies have reported the influences of sea-level rise on estuarine salinity, stratification, exchange flow, residence time, material transport processes, and other relevant processes in estuaries [27,28,29]. Globally, sea-level rise due to climate change is a grave concern, and the increase in saltwater intrusion and salinity stratification in estuaries due to rising sea levels is rapidly escalating worldwide. When quantitatively analyzing global sea-level rise, the global mean sea level under Representative Concentration Pathway (RCP) 8.5 is projected to rise by 0.45 to 0.82 m from 1986−2005 to 2081−2100, while 0.32−0.70 m of the global mean sea-level rise is projected by 2100 under RCP 4.5 [30]. For the Korean peninsula, a sea-level rise of 0.75 m under RCP 4.5 is estimated at the coast line in the East Sea by 2100, followed by the South Sea (0.58 m) and the West Sea 0.57 m [31]. Those under RCP 8.5 are 1.08 m for the East Sea, 0.72 m for the West Sea, and 0.70 m for the South Sea [32]. Therefore, in addition to local issues (such as marine activities, river dredging, landfilling, etc.) in estuaries, preparations for regional water resource development and management plans must also consider mitigation strategies for the global issue of sea-level rise.
The lack of long-term observed salinity data in this study posed limitations in modeling the intricate salinity dynamics in the actual tide creek. Therefore, for future research, securing long-term salinity data is essential to enhance the applicability of the model and further investigate the direct relationship between salinity and oyster growth in the observed tide creek. In addition, Perales-Valdivia et al. [33] and Kang et al. [34] studied salinity intrusion and saltwater stratification. It was especially suggested that the alignment of wind direction with tide direction could lead to increased salinity intrusion and the occurrence of stratification with high salinity during neap tides in Maryland Coastal Bays [34]. Compared to this, since the study area of this study is not prone to typhoons or significantly influenced by wind during normal conditions, the impact of wind was not considered in this study. However, a future study will be necessary to evaluate its effects.
As mentioned in the introduction, the results of the Caloosahatchee River study in Florida revealed several key findings. The implementation of locks to regulate the flow rate and salinity levels is indeed a fascinating approach in water management. It is essential to analyze such studies comprehensively, as they offer valuable insights into ecosystem management and mitigation strategies for ecological challenges. For future study, a further exploration of the methodologies and findings of this study could potentially provide valuable knowledge applicable to other regions facing similar issues.
5. Conclusions
In conclusion, based on the analysis of the characteristics of salinity intrusion in the Seomjin River, we determined that salinity is predominantly influenced by neap tides. Attempts to push seawater back into the sea by ensuring river discharge and the proper operation of water intake facilities to restore the previously elevated salinity intrusion distance are considered extremely challenging. Structural measures, such as riverbed restoration, underwater barrier installation, artificial structures, and flushing effects, which enhance resistance to seawater intrusion, are deemed necessary. Future research should develop scenarios for reducing salinity using artificial structures, quantitatively present reduction efficiency, and provide realistic measures tailored to the specific needs of the region.
Author Contributions
Funding acquisition, supervision, J.P.; methodology, data curation, original draft, G.L.; conceptualization, methodology, data curation, original draft, writing, revising—review and editing, supervision, C.J.; methodology, data curation. All authors have read and agreed to the published version of the manuscript.
Funding
This paper is based on the results of the research work “A Study on the Habitat Environment of Corbicula in the Lower Seomjin River through Empirical Investigation (2023-071)”, conducted by the Korea Environment Institute (KEI) upon the request of the Korea Ministry of Environment.
Data Availability Statement
The data presented in this study are available on request from the corresponding author. The data are not publicly available due to our laboratory’s policy and confidentiality agreements.
Conflicts of Interest
The authors declare no conflicts of interest.
References
- Baek, S.H.; Seo, J.Y.; Choi, J.W. Growth characteristics and distribution pattern of a brackish water clam, Corbicula japonica along an estuarine salinity gradient in Seomjin River. J. Korea Acad. Ind. Coop. Soc. 2015, 16, 6852–6859. (In Korean) [Google Scholar] [CrossRef]
- Lee, J.J.; Kim, Y.J. Analysis of Flow Duration Characteristics due to Environmental Change in Korea River Basin. J. Korean Soc. Hazard. Mitig. 2011, 11, 67–75. (In Korean) [Google Scholar] [CrossRef]
- Noh, J.W.; Lee, J.Y.; Shin, J.K. Analysis of Saltwater Intrusion by Flushing Discharge in the Seomjin River Estuary. J. Environ. Impact Assess. 2011, 20, 325–335. (In Korean) [Google Scholar] [CrossRef]
- Gaiolini, M.; Colombani, N.; Postacchini, M. Seawater intrusion assessment along the Volturno River (Italy) via numerical modeling and spectral analysis. J. Hydrol. 2023, 626 Pt B, 130289. [Google Scholar] [CrossRef]
- Moreira, M.H.; They, N.H.; Rodrigues, L.R.; Alvarenga-Lucius, L.; Pita-Barbosa, A. Salty freshwater macrophytes: The effects of salinization in freshwaters upon non-halophyte aquatic plants. Sci. Total Environ. 2023, 857 Pt 3, 159608. [Google Scholar] [CrossRef] [PubMed]
- Lee, J.B.; Shin, Y.J.; Lee, J.H.; Choi, Y.M.; Lee, D.W.; Cha, H.K. Estimation of potential fishery yield for Corbicula japonica in the Seomjin River, Korea. Korean J. Malacol. 2012, 28, 91–99. (In Korean) [Google Scholar] [CrossRef]
- USGS. Effects of Variations in Flow Characteristics through W.P. Franklin Lock and Dam on Downstream Water Quality in the Caloosahatchee River Estuary and in McIntyre Creek in the J.N. “Ding” Darling National Wildlife Refuge, Southern Florida, 2010–2013, Scientific Investigations Report 2016-5033; USGS: Reston, VA, USA, 2016.
- Feng, L.U.O.; Ruijie, L.I. 3D Water environment simulation for North Jiangsu offshore sea based on EFDC. J. Water Resour. Prot. 2009, 1, 41–47. Available online: http://www.scirp.org/journal/PaperInformation.aspx?PaperID=419 (accessed on 29 March 2024). [CrossRef]
- Xia, M.; Craig, P.M.; Wallen, C.M.; Stoddard, A.; Poulsen, J.M.; Peng, M.; Schaeffer, B.; Liu, Z. Numerical Simulation of Salinity and Dissolved Oxygen in Perdido Bay and Adjacent Coastal Ocean. J. Coast. Res. 2011, 27, 73–86. [Google Scholar] [CrossRef]
- Son, Y.G. A Numerical Simulation for Salinity Intrusion in Nakdong River Estuary Using EFDC. Ph.D. Dissertation, Kongju University Graduate School, Kongju, Republic of Korea, 2009. (In Korean). [Google Scholar]
- Han, S.D. Evaluation of mean tidal currents at Kwangyang and Chinju Bay, Connected into Noryang Channel. Theses Collect. 1995, 13, 161–170. [Google Scholar]
- Kwak, G.I. Temporal and Spatial Mixing Characteristics of SEOMJIN River Discharges Using a Three-Dimensional Numerical Model. Master’s Thesis, Chonnam National University, Kwangju, Republic of Korea, 2008. (In Korean). [Google Scholar]
- Kang, Y.S.; Chae, Y.K.; Lee, H.R. Variation of density stratification due to fresh water discharge in the Kwangyang Bay and Jinju Bay. J. Korean Soc. Coast. Ocean. Eng. 2011, 23, 126–137. (In Korean) [Google Scholar] [CrossRef]
- Jung, K.Y.; Ro, Y.J. Stratification and destratification processes in the Kangjin Bay, South Sea, Korea. J. Korean Soc. Oceanogr. 2010, 15, 97–109. [Google Scholar]
- Jung, K.Y.; Ro, Y.J.; Kim, B.J.; Park, K.S. Model trajectory simulation for the behavior of the Namgang Dam water in the Kangjin Bay, South Sea, Korea. J. Korean Soc. Coast. Ocean. Eng. 2012, 24, 97–106. (In Korean) [Google Scholar] [CrossRef][Green Version]
- Ministry of Land, Infrastructure and Transport. Seomjin River Basic Plan; Ministry of Land, Infrastructure and Transport: Sejong, Republic of Korea, 2021; (In Korean). Available online: https://www.molit.go.kr/english/intro.do (accessed on 29 March 2024).
- Ministry of Environment. Research on the Cause of Salt Damage in the Lower Seomjin River and Preparation of Countermeasures, Research Report; Ministry of Environment: Seoul, Republic of Korea, 2021. (In Korean)
- Seo, J.Y.; Kim, J.H.; Choi, J.W. A comparative study on the ecological characters of Corbicula japonica populations inhabiting at the subtidal estuary of the Seomjin River and the intertidal Eulsuk sand flat of the Nakdong River, Korea. Korean J. Malacol. 2018, 34, 135–146. (In Korean) [Google Scholar] [CrossRef]
- Seong, C.H. Assessing Temporal and Spatial Salinity Variations in Estuary Reservoir Using EFDC. J. Korean Soc. Agric. Eng. 2014, 56, 139–147. (In Korean) [Google Scholar]
- Kim, S.J.; Seo, D.I.; Ahn, K.H. Estimation of Proper EFDC Parameters to Improve the Reproductability of Thermal Stratification in Korea Reservoir. J. Korea Water Resour. Assoc. 2011, 44, 741–751. (In Korean) [Google Scholar] [CrossRef]
- Ministry of Land, Infrastructure and Transport. Seomjin River Basic Plan (Supplementation); Ministry of Land, Infrastructure and Transport: Sejong, Republic of Korea, 2009; (In Korean). Available online: https://www.molit.go.kr/english/USR/WPGE0201/m_28276/LST.jsp (accessed on 29 March 2024).
- Ceon, I.K.; Kim, M.H. The Prediction and Analysis of Bed Changes Characteristics in the Seomjin River Downstream. J. Korean Soc. Hazard. Mitig. 2009, 9, 115–121. (In Korean) [Google Scholar]
- Crone, T. The Basic Sediment Transport Equations Made Ridiculously Simple. In OCEAN/ESS 410 Marine Geology and Geophysics; 2004; Available online: https://scholar.google.com.hk/scholar?hl=zh-CN&as_sdt=0%2C5&q=The+Basic+Sediment+Transport+Equations+Made+Ridiculously+Simple&btnG= (accessed on 29 March 2024).
- Lee, M.O. The Behavior of Unsteady Saline Wedge. J. Korean Soc. Coast. Ocean. Eng. 1991, 3, 72–80. (In Korean) [Google Scholar]
- Moriasi, D.N.; Arnold, J.; Van Liew, M.; Bingner, R.; Harmel, R.D.; Veith, T.L. Model evaluation guidelines for systematic quantification of accuracy in watershed simulations. Trans. ASABE 2007, 50, 885–900. [Google Scholar] [CrossRef]
- Zhang, J.; Cheng, L.; Wang, Y.; Jiang, C. The impact of tidal straining and advection on the stratification in a partially mixed estuary. Water 2023, 15, 339. [Google Scholar] [CrossRef]
- Bhuiyan, M.J.A.N.; Dutta, D. Assessing impacts of sea level rise on river salinity in the Gorai river network, Bangladesh. Estuar. Coast. Shelf Sci. 2012, 96, 219–227. [Google Scholar] [CrossRef]
- Hong, B.; Shen, J. Responses of estuarine salinity and transport processes to potential future sea level rise in the Chesapeake Bay. Estuar. Coast. Shelf Sci. 2012, 104–105, 33–45. [Google Scholar] [CrossRef]
- Rice, K.C.; Hong, B.; Shen, J. Assessment of salinity intrusion in the James and Chickahominy Rivers as a result of simulated sea level rise in Chesapeake Bay, East Coast, USA. J. Environ. Manag. 2012, 111, 61–69. [Google Scholar] [CrossRef] [PubMed]
- Intergovernmental Panel on Climate Change (IPCC). 2013: Summary for Policymakers. In Climate Change 2013: The Physical Science Basis. Contribution of Working Group I to the Fifth Assessment Report of the Intergovernmental Panel on Climate Change; Stocker, T.F., Qin, D., Plattner, G.-K., Tignor, M., Allen, S.K., Boschung, J., Nauels, A., Xia, Y., Bex, V., Midgley, P.M., Eds.; Cambridge University Press: Cambridge, UK; New York, NY, USA, 2013. [Google Scholar]
- National Institute of Malaria Research (NIMR). Global Climate Change Report 2012; Publication number 11-1360395-000341-10; National Institute of Meteorological Research: Seogwipo, Korea, 2012. (In Korean)
- Chun, J.A.; Lim, C.; Kim, D.; Kim, J.S. Assessing Impacts of Climate Change and Sea-Level Rise on Seawater Intrusion in a Coastal Aquifer. Water 2018, 10, 357. [Google Scholar] [CrossRef]
- Perales-Valdivia, H.; Sanay-Gonzalez, R.; Valle-Levinson, A. Effects of tides, wind and river discharge on the salt intrusion in a microtidal tropical estuary. Reg. Stud. Mar. Sci. 2018, 24, 400–410. [Google Scholar] [CrossRef]
- Kang, X.; Xia, M.; Pitual, J.S.; Chigbu, P. Dynamics of water and salt exchage at Maryland Coastal Bays. Estuar. Coast. Shelf Sci. 2017, 189, 1–16. [Google Scholar] [CrossRef]


Disclaimer/Publisher’s Note: The statements, opinions and data contained in all publications are solely those of the individual author(s) and contributor(s) and not of MDPI and/or the editor(s). MDPI and/or the editor(s) disclaim responsibility for any injury to people or property resulting from any ideas, methods, instructions or products referred to in the content. |
© 2024 by the authors. Licensee MDPI, Basel, Switzerland. This article is an open access article distributed under the terms and conditions of the Creative Commons Attribution (CC BY) license (https://creativecommons.org/licenses/by/4.0/).