


Deep Learning Methods of Satellite Image Processing for Monitoring of Flood Dynamics in the Ganges Delta, Bangladesh


Abstract
1. Introduction
1.1. Background
1.2. Related Works
1.3. Gap and Motivation
1.4. Goals and Objectives
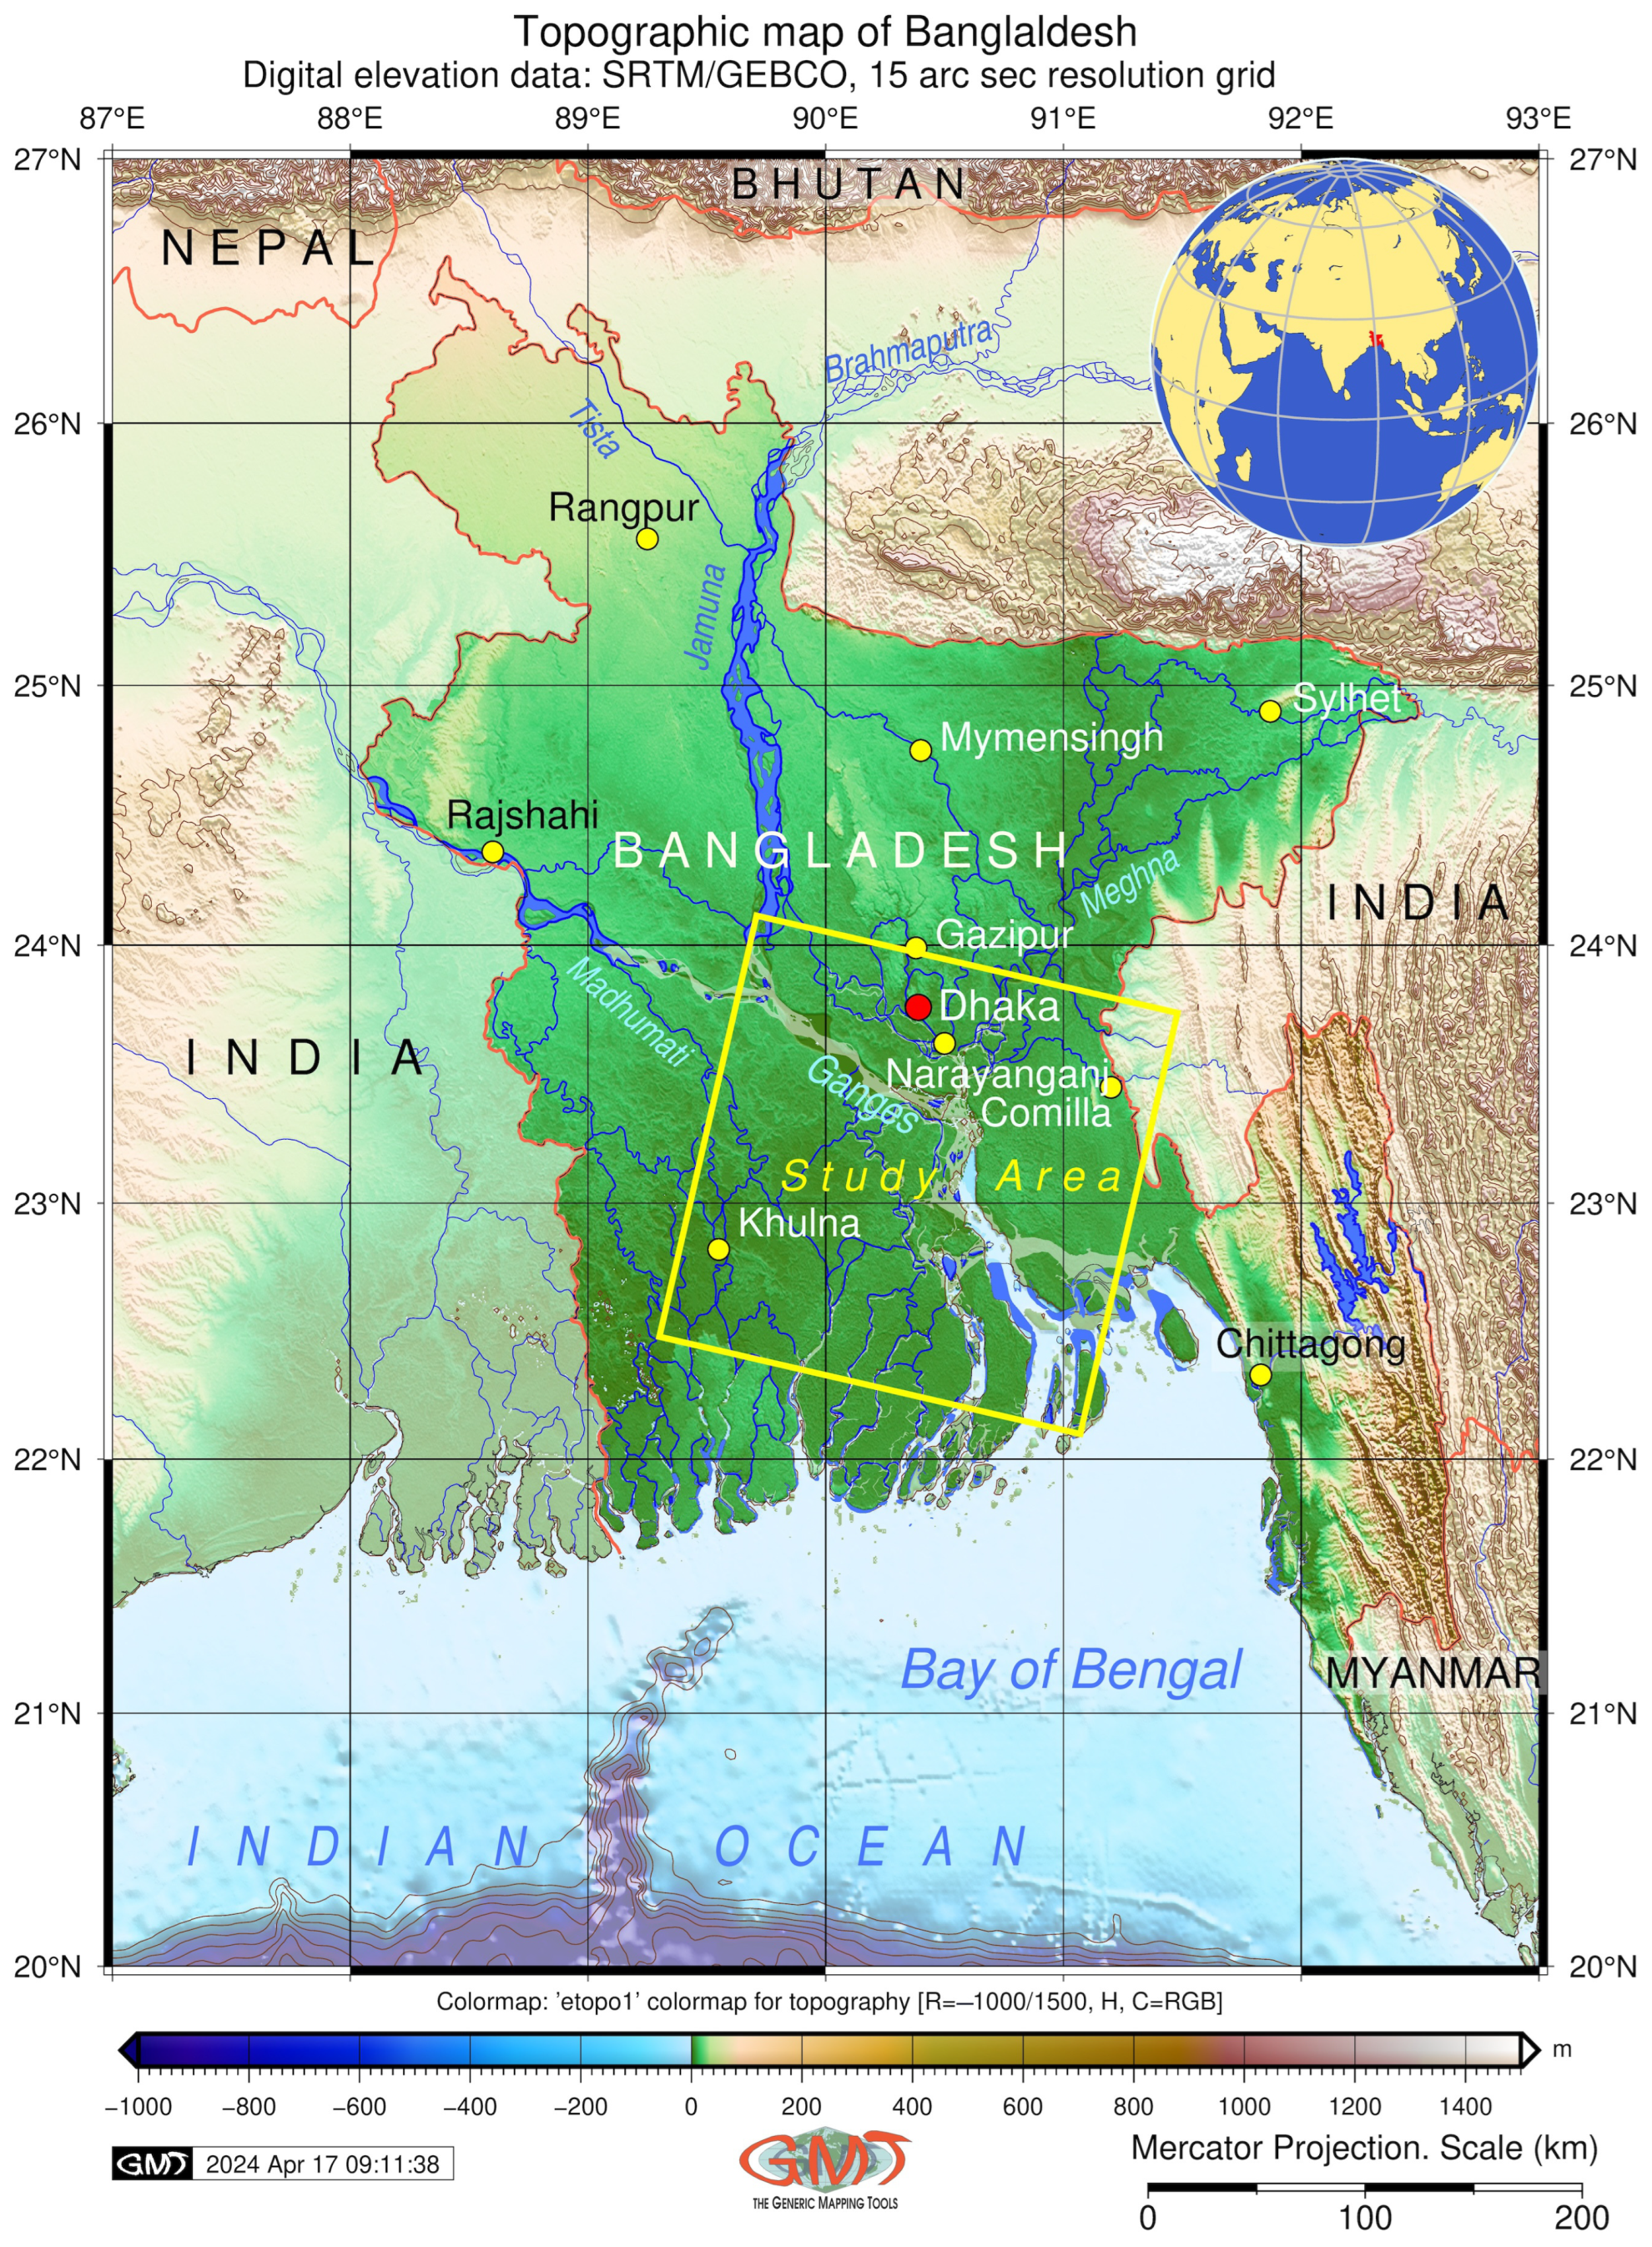
2. Study Area
2.1. Current Landscape
2.2. Problem Formulation
3. Materials and Methods
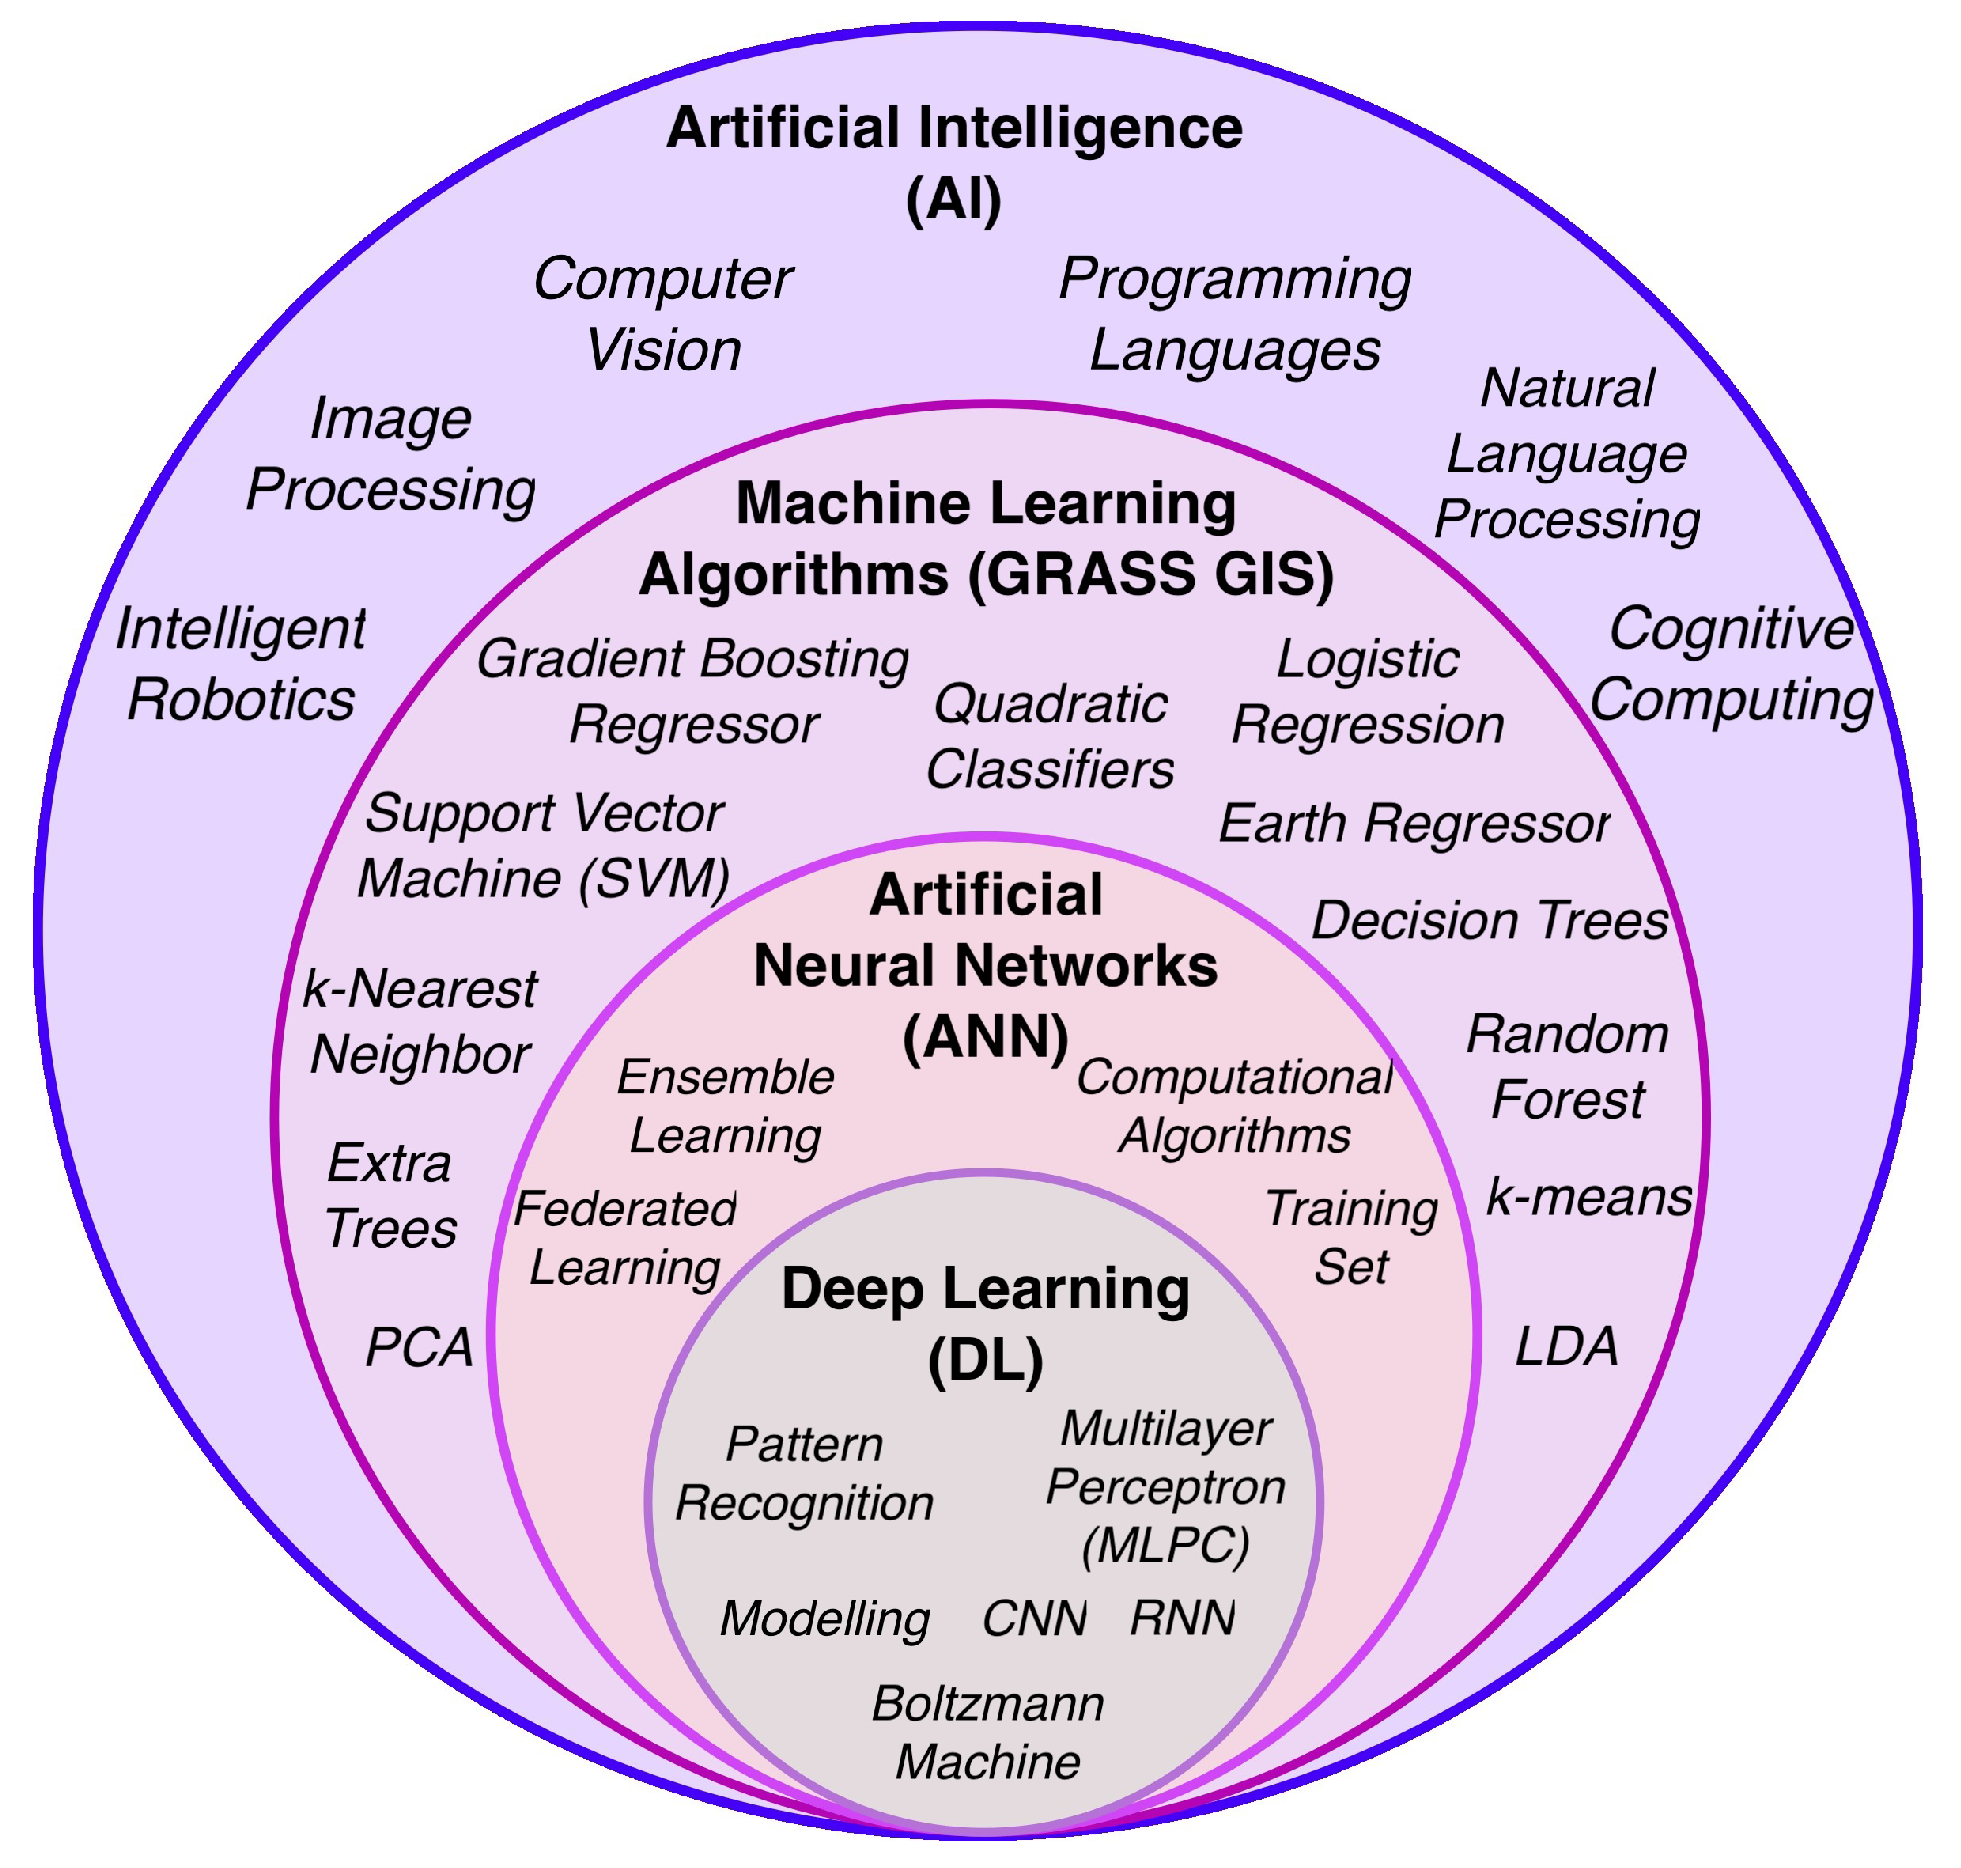
3.1. Deep Learning
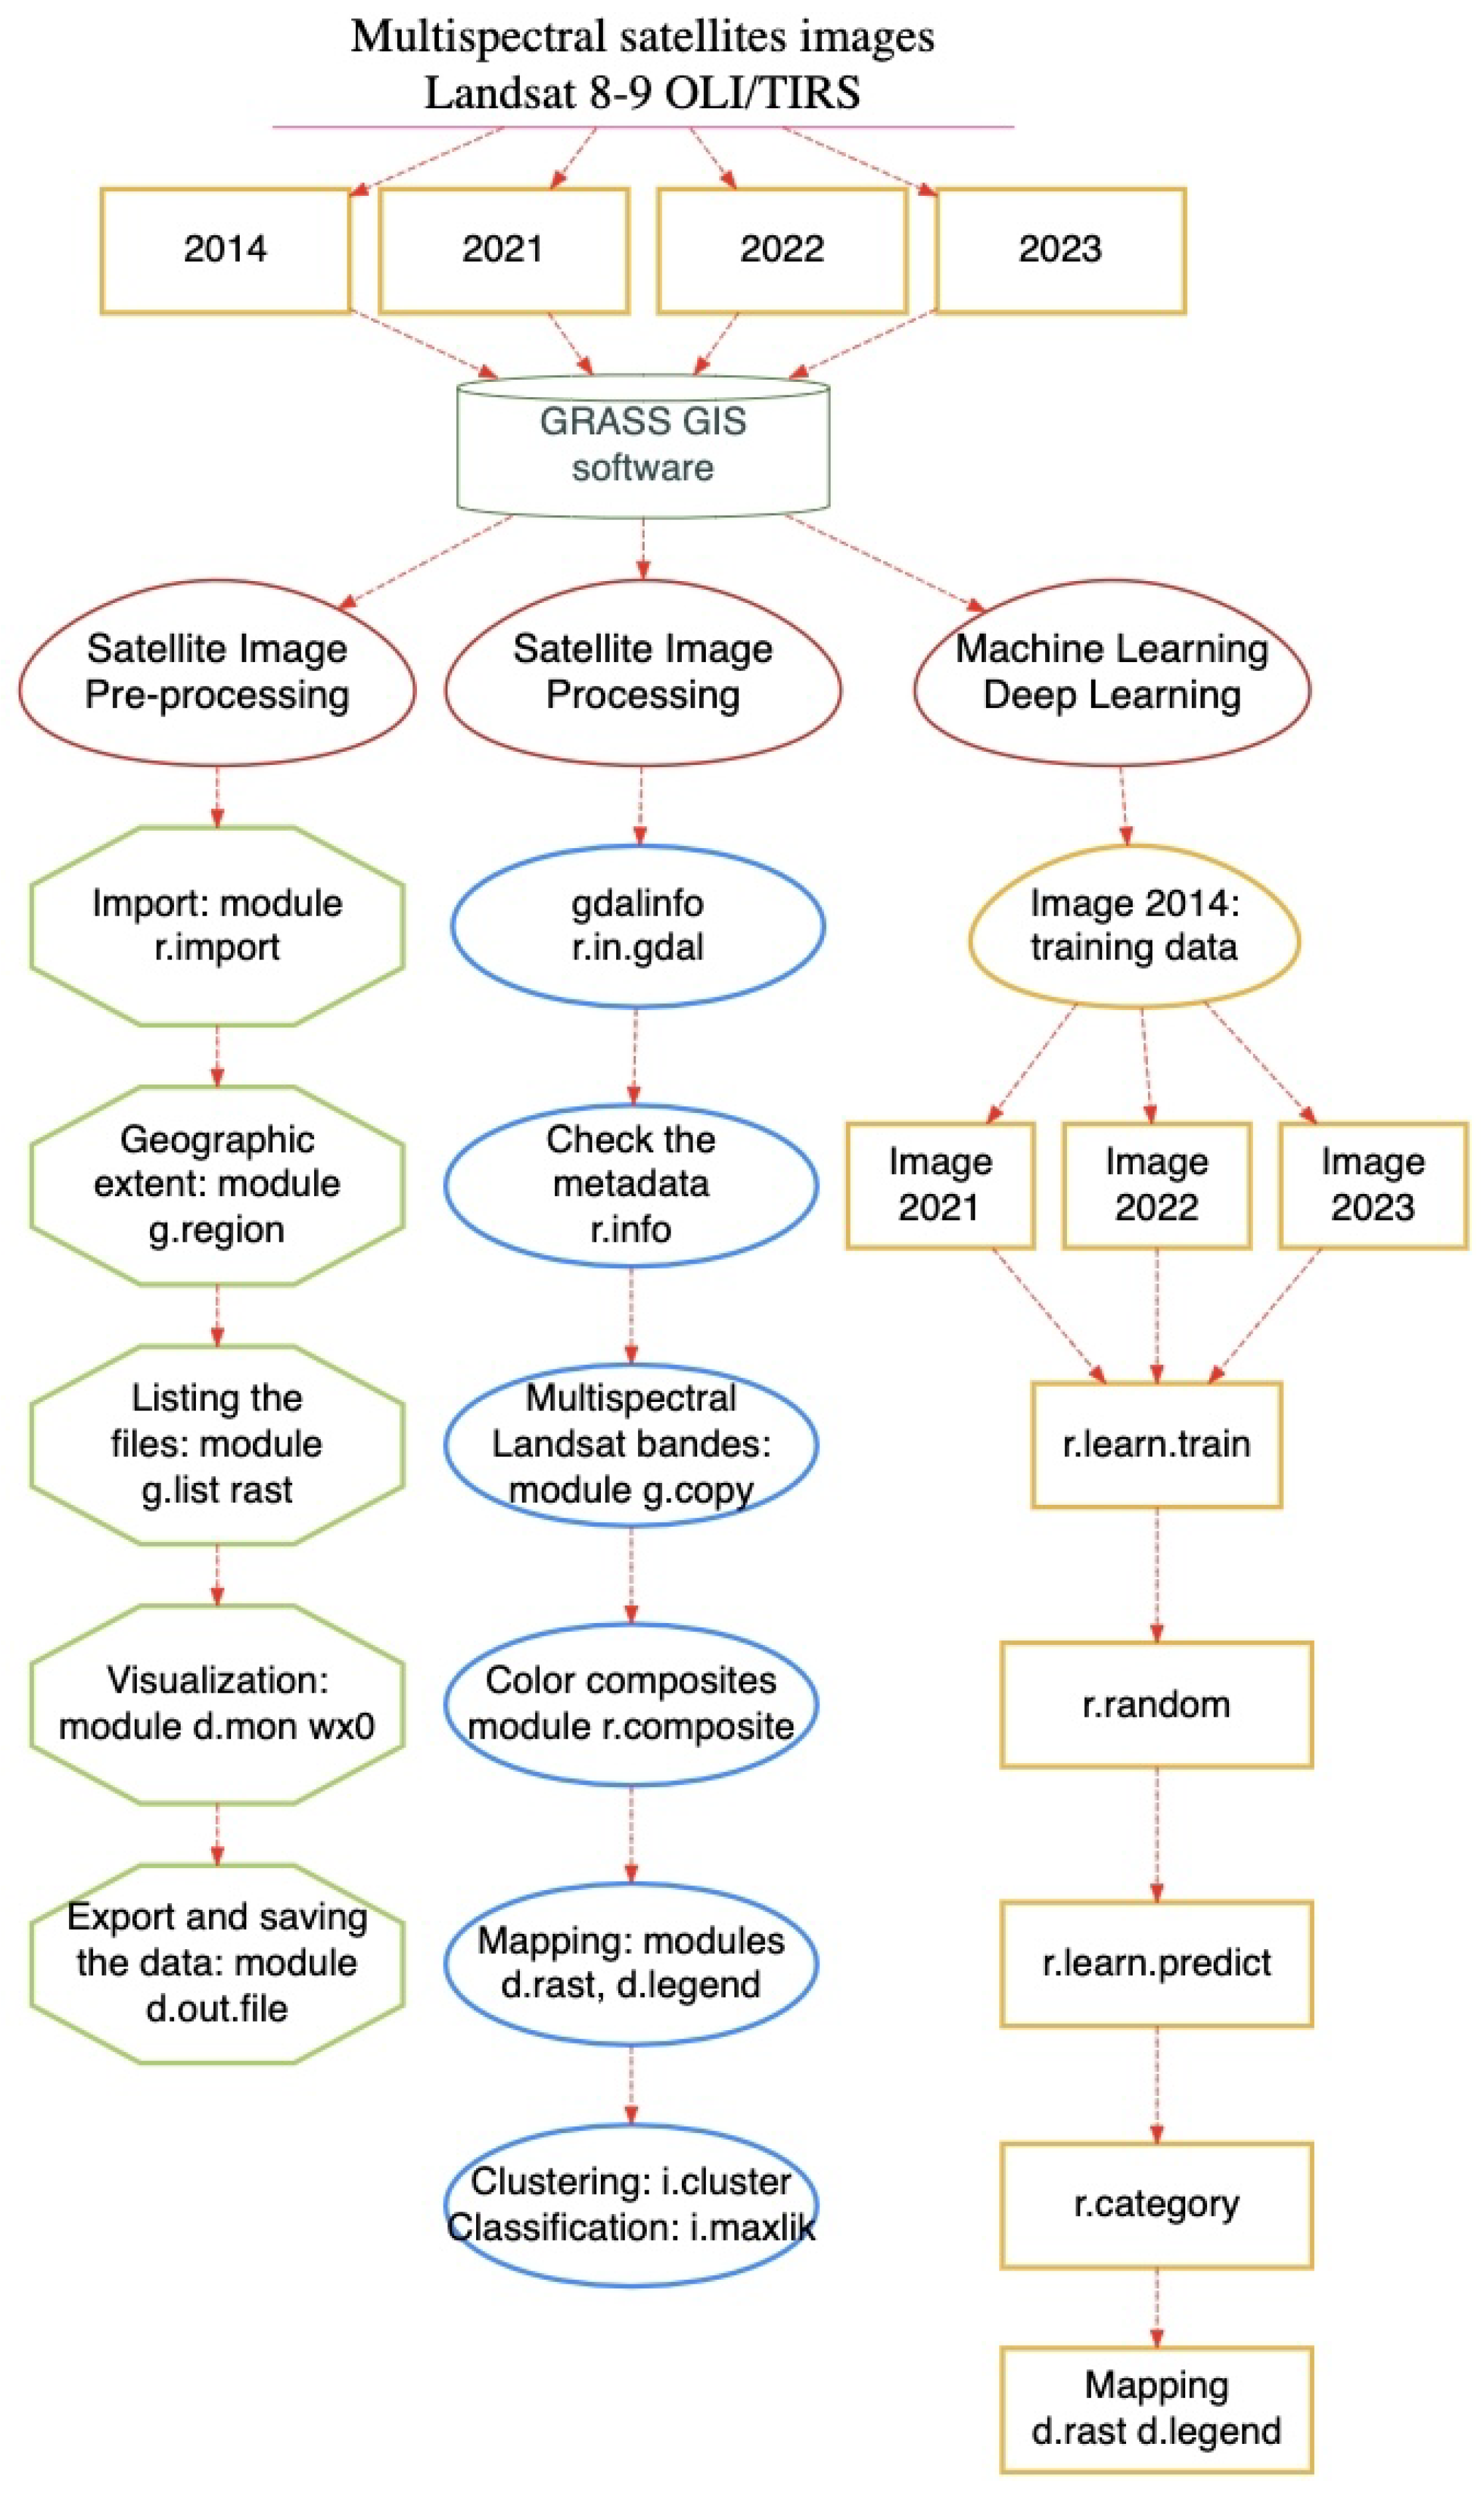
3.2. Workflow
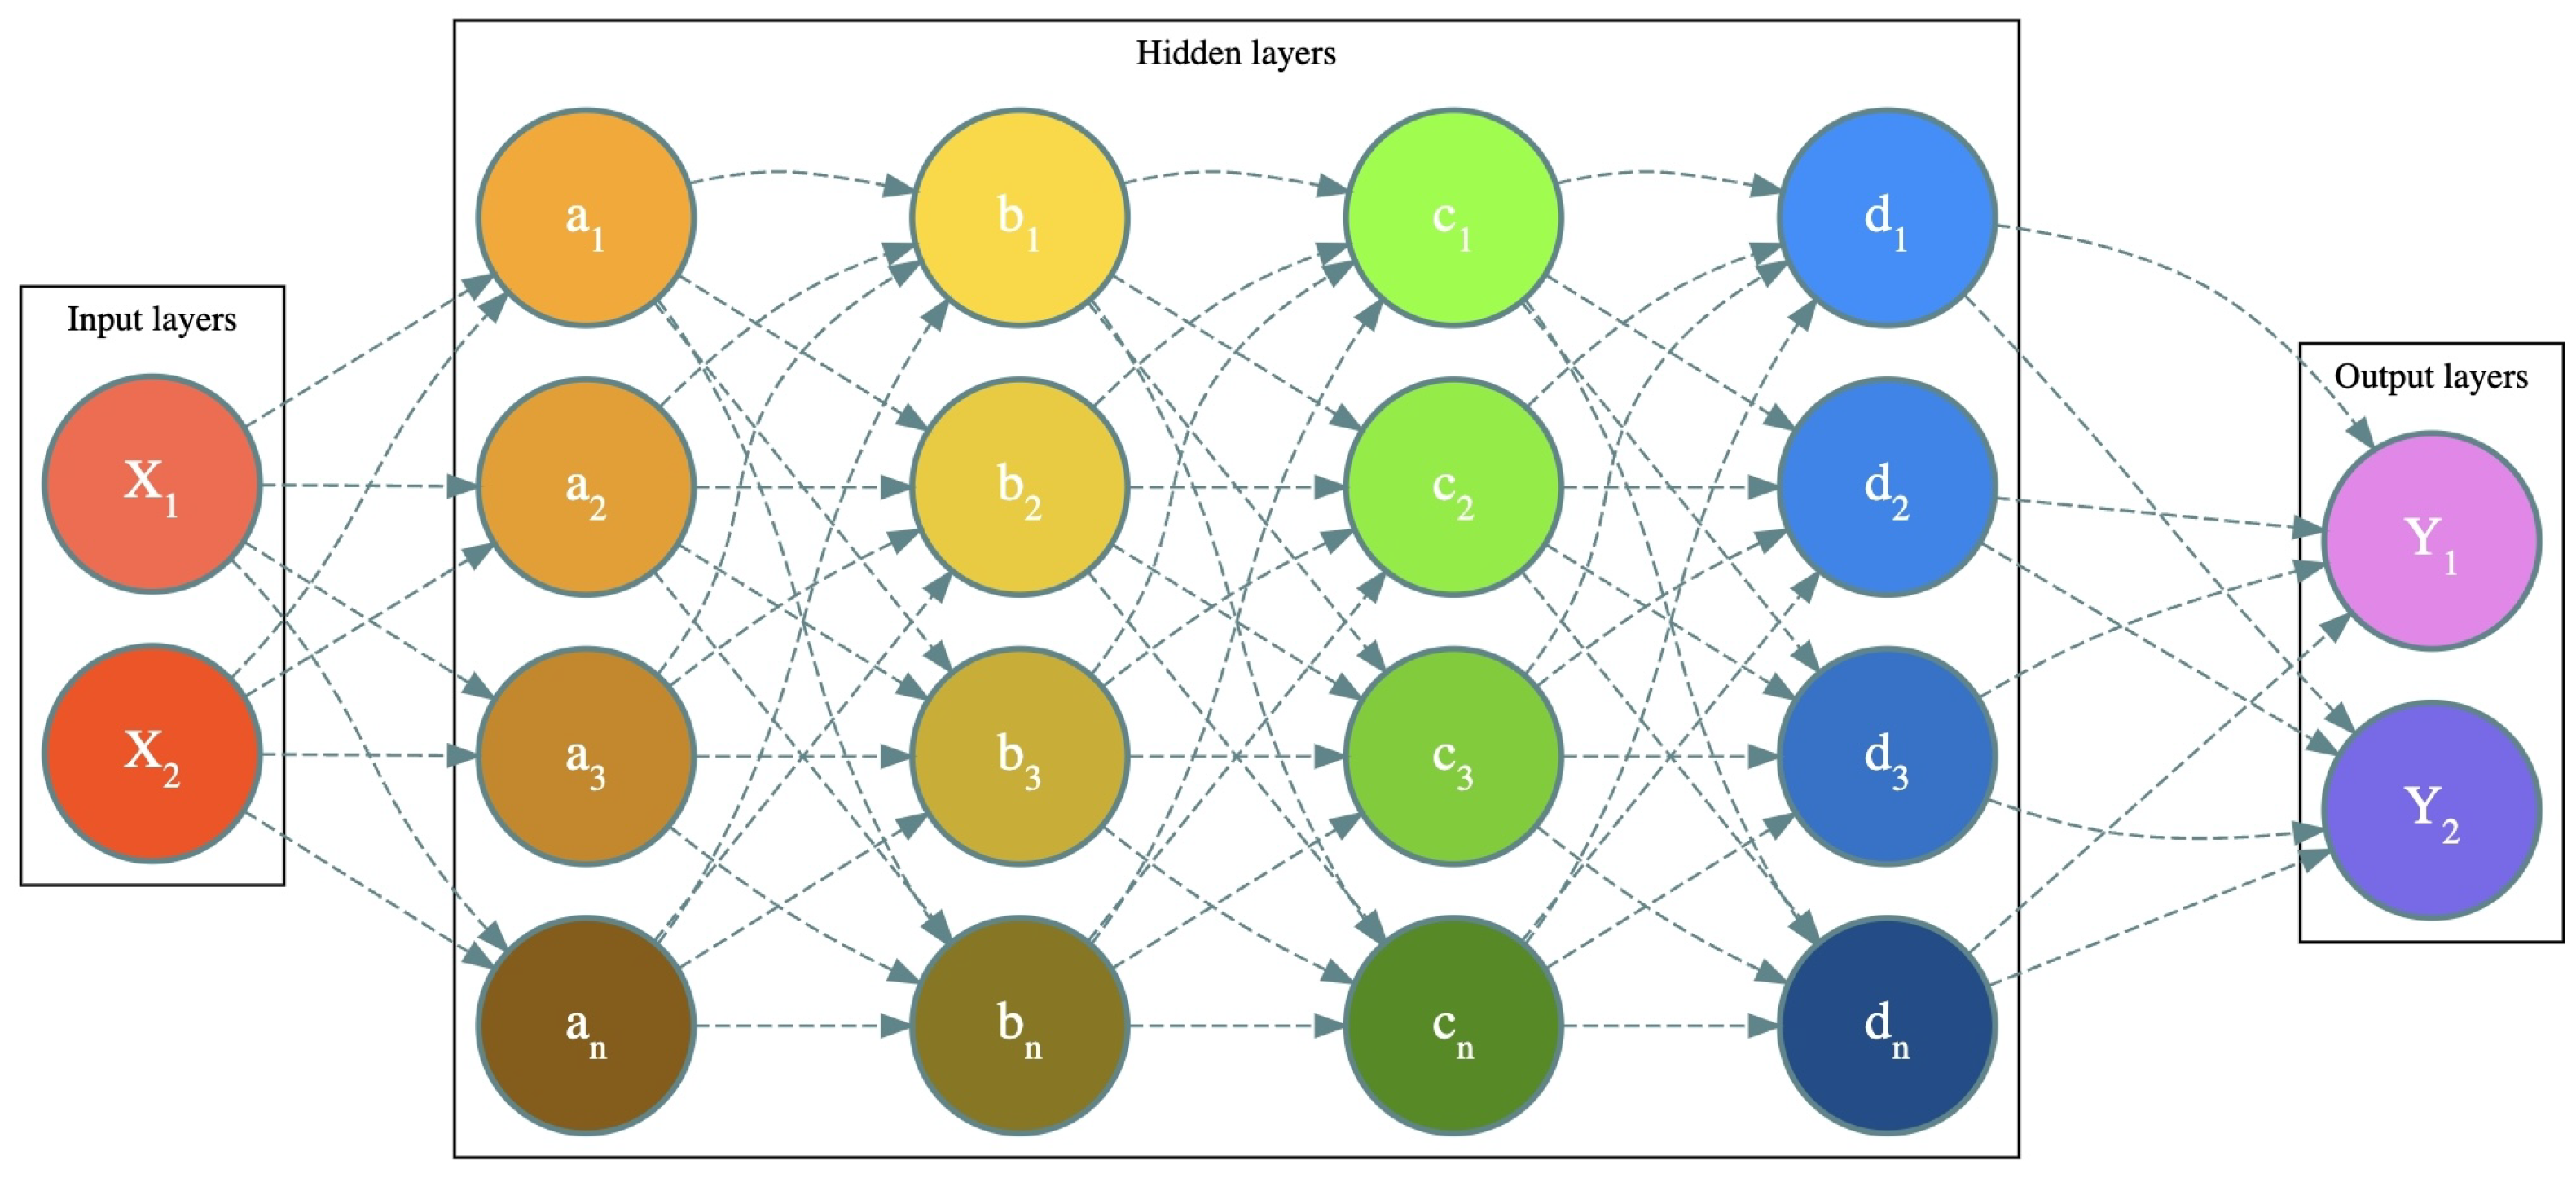
3.3. Theoretical Fundamentals of MLP
3.4. Data
3.5. Software
3.6. Implementation
3.7. Image Processing
| Listing 1. GRASS GIS code for data import and the creation of a colour composite algorithm. |
 |
| Listing 2. GRASS GIS code for unsupervised image classification method using k-means clustering algorithm. |
 |
| Listing 3. GRASS GIS code for supervised image classification using Artificial Neural Network (ANN) model with multi-layer neural network approach of MLPC algorithm. |
 |
4. Results
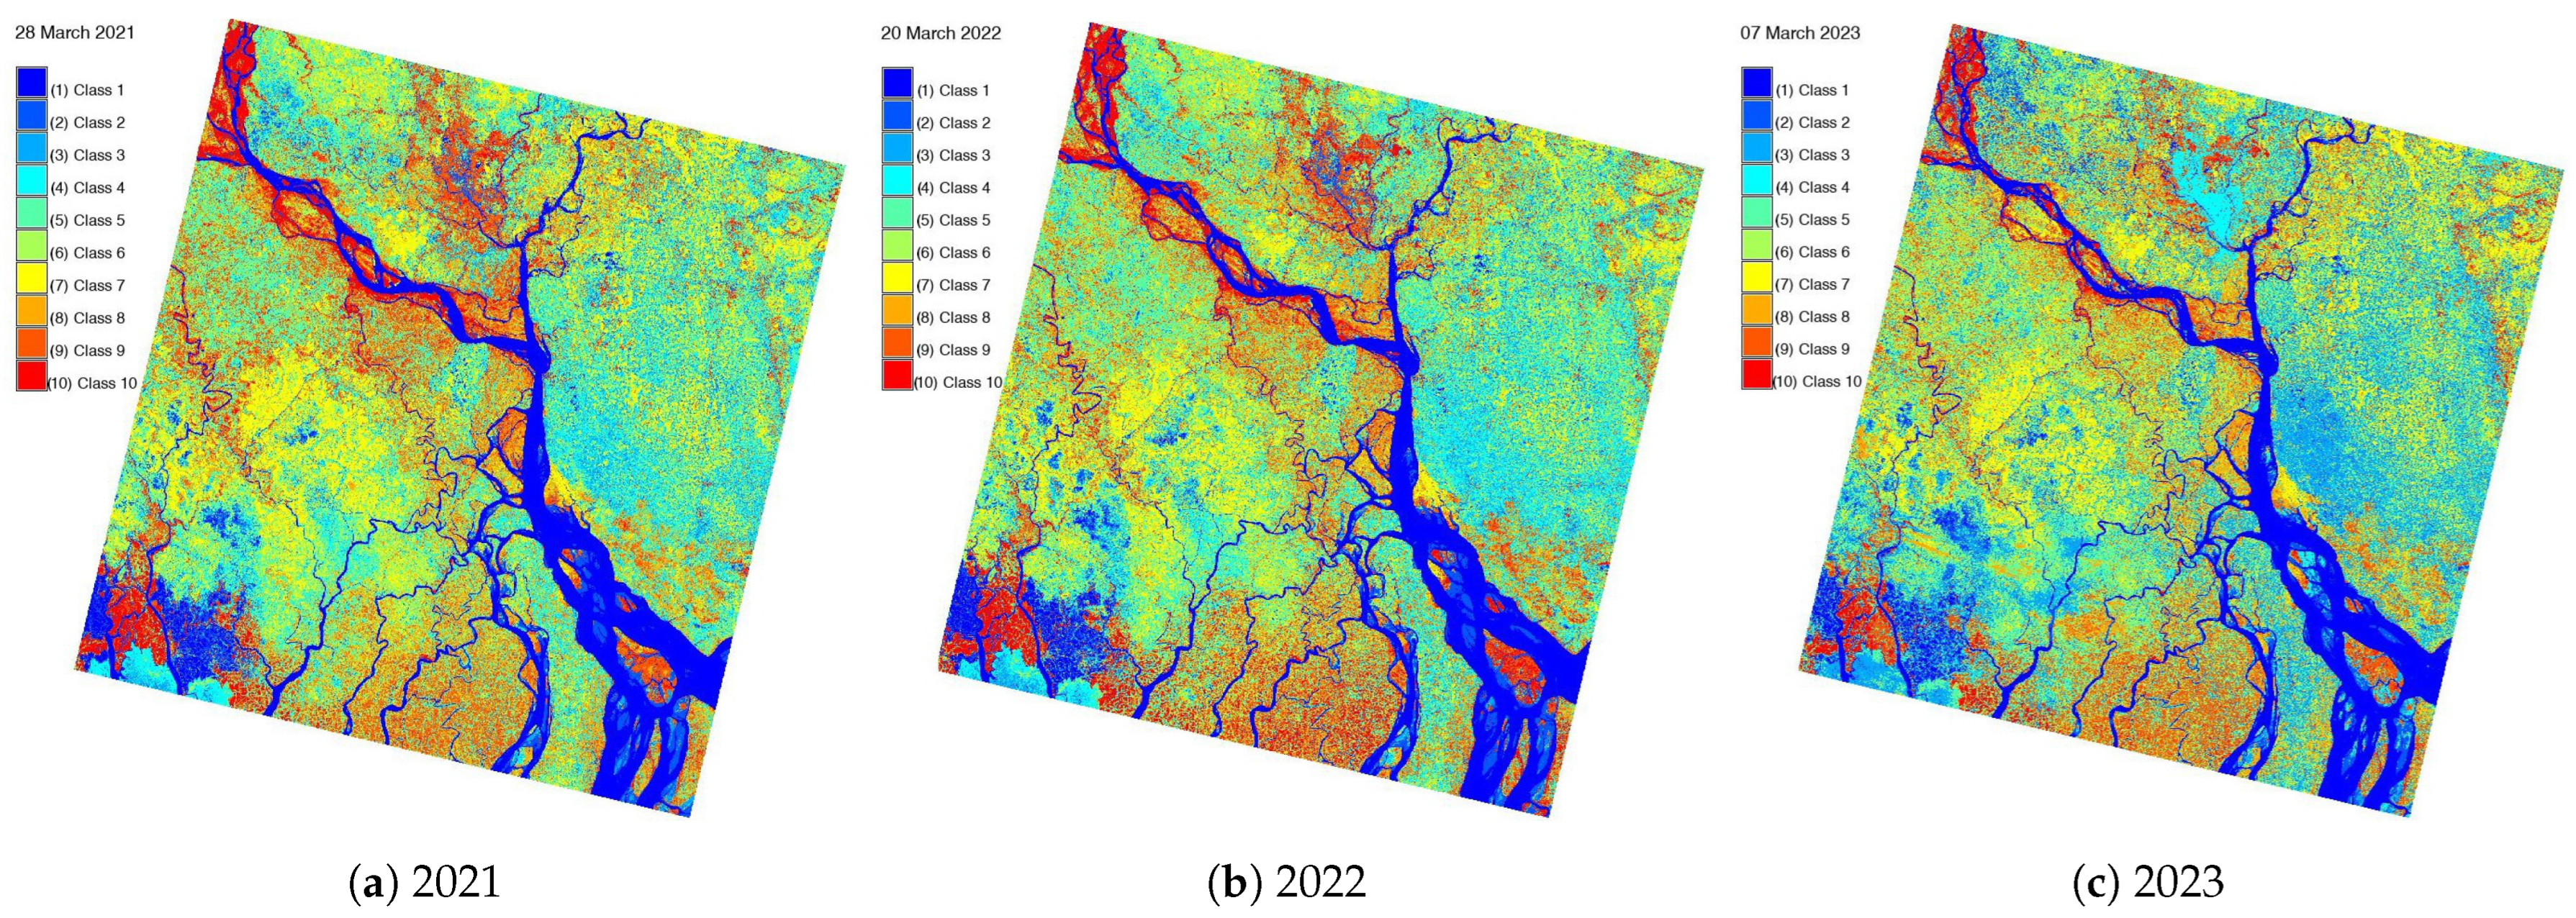
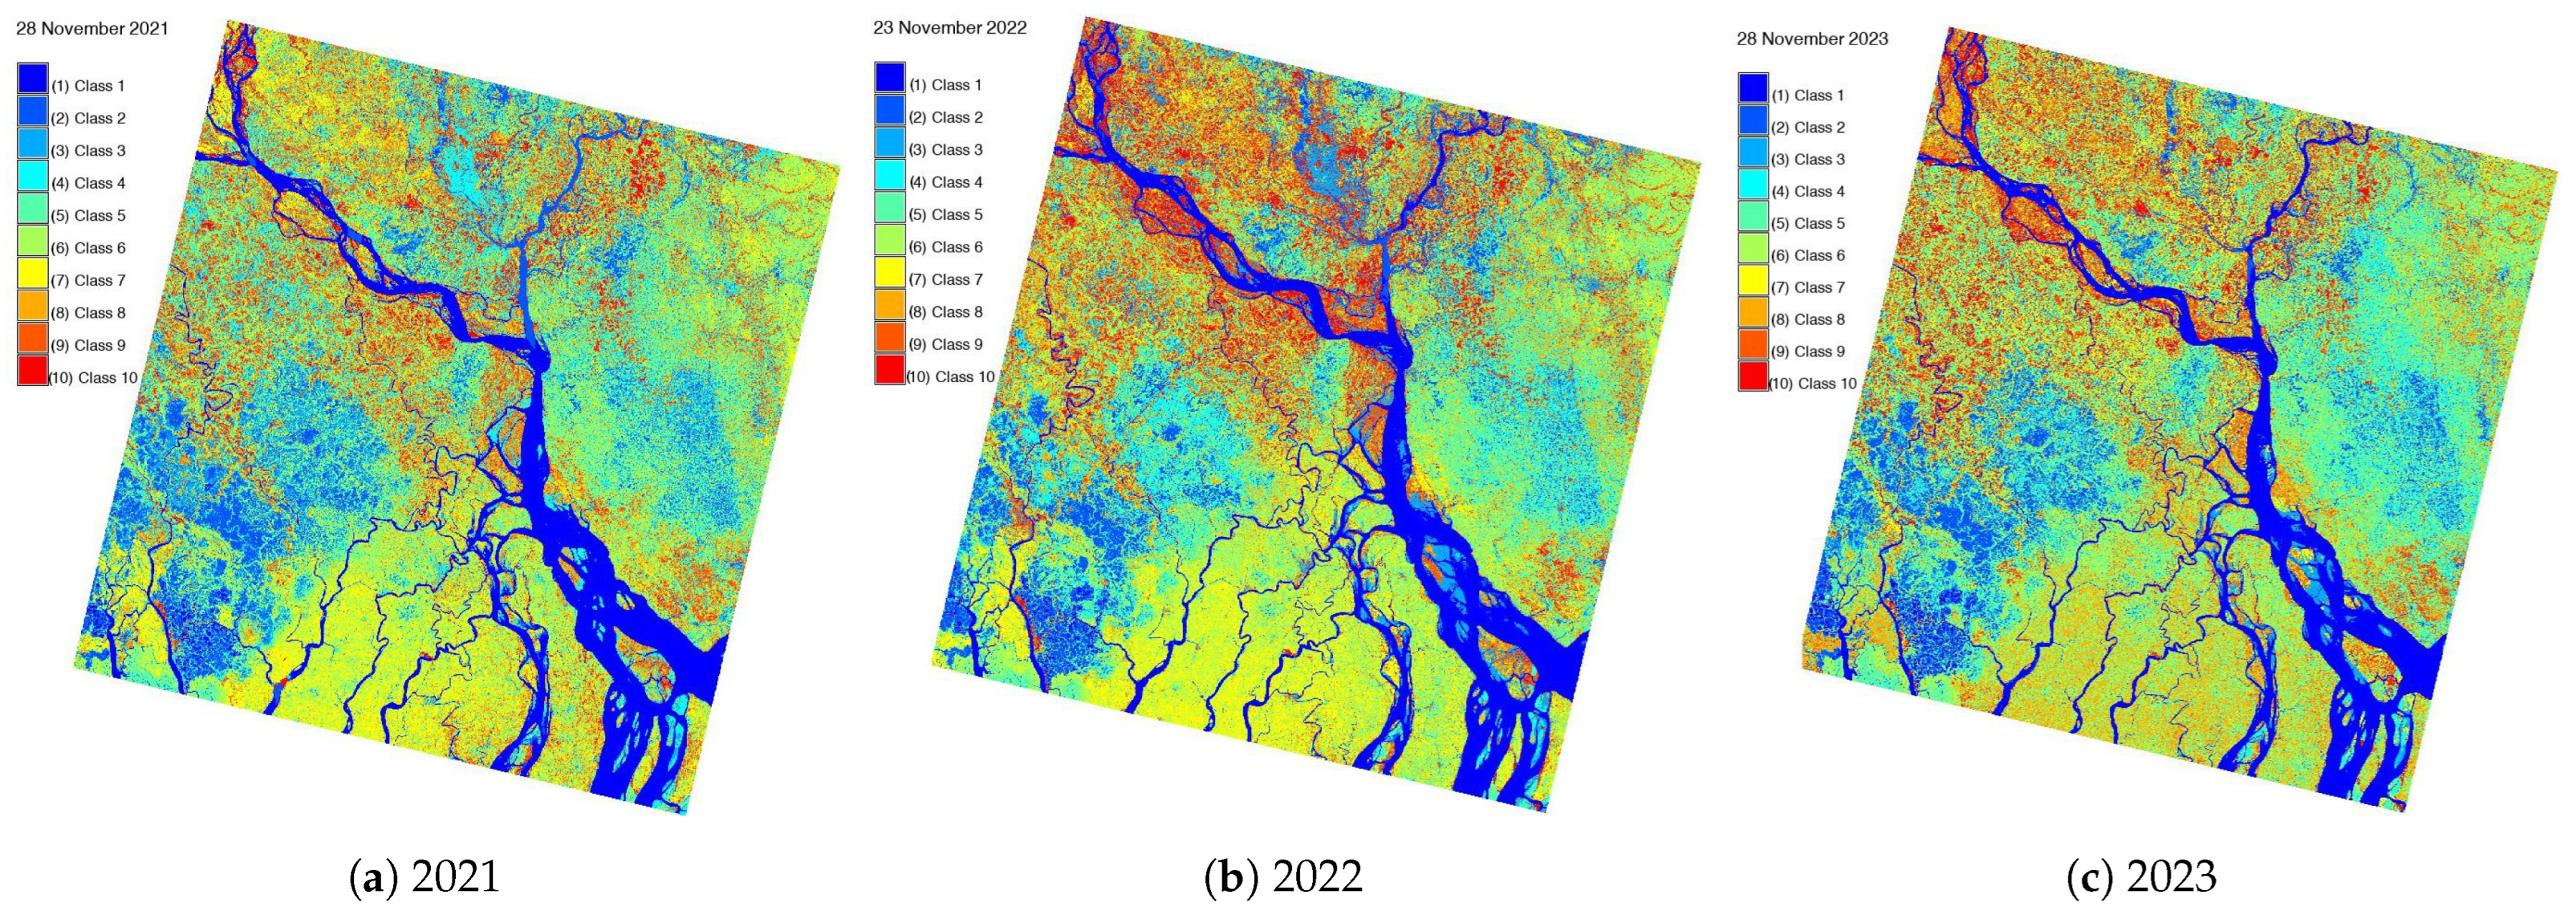
4.1. K-Means Classification Outcomes
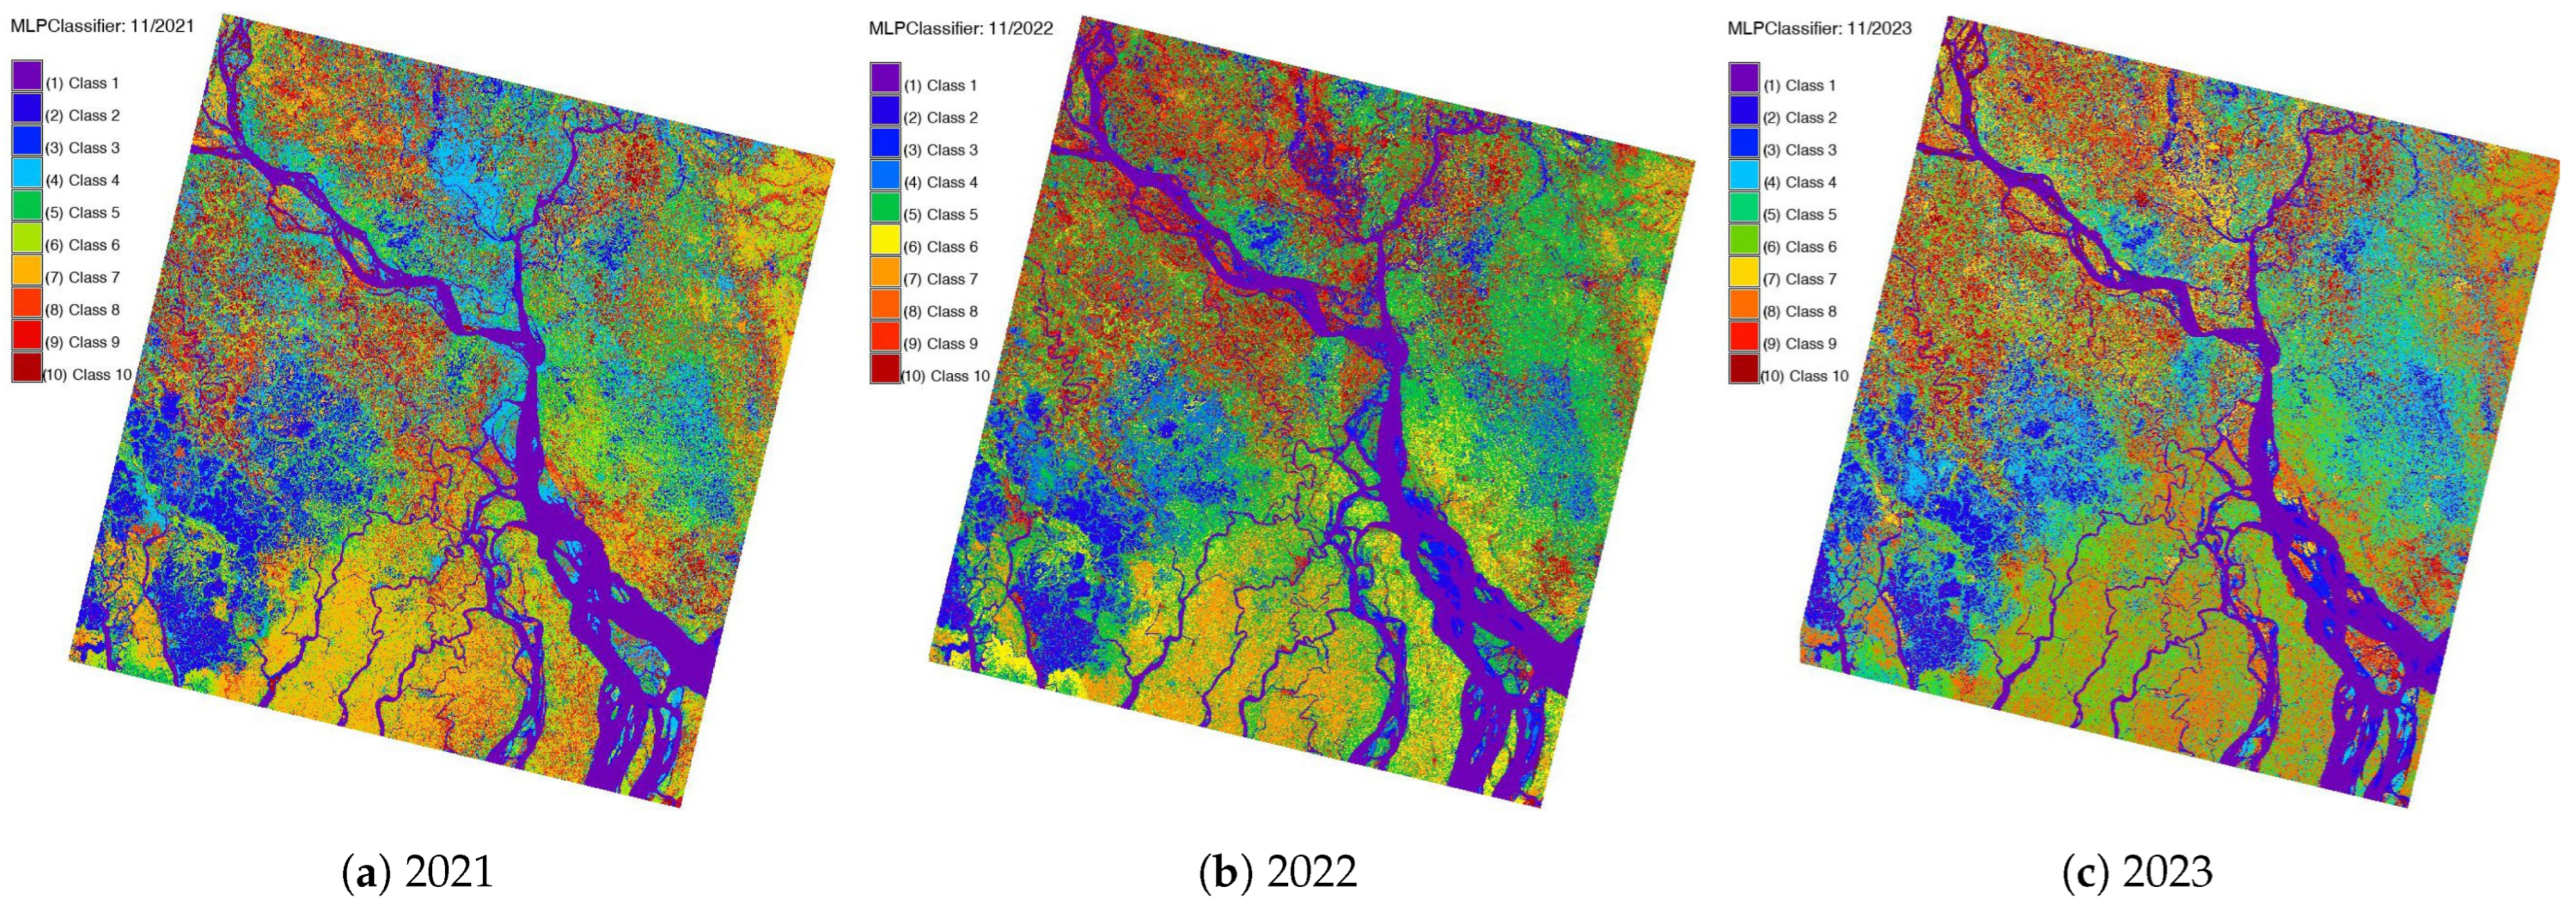
4.2. Deep Learning Outcomes
5. Discussion
6. Conclusions
Funding
Institutional Review Board Statement
Informed Consent Statement
Data Availability Statement
Acknowledgments
Conflicts of Interest
Abbreviations
| AI | Artificial Intelligence |
| ANN | Artificial Neural Network |
| DL | Deep Learning |
| DN | Digital Number |
| EO | Earth Observation |
| GEBCO | General Bathymetric Chart of the Oceans |
| GMT | Generic Mapping Tools |
| GRASS | Geographic Resources Analysis Support System |
| GIS | Geographic Information System |
| Landsat OLI/TIRS | Landsat Operational Land Imager and Thermal Infrared Sensor |
| ML | Machine Learning |
| MLP | Multilayer Perceptron |
| NIR | Near Infrared |
| RF | Random Forest |
| RS | Remote Sensing |
| SVM | Support Vector Machine |
| SWIR | Shortwave Infrared |
| USGS | United States Geological Survey |
| UTM | Universal Transverse Mercator |
| WGS84 | World Geodetic System 84 |
| WRS | Worldwide Reference System |
Appendix A. Metadata for Satellite Images

| Dataset Attribute | Attribute Value | Attribute Value | Attribute Value |
|---|---|---|---|
| Landsat Scene Identifier | LC81370442023066LGN00 | LC81370442022079LGN00 | LC81370442021076LGN00 |
| Date Acquired | 7 March 2023 | 20 March 2022 | 17 March 2021 |
| Roll Angle | −1 | 0 | 0 |
| Start Time | 7 March 2023 04:24:33 | 20 March 2022 04:24:26.058914 | 17 March 2021 04:24:23.120295 |
| Stop Time | 7 March 2023 04:25:05 | 20 March 2022 04:24:57.828914 | 17 March 2021 04:24:54.890294 |
| Land Cloud Cover | 3.12 | 0.01 | 0.03 |
| Scene Cloud Cover L1 | 2.97 | 0.01 | 0.03 |
| Ground Control Points Model | 732 | 771 | 776 |
| Ground Control Points Version | 5 | 5 | 5 |
| Geometric RMSE Model | 5683 | 5615 | 5694 |
| Geometric RMSE Model X | 3887 | 3857 | 3585 |
| Geometric RMSE Model Y | 4146 | 4081 | 4424 |
| Processing Software Version | LPGS_16.2.0 | LPGS_15.6.0 | LPGS_15.4.0 |
| Sun Elevation L0RA | 51.70012312 | 56.10505202 | 55.19368850 |
| Sun Azimuth L0RA | 134.86314148 | 129.90704446 | 131.01649112 |
| TIRS SSM Model | FINAL | FINAL | FINAL |
| Data Type L2 | OLI_TIRS_L2SP | OLI_TIRS_L2SP | OLI_TIRS_L2SP |
| Satellite | 8 | 8 | 8 |
| Scene Center Lat DMS | “23°06′46.58″ N” | “23°06′45.29″ N” | “23°06′46.01″ N” |
| Scene Center Long DMS | “90°23′29.83″ E” | “90°23′14.57″ E” | “90°24′53.42″ E” |
| Corner Upper Left Lat DMS | “24°09′00.29″ N” | “24°09′00″ N” | “24°09′02.38″ N” |
| Corner Upper Left Long DMS | “89°13′54.73″ E” | “89°13′44.11″ E” | “89°15′19.58″ E” |
| Corner Upper Right Lat DMS | “24°11′21.62″ N” | “24°11′21.52″ N” | “24°11′22.45″ N” |
| Corner Upper Right Long DMS | “91°30′23.18″ E” | “91°30′12.56″ E” | “91°31′48.22″ E” |
| Corner Lower Left Lat DMS | “22°01′28.45″ N” | “22°01′28.20″ N” | “22°01′30.32″ N” |
| Corner Lower Left Long DMS | “89°17′26.70″ E” | “89°17′16.22″ E” | “89°18′50.22″ E” |
| Corner Lower Right Lat DMS | “22°03′36.04″ N” | “22°03′35.93″ N” | “22°03′36.76″ N” |
| Corner Lower Right Long DMS | “91°31′47.39″ E” | “91°31′36.95″ E” | “91°33′11.12″ E” |
| Landsat Scene Identifier | LC91370442023330LGN00 | LC91370442022327LGN01 | LC81370442021332LGN00 |
| Date Acquired | 26 November 2023 | 23 November 2022 | 28 November 2021 |
| Roll Angle | 0 | 0 | 0 |
| Start Time | 26 November 2023 04:24:51 | 23 November 2022 04:25:01 | 28 November 2021 04:24:54.925489 |
| Stop Time | 26 November 2023 04:25:23 | 23 November 2022 04:25:32 | 28 November 2021 04:25:26.695489 |
| Land Cloud Cover | 0.02 | 0.20 | 0.40 |
| Scene Cloud Cover L1 | 0.02 | 0.19 | 0.38 |
| Ground Control Points Model | 750 | 782 | 768 |
| Ground Control Points Version | 5 | 5 | 5 |
| Geometric RMSE Model | 6651 | 6490 | 6697 |
| Geometric RMSE Model X | 4185 | 4191 | 4329 |
| Geometric RMSE Model Y | 5170 | 4955 | 5110 |
| Processing Software Version | LPGS_16.3.1 | LPGS_16.2.0 | LPGS_15.5.0 |
| Sun Elevation L0RA | 41.83496249 | 42.43660966 | 41.36291892 |
| Sun Azimuth L0RA | 154.44654325 | 154.42300606 | 154.52745495 |
| TIRS SSM Model | N/A | N/A | FINAL |
| Data Type L2 | OLI_TIRS_L2SP | OLI_TIRS_L2SP | OLI_TIRS_L2SP |
| Satellite | 9 | 9 | 8 |
| Scene Center Lat DMS | “23°06′45.65″ N” | “23°06′46.48″ N” | “23°06′45.22″ N” |
| Scene Center Long DMS | “90°22′20.75″ E” | “90°23′11.94″ E” | “90°24′08.21″ E” |
| Corner Upper Left Lat DMS | “24°08′48.98″ N” | “24°08′50.28″ N” | “24°09′01.33″ N” |
| Corner Upper Left Long DMS | “89°12′51.37″ E” | “89°13′44.40″ E” | “89°14′37.14″ E” |
| Corner Upper Right Lat DMS | “24°11′11.26″ N” | “24°11′11.80″ N” | “24°11′22.06″ N” |
| Corner Upper Right Long DMS | “91°29′19.50″ E” | “91°30′12.67″ E” | “91°31′05.70″ E” |
| Corner Lower Left Lat DMS | “22°01′27.01″ N” | “22°01′28.20″ N” | “22°01′19.67″ N” |
| Corner Lower Left Long DMS | “89°16′24.02″ E” | “89°17′16.22″ E” | “89°18′08.71″ E” |
| Corner Lower Right Lat DMS | “22°03′35.46″ N” | “22°03′35.93″ N” | “22°03′26.64″ N” |
| Corner Lower Right Long DMS | “91°30′44.60″ E” | “91°31′36.95″ E” | “91°32′29.36″ E” |
References
- Alarifi, S.S.; Abdelkareem, M.; Abdalla, F.; Alotaibi, M. Flash Flood Hazard Mapping Using Remote Sensing and GIS Techniques in Southwestern Saudi Arabia. Sustainability 2022, 14, 14145. [Google Scholar] [CrossRef]
- Subraelu, P.; Ahmed, A.; Ebraheem, A.A.; Sherif, M.; Mirza, S.B.; Ridouane, F.L.; Sefelnasr, A. Risk Assessment and Mapping of Flash Flood Vulnerable Zones in Arid Region, Fujairah City, UAE-Using Remote Sensing and GIS-Based Analysis. Water 2023, 15, 2802. [Google Scholar] [CrossRef]
- Ahmed, A.; Alrajhi, A.; Alquwaizany, A.; Al Maliki, A.; Hewa, G. Flood Susceptibility Mapping Using Watershed Geomorphic Data in the Onkaparinga Basin, South Australia. Sustainability 2022, 14, 16270. [Google Scholar] [CrossRef]
- Rashwan, M.; Mohamed, A.K.; Alshehri, F.; Almadani, S.; Khattab, M.; Mohamed, L. Flash Flood Hazard Assessment along the Red Sea Coast Using Remote Sensing and GIS Techniques. ISPRS Int. J. Geo-Inf. 2023, 12, 465. [Google Scholar] [CrossRef]
- Shawky, M.; Hassan, Q.K. Geospatial Modeling Based-Multi-Criteria Decision-Making for Flash Flood Susceptibility Zonation in an Arid Area. Remote Sens. 2023, 15, 2561. [Google Scholar] [CrossRef]
- Yaseen, Z.M. Flood hazards and susceptibility detection for Ganga river, Bihar state, India: Employment of remote sensing and statistical approaches. Results Eng. 2024, 21, 101665. [Google Scholar] [CrossRef]
- Ghalehteimouri, K.J.; Ros, F.C.; Rambat, S. Flood risk assessment through rapid urbanization LULC change with destruction of urban green infrastructures based on NASA Landsat time series data: A case of study Kuala Lumpur between 1990–2021. Acta Ecol. Sin. 2023; in press. [Google Scholar] [CrossRef]
- Thakur, D.A.; Mohanty, M.P.; Mishra, A.; Karmakar, S. Quantifying flood risks during monsoon and post-monsoon seasons: An integrated framework for resource-constrained coastal regions. J. Hydrol. 2024, 630, 130683. [Google Scholar] [CrossRef]
- Sun, D.; Yang, T.; Li, S.; Goldberg, M.; Kalluri, S.; Helfrich, S.; Sjonberg, B.; Zhou, L.; Zhang, Q.; Straka, W.; et al. Hazard or Non-Hazard Flood: Post Analysis for Paddy Rice, Wetland, and Other Potential Non-Hazard Flood Extraction from the VIIRS Flood Products. ISPRS J. Photogramm. Remote. Sens. 2024, 209, 415–431. [Google Scholar] [CrossRef]
- Razavi-Termeh, S.V.; Seo, M.; Sadeghi-Niaraki, A.; Choi, S.M. Flash flood detection and susceptibility mapping in the Monsoon period by integration of optical and radar satellite imagery using an improvement of a sequential ensemble algorithm. Weather Clim. Extrem. 2023, 41, 100595. [Google Scholar] [CrossRef]
- Zheng, X.; Duan, C.; Chen, Y.; Li, R.; Wu, Z. Disaster loss calculation method of urban flood bimodal data fusion based on remote sensing and text. J. Hydrol. Reg. Stud. 2023, 47, 101410. [Google Scholar] [CrossRef]
- Duan, C.; Zheng, X.; Li, R.; Wu, Z. Urban flood vulnerability Knowledge-Graph based on remote sensing and textual bimodal data fusion. J. Hydrol. 2024, 633, 131010. [Google Scholar] [CrossRef]
- Bell, R.; Fort, M.; Götz, J.; Bernsteiner, H.; Andermann, C.; Etzlstorfer, J.; Posch, E.; Gurung, N.; Gurung, S. Major geomorphic events and natural hazards during monsoonal precipitation 2018 in the Kali Gandaki Valley, Nepal Himalaya. Geomorphology 2021, 372, 107451. [Google Scholar] [CrossRef]
- Jaramillo, E.; Portnoy, I.; Torregroza-Espinosa, A.C.; Larios-Giraldo, P. Evolution of the Landscape’s Vegetation Health Condition in a Tropical Coastal Lagoon: A Remote Sensing Study in the Case of Northern Colombia. Procedia Comput. Sci. 2024, 231, 526–531. [Google Scholar] [CrossRef]
- Zuo, J.; Jiang, W.; Li, Q.; Du, Y. Remote sensing dynamic monitoring of the flood season area of Poyang Lake over the past two decades. Nat. Hazards Res. 2024, 4, 8–19. [Google Scholar] [CrossRef]
- Singha, P.; Pal, S. Influence of hydrological state on trophic state in dam induced seasonally inundated flood plain wetland. Ecohydrol. Hydrobiol. 2023, 23, 316–334. [Google Scholar] [CrossRef]
- Mathew, M.M.; K, S.; Mathew, M.; Arulbalaji, P.; Padmalal, D. Spatiotemporal variability of rainfall and its effect on hydrological regime in a tropical monsoon-dominated domain of Western Ghats, India. J. Hydrol. Reg. Stud. 2021, 36, 100861. [Google Scholar] [CrossRef]
- Rocha, E.M.; Drewry, J.L.; Willett, R.M.; Luck, B.D. Assessing kernel processing score of harvested corn silage in real-time using image analysis and machine learning. Comput. Electron. Agric. 2022, 203, 107415. [Google Scholar] [CrossRef]
- Li, Y.; Li, X.; Zhang, Y.; Peng, D.; Bruzzone, L. Cost-efficient information extraction from massive remote sensing data: When weakly supervised deep learning meets remote sensing big data. Int. J. Appl. Earth Obs. Geoinf. 2023, 120, 103345. [Google Scholar] [CrossRef]
- Lemenkova, P.; Debeir, O. Recognizing the Wadi Fluvial Structure and Stream Network in the Qena Bend of the Nile River, Egypt, on Landsat 8-9 OLI Images. Information 2023, 14, 249. [Google Scholar] [CrossRef]
- Xiong, P.; Tong, L.; Zhang, K.; Shen, X.; Battiston, R.; Ouzounov, D.; Iuppa, R.; Crookes, D.; Long, C.; Zhou, H. Towards advancing the earthquake forecasting by machine learning of satellite data. Sci. Total Environ. 2021, 771, 145256. [Google Scholar] [CrossRef]
- Aouragh, M.H.; Ijlil, S.; Essahlaoui, N.; Essahlaoui, A.; El Hmaidi, A.; El Ouali, A.; Mridekh, A. Remote sensing and GIS-based machine learning models for spatial gully erosion prediction: A case study of Rdat watershed in Sebou basin, Morocco. Remote Sens. Appl. Soc. Environ. 2023, 30, 100939. [Google Scholar] [CrossRef]
- Rafik, A.; Ait Brahim, Y.; Amazirh, A.; Ouarani, M.; Bargam, B.; Ouatiki, H.; Bouslihim, Y.; Bouchaou, L.; Chehbouni, A. Groundwater level forecasting in a data-scarce region through remote sensing data downscaling, hydrological modeling, and machine learning: A case study from Morocco. J. Hydrol. Reg. Stud. 2023, 50, 101569. [Google Scholar] [CrossRef]
- Wu, N.; Crusiol, L.G.T.; Liu, G.; Wuyun, D.; Han, G. Comparing the performance of machine learning algorithms for estimating aboveground biomass in typical steppe of northern China using Sentinel imageries. Ecol. Indic. 2023, 154, 110723. [Google Scholar] [CrossRef]
- Lemenkova, P.; Debeir, O. Multispectral Satellite Image Analysis for Computing Vegetation Indices by R in the Khartoum Region of Sudan, Northeast Africa. J. Imaging 2023, 9, 98. [Google Scholar] [CrossRef] [PubMed]
- dos Santos, E.P.; da Silva, D.D.; do Amaral, C.H.; Fernandes-Filho, E.I.; Dias, R.L.S. A Machine Learning approach to reconstruct cloudy affected vegetation indices imagery via data fusion from Sentinel-1 and Landsat 8. Comput. Electron. Agric. 2022, 194, 106753. [Google Scholar] [CrossRef]
- Kalpoma, K.A.; Robin, G.M.R.K.; Ferdaus, J.; Mitul, M.M.R.; Rahman, A. Satellite Image Database Creation for Road Quality Measurement of National Highways of Bangladesh. In Proceedings of the IGARSS 2022—2022 International Geoscience and Remote Sensing Symposium (IGARSS), Kuala Lumpur, Malaysia, 17–22 July 2022; pp. 3047–3050. [Google Scholar] [CrossRef]
- Lemenkova, P. Random Forest Classifier Algorithm of Geographic Resources Analysis Support System Geographic Information System for Satellite Image Processing: Case Study of Bight of Sofala, Mozambique. Coasts 2024, 4, 127–149. [Google Scholar] [CrossRef]
- Sanyal, J. Flood Inundation Modelling in Data-Sparse Flatlands: Challenges and Prospects. In Floods in the Ganga–Brahmaputra—Meghna Delta; Springer International Publishing: Cham, Switzerland, 2023; pp. 19–35. [Google Scholar]
- Islam, S.N.; Reinstädtler, S.; Kowshik, M.H.; Akther, S.; Newaz, M.N.; Gnauck, A.; Eslamian, S. Chapter 11—GIS Application in floods mapping in the Ganges–Padma River basins in Bangladesh. In Handbook of Hydroinformatics; Eslamian, S., Eslamian, F., Eds.; Elsevier: Amsterdam, The Netherlands, 2023; pp. 167–183. [Google Scholar] [CrossRef]
- Rana, S.S.; Habib, S.A.; Sharifee, M.N.H.; Sultana, N.; Rahman, S.H. Flood risk mapping of the flood-prone Rangpur division of Bangladesh using remote sensing and multi-criteria analysis. Nat. Hazards Res. 2023, 4, 20–31. [Google Scholar] [CrossRef]
- Chakma, P.; Akter, A. Flood Mapping in the Coastal Region of Bangladesh Using Sentinel-1 SAR Images: A Case Study of Super Cyclone Amphan. J. Civ. Eng. Forum 2021, 7, 267–278. [Google Scholar] [CrossRef]
- Singha, M.; Dong, J.; Sarmah, S.; You, N.; Zhou, Y.; Zhang, G.; Doughty, R.; Xiao, X. Identifying floods and flood-affected paddy rice fields in Bangladesh based on Sentinel-1 imagery and Google Earth Engine. ISPRS J. Photogramm. Remote. Sens. 2020, 166, 278–293. [Google Scholar] [CrossRef]
- Yang, R.; Ahmed, Z.U.; Schulthess, U.C.; Kamal, M.; Rai, R. Detecting functional field units from satellite images in smallholder farming systems using a deep learning based computer vision approach: A case study from Bangladesh. Remote Sens. Appl. Soc. Environ. 2020, 20, 100413. [Google Scholar] [CrossRef]
- Lemenkova, P. Monitoring Seasonal Fluctuations in Saline Lakes of Tunisia Using Earth Observation Data Processed by GRASS GIS. Land 2023, 12, 1995. [Google Scholar] [CrossRef]
- Beveridge, C.; Hossain, F.; Biswas, R.K.; Haque, A.A.; Ahmad, S.K.; Biswas, N.K.; Hossain, M.A.; Bhuyan, M.A. Stakeholder-driven development of a cloud-based, satellite remote sensing tool to monitor suspended sediment concentrations in major Bangladesh rivers. Environ. Model. Softw. 2020, 133, 104843. [Google Scholar] [CrossRef]
- Sadiq, M.A.; Sarkar, S.K.; Raisa, S.S. Meteorological drought assessment in northern Bangladesh: A machine learning-based approach considering remote sensing indices. Ecol. Indic. 2023, 157, 111233. [Google Scholar] [CrossRef]
- Lemenkova, P.; Debeir, O. Satellite Image Processing by Python and R Using Landsat 9 OLI/TIRS and SRTM DEM Data on Côte d’Ivoire, West Africa. J. Imaging 2022, 8, 317. [Google Scholar] [CrossRef] [PubMed]
- Zhao, G.; Pang, B.; Xu, Z.; Cui, L.; Wang, J.; Zuo, D.; Peng, D. Improving urban flood susceptibility mapping using transfer learning. J. Hydrol. 2021, 602, 126777. [Google Scholar] [CrossRef]
- Roy, M.; Routaray, D.; Ghosh, S.; Ghosh, A. Ensemble of Multilayer Perceptrons for Change Detection in Remotely Sensed Images. IEEE Geosci. Remote Sens. Lett. 2014, 11, 49–53. [Google Scholar] [CrossRef]
- Roy, M.; Routaray, D.; Ghosh, S. Change detection in remotely sensed images using an ensemble of multilayer perceptrons. In Proceedings of the 2012 International Conference on Communications, Devices and Intelligent Systems (CODIS), Kolkata, India, 28–29 December 2012; pp. 278–281. [Google Scholar] [CrossRef]
- Chakraborty, S.; Roy, M. Domain adaptation for land-cover classification of remotely sensed images using ensemble of Multilayer Perceptrons. In Proceedings of the 2016 3rd International Conference on Recent Advances in Information Technology (RAIT), Dhanbad, India, 3–5 March 2016; pp. 523–528. [Google Scholar] [CrossRef]
- Kalpoma, K.A.; Ali, R.; Rahman, A.; Islam, A. Use of Remote Sensing Satellite Images in Rice Area Monitoring System of Bangladesh. In Proceedings of the IGARSS 2020—2020 International Geoscience and Remote Sensing Symposium (IGARSS), Waikoloa, HI, USA, 26 September–2 October 2020; pp. 4665–4668. [Google Scholar] [CrossRef]
- Lemenkova, P. A GRASS GIS Scripting Framework for Monitoring Changes in the Ephemeral Salt Lakes of Chotts Melrhir and Merouane, Algeria. Appl. Syst. Innov. 2023, 6, 61. [Google Scholar] [CrossRef]
- Kalpoma, K.A.; Sarker Aurgho, A.; Bondhon, A.R.; Hossan Ani, F.; Islam Shizan, M.M. Road Quality Measurement System Using Satellite Images for National Highways of Bangladesh. In Proceedings of the IGARSS 2023—2023 International Geoscience and Remote Sensing Symposium (IGARSS), Pasadena, CA, USA, 16–21 July 2023; pp. 6912–6915. [Google Scholar] [CrossRef]
- Lemenkova, P.; Debeir, O. Computing Vegetation Indices from the Satellite Images Using GRASS GIS Scripts for Monitoring Mangrove Forests in the Coastal Landscapes of Niger Delta, Nigeria. J. Mar. Sci. Eng. 2023, 11, 871. [Google Scholar] [CrossRef]
- Kalpoma, K.A.; Nawar Arony, N.; Chowdhury, A.; Nowshin, M.; Kudoh, J.i. Boro Rice Model for HAOR Region of Bangladesh Based on Modis NDVI Images. In Proceedings of the IGARSS 2019—2019 International Geoscience and Remote Sensing Symposium (IGARSS), Yokohama, Japan, 28 July–2 August 2019; pp. 7326–7329. [Google Scholar] [CrossRef]
- Lemenkova, P. Sentinel-2 for High Resolution Mapping of Slope-Based Vegetation Indices Using Machine Learning by SAGA GIS. Transylv. Rev. Syst. Ecol. Res. 2020, 22, 17–34. [Google Scholar] [CrossRef]
- Onim, M.S.H.; Ehtesham, A.R.B.; Anbar, A.; Nazrul Islam, A.K.M.; Mahbubur Rahman, A.K.M. LULC classification by semantic segmentation of satellite images using FastFCN. In Proceedings of the 2020 2nd International Conference on Advanced Information and Communication Technology (ICAICT), Dhaka, Bangladesh, 28–29 November 2020; pp. 471–475. [Google Scholar] [CrossRef]
- Sarmin, F.J.; Zaman, M.S.U.; Sarkar, A.R. Monitoring land deformation due to groundwater extraction using Sentinel-1 satellite images: A case study from Chapai Nawabgonj, Bangladesh. In Proceedings of the 2020 23rd International Conference on Computer and Information Technology (ICCIT), Dhaka, Bangladesh, 19–21 December 2020; pp. 1–6. [Google Scholar] [CrossRef]
- Lemenkova, P.; Debeir, O. Time Series Analysis of Landsat Images for Monitoring Flooded Areas in the Inner Niger Delta, Mali. Artif. Satell. 2023, 58, 278–313. [Google Scholar] [CrossRef]
- Kalpoma, K.A.; Aurgho, A.S.; Shizan, M.M.I.; Ani, F.H.; Bondhon, A.R. Deep Learning Image Segmentation for Satellite Images of National Highways of Bangladesh. In Proceedings of the IGARSS 2023—2023 International Geoscience and Remote Sensing Symposium (IGARSS), Pasadena, CA, USA, 16–21 July 2023; pp. 6894–6897. [Google Scholar] [CrossRef]
- Lemenkova, P.; Debeir, O. Quantitative Morphometric 3D Terrain Analysis of Japan Using Scripts of GMT and R. Land 2023, 12, 261. [Google Scholar] [CrossRef]
- Islam, R.; Khatun, M.; Popy, S.H. TL-GAN: Transfer Learning with Generative Adversarial Network Model for Satellite Image Resolution Enhancement. In Proceedings of the 2023 26th International Conference on Computer and Information Technology (ICCIT), Cox’s Bazar, Bangladesh, 13–15 December 2023; pp. 1–5. [Google Scholar] [CrossRef]
- GEBCO Compilation Group. GEBCO 2023 Grid. 2023. Available online: https://doi.org/10.5285/f98b053b-0cbc-6c23-e053-6c86abc0af7b (accessed on 2 March 2024).
- Tozer, B.; Sandwell, D.T.; Smith, W.H.F.; Olson, C.; Beale, J.R.; Wessel, P. Global Bathymetry and Topography at 15 Arc Sec: SRTM15+. Earth Space Sci. 2019, 6, 1847–1864. [Google Scholar] [CrossRef]
- Wessel, P.; Luis, J.F.; Uieda, L.; Scharroo, R.; Wobbe, F.; Smith, W.H.F.; Tian, D. The Generic Mapping Tools Version 6. Geochem. Geophys. Geosyst. 2019, 20, 5556–5564. [Google Scholar] [CrossRef]
- Bhardwaj, P.; Singh, O. Understanding the Development and Progress of Extremely Severe Cyclonic Storm “Fani” Over the Bay of Bengal. In Geospatial Technology for Environmental Hazards: Modeling and Management in Asian Countries; Chapter Geospatial Technology for Environmental Hazards; Springer International Publishing: Cham, Switzerland, 2022; pp. 263–277. [Google Scholar]
- Islam, S.N. Deltaic floodplains development and wetland ecosystems management in the Ganges–Brahmaputra–Meghna Rivers Delta in Bangladesh. Sustain. Water Resour. Manag. 2016, 2, 237–256. [Google Scholar] [CrossRef]
- Datta, D.; Subramanian, V. Texture and mineralogy of sediments from the Ganges-Brahmaputra-Meghna river system in the Bengal Basin, Bangladesh and their environmental implications. Environ. Geol. 1997, 30, 181–188. [Google Scholar] [CrossRef]
- Khan, M.H.R.; Liu, J.; Liu, S.; Seddique, A.A.; Cao, L.; Rahman, A. Clay mineral compositions in surface sediments of the Ganges-Brahmaputra-Meghna river system of Bengal Basin, Bangladesh. Mar. Geol. 2019, 412, 27–36. [Google Scholar] [CrossRef]
- Lemenkova, P. Sediment thickness in the Bay of Bengal and Andaman Sea compared with topography and geophysical settings by GMT. Ovidius Univ. Ann. Constanta Ser. Civ. Eng. 2020, 22, 13–22. [Google Scholar] [CrossRef]
- Jerin, T.; Chowdhury, M.A.; Azad, M.A.K.; Zaman, S.; Mahmood, S.; Islam, S.L.U.; Mohammad Jobayer, H. Extreme weather events (EWEs)-Related health complications in Bangladesh: A gender-based analysis on the 2017 catastrophic floods. Nat. Hazards Res. 2023. ahead of print. [Google Scholar] [CrossRef]
- Mukherjee, K.; Pal, S. Hydrological and landscape dynamics of floodplain wetlands of the Diara region, Eastern India. Ecol. Indic. 2021, 121, 106961. [Google Scholar] [CrossRef]
- Abedin, M.A.; Hosenuzzaman, M. Chapter 19—Change in cropping pattern and soil health in relation to climate change and salinity in coastal Bangladesh. In Multi-Hazard Vulnerability and Resilience Building; Pal, I., Shaw, R., Eds.; Elsevier: Amsterdam, The Netherlands, 2023; pp. 315–332. [Google Scholar] [CrossRef]
- Al Masud, M.M.; Gain, A.K.; Azad, A.K. Tidal river management for sustainable agriculture in the Ganges-Brahmaputra delta: Implication for land use policy. Land Use Policy 2020, 92, 104443. [Google Scholar] [CrossRef]
- Sarker, S.; Krug, L.A.; Islam, K.M.; Basak, S.C.; Huda, A.S.; Hossain, M.S.; Das, N.; Riya, S.C.; Liyana, E.; Chowdhury, G.W. An integrated coastal ecosystem monitoring strategy: Pilot case in Naf-Saint Martin Peninsula, Bangladesh. Sci. Total Environ. 2024, 913, 169718. [Google Scholar] [CrossRef] [PubMed]
- Mainuddin, M.; Kirby, J.M. Impact of flood inundation and water management on water and salt balance of the polders and islands in the Ganges delta. Ocean. Coast. Manag. 2021, 210, 105740. [Google Scholar] [CrossRef]
- Hasan, M.A.; Mayeesha, A.N.; Razzak, M.Z.A. Evaluating geomorphological changes and coastal flood vulnerability of the Nijhum Dwip Island using remote sensing techniques. Remote Sens. Appl. Soc. Environ. 2023, 32, 101028. [Google Scholar] [CrossRef]
- Singha, P.; Das, P.; Talukdar, S.; Pal, S. Modeling livelihood vulnerability in erosion and flooding induced river island in Ganges riparian corridor, India. Ecol. Indic. 2020, 119, 106825. [Google Scholar] [CrossRef]
- Rumpa, N.T.; Real, H.R.K.; Razi, M.A. Disaster risk reduction in Bangladesh: A comparison of three major floods for assessing progress towards resilience. Int. J. Disaster Risk Reduct. 2023, 97, 104047. [Google Scholar] [CrossRef]
- Jerin, T.; Azad, M.A.K.; Khan, M.N. Climate change-triggered vulnerability assessment of the flood-prone communities in Bangladesh: A gender perspective. Int. J. Disaster Risk Reduct. 2023, 95, 103851. [Google Scholar] [CrossRef]
- Nahin, K.T.K.; Islam, S.B.; Mahmud, S.; Hossain, I. Flood vulnerability assessment in the Jamuna river floodplain using multi-criteria decision analysis: A case study in Jamalpur district, Bangladesh. Heliyon 2023, 9, e14520. [Google Scholar] [CrossRef]
- Das, S.; Hazra, S.; Haque, A.; Rahman, M.; Nicholls, R.J.; Ghosh, A.; Ghosh, T.; Salehin, M.; Safra de Campos, R. Social vulnerability to environmental hazards in the Ganges-Brahmaputra-Meghna delta, India and Bangladesh. Int. J. Disaster Risk Reduct. 2021, 53, 101983. [Google Scholar] [CrossRef]
- Ali, M.; Bhattacharya, B.; Islam, A.; Islam, G.; Hossain, M.; Khan, A. Challenges for flood risk management in flood-prone Sirajganj region of Bangladesh. J. Flood Risk Manag. 2019, 12, e12450. [Google Scholar] [CrossRef]
- Azad, M.J.; Pritchard, B. Bonding, bridging, linking social capital as mutually reinforcing elements in adaptive capacity development to flood hazard: Insights from rural Bangladesh. Clim. Risk Manag. 2023, 40, 100498. [Google Scholar] [CrossRef]
- Nicholls, R.; Hutton, C.; Lázár, A.; Allan, A.; Adger, W.; Adams, H.; Wolf, J.; Rahman, M.; Salehin, M. Integrated assessment of social and environmental sustainability dynamics in the Ganges-Brahmaputra-Meghna delta, Bangladesh. Estuarine Coast. Shelf Sci. 2016, 183, 370–381. [Google Scholar] [CrossRef]
- GRASS Development Team. Geographic Resources Analysis Support System (GRASS GIS) Software, Version 8.2; Open Source Geospatial Foundation: Beaverton, OR, USA, 2022.
- Inkscape Project Development Team. Inkscape, Software version 1.2; Inkscape Software Freedom Conservancy: Portland, OR, USA, 2012.
- Pedregosa, F.; Varoquaux, G.; Gramfort, A.; Michel, V.; Thirion, B.; Grisel, O.; Blondel, M.; Prettenhofer, P.; Weiss, R.; Dubourg, V.; et al. Scikit-learn: Machine learning in Python. J. Mach. Learn. Res. 2011, 12, 2825–2830. [Google Scholar]
- Van Rossum, G.; Drake, F.L., Jr. Python Reference Manual; Centrum voor Wiskunde en Informatica: Amsterdam, The Netherlands, 1995. [Google Scholar]
- Neteler, M.; Bowman, M.H.; Landa, M.; Metz, M. GRASS GIS: A multi-purpose open source GIS. Environ. Model. Softw. 2012, 31, 124–130. [Google Scholar] [CrossRef]
- Mitasova, H.; Neteler, M. GRASS as Open Source Free Software GIS: Accomplishments and Perspectives. Trans. GIS 2004, 8, 145–154. [Google Scholar] [CrossRef]
- Ahamed, M.Y.; Bin Syed, M.A.; Chatterjee, P.; Bin Habib, A.Z.S. A Deep Learning Approach for Satellite and Debris Detection: YOLO in Action. In Proceedings of the 2023 26th International Conference on Computer and Information Technology (ICCIT), Cox’s Bazar, Bangladesh, 13–15 December 2023; pp. 1–6. [Google Scholar] [CrossRef]
- Ahmed, A.A.M.; Jui, S.J.J.; Sharma, E.; Ahmed, M.H.; Raj, N.; Bose, A. An advanced deep learning predictive model for air quality index forecasting with remote satellite-derived hydro-climatological variables. Sci. Total Environ. 2024, 906, 167234. [Google Scholar] [CrossRef] [PubMed]
- Hassan, M.S.; Gomes, R.F.; Bhuiyan, M.A.H. Seasonal distribution of AOT and its relationship with air pollutants in central Bangladesh using remote sensing and machine learning tools. Case Stud. Chem. Environ. Eng. 2023, 8, 100399. [Google Scholar] [CrossRef]
- Shakib, M.F.; Al Mamun, M. Bushfire Classification from Satellite Imagery using Deep Learning. In Proceedings of the 2023 26th International Conference on Computer and Information Technology (ICCIT), Cox’s Bazar, Bangladesh, 13–15 December 2023; pp. 1–5. [Google Scholar] [CrossRef]
- Sanchez, E.N.; Rios, J.D.; Alanis, A.Y.; Arana-Daniel, N.; Lopez-Franco, C. Chapter 3—Neural identification using recurrent high-order neural networks for discrete nonlinear systems with unknown time delays. In Neural Networks Modeling and Control; Academic Press: Cambridge, MA, USA, 2020; pp. 17–33. [Google Scholar] [CrossRef]
- Hecht-Nielsen, R. III.3—Theory of the Backpropagation Neural Network**Based on “nonindent” by Robert Hecht-Nielsen, which appeared in Proceedings of the International Joint Conference on Neural Networks 1, 593–611, June 1989. © 1989 IEEE. In Neural Networks for Perception; Wechsler, H., Ed.; Academic Press: Cambridge, MA, USA, 1992; pp. 65–93. [Google Scholar] [CrossRef]
- Shekhar, S.; Amin, M.B.; Khandelwal, P. Generalization Performance of Feed-Forward Neural Networks. In Neural Networks; Gelenbe, E., Ed.; North-Holland: Amsterdam, The Netherlands, 1992; pp. 13–38. [Google Scholar] [CrossRef]
- Biswas, J.; Jobaer, M.A.; Haque, S.F.; Islam Shozib, M.S.; Limon, Z.A. Mapping and monitoring land use land cover dynamics employing Google Earth Engine and machine learning algorithms on Chattogram, Bangladesh. Heliyon 2023, 9, e21245. [Google Scholar] [CrossRef] [PubMed]
- Lemenkova, P. Image Segmentation of the Sudd Wetlands in South Sudan for Environmental Analytics by GRASS GIS Scripts. Analytics 2023, 2, 745–780. [Google Scholar] [CrossRef]
- Raisa, S.S.; Sarkar, S.K.; Sadiq, M.A. Advancing groundwater vulnerability assessment in Bangladesh: A comprehensive machine learning approach. Groundw. Sustain. Dev. 2024, 25, 101128. [Google Scholar] [CrossRef]
- Rudra, R.R.; Sarkar, S.K. Artificial neural network for flood susceptibility mapping in Bangladesh. Heliyon 2023, 9, e16459. [Google Scholar] [CrossRef]
- Iannone, R.; Roy, O. DiagrammeR: Graph/Network Visualization. 2024. R package version 1.0.11.9000. Available online: https://cran.r-project.org/web/packages/DiagrammeR (accessed on 5 March 2024).
- Chen, Q.; Wang, L.; Shang, Z. MRGIS: A MapReduce-Enabled High Performance Workflow System for GIS. In Proceedings of the 2008 IEEE Fourth International Conference on eScience, Indianapolis, IN, USA, 7–12 December 2008; pp. 646–651. [Google Scholar] [CrossRef]
- Song, X.; Liu, J. Scheduling Geo-processing Workflow Applications with QoS. In Proceedings of the 2008 International Workshop on Education Technology and Training & 2008 International Workshop on Geoscience and Remote Sensing, Shanghai, China, 21–22 December 2008; Volume 1, pp. 460–463. [Google Scholar] [CrossRef]
- Delogu, G.; Caputi, E.; Perretta, M.; Ripa, M.N.; Boccia, L. Using PRISMA Hyperspectral Data for Land Cover Classification with Artificial Intelligence Support. Sustainability 2023, 15, 13786. [Google Scholar] [CrossRef]
- Crivellaro, M.; Vitti, A.; Zolezzi, G.; Bertoldi, W. Characterization of Active Riverbed Spatiotemporal Dynamics through the Definition of a Framework for Remote Sensing Procedures. Remote Sens. 2024, 16, 184. [Google Scholar] [CrossRef]
- Huang, Y.; Chen, Z.-X.; Yu, T.; Huang, X.-Z.; Gu, X.-F. Agricultural remote sensing big data: Management and applications. J. Integr. Agric. 2018, 17, 1915–1931. [Google Scholar] [CrossRef]
- Yin, J.; Dong, J.; Hamm, N.A.; Li, Z.; Wang, J.; Xing, H.; Fu, P. Integrating remote sensing and geospatial big data for urban land use mapping: A review. Int. J. Appl. Earth Obs. Geoinf. 2021, 103, 102514. [Google Scholar] [CrossRef]
- Houska, T. Earth Explorer; Report; U.S. Geological Survey: Reston, VA, USA, 2012. [Google Scholar] [CrossRef]
- Survey, U.G. Landsat Collection 2 U.S. Analysis Ready Data; Report; U.S. Geological Survey: Reston, VA, USA, 2023. [Google Scholar] [CrossRef]
- Sheonty, S.R.; Nayeem, J. Drought Risk Mapping in the North-West Region of Bangladesh Using Landsat Time Series Satellite Images. In Proceedings of the Climate Change and Water Security, Singapore, 6–18 November 2022; pp. 221–229. [Google Scholar]
- Islam, M.R.; Miah, M.G.; Inoue, Y. Analysis of Land use and Land Cover Changes in the Coastal Area of Bangladesh using Landsat Imagery. Land Degrad. Dev. 2016, 27, 899–909. [Google Scholar] [CrossRef]
- Lemenkova, P.; Debeir, O. R Libraries for Remote Sensing Data Classification by k-means Clustering and NDVI Computation in Congo River Basin, DRC. Appl. Sci. 2022, 12, 12554. [Google Scholar] [CrossRef]
- Ferdous, J.; Rahman, M.T.U. Applicability of Landsat TM Images to Detect Soil Salinity of Coastal Areas in Bangladesh. In Advances in Remote Sensing and Geo Informatics Applications; Springer: Cham, Switzerland, 2019; pp. 219–221. [Google Scholar]
- Lemenkova, P.; Debeir, O. Environmental mapping of Burkina Faso using TerraClimate data and satellite images by GMT and R scripts. Adv. Geod. Geoinf. 2023, 72, 1–32. [Google Scholar] [CrossRef]
- Lemenkova, P. Using open-source software GRASS GIS for analysis of the environmental patterns in Lake Chad, Central Africa. Die Bodenkultur J. Land Manag. Food Environ. 2023, 74, 49–64. [Google Scholar] [CrossRef]
- Lemenkova, P.; Debeir, O. GDAL and PROJ Libraries Integrated with GRASS GIS for Terrain Modelling of the Georeferenced Raster Image. Technologies 2023, 11, 46. [Google Scholar] [CrossRef]
- Wessel, P.; Smith, W.H.F. Free software helps map and display data. Eos Trans. Am. Geophys. Union 1991, 72, 441–446. [Google Scholar] [CrossRef]
- Rahman, M.M.; Ghosh, T.; Salehin, M.; Ghosh, A.; Haque, A.; Hossain, M.A.; Das, S.; Hazra, S.; Islam, N.; Sarker, M.H.; et al. Ganges-Brahmaputra-Meghna Delta, Bangladesh and India: A Transnational Mega-Delta. In Deltas in the Anthropocene; Springer International Publishing: Cham, Switzerland, 2020; pp. 23–51. [Google Scholar] [CrossRef]
- Sousa, D.; Small, C. Land Cover Dynamics on the Lower Ganges–Brahmaputra Delta: Agriculture–Aquaculture Transitions, 1972–2017. Remote Sens. 2021, 13, 4799. [Google Scholar] [CrossRef]
- Paszkowski, A.; Goodbred, S.; Borgomeo, E.; Khan, M.S.A.; Hall, J.W. Geomorphic change in the Ganges–Brahmaputra–Meghna delta. Nat. Rev. Earth Environ. 2021, 2, 763–780. [Google Scholar] [CrossRef]
- Szabo, S.; Brondizio, E.; Renaud, F.G.; Hetrick, S.; Nicholls, R.J.; Matthews, Z.; Tessler, Z.; Tejedor, A.; Sebesvari, Z.; Foufoula-Georgiou, E.; et al. Population dynamics, delta vulnerability and environmental change: Comparison of the Mekong, Ganges–Brahmaputra and Amazon delta regions. Sustain. Sci. 2016, 11, 539–554. [Google Scholar] [CrossRef] [PubMed]


| Dataset Attribute | Attribute Value | Attribute Value | Attribute Value |
| Date Acquired | 7 March 2023 | 20 March 2022 | 17 March 2021 |
| Land Cloud Cover | 3.12 | 0.01 | 0.03 |
| Scene Cloud Cover L1 | 2.97 | 0.01 | 0.03 |
| Sun Elevation L0RA | 51.70012312 | 56.10505202 | 55.19368850 |
| Sun Azimuth L0RA | 134.86314148 | 129.90704446 | 131.01649112 |
| Satellite | 8 | 8 | 8 |
| Dataset Attribute | Attribute Value | Attribute Value | Attribute Value |
| Date Acquired | 26 November 2023 | 23 November 2022 | 28 November 2021 |
| Land Cloud Cover | 0.02 | 0.20 | 0.40 |
| Scene Cloud Cover L1 | 0.02 | 0.19 | 0.38 |
| Sun Elevation L0RA | 41.83496249 | 42.43660966 | 41.36291892 |
| Sun Azimuth L0RA | 154.44654325 | 154.42300606 | 154.52745495 |
| Satellite | 9 | 9 | 8 |
| Year | Classes of Land Cover Types in March Pixels: Ganges–Brahmaputra River Delta | |||||||||
|---|---|---|---|---|---|---|---|---|---|---|
| 1 | 2 | 3 | 4 | 5 | 6 | 7 | 8 | 9 | 10 | |
| 2021 | 717 | 252 | 434 | 758 | 1005 | 1035 | 758 | 744 | 927 | 219 |
| 2022 | 749 | 236 | 489 | 803 | 1030 | 1100 | 557 | 744 | 800 | 336 |
| 2023 | 707 | 343 | 1055 | 381 | 1032 | 997 | 702 | 649 | 796 | 180 |
| Year | Classes of Land Cover Types in November Pixels: Ganges–Brahmaputra River Delta | |||||||||
|---|---|---|---|---|---|---|---|---|---|---|
| 1 | 2 | 3 | 4 | 5 | 6 | 7 | 8 | 9 | 10 | |
| 2021 | 689 | 402 | 579 | 565 | 1228 | 1109 | 571 | 849 | 647 | 208 |
| 2022 | 700 | 468 | 365 | 587 | 1066 | 1048 | 683 | 942 | 683 | 326 |
| 2023 | 715 | 511 | 231 | 599 | 1351 | 1132 | 718 | 707 | 685 | 310 |
Disclaimer/Publisher’s Note: The statements, opinions and data contained in all publications are solely those of the individual author(s) and contributor(s) and not of MDPI and/or the editor(s). MDPI and/or the editor(s) disclaim responsibility for any injury to people or property resulting from any ideas, methods, instructions or products referred to in the content. |
© 2024 by the author. Licensee MDPI, Basel, Switzerland. This article is an open access article distributed under the terms and conditions of the Creative Commons Attribution (CC BY) license (https://creativecommons.org/licenses/by/4.0/).
Share and Cite
Lemenkova, P. Deep Learning Methods of Satellite Image Processing for Monitoring of Flood Dynamics in the Ganges Delta, Bangladesh. Water 2024, 16, 1141. https://doi.org/10.3390/w16081141
Lemenkova P. Deep Learning Methods of Satellite Image Processing for Monitoring of Flood Dynamics in the Ganges Delta, Bangladesh. Water. 2024; 16(8):1141. https://doi.org/10.3390/w16081141
Chicago/Turabian StyleLemenkova, Polina. 2024. "Deep Learning Methods of Satellite Image Processing for Monitoring of Flood Dynamics in the Ganges Delta, Bangladesh" Water 16, no. 8: 1141. https://doi.org/10.3390/w16081141
APA StyleLemenkova, P. (2024). Deep Learning Methods of Satellite Image Processing for Monitoring of Flood Dynamics in the Ganges Delta, Bangladesh. Water, 16(8), 1141. https://doi.org/10.3390/w16081141