Abstract
The study of two-stage partial nitrification–anaerobic ammonium oxidation (PN/A) reactors, which are advantageous in engineering applications, still lacks research on process kinetics. Therefore, in this study, the start-up performance and process kinetics of a two-stage PN/A reactor were evaluated by controlling the reaction conditions, for which the two reactors were inoculated with sludge, incubated separately, and then operated in tandem. Increasing the ammonia load of the reactor during the 60 d stabilization period resulted in a nitrogen accumulation rate of 96.93% and a [NO2− − N]Eff/[NH4+ − N]Eff ratio of 1.33, which is close to the theoretical value of 1.32. Successful initiation of the A reactor was achieved after 55 d of operation by inoculating with anammox-activated sludge and granular activated carbon, and the PN and A reactors then successfully operated in combination for 20 d, with an average NH4+ − N efficiency of 99.04% and the NH4+ − N load of the A reactor showing an “S-shaped” curve. An analysis of the microbial growth kinetic models indicated that the removal of NH4+ − N could be successfully described by the logistic, modified logistic, modified Gompertz, and modified Boltzmann models. A strong association between the model and the dependent variable was observed. The process kinetic analysis showed that the removal of NH4+ − N from reactor A could be simulated under steady-state conditions, using the Grau second-order model. The parameters obtained from the model analysis are expected to help predict the denitrification performance of the reactor, facilitate operational management and control, and thus provide a promising research basis for the introduction of automated control systems.
1. Introduction
Nitrogenous pollutants, which reach water bodies via the discharge of nutrients, have become ubiquitous in the aquatic environment, leading to eutrophication, ecosystem damage, and toxicological risk to human life [1]. Biological methods are important for controlling water pollution due to their high efficiency, durability, and lack of secondary pollution [2]. The coupled biological denitrification process of partial nitrification/anammox (PN/A) has become a key research target for biological treatment due to its high denitrification efficiency, with 60% less aeration required and 90% excess activated sludge [3]. However, partial nitrification can eliminate ammonia-oxidizing bacteria (AOB) while retaining nitrite-oxidizing bacteria (NOB) by controlling factors such as temperature and hydraulic residence time. AOB dominates the conversion of NH4+ − N to NO2 − N [4], and anammox is a biological reaction in which anaerobic AOB (AnAOB) uses NH4+ − N as an electron donor and NO2− − N as an electron acceptor to produce N2 and a small amount of NO3− − N under anaerobic conditions [5,6]. The effectiveness of PN/A processes in treating wastewater with high ammonia nitrogen content, such as waste leachate [7], farming wastewater [8], municipal wastewater [9], and sludge digestate [10], has been widely studied, with results suggesting certain economic advantages in using the method [11].
PN/A process applications are mainly one- or two-stage [12], with one-stage PN/A accounting for over 80% of PN/A processes worldwide [13]. Although research focus and applications tend to favor one-stage PN/A due to its smaller and more economical footprint [14], two-stage PN/A has greater potential for tighter control, a shorter start-up time, and reduced inhibition [15]. For influent wastewater with large variations in terms of water quality and quantity, the two-stage type is associated with greater advantages, such as the front-end PN section acting as a buffer and separate optimization of the PN/A process [16,17].
Studies investigating the start-up of two-stage PN/A have generally focused on the start-up effects and microbial characteristics [18], with few scholars focusing on the kinetics or attempting to simulate the startup and operation processes of the PN/A reactor, and even fewer focused on the narrowly applied two-stage PN/A reactor. The aim of this study was thus to analyze the start-up performance and system kinetics of a two-stage PN/A reactor, determine a kinetic model that is consistent with the observed results, and provide a reference for the start-up conditions and environmental control of the reactor in practical applications. The results are expected to facilitate better prediction, management, and optimization of the two-stage PN/A reactor.
2. Materials and Methods
2.1. Experimental Setup
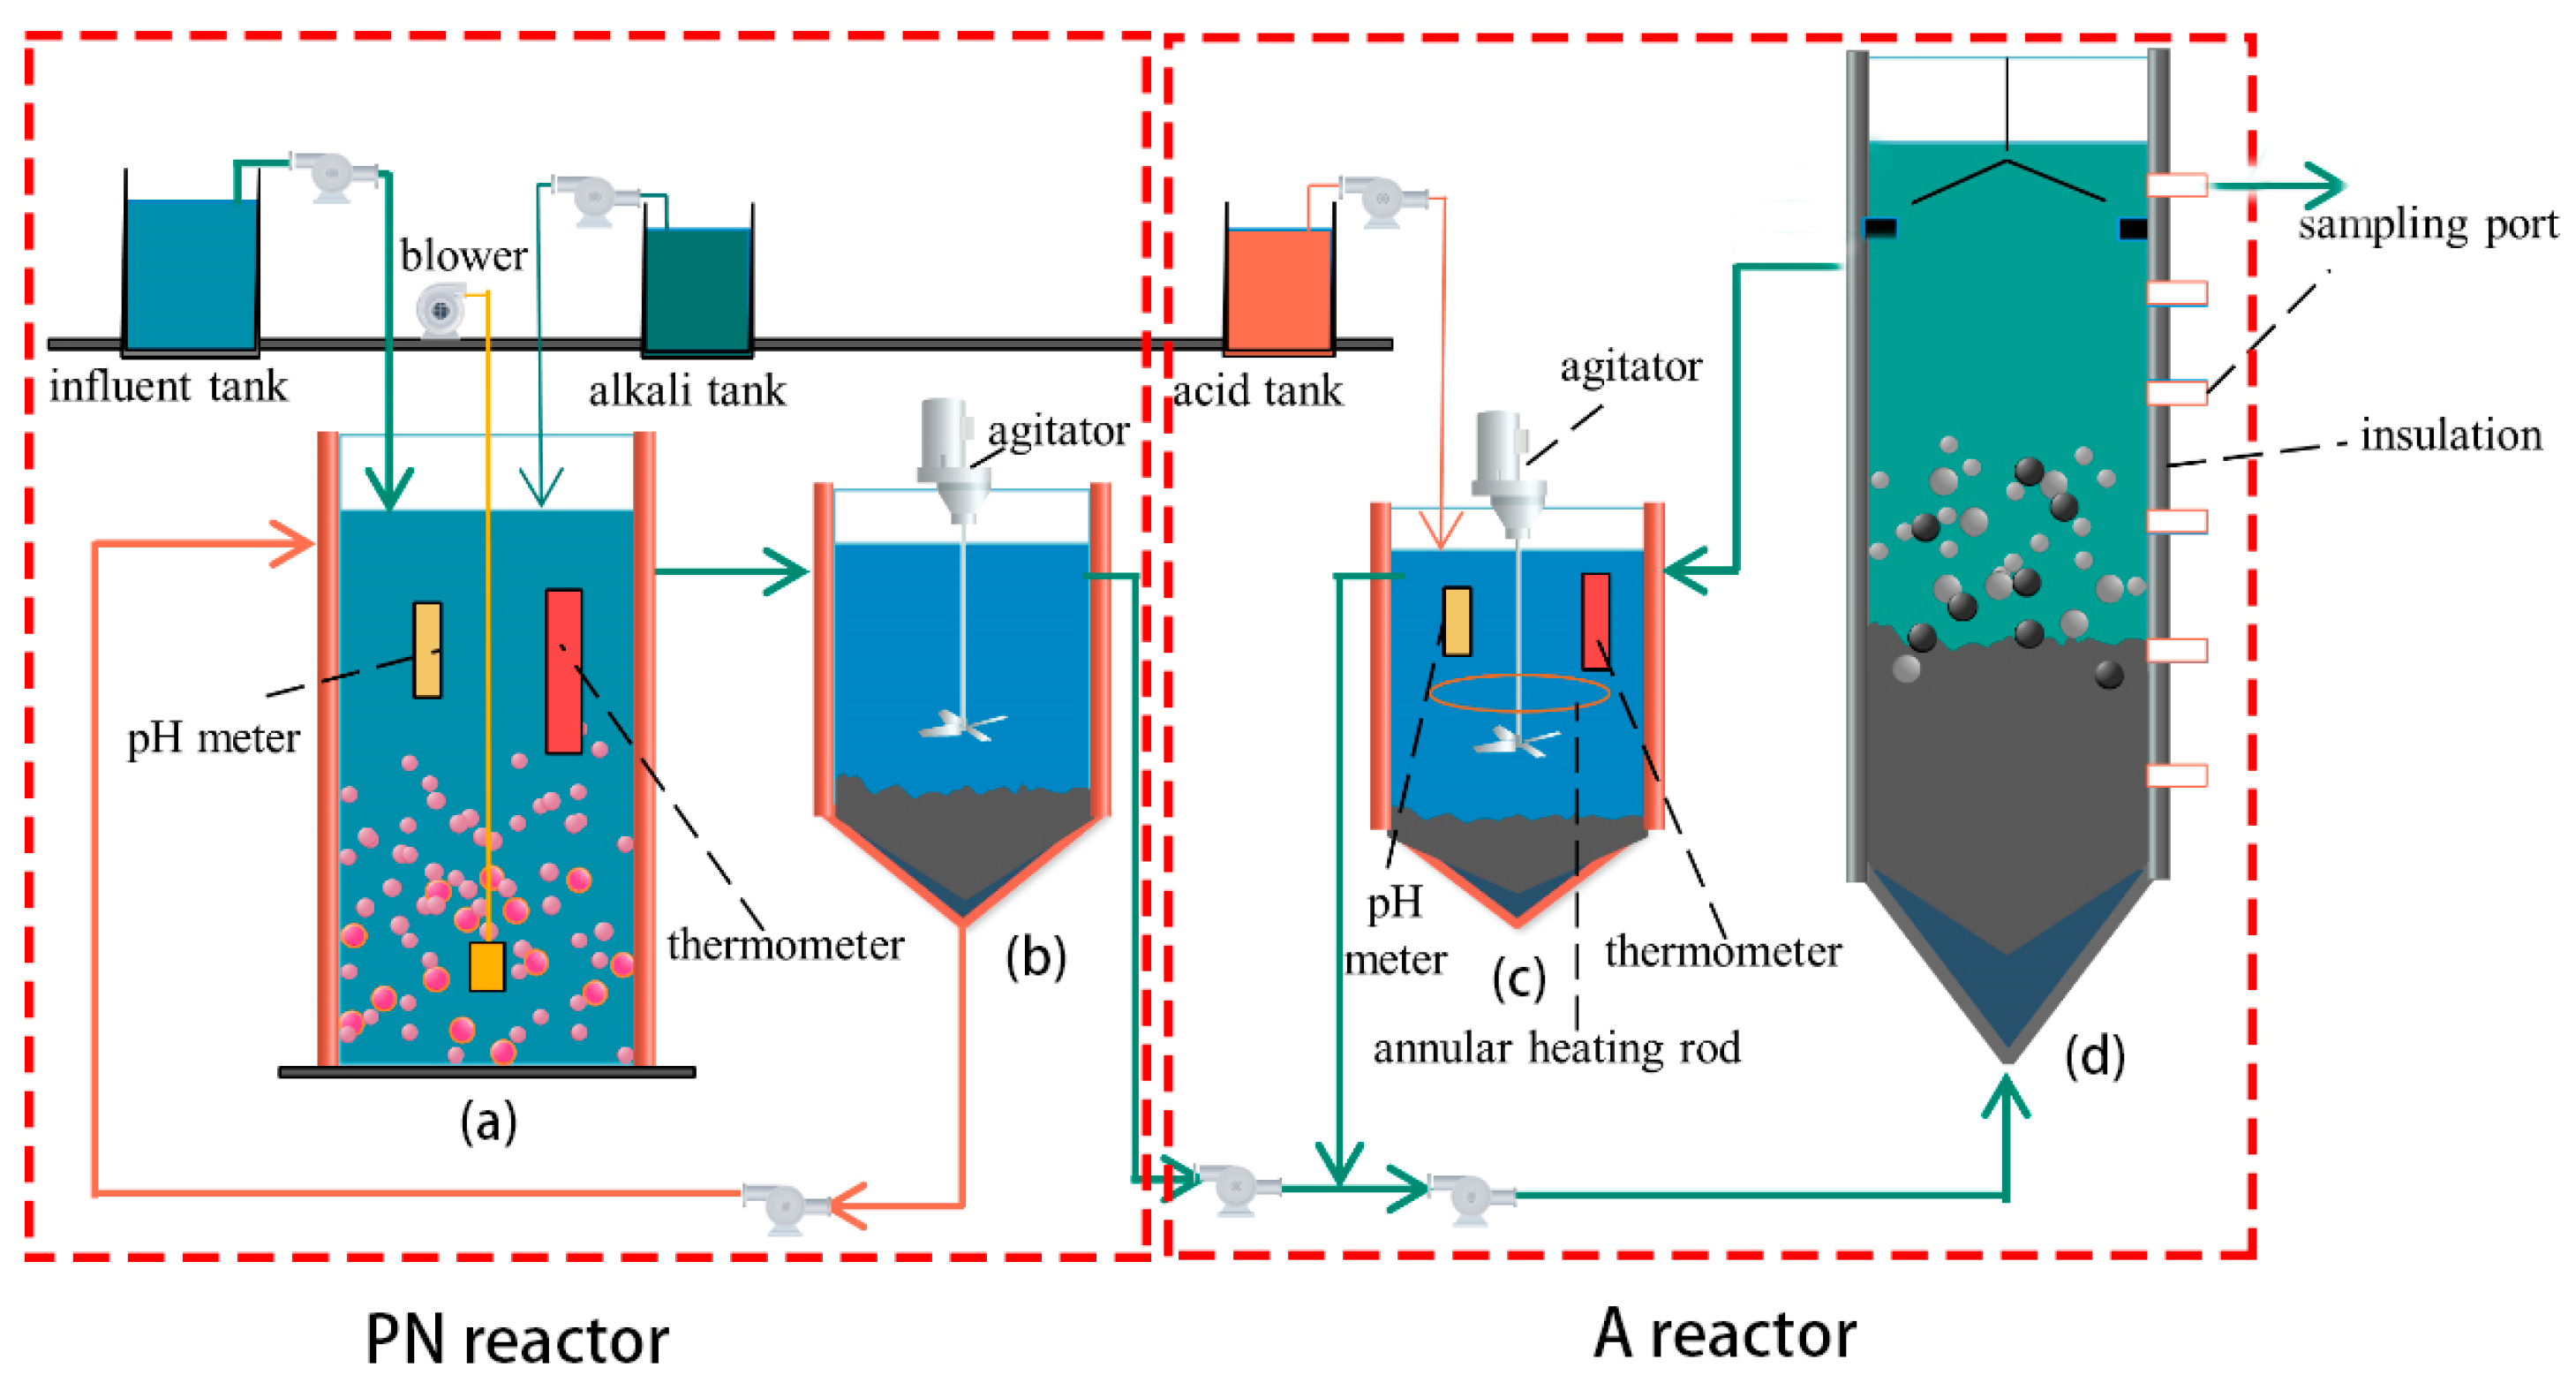
The experimental setup was divided into two parts: partial nitrification (PN section) and anammox (A section), as shown in Figure 1. The PN section consisted of aerobic and sedimentation tanks, while the A section consisted of a pH adjustment tank and a UASB reactor. All reaction bodies were composed of organic glass. The volumes of the aerobic and sedimentation tanks were 9 and 8 L, respectively. Water was fed from the upper end of the aerobic tank, which was equipped with pH poles, temperature heating rods, and aeration heads to control the pH, temperature, and dissolved oxygen (DO), respectively. The volumes of the pH adjustment sedimentation and UASB tanks were 14.3 and 61 L, respectively. Water from the sedimentation tank was mixed with the temperature- and pH-adjusted water from the pH-adjustment tank and fed to the UASB tank from the bottom. The total effective volume of the reactor was 61 L, the sampling port was set on the right side, and the outer wall was insulated with thermal insulation material.
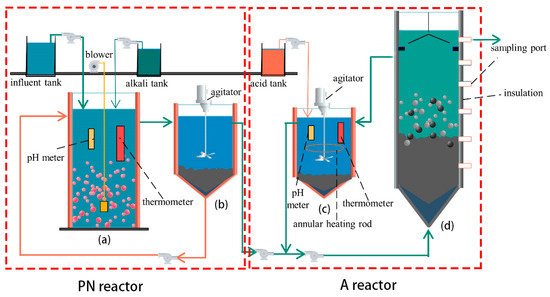
Figure 1.
Diagram of a PN/A reactor: (a) the aerobic reactor, (b) the settling basin, (c) the pH-regulating tank, and (d) the UASB reactor.
2.2. Experimental Water and Inoculated Sludge
Cultivation was performed separately during the reactor start-up and load-raising phases, with water dispensed separately into the PN and A reactors until both reached the ideal operating load. The two reactors were then connected in series. This method reduces the difficulty that is associated with cultivation and improves the cultivation efficiency, while reducing the likelihood that the two reactors will interfere with each other during early cultivation, thus increasing the start-up time.
PN section reactor: Tap water was used in preparing the experimental water, thus avoiding interference from random bacteria, and the concentration of [NH4+ − N]Inf was 500 mg/L. Specific data are represented in Table 1.

Table 1.
Simulated influent compositions.
A-section reactor: Similar to the PN reactor, (NH4)2SO4 (Sinopharm Chemical Reagent Co. Ltd., Shanghai, China) and NaNO2 (Sinopharm Chemical Reagent Co. Ltd., Shanghai, China) were prepared at the required concentrations. KH2PO4 (Sinopharm Chemical Reagent Co. Ltd., Shanghai, China) was used to adjust the pH of the feed water. KHCO3 was added at 1500 mg/L, CaCl2-7H2O at 226.6 mg/L, MgSO4-7H2O at 200 mg/L, and Na2S2O3 at 24.81 mg/L. Trace elements: The dosages and compositions of the trace elements were consistent with those in the PN section.
- Inoculated sludge:
Activated sludge for use in the aerobic tank of the PN reactor was obtained from CASS tank No. 1 at the YanShan town wastewater treatment plant in the Guangxi Zhuang autonomous region. Impurities and debris were screened, and sediment was removed after resting and settling to improve the inoculated sludge concentration, thereby improving adaptation to the [NH4+ − N]Inf concentration.
Anaerobic ammonia oxidation-activated sludge from the research laboratory of Professor Furukawa at Kumamoto University, Japan, was used in the UASB tank of the A-section reactor. Treated granular BC, which was obtained by hammering bamboo charcoal to a particle size of approximately 1–2 mm, washing with distilled water, and soaking overnight before removing all liquid, was mixed with the sludge before cultivation for rapid enrichment with anaerobic ammonia-oxidizing bacteria. Color changes that are associated with anaerobic ammonia-oxidizing bacteria were observed in the resulting granular sludge.
A-section reactor’s parameters: Pool temperature was controlled to within 35 ± 1 °C, using a ring heating rod; pH was controlled at 7.5–7.6 by adding acidic solution; and aeration of inlet water was obtained using 99% high-purity nitrogen. A small amount of anhydrous sodium sulfite was added to maintain the DO concentration of the inlet water below 0.1 mg/L.
2.3. Analysis Methods
2.3.1. Water Quality Analysis
The pH was determined using a pH meter (PHS-3C, INESA, Shanghai, China). The mixed liquor suspended solid concentration (MLSS) and mixed liquor volatile suspended solid concentration (MLVSS) were measured by weight. NH4+ − N, NO2−N, and NO3− − N were measured using a continuous flow analyzer (Skalar Co. Ltd., Breda, Netherlands), and regular measurements of DO and temperature were obtained using a portable dissolved oxygen Meter (Hach Co. Ltd., CO, USA) and a thermometer, respectively.
2.3.2. Data Analysis
The free ammonia (FA), nitrogen accumulation rate (NAR), ammonia conversion efficiency (ACE), ammonia load (NLR), and settling velocity (SV) were calculated using the following equations (Equations (1)–(4)).
where is the effluent concentration of ; is the effluent concentration of ; is the effluent concentration of ; is the influent concentration of ; Q is the intake volume; T is the temperature of the reactor; and H is the settlement height.
3. Discussion
3.1. PN Section Reactor Start-Up
The NLR was added during the operation of the PN section reactor to improve the cultivation of the activated sludge, improving its capacity for treating high-ammonia-nitrogen wastewater, while increasing the concentration of FA to screen AOB and eliminate NOB. Complete NOB and AOB activity inhibition has been reported at FA concentrations of >0.6 and 10 mg/L, respectively [19]; however, severe inhibition of AOB activity occurs only at FA concentrations > 40 mg/L. Because FA concentration inhibits AOB at greater concentration ranges than NOB, nitrite accumulation could be successfully screened and enriched if the FA concentration was controlled within a reasonable range. As shown in Figure 2, the PN section reactor was operated for 60 d and was able to meet the semi-nitrification and feed water requirements for subsequent anaerobic ammonia oxidation. Acclimation was performed for 1–3 d, load ramp-up for 4–40 d, and stabilization for 40–60 d.
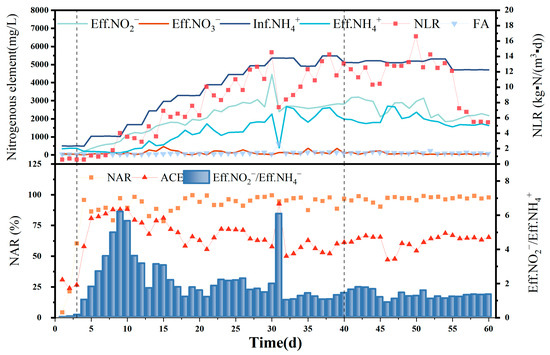
Figure 2.
Ammonia nitrogen in influent and effluent; nitrite nitrogen in the effluent; nitrate nitrogen in the effluent; and NLR, FA, NAR, and ACE during 60 d PN operation.
Because 500 mg/L of that was used during the adaptation period was much higher than that in the domestic sewage that was treated with activated sludge, the removal of was not effective, and only 25–30% of the was converted to NO3− − N and NO2− − N. [NO3− − N]Eff was greater than [NO2− − N]Eff because only HCO3, an inorganic carbon source, was available in the artificially prepared water.
The ratio of nitrate to nitrite in the effluent reached 1, and the NAR reached 92.74% on day 4 of the load-boosting period, indicating that the conversion rate of ammonia nitrogen exceeded 50% and that the activated sludge in the plant had adapted to the 500 mg/L [NH4+ − N]Inf concentration. Therefore, from the fourth day onwards, [NH4+ − N]Inf was added every 2–5 d to load the influent until the reactor was upgraded to the highest [NH4+ − N]Inf of 5496.48 mg/L. Although fluctuations were observed in the [NO3− − N]Eff and [NO2− − N]Eff content during this period, a gradually increasing water nitrite-nitrogen concentration trend was still evident overall, while [NO3− − N]Eff was maintained at a low level. An obvious inflection point for [NO3− − N]Eff and [NH4+ − N]Eff on day 31 was due to damage to the influent pump, with the sudden decrease in influent water leading to a corresponding decrease in the FA concentration and reduced AOB and NOB inhibition. However, a significant increase was observed only in the [NO2− − N]Eff levels, indicating a significant advantage for the AOB volume in the water column, along with a higher degree of nitrification.
According to Li et al. [20], the concentration of HCO3− during short-course nitrification can improve the conversion of ammonia nitrogen and show a significantly increase [NO2− − N]Eff in the short term. Therefore, the short-range nitrification reaction was connected to the anammox reactor in the follow-up experiments, and the alkaline solution was changed to NaOH on the 55th day, allowing the ammonia load in the short-range nitrification reactor to reach approximately half that of the previous level, with the ammonia nitrogen concentration in the reactor effluent similar to that of the effluent nitrite nitrogen. The method provides sufficient amounts of the reaction substrate, NH4+ − N, for subsequent anaerobic ammonia oxidation. As shown in Figure 2, after the NAR reached 95.81% on day 4, it remained high as the ammonia load increased, albeit with certain fluctuations. A NAR of <90% was observed on only 14 of the 60 d that followed start-up, with the NAR reaching 96.93% and the [NO2− − N]Eff/[NH4+ − N]Eff ratio being 1.33, which is close to the theoretical value of 1.32, during the stabilization period. This indicates high nitrite accumulation over some time, with the AOB completely eluting the NOB, indicating effective and successful nitrification.
3.2. A-Section Reactor Start-Up
The UASB process was selected for the A-section reactor. The feasibility of this process for treating high-concentration ammonia-nitrogen wastewater has been proven previously [21]. The addition of granular activated carbon accelerates the formation of granular sludge from AnAOB, which grows in granular form and is considered a suitable and promising method for anaerobic ammonia oxidation [22]. The laboratory scale-activated sludge AnAOB was used for 55 d, during which time the [NH4+ − N]Inf and [NO2− − N]Inf concentrations were gradually increased, with the highest influent concentrations reaching 745.8 mg/L and 597.7 mg/L, respectively. The NLR reached 4.3 kg-N/m3/d, and the concentrations of reactor [NH4+ − N]Eff and [NO2− − N]Eff concentrations is maintained at a low concentration throughout the 55 d-phase. In particular, maintaining the [NO2− − N]Eff concentration below 10 mg/L prevented the high [NO2− − N]Eff from inhibiting the activity of the bacterial strains. The reactor was observed to operate stably with only one load shock. Adaptation was performed over 1–3 d, load boosting over 4–45 d, and stabilization over 45–55 d.
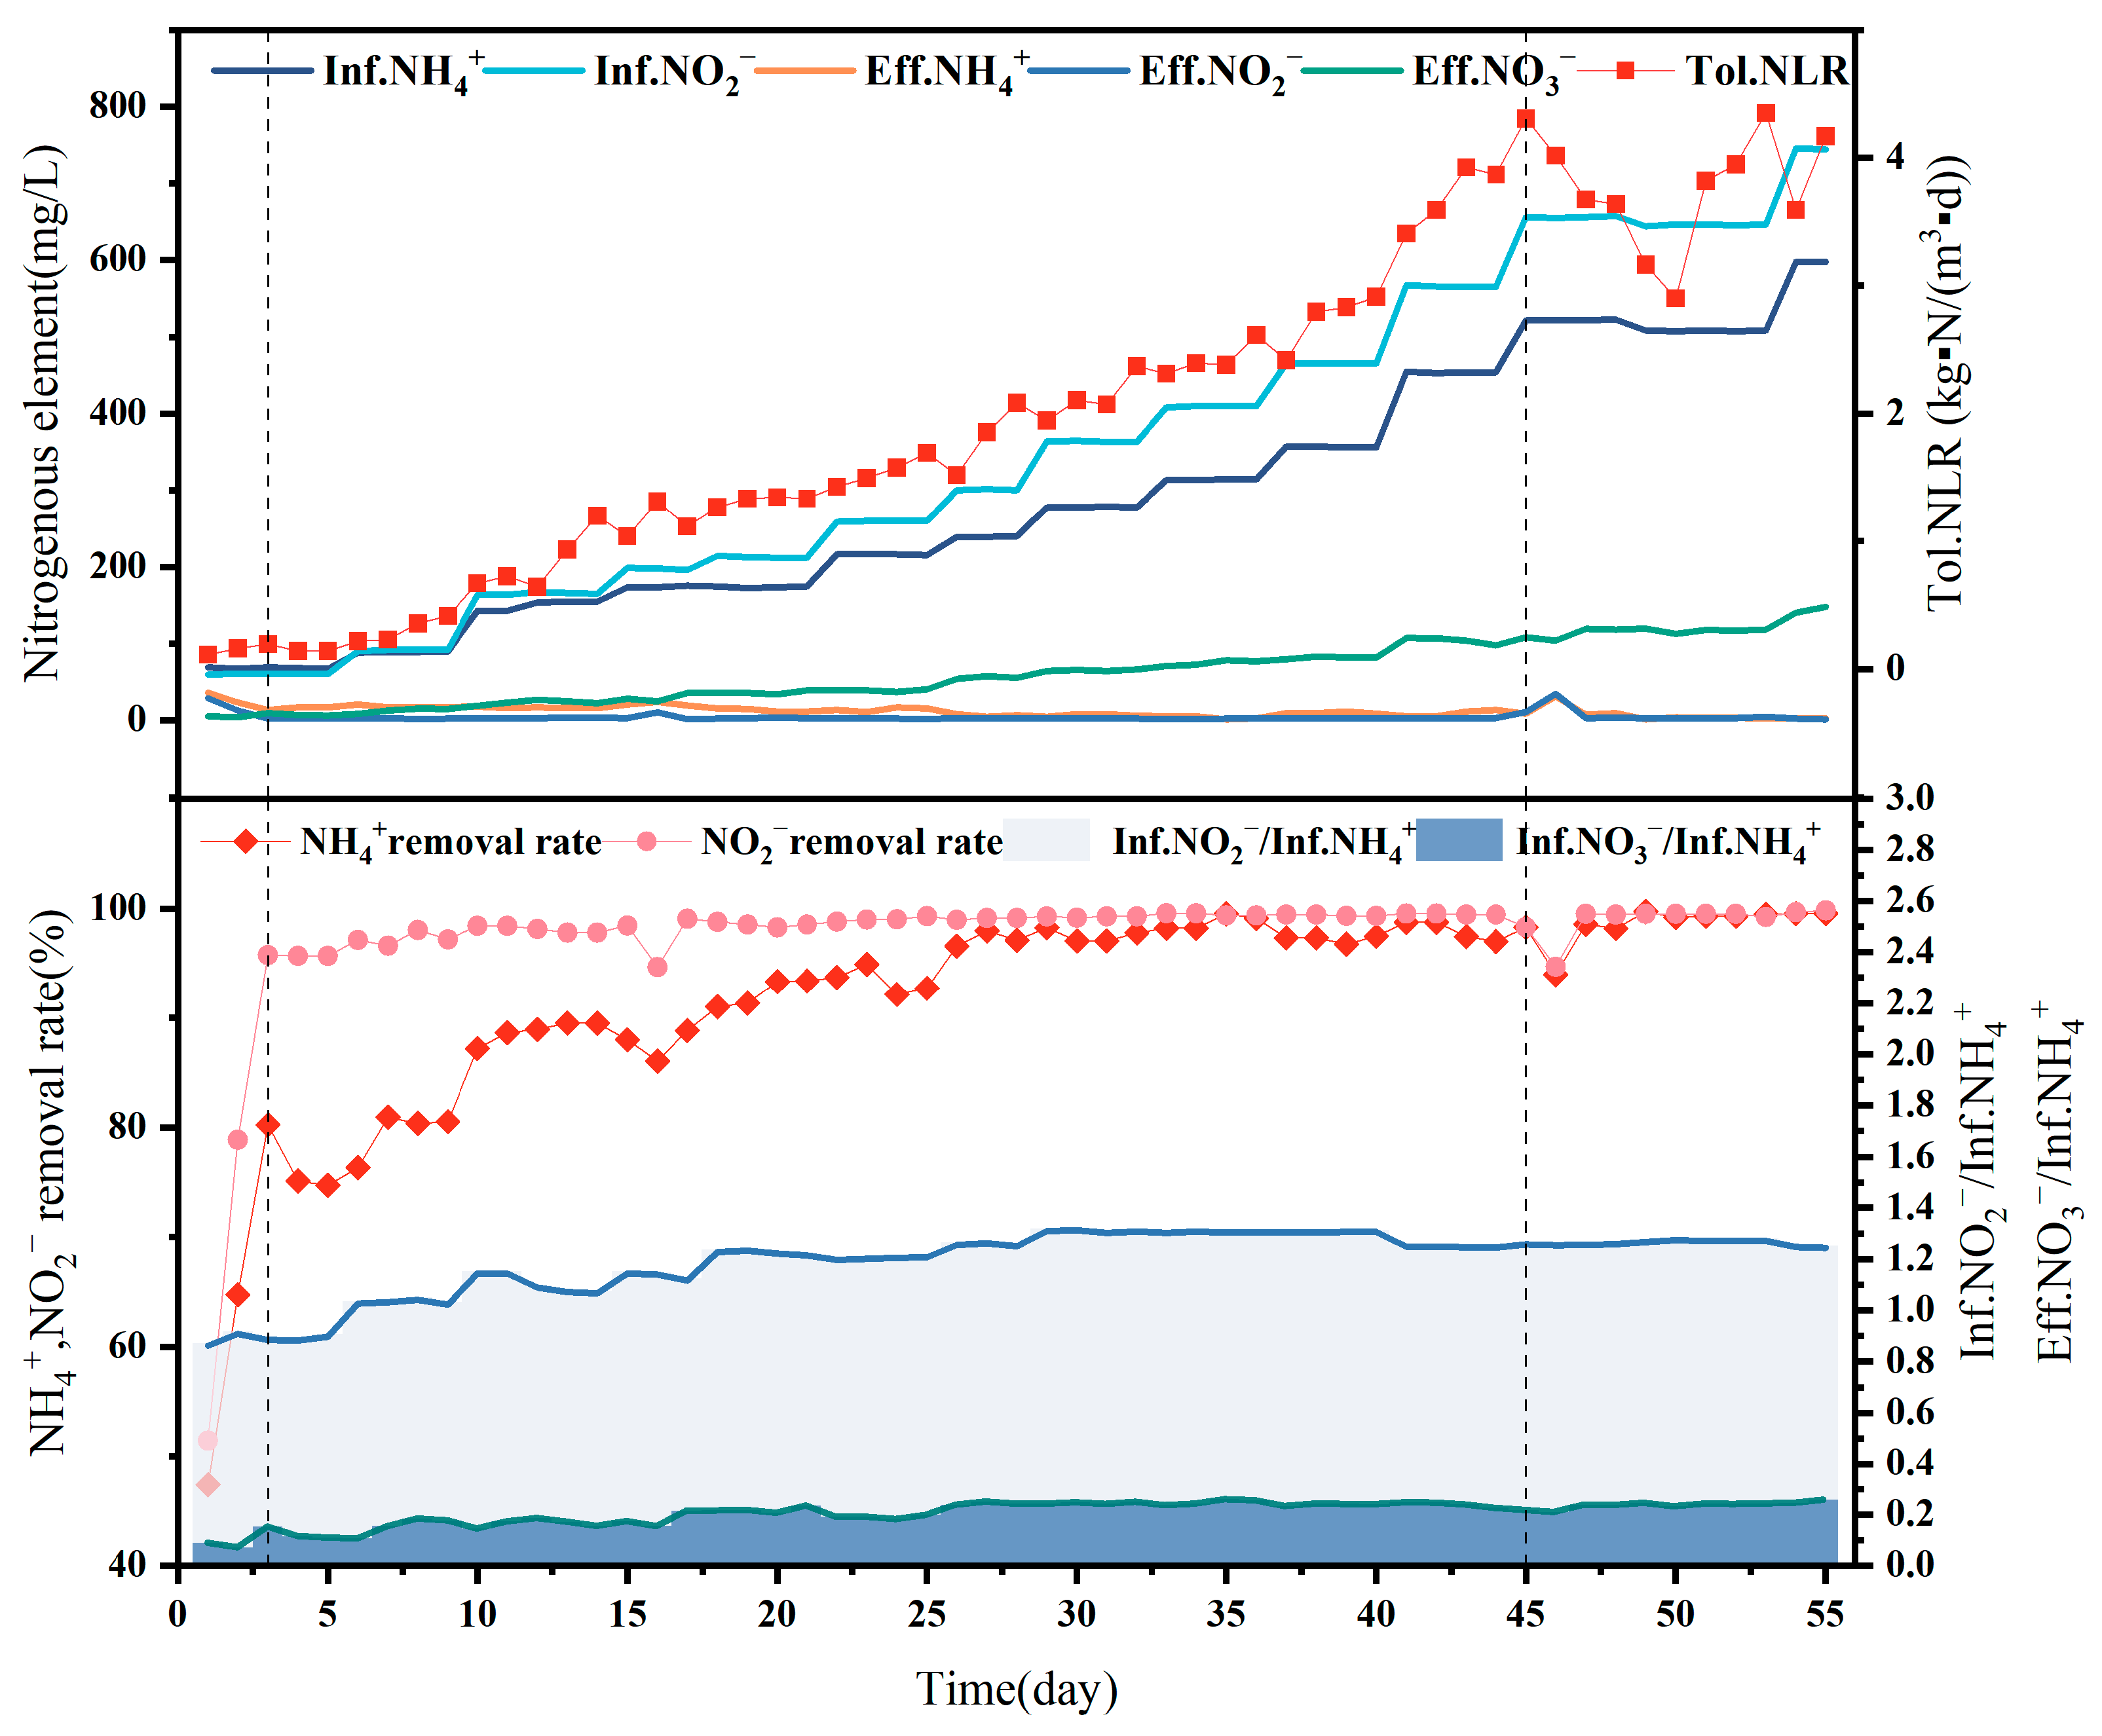
The effluent that was present within the reactor on day 1 was not effective during the start-up period because the strictly anaerobic AAOB strains require a certain adaptation period following transferal and are exposed to oxygen during the process, rendering them inactive [23,24]. In addition, the 60 L reactor is six times larger than the previous laboratory-scale reactor in terms of volume. To ensure the same concentration, more activated carbon particles were added to the reactor; however, the lack of microbial attachment to the newly added activated carbon particles rendered culture necessary. The effluent effect was observed to improve over two consecutive days from the second day, with the [NH4+ − N]Eff decreasing to 17.3 mg/L and the [NO2− − N]Eff to 1 mg/L, indicating that the strain was fully suitable for the new reactor and the load could be increased. The content of Figure 3 shows the internal reactor changes during the startup phase of A-section reactor. The upper graph shows A-section reactor influent ammonia nitrogen, influent nitrite, effluent ammonia nitrogen, effluent nitrite, effluent ammonia nitrogen and ammonia load. The lower graph shows the ammonia conversion rate, nitrite conversion rate, influent ammonia/nitrogen/nitrite ratio, and nitrate-nitrogen conversion rate within the reactor during the startup phase of A-section reactor.
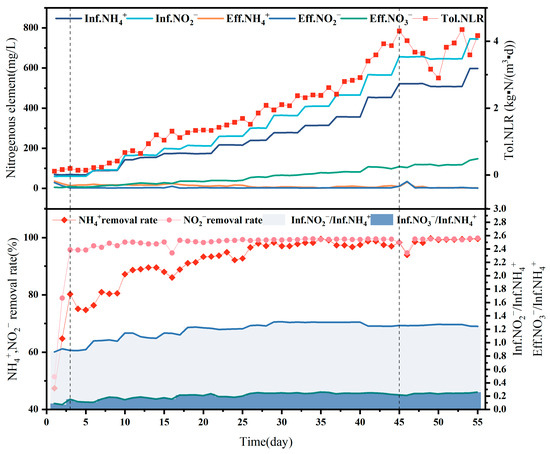
Figure 3.
This figure shows the internal changes in reactor A at the start-up stage. The above diagram shows InfNH4+, InfNO2−, EffNH4+, EffNO2−, EffNO3− and TolNLR of the reactor. In order to start reactor A, the ammonia load in the reactor was gradually increased during the start-up stage: that is, the daily influent ammonia nitrogen and influent nitrous oxide were gradually increased. The effluent ammonia nitrogen and nitrous oxide remained at a low level, and the effluent nitrate nitrogen increased with the increase in the load. The following figure shows the [NH4+] removal rate, [NO2−] removal rate, [InfNO2−/InfNH4+] of influent water and [InfNO3−/InfNH4+] in reactor A at the start-up stage. As shown in the figure, the [InfNO3−/InfNH4+] gradually increases with the start-up process, and [InfNO2−/InfNH4+] gradually approaches the same level.
Stabilization period: Loading was steadily upgraded from day 4 to 45, at which point an inflection point appeared in the reactor when the ammonia nitrogen load reached the maximum value of 4.3 kg-N/m3/d. The reactor began to show blockage from the activated carbon particles on day 46, with immediate deterioration observed in the effluent water quality. To avoid excessive high-water nitrite-affecting activity, the blockage problem was solved, and the load was slowly reduced to 3 kg-N/m3/d to extend the hydraulic residence time, followed by a slow restoration to 4.3 kg-N/m3/d. This technique was observed to protect the strain activity to the maximum extent, with the reactor returning to its original performance and stable operation maintained after a week of buffering.
The anammox reaction equation is represented by the following equation [25]:
As seen in the formula, [NO3− − N]Eff increases as [NH4+ − N]Inf and [NO2− − N]Inf in the influent water increase. This is because, for every 1 mol/L of NH4+ − N consumed in the anammox reaction equation, 1.32 mol/L of NO2− − N and 0.26 mol/L of NO3− − N are theoretically produced [26,27]. A certain reactor load can be used to appropriately reduce the influent ammonia nitrogen and nitrite nitrogen concentrations while shortening the hydraulic retention time to increase the load from the side, meaning that the effluent nitrate nitrogen concentration and total nitrogen content can be reduced with the premise of ensuring the load.
NH4+ − N removal rate: As [NH4+ − N]Inf increased, and [NH4+ − N]Eff decreased, indicating the good treatment effect of the reactor. The increase in [NH4+ − N]Inf from 68.8 mg/L at the beginning to a maximum of 597.7 mg/L was accompanied by a decrease in [NH4+ − N]Eff, from 40.3 mg/L to about 5 mg/L during the stabilization period, at which point an NH4+ − N removal rate of approximately 98% was observed, with a maximum of 99.3%.
NO2− − N removal rate: NO2− − N removal was maintained at approximately 99%, except during the pre-startup and pipe-blockage periods. The [NO2− − N]Inf increased from 64.5 mg/L to 745.8 mg/L, with anammox treatment of the NO2− − N wastewater leading to a [NO2− − N]Eff of only 1–2 mg/L, indicating particularly strong anammox treatment ability. These results indicate strong activity for the anaerobic ammonia-oxidizing bacteria, with outstanding treatment capacity.
As shown in Figure 3, the ratio of [NO2− − N]inf/[NH4+ − N]inf in the reactor ranged from 1.22 to 1.35, while the ratio of [NO3− − N]Eff/[NH4+ − N]Eff ranged from 0.17 to 0.26, remaining at approximately 0.25 during stabilization. The reaction ratio in this reactor was not stable but fluctuated, which may be because the conditions under actual operation differ from those in the laboratory. Many variables affect the actual reaction process, and the regulation of the reaction conditions cannot be realized instantaneously. Secondly, the microbial community in the reactor is not singular, and a small number of other microorganisms may be involved in substrate removal within the reactor. Chen [28] suggested that the slow proliferation of anaerobic anammox bacteria means that part of the reaction substrate is likely consumed by other miscellaneous bacteria in the anammox reactor, which is the same as the data analysis results obtained in this experiment. These factors can lead to an imbalance in the ammonia nitrogen and nitrite nitrogen removal ratios of the influent material, which fluctuates around the theoretical value of 1.32. However, in general, the proportion observed in the reactor is still in line with the proportion of anaerobic ammoxidation bacteria, indicating that anaerobic ammoxidation is the main reaction occurring within the reactor.
3.3. Joint Operation
Due to the strong sludge activity described in Section 2.1, the influent ammonia nitrogen concentration was reduced to 300 mg/L. The PN section effluent was then directly used as the A-section influent, and the two operated jointly to observe the effluent effect of the combined process.
3.3.1. Partial Nitrification Stage
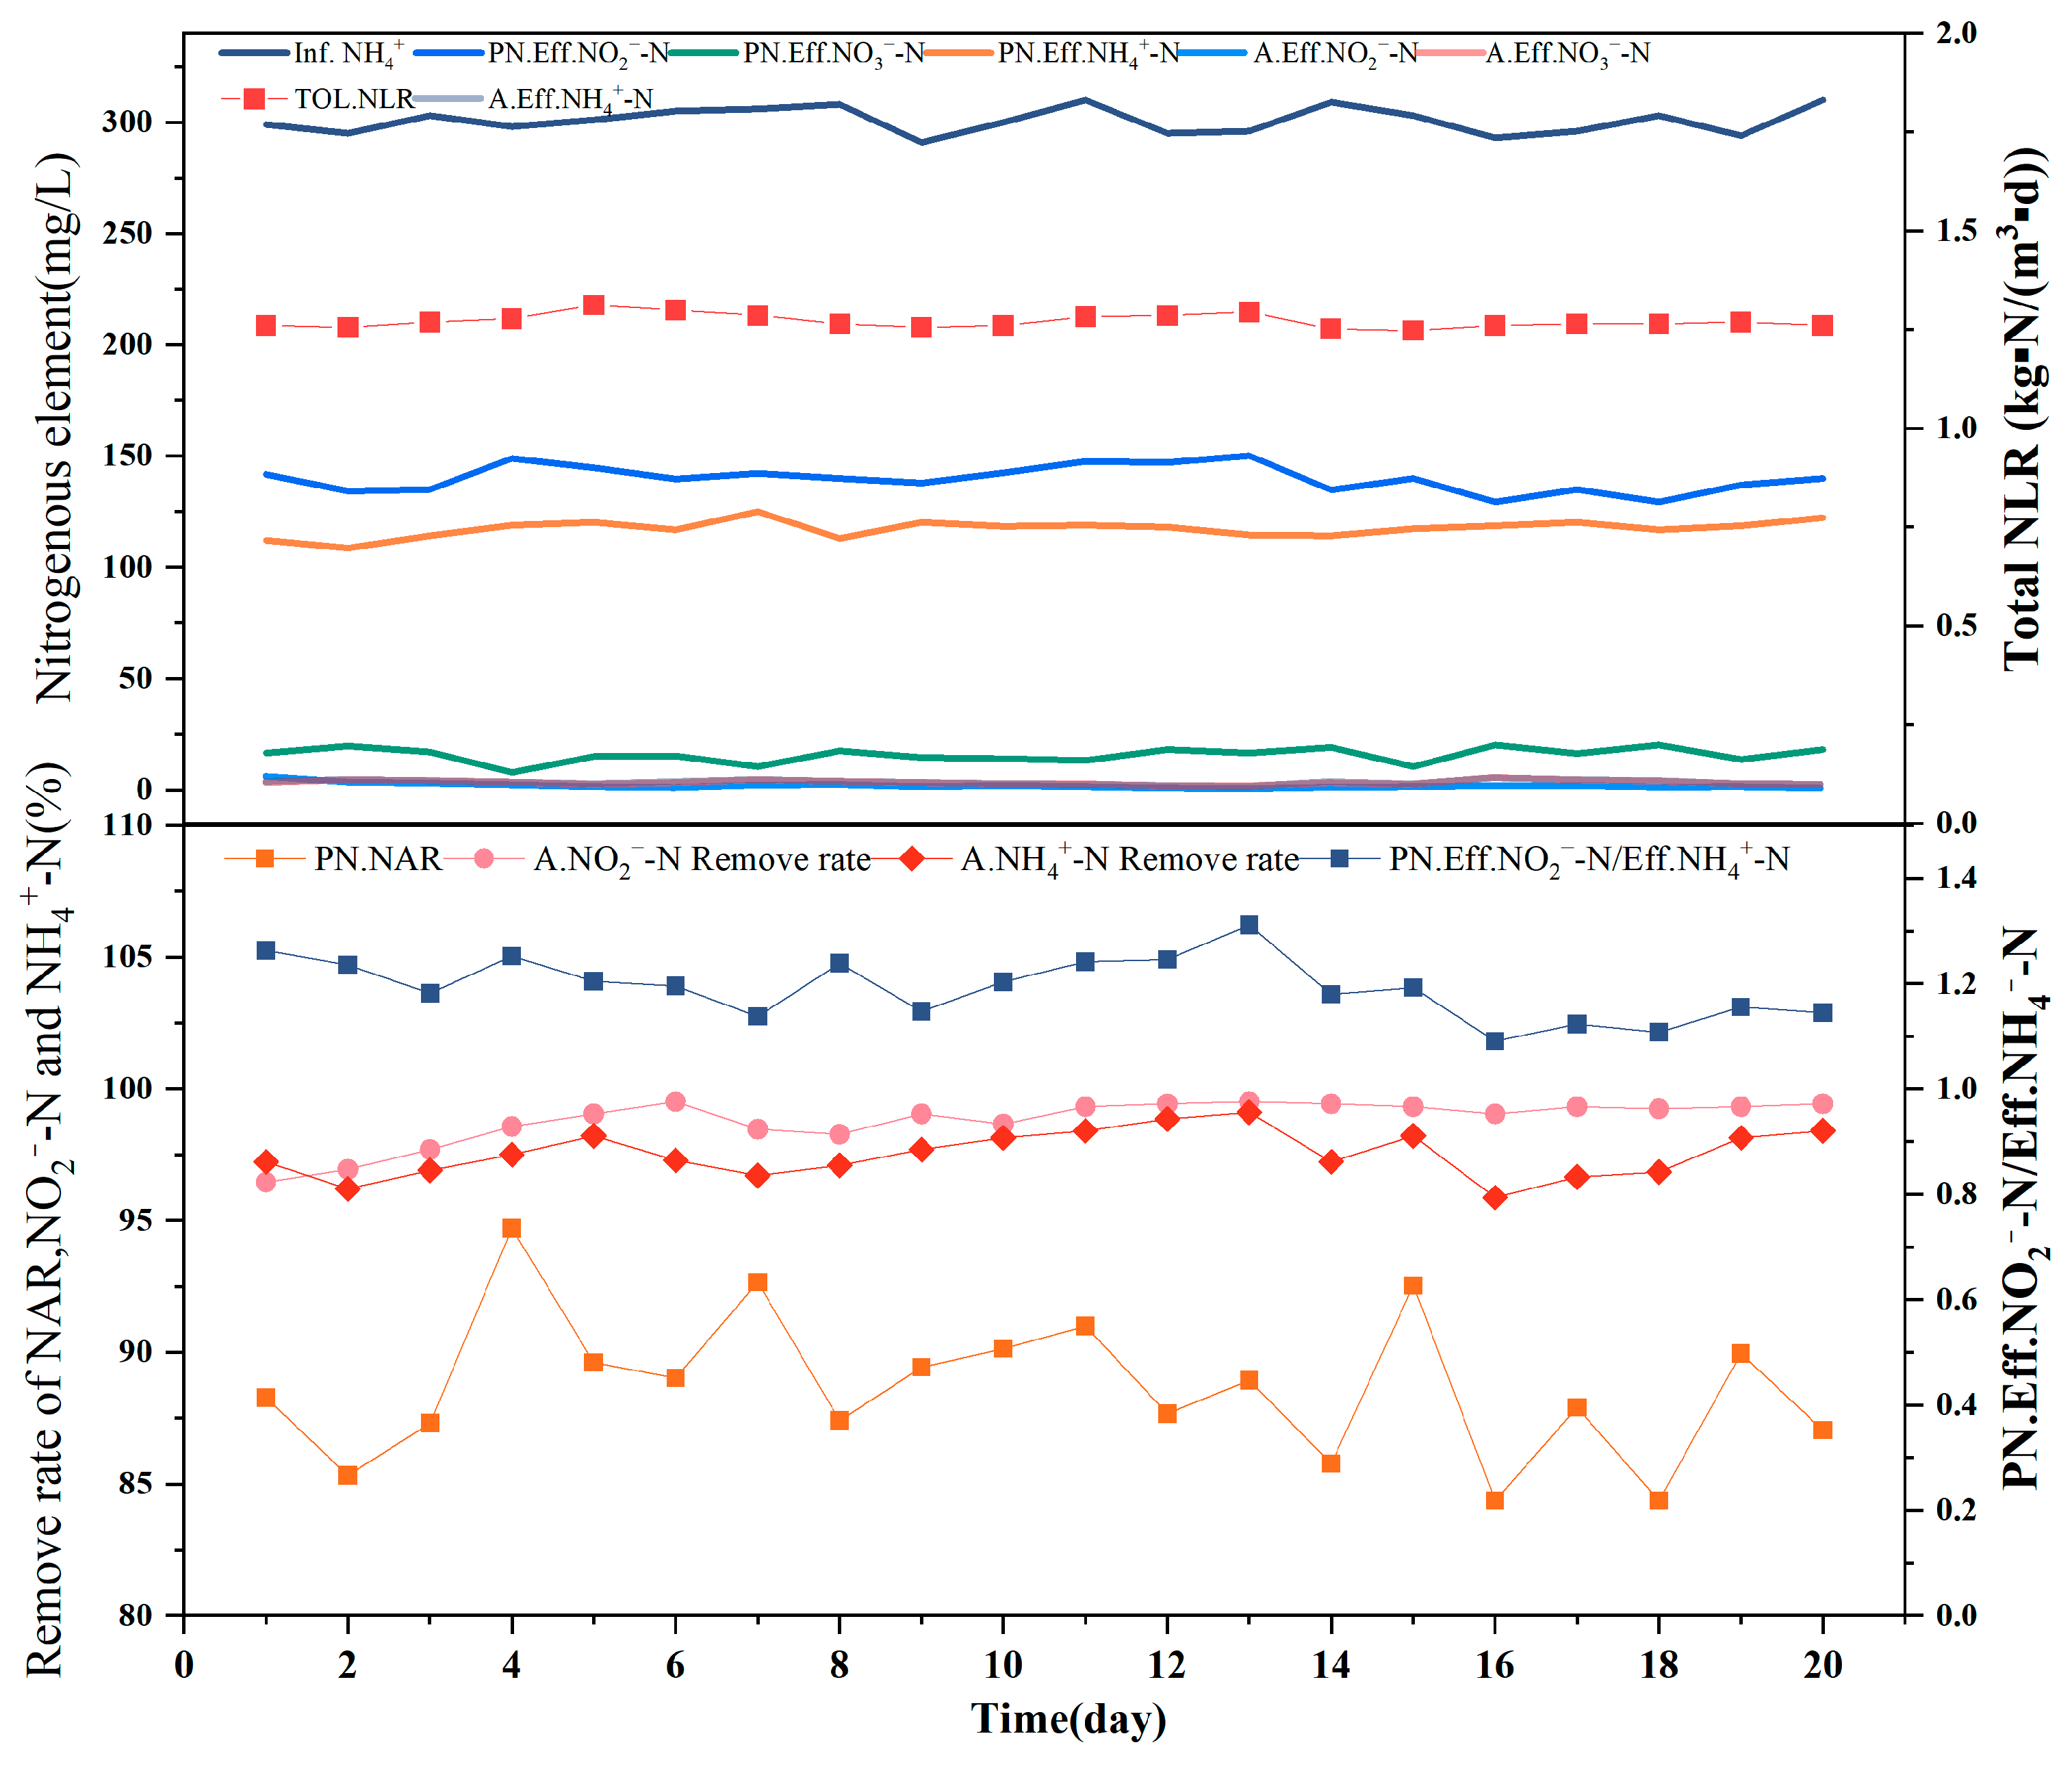
The combined process was operated for 20 d, with no obvious inflection points observed. The [NH4+ − N]Inf of approximately 300 mg/L in the PN reactor was associated with a [NH4+ − N]Eff of 105–125 mg/L, [NO2− − N]Eff of 130–150 mg/L, and [NO3− − N]Eff of 5–20 mg/L, indicating that the nitrogen reached the effluent, which acted as influent for the anammox stage. Anammox requires a strict theoretical substrate concentration ratio of NO2− − N:NH4+ − N = 1:1.32, and the similarity of the obtained ratio to the theoretical value is an important indicator of whether the next step of anaerobic ammonia oxidation will proceed normally. The ratio of nitrite nitrogen to ammonia nitrogen in the effluent of approximately 1.2 for the PN reactor thus satisfied the partial nitrification effluent requirements, indicating the good performance of the reactor and the quality of the influent water, with an average NAR of 88.67% and the highest value of 94.70% indicating sufficient nitrite for the subsequent anammox reaction.
3.3.2. Anammox Stage
The partial-nitrification effluent entering the reactor was best treated by the medium-efficiency anammox reactor, in which [NO3− − N]Eff was maintained below 5 mg/L and [NO2− − N]Eff below 5 mg/L. The results indicated that the reactor operated well in the latter stage of the anammox process and that it could therefore be connected to the partial nitrification reactor in the former stage. The removal rates of NH4+ − N and NO2− − N in the later anammox stage were stable, with the removal rate of NH4+ − N remaining at >96% and the removal rate of NO2− − N stable at approximately 99% for a long period. The TN removal rate of the reactor was stable at above 80%, and compared to the artificial water distribution, the semi-nitrosated effluent of short-range nitrification contained approximately 20 mg/L of nitrogen in the form of nitrate. As seen in Figure 4, the increase in the nitrate nitrogen concentration did not affect treatment in the anammox stage. The ratio of nitrite nitrogen to ammonia nitrogen consumed was approximately 1.2, whereas the ratio of generated nitrate nitrogen to ammonia nitrogen consumed was approximately 0.22. This indicates that the high-efficiency anammox reaction achieved a good removal from the semi-nitrosated effluent during the partial nitrification stage.
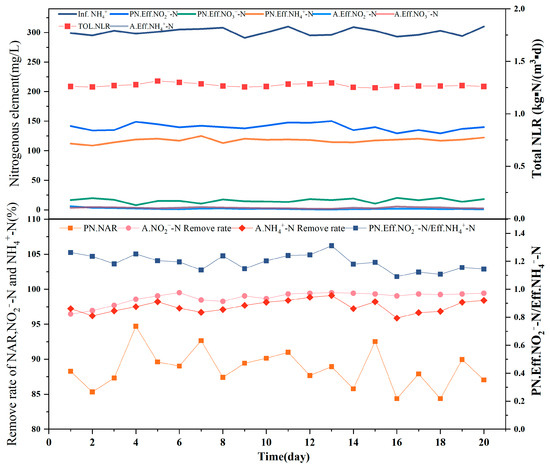
Figure 4.
This graph shows the reaction data for 20 days of combined operation of the reactor. The above figure shows [InfNH4+] of the reactor; [Eff NH4+], [EffNO2−], and [EffNO3−] of the PN reactor; [EffNO2−] and [EffNO3−] of the A reactor; and [TolNLR] of the combined reactor. The following figure shows the NAR and [EffNO2−/EffNH4+] of the PN reactor and the [NH4+] removal rate and [NO2−] removal rate of reactor A.
3.4. Growth Kinetics Analysis
The start-up process of a microbial reactor involves the growth, reproduction, and expansion of the functional microorganisms, with microorganisms adapting to their environment during start-up and propagation and expansion occurring during loading. Correspondingly, an improvement in the treatment effect of the microbial reactor can mark an increase in the microbial population [29]. However, the growth of microorganisms is not unlimited and is affected by the living space, nutrient concentration, and other conditions. Therefore, the growth curve of microorganisms is bound to be exponential in the early stages and inhibited by restrictions on the living environment in the later stages [30]. In this experiment, the growth of the anammox bacteria in the A-section reactor was slow in the early stages, during which time microbes adapted to the new environment, adjusting their metabolic activities. However, as the substrate concentration and microbial population in the influent water increase, the anammox reaction proceeds more rapidly, with the total denitrification load tending towards constancy when the substrate concentration or available space stabilizes, after which the bacterial growth rate decreases, entering a stable period.
Li et al. [20] used four kinetic models to simulate the growth of anammox microbial cells in the presence of a low-concentration substrate and successfully predicted the ideal microbial growth in a low-concentration UASB reactor. Therefore, cell growth in an anammox microbial reactor with a high substrate concentration was investigated in this study [31]. The process in the A-section reactor was analyzed using a microbial growth kinetic model.
Nt is the NLR at time, t, which is proportional to the microbial growth rate (kg-N/m3-d); K is the maximum NLR removal load (kg-N/m3-d); a is a constant; r is the maximum instantaneous growth rate for total denitrification; λ is the denitrification delay time (d); M is the minimum total nitrogen removal load (g/L·d); t is the run time (d); tc corresponds to K/2 (d); and td is a time constant (d).
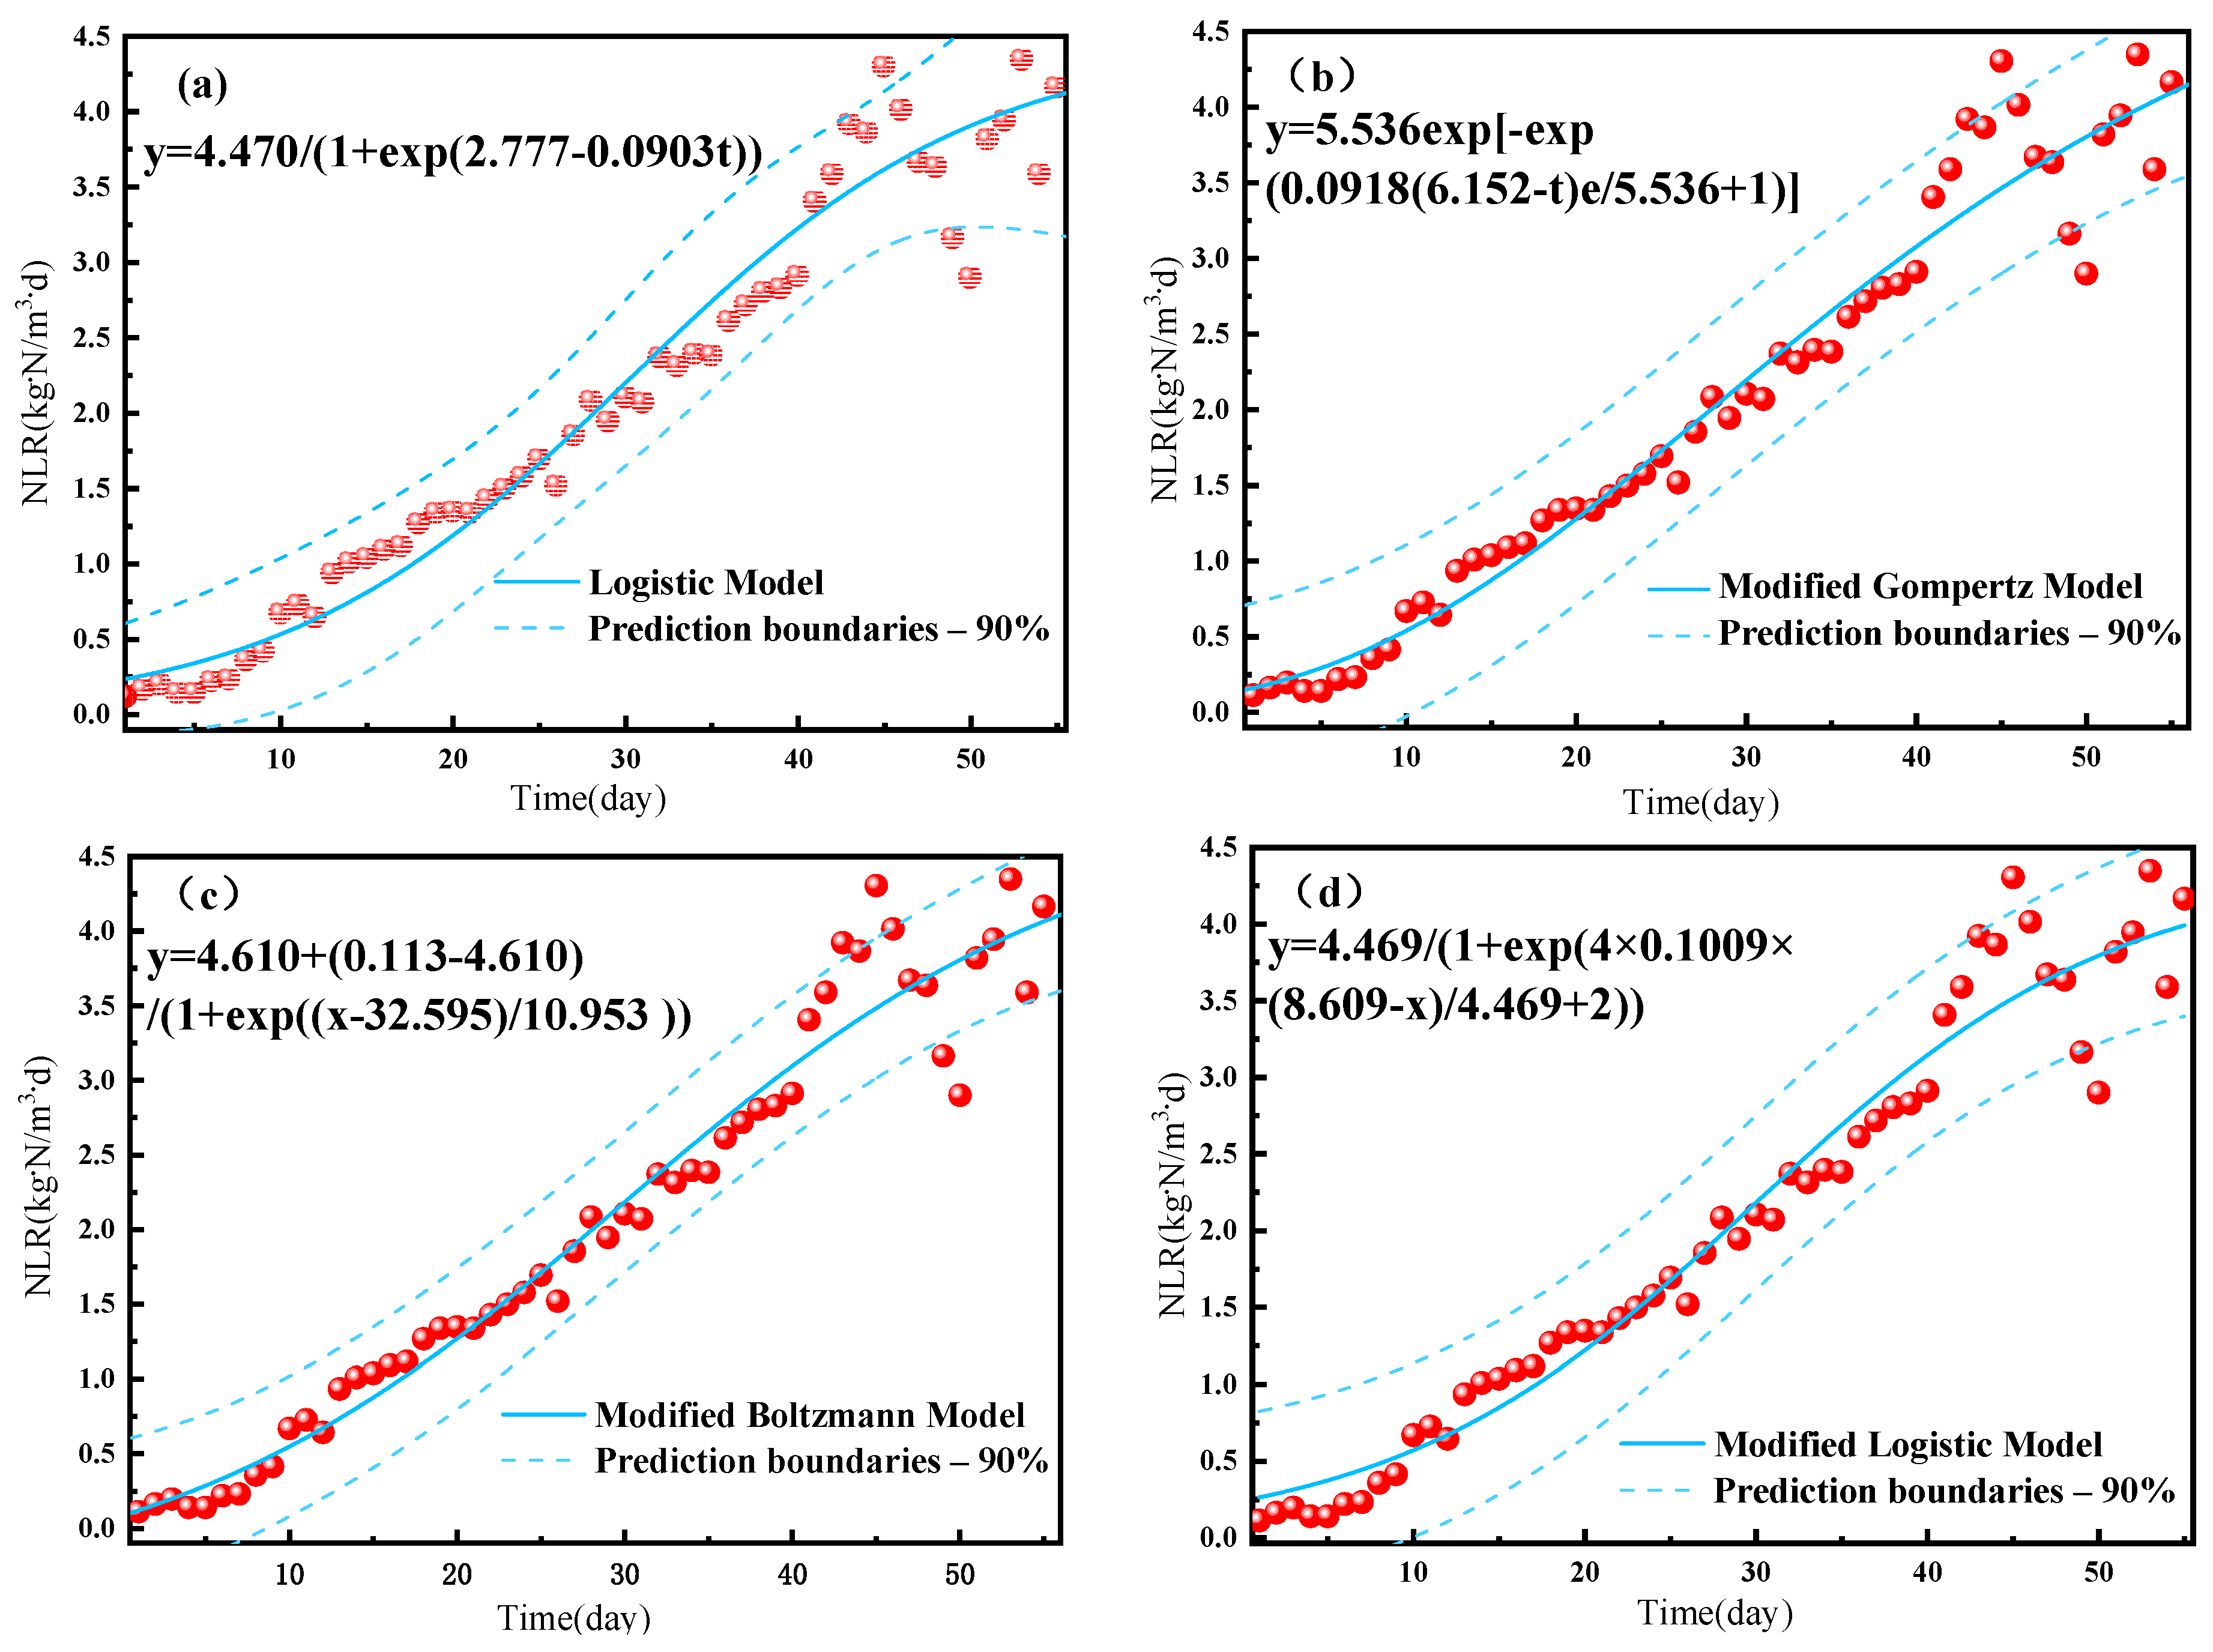
Fitting of the experimental data to the NLR of reactor A resulted in high R2 values of >0.95 for all four growth models (Table 2), indicating that all are suitable for describing the start-up performance of the A-section reactor in the PN/A reactor. The fitted curve for the start-up period was in the shape of an “S” (Figure 5), indicating that the anammox proliferation process can be divided into an adaptation period, an active period, and a stabilization period. The fitted maximum ammonia nitrogen removal loads were consistent at 4.47 kg-N/m3-d for both the logistic and the modified logistic models, whereas the maximum instantaneous growth rates (r) of 0.0903, 0.1009, and 0.0918 were obtained for ammonia nitrogen removal using the logistic model, Gompertz model, and Boltzmann model, respectively. Delay times (λ) of 8.609 and 6.152 d were obtained for ammonia removal using the modified logistic and modified Gompertz models, respectively, while fitting to the modified Boltzmann model resulted in a minimum NH4+ − N removal load (M) of 0.113 kg-N/m3-d, corresponding to a tc of 32.595 d and a td of 10.953 d. The significantly shorter delay times for ammonia nitrogen removal in this study as compared to the 17.28 and 13.49 d obtained by Li et al. [20] indicate a higher reaction rate under the high concentration conditions, indicating a better growth environment for anammox bacteria with better proliferation and enrichment. By analyzing these four models, it was possible to obtain the maximum NLR, instantaneous growth rate, and delay time for NH4+ − N removal. These results help predict the ammonia nitrogen removal performance in practice and are thus expected to improve reactor operation management and control.
Table 2.
Summary of growth kinetic parameters in different models.
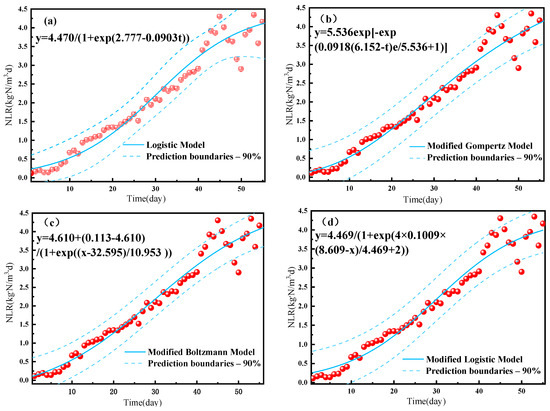
Figure 5.
Growth kinetic model of an A-section reactor for ammonia nitrogen removal under (a) the logistic model, (b) the modified logistic model, (c) the modified Gompertz model, and (d) the modified Boltzmann model.
3.5. Analysis of Process Dynamics
Process kinetics modeling is an analytical method that is used for monitoring system performance, the fitted kinetic results used to estimate reactor treatment efficiency under the same operating conditions [32]. The Grau second-order model is the most widely used mathematical model for analyzing the performance of anaerobic reactors and can describe the dynamic behavior of anaerobic bioreactors [33,34]. The general equation of Grau’s second-order model is shown in Equation (10):
where is the kinetic constant (d−1), X is the sludge concentration (g/L), represents [NH4+ − N]Inf (mg/L), and represents [NH4+ − N]Eff (mg/L). If the boundary condition ( = ) is used, t = HRT, and the following equation can be obtained by linearization:
where H is the hydraulic retention time (HRT) listed in Table 3. If /(kX) is expressed as a constant b, and /(-) is expressed as E (a percentage of substrate removal), the above equation can be modified as follows:
Table 3.
Operating conditions and modeling parameters of the reactor for different periods of time.
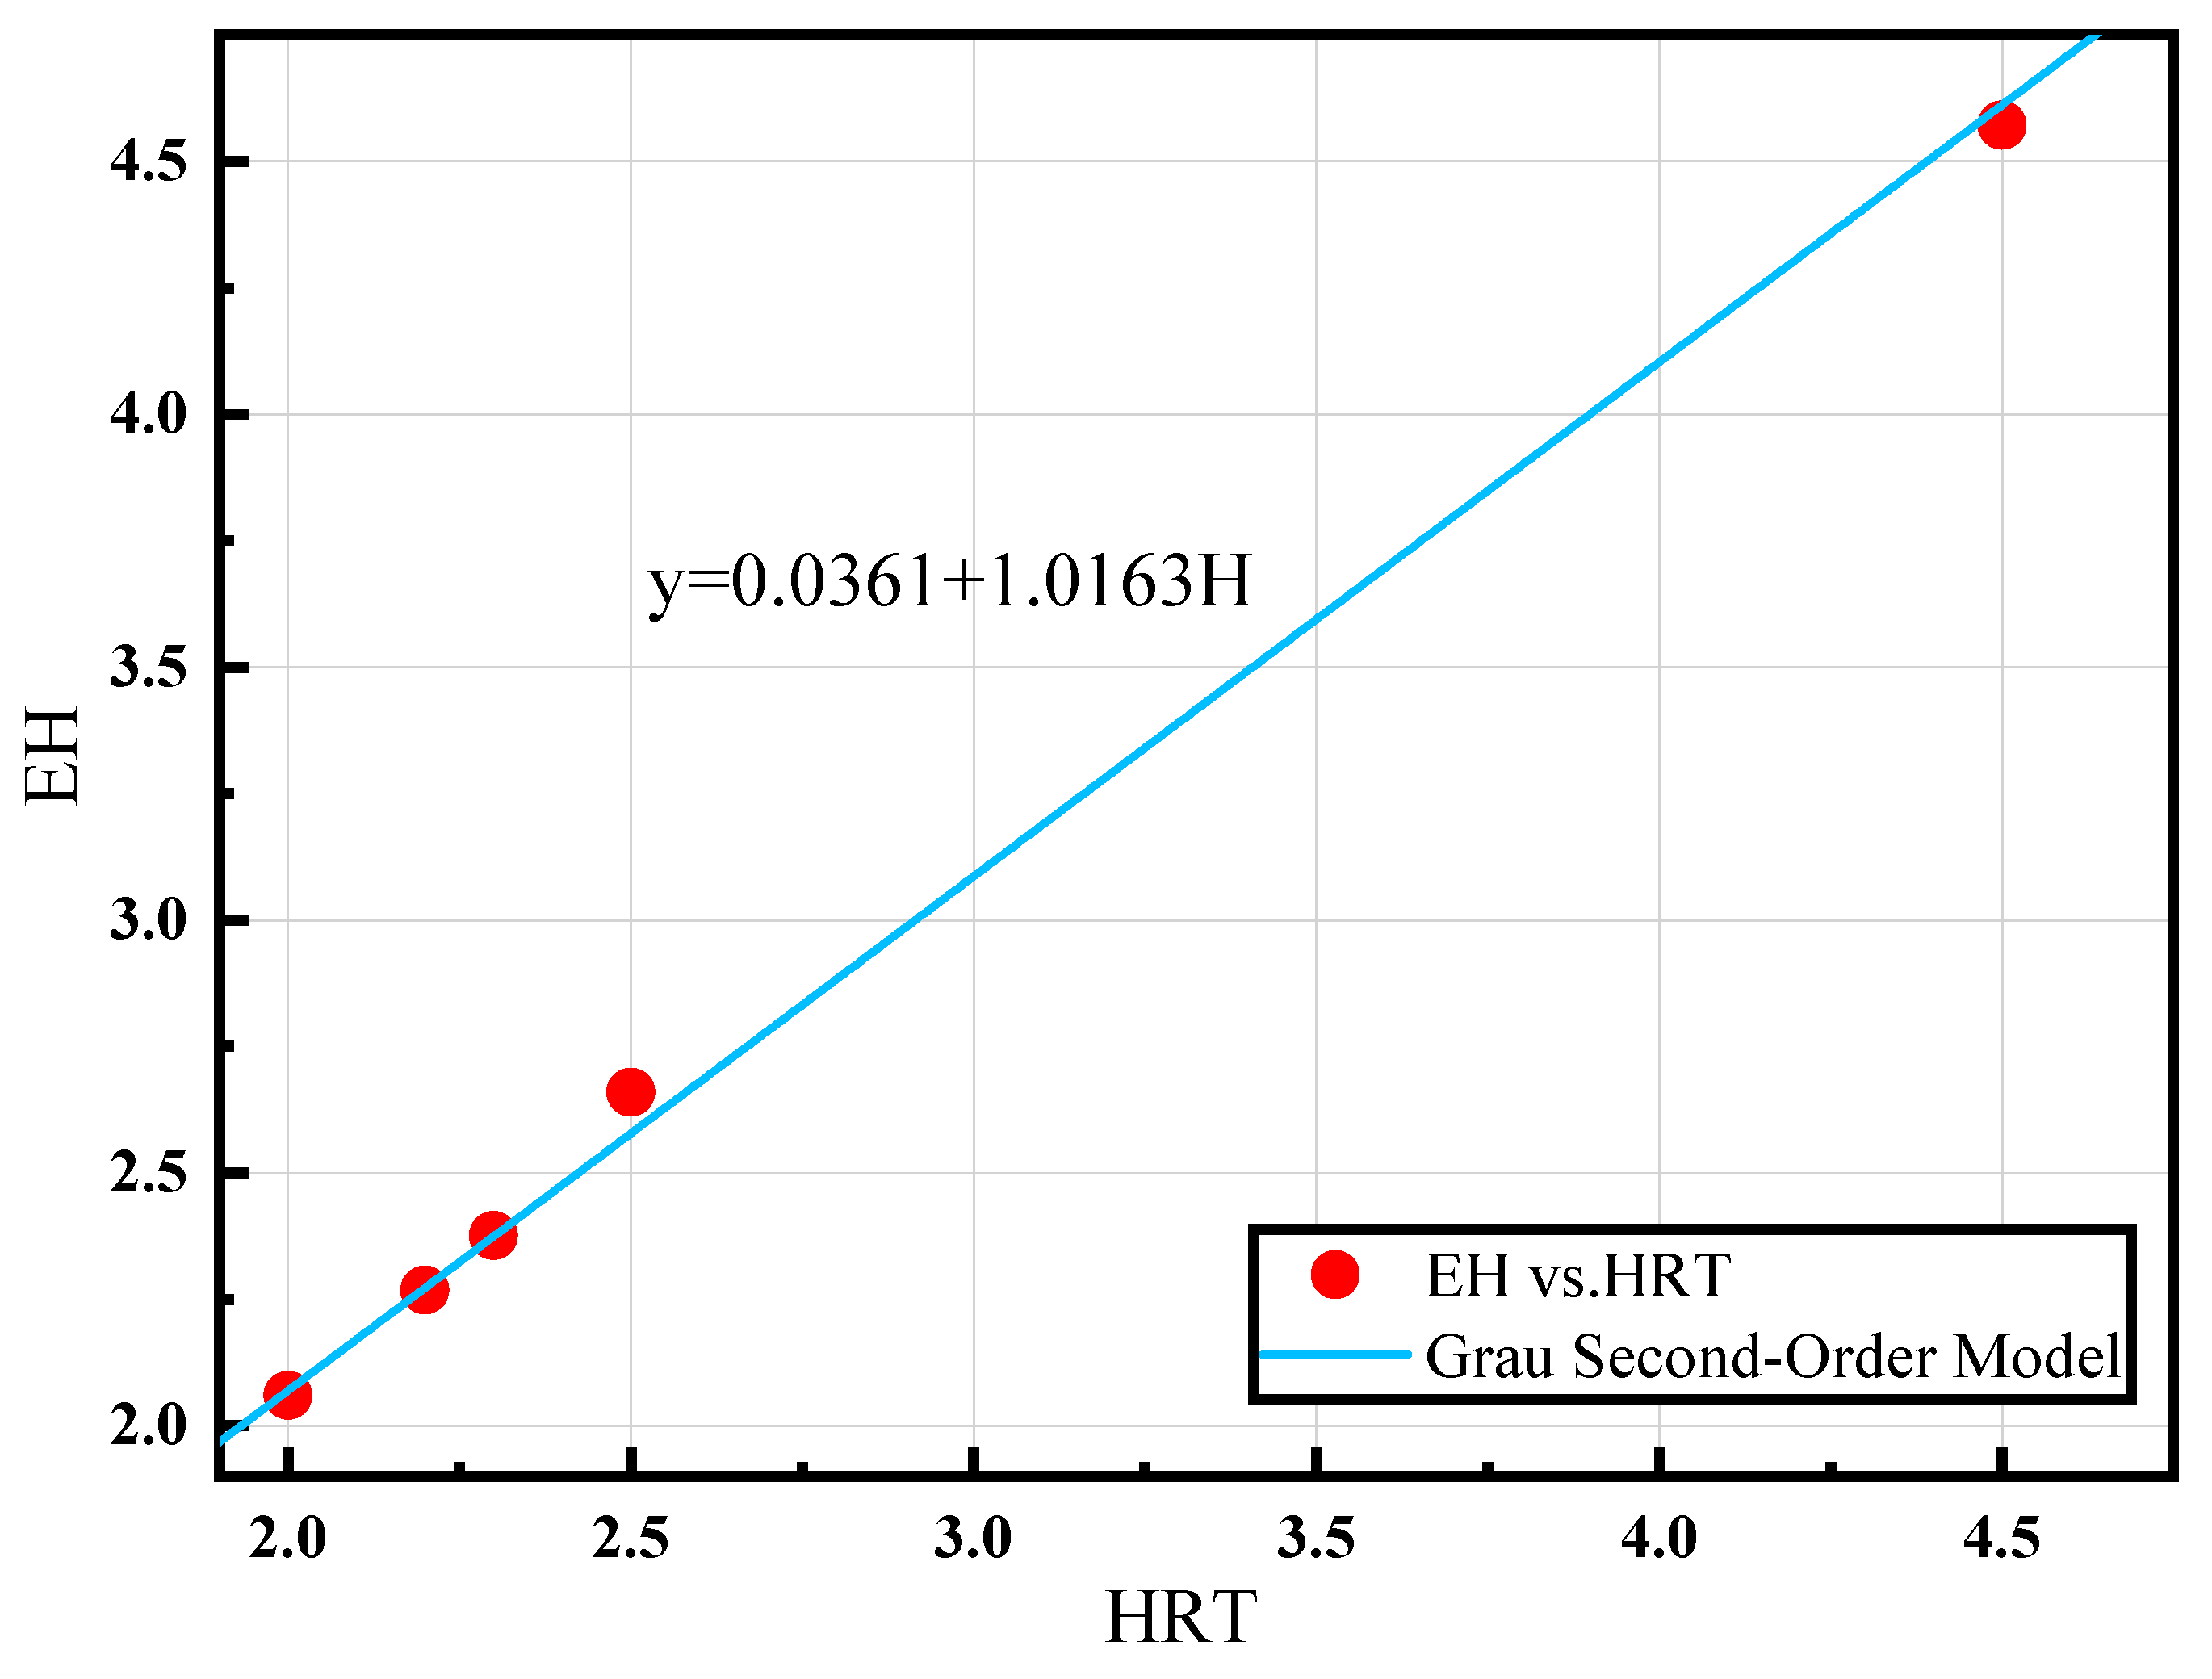
The fit is shown in Figure 5 for EH placed on the y-axis and H on the x-axis. The equation for predicting the [NH4+ − N]Eff of reactor A is derived using Equation (13).
As shown in Figure 6, fitting this model resulted in R2 = 0.9984, a = 1.0163, and b = 0.0361, allowing a better curve to be obtained. The equation for predicting the effluent ammonia nitrogen concentration also provides new concepts for an automated control system that can manage two-stage PN/A reactors.

Figure 6.
Process dynamics model (H is the hydraulic retention time (HRT), and E is the reciprocal of the percentage of substrate removal).
4. Conclusions
The two-stage PN/A reactor, which is advantageous in engineering applications, has not been rigorously studied in terms of process kinetics. Therefore, in this study, the start-up performance and process kinetics of the two-stage PN/A reactor were evaluated. The results showed that increasing the NLR during the stabilization period 60 d after initiation resulted in a NAR of 96.93% and [NO2− − N]Eff/[NH4+ − N]Eff of 1.33, which is close to the theoretical value of 1.32 in the PN reactor. The A-stage reactor was successfully started 55 d into operation by inoculation with anaerobic ammonia-oxidizing activated sludge and adding granular activated carbon. The ammonia load showed an S-shaped trend during the start-up of the A-stage reactor.
A logistic model, modified logistic model, modified Gompertz model, and modified Boltzmann model were used to plot the experimental data of ammonia nitrogen removal load. The results showed that the theoretical model correctly explained the kinetic curve of anaerobic ammonia oxidation in the experimental data. The curves in the image show a strong correlation between the model and the dependent variable. The maximum ammonia nitrogen removal load and the maximum instantaneous growth rate of nitrogen removal were obtained by using a growth kinetic model analysis. The maximum ammonia nitrogen removal load and the maximum instantaneous growth rate of nitrogen removal were obtained by using a growth kinetic model analysis. This helps to predict the performance of ammonia nitrogen removal in actual operation and improves the operational management and control of the reactor. Certain results were obtained during the study; however, the short time period over which the experiment was performed means that problems may not have been thoroughly elucidated, and further research and exploration are required to provide more reliable technical support for practical engineering use in the future. The recommendations are as follows:
- (1)
- The results of this experiment were based on an artificial water distribution, and further in-depth research is required to determine the water quality in an actual complex.
- (2)
- This experiment has not yet been conducted from a microbial point of view, and follow-up experiments should be supplemented with other techniques such as scanning electron microscopy and DNA identification.
- (3)
- Increasing the load in an anaerobic ammonia oxidation reactor will result in pipe blockage, impacting the performance of the reactor, and this effect should be noted during any further experimental processes.
- (4)
- The combined processes of nitrosation and anaerobic ammonia oxidation produce nitrate nitrogen, and subsequent research could address the application of this reaction in further analysis and research.
Author Contributions
Conceptualization, D.W. and W.Z.; methodology, Y.J. and D.W.; formal analysis, X.G. and K.D.; investigation, H.W., G.W., and D.W.; resources, K.D.; data curation, X.F. and K.D.; writing—original draft, G.W. and D.W.; writing—review and editing, K.D. and X.F.; visualization, D.W. and K.D.; supervision, K.D.; project administration, D.W.; funding acquisition, K.D. All authors have read and agreed to the published version of the manuscript.
Funding
This research was funded by the National Natural Science Foundation of China (grant number 52260023); the Research funds of The Guangxi Key Laboratory of Theory and Technology for Environmental Pollution Control (guikeneng 2301Z003).
Institutional Review Board Statement
Not applicable.
Informed Consent Statement
Not applicable.
Data Availability Statement
The data that support the findings of this study are available from the corresponding author upon reasonable request.
Conflicts of Interest
The authors declare no conflict of interest.
References
- Chen, X.; Jiang, X.; Huang, W. Evaluation and mechanism of ammonia nitrogen removal using sediments from a malodorous river. R. Soc. Open Sci. 2018, 5, 114432. [Google Scholar] [CrossRef] [PubMed]
- Rahimi, S.; Modin, O.; Mijakovic, I. Technologies for biological removal and recovery of nitrogen from wastewater. Biotechnol. Adv. 2020, 43, 107570. [Google Scholar] [CrossRef] [PubMed]
- Yuan, Y.; Li, X.; Li, B.-L. Autotrophic nitrogen removal characteristics of PN-anammox process enhanced by sulfur autotrophic denitrification under mainstream conditions. Bioresour. Technol. 2020, 316, 123926. [Google Scholar] [CrossRef] [PubMed]
- Bao, R.; Xu, J.; Zhang, Y. Start-up and operation control of short-range nitrification and denitrification in multistage AO process. Water Purif. Technol. 2023, 42, 95–103. [Google Scholar]
- Piculell, M.; Suarez, C.; Li, C.; Christensson, M.; Persson, F.; Wagner, M.; Hermansson, M.; Jönsson, K.; Welander, T. The inhibitory effects of reject water on nitrifying populations grown at different biofilm thickness. Water Res. 2016, 104, 292–302. [Google Scholar] [CrossRef] [PubMed]
- Wen, R.; Jin, Y.; Zhang, W. Application of the Anammox in China—A Review. Int. J. Environ. Res. Public Health 2020, 17, 1090. [Google Scholar] [CrossRef] [PubMed]
- Wu, L.; Yan, Z.; Huang, S.; Li, J.; Su, B.C.; Wang, Y.; Peng, Y. Rapid start-up and stable maintenance of partial nitrification-anaerobic ammonium oxidation treatment of landfill leachate at low temperatures. Environ. Res. 2020, 191, 110131. [Google Scholar] [CrossRef] [PubMed]
- Ye, M.; Li, Y.-Y. Methanogenic treatment of dairy wastewater: A review of current obstacles and new technological perspectives. Sci. Total Environ. 2023, 866, 161447. [Google Scholar] [CrossRef] [PubMed]
- Rong, C.; Luo, Z.; Wang, T.; Qin, Y.; Wu, J.; Guo, Y.; Hu, Y.; Kong, Z.; Hanaoka, T.; Sakemi, S.; et al. Biomass retention and microbial segregation to offset the impacts of seasonal temperatures for a pilot-scale integrated fixed-film activated sludge partial nitritation-anammox (IFAS-PN/A) treating anaerobically pretreated municipal wastewater. Water Res. 2022, 225, 119194. [Google Scholar] [CrossRef]
- Wu, L.; Shen, M.; Li, J.; Huang, S.; Li, Z.; Yan, Z.; Peng, Y. Cooperation between partial-nitrification, complete ammonia oxidation (comammox), and anaerobic ammonia oxidation (anammox) in sludge digestion liquid for nitrogen removal. Environ. Pollut. 2019, 254, 112965. [Google Scholar] [CrossRef]
- Al-Hazmi, H.E.; Hassan, G.K.; Maktabifard, M.; Grubba, D.; Majtacz, J.; Mąkinia, J. Integrating conventional nitrogen removal with anammox in wastewater treatment systems: Microbial metabolism, sustainability and challenges. Environ. Res. 2022, 215, 114432. [Google Scholar] [CrossRef] [PubMed]
- Guo, Y.; Luo, Z.B.; Shen, J.H.; Li, Y.Y. The main anammox-based processes, the involved microbes and the novel process concept from the application perspective. Front. Environ. Sci. Eng. 2022, 16, 84. [Google Scholar] [CrossRef]
- Lackner, S.; Gilbert, E.M.; Vlaeminck, S.E.; Joss, A.; Horn, H.; van Loosdrecht, M.C. Loosdrecht Full-scale partial nitritation/anammox experiences—An application survey. Water Res. 2014, 55, 292–303. [Google Scholar] [CrossRef] [PubMed]
- Wei, Y.; Jin, Y.; Zhang, W. Domestic Sewage Treatment Using a One-Stage ANAMMOX Process. Int. J. Environ. Res. Public Health 2020, 17, 3284. [Google Scholar] [CrossRef] [PubMed]
- Xu, Y.; Xu, Y.; Li, T.; Wang, G.; Dai, X. Two-step partial nitrification-anammox process for treating thermal-hydrolysis anaerobic digester effluent: Start-up and microbial characterisation. J. Clean. Prod. 2020, 252, 119784. [Google Scholar] [CrossRef]
- Lu, D.; Gong, H.; Diao, S.; Shi, W.; Yin, R.; Dai, X. Enhanced sludge settlement of two stage PN/Anammox for reject water treatment with respective diatomite addition. Sci. Total Environ. 2023, 877, 162784. [Google Scholar] [CrossRef] [PubMed]
- Chen, Y.; Zhao, Z.; Liu, H.; Ma, Y.; An, F.; Huang, J.; Shao, Z. Achieving stable two-stage mainstream partial-nitrification/anammox (PN/A) operation via intermittent aeration. Chemosphere 2020, 245, 125250. [Google Scholar] [CrossRef] [PubMed]
- Cao, S.; Koch, K.; Duan, H.; Wells, G.F.; Ye, L.; Zhao, Y.; Du, R. In a quest for high-efficiency mainstream partial nitritation-anammox (PN/A) implementation: One-stage or two-stage? Sci. Total Environ. 2023, 883, 163540. [Google Scholar] [CrossRef] [PubMed]
- Mosquera-Corral, A.; Gonzalez, F.; Campos, J.L.; Mendez, R. Partial nitrification in a SHARON reactor in the presence of salts and organic carbon compounds. Process Biochem. 2005, 40, 3109–3118. [Google Scholar] [CrossRef]
- Li, S.; Xue, T.; Li, W. Study on initiating short-range nitrification of high ammonia nitrogen wastewater. J. Fuyang Norm. Univ. (Nat. Sci. Ed.) 2020, 37, 28–33. [Google Scholar]
- Perez, J.; Costa, E.; Kreft, J.-U. Conditions for Partial Nitrification in Biofilm Reactors and a Kinetic Explanation. Biotechnol. Bioeng. 2009, 103, 282–295. [Google Scholar] [CrossRef] [PubMed]
- Adams, M.; Xie, J.; Kabore, A.w.J.; Chang, Y.; Xie, J.; Guo, M.; Chen, C. Research advances in anammox granular sludge: A review. Crit. Rev. Environ. Sci. Technol. 2022, 52, 631–674. [Google Scholar] [CrossRef]
- Tang, C.-J.; Zheng, P.; Hu, B.-L.; Chen, J.-W.; Wang, C.-H. Influence of substrates on nitrogen removal performance and microbiology of anaerobic ammonium oxidation by operating two UASB reactors fed with different substrate levels. J. Hazard. Mater. 2010, 181, 19–26. [Google Scholar] [CrossRef] [PubMed]
- Gao, J.; Wang, R.; Li, Y.; Huang, H.; Su, X.; An, Z.; Yin, W.; Yang, L.; Rong, L.; Sun, F. Effect of aeration modes on nitrogen removal and N2O emission in the partial nitrification and denitrification process for landfill leachate treatment. Sci. Total Environ. 2022, 853, 158424. [Google Scholar] [CrossRef] [PubMed]
- Zhang, W.; Zhang, Y.; Li, L.; Zhang, X.; Jin, Y. Fast start-up of expanded granular sludge bed (EGSB) reactor using stored Anammox sludge. Water Sci. Technol. 2014, 69, 1469–1474. [Google Scholar]
- Ren, S.; Zhang, N.; Zhang, R. Challenges and countermeasures of short-range nitrification and anaerobic ammoX process. Chin. Chem. Bull. 2019, 87, 209–217+225. [Google Scholar]
- Mao, N.J.; Ren, H.Q.; Geng, J.J.; Ding, L.L.; Xu, K. Engineering application of anaerobic ammonium oxidation process in wastewater treatment. World J. Microbiol. Biotechnol. 2017, 33, 153. [Google Scholar] [CrossRef] [PubMed]
- Chen, C.; Song, Y.; Yuan, Y. Study on start-up and connection process of short-range nitrification and anaerobic ammoX plant. Water Treat. Technol. 2019, 45, 104–109+114. [Google Scholar]
- Fujikawa, H. Prediction of Competitive Microbial Growth. Biocontrol Sci. 2016, 21, 215–223. [Google Scholar] [CrossRef]
- Istok, J.D.; Park, M.; Michalsen, M.; Spain, A.M.; Krumholz, L.R.; Liu, C.; McKinley, J.; Long, P.; Roden, E.; Peacock, A.D.; et al. A thermodynamically-based model for predicting microbial growth and community composition coupled to system geochemistry: Application to uranium bioreduction. J. Contam. Hydrol. 2010, 112, 1–14. [Google Scholar] [CrossRef]
- Okpokwasili, G.C.; Nweke, C.O. Microbial growth and substrate utilization kinetics. Afr. J. Biotechnol. 2006, 5, 305–317. [Google Scholar]
- Li, Y.; Cui, N.; Xuan, K.; Xu, D.; Wang, D.; Li, C.; Li, Z.; Wang, Y. Start-up performance and process kinetics of a UASB-Anammox reactor at low substrate concentration. J. Environ. Chem. Eng. 2021, 9, 106726. [Google Scholar] [CrossRef]
- Yuan, Q.; Zhang, Y.; Xue, X.; Wang, C.; Ding, N.; Xu, H.; Sun, Y. Morphological, kinetic, and microbial community characterization of anammox bacteria with different inoculations and biofilm types for low-ammonium wastewater treatment. J. Water Process Eng. 2022, 47, 102748. [Google Scholar] [CrossRef]
- Debik, E.; Coskun, T. Use of the Static Granular Bed Reactor (SGBR) with anaerobic sludge to treat poultry slaughterhouse wastewater and kinetic modeling. Bioresour. Technol. 2009, 100, 2777–2782. [Google Scholar] [CrossRef] [PubMed]

Disclaimer/Publisher’s Note: The statements, opinions and data contained in all publications are solely those of the individual author(s) and contributor(s) and not of MDPI and/or the editor(s). MDPI and/or the editor(s) disclaim responsibility for any injury to people or property resulting from any ideas, methods, instructions or products referred to in the content. |
© 2024 by the authors. Licensee MDPI, Basel, Switzerland. This article is an open access article distributed under the terms and conditions of the Creative Commons Attribution (CC BY) license (https://creativecommons.org/licenses/by/4.0/).