
Changes in Drought Characteristics in the Yellow River Basin during the Carbon-Neutral Period under Low-Emission Scenarios


Abstract
1. Introduction
2. Materials and Methods
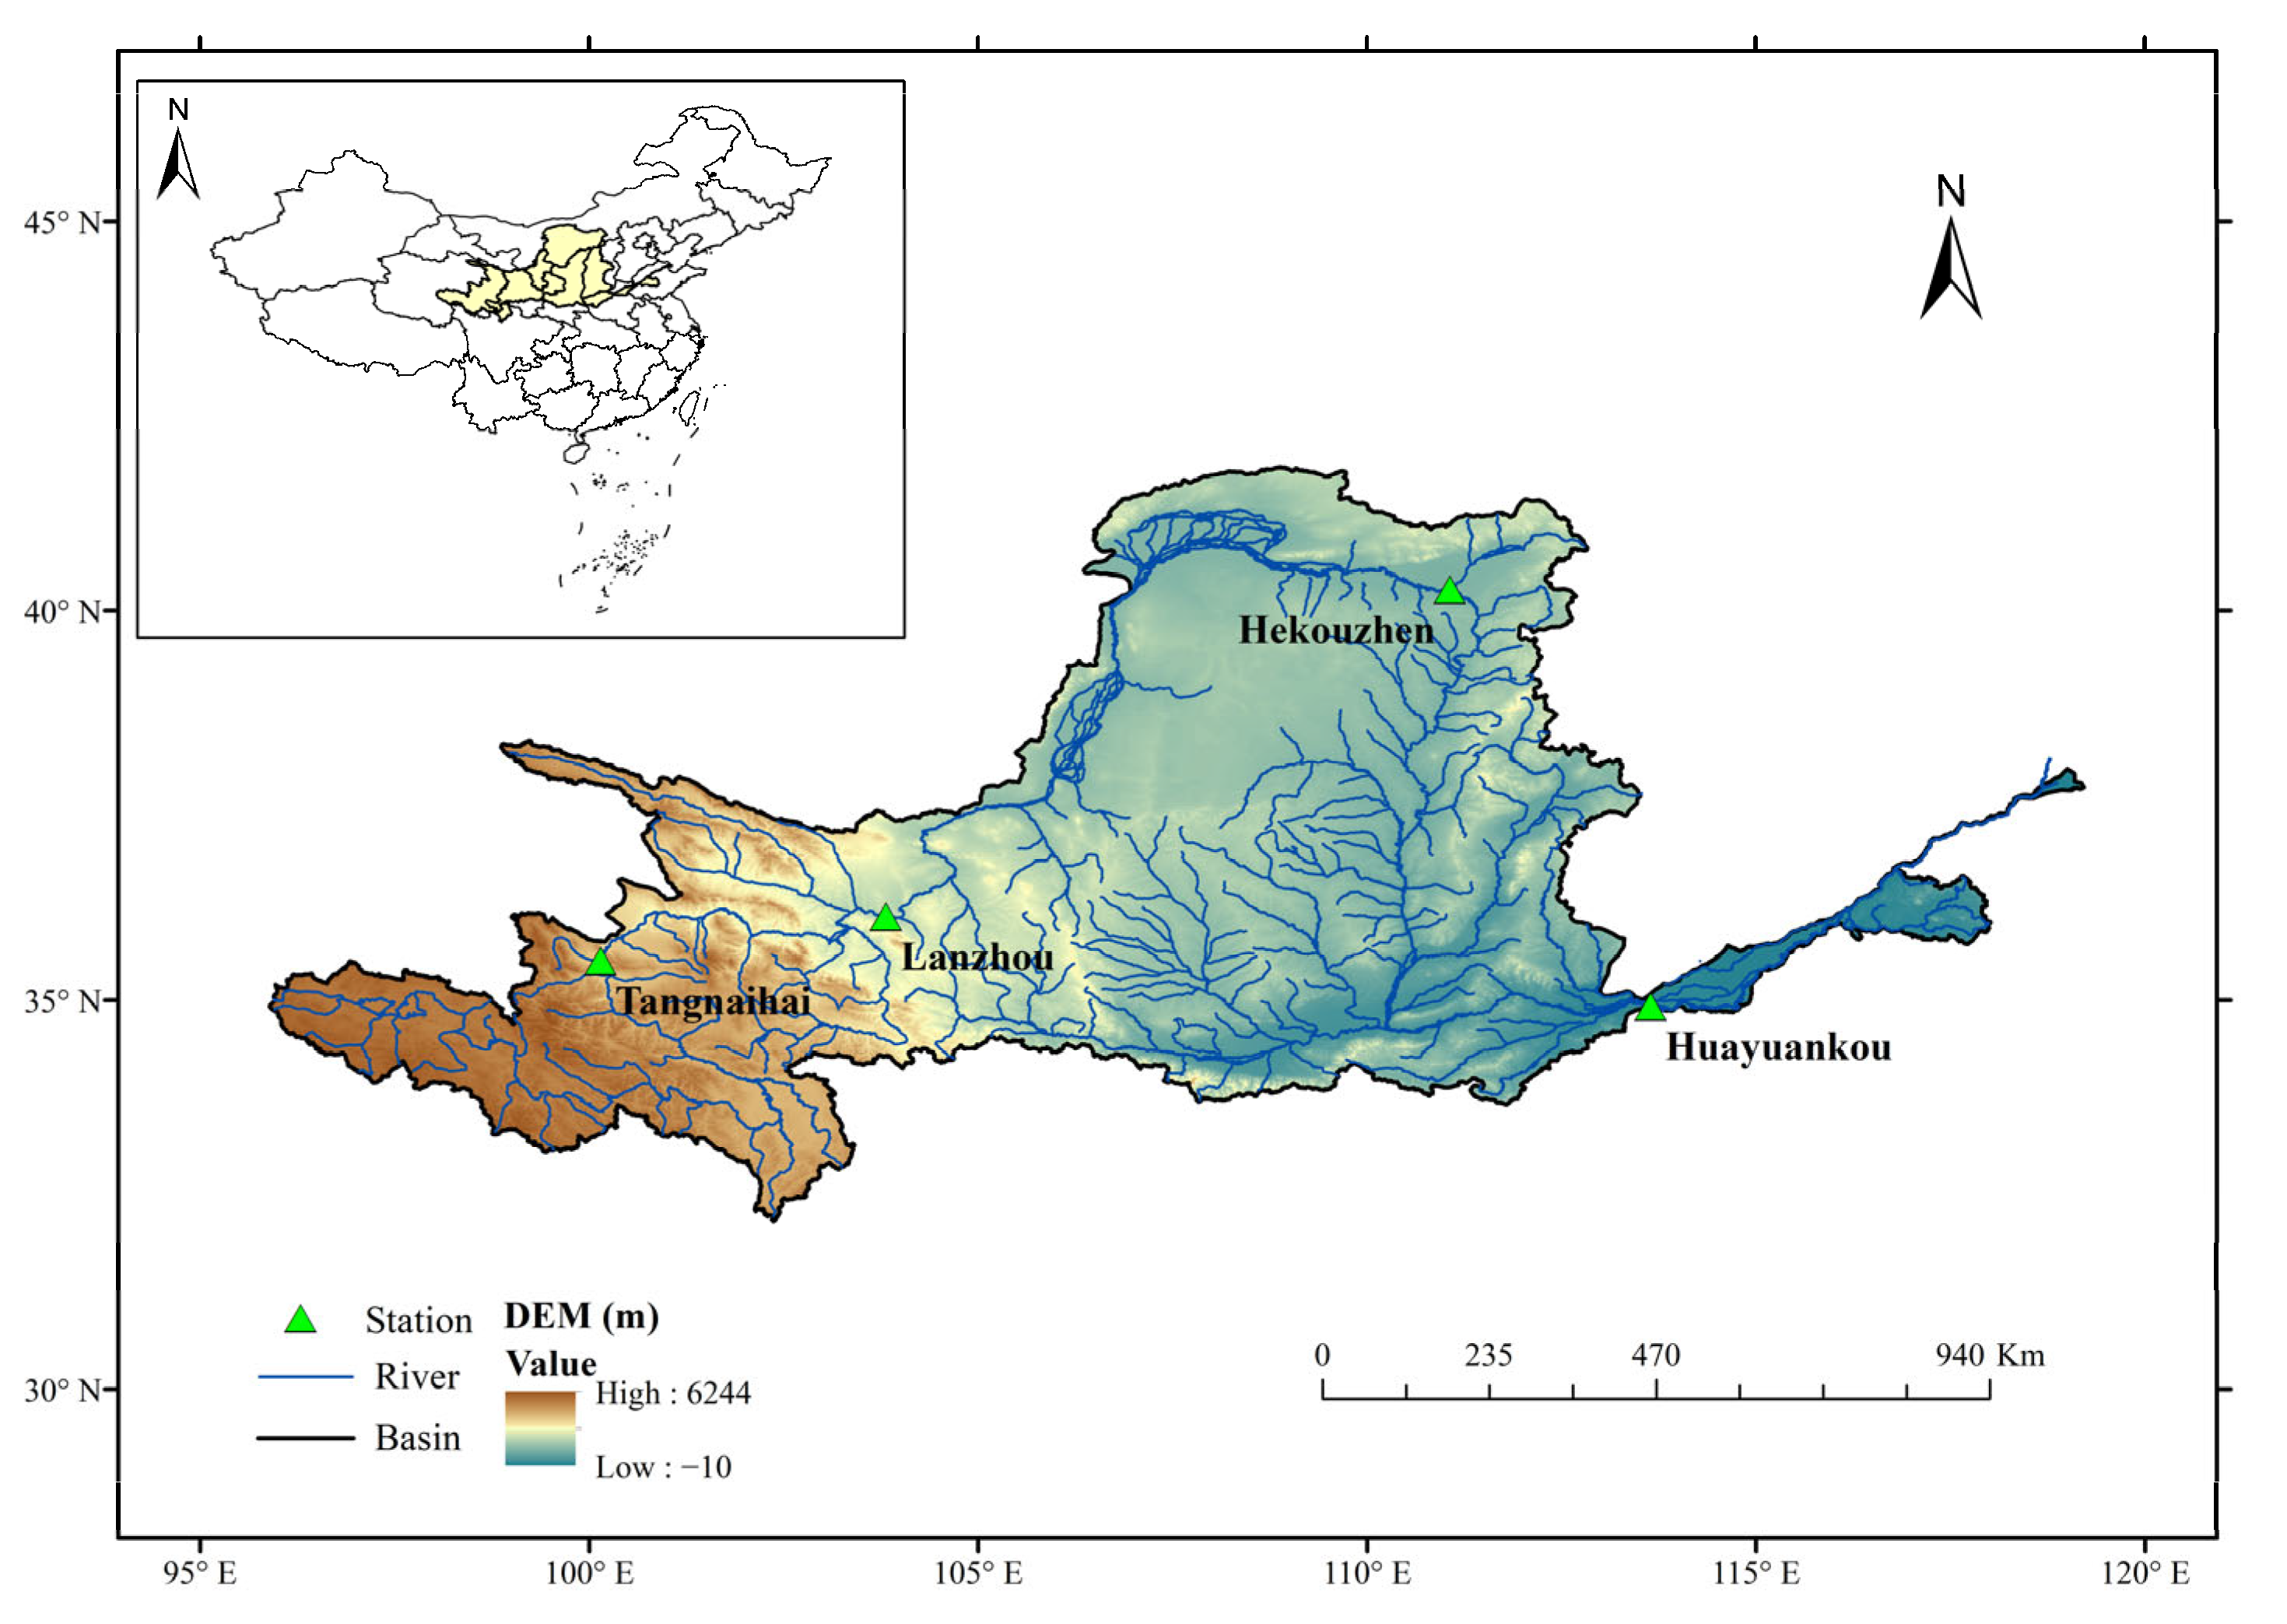
2.1. Study Area
2.2. Materials
2.2.1. Meteorological Forcings and Streamflow Records
2.2.2. CMIP6 Model Simulations and Carbon-Neutral Periods
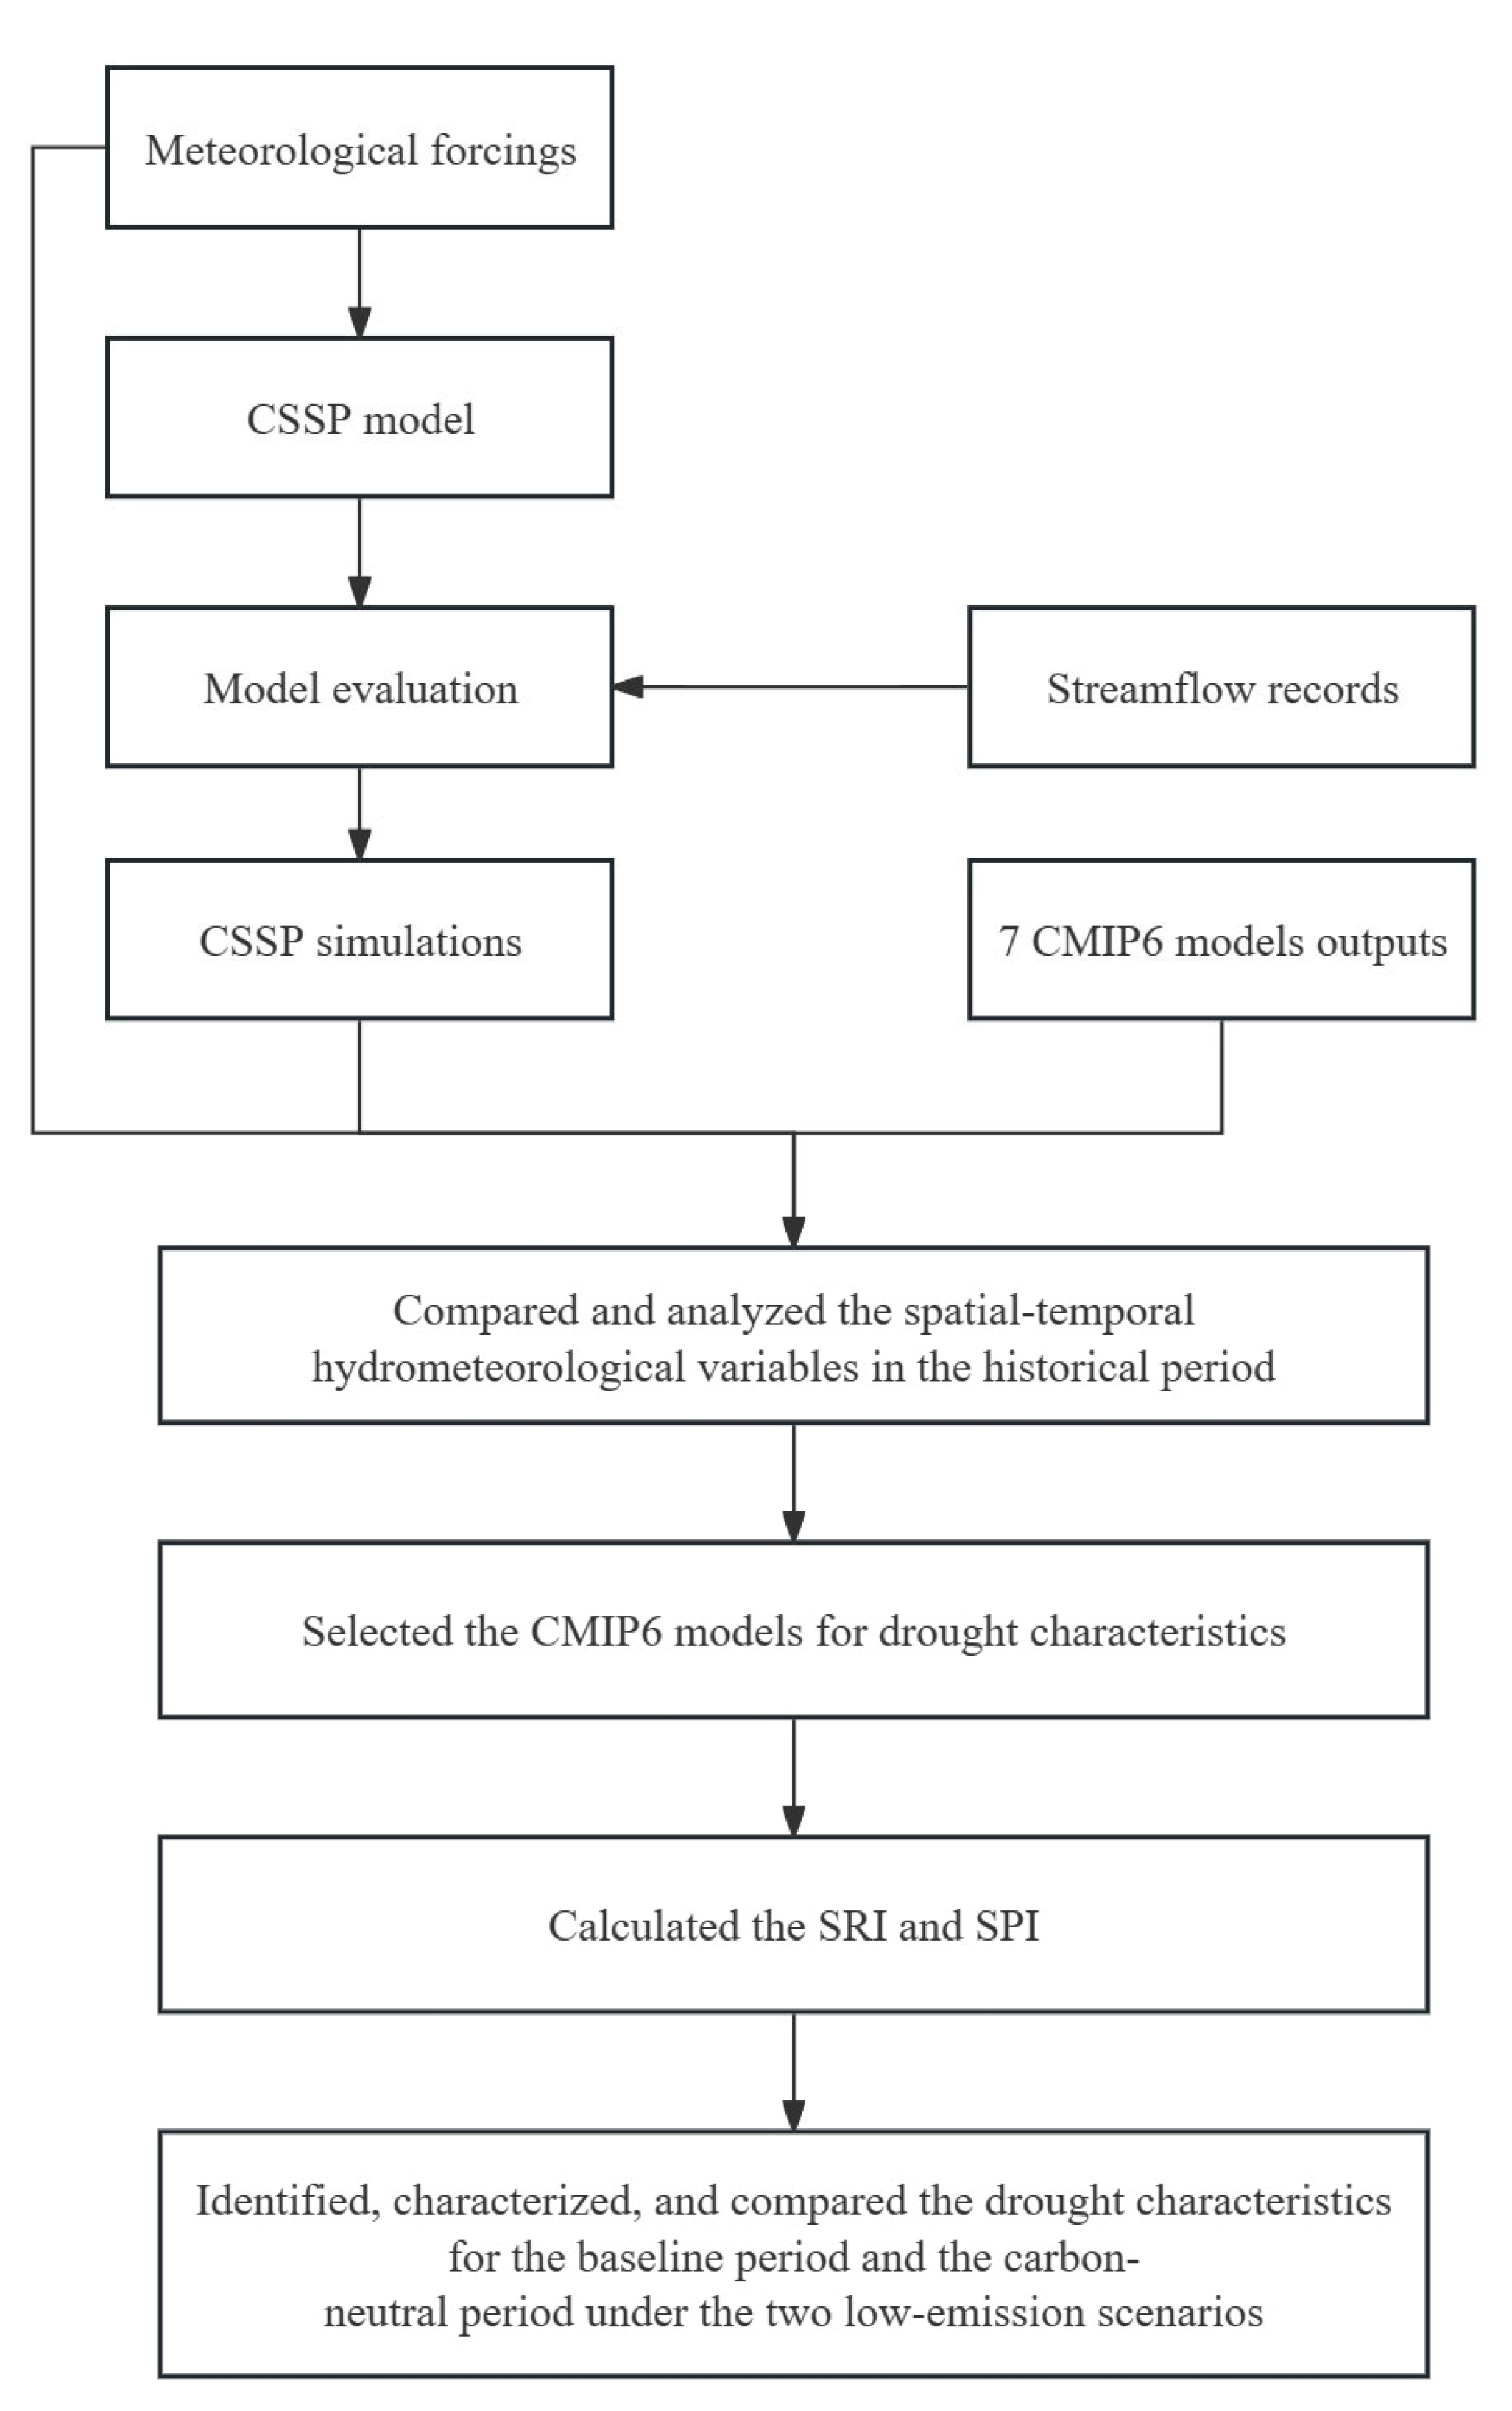
2.3. Methods
2.3.1. The Conjunctive Surface–Subsurface Process Model (CSSP)
2.3.2. Identification of Hydrological and Meteorological Drought Characteristics
2.3.3. Evaluation Indicators
3. Results
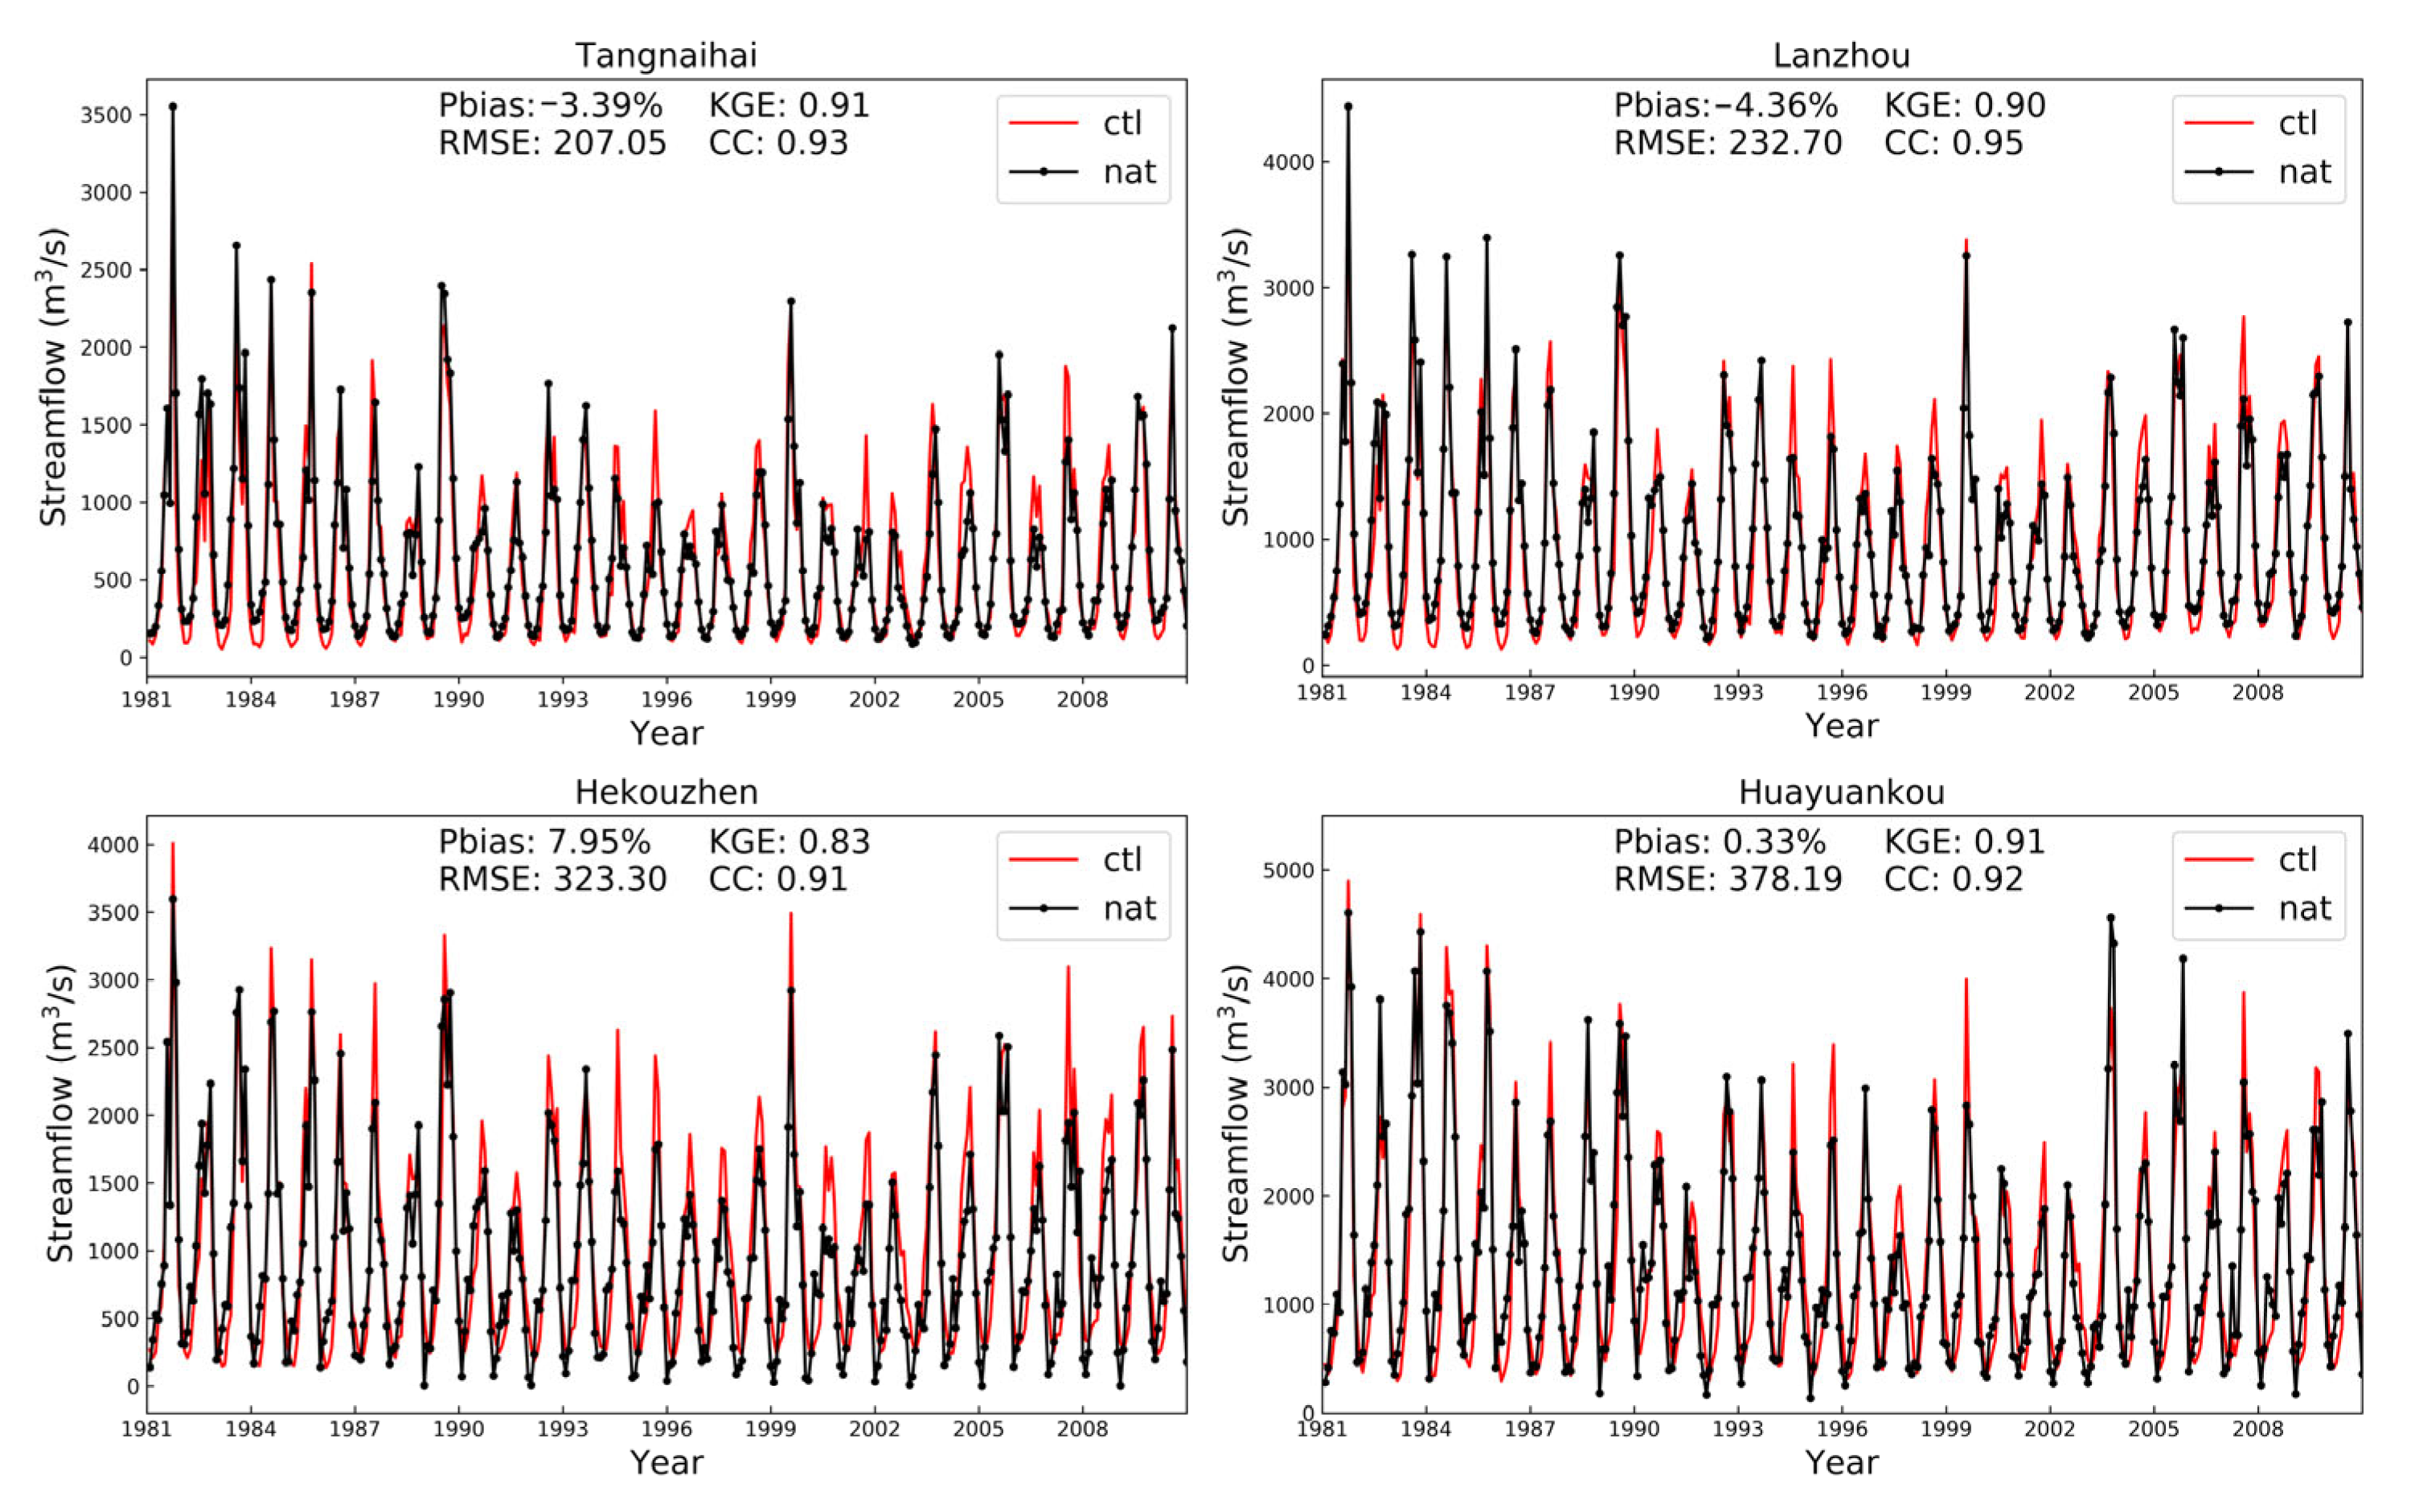
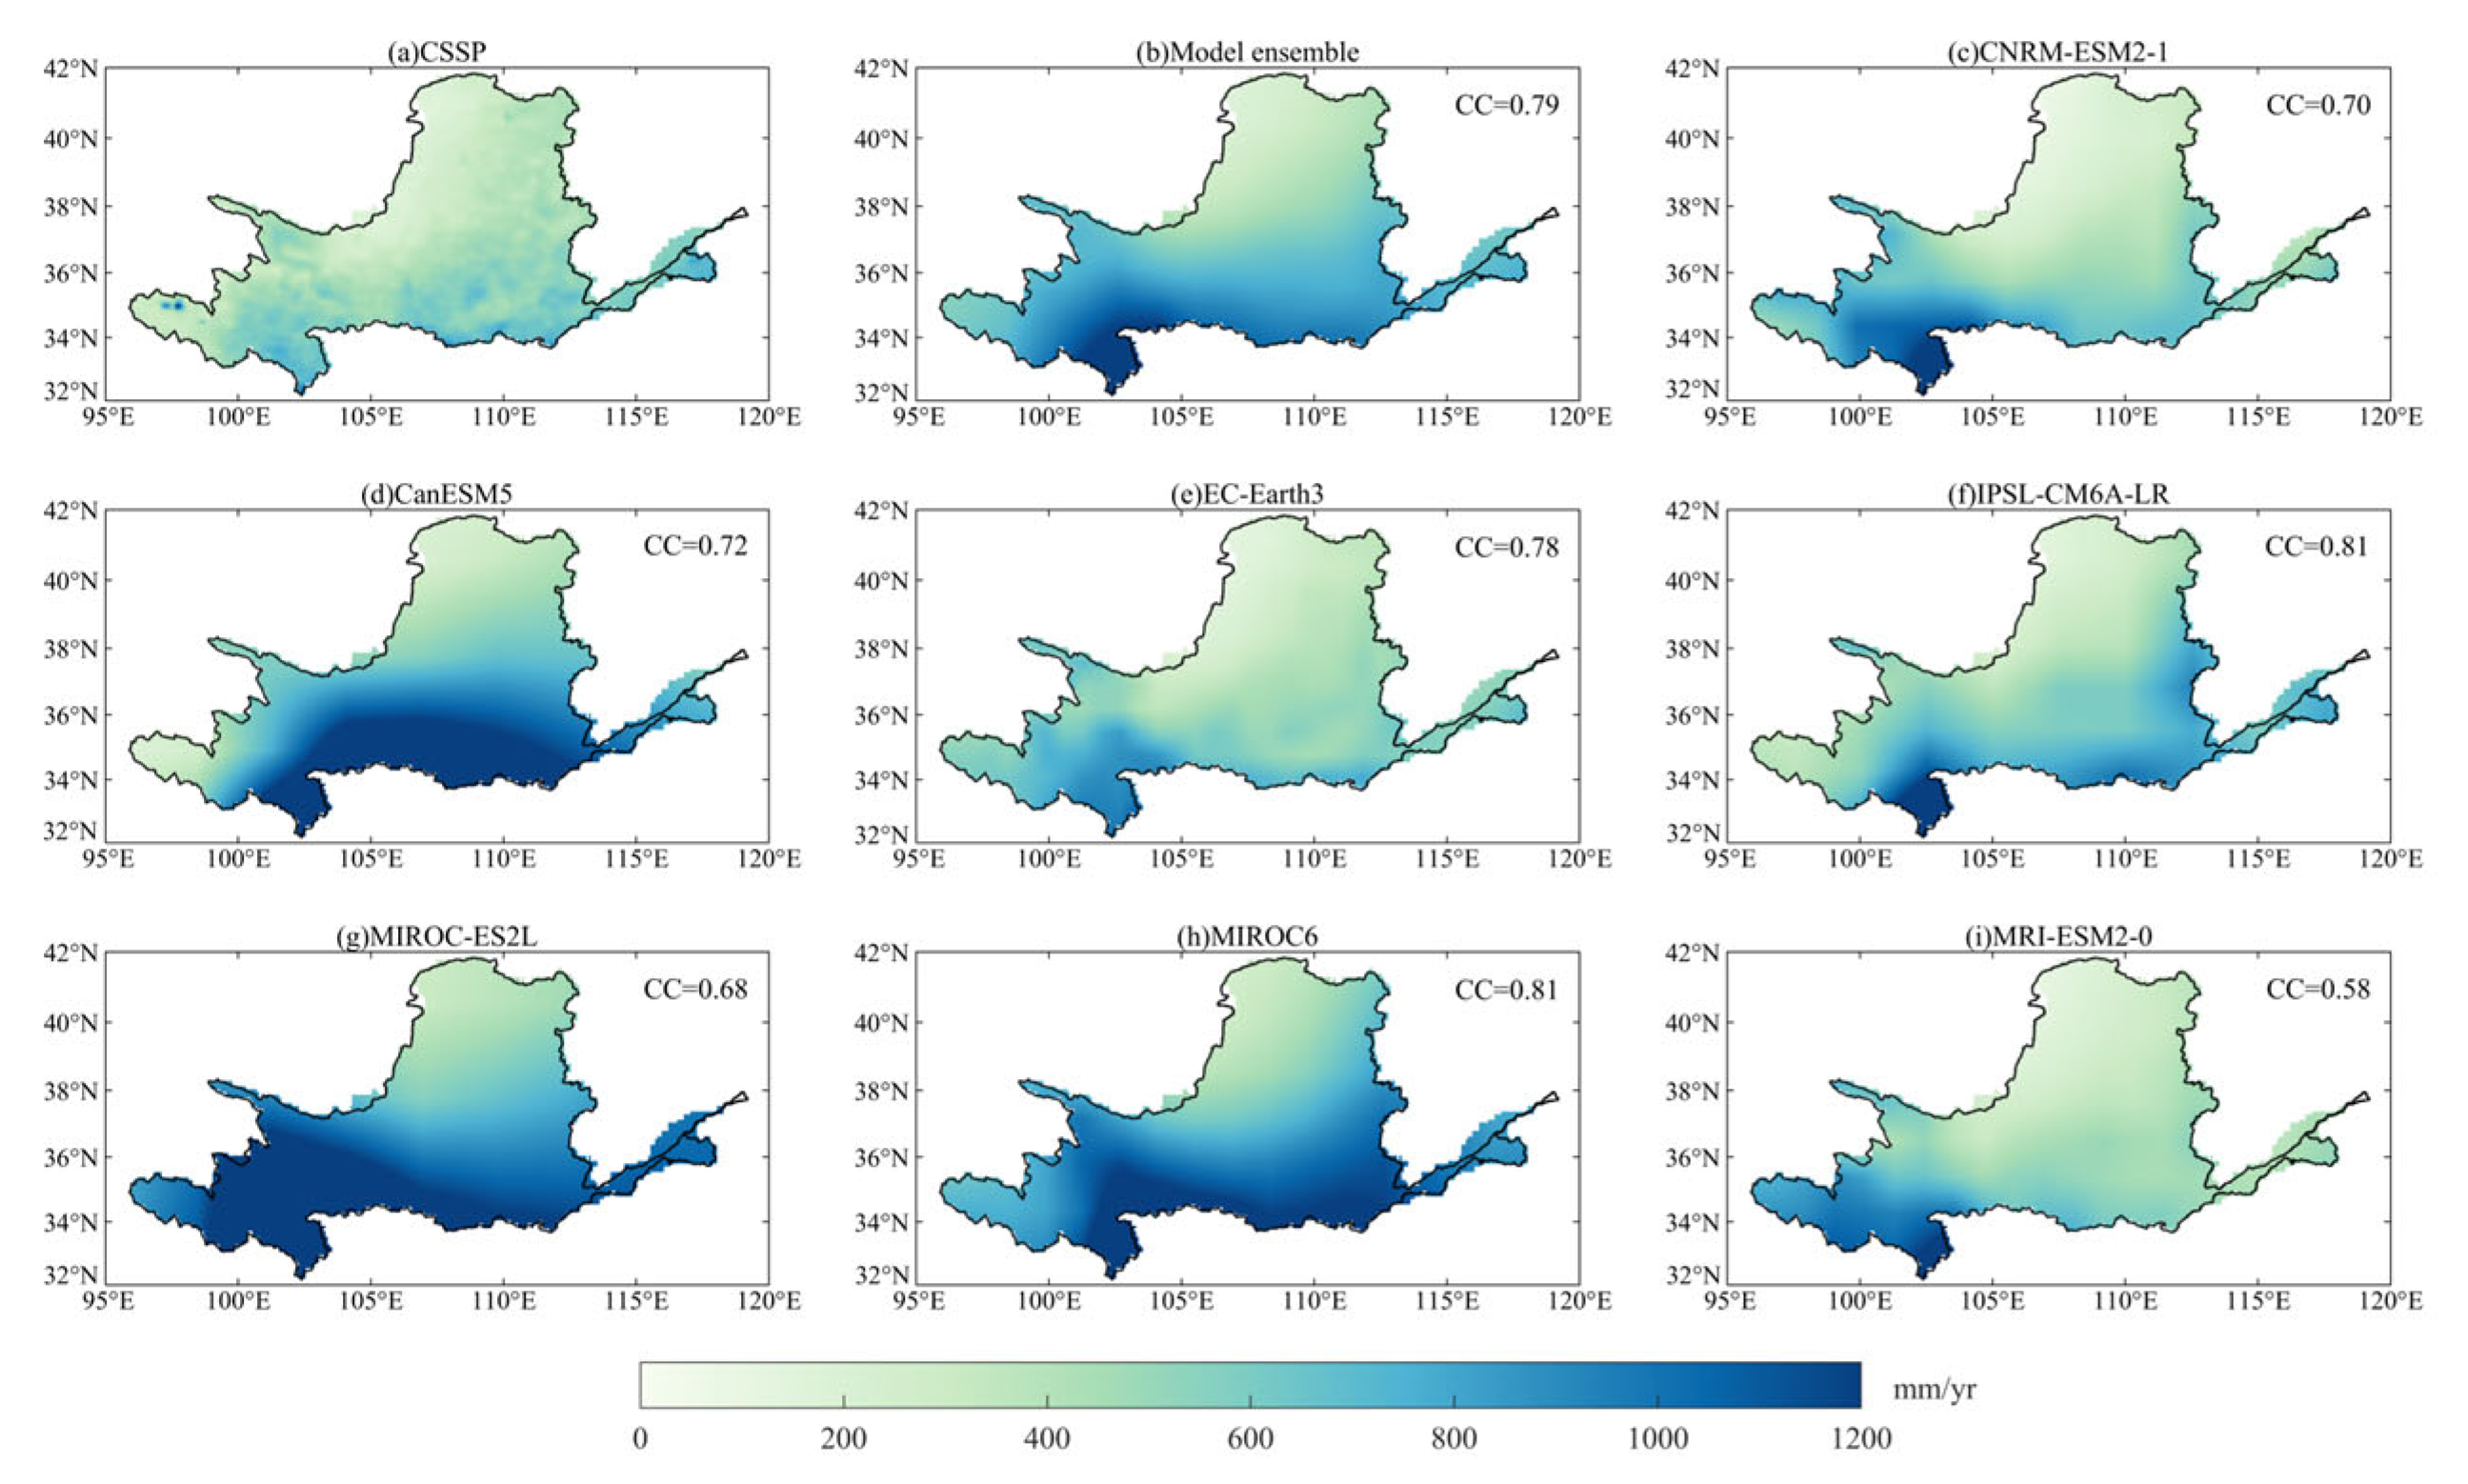
3.1. Model Evaluation
3.2. Spatial–Temporal Variations in Precipitation, Temperature, and Total Runoff
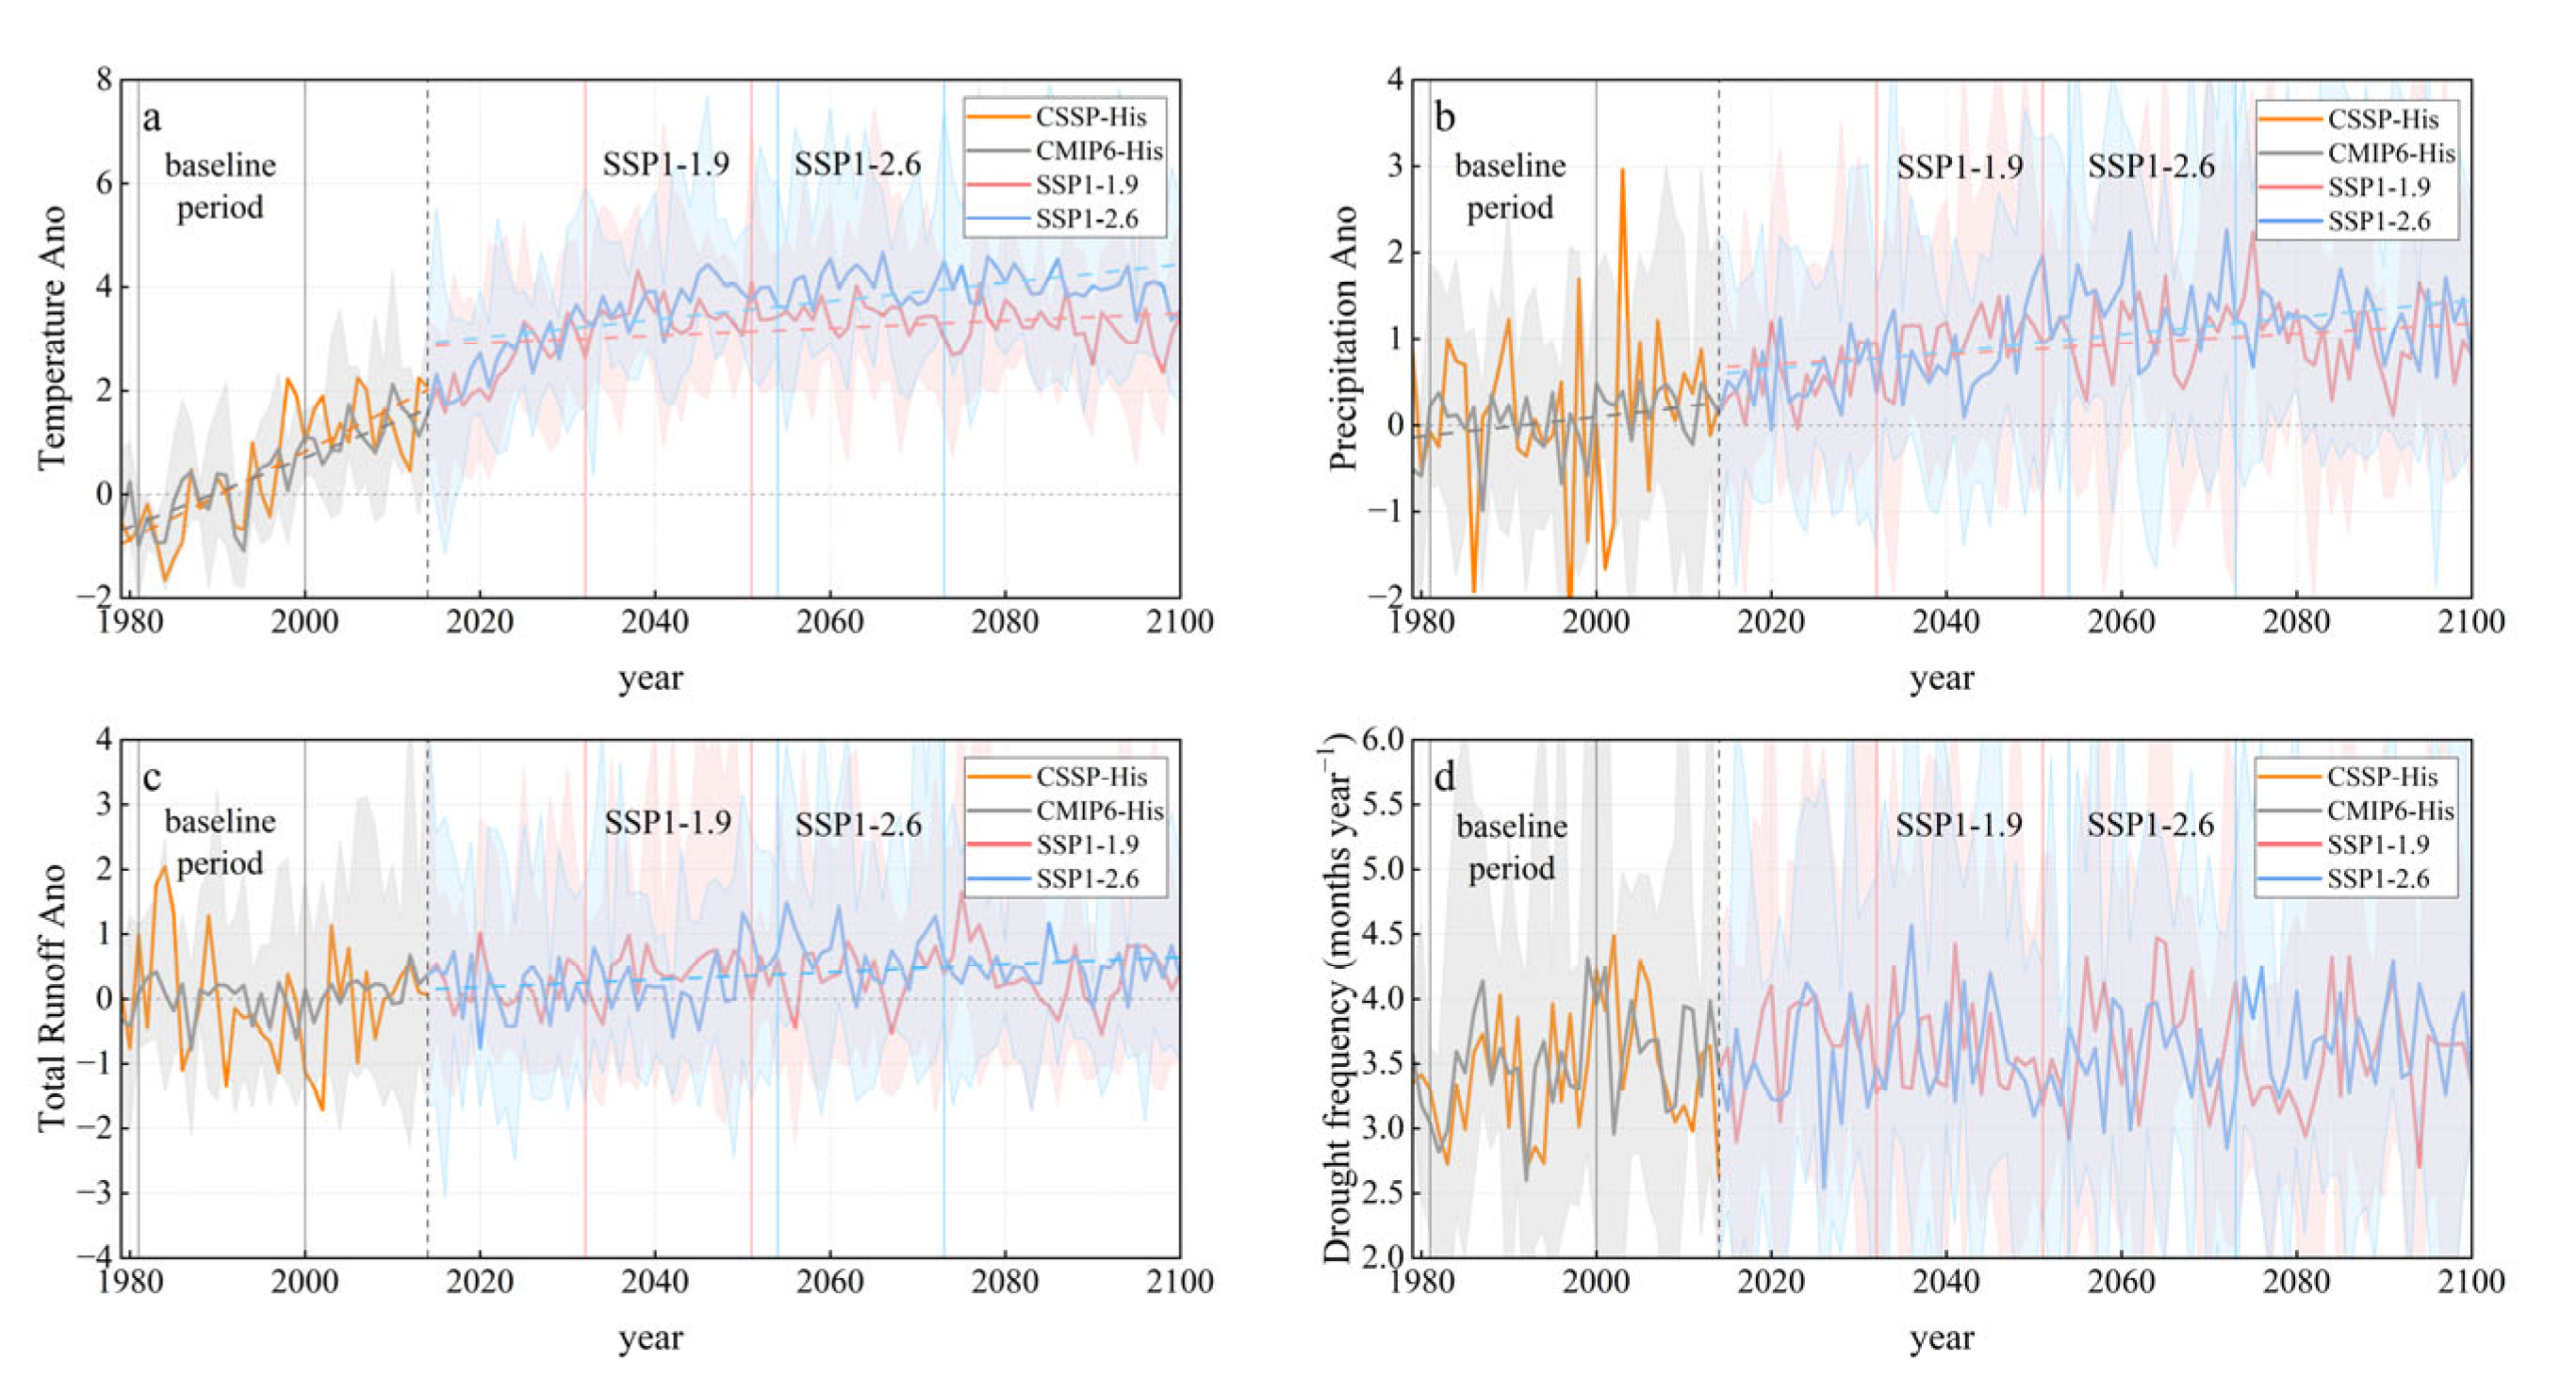
3.2.1. Changes in Hydrometeorological Regime
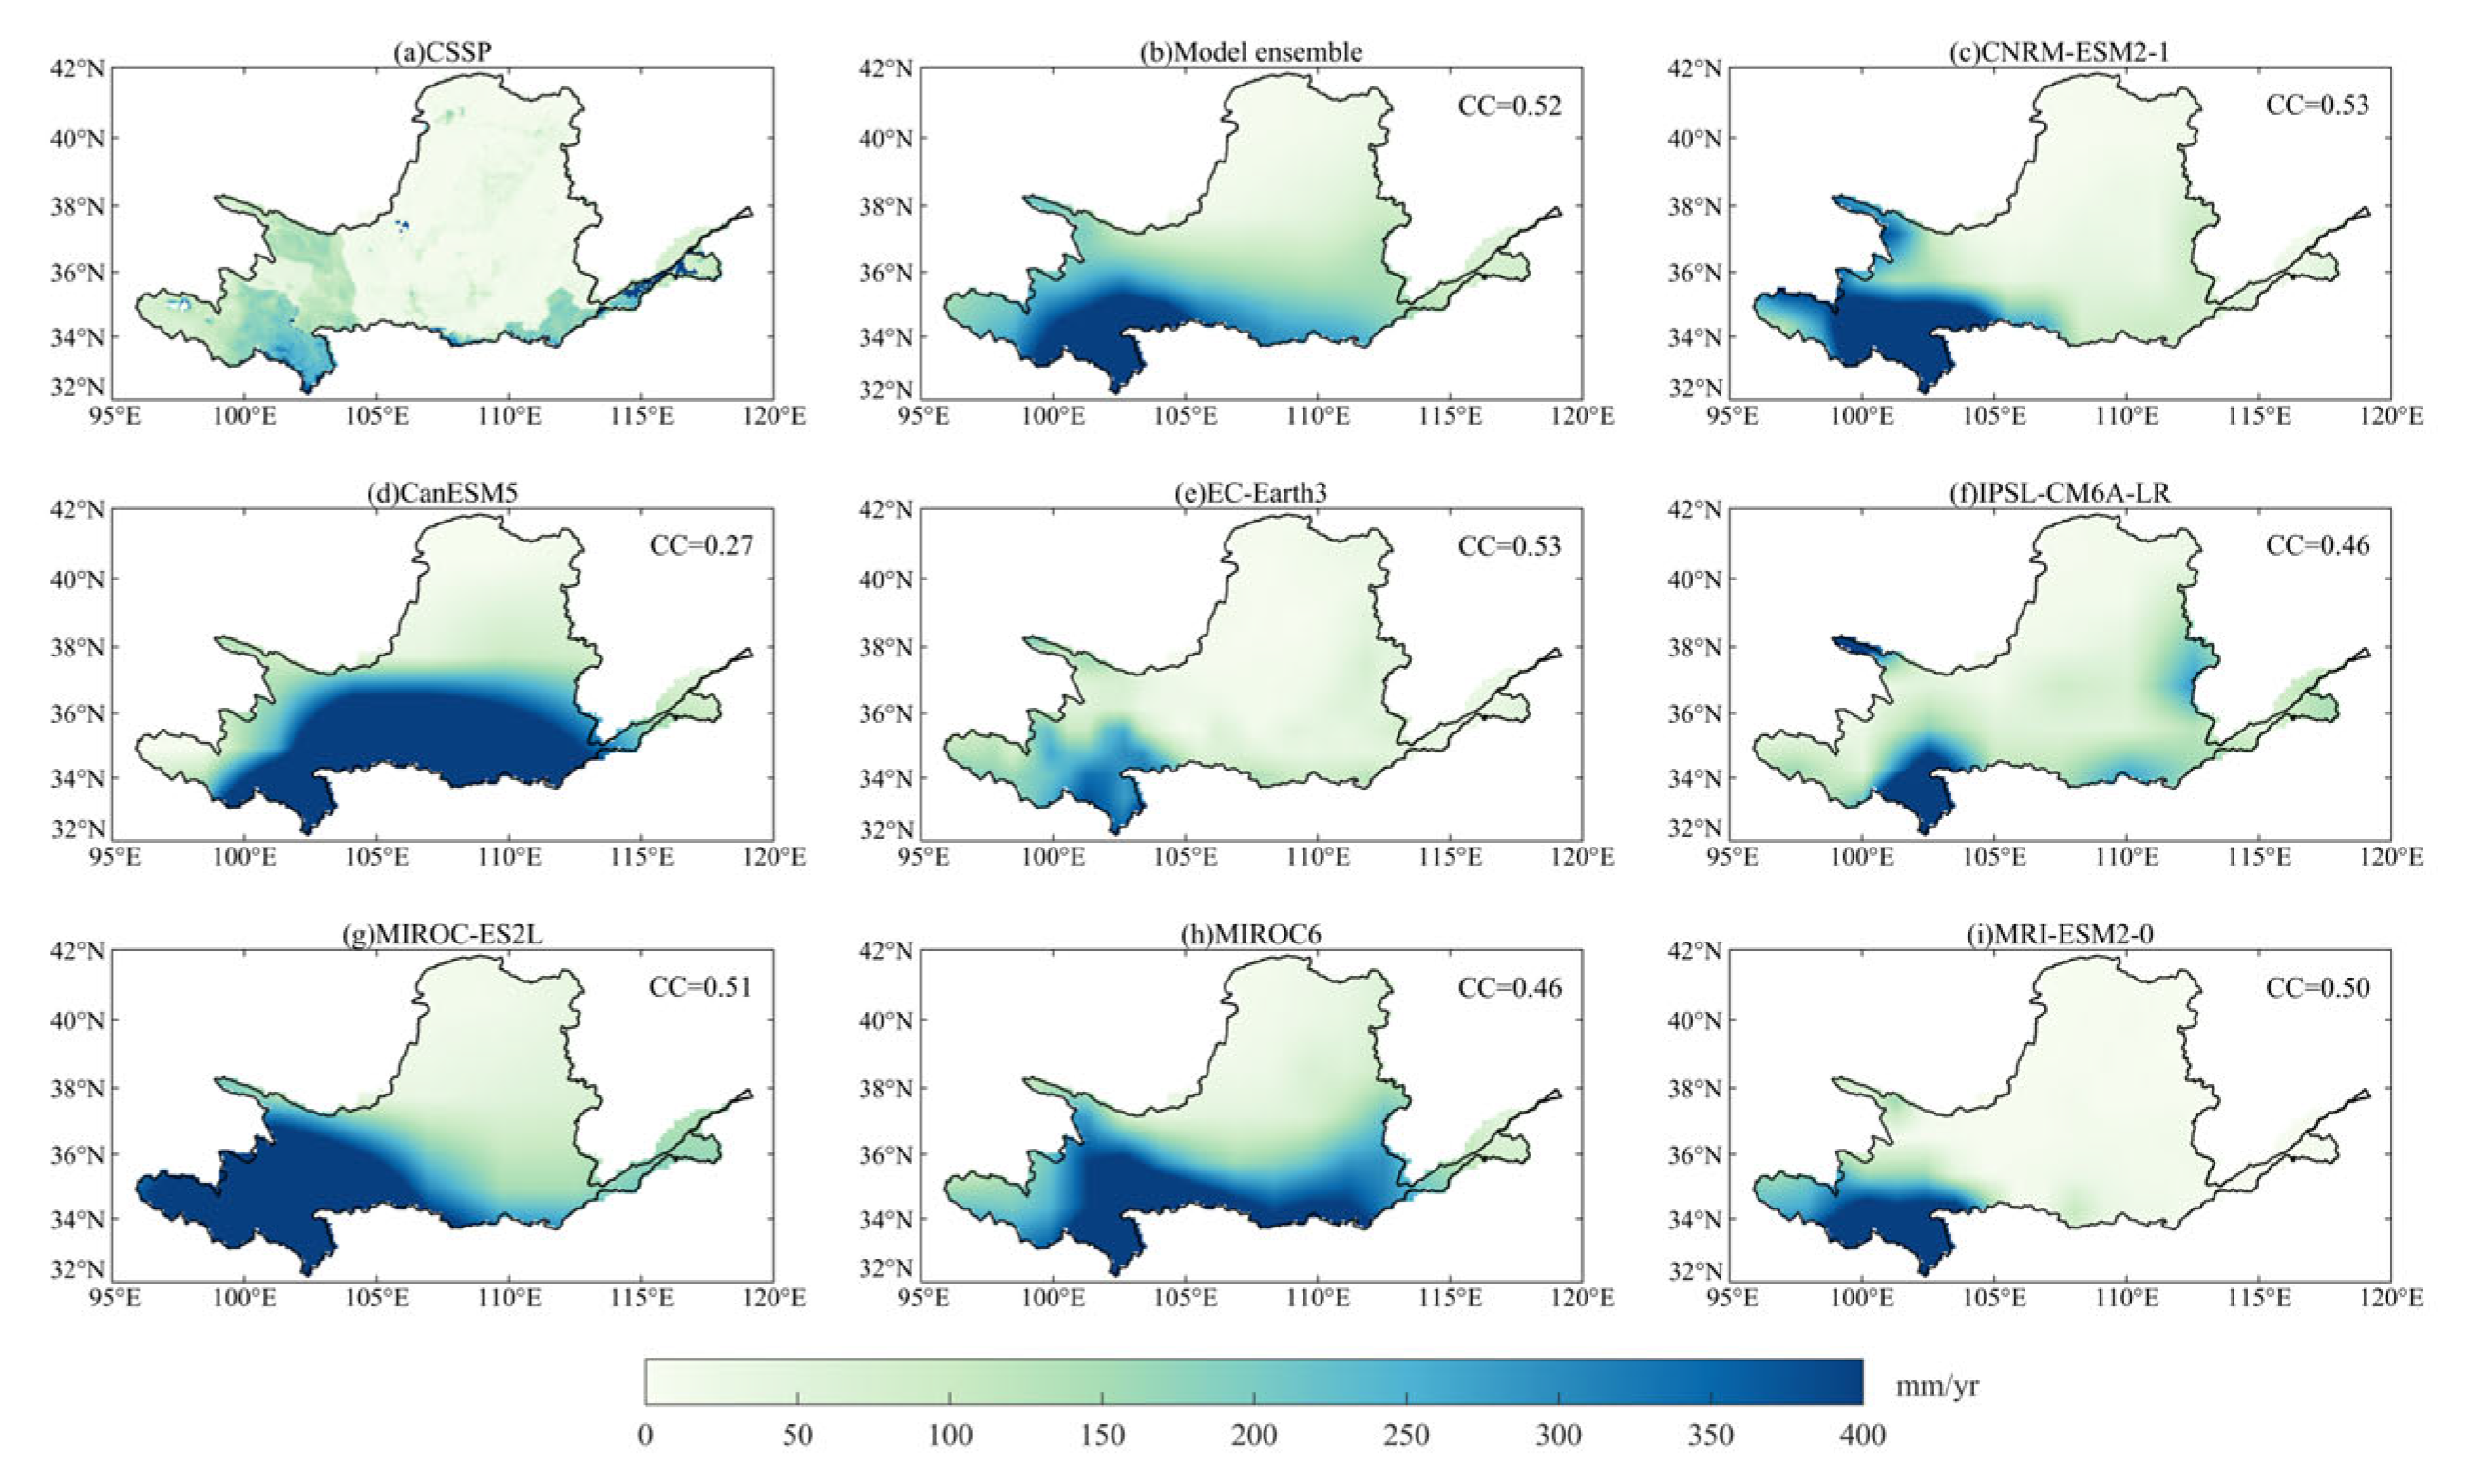
3.2.2. Spatial Patterns of Temperature, Precipitation, and Total Runoff
3.3. Hydrological and Meteorological Drought Characteristics
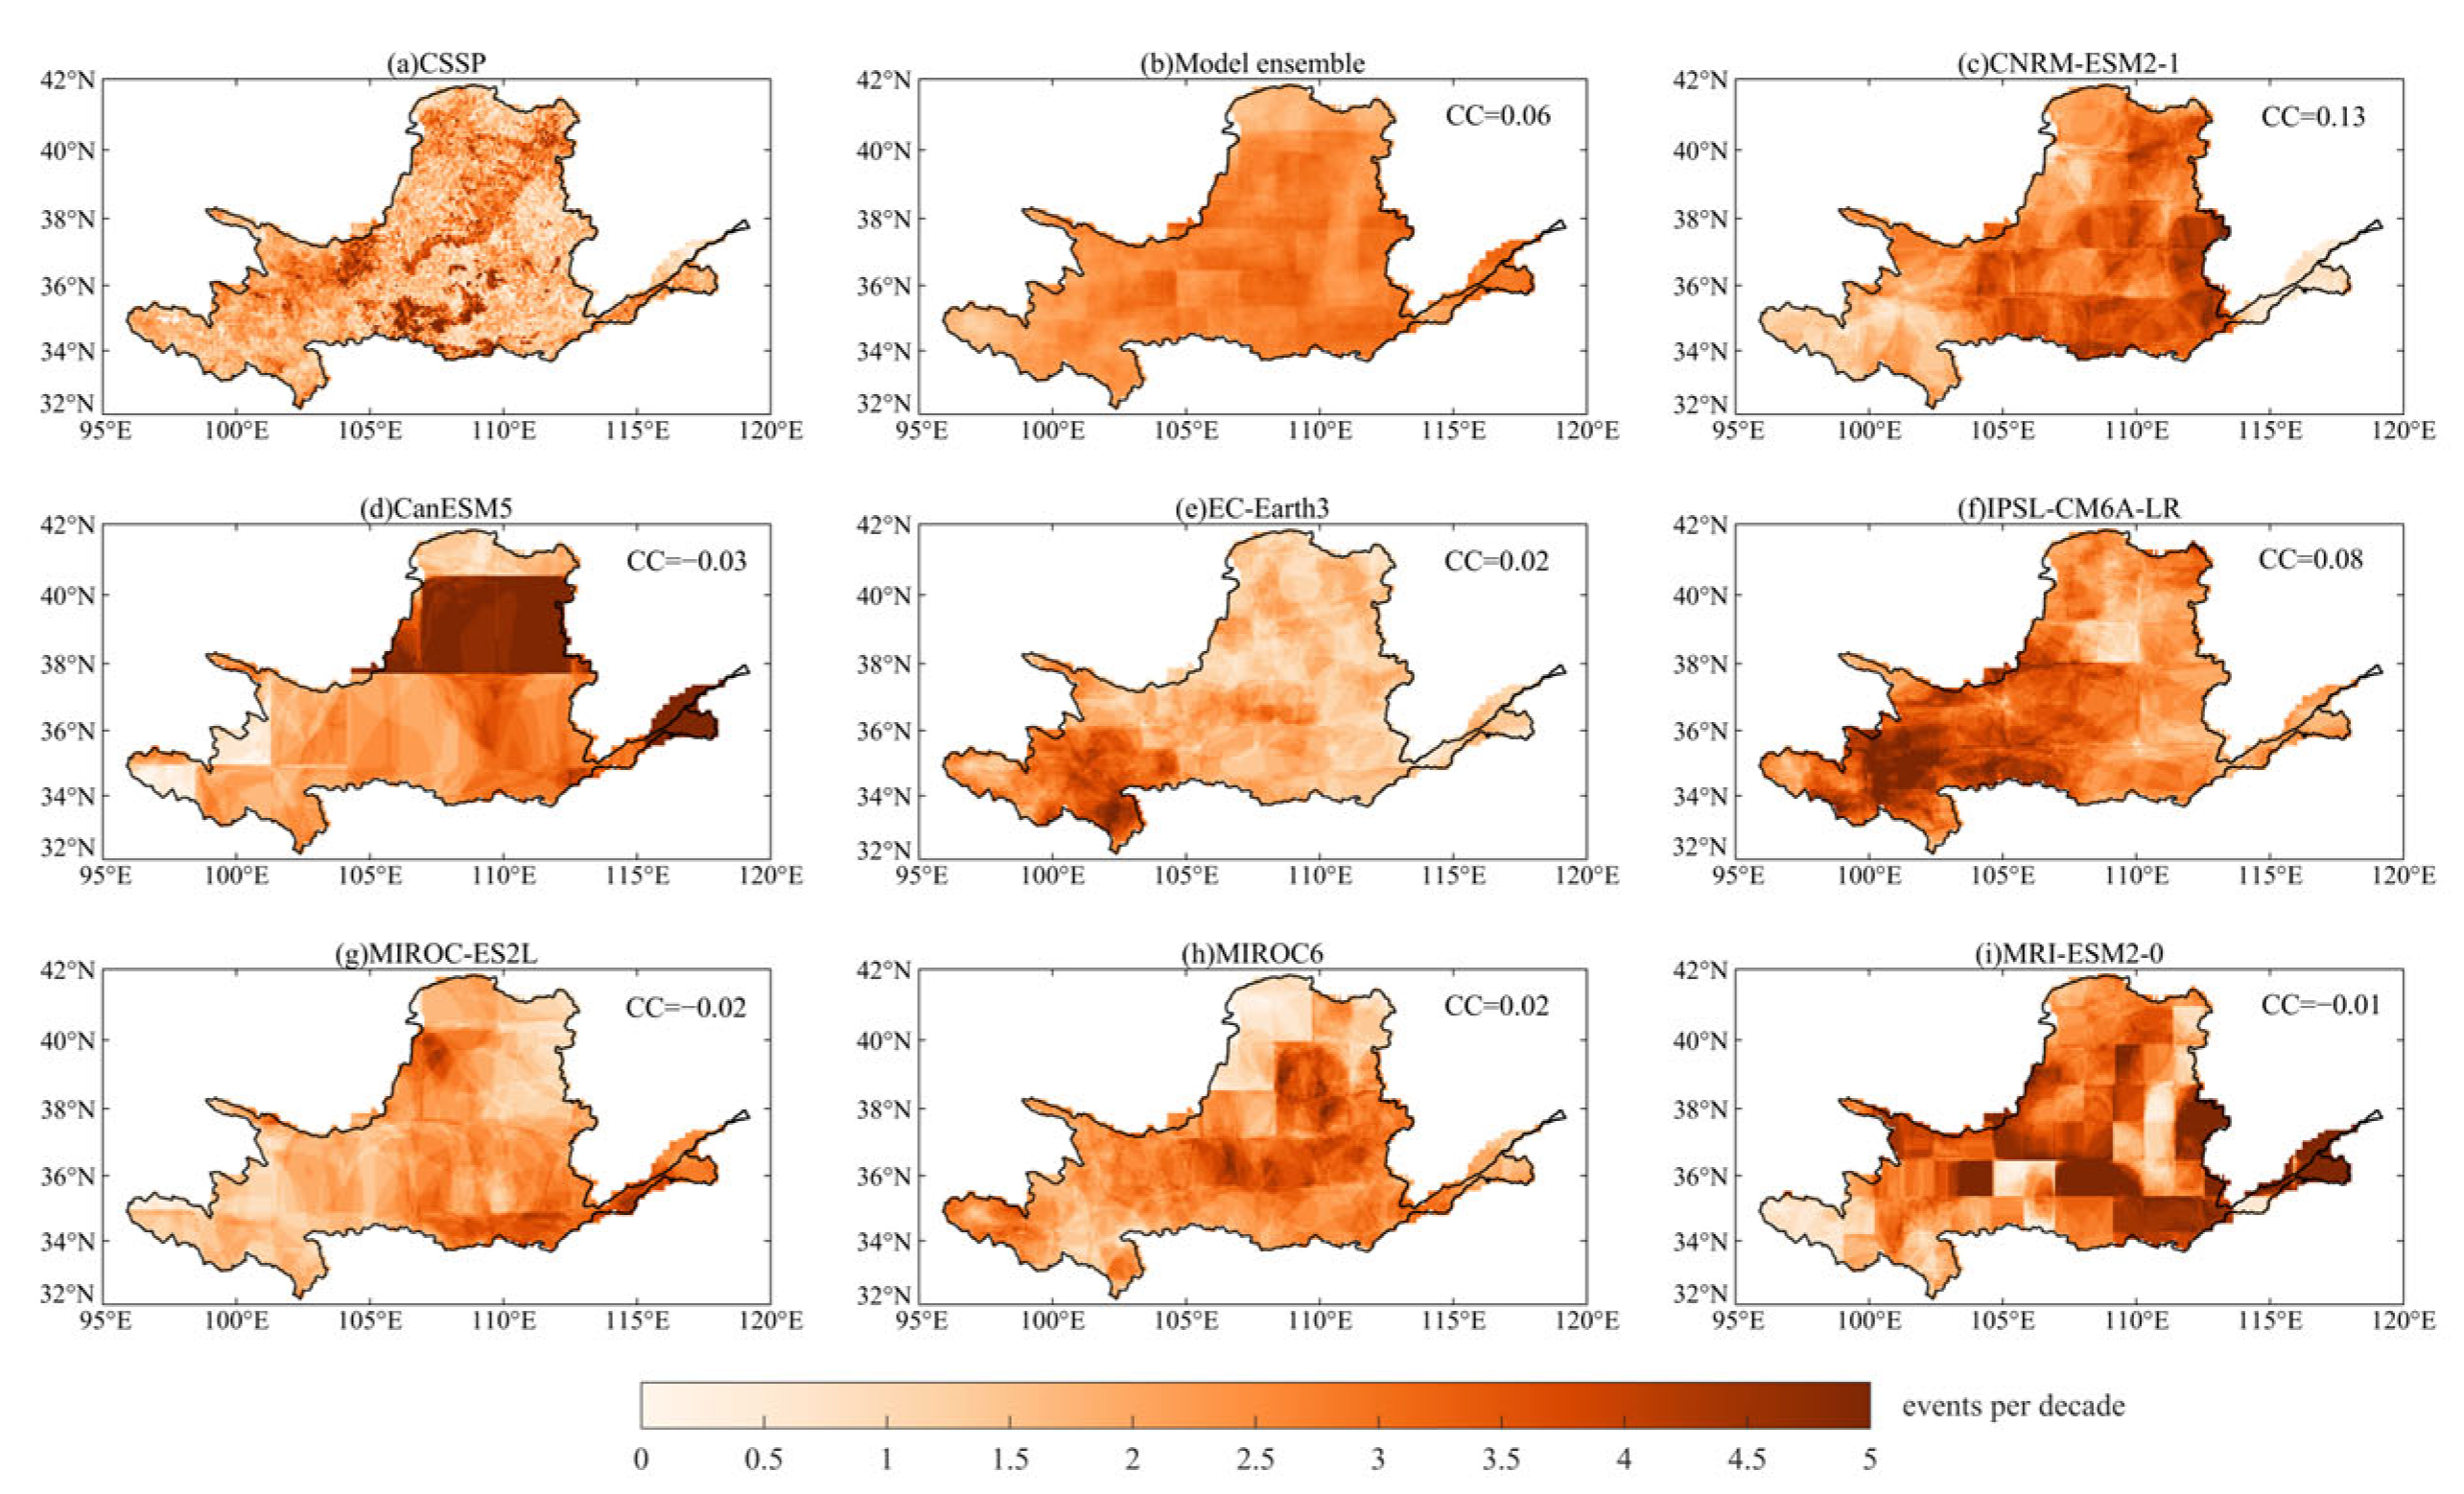
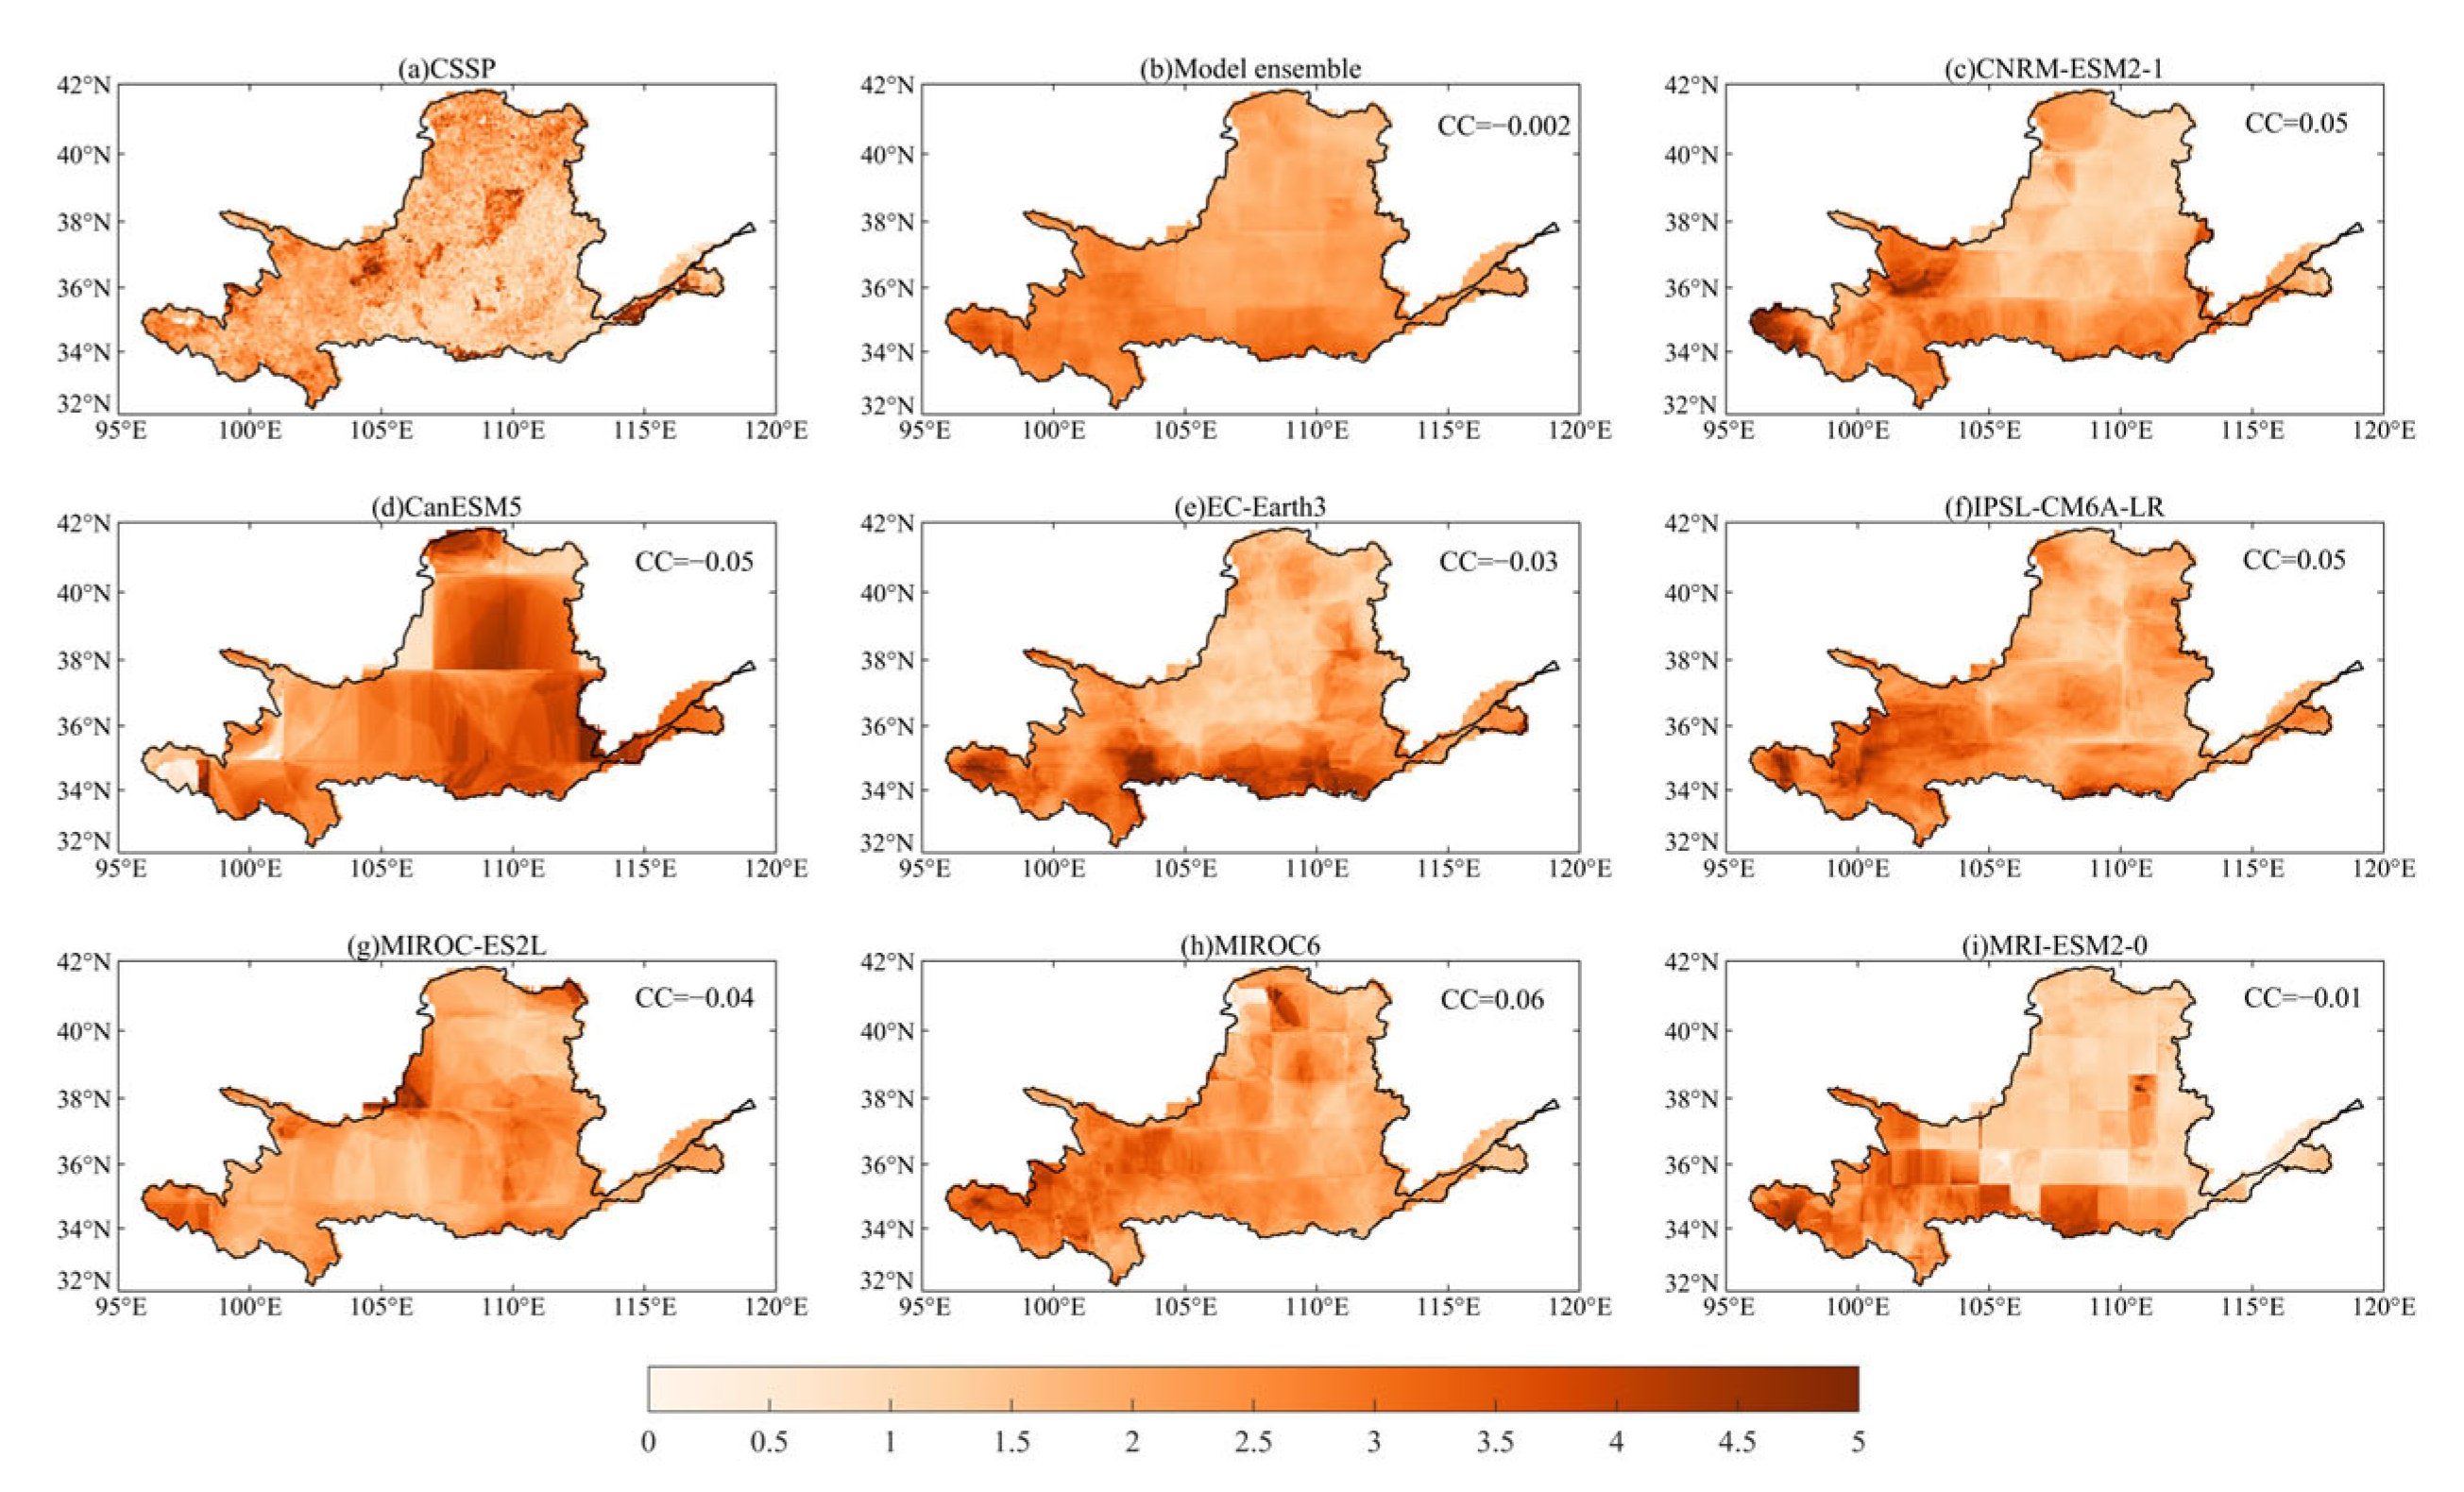
3.3.1. Hydrological Drought Characteristics
3.3.2. Basin-Averaged Drought Characteristics
3.3.3. Meteorological Drought Characteristics
4. Discussion
5. Conclusions
- The CMIP6 model ensemble mean can capture the historical changes well, while the warming trend in the YRB is slightly underestimated. During the future period, the CMIP6 model-ensembled temperature and precipitation in both SSP scenarios and the total runoff under SSP1-2.6 increase significantly, and the changing trends are faster for SSP1-2.6 compared to SSP1-1.9. Although not significant, the hydrological drought frequency decreases under SSP1-1.9, while it increases under SSP1-2.6.
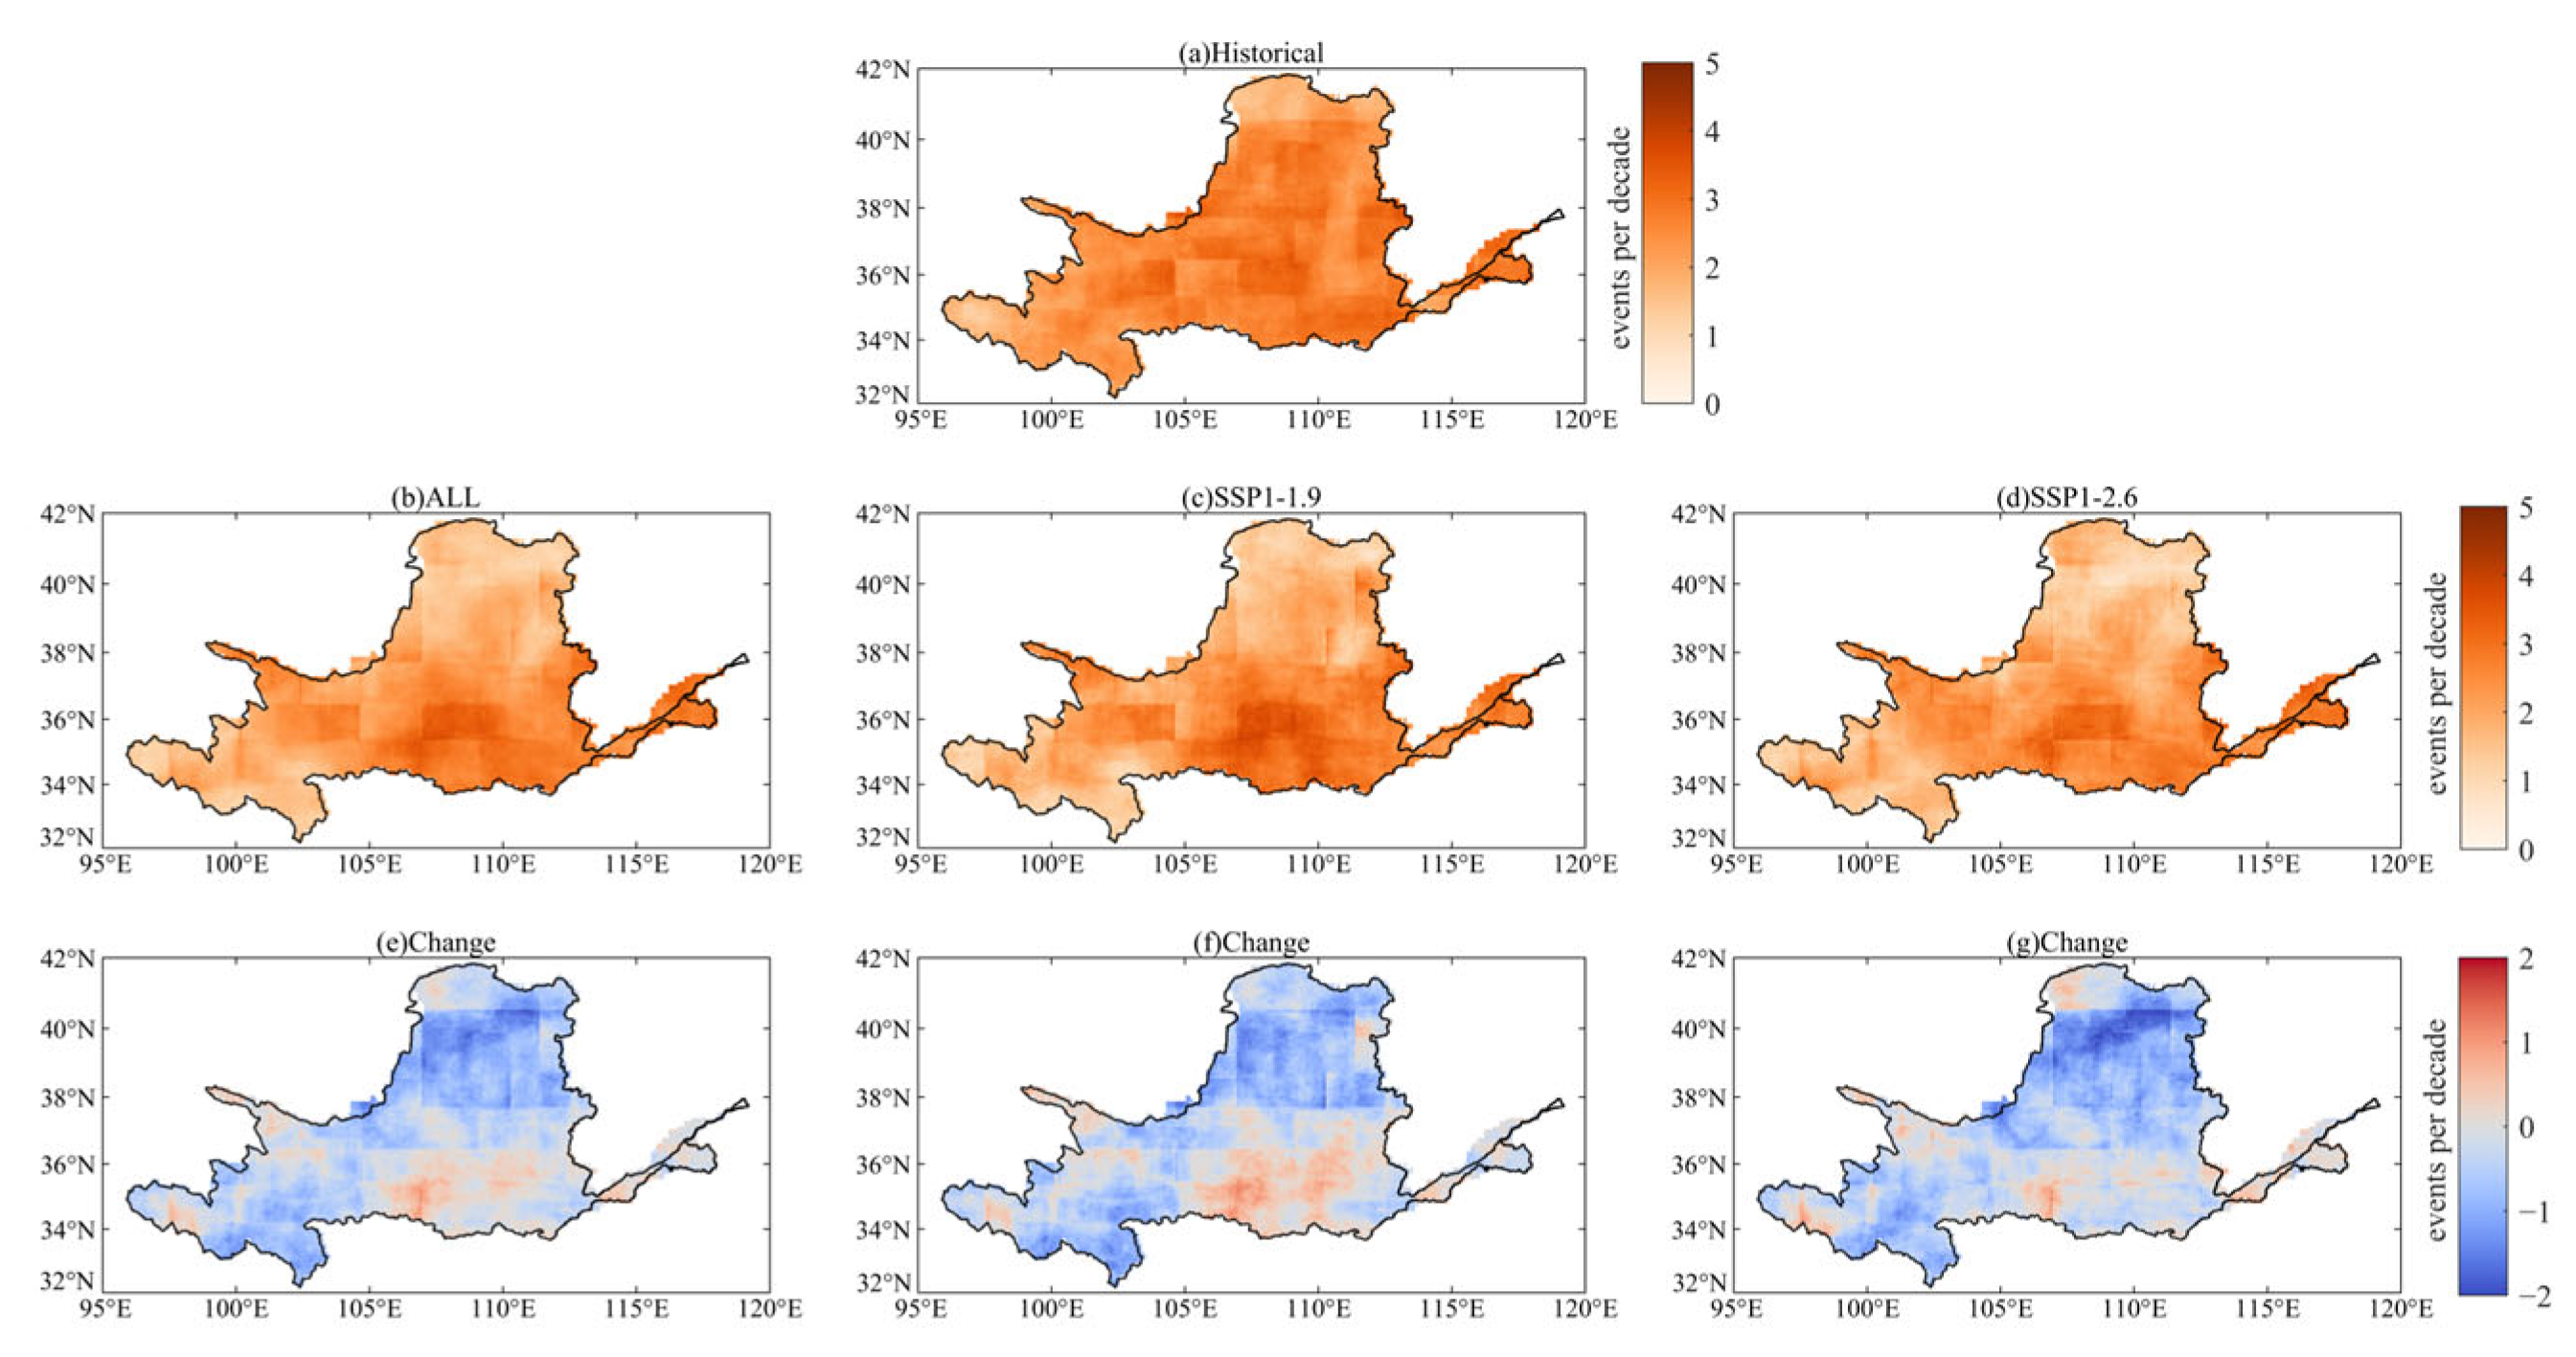
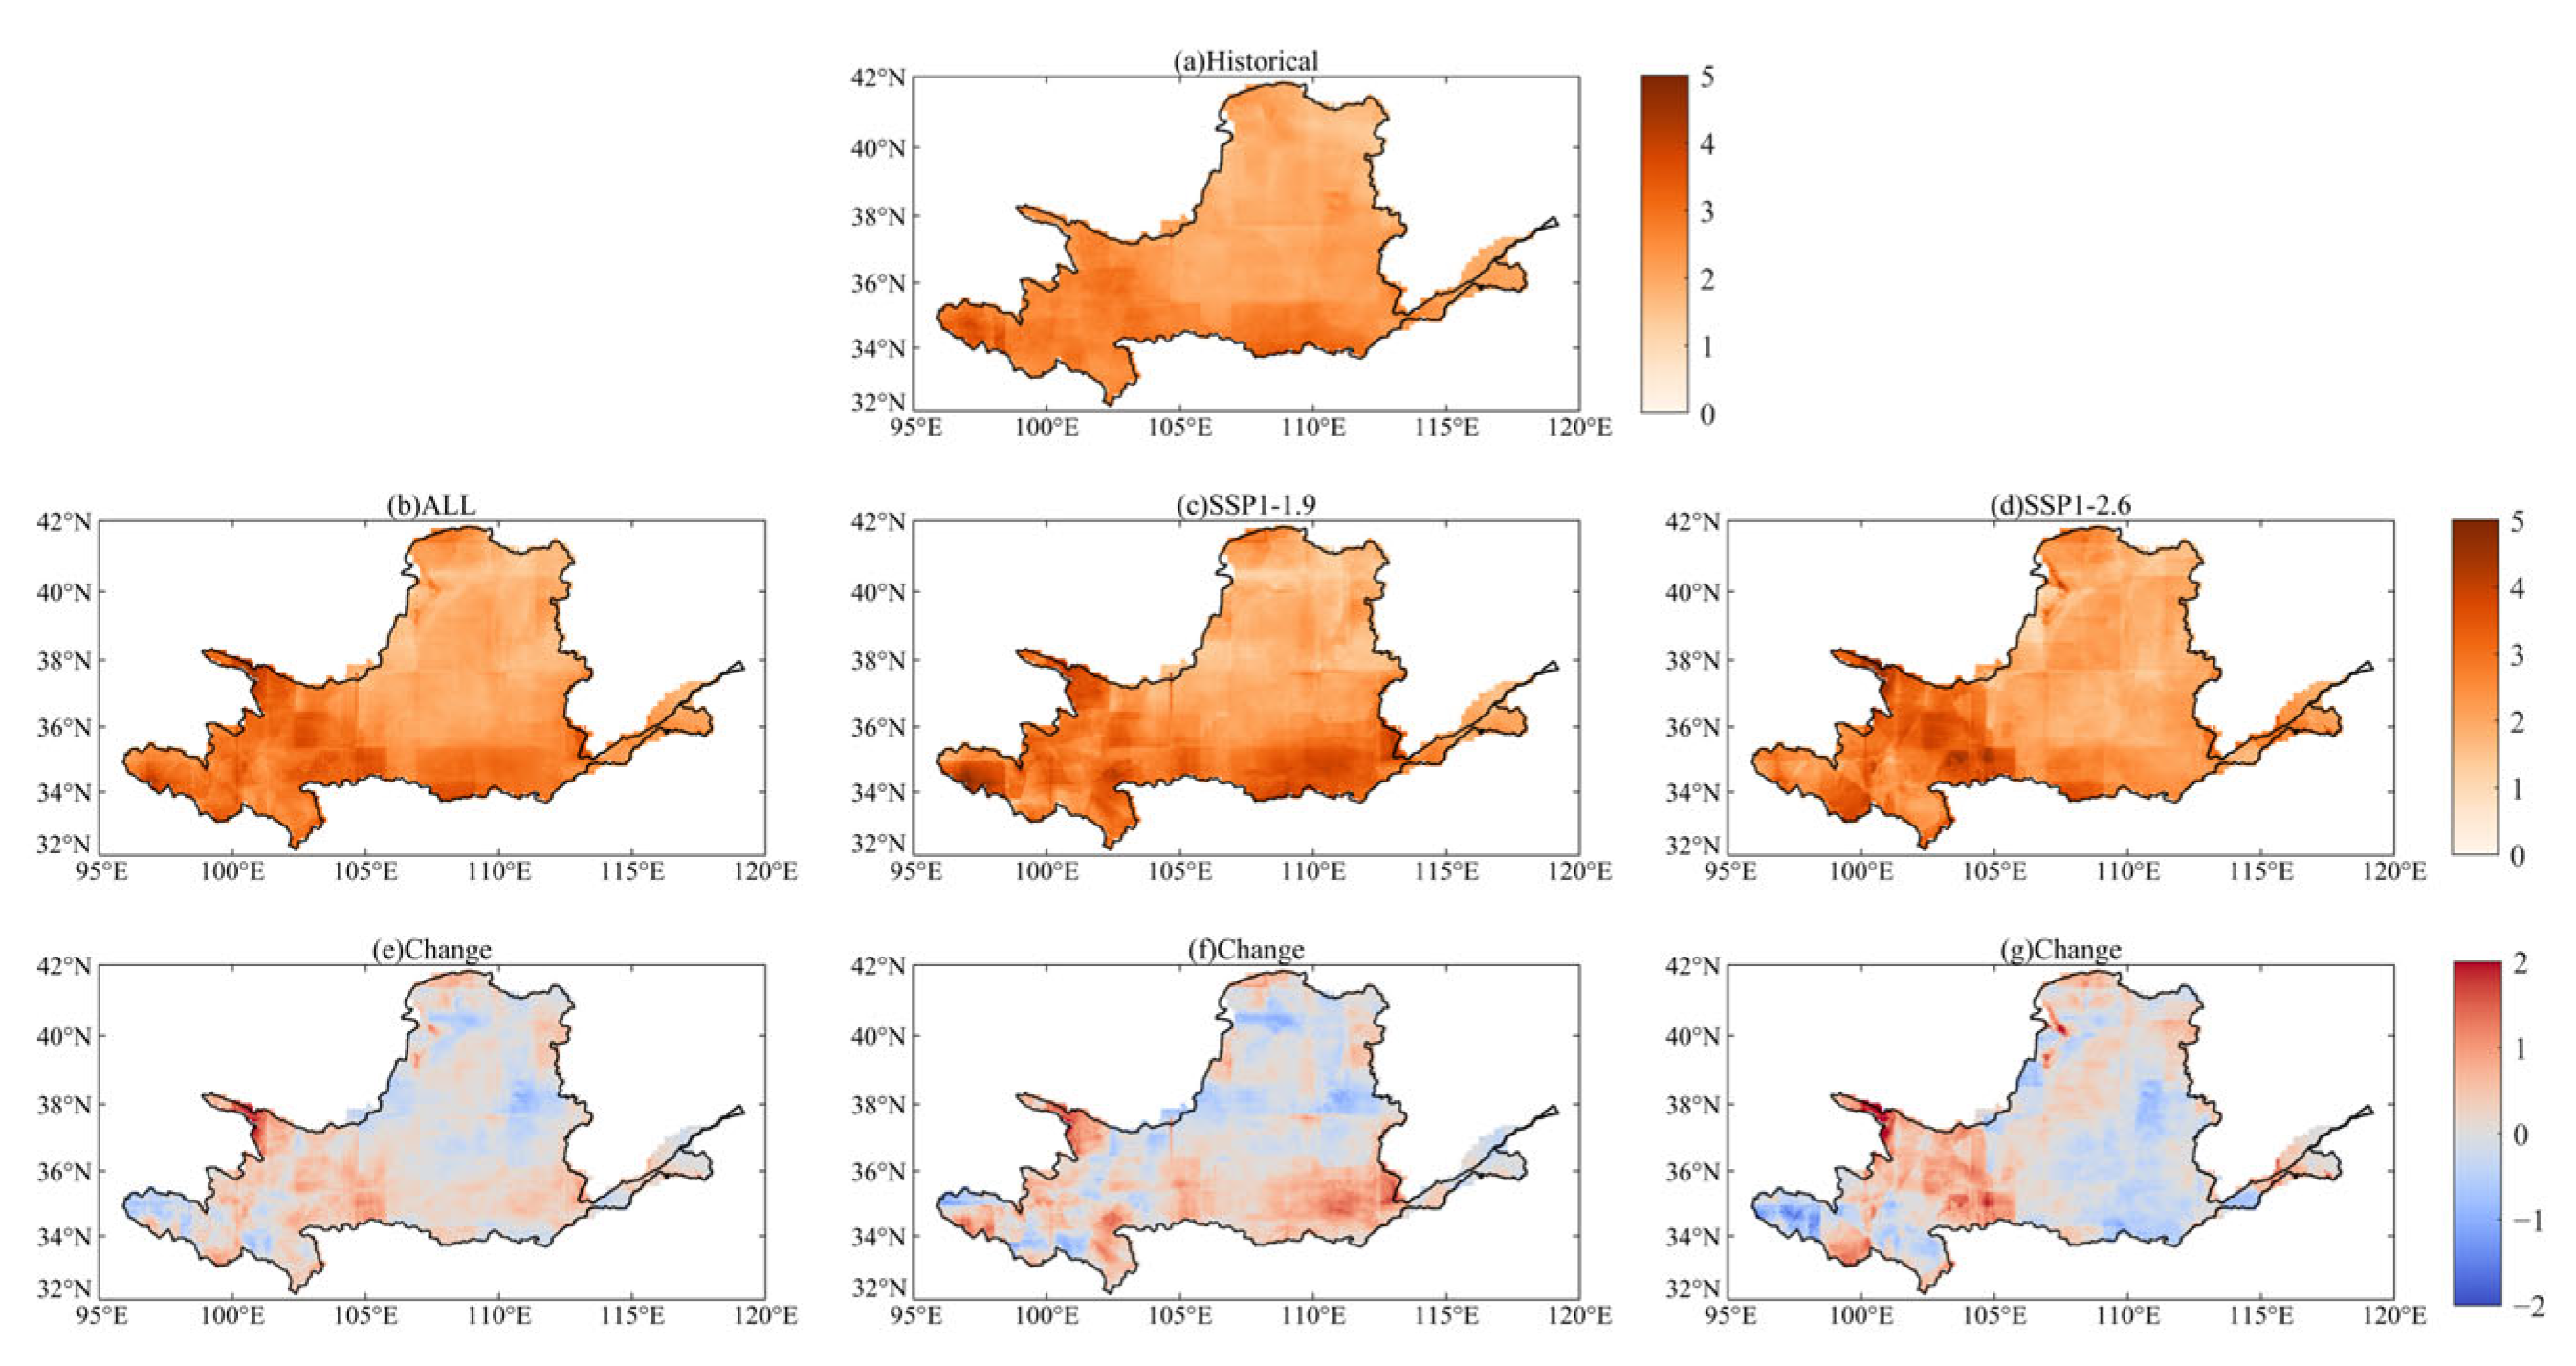
- The CMIP6 model ensemble overestimates both the drought frequency and severity in historical periods. In carbon-neutral periods, the hydrological drought frequency generally decreases, with a large decline in the northern YRB, while the drought severity will increase under both scenarios, with rises mainly in the sources, upper reaches, and southern part of the YRB, compared to historical periods. Generally, the hydrological drought frequency will decrease by 15.5% (13.0–18.1%), and the drought severity is projected to rise by 14.4% (13.2–15.7%) in carbon-neutral periods.
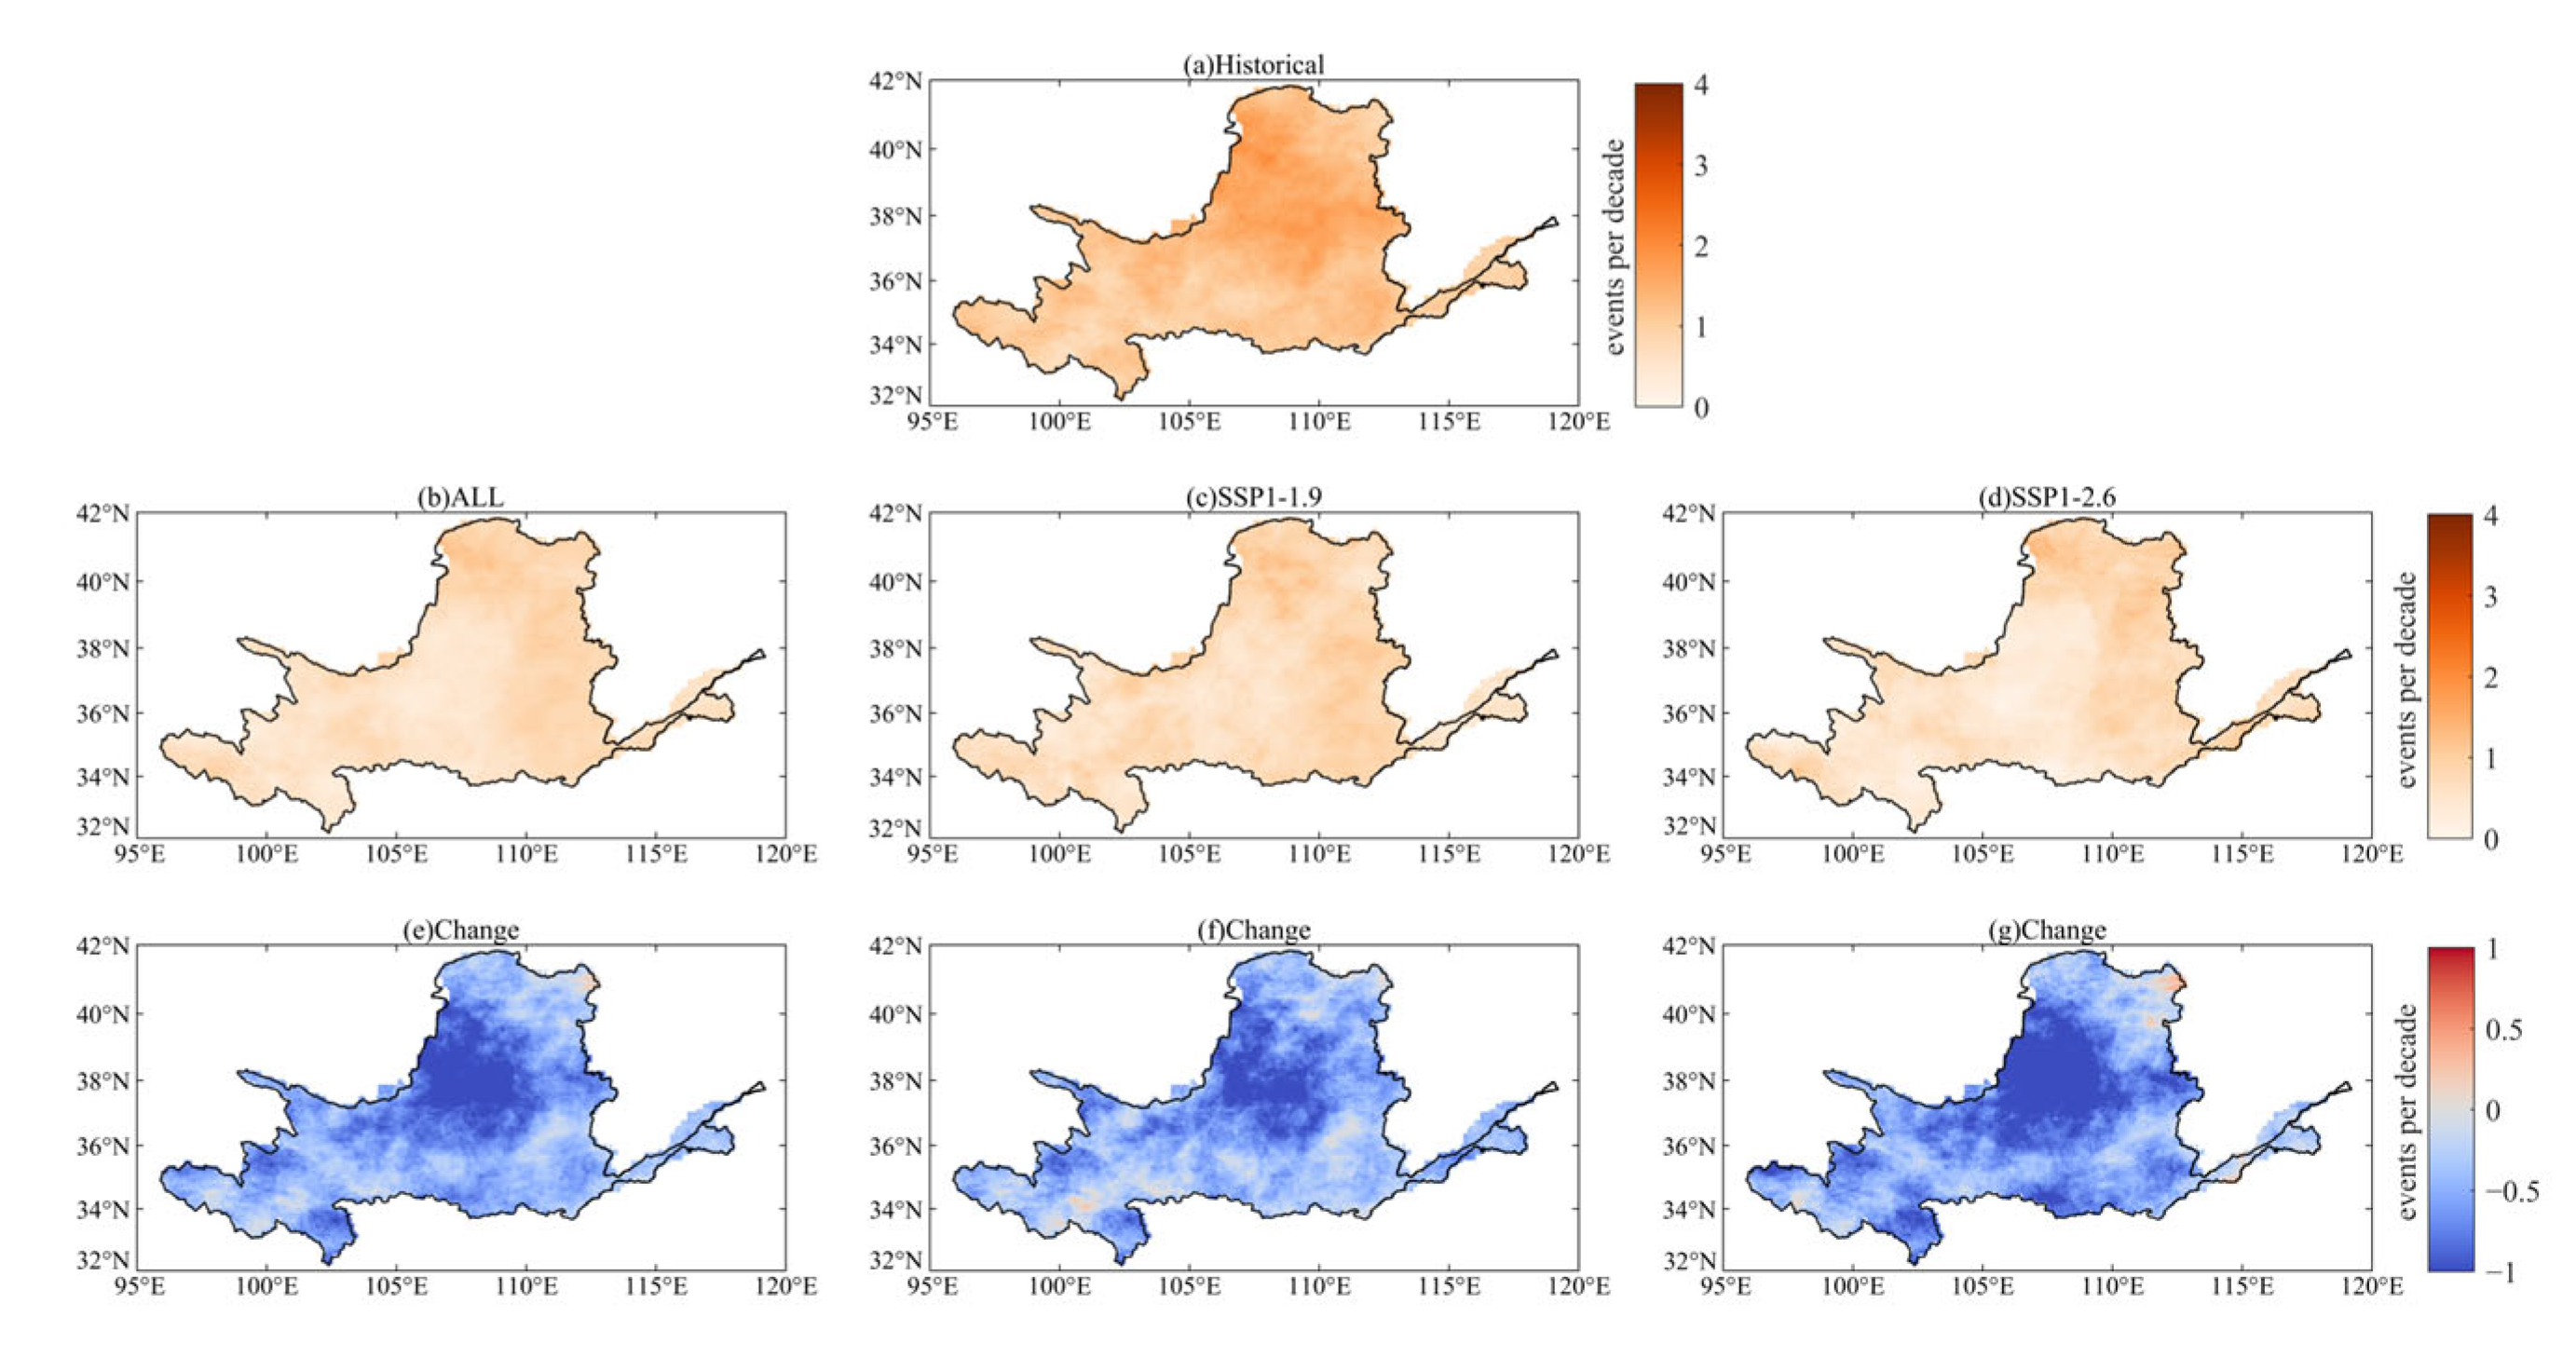
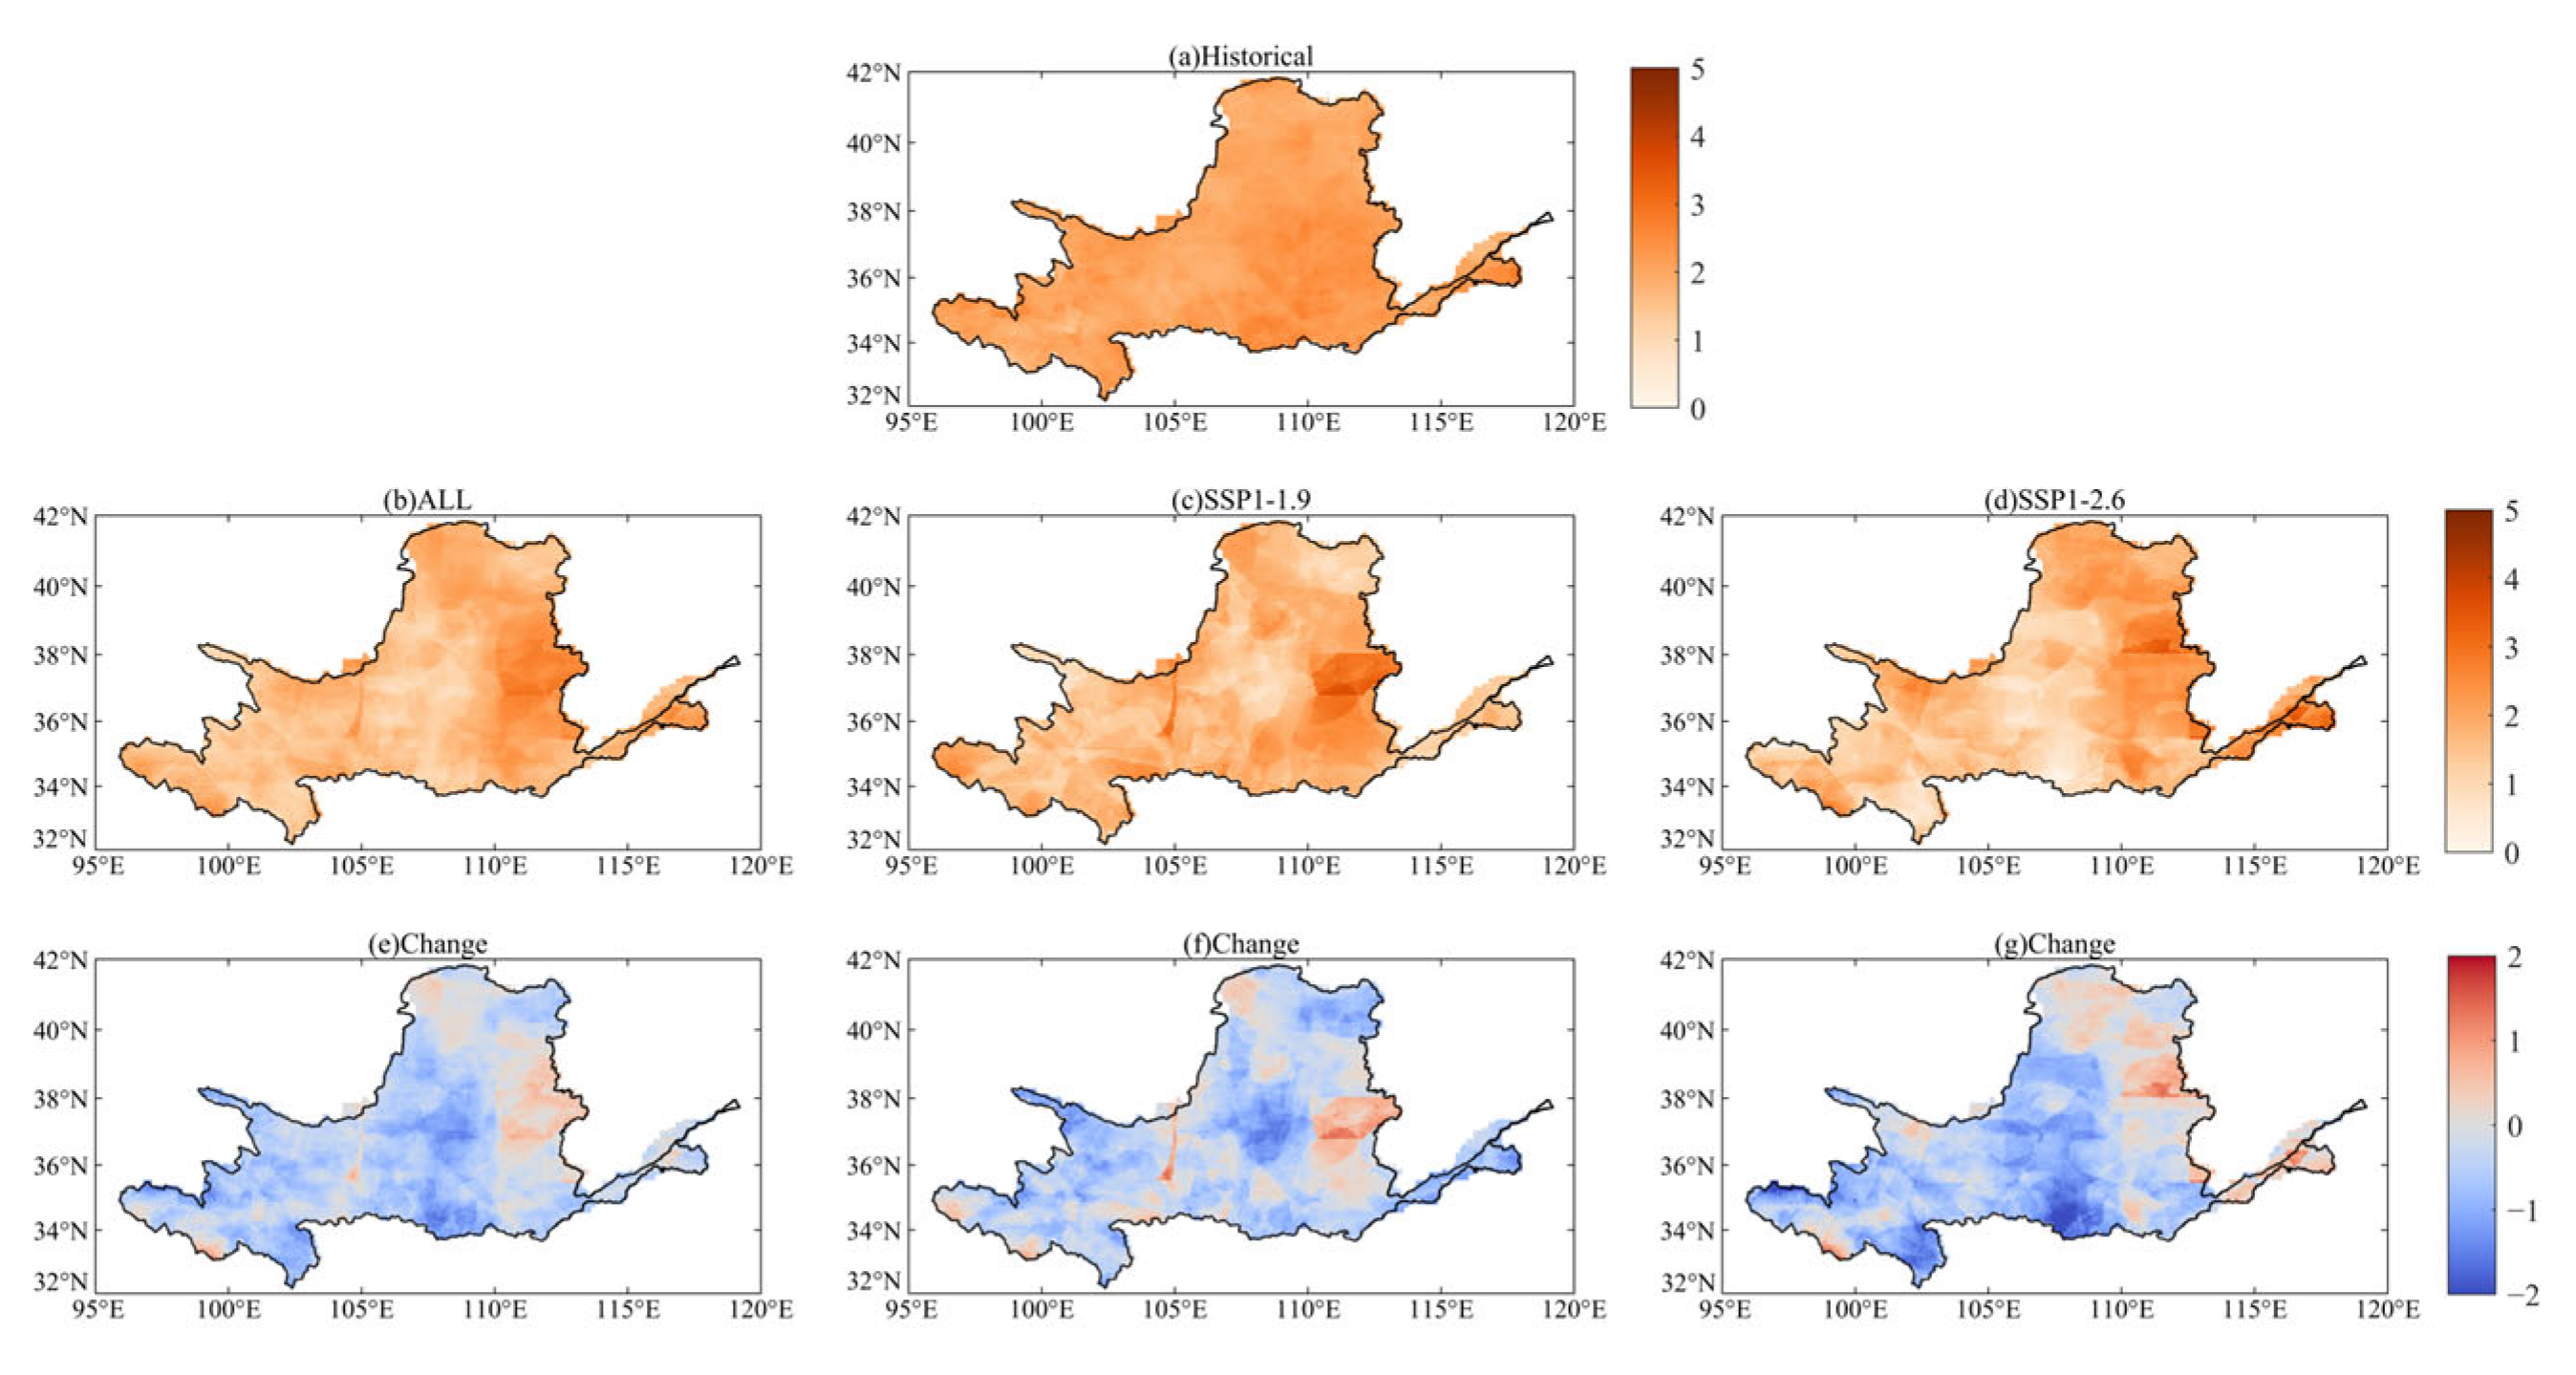
- Meteorological droughts exhibit a similar changing trend to hydrological droughts during the carbon-neutral period; however, the variations in spatial patterns differ in their magnitude and critical regions. The frequency of meteorological droughts will decrease, especially in the central region, while the drought severity will increase in the northern basin. SSP1-2.6 is projected to experience a more substantial reduction in drought frequency compared to SSP1-1.9.
Supplementary Materials
Author Contributions
Funding
Data Availability Statement
Acknowledgments
Conflicts of Interest
References
- Russo, S.; Dosio, A.; Graversen, R.G.; Sillmann, J.; Carrao, H.; Dunbar, M.B.; Singleton, A.; Montagna, P.; Barbola, P.; Vogt, J.V. Magnitude of Extreme Heat Waves in Present Climate and Their Projection in a Warming World. J. Geophys. Res. Atmos. 2014, 119. [Google Scholar] [CrossRef]
- Wang, X.; Zhao, C.; Müller, C.; Wang, C.; Ciais, P.; Janssens, I.; Peñuelas, J.; Asseng, S.; Li, T.; Elliott, J.; et al. Emergent Constraint on Crop Yield Response to Warmer Temperature from Field Experiments. Nat. Sustain. 2020, 3, 908–916. [Google Scholar] [CrossRef]
- Dai, A. Increasing Drought under Global Warming in Observations and Models. Nat. Clim. Chang. 2013, 3, 52–58. [Google Scholar] [CrossRef]
- Trenberth, K.E.; Dai, A.; Van Der Schrier, G.; Jones, P.D.; Barichivich, J.; Briffa, K.R.; Sheffield, J. Global Warming and Changes in Drought. Nat. Clim. Chang. 2014, 4, 17–22. [Google Scholar] [CrossRef]
- Donat, M.G.; Lowry, A.L.; Alexander, L.V.; O’Gorman, P.A.; Maher, N. More Extreme Precipitation in the World’s Dry and Wet Regions. Nat. Clim. Chang. 2016, 6, 508–513. [Google Scholar] [CrossRef]
- Degefu, M.A.; Bewket, W. Variability and Trends in Rainfall Amount and Extreme Event Indices in the Omo-Ghibe River Basin, Ethiopia. Reg. Environ. Chang. 2014, 14, 799–810. [Google Scholar] [CrossRef]
- Gaffin, S.R.; Rosenzweig, C.; Xing, X.; Yetman, G. Downscaling and Geo-Spatial Gridding of Socio-Economic Projections from the IPCC Special Report on Emissions Scenarios (SRES). Glob. Environ. Chang. 2004, 14, 105–123. [Google Scholar] [CrossRef]
- Climate Change 2021: The Physical Science Basis. In Contribution of Working Group I to the Sixth Assessment Report of the Intergovernmental Panel on Climate Change; Cambridge University Press: Cambridge, UK; New York, NY, USA, 2021; pp. 33–144.
- Huang, J.; Zhai, J.; Jiang, T.; Wang, Y.; Li, X.; Wang, R.; Xiong, M.; Su, B.; Fischer, T. Analysis of Future Drought Characteristics in China Using the Regional Climate Model CCLM. Clim. Dynam. 2018, 50, 507–525. [Google Scholar] [CrossRef]
- Su, B.; Huang, J.; Fischer, T.; Wang, Y.; Kundzewicz, Z.W.; Zhai, J.; Sun, H.; Wang, A.; Zeng, X.; Wang, G.; et al. Drought Losses in China Might Double between the 1.5 °C and 2.0 °C Warming. Proc. Natl. Acad. Sci. USA 2018, 115, 10600–10605. [Google Scholar] [CrossRef]
- Zhai, J.; Huang, J.; Su, B.; Cao, L.; Wang, Y.; Jiang, T.; Fischer, T. Intensity–Area–Duration Analysis of Droughts in China 1960–2013. Clim. Dynam. 2017, 48, 151–168. [Google Scholar] [CrossRef]
- Yao, N.; Li, L.; Feng, P.; Feng, H.; Li Liu, D.; Liu, Y.; Jiang, K.; Hu, X.; Li, Y. Projections of Drought Characteristics in China Based on a Standardized Precipitation and Evapotranspiration Index and Multiple GCMs. Sci. Total Environ. 2020, 704, 135245. [Google Scholar] [CrossRef] [PubMed]
- Hao, Z.; Singh, V.P. Drought Characterization from a Multivariate Perspective: A Review. J. Hydrol. 2015, 527, 668–678. [Google Scholar] [CrossRef]
- AghaKouchak, A.; Chiang, F.; Huning, L.S.; Love, C.A.; Mallakpour, I.; Mazdiyasni, O.; Moftakhari, H.; Papalexiou, S.M.; Ragno, E.; Sadegh, M. Climate Extremes and Compound Hazards in a Warming World. Annu. Rev. Earth Planet Sci. 2020, 48, 519–548. [Google Scholar] [CrossRef]
- Jiang, T.; Lü, Y.; Huang, J.; Wang, Y.; Su, B.; Tao, H. New Scenarios of CMIP6 Model (SSP-RCP) and Its Application in the Huaihe River Basin. Adv. Meteorol. Sci. Technol. 2020, 10, 102–109. [Google Scholar] [CrossRef]
- Gidden, M.J.; Riahi, K.; Smith, S.J.; Fujimori, S.; Luderer, G.; Kriegler, E.; Van Vuuren, D.P.; Van Den Berg, M.; Feng, L.; Klein, D.; et al. Global Emissions Pathways under Different Socioeconomic Scenarios for Use in CMIP6: A Dataset of Harmonized Emissions Trajectories through the End of the Century. Geosci. Model Dev. 2019, 12, 1443–1475. [Google Scholar] [CrossRef]
- O’Neill, B.C.; Tebaldi, C.; Van Vuuren, D.P.; Eyring, V.; Friedlingstein, P.; Hurtt, G.; Knutti, R.; Kriegler, E.; Lamarque, J.-F.; Lowe, J.; et al. The Scenario Model Intercomparison Project (ScenarioMIP) for CMIP6. Geosci. Model Dev. 2016, 9, 3461–3482. [Google Scholar] [CrossRef]
- Tebaldi, C.; Debeire, K.; Eyring, V.; Fischer, E.; Fyfe, J.; Friedlingstein, P.; Knutti, R.; Lowe, J.; O’Neill, B.; Sanderson, B.; et al. Climate Model Projections from the Scenario Model Intercomparison Project (ScenarioMIP) of CMIP6. Earth Syst. Dynam. 2021, 12, 253–293. [Google Scholar] [CrossRef]
- Wang, Z.; Zhong, R.; Lai, C.; Zeng, Z.; Lian, Y.; Bai, X. Climate Change Enhances the Severity and Variability of Drought in the Pearl River Basin in South China in the 21st Century. Agr. For. Meteorol. 2018, 249, 149–162. [Google Scholar] [CrossRef]
- Mondal, S.K.; Huang, J.; Wang, Y.; Su, B.; Zhai, J.; Tao, H.; Wang, G.; Fischer, T.; Wen, S.; Jiang, T. Doubling of the Population Exposed to Drought over South Asia: CMIP6 Multi-Model-Based Analysis. Sci. Total Environ. 2021, 771, 145186. [Google Scholar] [CrossRef]
- Cook, B.I.; Mankin, J.S.; Marvel, K.; Williams, A.P.; Smerdon, J.E.; Anchukaitis, K.J. Twenty-First Century Drought Projections in the CMIP6 Forcing Scenarios. Earth’s Future 2020, 8, e2019EF001461. [Google Scholar] [CrossRef]
- Ukkola, A.M.; De Kauwe, M.G.; Roderick, M.L.; Abramowitz, G.; Pitman, A.J. Robust Future Changes in Meteorological Drought in CMIP6 Projections Despite Uncertainty in Precipitation. Geophys. Res. Lett. 2020, 47, e2020GL087820. [Google Scholar] [CrossRef]
- Zhai, J.; Mondal, S.K.; Fischer, T.; Wang, Y.; Su, B.; Huang, J.; Tao, H.; Wang, G.; Ullah, W.; Uddin, M.J. Future Drought Characteristics through a Multi-Model Ensemble from CMIP6 over South Asia. Atmos. Res. 2020, 246, 105111. [Google Scholar] [CrossRef]
- Su, B.; Huang, J.; Mondal, S.K.; Zhai, J.; Wang, Y.; Wen, S.; Gao, M.; Lv, Y.; Jiang, S.; Jiang, T.; et al. Insight from CMIP6 SSP-RCP Scenarios for Future Drought Characteristics in China. Atmos. Res. 2021, 250, 105375. [Google Scholar] [CrossRef]
- Zhang, M.; Yang, X.; Pan, M.; Zhang, L.; Fang, X.; Sheffield, J. Spatio-Temporal Characteristics and Driving Factors of the Meteorological Drought across China Based on CMIP6. Hydrol. Res. 2023, 54, 382–400. [Google Scholar] [CrossRef]
- Xu, F.; Bento, V.A.; Qu, Y.; Wang, Q. Projections of Global Drought and Their Climate Drivers Using CMIP6 Global Climate Models. Water 2023, 15, 2272. [Google Scholar] [CrossRef]
- Afsari, R.; Nazari-Sharabian, M.; Hosseini, A.; Karakouzian, M. A CMIP6 Multi-Model Analysis of the Impact of Climate Change on Severe Meteorological Droughts through Multiple Drought Indices—Case Study of Iran’s Metropolises. Water 2024, 16, 711. [Google Scholar] [CrossRef]
- Jiao, Y.; Yuan, X. More Severe Hydrological Drought Events Emerge at Different Warming Levels over the Wudinghe Watershed in Northern China. Hydrol. Earth Syst. Sci. 2019, 23, 621–635. [Google Scholar] [CrossRef]
- Chen, S.; Yuan, X. CMIP6 Projects Less Frequent Seasonal Soil Moisture Droughts over China in Response to Different Warming Levels. Environ. Res. Lett. 2021, 16, 044053. [Google Scholar] [CrossRef]
- Li, C.; Raj Kattel, G.; Zhang, J.; Shang, Y.; Gnyawali, K.R.; Zhang, F.; Miao, L. Slightly Enhanced Drought in the Yellow River Basin under Future Warming Scenarios. Atmos. Res. 2022, 280, 106423. [Google Scholar] [CrossRef]
- Piao, S.; Ciais, P.; Huang, Y.; Shen, Z.; Peng, S.; Li, J.; Zhou, L.; Liu, H.; Ma, Y.; Ding, Y.; et al. The Impacts of Climate Change on Water Resources and Agriculture in China. Nature 2010, 467, 43–51. [Google Scholar] [CrossRef]
- Yin, Z.; Ottlé, C.; Ciais, P.; Zhou, F.; Wang, X.; Jan, P.; Dumas, P.; Peng, S.; Li, L.; Zhou, X.; et al. Irrigation, Damming, and Streamflow Fluctuations of the Yellow River. Hydrol. Earth Syst. Sci. 2021, 25, 1133–1150. [Google Scholar] [CrossRef]
- Omer, A. Water Scarcity in the Yellow River Basin under Future Climate Change and Human Activities. Sci. Total Environ. 2020, 749, 141446. [Google Scholar] [CrossRef] [PubMed]
- Wang, F.; Wang, Z.; Yang, H.; Zhao, Y. Study of the Temporal and Spatial Patterns of Drought in the Yellow River Basin Based on SPEI. Sci. China Earth Sci. 2018, 61, 1098–1111. [Google Scholar] [CrossRef]
- He, J.; Yang, K.; Tang, W.; Lu, H.; Qin, J.; Chen, Y.; Li, X. The first highresolution meteorological forcing dataset for land process studies over China. Sci. Data 2020, 7, 25. [Google Scholar] [CrossRef] [PubMed]
- Wu, J.; Gao, X. A gridded daily observation dataset over China region and comparison with the other datasets. Chin. J. Geophys. 2013, 56, 1102–1111. [Google Scholar] [CrossRef]
- Deng, L.; Zhu, H.; Jiang, Z. Projection of climate change in China under carbon neutral scenarios. Trans. Atmos. Sci. 2022, 45, 364–375. [Google Scholar] [CrossRef]
- Yuan, X.; Ji, P.; Wang, L.; Liang, X.-Z.; Yang, K.; Ye, A.; Su, Z.; Wen, J. High-Resolution Land Surface Modeling of Hydrological Changes Over the Sanjiangyuan Region in the Eastern Tibetan Plateau: 1. Model Development and Evaluation. J. Adv. Model. Earth Syst. 2018, 10, 2806–2828. [Google Scholar] [CrossRef]
- Ji, P.; Yuan, X.; Jiao, Y. Future Hydrological Drought Changes over the Upper Yellow River Basin: The Role of Climate Change, Land Cover Change and Reservoir Operation. J. Hydrol. 2023, 617, 129128. [Google Scholar] [CrossRef]
- Ji, P.; Yuan, X.; Shi, C.; Jiang, L.; Wang, G.; Yang, K. A Long-Term Simulation of Land Surface Conditions at High Resolution over Continental China. J. Hydrometeorol. 2023, 24, 285–314. [Google Scholar] [CrossRef]
- Lorenzo-Lacruz, J.; Morán-Tejeda, E.; Vicente-Serrano, S.M.; López-Moreno, J.I. Streamflow Droughts in the Iberian Peninsula between 1945 and 2005: Spatial and Temporal Patterns. Hydrol. Earth Syst. Sci. 2013, 17, 119–134. [Google Scholar] [CrossRef]
- Ma, F.; Yuan, X.; Ye, A. Seasonal Drought Predictability and Forecast Skill over China. J. Geophys. Res. Atmos. 2015, 120, 8264–8275. [Google Scholar] [CrossRef]
- Yuan, X.; Zhang, M.; Wang, L.; Zhou, T. Understanding and Seasonal Forecasting of Hydrological Drought in the Anthropocene. Hydrol. Earth Syst. Sci. 2017, 21, 5477–5492. [Google Scholar] [CrossRef]
- Tao, Y.; Meng, E.; Huang, Q. Spatiotemporal Changes and Hazard Assessment of Hydrological Drought in China Using Big Data. Water 2023, 16, 106. [Google Scholar] [CrossRef]
- Vicente-Serrano, S.M.; López-Moreno, J.I.; Beguería, S.; Lorenzo-Lacruz, J.; Azorin-Molina, C.; Morán-Tejeda, E. Accurate Computation of a Streamflow Drought Index. J. Hydrol. Eng. 2012, 17, 318–332. [Google Scholar] [CrossRef]
- Yuan, X.; Wood, E.F. Multimodel Seasonal Forecasting of Global Drought Onset. Geophys. Res. Lett. 2013, 40, 4900–4905. [Google Scholar] [CrossRef]
- Hydrological Drought Severity Explained by Climate and Catchment Characteristics. J. Hydrol. 2015, 526, 3–14. [CrossRef]
- Zhu, H.; Jiang, Z.; Li, L. Projection of Climate Extremes in China, an Incremental Exercise from CMIP5 to CMIP6. Sci. Bull. 2021, 66, 2528–2537. [Google Scholar] [CrossRef] [PubMed]
- Zhou, B.; Wen, Q.H.; Xu, Y.; Song, L.; Zhang, X. Projected Changes in Temperature and Precipitation Extremes in China by the CMIP5 Multimodel Ensembles. J. Clim. 2014, 27, 6591–6611. [Google Scholar] [CrossRef]
- Knutti, R.; Furrer, R.; Tebaldi, C.; Cermak, J.; Meehl, G.A. Challenges in Combining Projections from Multiple Climate Models. J. Clim. 2010, 23, 2739–2758. [Google Scholar] [CrossRef]
- Chen, W.; Jiang, Z.; Li, L. Probabilistic Projections of Climate Change over China under the SRES A1B Scenario Using 28 AOGCMs. J. Clim. 2011, 24, 4741–4756. [Google Scholar] [CrossRef]
- Giorgi, F.; Mearns, L.O. Probability of Regional Climate Change Based on the Reliability Ensemble Averaging (REA) Method. Geophys. Res. Lett. 2003, 30, 1629. [Google Scholar] [CrossRef]
- Li, W.; Jiang, Z.; Xu, J.; Li, L. Extreme Precipitation Indices over China in CMIP5 Models. Part II: Probabilistic Projection. J. Clim. 2016, 29, 8989–9004. [Google Scholar] [CrossRef]
- Li, T.; Jiang, Z.; Zhao, L.; Li, L. Multi-Model Ensemble Projection of Precipitation Changes over China under Global Warming of 1.5 and 2 °C with Consideration of Model Performance and Independence. J. Meteorol. Res. 2021, 35, 184–197. [Google Scholar] [CrossRef]
- Knutti, R.; Sedláček, J.; Sanderson, B.M.; Lorenz, R.; Fischer, E.M.; Eyring, V. A Climate Model Projection Weighting Scheme Accounting for Performance and Interdependence. Geophys. Res. Lett. 2017, 44, 1909–1918. [Google Scholar] [CrossRef]
- Giorgi, F.; Mearns, L.O. Calculation of Average, Uncertainty Range, and Reliability of Regional Climate Changes from AOGCM Simulations via the “Reliability Ensemble Averaging” (REA) Method. J. Clim. 2002, 15, 1141–1158. [Google Scholar] [CrossRef]
- Yuan, X.; Wang, Y.; Ji, P.; Wu, P.; Sheffield, J.; Otkin, J.A. A Global Transition to Flash Droughts under Climate Change. Science 2023, 380, 187–191. [Google Scholar] [CrossRef]


| Model | Name | Country | Resolution |
|---|---|---|---|
| 1 | CanESM5 | Canada | 2.8° × 2.8° |
| 2 | CNRM-ESM2-1 | France | 1.4° × 1.4° |
| 3 | EC-Earth3 | European Union | 0.7° × 0.7° |
| 4 | IPSL-CM6A-LR | France | 1.3° × 2.5° |
| 5 | MIROC6 | Japan | 1.4° × 1.4° |
| 6 | MIROC-ES2L | Japan | 2.8° × 2.8° |
| 7 | MRI-ESM2-0 | Japan | 1.1° × 1.1° |
| Historical (1979–2014) and Future (2015–2100) Scenarios | Changing Trend of Standardized Time Series (per Decade) | |||
|---|---|---|---|---|
| Temperature | Precipitation | Total Runoff | Drought Frequency | |
| Historical CSSP | 0.849 * | 0.064 | −0.111 | 0.069 |
| Historical CMIP6 | 0.671 * | 0.113 | 0.080 | 0.106 |
| Future SSP1-1.9 | 0.072 * | 0.059 * | 0.016 | −0.014 |
| Future SSP1-2.6 | 0.178 * | 0.099 * | 0.058 * | 0.024 |
Disclaimer/Publisher’s Note: The statements, opinions and data contained in all publications are solely those of the individual author(s) and contributor(s) and not of MDPI and/or the editor(s). MDPI and/or the editor(s) disclaim responsibility for any injury to people or property resulting from any ideas, methods, instructions or products referred to in the content. |
© 2024 by the authors. Licensee MDPI, Basel, Switzerland. This article is an open access article distributed under the terms and conditions of the Creative Commons Attribution (CC BY) license (https://creativecommons.org/licenses/by/4.0/).
Share and Cite
Li, X.; Jiao, Y.; Liu, J. Changes in Drought Characteristics in the Yellow River Basin during the Carbon-Neutral Period under Low-Emission Scenarios. Water 2024, 16, 1045. https://doi.org/10.3390/w16071045
Li X, Jiao Y, Liu J. Changes in Drought Characteristics in the Yellow River Basin during the Carbon-Neutral Period under Low-Emission Scenarios. Water. 2024; 16(7):1045. https://doi.org/10.3390/w16071045
Chicago/Turabian StyleLi, Xunyu, Yang Jiao, and Jieyu Liu. 2024. "Changes in Drought Characteristics in the Yellow River Basin during the Carbon-Neutral Period under Low-Emission Scenarios" Water 16, no. 7: 1045. https://doi.org/10.3390/w16071045
APA StyleLi, X., Jiao, Y., & Liu, J. (2024). Changes in Drought Characteristics in the Yellow River Basin during the Carbon-Neutral Period under Low-Emission Scenarios. Water, 16(7), 1045. https://doi.org/10.3390/w16071045