


Monitoring of Microplastics in Water and Sediment Samples of Lakes and Rivers of the Akmola Region (Kazakhstan)

 ,
,  ,
, 
 ,
,
Abstract
1. Introduction
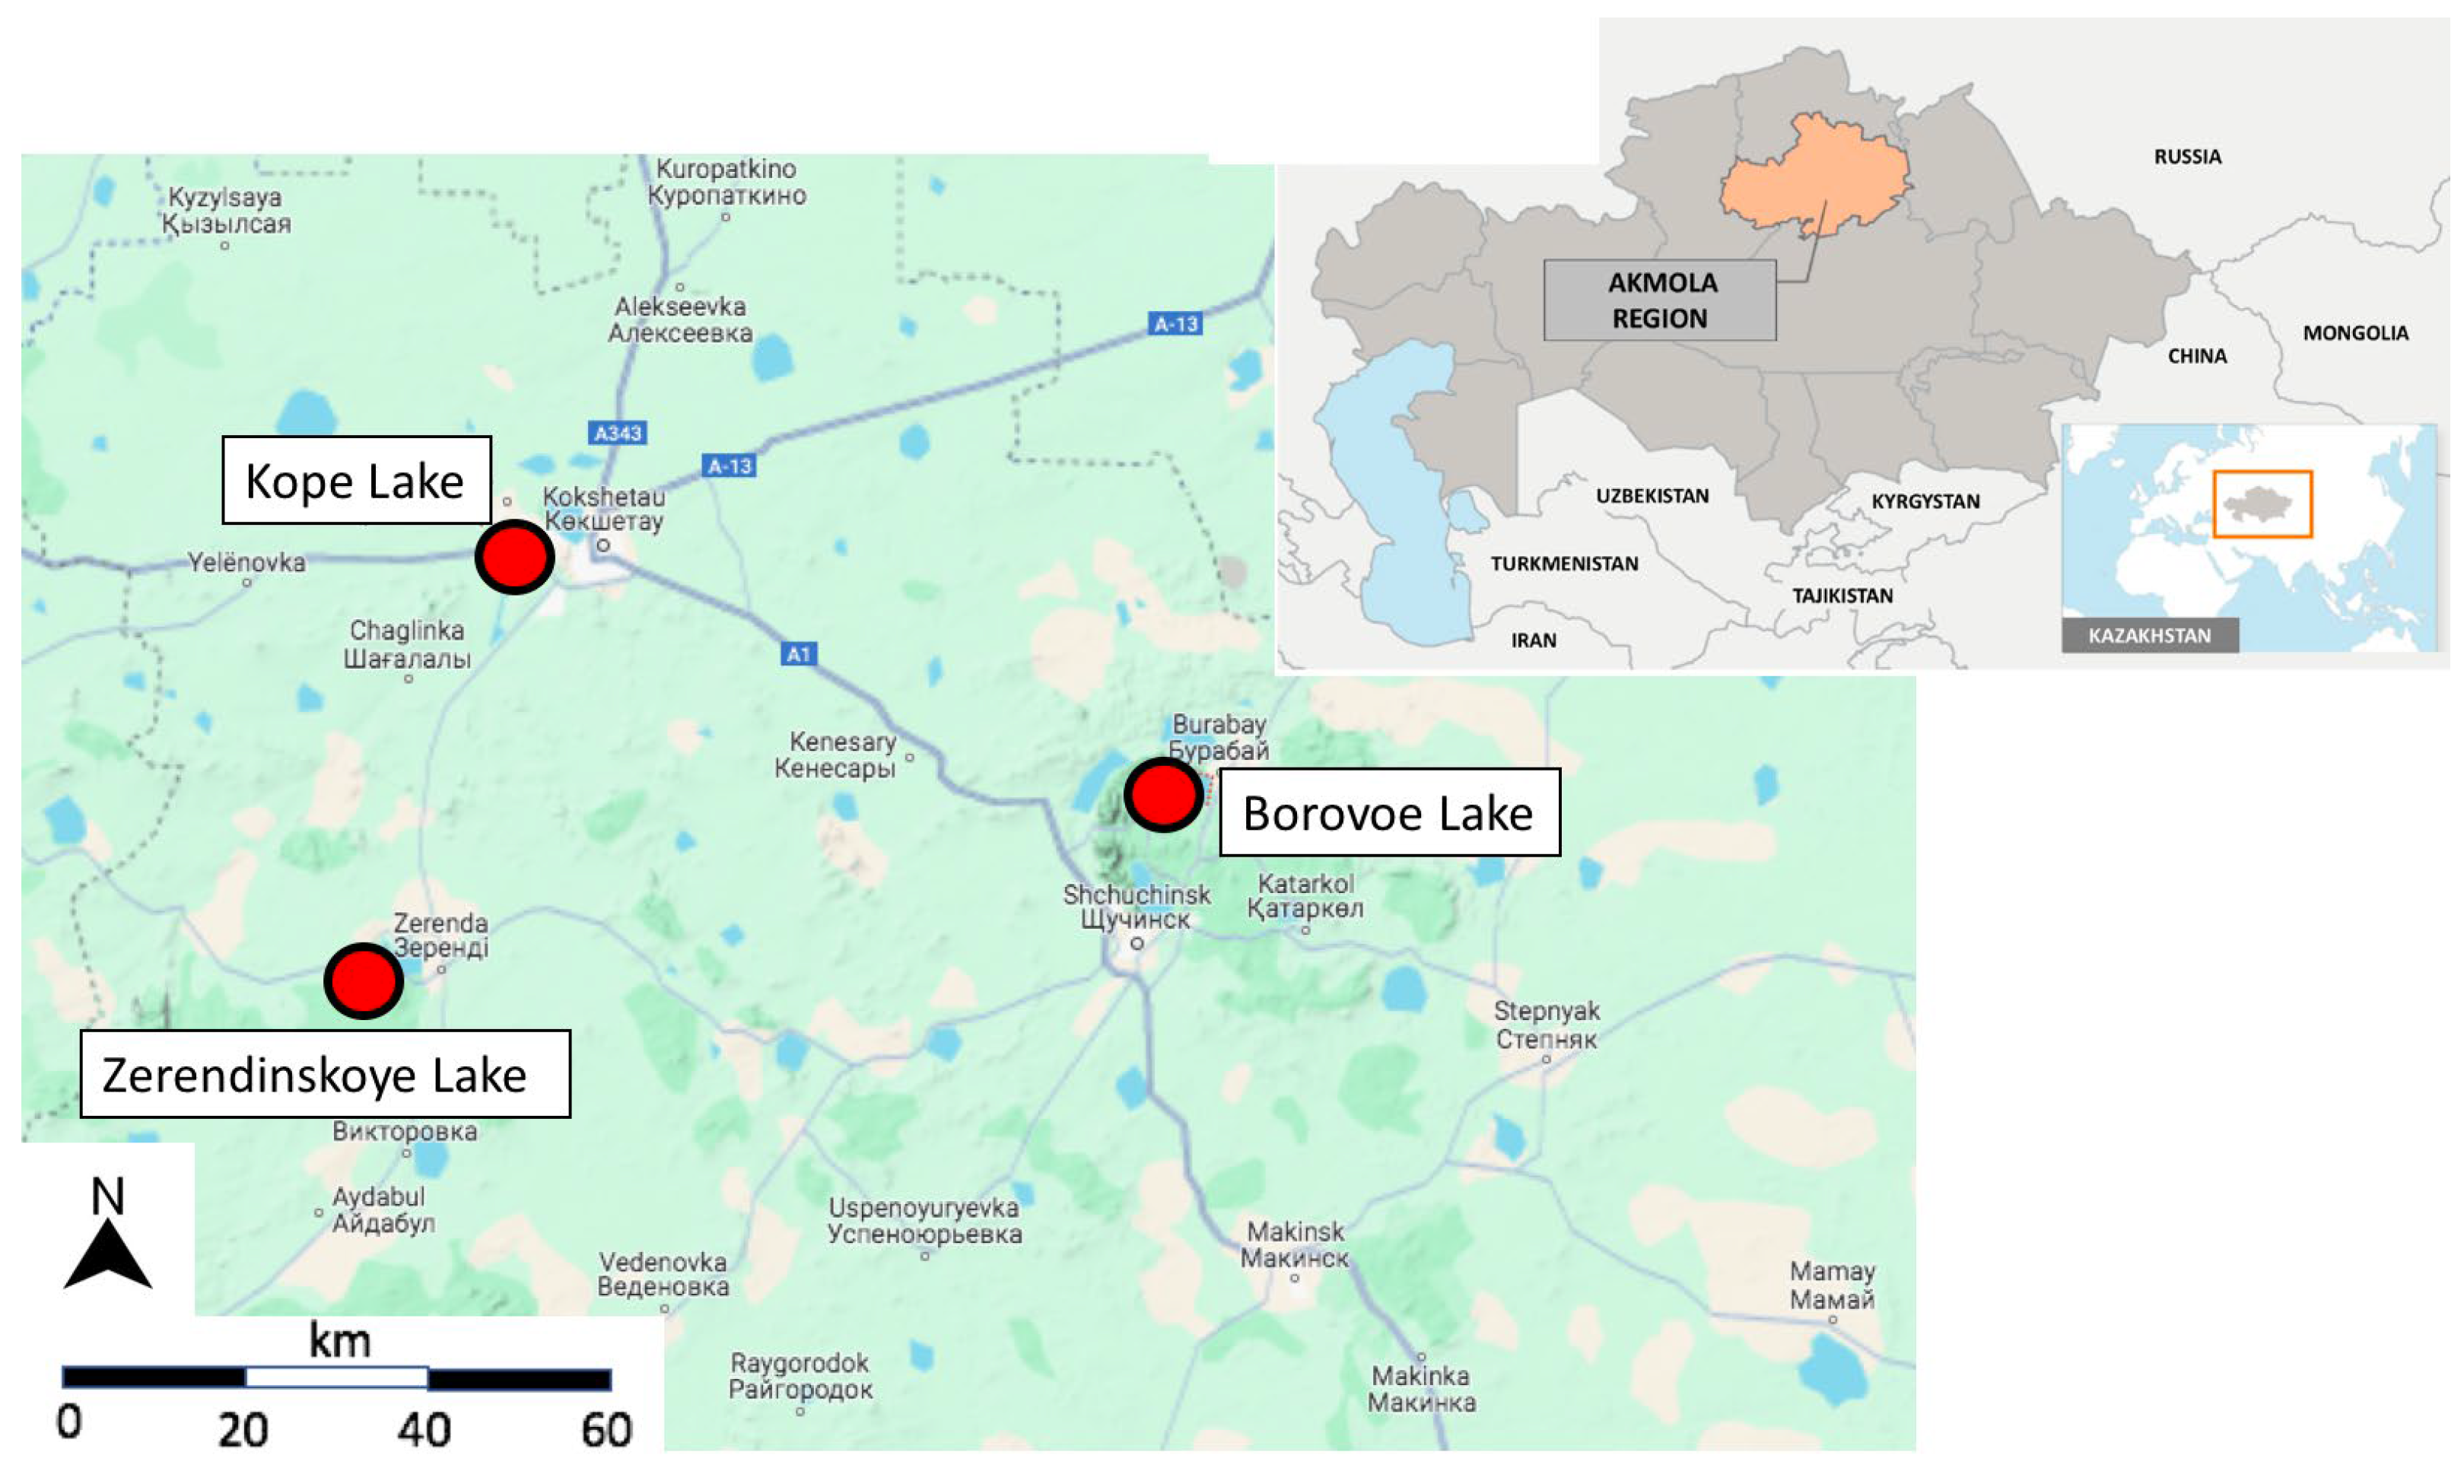
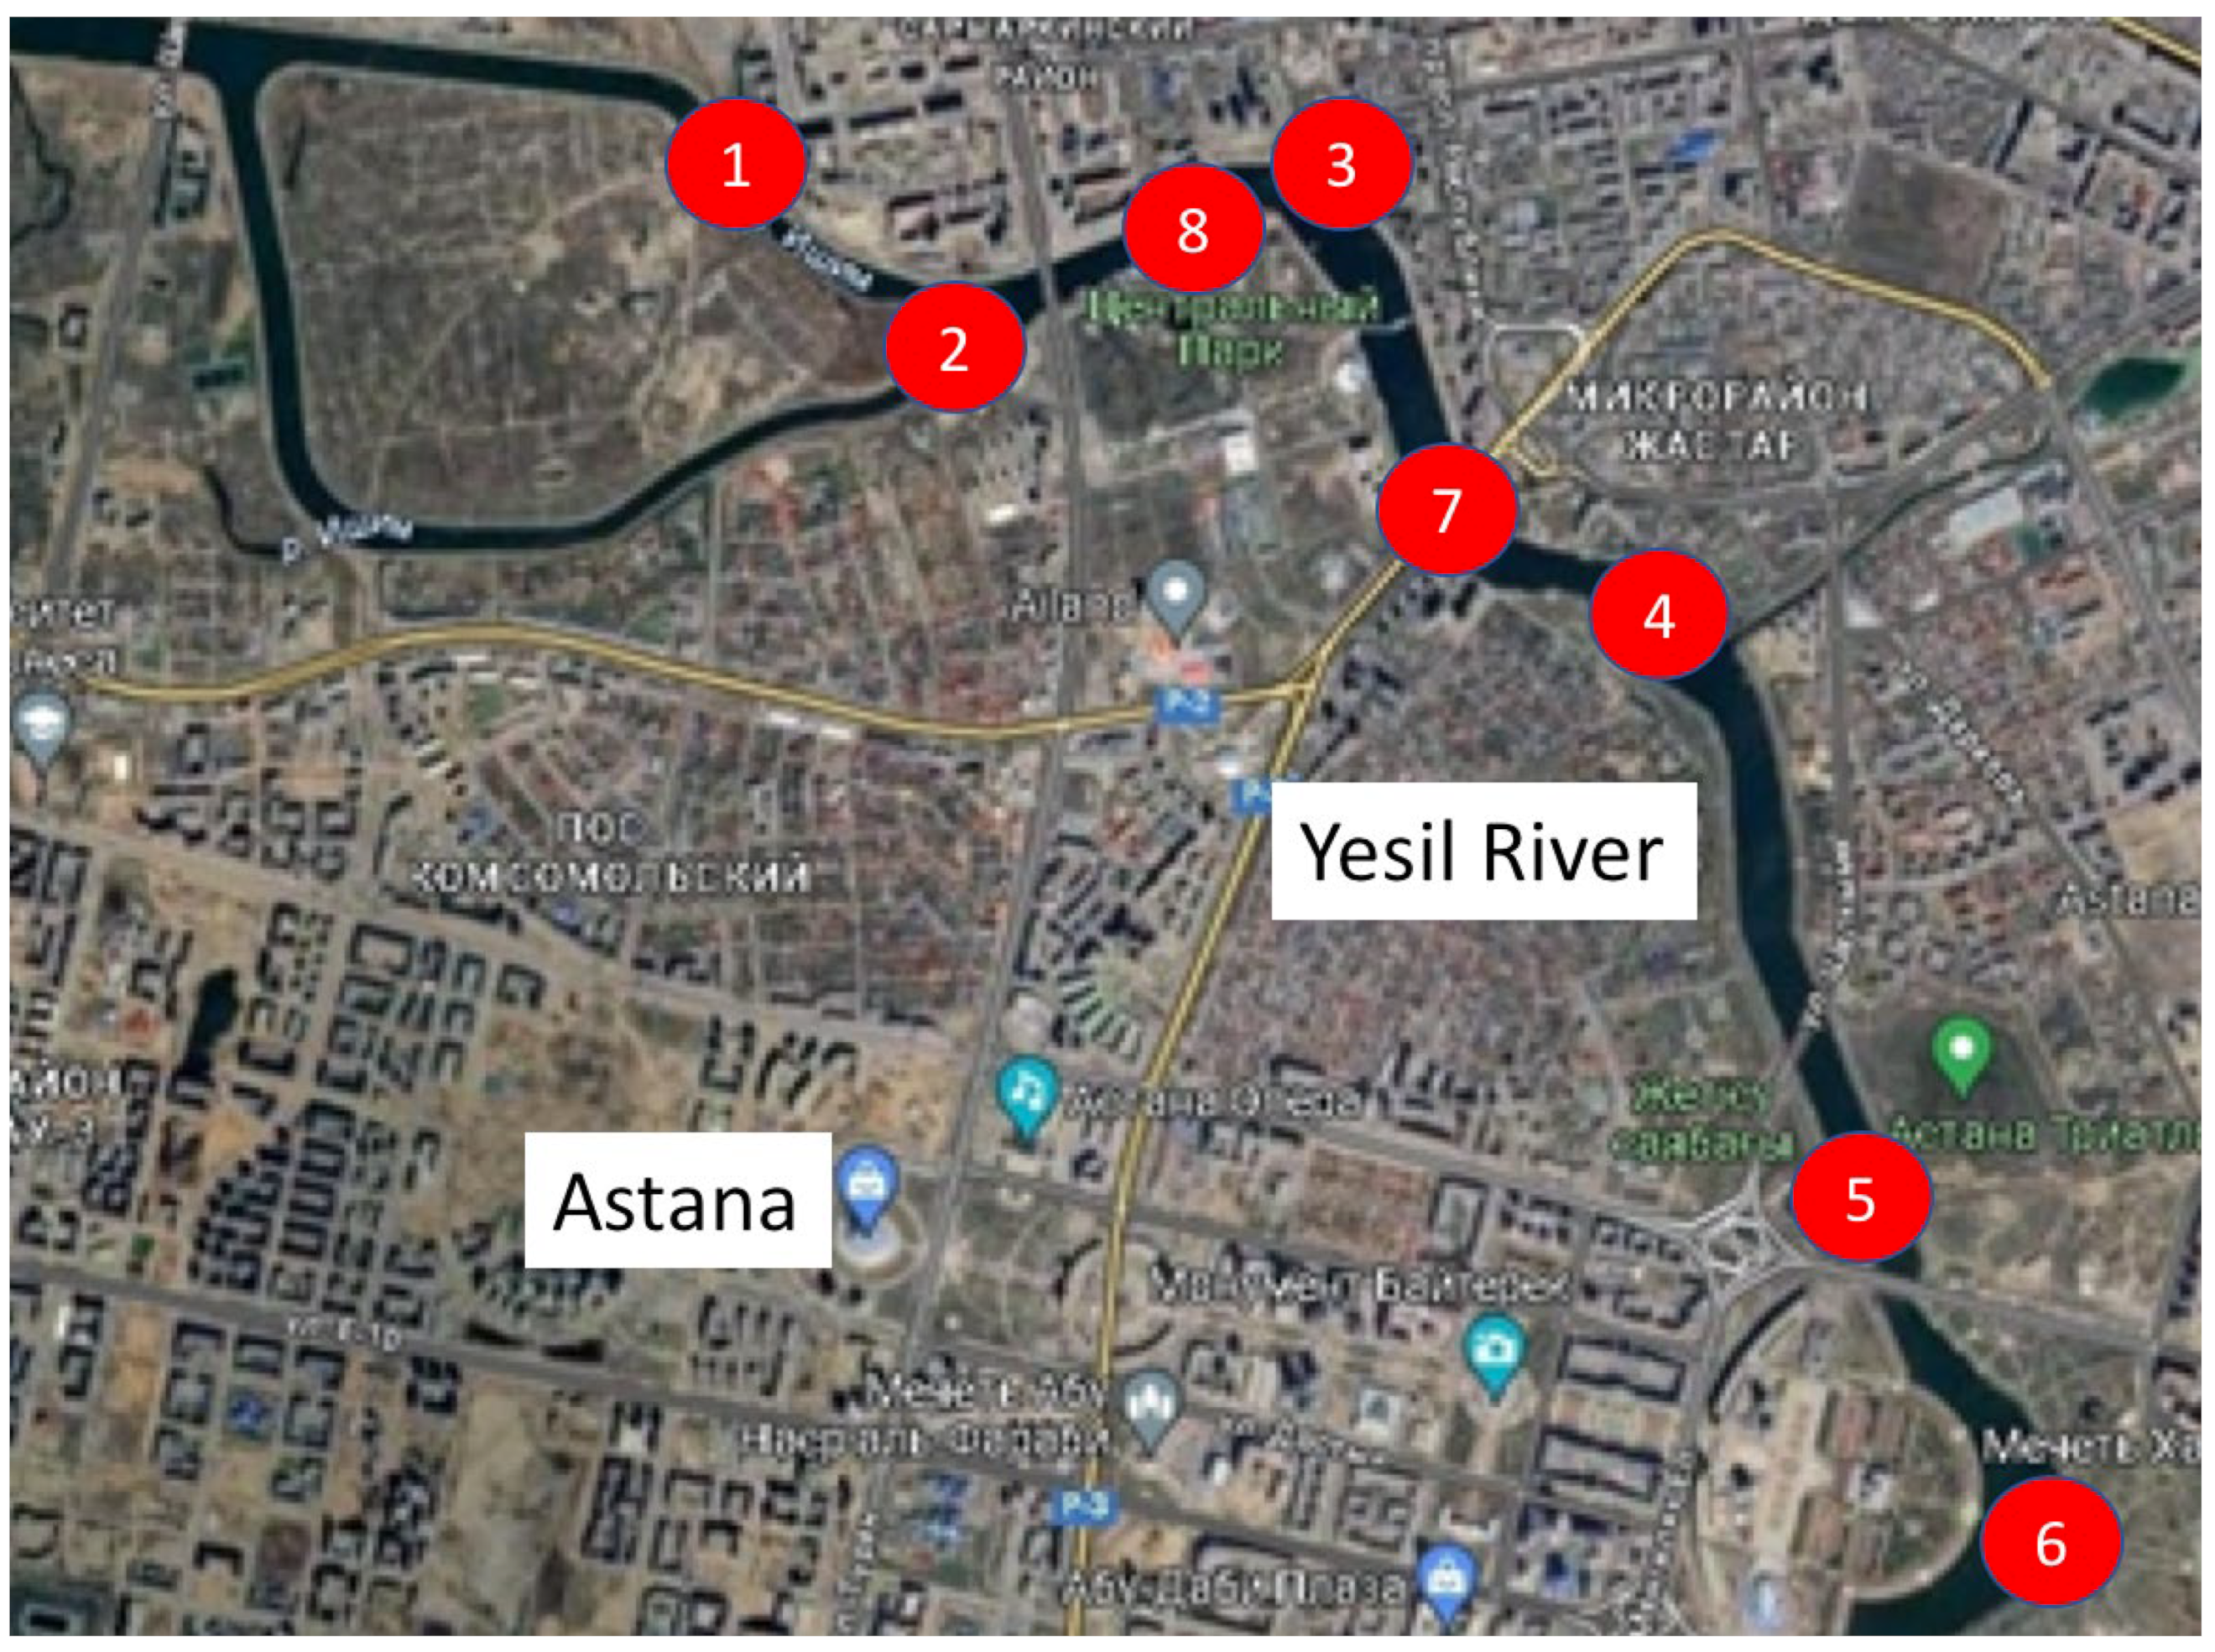
2. Description of the Study Area
3. Materials and Methods
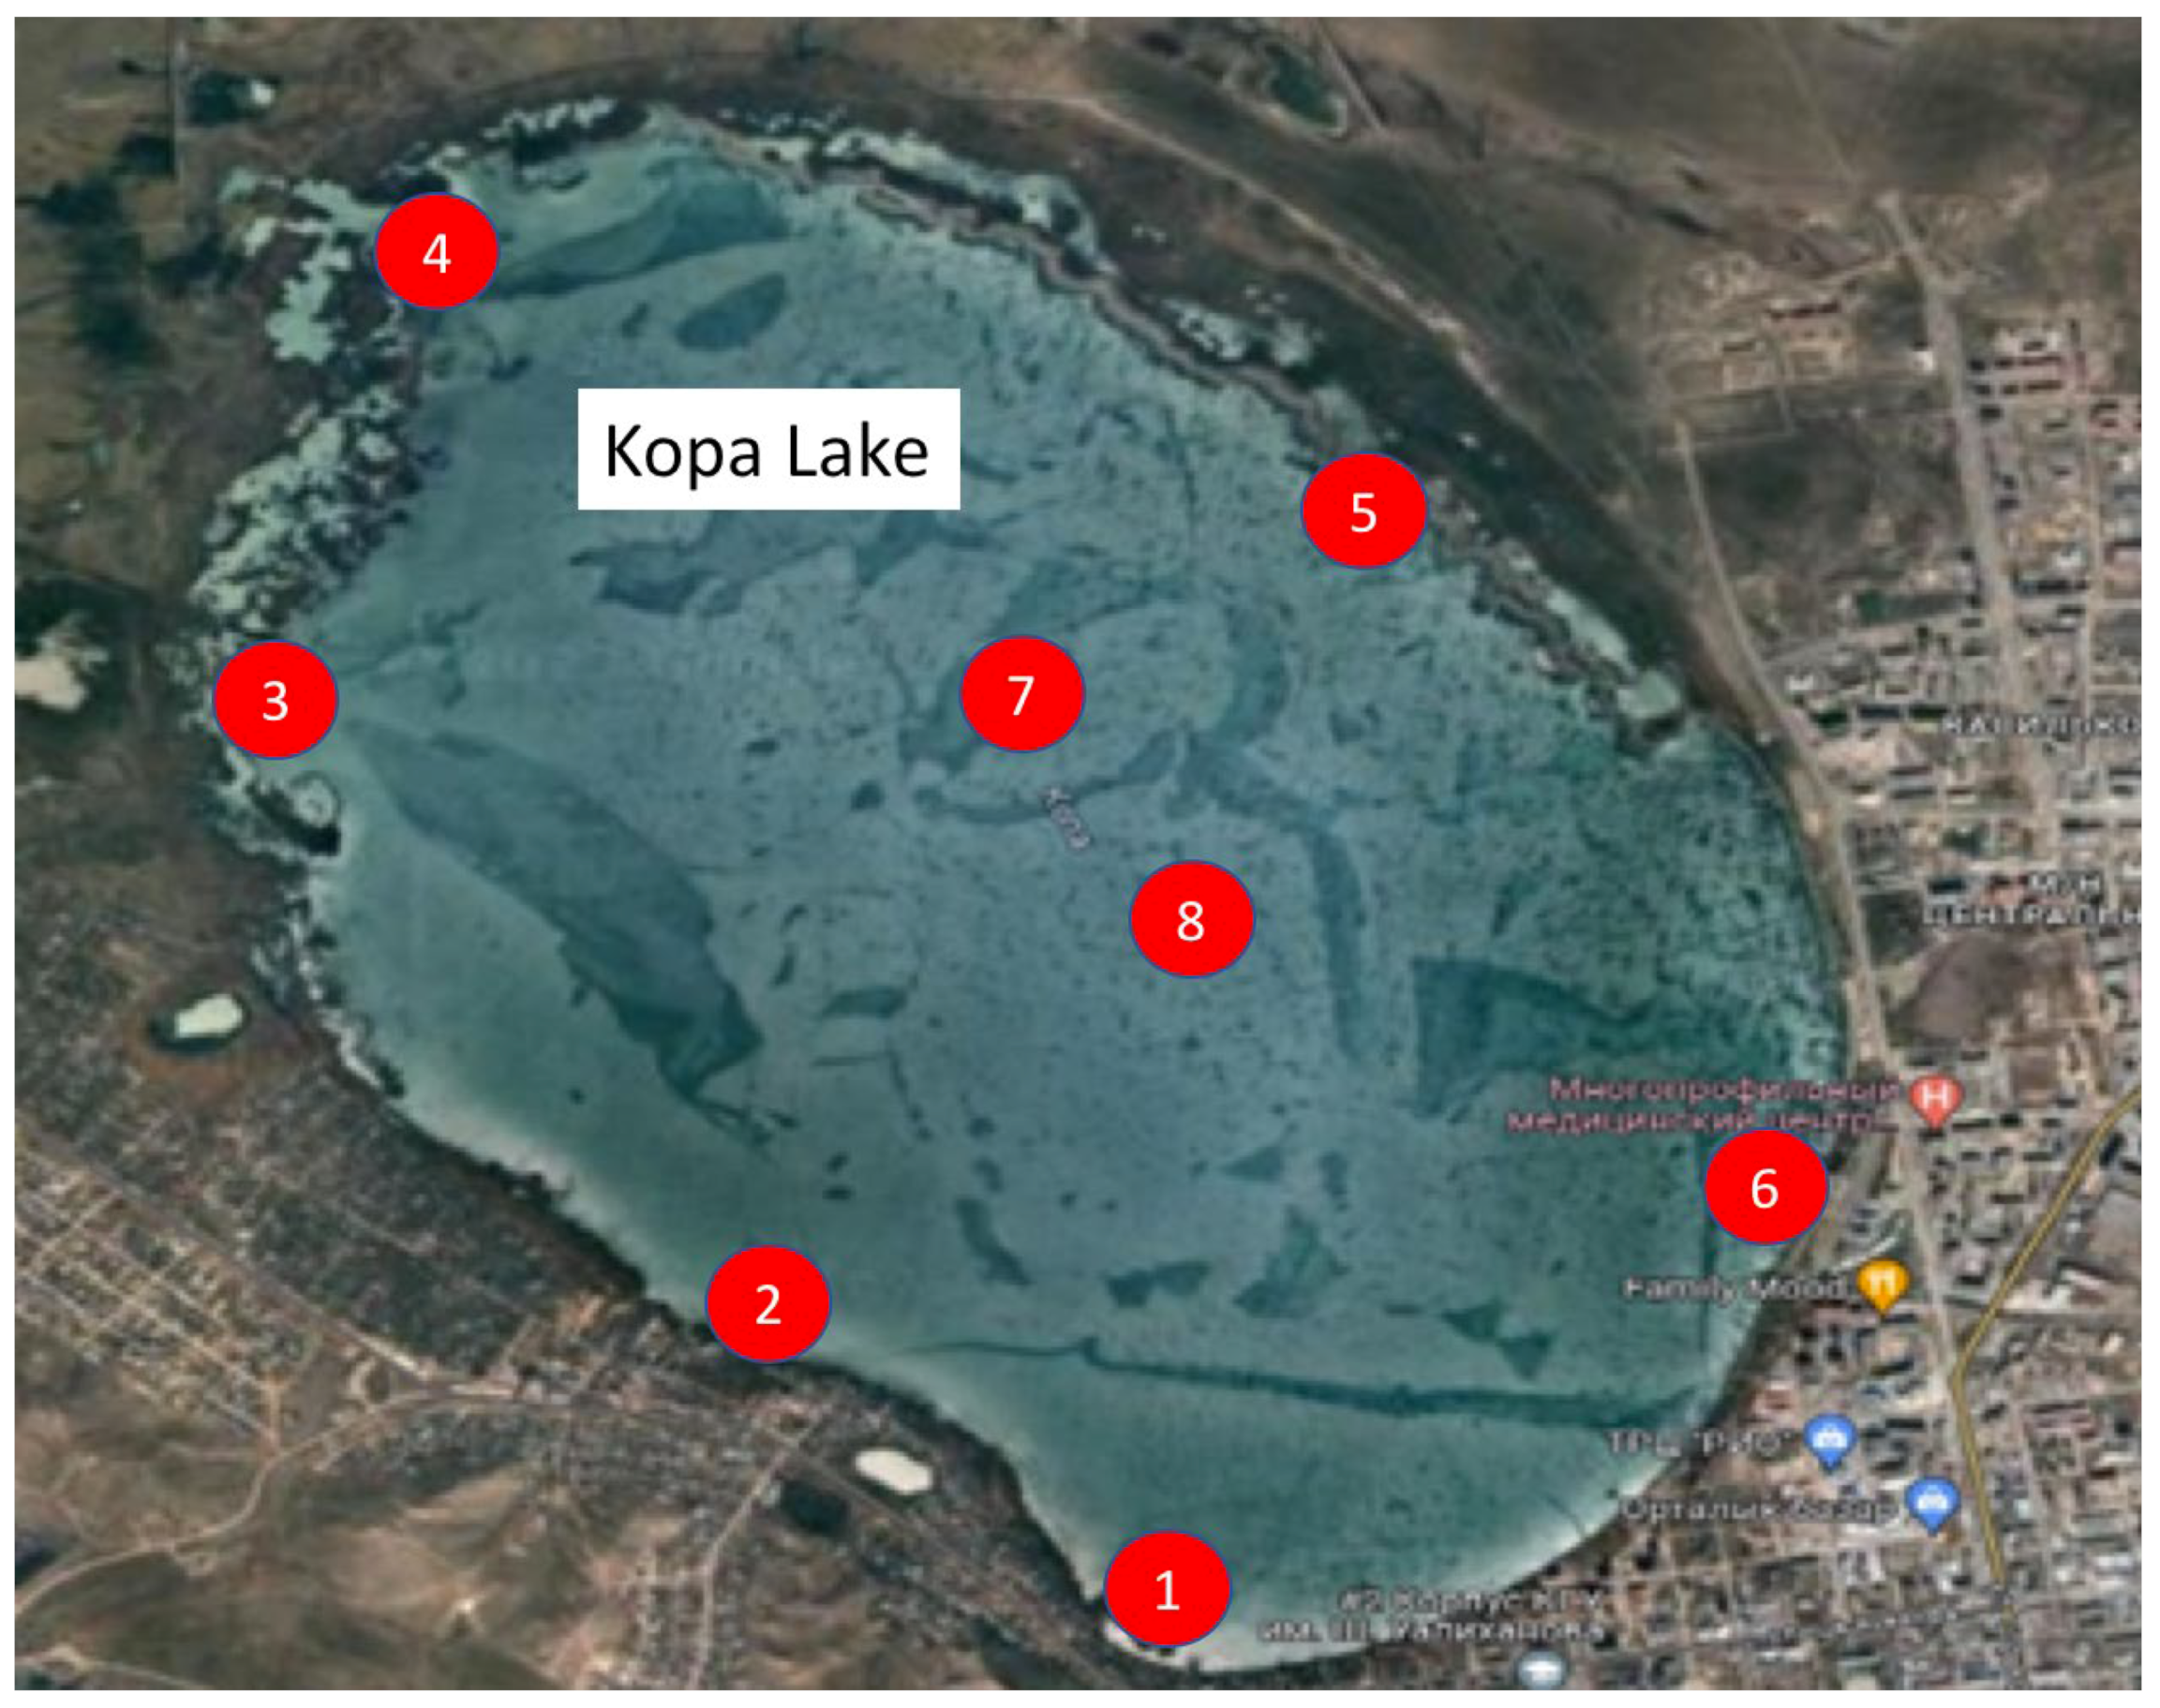
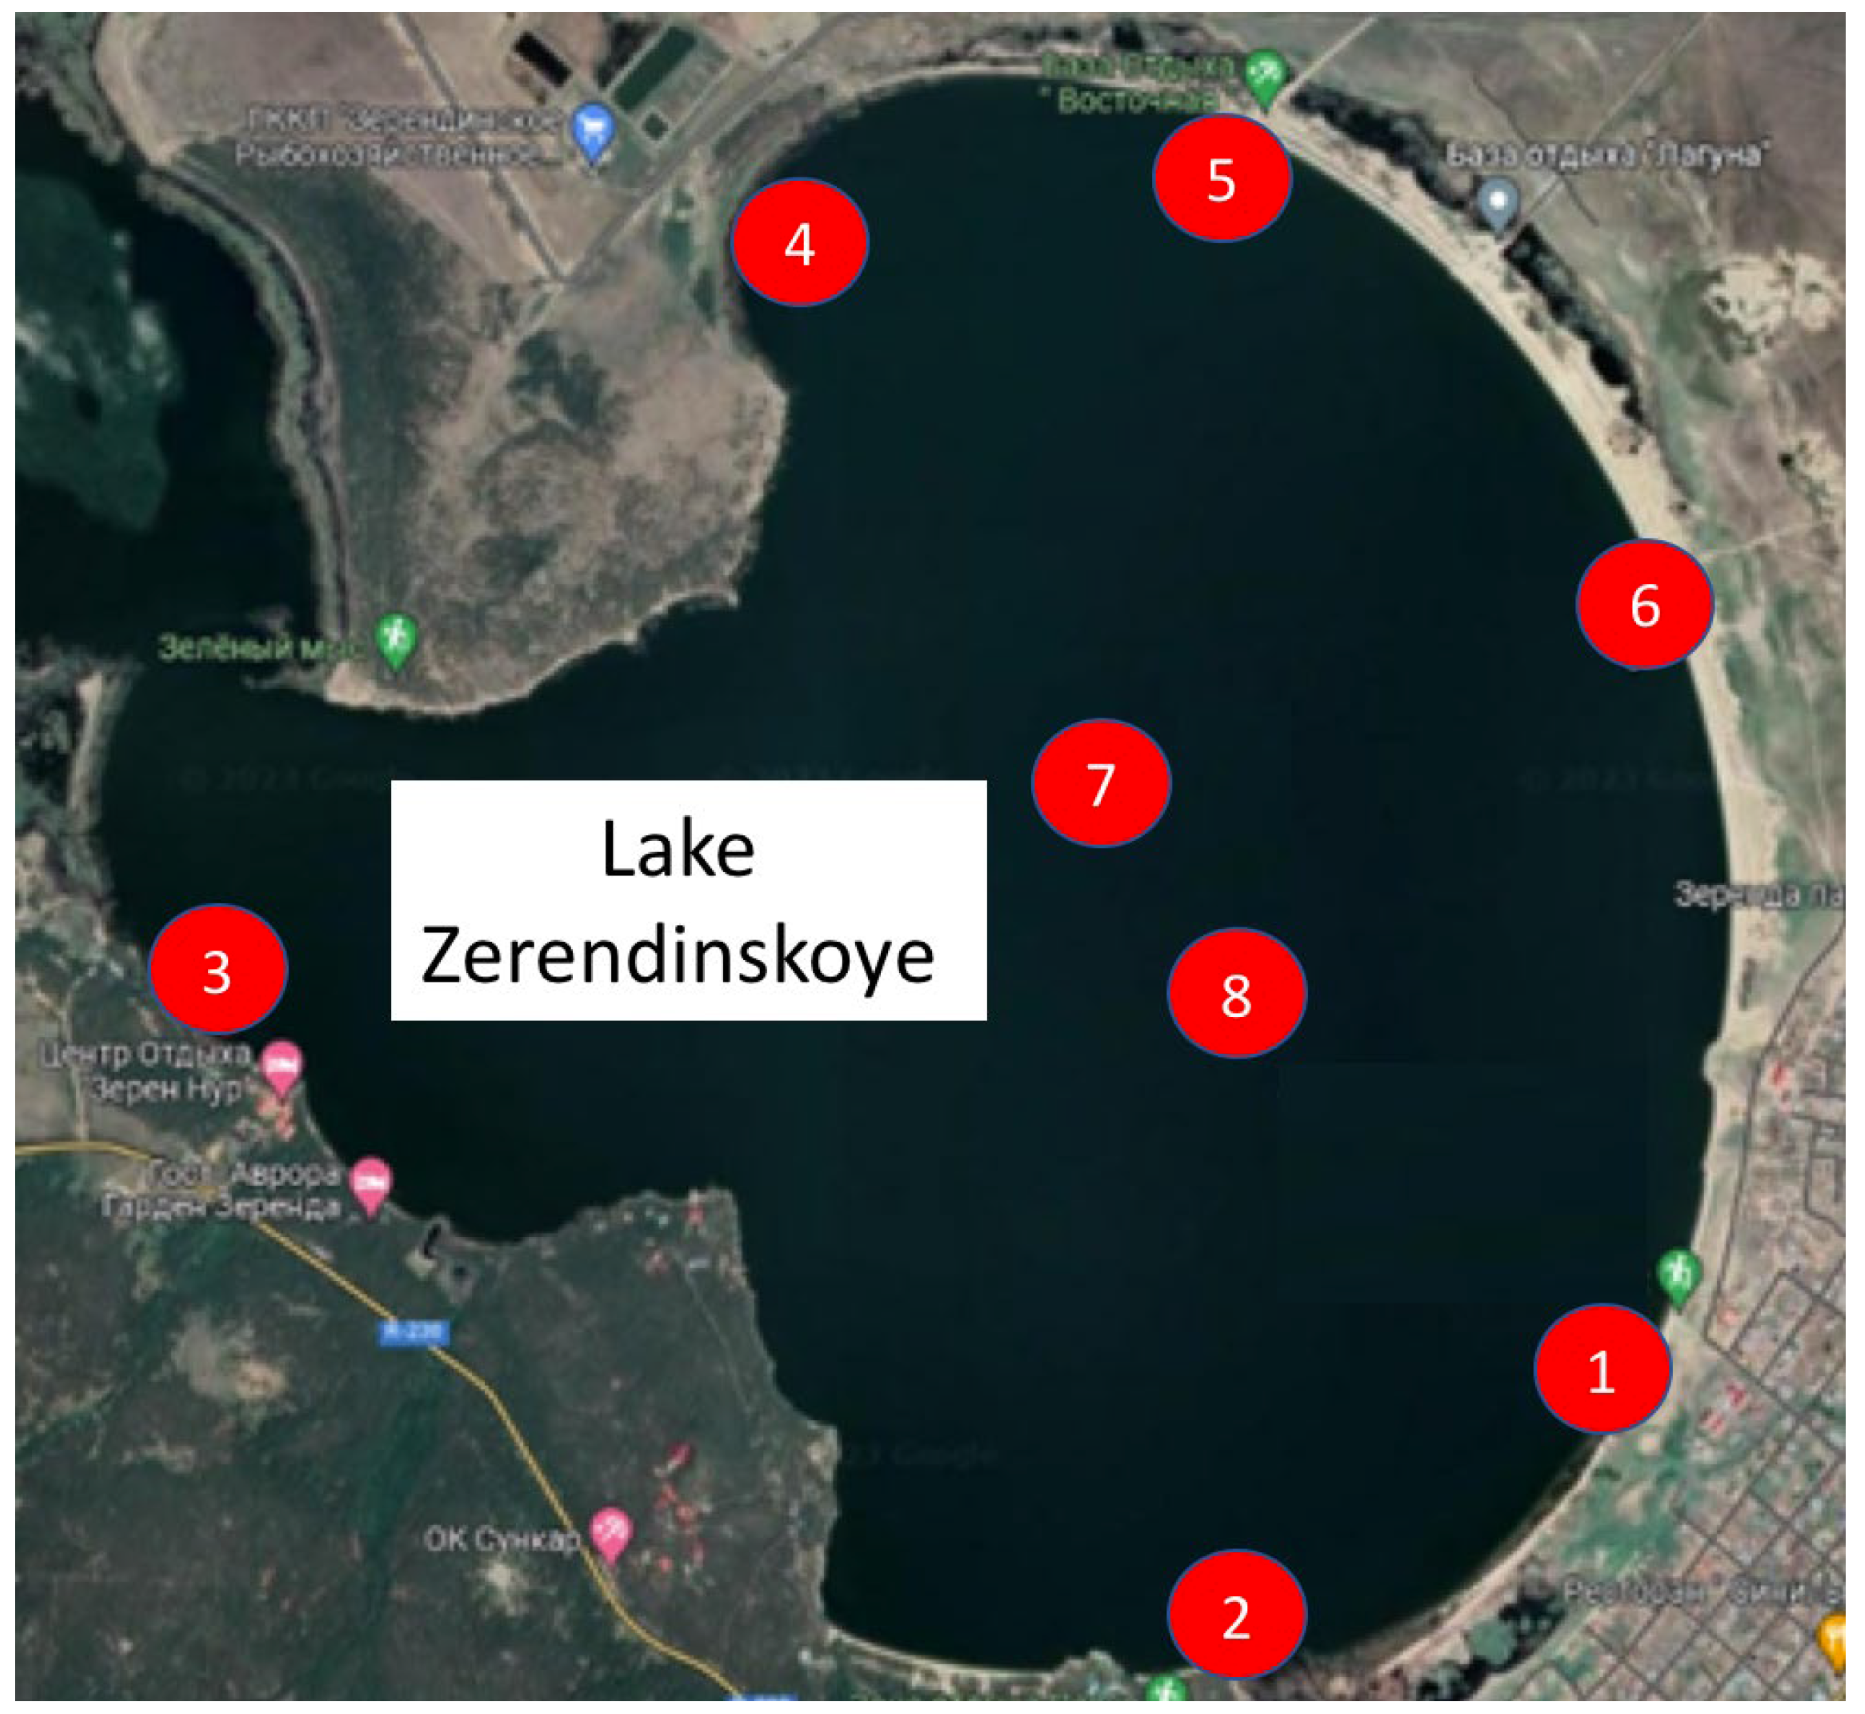
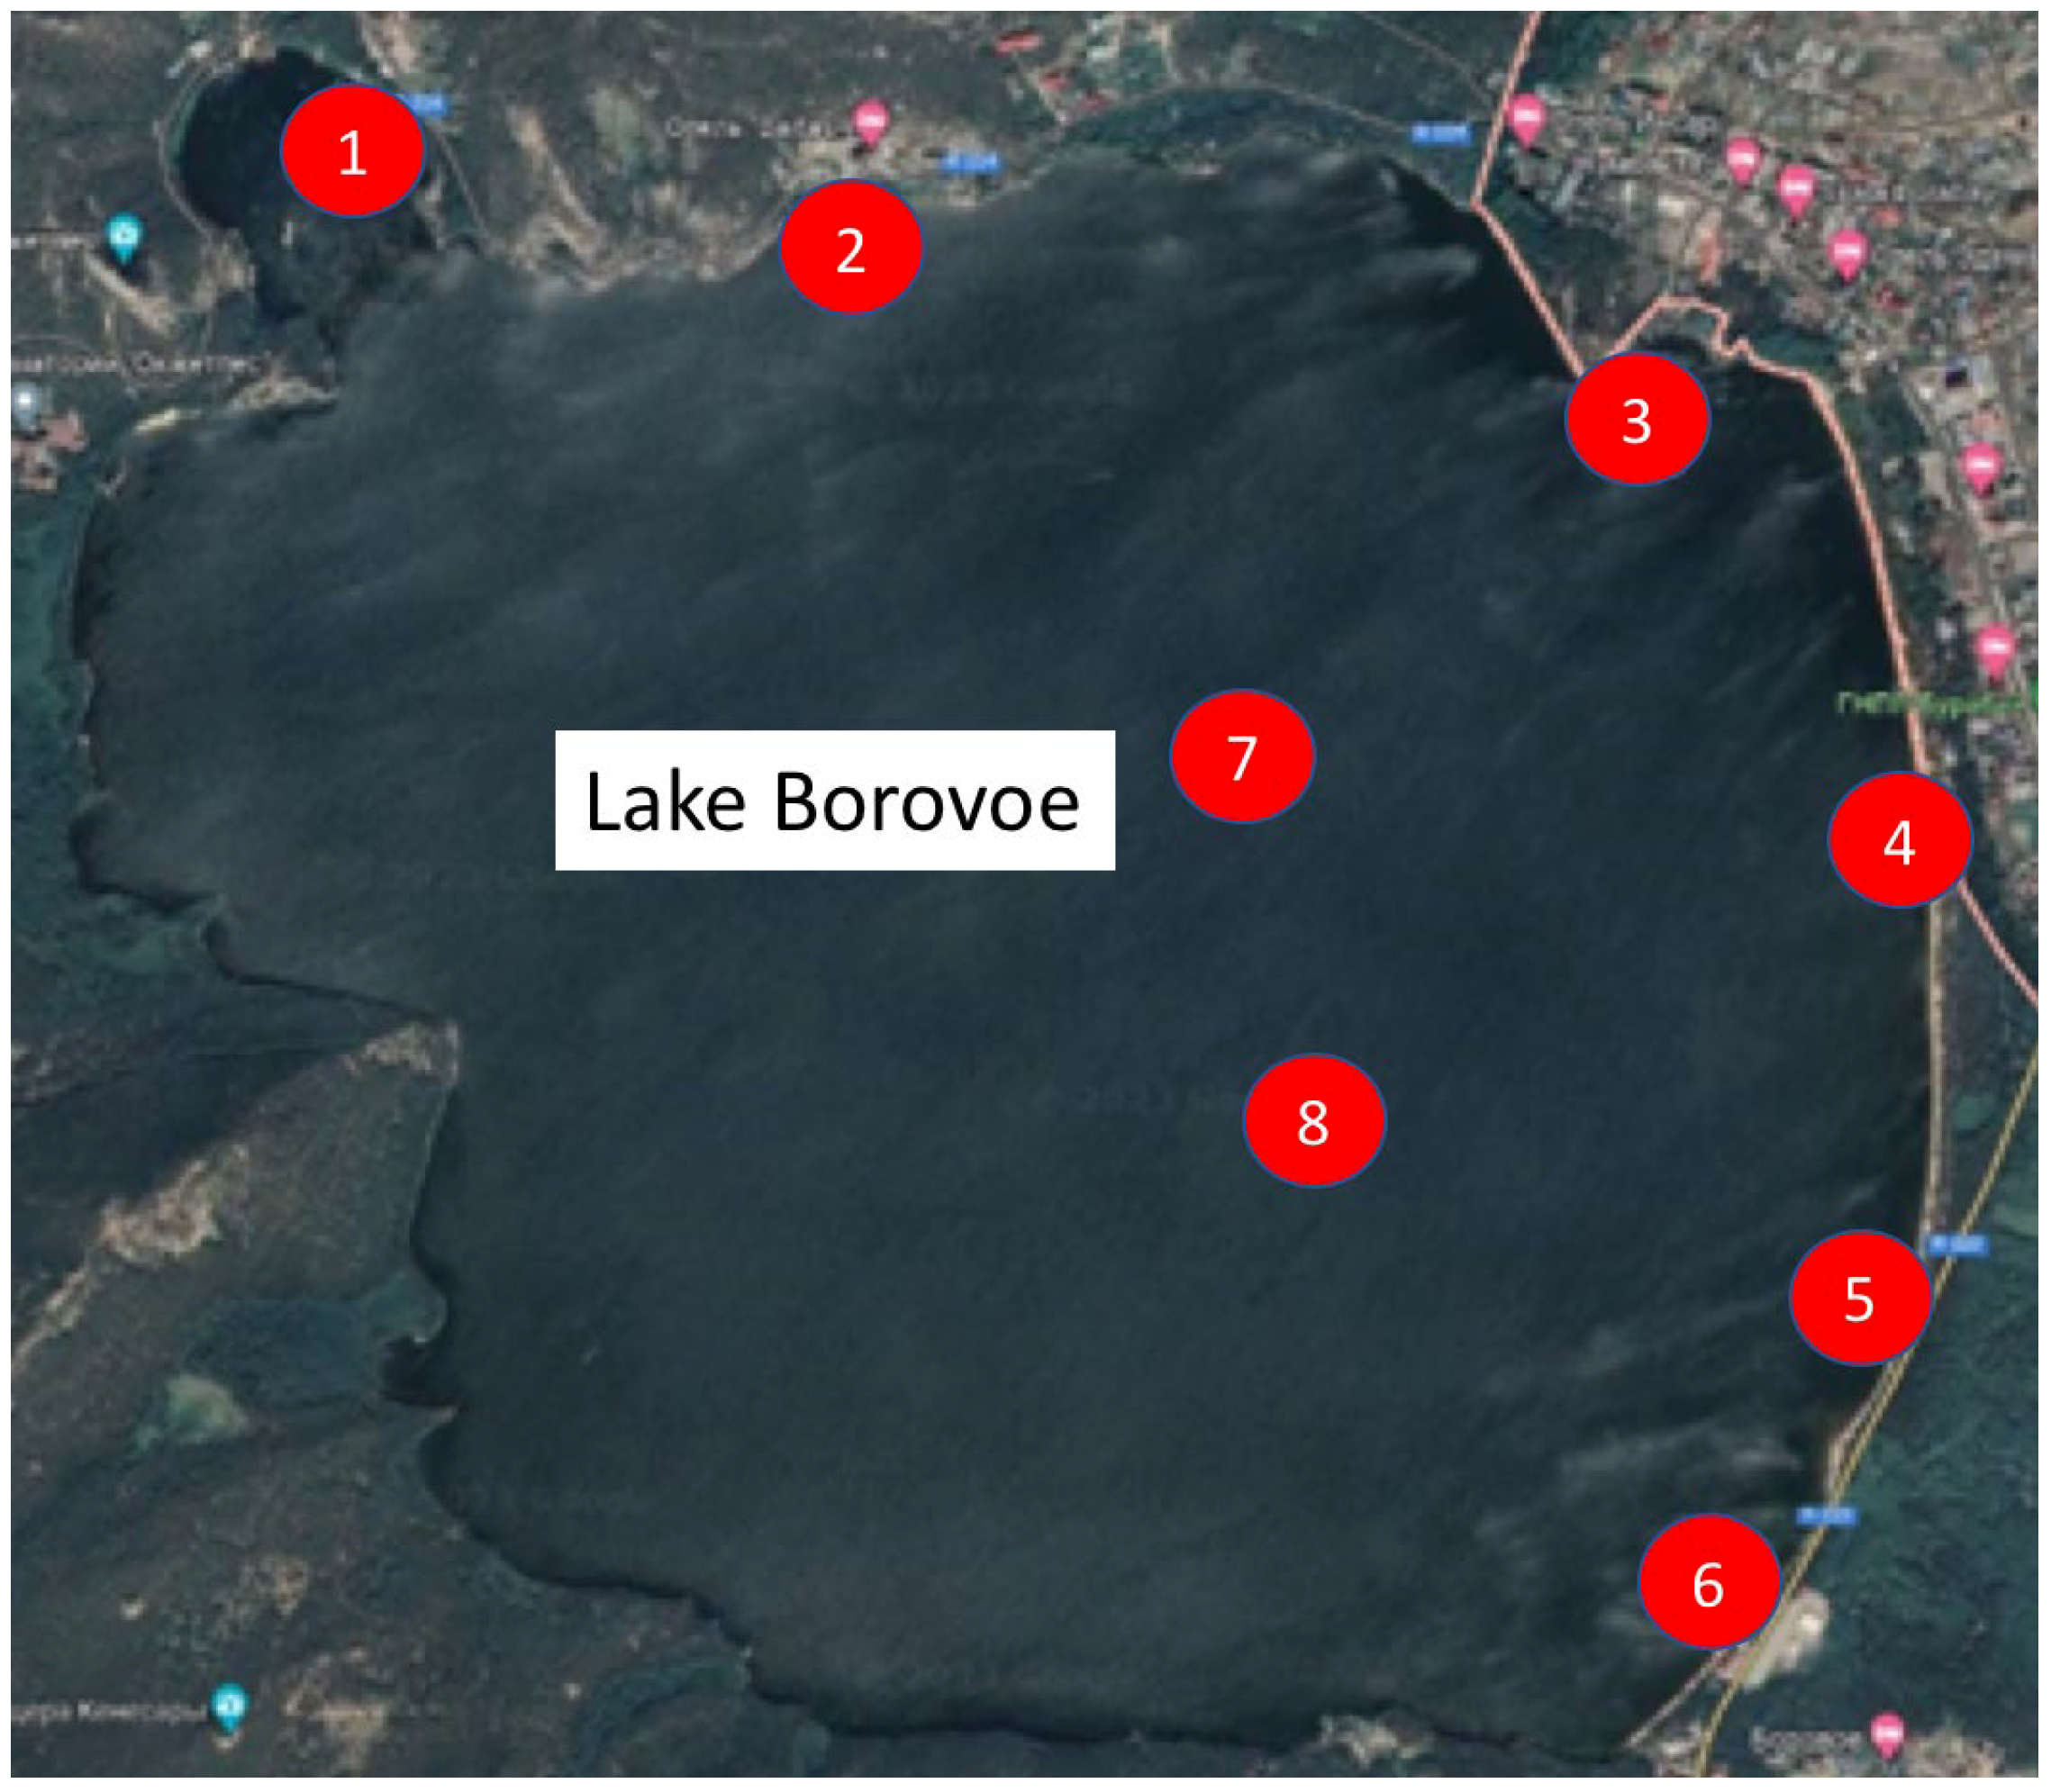
3.1. Location of the Sampling Points
3.2. Water Sampling Equipment and Sampling Methodology
- -
- GR-91 rod dredger with a bucket volume of 300 cm3;
- -
- Ruttner bathometer with a volume of 5 dm3;
- -
- Metal bucket with a volume of 10 dm3;
- -
- Metal scoops and spatulas;
- -
- Glass jars;
- -
- Glass Petri dishes;
- -
- Metal tweezers;
- -
- Aluminum foil;
- -
- Sefar polyamide mesh with a mesh size of 100 µm.
- (i)
- Wave splash zone;
- (ii)
- Water edge;
- (iii)
- Bottom sediment zone at depths ranging from approximately 1.23 to 1.53 m (the maximum feasible depth for manual sediment sampling, determined by the geological structure of the bottom).
3.3. Water Quality Standards
3.4. Methodology to Extract and Analyze Microplastics from Water and Sediment Samples
- Microscope: DTX 500 LCD Levenhuk with photo and video registration;
- Analytical electronic scales: AX-200 Shimadzu (measurement accuracy 0.0001 g);
- Stainless steel sieves with mesh sizes: 3, 2, 1, 0.3, 0.175 mm;
- Electric dry-air thermostat: TS-1/80 SPU (maximum deviation of the average temperature not more than ±1 °C, maximum deviation of the temperature at any point ±0.4 °C);
- Water bath: “Ekros” model 4310;
- Ultrasonic bath: UZV-4.0 “Sapphire” with a digital thermostat (temperature range from 15 to 70 °C, ultrasound frequency 35 kHz, timer from 1 to 99 min);
- Filters for quantitative analysis: Whatman No.2;
- Laboratory centrifuge: Opn-3.01 “Dastan” centrifuge with rotation speeds of 1000, 1500, and 3000 rpm;
- Set of areometers;
- 5.75 M ZnCl solution.
- Drying the sample at 30 °C for a minimum of 24 h.
- Weighing the dried sample.
- The resulting supernatant was filtered through a 100–150 mm glass funnel using a filter for quantitative analysis (Whatman #42). The filters were replaced when clogged.
- The filter containing retained plastic and organic matter particles was washed from the saline solution with distilled water.
- Microplastic particles, along with organic matter from all filters related to the analysis of one sample, were washed into a glass beaker with distilled water.
- The oxidation of organic impurities was carried out with a ratio of hydrogen peroxide to Fe(II) salt—1:1. The oxidation time was 30 min, adding 25 cm3 of 30% hydrogen peroxide and 25 cm3 of Fe(II) catalyst solution to a glass beaker with 150 cm3, containing solids extracted through density separation. The beaker was placed in a water bath, with the thermostat at 50 °C, with periodic stirring for 30 min [84,85,86].
- An additional portion of hydrogen peroxide was added to the beaker if undissolved organic matter was visually observed. The beaker was then covered with aluminum foil and left for a period of 8–12 h.
- With a bathometer from a depth of 1.5 m—the total volume of 50 dm3 from each sampling point;
- From the surface with a metal bucket—volume 100 dm3 from each point.
4. Results and Discussion
4.1. Analysis of MP Content in Water Samples
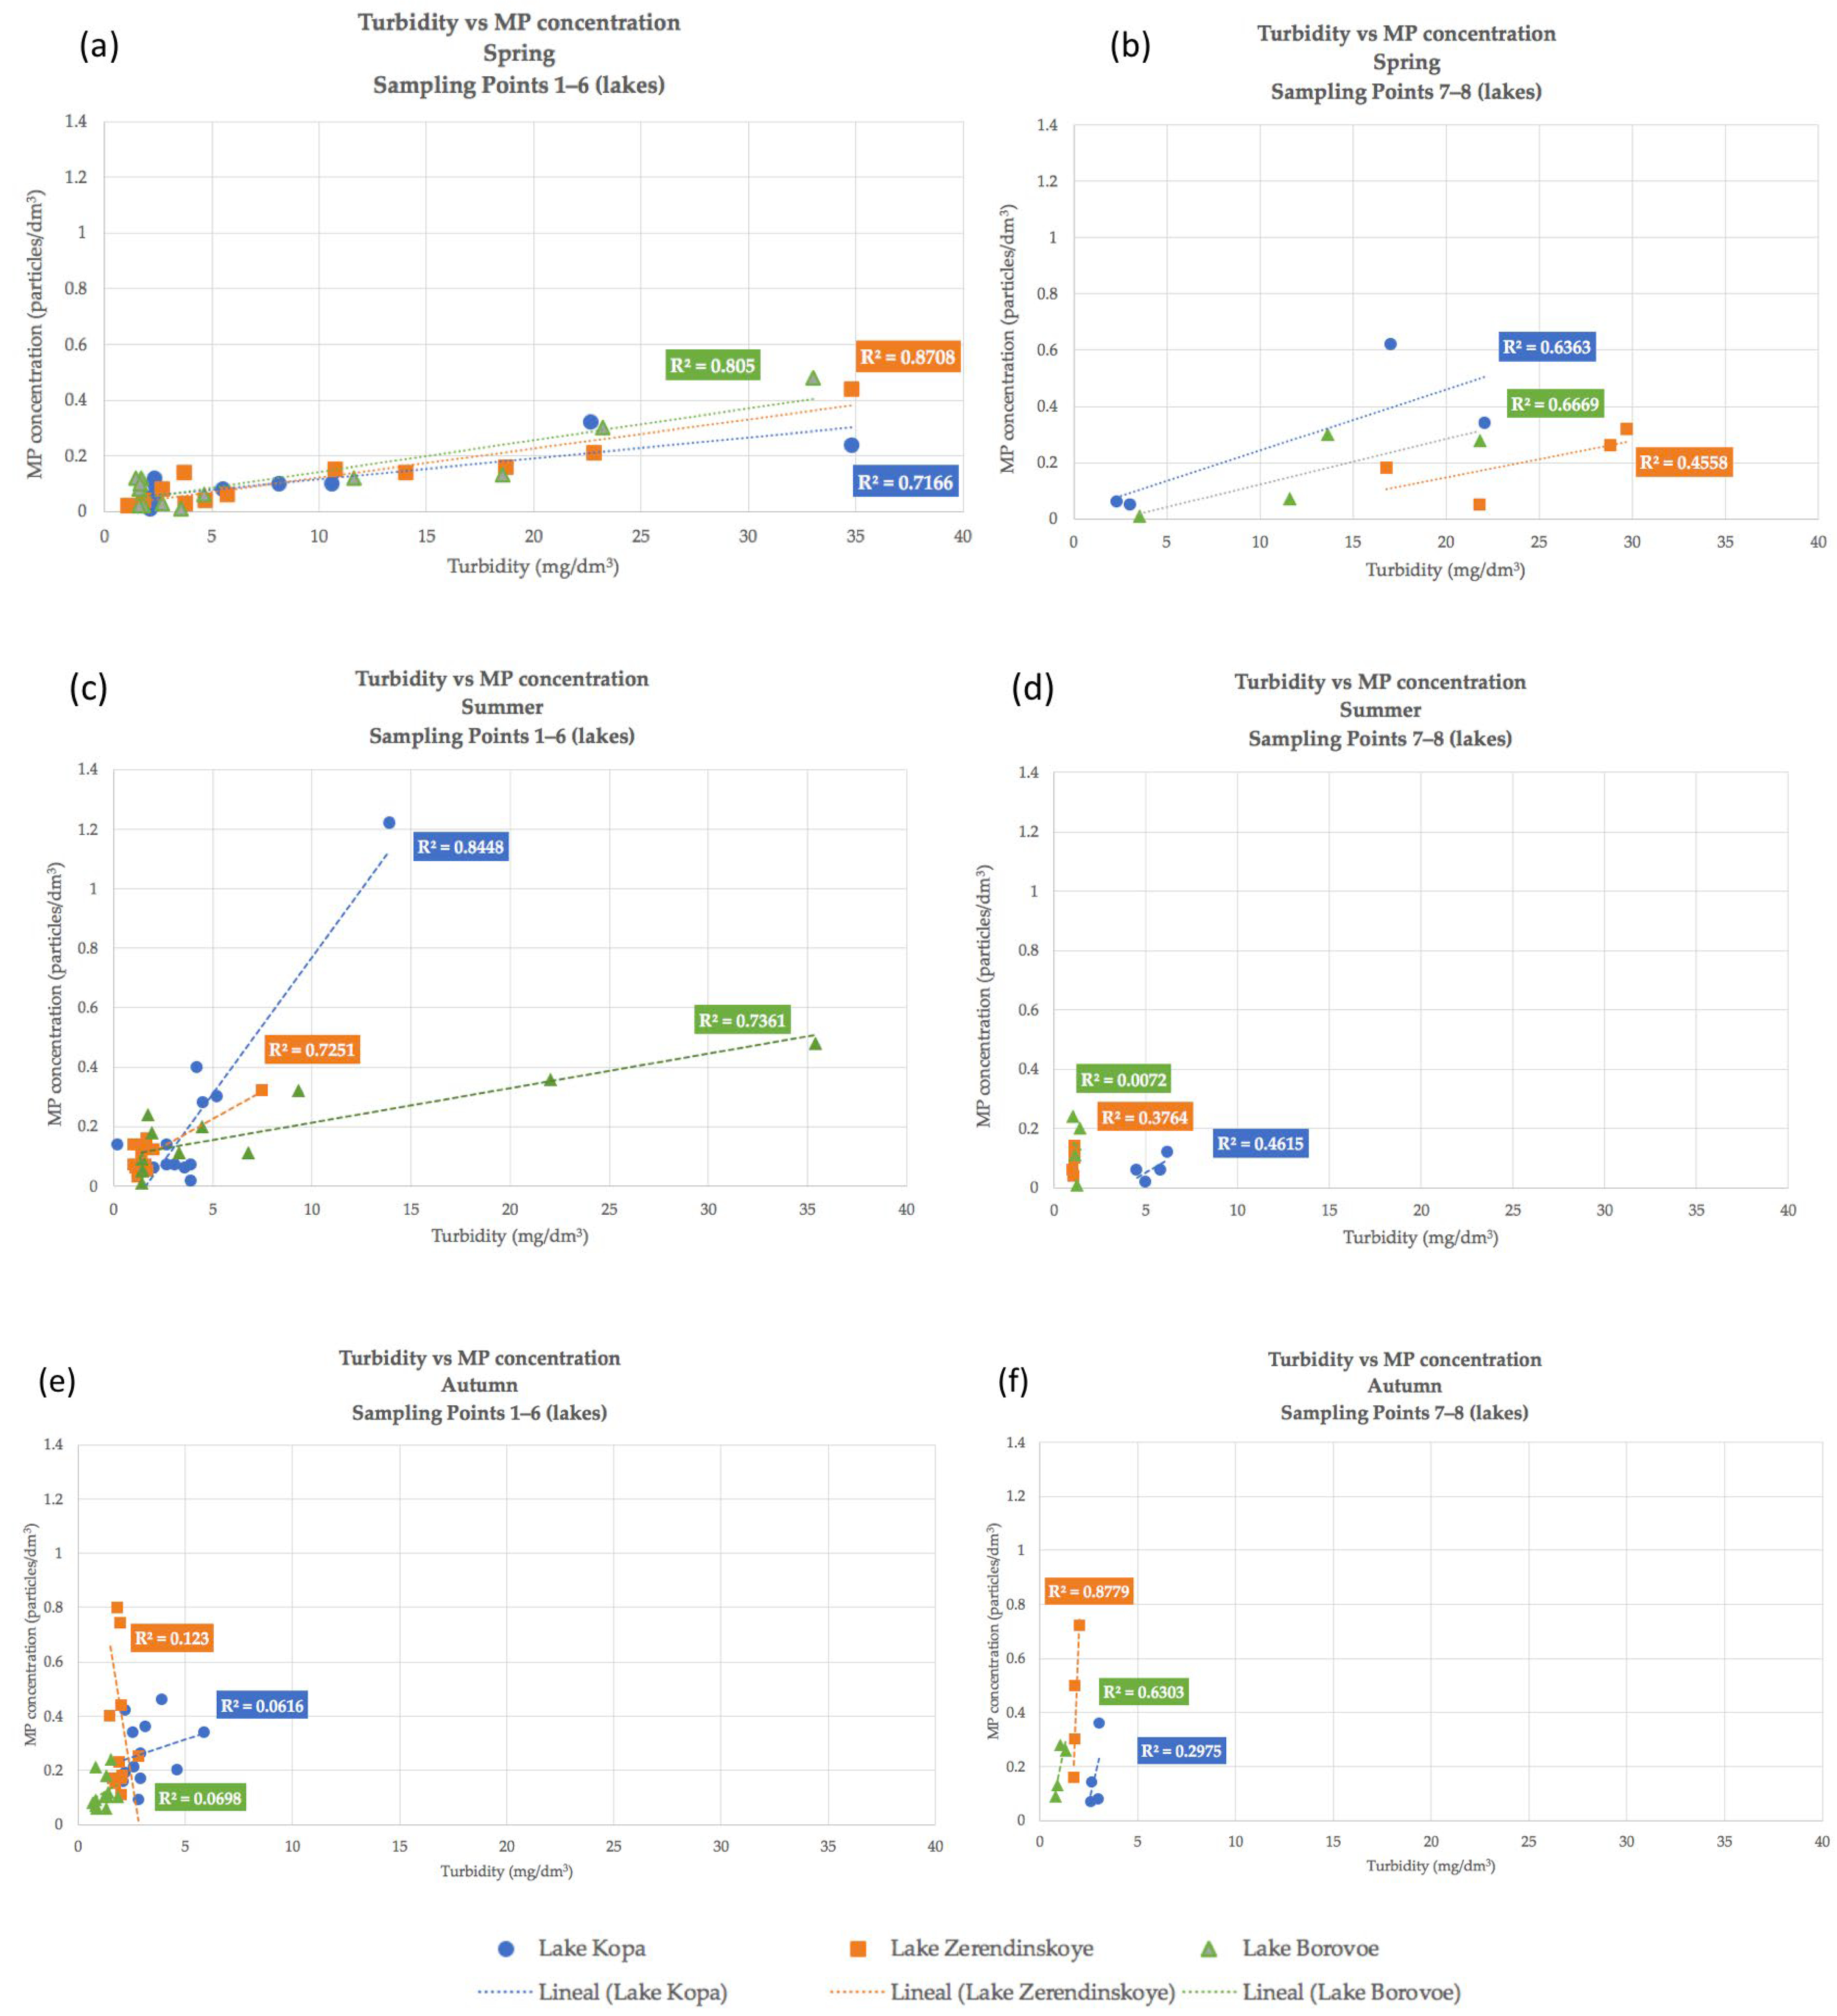
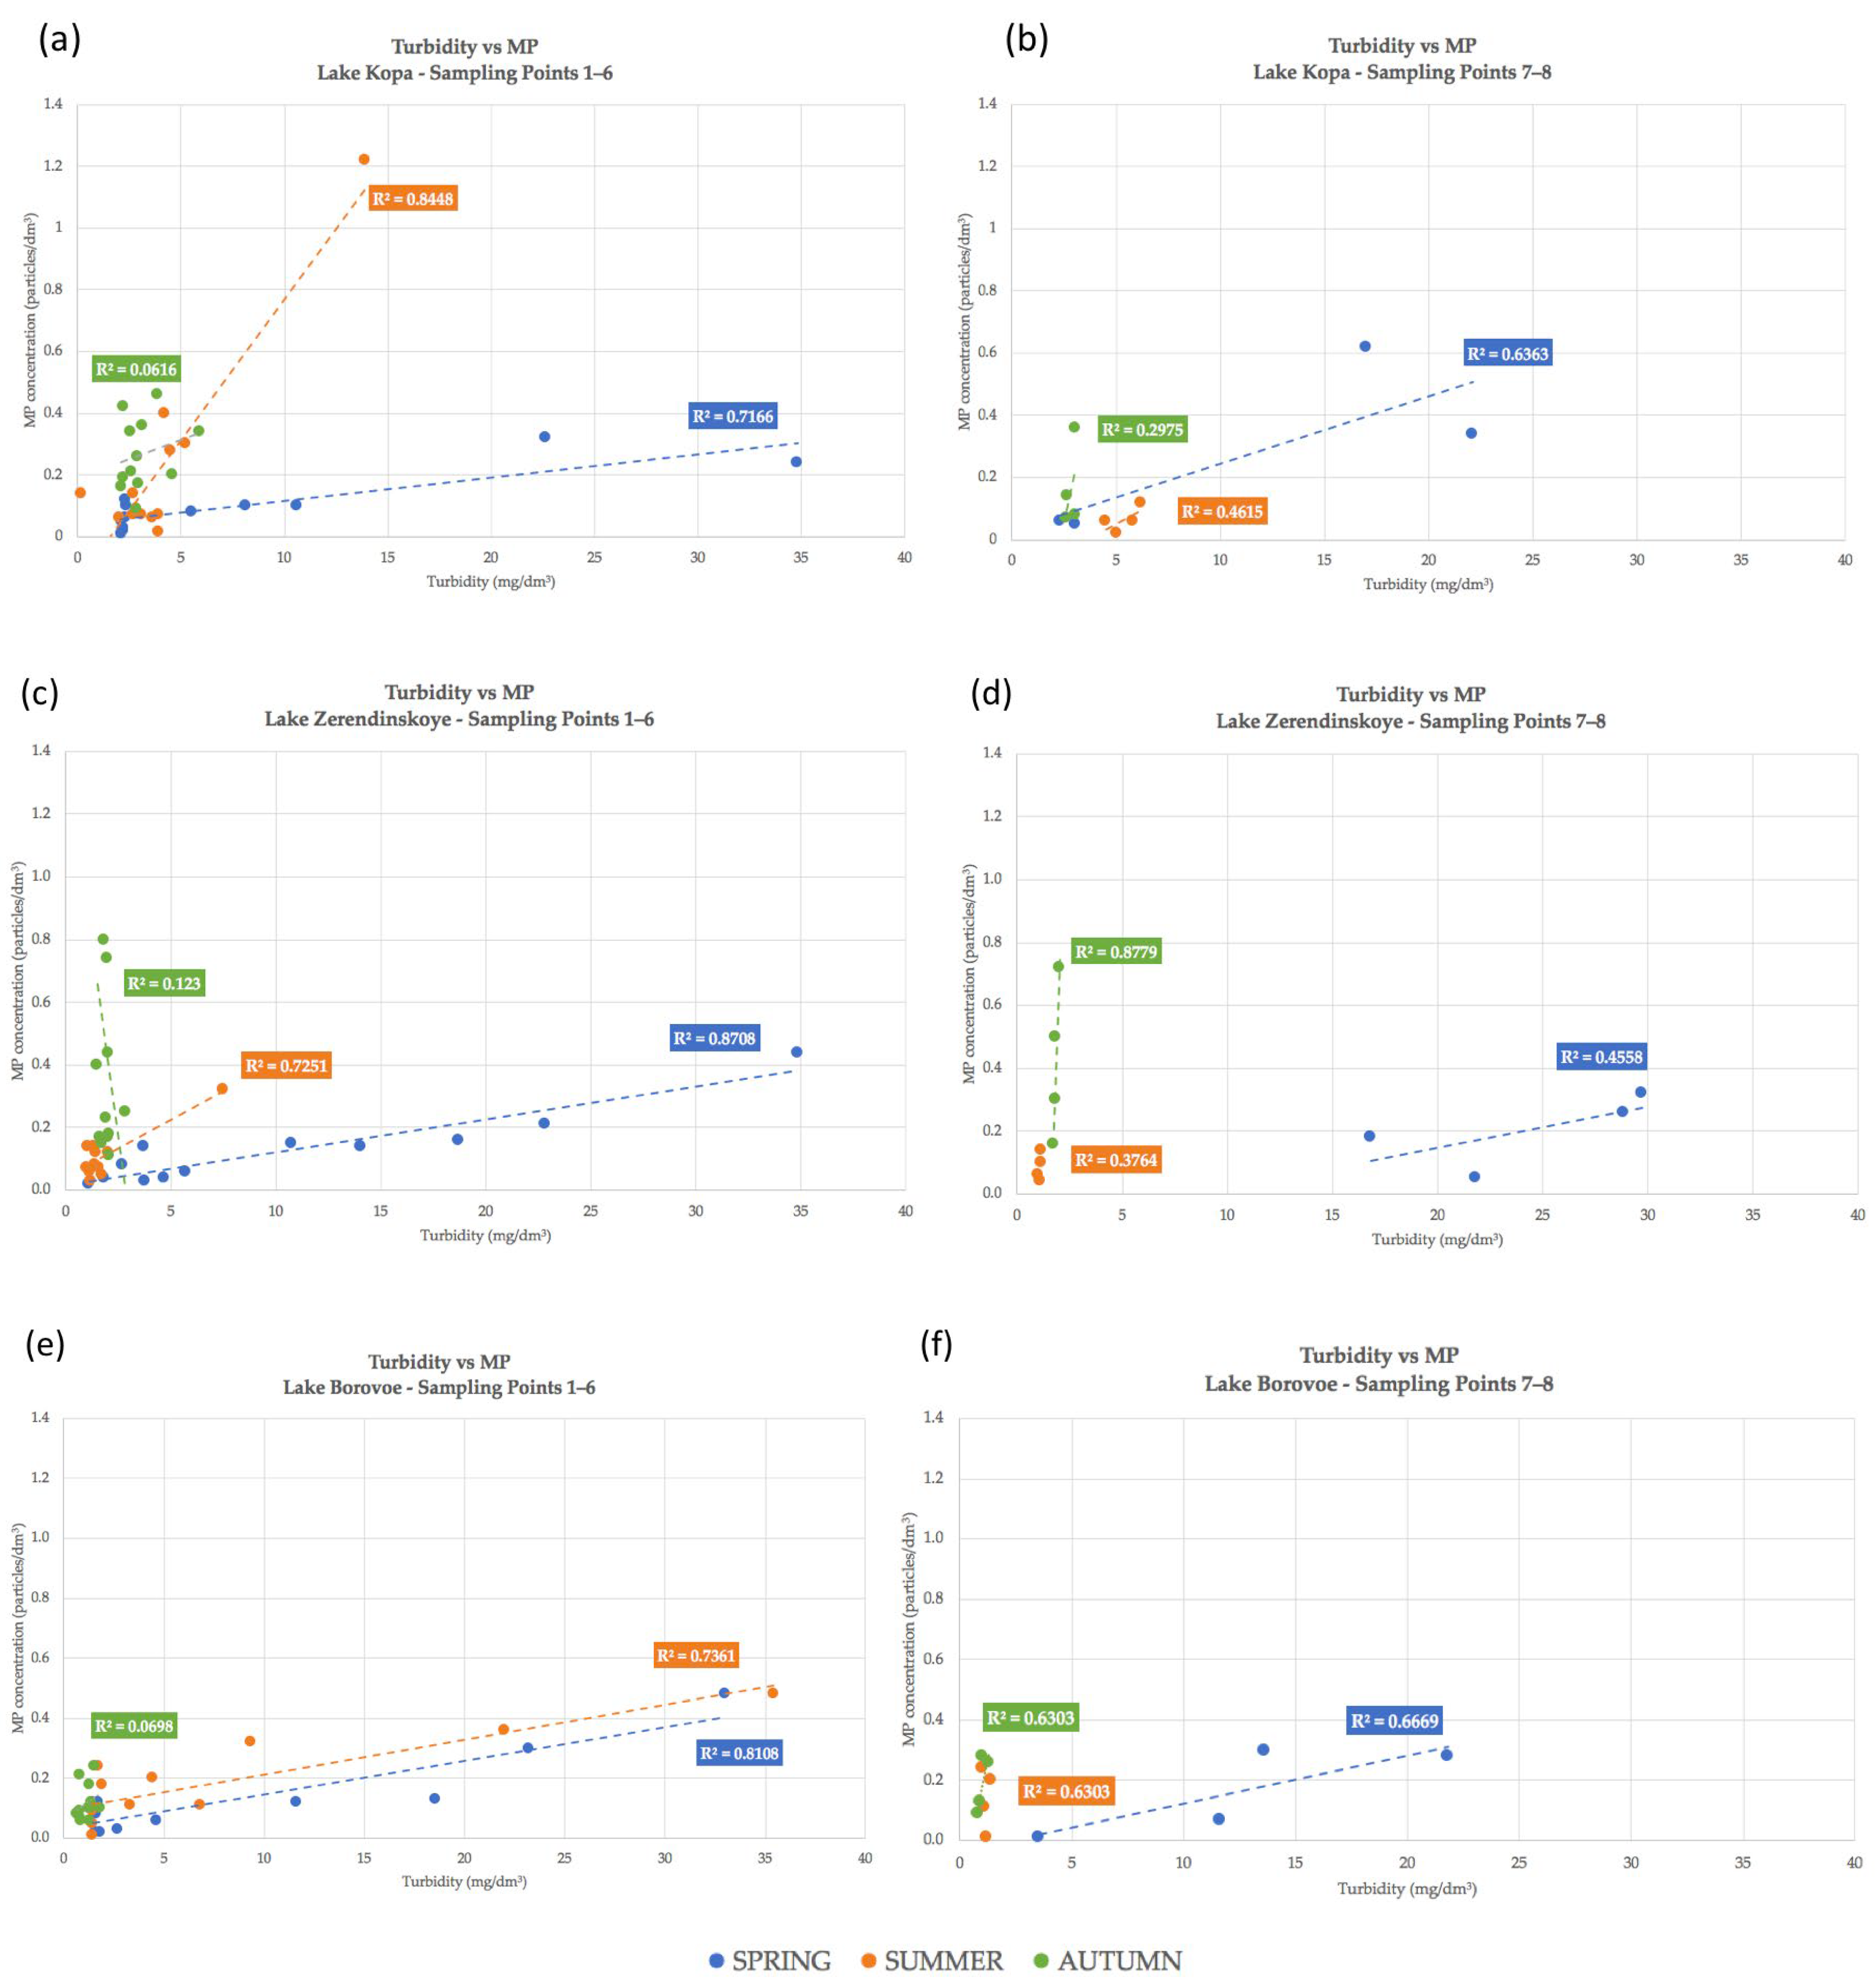
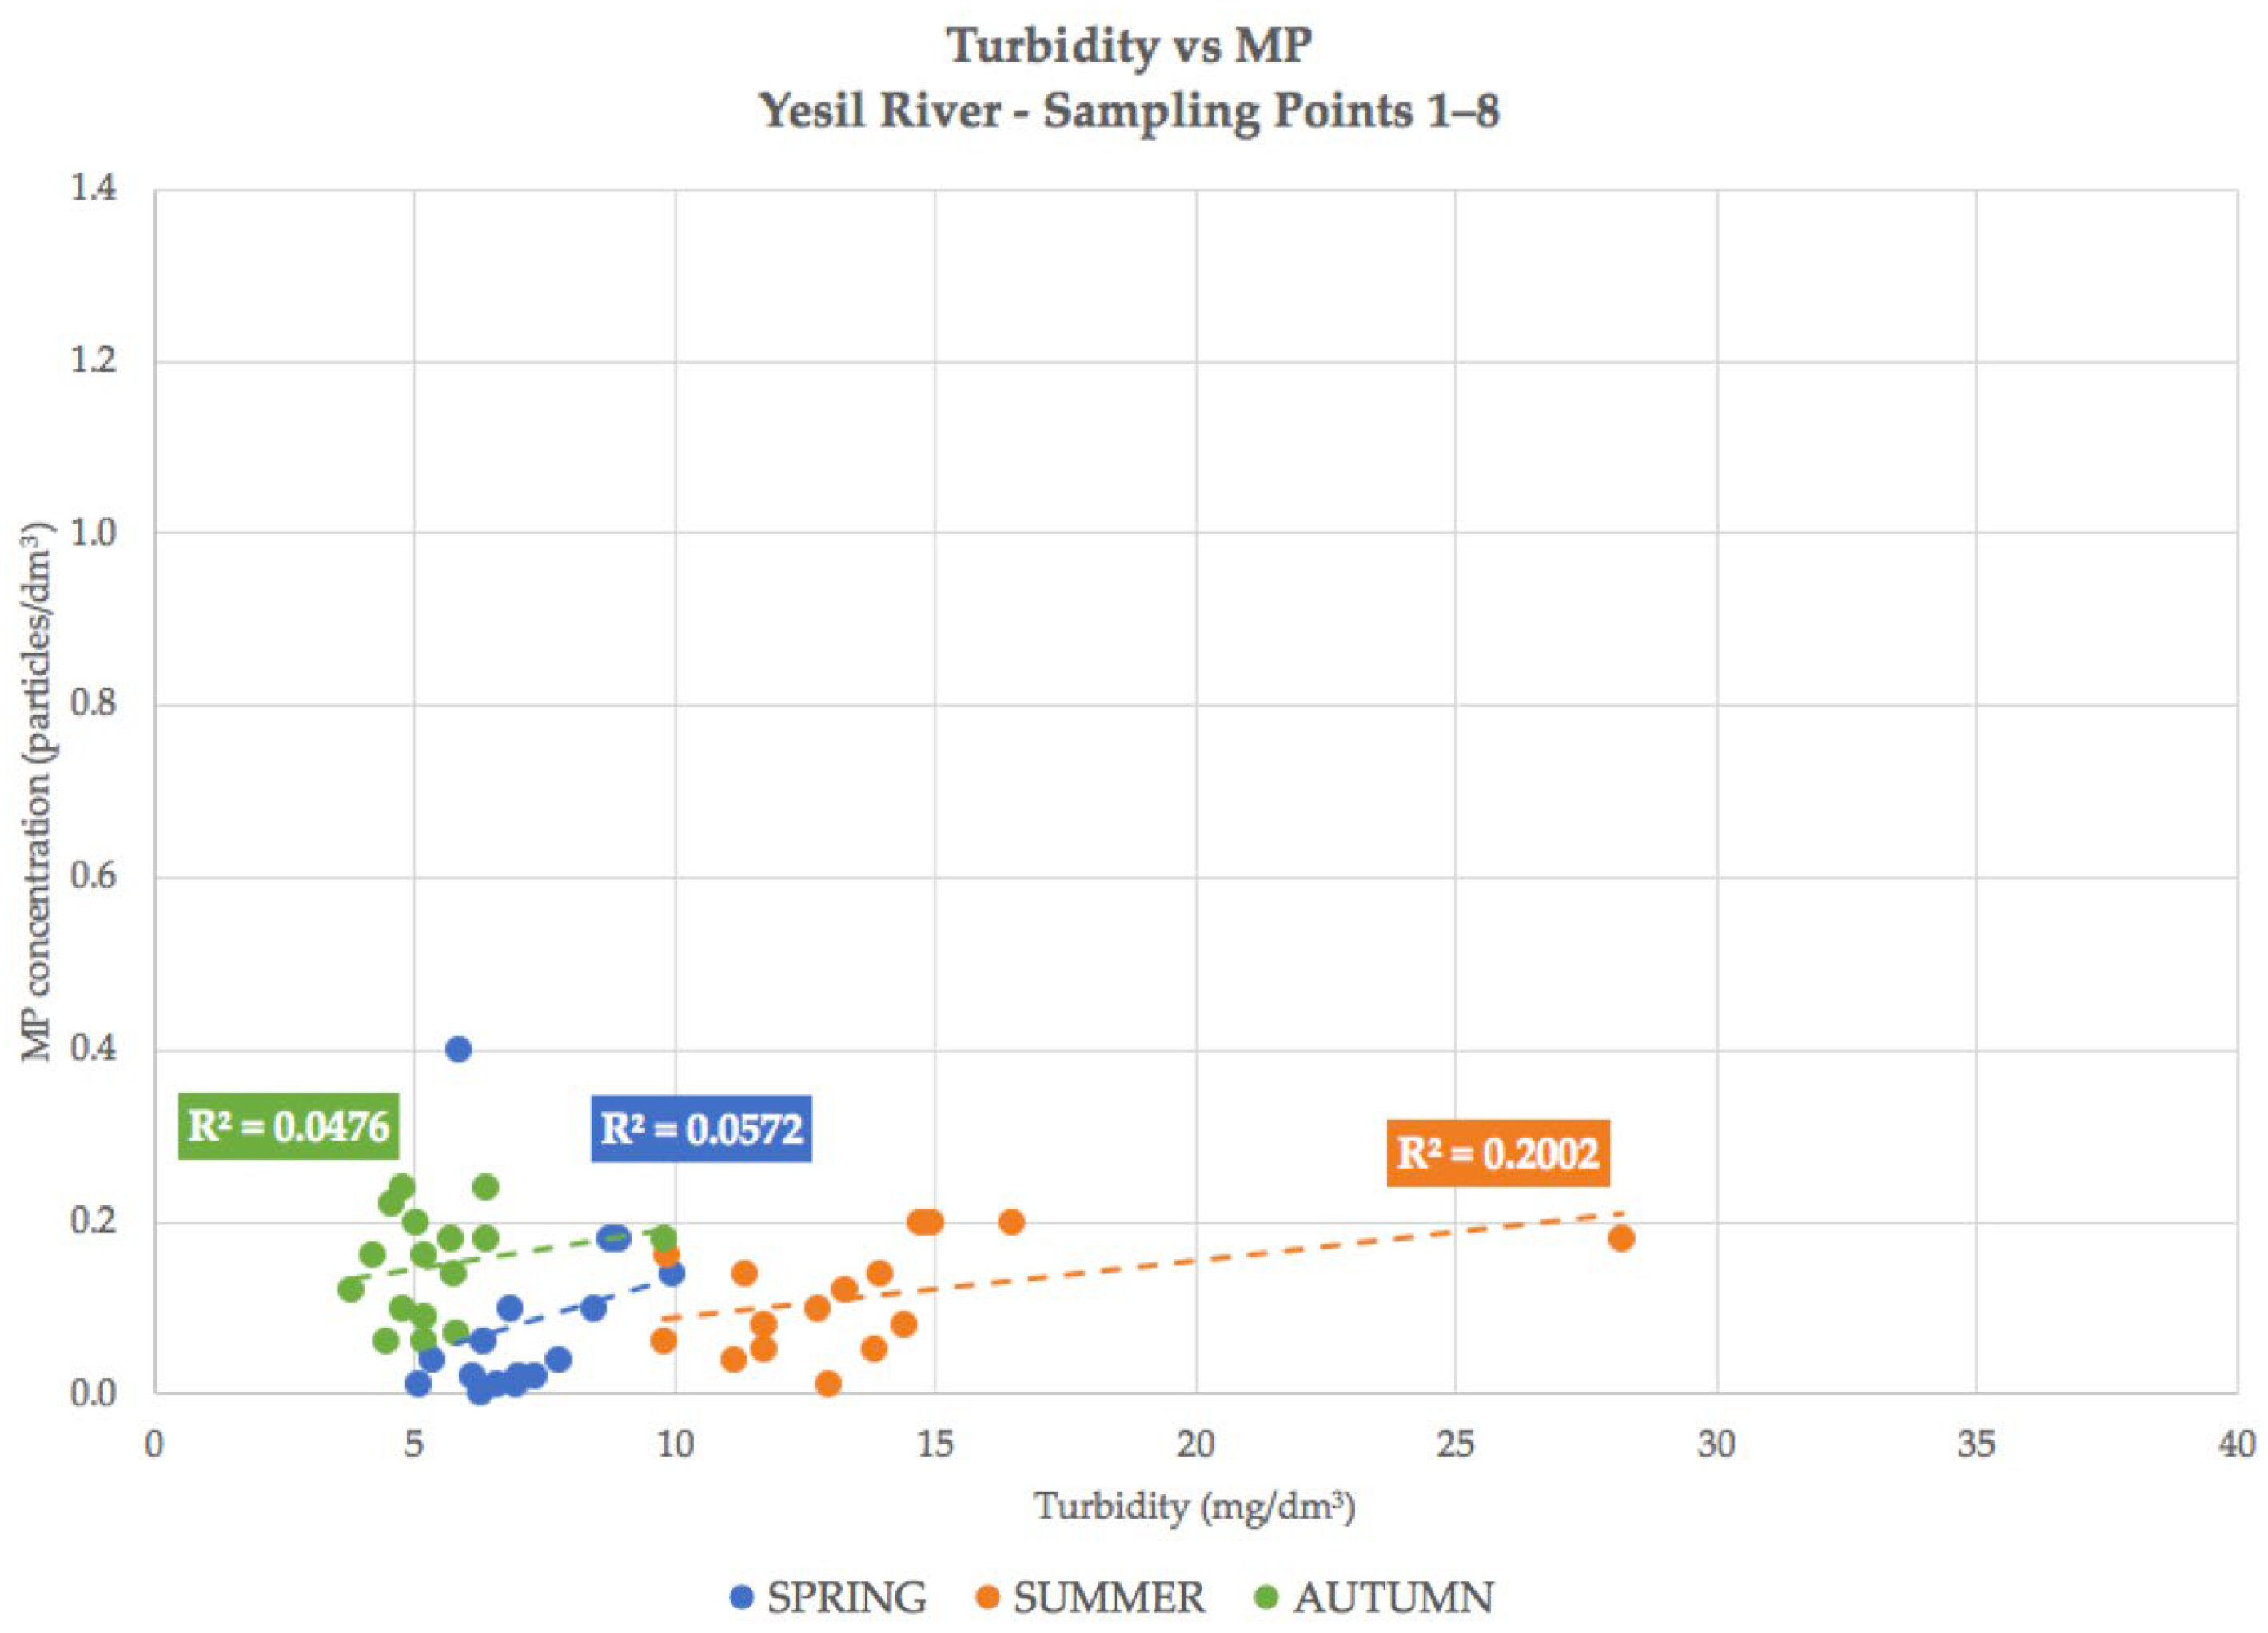
4.2. Correlation Dependencies
4.3. Analysis of MP Content in Sediment Samples
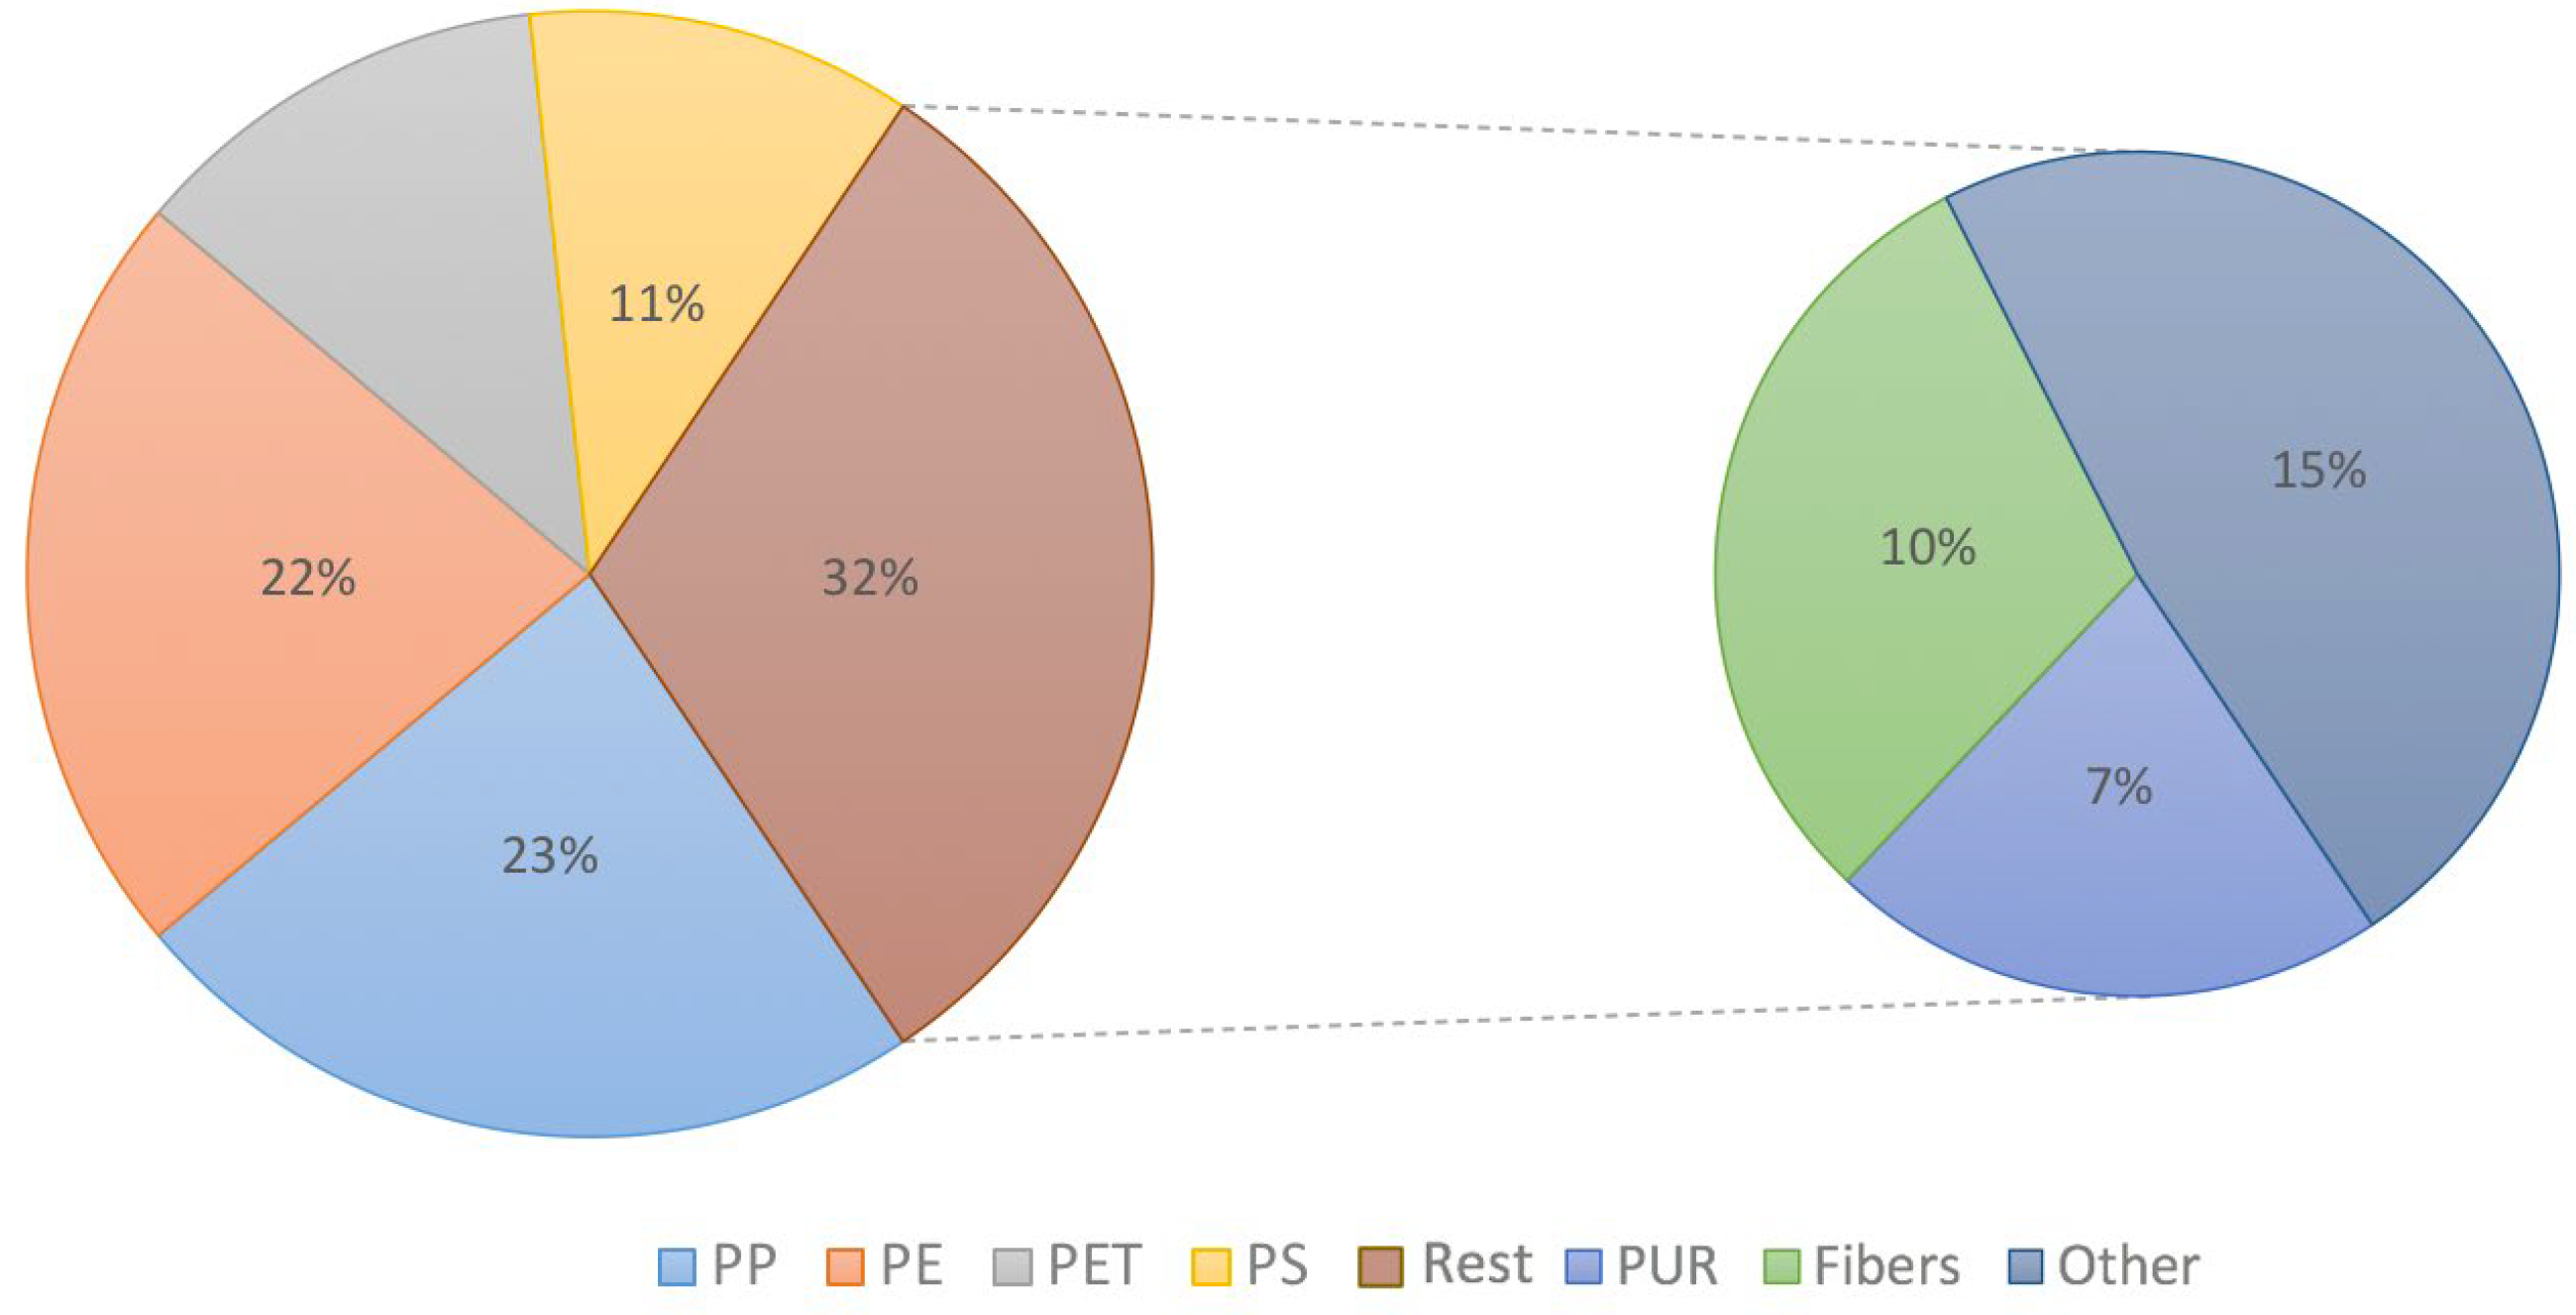
4.4. Analysis of FTIR Results
5. Conclusions
Supplementary Materials
Author Contributions
Funding
Data Availability Statement
Acknowledgments
Conflicts of Interest
References
- Drinking-Water. Available online: https://www.who.int/news-room/fact-sheets/detail/drinking-water (accessed on 5 March 2024).
- Levallois, P.; Villanueva, C.M. Drinking Water Quality and Human Health: An Editorial. Int. J. Environ. Res. Public Health 2019, 16, 631. [Google Scholar] [CrossRef] [PubMed]
- Chang, K.Y.; Wu, I.-W.; Huang, B.-R.; Juang, J.-G.; Wu, J.-C.; Chang, S.-W.; Chang, C.C. Associations between Water Quality Measures and Chronic Kidney Disease Prevalence in Taiwan. Int. J. Environ. Res. Public Health 2018, 15, 2726. [Google Scholar] [CrossRef] [PubMed]
- Meride, Y.; Ayenew, B. Drinking water quality assessment and its effects on residents health in Wondo genet campus, Ethiopia. Environ. Syst. Res. 2016, 5, 1. [Google Scholar] [CrossRef]
- Salikova, N.S.; Rodrigo-Ilarri, J.; Alimova, K.K.; Rodrigo-Clavero, M.-E. Analysis of the Water Quality of the Ishim River within the Akmola Region (Kazakhstan) Using Hydrochemical Indicators. Water 2021, 13, 1243. [Google Scholar] [CrossRef]
- Salikova, N.S.; Seidakhmetova, G.I.; Zhaparova, S.B.; Bayazitova, Z.E.; Kapbasova, G.A. Assessment of the conformity of the quality of decentralised sources of water supply to the sanitary and hygienic requirements of household and drinking purposes. Bull. KazNITU 2020, 6, 109–113. (In Russian) [Google Scholar]
- Salikova, N.S.; Uralbaeva, A.A. Monitoring of hydrochemical indicators of surface water bodies of the Akmola region. Actual Probl. Humanit. Nat. Sci. 2016, 2, 185–188. (In Russian) [Google Scholar]
- Salikova, N.S.; Likhodumova, I.N. Influence of natural and anthropogenic factors on the surface waters quality in the North Kazakhstan region. Water Chem. Ecol. 2015, 5, 9–14. (In Russian) [Google Scholar]
- Salikova, N.S.; Uralbaeva, A.A. On a comprehensive assessment and factors in the formation of the hydrochemical composition of surface waters in the Akmola region. Bull. D. Serikbaev EKSTU. Serikbaev EKSTU. Ser. Earth Sci. 2016, 1, 22–28. (In Russian) [Google Scholar]
- Salikova, N.S. The Quality of Natural Waters in Northern Kazakhstan: A Monograph; IP “Salem”: Almaty, Kazakhstan, 2019. [Google Scholar]
- Mukatova, A.A.; Tleuova, Z.O.; Bayazitova, Z.E. The surface waters quality in the Republic of Kazakhstan. Sci. Real. 2021, 1, 84–85. (In Russian) [Google Scholar]
- Mukhamadeyeva, R.M.; Bayazitova, Z.E.; Elyubaev, S.Z.; Makeyeva, L.A.; Nurmaganbetov, Z.O. Development of Integrated Technology of Collection and Recycling of Plastic in Small Towns. J. Environ. Manag. Tour. 2018, 9, 1366–1376. [Google Scholar] [CrossRef]
- Bayazitova, Z.E.; Zhaparova, S.B.; Mukhamadeyeva, R.M.; Tleuova, Z.O.; Makeeva, L.A.; Yelyubayev, S.Z. Studying the ways to reduce the harmful effects of plastic bottles in municipal solid waste on the environment in small towns. J. Environ. Manag. Tour. 2016, 7, 538–547. [Google Scholar]
- Bayazitova, Z.; Zhaparova, S.; Tleuova, Z.; Makeeva, L.; Kapbasova, G.; Timeeva, M.; Makhmutova, A. Development of an Integrated Technology for the Collection, Sorting and Processing of Plastic Bottles in Small Towns of the Akmola Region. Monograph; Alla Prima: Almaty, Kazakhstan, 2017. (In Russian) [Google Scholar]
- Zhaparova, S.B.; Salikova, N.S.; Bayazitova, Z.E.; Bekbergenova, Z.B. Method of Obtaining Polymer-Sand Paving Slabs. Utility Model Patent RK No. 6808, 14 January 2022. [Google Scholar]
- Zhaparova, S.B.; Bayazitova, Z.E.; Salikova, N.S.; Tleuova, Z.O.; Bekpergenova, Z.B. Development of an effective technology for processing household plastic waste for the development of small business. Bull. KazNITU 2020, 1, 109–113. (In Russian) [Google Scholar]
- Makeeva, L.A.; Tleuova, Z.O.; Zhabaeva, M.U.; Amrina, S.K. Ecological assessment of the impact of municipal solid waste landfills on the state of atmospheric air. Bull. Shakarim Semipalat. State Univ. 2017, 1, 155–160. (In Russian) [Google Scholar]
- Makeeva, L.A.; Tleuova, Z.O.; Bayazitova, Z.E.; Temirbekov, N.G.; Kazytay, A. Influence of accumulation of plastic bottles on the ecological state of soils (on the example of the Schuchinsk landfill). Bull. Shakarim Semipalat. State Univ. 2017, 1, 151–155. (In Russian) [Google Scholar]
- Salikova, N.S.; Rodrigo-Ilarri, J.; Rodrigo-Clavero, M.-E.; Urazbayeva, S.E.; Askarova, A.Z.; Magzhanov, K.M. Environmental Assessment of Microplastic Pollution Induced by Solid Waste Landfills in the Akmola Region (North Kazakhstan). Water 2023, 15, 2889. [Google Scholar] [CrossRef]
- Jambeck, R.; Geyer, R.; Wilcox, C.; Siegler, T.R.; Perryman, M.; Andrady, A.; Narayan, R.; Law, K.L. Plastic waste inputs from land into the ocean. Science 1979, 347, 768–771. [Google Scholar] [CrossRef] [PubMed]
- U.S. National Park Service. Decomposition Times of Marine Debris. Available online: https://ourworldindata.org/grapher/decomposition-rates-marine-debris (accessed on 4 April 2024).
- Geyer, R.; Jambeck, J.R.; Law, K.L. Production, use, and fate of all plastics ever made. Sci. Adv. 2017, 3, e1700782. [Google Scholar] [CrossRef]
- Government of the Republic of Kazakhstan. Landfills in Akmola. Available online: https://www.gov.kz/memleket/entities/ecogeo/press/news/details/244813?lang=ru (accessed on 22 February 2024).
- Hartmann, N.B.; Hüffer, T.; Thompson, R.C.; Hassellöv, M.; Verschoor, A.; Daugaard, A.E.; Rist, S.; Karlsson, T.; Brennholt, N.; Cole, M.; et al. Are We Speaking the Same Language? Recommendations for a Definition and Categorization Framework for Plastic Debris. Environ. Sci. Technol. 2019, 53, 1039–1047. [Google Scholar] [CrossRef]
- Frias, J.P.G.L.; Nash, R. Microplastics: Finding a consensus on the definition. Mar. Pollut. Bull. 2019, 138, 145–147. [Google Scholar] [CrossRef]
- Cole, M.; Lindeque, P.; Halsband, C.; Galloway, T.S. Microplastics as contaminants in the marine environment: A review. Mar. Pollut. Bull. 2011, 62, 2588–2597. [Google Scholar] [CrossRef]
- Joint Group of Experts on the Scientific Aspects of Marine Environmental Protection. Sources, Fate and Effects of Microplastics in the Marine Environment (Part 2). 2016. Available online: https://unesdoc.unesco.org/ark:/48223/pf0000247517 (accessed on 20 February 2024).
- Andrady, A.L. Plastics and Environmental Sustainability; John Wiley & Sons: Hoboken, NJ, USA, 2015. [Google Scholar] [CrossRef]
- Wright, S.L.; Thompson, R.C.; Galloway, T.S. The physical impacts of microplastics on marine organisms: A review. Environ. Pollut. 2013, 178, 483–492. [Google Scholar] [CrossRef] [PubMed]
- Cox, K.D.; Covernton, G.A.; Davies, H.L.; Dower, J.F.; Juanes, F.; Dudas, S.E. Human Consumption of Microplastics. Environ. Sci. Technol. 2019, 53, 7068–7074. [Google Scholar] [CrossRef] [PubMed]
- De Wit, W.; Bigaud, N. No Plastic in Nature: Assessing Plastic Ingestion from Nature to People: An Analysis for WWF; WWF: Gland, Switzerland, 2019. [Google Scholar]
- Deng, Y.; Zhang, Y.; Lemos, B.; Ren, H. Tissue accumulation of microplastics in mice and biomarker responses suggest widespread health risks of exposure. Sci. Rep. 2017, 7, srep46687. [Google Scholar] [CrossRef]
- Schwabl, P.; Köppel, S.; Königshofer, P.; Bucsics, T.; Trauner, M.; Reiberger, T.; Liebmann, B. Detection of Various Microplastics in Human Stool. Ann. Intern. Med. 2019, 171, 453–457. [Google Scholar] [CrossRef] [PubMed]
- Ragusa, A.; Svelato, A.; Santacroce, C.; Catalano, P.; Notarstefano, V.; Carnevali, O.; Papa, F.; Rongioletti, M.C.A.; Baiocco, F.; Draghi, S.; et al. Plasticenta: First evidence of microplastics in human placenta. Environ. Int. 2021, 146, 106274. [Google Scholar] [CrossRef] [PubMed]
- Torres, F.G.; Dioses-Salinas, D.C.; Pizarro-Ortega, C.I.; De-la-Torre, G.E. Sorption of chemical contaminants on degradable and non-degradable microplastics: Recent progress and research trends. Sci. Total Environ. 2021, 757, 143875. [Google Scholar] [CrossRef]
- Fu, L.; Li, J.; Wang, G.; Luan, Y.; Dai, W. Adsorption behavior of organic pollutants on microplastics. Ecotoxicol. Environ. Saf. 2021, 217, 112207. [Google Scholar] [CrossRef] [PubMed]
- Yang, H.; Dong, H.; Huang, Y.; Chen, G.; Wang, J. Interactions of microplastics and main pollutants and environmental behavior in soils. Sci. Total Environ. 2022, 821, 153511. [Google Scholar] [CrossRef] [PubMed]
- Mahon, A.M.; Officer, R.; Nash, R.; O’Connor, I. Scope, Behaviour, Risks and Impacts of Microplastic Pollution in Irish Freshwater Systems; Environmental Protection Agency by Marine and Freshwater Research Centre, Galway-Mayo Institute of Technology: Galway, Ireland, 2017. [Google Scholar]
- Maes, T.; Van der Meulen, M.D.; Devriese, L.I.; Leslie, H.A.; Huvet, A.; Frère, L.; Robbens, J.; Vethaak, A.D. Microplastics baseline surveys at the water surface and in sediments of the North-East Atlantic. Front. Mar. Sci. 2017, 4, 257485. [Google Scholar] [CrossRef]
- Bergman, M.; Gutow, L.; Klages, M. Marine Anthropogenic Litter; Springer: Berlin, Germany, 2015. [Google Scholar]
- Baimukanov, M.T.; Baimukanova, Z.M. On plastic pollution and its potential impact on the biodiversity of the Caspian Sea. Sci. News Kazakhstan 2021, 2, 174–179. (In Russian) [Google Scholar]
- Malygina, N.; Mitrofanova, E.; Kuryatnikova, N.; Biryukov, R.; Zolotov, D.; Pershin, D.; Chernykh, D. Microplastic Pollution in the Surface Waters from Plain and Mountainous Lakes in Siberia, Russia. Water 2021, 13, 2287. [Google Scholar] [CrossRef]
- Wakkaf, T.; El Zrelli, R.; Kedzierski, M.; Balti, R.; Shaiek, M.; Mansour, L.; Tlig-Zouari, S.; Bruzaud, S.; Rabaoui, L. Characterization of microplastics in the surface waters of an urban lagoon (Bizerte lagoon, Southern Mediterranean Sea): Composition, density, distribution, and influence of environmental factors. Mar. Pollut. Bull. 2020, 160, 111625. [Google Scholar] [CrossRef]
- Kye, H.; Kim, J.; Ju, S.; Lee, J.; Lim, C.; Yoon, Y. Microplastics in water systems: A review of their impacts on the environment and their potential hazards. Heliyon 2023, 9, e14359. [Google Scholar] [CrossRef]
- Kazbekov, A.K.; Kabiev, E.K. Hydrogeological and Engineering-Geological Studies in Northern Kazakhstan; Polygraphy: Kokshetau, Kazakhstan, 1997. [Google Scholar]
- Klushev, S.L.; Arefieva, V.A.; Zatenatskaya, T.I.; Isachenko, N.P.; Pachikina, Y.I.; Rubinshtein, L.I.; Feldman, M.I. Brief information about natural conditions and study of the Kokchetav region. In Natural Zoning of Northern Kazakhstan; AN SSSR: Moscow-Leningrad, Russia, 1960. [Google Scholar]
- Berkaliev, Z.T. Hydrological Regime of the Rivers of Central, Northern and Western Kazakhstan; AN SSSR: Moscow-Leningrad, Russia, 1959. [Google Scholar]
- Dolatova, L.A. Features of the hydrochemical composition of the middle reaches of the Ishim River and lakes of its basin. World Sci. Cult. Educ. 2011, 1, 347–351. [Google Scholar]
- Muravlev, G.G. Small Lakes of Kazakhstan; Gidrometeoizdat: Leningrad, Russia, 1973. [Google Scholar]
- Filonets, P.P. Lakes of Northern, Western and Eastern Kazakhstan: A Reference Book; Gidrometeoizdat: Leningrad, Russia, 1974. [Google Scholar]
- Davitaya, F.F. (Ed.) Agroclimatic and Water Resources of Areas of Development of Virgin and Fallow Lands; Gidrometeoizdat: Leningrad, Russia, 1955. [Google Scholar]
- Doyle, M.J.; Watson, W.; Bowlin, N.M.; Sheavly, S.B. Plastic particles in coastal pelagic ecosystems of the Northeast Pacific ocean. Mar. Environ. Res. 2011, 71, 41–52. [Google Scholar] [CrossRef] [PubMed]
- Gago, J.; Galgani, F.; Maes, T.; Thompson, R.C. Microplastics in seawater: Recommendations from the marine strategy framework directive implementation process. Front. Mar. Sci. 2016, 3, 214280. [Google Scholar] [CrossRef]
- Park, H.; Park, B. Review of Microplastic Distribution, Toxicity, Analysis Methods, and Removal Technologies. Water 2021, 13, 2736. [Google Scholar] [CrossRef]
- Lindeque, P.K.; Cole, M.; Coppock, R.L.; Lewis, C.N.; Miller, R.Z.; Watts, A.J.; Wilson-McNeal, A.; Wright, S.L.; Galloway, T.S. Are we underestimating microplastic abundance in the marine environment? A comparison of microplastic capture with nets of different mesh-size. Environ. Poll. 2020, 265, 114721. [Google Scholar] [CrossRef]
- Dubaish, F.; Liebezeit, G. Suspended microplastics and black carbon particles in the Jade system, southern North Sea. Water Air Soil Poll. 2013, 224, 1352. [Google Scholar] [CrossRef]
- Uddin, S.; Fowler, S.W.; Uddin, M.F.; Behbehani, M.; Naji, A. A review of microplastic distribution in sediment profiles. Mar. Pollut. Bull. 2021, 163, 111973. [Google Scholar] [CrossRef]
- Darabi, M.; Majeed, H.; Diehl, A.; Norton, J.; Zhang, Y. A Review of Microplastics in Aquatic Sediments: Occurrence, Fate, Transport, and Ecological Impact. Curr. Pollut. Rep. 2021, 7, 40–53. [Google Scholar] [CrossRef]
- Minister of Health of the Republic of Kazakhstan, On Approval of Hygienic Norms of Safety Indicators of Household Drinking and Cultural and Domestic Water Use. 2022. Available online: https://adilet.zan.kz/rus/docs/V2200030713 (accessed on 5 March 2024).
- Interstate Standard 31868-2012. Water. Methods for Determining Color. Interstate Council for Standardization, Metrology and Certification: Moscow, Russia, 2019; p. 12. Available online: https://docs.cntd.ru/document/1200097407 (accessed on 31 March 2024).
- Interstate Standard 3351-74. Drinking Water. Method for Determinination of Odour, Taste, Color and Turbidity. Publishing House of Standards: Moscow, Russia, 2003; p. 8. Available online: https://meganorm.ru/Index2/1/4294850/4294850608.htm (accessed on 31 March 2024).
- ISO Standard 4316-2019. Surfactants. Determination of pH of Aqueous Solutions. Potentiometric Method. Technical Committee ISO/TC91:1977. International Organization for Standardization: Geneva, Switzerland, 1977. Available online: https://online.zakon.kz/Document/?doc_id=33823182&pos=30;-10#pos=30;-10 (accessed on 31 March 2024).
- State Mandatory Standard 26449. 1-85. Stationary Distillation and Desalination Plants. Methods for Chemical Analysis of Salt Waters. USSR State Committee on Standards: Moscow, Russia, 1985; p. 101. Available online: https://files.stroyinf.ru/Index2/1/4294850/4294850335.htm (accessed on 31 March 2024).
- Interstate Standard 33045-2014. Water. Methods for Determining Nitrogen-Containing Substances. Interstate Council for Standardization, Metrology and Certification: Moscow, Russia, 2014; p. 24. Available online: https://docs.cntd.ru/document/1200115428 (accessed on 31 March 2024).
- Interstate Standard 31954-20120. Drinking Water. Methods of Hardness Determination. Interstate Council for Standardization, Metrology and Certification: Moscow, Russia, 2018; p. 18. Available online: https://docs.cntd.ru/document/1200097815 (accessed on 31 March 2024).
- State Mandatory Standard 18164-72. Drinking Water. Method for Determination of Total Solids Content. USSR State Committee on Standards: Moscow, Russia, 1972; p. 4. Available online: https://docs.cntd.ru/document/1200012556 (accessed on 31 March 2024).
- Interstate Standard 4389-72. Methods for Determination of Sulphate Content. Publishing House of Standards: Moscow, Russia, 1972; p. 9. Available online: https://files.stroyinf.ru/Data2/1/4294850/4294850724.htm (accessed on 31 March 2024).
- Interstate Standard 4011-72. Drinking Water. Methods for Determination of Total Iron. Publishing House of Standards: Moscow, Russia, 1972; p. 8. Available online: https://docs.cntd.ru/document/1200008210 (accessed on 31 March 2024).
- Salikova, N.S.; Makeeva, L.A.; Urazbayeva, S.E.; Askarova, A.J.; Magzhanov, K.M. Method of Extraction and Purification of Microplastic from Natural Media. Copyright Certificate for the Work of Science No. 39146 Issued on 21 September 2023, Kazakh National Institute of Intellectual Property (Kazpatent). Available online: https://copyright.kazpatent.kz/?!.iD=PLEk. (accessed on 4 April 2024).
- Cable, R.N.; Beletsky, D.; Beletsky, R.; Wigginton, K.; Locke, B.W.; Duhaime, M.B. Distribution and modeled transport of plastic pollution in the Great Lakes, the world’s largest freshwater resource. Front. Environ. Sci. 2017, 5, 246530. [Google Scholar] [CrossRef]
- Ziajahromi, S.; Neale, P.A.; Rintoul, L.; Leusch, F.D.L. Wastewater treatment plants as a pathway for microplastics: Development of a new approach to sample wastewater-based microplastics. Water Res. 2017, 112, 93–99. [Google Scholar] [CrossRef]
- Allen, S.; Allen, D.; Phoenix, V.R.; Le Roux, G.; Jiménez, P.D.; Simonneau, A.; Binet, S.; Galop, D. Atmospheric transport and deposition of microplastics in a remote mountain catchment. Nat. Geosci. 2019, 12, 339–344. [Google Scholar] [CrossRef]
- Wesch, C.; Bredimus, K.; Paulus, M.; Klein, R. Towards the suitable monitoring of ingestion of microplastics by marine biota: A review. Environ. Pollut. 2016, 218, 1200–1208. [Google Scholar] [CrossRef] [PubMed]
- Hermsen, E.; Pompe, R.; Besseling, E.; Koelmans, A.A. Detection of low numbers of microplastics in North Sea fish using strict quality assurance criteria. Mar. Pollut. Bull. 2017, 122, 253–258. [Google Scholar] [CrossRef] [PubMed]
- Vandermeersch, G.; Van Cauwenberghe, L.; Janssen, C.R.; Marques, A.; Granby, K.; Fait, G.; Kotterman, M.J.; Diogène, J.; Bekaert, K.; Robbens, J.; et al. A critical view on microplastic quantification in aquatic organisms. Environ. Res. 2015, 143, 46–55. [Google Scholar] [CrossRef] [PubMed]
- Hermsen, E.; Mintenig, S.M.; Besseling, E.; Koelmans, A.A. Quality Criteria for the Analysis of Microplastic in Biota Samples: A Critical Review. Environ. Sci. Technol. 2018, 52, 10230–10240. [Google Scholar] [CrossRef] [PubMed]
- Gao, W.; Deng, X.J.; Zhang, J.; Qi, L.; Zhao, X.Q.; Zhang, P.Y. Assessment of quality control measures in the monitoring of microplastic: A critical review. Environ. Pollut. Bioavailab. 2023, 35, 2203349. [Google Scholar] [CrossRef]
- Praveena, S.M.; Laohaprapanon, S. Quality assessment for methodological aspects of microplastics analysis in bottled water—A critical review. Food Control. 2021, 130, 108285. [Google Scholar] [CrossRef]
- Monteiro, S.S.; Rocha-Santos, T.; Prata, J.C.; Duarte, A.C.; Girão, A.V.; Lopes, P.; Cristovão, T.; da Costa, J.P. A straightforward method for microplastic extraction from organic-rich freshwater samples. Sci. Total Environ. 2022, 815, 152941. [Google Scholar] [CrossRef] [PubMed]
- Fries, E.; Dekiff, J.H.; Willmeyer, J.; Nuelle, M.T.; Ebert, M.; Remy, D. Identification of polymer types and additives in marine microplastic particles using pyrolysis-GC/MS and scanning electron microscopy. Environ. Sci. Process. Impacts 2013, 15, 1949–1956. [Google Scholar] [CrossRef] [PubMed]
- Imhof, H.K.; Ivleva, N.P.; Schmid, J.; Niessner, R.; Laforsch, C. Contamination of beach sediments of a subalpine lake with microplastic particles. Curr. Biol. 2013, 23, R867–R868. [Google Scholar] [CrossRef] [PubMed]
- Joint Research Centre and Institute for Environment and Sustainability, Guidance on Monitoring of Marine Litter in European Seas—Publications Office of the EU. 2013. Available online: https://op.europa.eu/en/publication-detail/-/publication/76da424f-8144-45c6-9c5b-78c6a5f69c5d/language-en (accessed on 5 March 2024).
- Hidalgo-Ruz, V.; Gutow, L.; Thompson, R.C.; Thiel, M. Microplastics in the marine environment: A review of the methods used for identification and quantification. Environ. Sci. Technol. 2012, 46, 3060–3075. [Google Scholar] [CrossRef]
- Oni, B.A.; Sanni, S.E. Occurrence of Microplastics in Borehole Drinking Water and Sediments in Lagos, Nigeria. Environ. Toxicol. Chem. 2022, 41, 1721–1731. [Google Scholar] [CrossRef]
- Lavoy, M.; Crossman, J. A novel method for organic matter removal from samples containing microplastics. Environ. Pollut. 2021, 286, 117357. [Google Scholar] [CrossRef]
- Al-Azzawi, M.S.M.; Kefer, S.; Weißer, J.; Reichel, J.; Schwaller, C.; Glas, K.; Knoop, O.; Drewes, J.E. Validation of Sample Preparation Methods for Microplastic Analysis in Wastewater Matrices—Reproducibility and Standardization. Water 2020, 12, 2445. [Google Scholar] [CrossRef]
- Hernandez, L.M.; Grant, J.; Fard, P.S.; Farner, J.M.; Tufenkji, N. Analysis of ultraviolet and thermal degradations of four common microplastics and evidence of nanoparticle release. J. Hazard. Mater. Lett. 2023, 4, 100078. [Google Scholar] [CrossRef]
- Munno, K.; Helm, P.A.; Jackson, D.A.; Rochman, C.; Sims, A. Impacts of temperature and selected chemical digestion methods on microplastic particles. Environ. Toxicol. Chem. 2018, 37, 91–98. [Google Scholar] [CrossRef]
- Corradini, F.; Meza, P.; Eguiluz, R.; Casado, F.; Huerta-Lwanga, E.; Geissen, V. Evidence of microplastic accumulation in agricultural soils from sewage sludge disposal. Sci. Total Environ. 2019, 671, 411–420. [Google Scholar] [CrossRef]
- Lusher, A.L.; McHugh, M.; Thompson, R.C. Occurrence of microplastics in the gastrointestinal tract of pelagic and demersal fish from the English Channel. Mar. Pollut. Bull. 2013, 67, 94–99. [Google Scholar] [CrossRef]
- Mariano, S.; Tacconi, S.; Fidaleo, M.; Rossi, M.; Dini, L. Micro and Nanoplastics Identification: Classic Methods and Innovative Detection Techniques. Front. Toxicol. 2021, 3, 636640. [Google Scholar] [CrossRef] [PubMed]
- Koelmans, A.A.; Nor, N.H.M.; Hermsen, E.; Kooi, M.; Mintenig, S.M.; De France, J. Microplastics in freshwaters and drinking water: Critical review and assessment of data quality. Water Res. 2019, 155, 410–422. [Google Scholar] [CrossRef] [PubMed]
- Li, Y.; Zhang, Y.; Chen, G.; Xu, K.; Gong, H.; Huang, K.; Yan, M.; Wang, J. Microplastics in Surface Waters and Sediments from Guangdong Coastal Areas, South China. Sustainability 2021, 13, 2691. [Google Scholar] [CrossRef]
- Pazos, R.S.; Bauer, D.E.; Gómez, N. Microplastics integrating the coastal planktonic community in the inner zone of the Río de la Plata estuary (South America). Environ. Pollut. 2018, 243, 134–142. [Google Scholar] [CrossRef] [PubMed]
- Petroody, S.S.A.; Hashemi, S.H. Wastewater treatment plants as a pathway for the release of microplastics into the environment: Investigation of sludge and treated effluent of Sari wastewater treatment plant. Amirkabir J. Civ. Eng. 2021, 53, 3751–3762. [Google Scholar] [CrossRef]
- Bakir, A.; Doran, D.; Silburn, B.; Russell, J.; Archer-Rand, S.; Barry, J.; Nicolaus, E.M. A spatial and temporal assessment of microplastics in seafloor sediments: A case study for the UK. Front. Mar. Sci. 2023, 9, 1093815. [Google Scholar] [CrossRef]
- Ghanbari, N.; Fataei, E.; Naji, A.; Imani, A.A.; Nasehi, F. Microplastic pollution in sediments in the urban section of the Qara Su River, Iran. Appl. Water Sci. 2022, 12, 192. [Google Scholar] [CrossRef]
- Almasi, A.; Mahmoudi, M.; Mohammadi, M.; Dargahi, A.; Biglari, H. Optimizing biological treatment of petroleum industry wastewater in a facultative stabilization pond for simultaneous removal of carbon and phenol. Toxin Rev. 2021, 40, 189–197. [Google Scholar] [CrossRef]
- Kuptsov, K.; Zhizhin, G. Fourier-Raman and Fourier-IR Spectra of Polymers; Fizmatlit: Moscow, Russia, 2011; p. 657. Available online: https://www.researchgate.net/publication/262416516_Kupcov_AH_Zizin_GN_Fure-KR_i_Fure-IK_spektry_polimerov_m_Fizmatlit_2001_657_s/references (accessed on 4 April 2024).
- Li, Y.; Chen, G.; Xu, K.; Huang, K.; Wang, J. Microplastics Environmental Effect and Risk Assessment on the Aquaculture Systems from South China. Int. J. Environ. Res. Public Health 2021, 18, 1869. [Google Scholar] [CrossRef]
- Golwala, H.; Zhang, X.; Iskander, S.M.; Smith, A.L. Solid waste: An overlooked source of microplastics to the environment. Sci. Total Environ. 2021, 769, 144581. [Google Scholar] [CrossRef] [PubMed]
- Chappell, B.; Pramanik, A.; Basak, A.; Sarker, P.; Prakash, C.; Debnath, S.; Shankar, S. Processing household plastics for recycling—A review. Clean. Mater. 2022, 6, 100158. [Google Scholar] [CrossRef]
- Ajaj, R.; Abu Jadayil, W.; Anver, H.; Aqil, E. A Revision for the Different Reuses of Polyethylene Terephthalate (PET) Water Bottles. Sustainability 2022, 14, 4583. [Google Scholar] [CrossRef]
- Carr, S.A.; Liu, J.; Tesoro, A.G. Transport and fate of microplastic particles in wastewater treatment plants. Water Res. 2016, 91, 174–182. [Google Scholar] [CrossRef]
- Ory, N.C.; Lehmann, A.; Javidpour, J.; Stöhr, R.; Walls, G.L.; Clemmesen, C. Factors Influencing the Spatial and Temporal Distribution of Microplastics at the Sea Surface—A Year-Long Monitoring Case Study from the Urban Kiel Fjord, Southwest Baltic Sea. Sci. Total Environ. 2020, 736, 139493. [Google Scholar] [CrossRef]


| Sampling Point | GPS Coordinates | Description |
|---|---|---|
| 1 | 53.286948, 69.354102 | Public groundwater wells |
| 2 | 53.297121, 69.336914 | Urker Palace Restaurant |
| 3 | 53.313779, 69.322168 | Mouth of the Shagalaly River (Krasny Yar village) |
| 4 | 53.327312, 69.328756 | Railway tracks (Krasnoye village) |
| 5 | 53.319875, 69.364748 | Kokshetau meteorological station “Kazhidromet” for Akmola region |
| 6 | 53.300309, 69.379781 | City beach |
| 7 | 53.312930, 69.351676 | Center of the lake |
| 8 | 53.305157, 69.357763 | Center of the lake |
| Sampling Point | GPS Coordinates | Description |
|---|---|---|
| 1 | 52.914085, 69.141020 | M. Gabdulin Secondary School |
| 2 | 52.906375, 69.126523 | Rural hospital |
| 3 | 52.922582, 69.083956 | Zeren Noor Recreation Centre |
| 4 | 52.940660, 69.113021 | Fishery enterprise |
| 5 | 52.940180, 69.125558 | Vostochnaya recreation center |
| 6 | 52.935238, 69.136085 | Public recreation site, Balkadisha Monument |
| 7 | 52.928451, 69.121305 | Center of the lake |
| 8 | 52.920951, 69.127372 | Center of the lake |
| Sampling Point | GPS Coordinates | Description |
|---|---|---|
| 1 | 53.089900, 70.254179 | Boat station |
| 2 | 53.087245, 70.268173 | Hotel Baitas |
| 3 | 53.084186, 70.299261 | S. Seifullin Secondary School |
| 4 | 53.076950, 70.302128 | Ring Road |
| 5 | 53.067756, 70.301272 | Mouth of Sarybulak Creek |
| 6 | 53.061712, 70.296819 | Aynakol Entertainment Complex |
| 7 | 53.078176, 70.278866 | Center of the lake |
| 8 | 53.071580, 70.280757 | Center of the lake |
| Sampling Point | GPS Coordinates | Description |
|---|---|---|
| 1 | 51.159911, 71.398368 | GasMashApparat plant area |
| 2 | 51.156111, 71.407128 | Overflow dam |
| 3 | 51.160420, 71.422823 | City embankment, area of Kenesary monument location |
| 4 | 51.149496, 71.437259 | Mouth of Akbulak River |
| 5 | 51.132982, 71.447133 | Triotlon Park |
| 6 | 51.124678, 71.453330 | City embankment, the area of the residence of the President of the Republic of Kazakhstan Akorda |
| 7 | 51.152855, 71.427425 | Riverbank |
| 8 | 51.159903, 71.417597 | Riverbank |
| Sample Number | GPS Coordinates | Location |
|---|---|---|
| 1 | 53.300309, 69.379781 | DO |
| 2 | UW | |
| 3 | ZZ | |
| 4 | 53.297121, 69.336914 | DO |
| 5 | UW | |
| 6 | ZZ |
| Sample Number | GPS Coordinates | Location |
|---|---|---|
| 7 | 52.940180, 69.125558 | DO |
| 8 | UW | |
| 9 | ZZ | |
| 10 | 52.935238, 69.136085 | DO |
| 11 | UW | |
| 12 | ZZ | |
| 13 | 52.914085, 69.141020 | DO |
| 14 | UW | |
| 15 | ZZ |
| Sample Number | GPS Coordinates | Location |
|---|---|---|
| 16 | 53.076950, 70.302128 | DO |
| 17 | UW | |
| 18 | ZZ | |
| 19 | 53.067756, 70.301272 | DO |
| 20 | UW | |
| 21 | ZZ | |
| 22 | 53.061712, 70.296819 | DO |
| 23 | UW | |
| 24 | ZZ |
| Sample Number | GPS Coordinates | Location |
|---|---|---|
| 25 | 51.156111, 71.407128 | DO |
| 26 | UW | |
| 27 | ZZ | |
| 28 | 51.101215, 71.514357 | DO |
| 29 | UW | |
| 30 | ZZ |
| Sample No. | Place of Selection | GPS Coordinates |
|---|---|---|
| 1 | Kopa Lake | 53.300309, 69.379781 |
| 2 | Kopa Lake | 53.297121, 69.336914 |
| 3 | Zerendinskoye Lake | 52.940180, 69.125558 |
| 4 | Zerendinskoye Lake | 52.929259,69.142834 |
| 5 | Zerendniskoye Lake | 52.914085, 69.141020 |
| 6 | Borovoe Lake | 53.076950, 70.302128 |
| 7 | Borovoe Lake | 53.067756, 70.301272 |
| 8 | Borovoe Lake | 53.061712, 70.296819 |
| 9 | Yesil River | 51.101215, 71.514357 |
| Indicator | Method of Measurement | Detection Limit | Standards and References |
|---|---|---|---|
| Color degree | Photometric | ±1 degree | Interstate standard 31868-2012. Water. Methods for determining color [60] |
| Turbidity | Photometric | ±0.01 mg/dm3 | Interstate standard 3351-74. Drinking water. Method for determination of odor, taste, color, and turbidity [61] |
| pH | Potentiometric | ±0.01 unit | RK ISO standard 4316-2019. Surfactants. Determination of pH of aqueous solutions. Potentiometric method [62] |
| Oxidizability (COD) | Titrimetric | ±0.1 mg/dm3 | State mandatory standard 26449.1-85. Stationary distillation and desalination plants. Methods for chemical analysis of salt waters [63] |
| Ammonium ions | Photometric | ±0.01 mg/dm3 | Interstate standard 33045-2014. Water. Methods for determining nitrogen-containing substances [64] |
| Hardness (concentration of calcium and magnesium ions) | Titrimetric | ±0.01 mg/dm3 | Interstate standard 31954-20120. Drinking water. Methods of hardness determination [65] |
| Mineralization (dry residue) | Gravimetric | ±1 mg/dm3 | State mandatory standard 18164-72. Drinking water. Method for determination of total solids content [66] |
| Sulfates | Titrimetric | ±0.1 mg/dm3 | Interstate standard 4389-72. Methods for determination of sulfate content [67] |
| Total iron | Photometric | ±0.01 mg/dm3 | Interstate standard 4011-72. Drinking water. Methods for determination of total iron [68] |
| Carbonates | Titrimetric | ±1 mg/dm3 | State mandatory standard 26449.1-85. Stationary distillation and desalination plants. Methods for chemical analysis of salt waters [63] |
| Sediment Type | Kopa Lake | Zerendinskoye Lake | Borovoe Lake | Yesil River |
|---|---|---|---|---|
| Open water bottom sediments | 113.48 | 76.51 | 68.62 | 88.11 |
| 48.32 | 66.16 | 77.15 | 76.10 | |
| 134.45 | 47.41 | |||
| Sediments of the water’s edge zone | 118.92 | 129.23 | 93.95 | 103.59 |
| 74.39 | 99.50 | 76.09 | 150.38 | |
| 95.08 | 83.60 | |||
| Splash zone deposits | 212.52 | 152.28 | 84.98 | 121.10 |
| 147.45 | 105.19 | 85.33 | 120.53 | |
| 147.30 | 99.09 | |||
| Beach sediments | 184.09 | 192.46 | 169.36 | 179.73 |
| 179.96 | 161.97 | 189.00 | ||
| 204.42 | 183.98 |
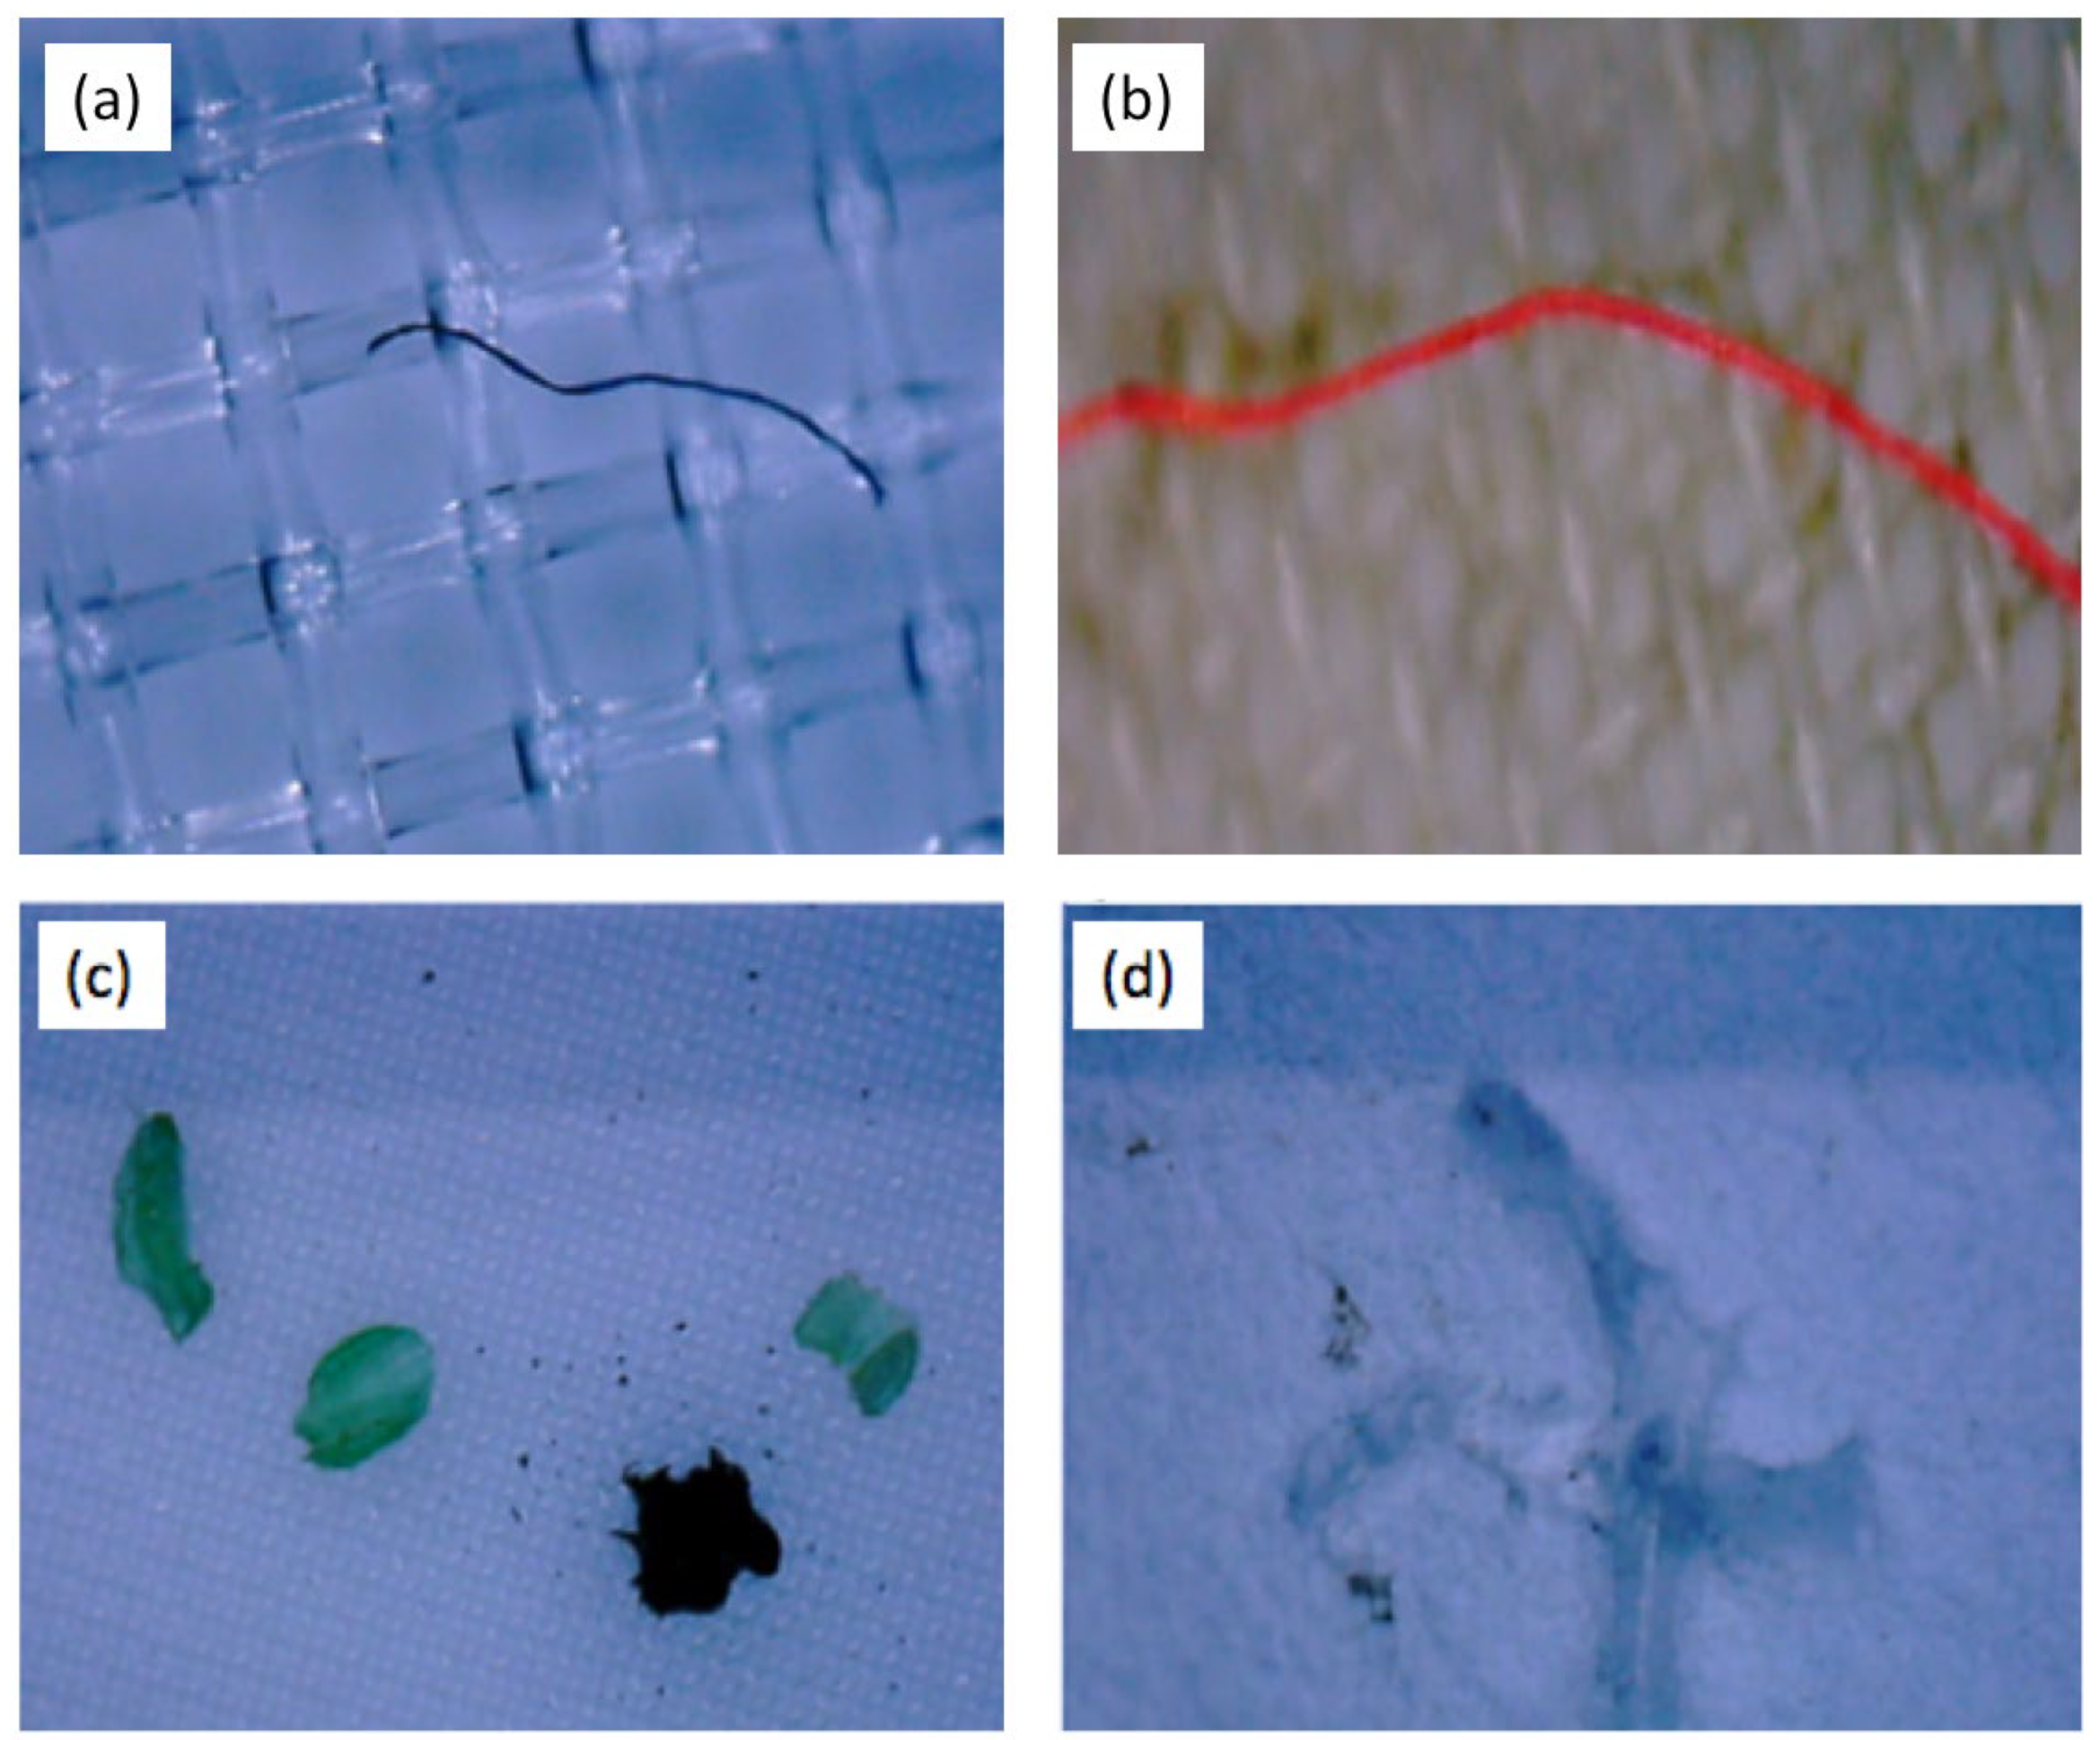
| Water Body | Fibers | Fragments | Films | Concentration (Particles/dm3) | Average MP Concentration (Particles/dm3) | Mean MP Concentration (Particles/dm3) at Surface/Depth 1.5 m |
|---|---|---|---|---|---|---|
| Kopa Lake | 120 | 15 | 1.0 × 10⁻²–6.2 × 10⁻¹ | 1.4 × 10⁻¹ | 5.5 × 10⁻²/2.3 × 10−1 | |
| Zerendinskoye Lake | 151 | 6 | 2.0 × 10⁻²–4.4 × 10⁻¹ | 1.5 × 10⁻¹ | 9.9 × 10⁻²/2.0 × 10−1 | |
| Borovoe Lake | 111 | 20 | 2 | 1.0 × 10⁻²–4.8 × 10⁻¹ | 1.3 × 10⁻¹ | 5.3 × 10⁻²/2.3 × 10−1 |
| Yesil River | 40 | 30 | 0–4.0 × 10⁻¹ | 7.7 × 10⁻² | 2.5 × 10⁻²/1.4 × 10−1 | |
| Total in spring period | 422 | 71 | 2 | 0–6.2 × 10⁻¹ | 1.2 × 10⁻¹ | 5.8 × 10⁻²/2.0 × 10−1 |
| Water Body | Fibers | Fragments | Films | Concentration (Particles/dm3) | Average MP Concentration (Particles/dm3) | Mean MP Concentration (Particles/dm3) at Surface/Depth 1.5 m |
|---|---|---|---|---|---|---|
| Kopa Lake | 239 | 1 | 11 | 6.0 × 10⁻²–4.6 × 10⁻¹ | 2.4 × 10⁻¹ | 1.5 × 10⁻¹/3.4 × 10−1 |
| Zerendinskoye Lake | 440 | 35 | 1.6 × 10⁻¹–1.8 | 4.5 × 10⁻¹ | 2.3 × 10⁻¹/6.6 × 10−1 | |
| Borovoe Lake | 145 | 8 | 6.0 × 10⁻²–2.4 × 10⁻¹ | 2.7 × 10⁻¹ | 1.0 × 10⁻¹ /1.7 × 10−1 | |
| Yesil River | 170 | 6.0 × 10⁻²–2.4 × 10⁻¹ | 1.5 × 10⁻¹ | 1.3 × 10⁻¹/1.8 × 10−1 | ||
| Total in summer period | 994 | 1 | 54 | 6.0 × 10⁻²–1.8 | 4.5 × 10⁻¹ | 1.5 × 10⁻¹/3.4 × 10−1 |
| Water Body | Fibers | Fragments | Films | Concentration (Particles/dm3) | Average MP Concentration (Particles/dm3) | Mean MP Concentration (Particles/dm3) at Surface/Depth 1.5 m |
|---|---|---|---|---|---|---|
| Kopa Lake | 190 | 3 | 2.0 × 10⁻²–1.22 | 1.9 × 10⁻¹ | 5.6 × 10⁻²/3.3 × 10−1 | |
| Zerendinskoye Lake | 111 | 0 | 3.0 × 10⁻²–3.2 × 10⁻¹ | 1.1 × 10⁻¹ | 5.6 × 10⁻²/1.6 × 10−1 | |
| Borovoe Lake | 182 | 1 | 5.0 × 10⁻³–4.8 × 10⁻¹ | 1.7 × 10⁻¹ | 6.7 × 10⁻²/2.8 × 10−1 | |
| Yesil River | 113 | 1 | 1.0 × 10⁻³–2.0 × 10⁻¹ | 1.1 × 10⁻¹ | 4.8 × 10⁻²/1.7 × 10−1 | |
| Total in autumn period | 596 | 5 | 1.0 × 10⁻²–1.22 | 1.5 × 10⁻¹ | 5.7 × 10⁻²/2.4 × 10−1 |
| Sampling Area | Kopa Lake | Zerendinskoye Lake | Borovoe Lake | Yesil River |
|---|---|---|---|---|
| Open water bottom | 80.90 | 92.37 | 64.39 | 82.11 |
| Water’s edge zone | 96.66 | 107.94 | 84.55 | 126.99 |
| Splash zone | 179.99 | 134.92 | 89.80 | 120.82 |
| Beach | 182.03 | 186.28 | 180.78 | 179.73 |
Disclaimer/Publisher’s Note: The statements, opinions and data contained in all publications are solely those of the individual author(s) and contributor(s) and not of MDPI and/or the editor(s). MDPI and/or the editor(s) disclaim responsibility for any injury to people or property resulting from any ideas, methods, instructions or products referred to in the content. |
© 2024 by the authors. Licensee MDPI, Basel, Switzerland. This article is an open access article distributed under the terms and conditions of the Creative Commons Attribution (CC BY) license (https://creativecommons.org/licenses/by/4.0/).
Share and Cite
Salikova, N.S.; Rodrigo-Ilarri, J.; Makeyeva, L.A.; Rodrigo-Clavero, M.-E.; Tleuova, Z.O.; Makhmutova, A.D. Monitoring of Microplastics in Water and Sediment Samples of Lakes and Rivers of the Akmola Region (Kazakhstan). Water 2024, 16, 1051. https://doi.org/10.3390/w16071051
Salikova NS, Rodrigo-Ilarri J, Makeyeva LA, Rodrigo-Clavero M-E, Tleuova ZO, Makhmutova AD. Monitoring of Microplastics in Water and Sediment Samples of Lakes and Rivers of the Akmola Region (Kazakhstan). Water. 2024; 16(7):1051. https://doi.org/10.3390/w16071051
Chicago/Turabian StyleSalikova, Natalya S., Javier Rodrigo-Ilarri, Lyudmila A. Makeyeva, María-Elena Rodrigo-Clavero, Zhulduz O. Tleuova, and Anar D. Makhmutova. 2024. "Monitoring of Microplastics in Water and Sediment Samples of Lakes and Rivers of the Akmola Region (Kazakhstan)" Water 16, no. 7: 1051. https://doi.org/10.3390/w16071051
APA StyleSalikova, N. S., Rodrigo-Ilarri, J., Makeyeva, L. A., Rodrigo-Clavero, M.-E., Tleuova, Z. O., & Makhmutova, A. D. (2024). Monitoring of Microplastics in Water and Sediment Samples of Lakes and Rivers of the Akmola Region (Kazakhstan). Water, 16(7), 1051. https://doi.org/10.3390/w16071051