Abstract
This study employed an advanced geospatial methodology using the Google Earth Engine (GEE) platform to assess soil erosion in the Satluj Watershed thoroughly. To achieve this, the Revised Universal Soil Loss Equation (RUSLE) model was integrated into the study, which was revealed through several analytical tiers, each with a unique function. The study commenced with estimating the R factor, which was carried out using annual precipitation data from the Climate Hazards Group Infra-Red Precipitation with Station (CHIRPS). The erodibility of the soil, which the K factor describes, was then calculated using the USDA soil texture classifications taken from the Open Land Map. The third layer emphasizes the LS factor, which analyzes slope data and how they affect soil erosion rates, using digital elevation models. To understand the impact of vegetation on soil conservation, the fourth layer presents the C factor, which evaluates changes in land cover, and the Normalized Difference Vegetation Index (NDVI) derived from Sentinel-2 data. The P factor incorporates MODIS data to assess the types of land cover and slope conditions. Combining these layers with the RUSLE model produces a thorough soil loss map, revealing different levels of soil erosion throughout the Satluj Watershed. The preliminary findings indicate that 3.3% of the watershed had slight soil loss, 0.2% had moderate loss, and 1.2% had high soil erosion rates. And 92% had severe rates of soil erosion. After a thorough investigation, the detected regions were divided into risk classifications, providing vital information for the watershed’s land management and conservation plans. The mean soil loss throughout the watershed was determined to be 10,740 tons/ha/year. This novel method creates a strong foundation for evaluating soil erosion, while also highlighting the value of the cloud-based geospatial analysis and the RUSLE model in comprehending intricate environmental processes.
1. Introduction
Soils are an essential component of earth system functions that facilitate the supply of essential ecosystem services [1]. Soil erosion, a complex and dynamic environmental process, poses a profound threat to the sustainability of agricultural landscapes and the health of watershed ecosystems. An accurate and comprehensive assessment of soil erosion is pivotal for implementing effective land management practices [2]. Soil erosion is a significant issue that occurs as a result of increased agricultural activity, the deterioration of land, and other human activities. Evaluating soil erosion is valuable for the purpose of strategizing and implementing conservation efforts within a watershed or basin [3]. The adverse impacts of this activity include land degradation, declining water quality, river sedimentation, and road destruction [4]. Soil erosion and surface runoff contribute to sediment transport into streams, resulting in offsite issues such as an increased risk of floods, reduced river capacity, compromised watershed resilience, and elevated maintenance costs [5]. The Satluj Watershed in India is experiencing a problem of reduced storage capacity due to increasing sediment deposition [6]. These water bodies are essential for irrigation, water supply, power generation, flood control, and supporting surrounding communities’ livelihoods and ecological functions [7]. Human activities in semi-arid areas have altered natural river basins, making sustainable water and land management practices essential [8]. Preventing soil erosion requires efficient conservation techniques and a thorough understanding of erosion [9]. Soil erosion models are valuable instruments that decision makers and stakeholders can utilize to address soil erosion issues and implement soil protection measures [10]. Dargiri and Samsampour’s (2023) study addressed the impact of modern agriculture on soil erosion, comparing qualitative, statistical, and modeling methods for risk assessment, enhanced by GIS technology. It emphasizes the advantages of soil erosion modeling over traditional methods, highlighting its efficiency and flexibility. The focus then shifts towards evaluating wind erosion models to predict and manage affected areas efficiently [11]. Hsieh et al. (2009) introduced a mesh-bag (MB) method, which is a sensitive approach to quantify soil erosion and nutrient movement directly in the field. This technique involves placing mesh bags on the soil surface to capture eroded soil, while allowing for water to pass through. Its effectiveness, validated against the runoff plot method, shows a strong correlation in measuring soil erosion on slopes. The method is particularly accurate on plots with less steep slopes or larger areas. The MB method, unaffected by mesh bag size, offers valuable insights into the patterns of soil erosion and nutrient distribution, promising the improved management of agricultural and natural landscapes [12]. Raza et al. (2021) evaluated 51 models for their effectiveness in dynamic soil erosion assessments, focusing on applications within complex agricultural systems such as patch and strip cropping, and agroforestry. It emphasizes the limitations of current models in capturing multidimensional soil erosion processes and suggests the integration of soil erosion modules within modular platforms like SIMPLACE, coupled with GIS capabilities, for enhanced 2D/3D flux and sedimentation simulations. The review calls for advancements in models to accurately represent horizontal matter transfers, vital for precise sedimentation process predictions [13]. DAS et al. (2020) integrated RUSLE and AHP with geospatial technology to model soil erosion in West Kameng, India, revealing average erosion rates of 124.21 t/ha/yr. Their results showed that 57.71% of the area is moderately to highly vulnerable, highlighting the urgent need for control measures [14].
Avand et al. (2023) combined empirical and AI models, notably the RUSLE and machine learning algorithms like Random Forest, to predict soil erosion in Iran’s Talar Watershed. They analyzed thirteen factors, such as slope and rainfall, finding Random Forest to be the most accurate in identifying erosion risks. This method enhances the identification of erosion hotspots in data-scarce areas [15].
The RUSLE model, renowned for its effectiveness in estimating soil erosion risk, considers a suite of influential factors, including rainfall, soil characteristics, topography, land use, and cover management practices [16]. Integrating such factors on a regional scale requires substantial computational power and data-handling capabilities, challenges effectively addressed by cloud-based platforms like GEE. The methodology is designed to be both comprehensive and scalable, enabling researchers to conduct efficient and reproducible soil erosion assessments.
Moreover, this research introduces a unique dimension to soil erosion analysis by estimating total soil loss and classifying erosion severity across the Satluj Watershed. An erosion-severity classification scheme enhances the spatial understanding of soil erosion dynamics, allowing for more targeted and context-specific land management strategies [17]. To improve the accessibility and applicability of the research, the article provides code snippets for exporting RUSLE factors, soil loss maps, and erosion severity classifications from GEE to external platforms. This transparency facilitates a deeper understanding of the research methodology and encourages collaboration and the adoption of similar approaches in diverse geographical regions.
Several models have been developed to assess soil loss but have limitations [18]. The Universal Soil Loss Equation (USLE) is an empirical model often used but has difficulty predicting large-scale or event-based soil erosion [19]. To address this, the RUSLE was developed and has become essential for predicting soil erosion on a broader scale [19]. In water resource management, it is crucial to prioritize the computation of soil erosion and sediment deposition in reservoirs and hydropower systems. To do this, a geospatial approach using GEE was adopted to compute the loss of storage capacity and sedimentation in the Yeldari reservoir. Thematic layers derived from refined and integrated data collected from various sources are overlaid in a GIS environment. Integrating remote sensing, GIS, and RUSLE models provides a comprehensive analysis to assess the impact on storage capacity and sedimentation in the reservoir. The GEE platform offers a practical toolkit for extensive environmental analyses, aligning this strategy with the growing importance of the cloud-based geospatial analysis.
The study adeptly integrates the RUSLE model with the GEE platform to assess soil erosion in the Satluj Watershed, showcasing the innovative use of cloud-based geospatial analysis. However, the research gap lies in the comparative analysis with other emerging technologies and methodologies for soil erosion assessment. While it advances the application of RUSLE within a cloud-based framework, how this integration compares to or could be enhanced by incorporating other advanced technologies, such as machine learning algorithms or artificial intelligence (AI) for improved prediction accuracy, remains underexplored. Additionally, the study highlights a significant area for future research in evaluating the effectiveness of proposed land management strategies informed by this model, assessing their real-world applicability and sustainability over time. This gap underscores the potential for developing more nuanced, technology-driven approaches to soil erosion assessment and management, fostering a deeper understanding of their practical implications and effectiveness in diverse geographical and environmental contexts.
This study involved an innovative and detailed exploration of soil erosion by integrating the RUSLE model with the advanced capabilities of cloud-based geospatial analysis, explicitly leveraging the GEE platform. Focusing on the Satluj Watershed, this study introduces a robust methodology that harnesses the extensive datasets and computational resources provided by GEE for large-scale environmental analyses. This study aimed to provide valuable insights into soil erosion patterns, quantify sedimentation rates, and classify erosion severity in the Satluj Watershed. Utilizing cloud-based geospatial analysis, the research contributes to sustainable water and land management practices tailored to the Satluj Watershed’s unique characteristics.
2. Materials and Methods
2.1. Study Area
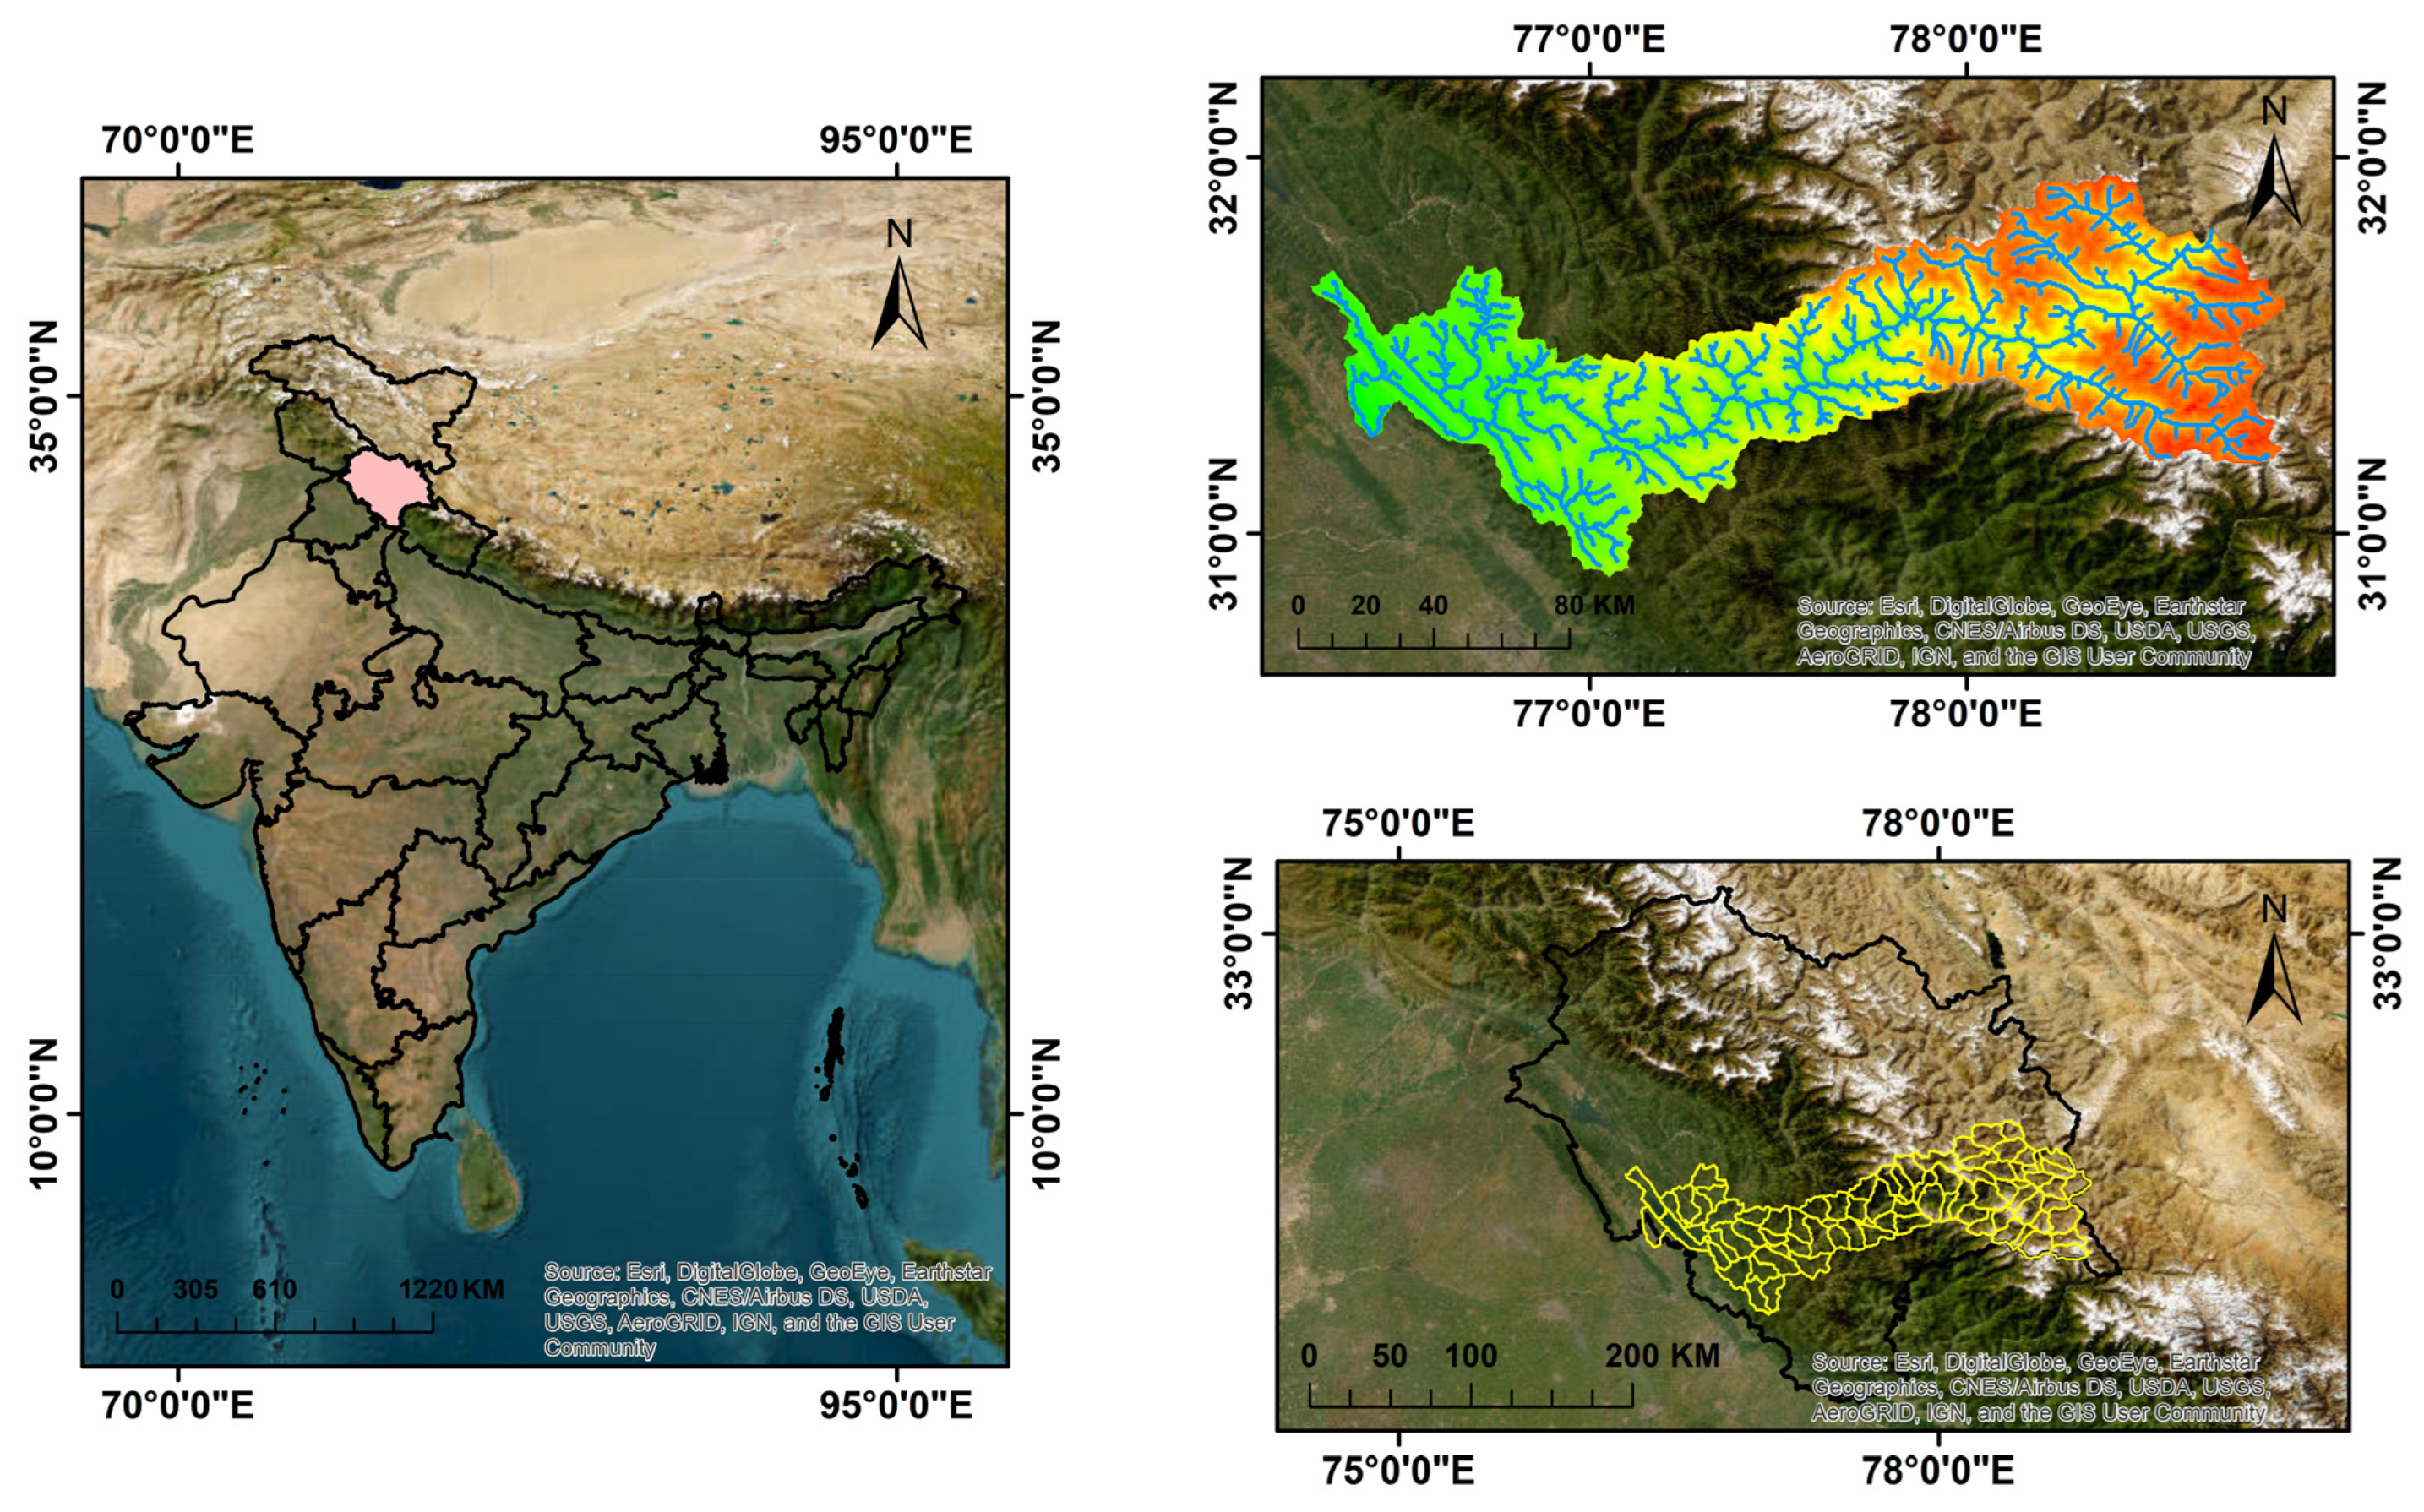
The Satluj Watershed, shaped by the Satluj River, is an essential geographical feature in Northern India. It is a crucial component of the more extensive Indus River system and spans multiple states, including Punjab and Himachal Pradesh. The region is known for its varied topography: high plateaus, vast plains, and mountainous areas. The Himalayan Mountain range dominates the higher portions of the Satluj Watershed, causing notable height variations in the region [20]. This geographical diversity results in a wide range of climatic conditions, from subtropical climates in the lower plains to alpine temperatures in the higher elevations. The complex network of tributaries and sub-basins within the watershed influences the hydrological dynamics and contributes to the overall ecological richness of the area. The Satluj Watershed is significant because it is an important agricultural region with significant hydrological significance [21]. The rich plains around the Satluj River support much agriculture, significantly boosting the economy. However, environmental factors such as precipitation patterns, soil properties, and land-use practices can lead to problems such as soil erosion, which can negatively impact ecosystem health and agricultural output. Growing human activity, such as urbanization, deforestation, and agricultural expansion, may significantly impact the hydrology and biological balance of the Satluj Watershed. Therefore, comprehensive research utilizing a cloud-based geospatial analysis and the RUSLE model becomes essential. Sustainable land-use practices must be implemented to manage the Satluj Watershed effectively and preserve this crucial natural resource. Understanding soil erosion dynamics is critical for achieving this goal. The study area’s geographic map is shown in Figure 1, providing an idea of the study’s comprehensive coverage in Himachal Pradesh in Northern India.
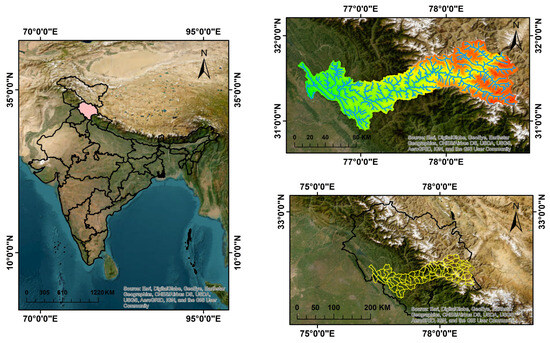
Figure 1.
Location map of the study area.
2.2. Materials and Methods
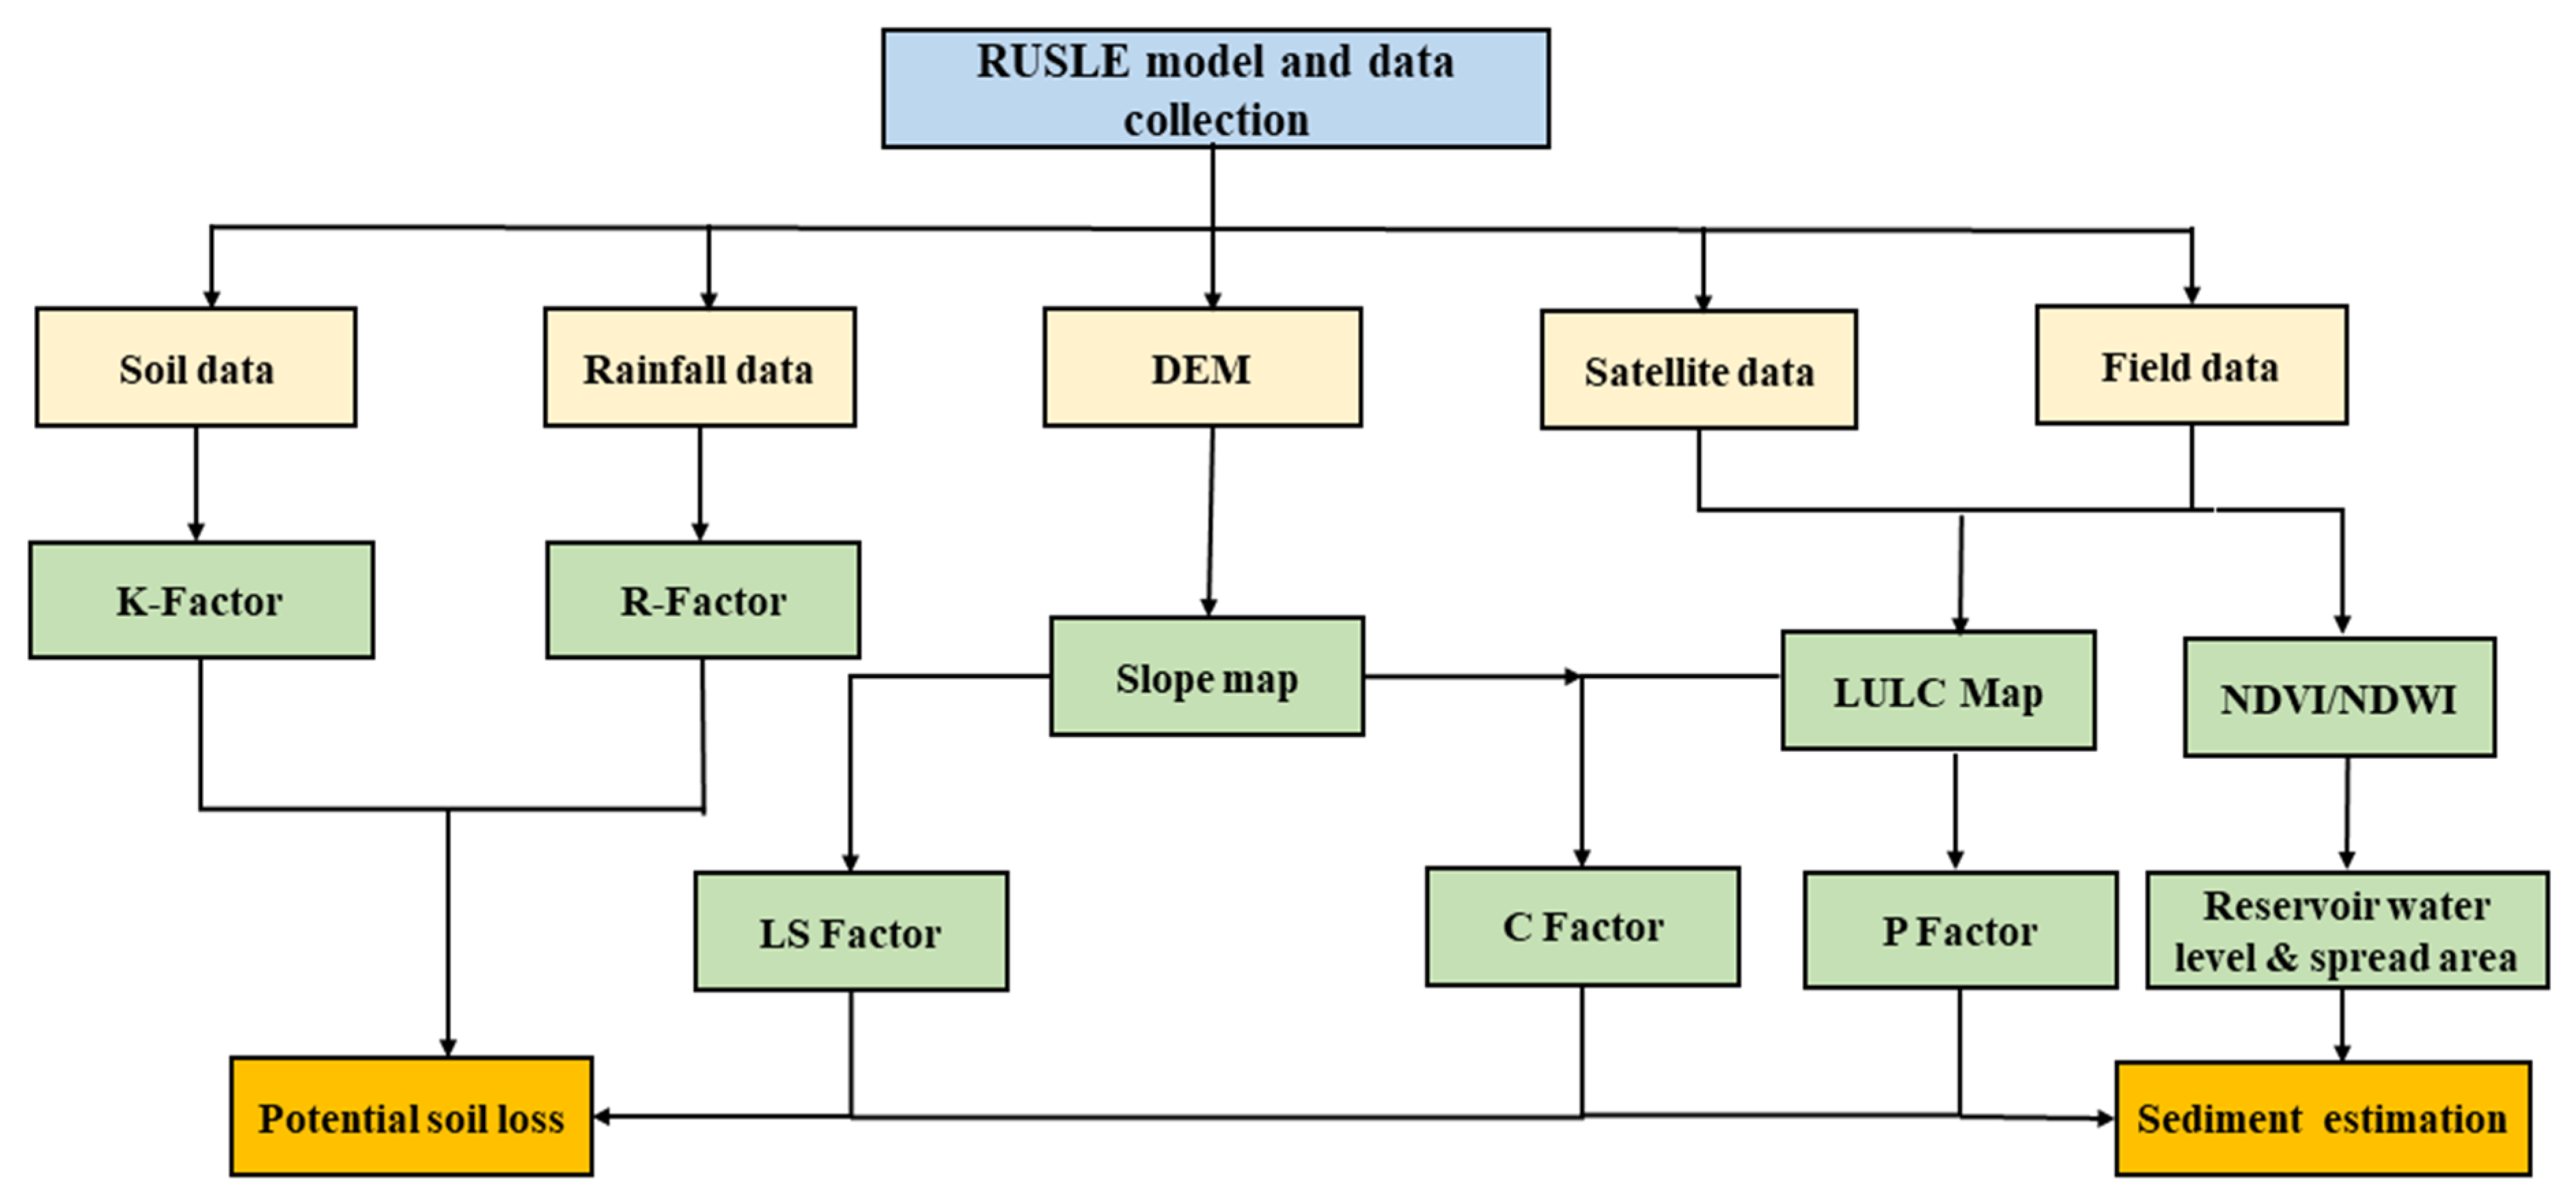
The study employed a Google Earth Engine (GEE)-based approach to estimate Average Annual Soil Loss (A) using the RUSLE. Various factors, including rainfall–runoff erosivity (R), soil erodibility (K), slope length (L), slope steepness (S), cropping management (C), and supporting conservation practices (P), were integrated using thematic layers derived from satellite imagery and environmental datasets. Rainfall erosivity (R) was determined based on long-term precipitation data. Soil erodibility (K) was estimated through GEE, considering specific soil types for the Satluj Watershed. The LS factor, cropping Management (C), and supporting conservation practices (P) were computed using GEE and satellite data. The study also incorporated the Normalized Difference Vegetation Index (NDVI) into the cover and management (C) factor calculation, accounting for seasonal variations in vegetation cover. The slope of the terrain was considered a key factor. The GEE-based methodology provided a spatially explicit understanding of soil erosion potential across the Satluj Watershed, emphasizing scalability, efficiency, and accuracy in handling large-scale geospatial data for soil erosion modeling. The results contribute insights for sustainable land management practices in the region, considering diverse factors influencing soil erosion susceptibility—methodology. The flowchart is shown in Figure 2.
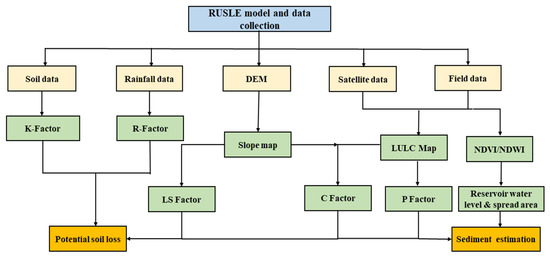
Figure 2.
Flowchart showing methodology used for the study.
2.2.1. RUSLE Thematic Maps Computation
To estimate the average annual soil loss per unit area (A) in the context of our Google Earth Engine (GEE)-based study, we utilize the RUSLE, represented by the primary Equation (1):
A: Average annual soil loss per unit area (ton ha−1 yr−1).
R: Rainfall–runoff erosivity factor (MJ mm ha−1 h−1 yr−1).
K: Soil erodibility factor (ton ha hr MJ−1 ha−1 mm−1).
L: Slope length factor (dimensionless).
S: Slope gradient factor (dimensionless).
C: Cropping management factor (dimensionless, ranging between 0 and 0.5).
P: Supporting conservation practice factor (dimensionless, ranging between 0 and 1).
This GEE-based methodology integrates geospatial layers derived from satellite imagery and environmental datasets. The factors R, K, L, S, C, and P are each represented by corresponding thematic layers and processed and analyzed using the Google Earth Engine platform. The outcome provides a spatially explicit understanding of soil erosion potential across the study area, contributing valuable insights for sustainable land management practices.
2.2.2. Rainfall Erosivity (R) Factor
In our GEE-based study, the rainfall erosivity (R) factor plays a crucial role in influencing the soil erosion potential. Rainfall intensity is a key determinant of soil erosion [22]. Sheet and rill erosion, often induced by high runoff flow, is intensified by increased rainfall rates and larger drop sizes, accelerating soil particle dissolution [23]. Monthly rainfall data spanning 20 years (2001–2021) were employed to quantify R. The adopted equation is widely used by researchers globally [24].
where R represents the rainfall erosivity factor (MJ mm ha−1 h−1/y), and P is the annual rainfall (mm). The spatial distribution of the rainfall erosivity factor was derived using the Kriging interpolation method within the GEE environment. We utilized diverse data sources, including satellite-based precipitation data, and employed the Google Earth Engine platform for spatial analysis and interpolation. The dataset incorporated information from 17 rain gauge stations within and around the study area, enabling a comprehensive representation of the regional rainfall erosivity pattern.
2.2.3. Soil Erodibility (K) Factor
The “soil erosion factor” (K) plays a crucial role in evaluating the inherent vulnerability of soil to erosion caused by rainwater and runoff [25]. This factor relies on various soil characteristics encompassing mineralogical, physical, chemical, and morphological features. K quantifies soil loss per unit of erosive energy from rainfall, with the reference condition being a standardized plot of clean bare soil with a 9% slope and a length of 22 m. In this study of the Satluj Watershed, we employed Cloud-Based Geospatial Analysis using the Google Earth Engine (GEE) platform to estimate the K factor. We utilized soil types and texture maps specific to the Satluj Watershed. The assignment of K-factor values was informed by soil-type data and insights from relevant studies, including [25]. Within the Satluj Watershed, we identified four distinct soil classes, each associated with specific K-factor values. These numerical values range from 0 to 1, with higher values indicating a greater susceptibility to soil erosion. Leveraging the capabilities of Google Earth Engine enables us to conduct geospatial analyses efficiently, providing a robust and scalable approach to estimate the K factor tailored to the Satluj Watershed. This approach considers local variations and characteristics, accurately representing soil erosion factors within our specific study area.
2.2.4. Topographic (LS) Factor
The LS factor, a crucial component in assessing soil erosion rates, integrates slope length (L) and slope steepness (S) into a unified index [26]. While the L factor accounts for the impact of slope length on erosion by considering the distance from the runoff initiation point to the deposition area, the S factor reflects the influence of steepness on soil erosion, standardized at a length of 22.1 m and a steepness of 9%. To compute the LS factor, ASTER (GDEM) satellite data with a spatial resolution of 30 m are utilized to generate a digital elevation model (DEM). The calculation of the LS factor involves filling sinks in the DEM and applying Equation (3):
where LS represents the combined slope steepness factor and slope length, the grid or DEM resolution is denoted as Cell Size, and the slope angle is referred to as sinSlope [27]. Flow accumulation, integral to the LS factor computation, quantifies the total upstream area draining into each DEM grid cell, indicating the potential for water flow and erosion within specific regions. Higher flow accumulation values correspond to increased runoff potential and greater susceptibility to erosion, providing essential insights for prioritizing erosion control measures within the watershed or similar regions.
LS = (Flow accumulation × Cell Size/0.0896)0.4 × (sinSlope/0.0896)1.3
2.2.5. Land Cover (C) Factor
The land cover (C) factor is contingent on land use and is notably susceptible to human influence to mitigate erosion [28]. Calculating the land cover factor across a large-scale watershed can be challenging due to spatial variation and complexities in land cover patterns. Satellite-based data, specifically 10m resolution land use and land cover (LULC) data from Google Earth Engine (GEE), were employed to address this. The LULC classification for the study area was executed using a supervised image classification approach based on the maximum likelihood algorithm within the GEE platform. This method necessitates ground truth verification for each LULC class. The entire study area was classified into five major LULC classes: agricultural land, barren land, built-up area, vegetation, and water bodies. The overall accuracy assessment achieved an accuracy of approximately 87.39%. Each LULC class was assigned C values ranging from 0 to 1, where a lower C suggests minimal soil loss and a value approaching 1 indicates higher susceptibility to soil loss. This approach leverages the geospatial analysis capabilities of Google Earth Engine, offering a more efficient and scalable method for land cover classification and factor assignment in the Satluj Watershed.
2.2.6. Conservation Practice (P) Factor
The conservation practice (P) factor shows both the effectiveness of management practices in reducing soil erosion through elements like vegetation, biomass on the soil, and runoff control, as well as the rate of soil loss, as determined by conservation practices. The RUSLE incorporates the P factor, representing the combined influence of land cover, support practices, land use, slope length, and custom adjustments on soil erosion. We use GEE’s capabilities for scalable and remote sensing-driven analyses to adapt this methodology to a Google Earth Engine (GEE)-based approach. In GEE, we calculate the P factor by defining a function that extracts relevant bands or properties for cover (C), support practices (M), land use (L), slope length (S), and custom adjustments. Applying the RUSLE formula pixel-wise, we combine image collections for each factor and generate a P-factor image. This image is then visualized on the map using GEE. The scalability and remote sensing capabilities of GEE enhance the efficiency of processing large-scale geospatial data, allowing for a comprehensive assessment of soil erosion susceptibility. Ensuring that the GEE environment includes the necessary image collections and bands for accurate P-factor calculations is crucial. The ultimate goal is to leverage this GEE-based approach for informed decision-making in land management, minimizing the P factor and promoting sustainable practices to reduce soil loss.
2.2.7. Normalized Difference Vegetation Index (NDVI)
The Normalized Difference Vegetation Index (NDVI) is a widely used vegetation index that quantifies the amount and health of vegetation based on the contrast between near-infrared (NIR) and red-light reflectance [29]. In estimating soil loss, NDVI is a valuable indicator of vegetation cover, influencing the cover and management (C) factor in the USLE [30]. Here is the individual methodology for integrating NDVI into the soil loss estimation process using Google Earth Engine (GEE). Analyze the NDVI values over multiple periods to capture seasonal variations in vegetation cover using Equation (4).
Different seasons may exhibit distinct NDVI patterns, influencing the overall C factor. Incorporate NDVI into the C-factor calculation of the RUSLE. A higher NDVI value corresponds to denser and healthier vegetation, resulting in a lower C factor. Modify the C-factor calculation as Equation (5):
Here, Cbase represents the base C factor without considering the NDVI.
Combine the NDVI-based C factor with other factors (M, L, S, and custom adjustments) in the USLE equation for comprehensive soil loss estimation:
In this Equation (6), PCustom stands for custom adjustments made to particular circumstances or factors that affect soil loss in addition to the conventional parameters (C, M, L, and S). The USLE equation acquires flexibility to take into account additional site-specific variables, such land management techniques, soil conservation measures, or localized environmental circumstances, that may effect soil erosion. This flexibility is achieved by integrating PCustom into the model in addition to the NDVI-based C component. Com-prehensive soil loss assessment is made possible by integrating PCustom and the NDVI-based C factor with other variables (M, L, and S) in the USLE equation. Apply the approach in GEE by choosing and sifting through satellite photos, figuring out the NDVI, and incorporating the NDVI-based C component into the total P-factor computation. Make use of GEE’s scalability to manage massive amounts of geographical data and gradually automate the procedure. The model is made more sensitive to variations in plant cover by adding NDVI to the soil-erosion calculation methodology. This gives important insights into how vegetation reduces soil loss and promotes sustainable land management techniques.
2.2.8. Slope
The slope of the terrain plays a fundamental role in estimating soil loss, serving as a critical factor in the RUSLE. The steepness of the land surface directly influences the erosive potential of water runoff, as steeper slopes enhance the force of rainfall, accelerating surface runoff and contributing to soil detachment and transport. The slope length–slope steepness (LS) factor in the RUSLE accounts explicitly for the combined influence of slope length and steepness on soil erosion, providing a quantitative measure of erosion susceptibility. The visualization and classification of slope maps aid in identifying areas with varying degrees of steepness, guiding in identifying regions at higher risk of erosion. Integrated with factors such as rainfall erosivity (R factor) [31], soil erodibility (K factor), land cover (C factor), and land use and management practices (P factor) in the RUSLE framework, the slope ensures a comprehensive assessment of soil loss. Understanding slope dynamics is crucial for implementing targeted conservation and land management practices, especially for steep slopes, and facilitates sustainable land use planning. Validation of slope calculations ensures the accuracy of its contribution to soil erosion modeling, supporting reliable estimations of erosion susceptibility across the study area.
3. Results
3.1. Topographic (LS) Factor
The LS factor, an integral component of the soil erosion assessment, combines the effects of slope length and steepness to influence the overall soil erosion rate. The computation of the LS factor, as per Equation (3), reveals a notable spatial heterogeneity within the Satluj Watershed, mirroring the region’s diverse topography. Elevated LS values pinpoint areas with steeper slopes and extended flow lengths, indicating heightened susceptibility to soil erosion. The LS factor map in Figure 3 is a valuable tool that delineates specific regions warranting focused attention for erosion control and conservation initiatives. The pronounced spatial variability emphasizes the need for tailored soil management strategies, considering the distinct LS factor values, to address soil erosion concerns effectively and promote sustainable land use practices across the Satluj Watershed.
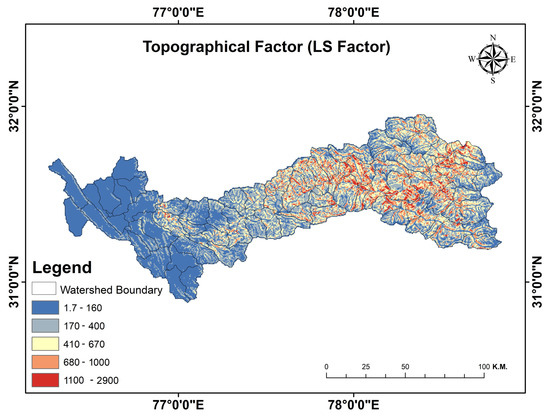
Figure 3.
Topographical factor (LS factor) map.
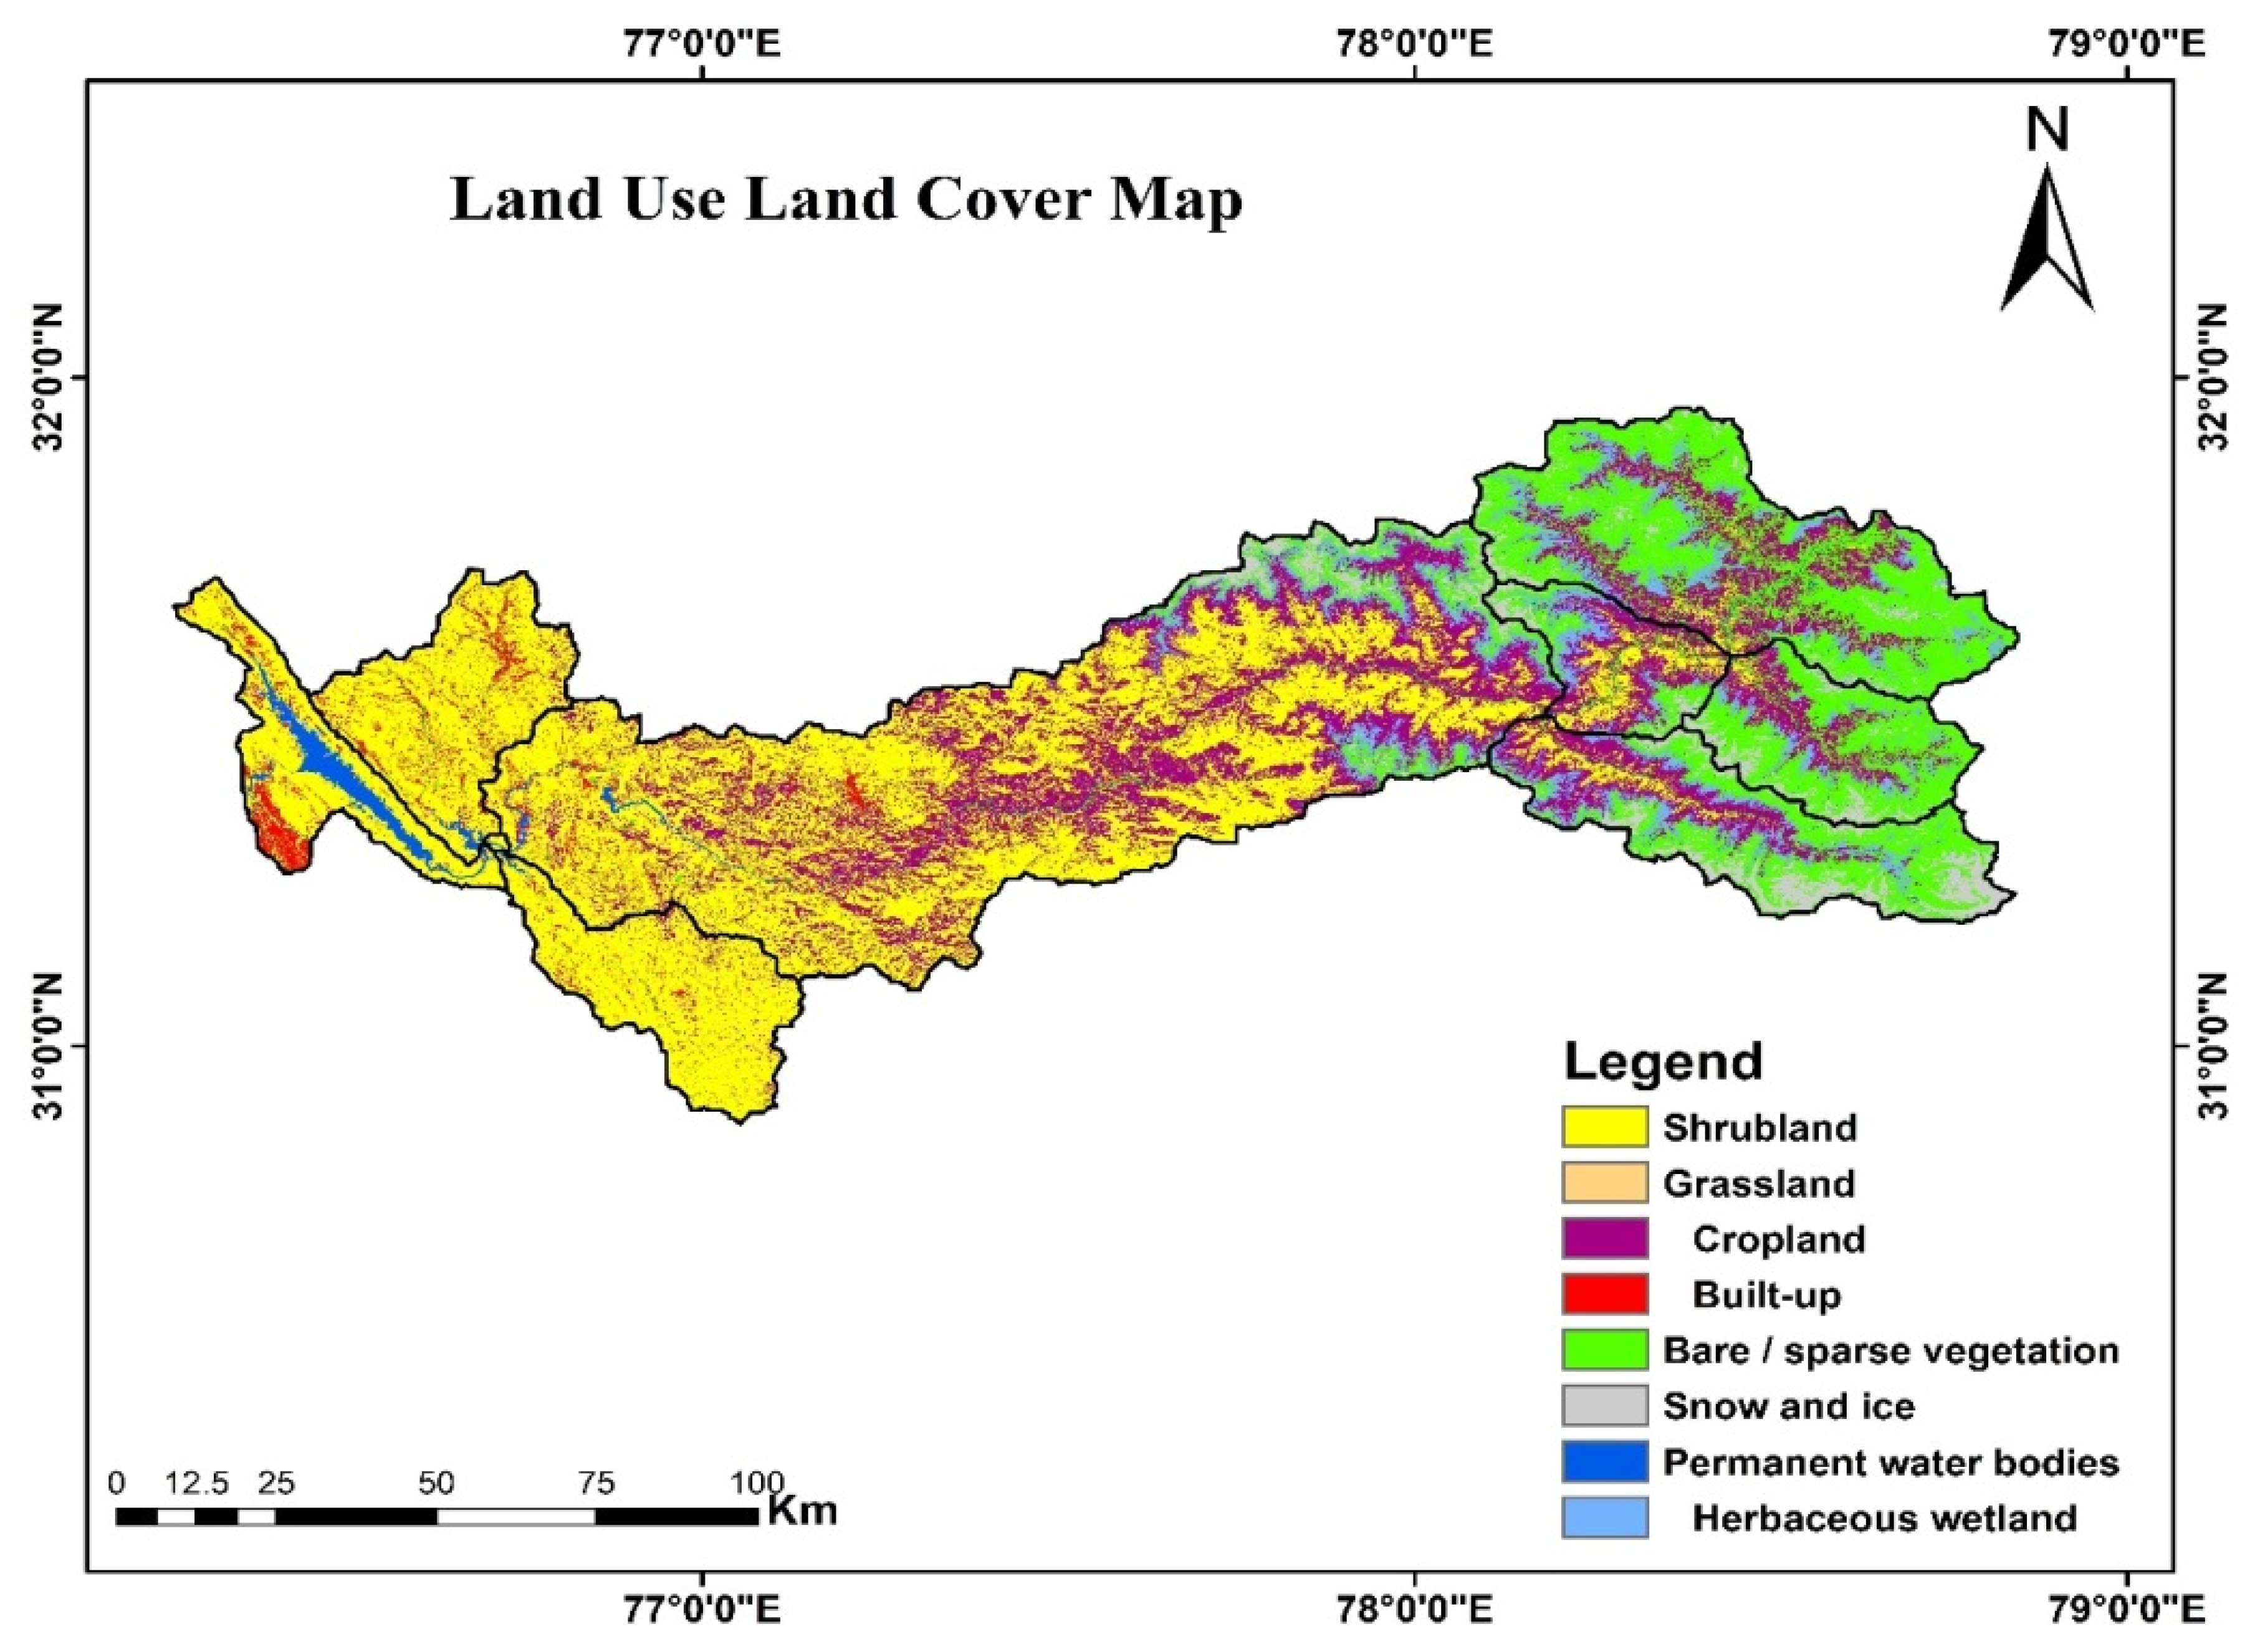
3.2. Land Cover (C) Factor
The Sentinel 2 imagery analysis identified eight major land-use classes in the study area, each contributing to the overall land cover (C) factor that ranges from 0 to 1, signifying the potential for soil erosion. Table 1 below outlines the specific areas corresponding to each land-use class:

Table 1.
Land use and land cover area.
Different land-use classes within the analyzed area have different potential degrees of soil erosion, according to the analysis. Remarkably, the classes of bare/sparse vegetation, grassland, and cropland exhibit the greatest erosion susceptibility. On the other hand, built-up regions and scrublands provide relatively lesser hazards of erosion. A thorough understanding of land-use classes and the risk for erosion they represent is essential for both planning land use and implementing sustainable agriculture techniques that reduce soil erosion. A useful tool for determining locations with different potentials for erosion is the C-factor map, which is shown in Figure 4. This makes it easier to establish focused strategies for soil conservation. This increases the efficacy of erosion control methods and promotes long-term environmental sustainability by ensuring that soil conservation efforts are effectively focused on places where they are most needed.

Figure 4.
Land use/land cover C-factor map.
3.3. Conservation Practice (P) Factor
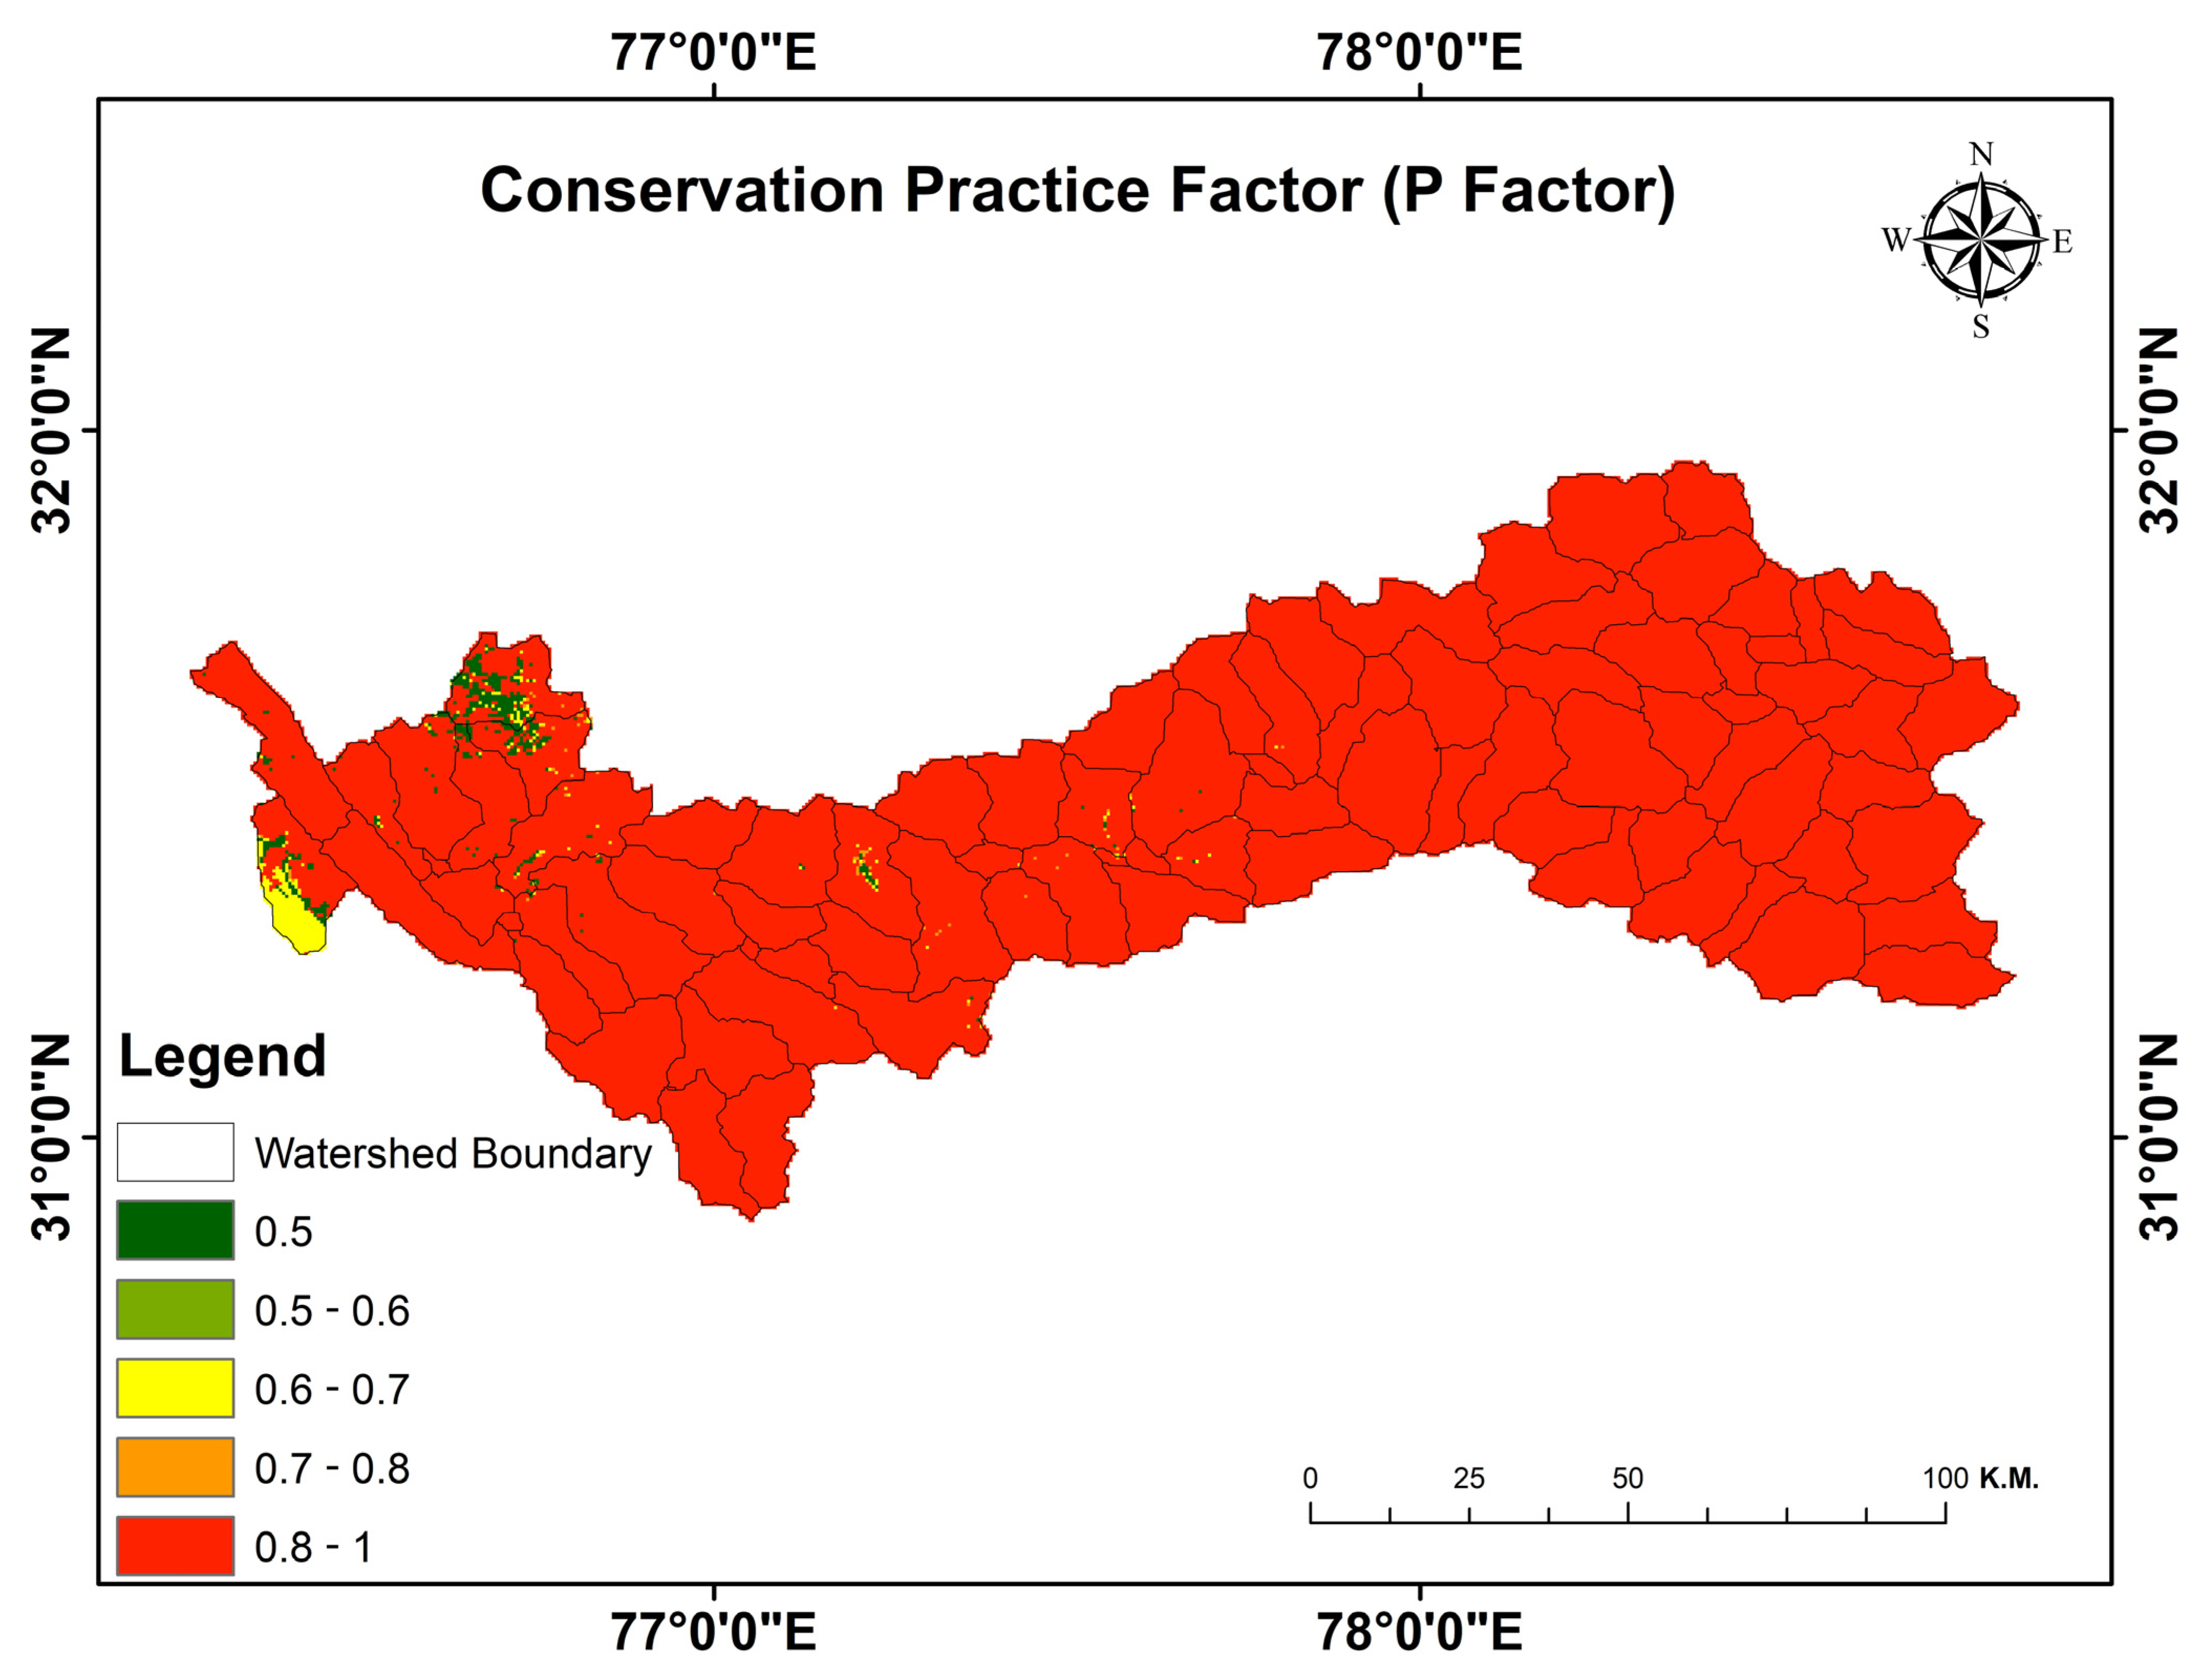
The conservation practice (P) factor was estimated using the empirical equation proposed by resulting in values between 0 and 1 [32]. Lower P values, representing more effective conservation practices, were generally found in areas with gentler slopes and well-managed agricultural land. However, areas with steep slopes and less effective conservation practices showed higher P values, indicating an increased risk of soil erosion. The spatial distribution of the P factor in Figure 5 can guide the implementation of erosion control measures and the enhancement of existing conservation practices.

Figure 5.
Conservation practice (P) factor map.
3.4. Soil Erodibility (K) Factor
The soil erodibility (K) factor represents the susceptibility of soil particles to detachment and transport by rainfall and runoff. Several soil properties, including texture, structure, organic matter content, and permeability, determine it. Using the RUSLE model, GIS tools, and satellite imagery, our analysis allowed us to compute the K factor for the entire Satluj Watershed. The K factor demonstrated spatial variability, indicating the heterogeneous nature of soil properties across the watershed. Areas with high K values represented soils with high erodibility, typically associated with poor structure, low organic matter content, and high silt or acceptable sand content. Conversely, areas with low K values indicated soils more resistant to erosion, often characterized by high organic matter content; a good soil structure; and higher proportions of coarse sand, silt, and clay. The K-factor map in Figure 6 highlights the spatial distribution of soil erodibility across the watershed, showing regions that are more prone to erosion and would require priority attention for soil conservation efforts. By integrating the K factor into the RUSLE model, we obtained a more comprehensive picture of soil erosion rates and their distribution within the watershed. This knowledge is crucial in designing and implementing effective erosion control measures that consider the specific characteristics and credibility of the local soils.

Figure 6.
Soil erodibility (K) factor map.
3.5. Analysis of NDVI
Significant insights into vegetation dynamics can be gained from the quantitative examination of the Satluj Watershed’s NDVI (Normalized Difference Vegetation Index). The NDVI, a measure of vegetation greenness, indicates the health and density of the vegetation cover. Denser and healthier vegetation was represented by higher values in the NDVI range from 0 to 0.85. Different vegetation densities were found throughout the watershed, according to the research. Richly vegetated areas are indicated by greater NDVI values, while areas closer to 0 are considered sparse or barren land. Water bodies, woods, and agricultural regions all have different NDVI signatures, and the distribution of NDVI values can be linked to land cover patterns and land use. It is possible to follow the health of the vegetation, identify regions that are vulnerable to deterioration, and evaluate the effects of land management techniques by tracking changes in the NDVI over time. The Satluj Watershed’s sustainable land use planning and conservation activities are greatly aided by the quantitative NDVI study, which provides valuable insights into the spatial distribution of vegetation. Figure 7 shows the Normalized Difference Vegetation Index (NDVI).
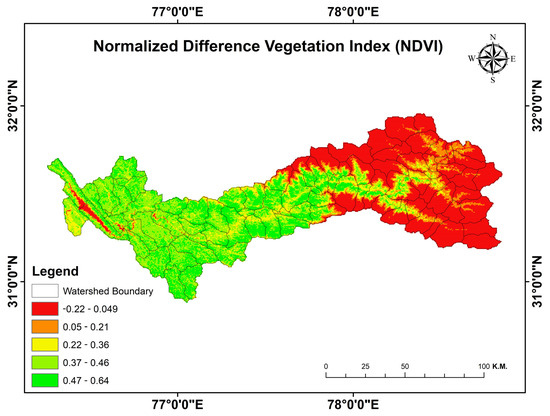
Figure 7.
Normalized Difference Vegetation Index (NDVI) map, 2020.
3.6. Soil Loss
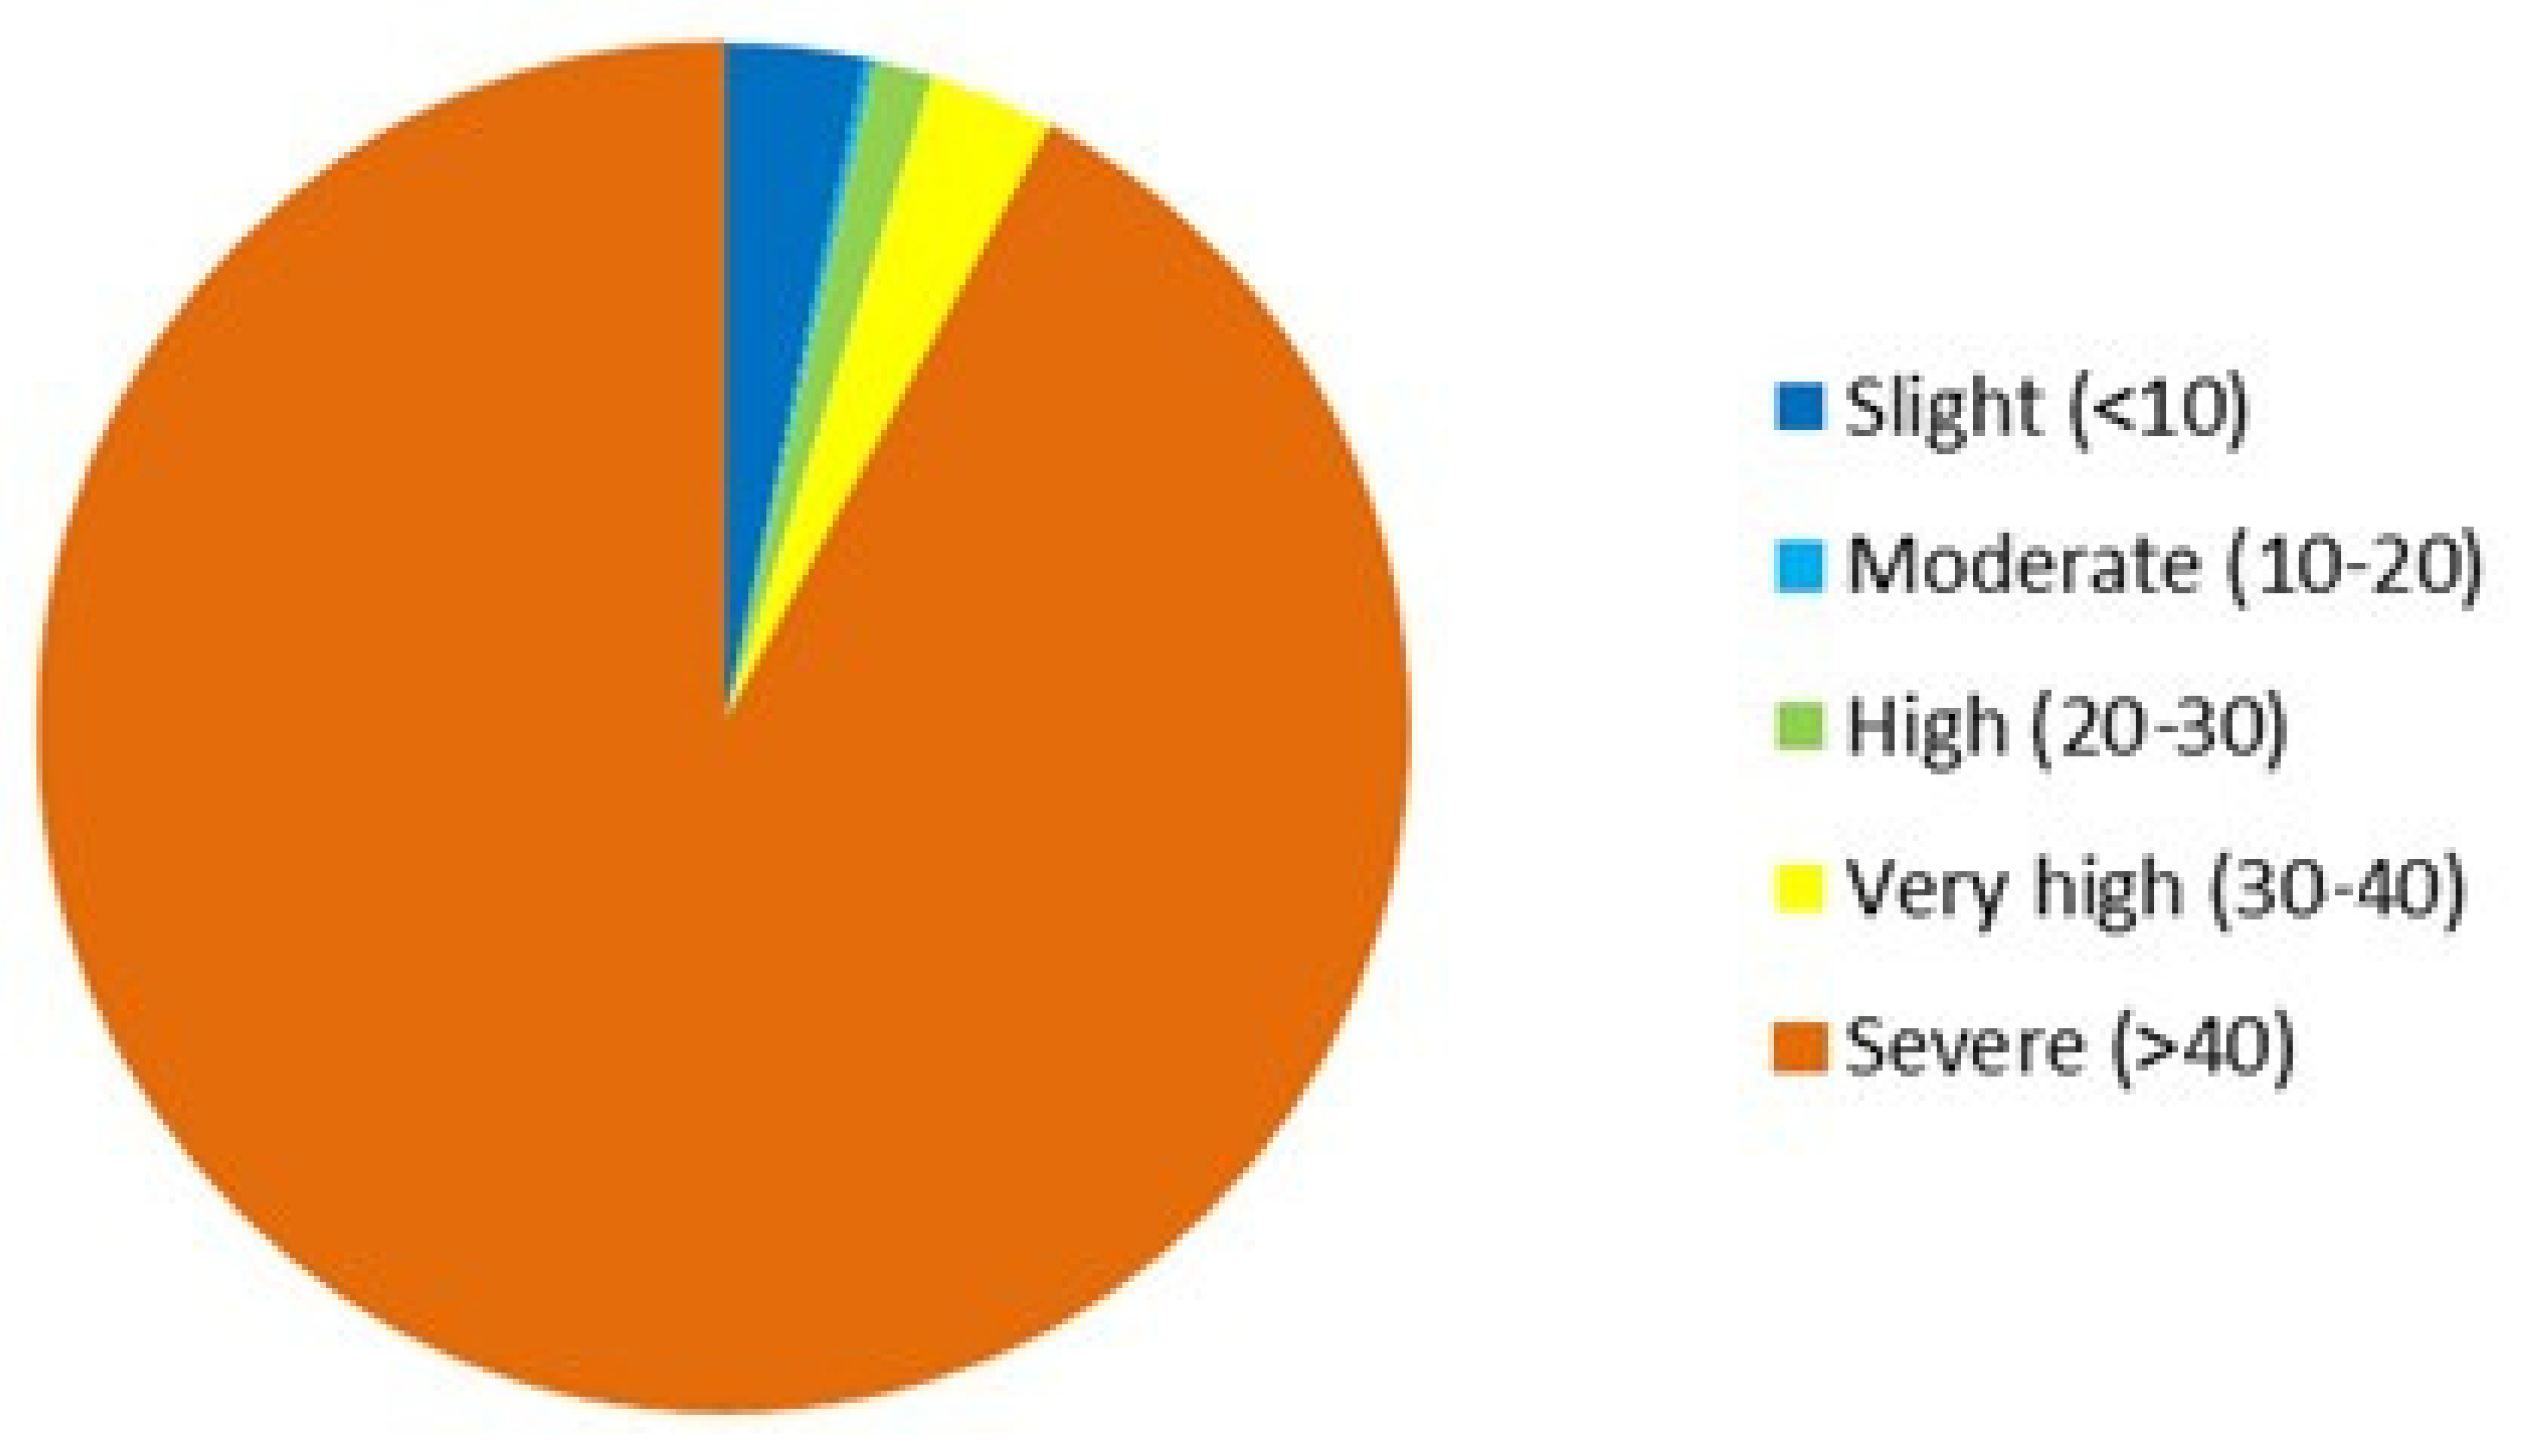
The Satluj Watershed’s assessment of soil loss indicates different classes with differing degrees of susceptibility: slight, moderate, high, very high, and severe. Very little erosion in the 1980 hectares makes up the watershed’s 3.3% of regions with slight soil loss. Approximately 0.2% of the watershed, or 120 hectares, falls into the moderate class, which indicates somewhat elevated soil loss and calls for focused conservation efforts. While very high soil loss locations (3% of the watershed, or 1800 hectares) demand immediate attention, high soil loss areas (1.4% of the watershed, or 840 hectares) call for extensive erosion control methods. In total, 92% of the watershed (55,200 hectares) is in the severe class, which dominates the landscape and shows significant soil loss (Table 2). This highlights the urgent need for timely and well-planned erosion control activities. The results offer insightful information that will help land managers and policymakers prioritize and customize conservation activities according to the unique features of each soil loss class, guaranteeing sustainable land use and environmental preservation in the Satluj Watershed. The findings of the study are presented in the table and maps. The result showed that the annual soil loss rate of the watershed ranged from 0 to 1, with a mean soil loss per year. The result indicates that the entire watershed was lost within the last 50 years, with about 0135 tons of soil annually from the total catchment area. Based on the results, the watershed was categorized into five classes of erosion: slight, moderate, high, very high, and severe, as shown in Figure 8 and Figure 9, indicating the area covered by each severity class.
Table 2.
Area covered by each severity class.
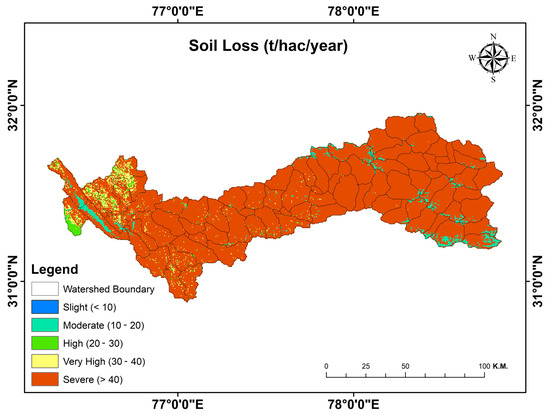
Figure 8.
Soil loss (ton ha−1 yr−1).

Figure 9.
Area covered by each severity class.
4. Discussion
The Satluj Watershed stands as a critical focal point for the examination of soil erosion dynamics, necessitating an integrated approach to land-use planning and the formulation of conservation policies. The foundation of informed decision-making for soil erosion control and the promotion of sustainable land use within this vital region is predicated on a comprehensive analysis of several key determinants. Paramount among these is the topographic (LS) factor, which elucidates the erosion vulnerability of specific locales through an amalgamation of slope length and steepness data. This essential information steers conservation efforts towards the most imperiled areas, underscoring the importance of slope analysis (LS) in the strategic design of erosion management interventions. Specifically, regions characterized by steeper inclines or elongated slopes are identified as having heightened susceptibility to erosion, necessitating prioritized attention.
The analytical process is further refined by examining the land cover (C) factor, which segregates the watershed into distinct primary land-use categories. This segmentation reveals that areas with minimal or sparse vegetation bear the brunt of erosion risks. Such delineation enables the implementation of targeted conservation strategies, allowing for focused efforts on land-use categories that are most vulnerable. The evaluation of the effectiveness of existing conservation strategies through the conservation practice (P) factor plays a pivotal role in guiding the enhancement and optimization of erosion control measures [33].
Adding another layer to this multifaceted analysis, the soil erodibility (K) factor sheds light on the heterogeneity of soil attributes across the watershed. A nuanced understanding of the diverse erosion susceptibilities of soils is critical for the prioritization and customization of conservation measures, ensuring that interventions are appropriately tailored to address the specific vulnerabilities of various soil types.
Moreover, the integration of NDVI data into the study provides invaluable insights into the health of vegetation within the watershed, underscoring the protective role of dense vegetation against soil erosion [34]. This inclusion facilitates the advancement of sustainable land-use planning strategies, informed by the robust analysis of vegetative cover’s resilience and the terrain’s physical characteristics.
The ramifications of soil erosion extend far beyond the immediate degradation of soil quality, impacting agricultural productivity, food security, aquatic ecosystems, and water quality through sedimentation processes [35,36]. The adverse effects of soil erosion are manifold, encompassing the diminution of topsoil quality, detrimental impacts on agricultural yield, disruptions to aquatic life and habitats, and exacerbated global warming effects due to reduced soil carbon sequestration capacities [37]. Additionally, the infrastructure within human communities, particularly in areas prone to landslides and mudflows triggered by soil erosion, faces significant risks, underscoring the broader societal and environmental stakes involved [38].
Given the extensive implications of soil erosion within the Satluj Watershed, there emerges an unequivocal need for meticulously conceived erosion control measures and bespoke conservation initiatives. The watershed and its environs necessitate comprehensive and sustainable land-use planning endeavors aimed at securing the long-term vitality and resilience of ecosystems, human settlements, agriculture, and water resources. This academically rigorous discourse accentuates the imperative for a holistic consideration of soil erosion’s far-reaching consequences, advocating for a concerted approach that synergizes environmental stewardship with community resilience and sustainable development objectives.
5. Conclusions
The Satluj Watershed has been extensively analyzed to provide a holistic understanding of soil erosion dynamics. The analysis considers influential factors, including LS, C, P, and K factors; NDVI analysis; and soil loss assessment. The LS factor reveals spatial heterogeneity in topography, which can guide conservation initiatives in specific areas. The C factor identifies land-use classes and erosion potentials, emphasizing the need for targeted strategies in areas with higher erosion risks, such as bare/sparse vegetation regions. The P factor highlights the need for effective conservation practices, especially for steeper slopes. The soil erodibility (K) factor provides insights into soil properties, which can guide priority attention for conservation efforts. Integrating K into the RUSLE model enhances understanding and targeted measures. An NDVI analysis provides crucial information for sustainable land-use planning, monitoring vegetation health, and identifying vulnerable areas. The soil loss assessment categorizes susceptibility, aiding prioritized erosion control. With 92% in the severe class, urgent and well-planned measures are essential. Overall, this comprehensive study offers a robust foundation for watershed management, informing decision-makers and stakeholders. The insights contribute to sustainable land-use planning, effective conservation strategies, and addressing evolving environmental challenges in the Satluj Watershed, ensuring a balanced approach to human needs and ecological sustainability in the region.
This research, by Mahesh Singh et al. (2023) [39], quantified soil loss across diverse watersheds, demonstrating the applicability and effectiveness of RUSLE modelling for soil erosion assessment. The congruence between their findings and ours underscores the reliability and accuracy of our methodology, further validating our soil erosion estimates and reinforcing the significance of our results for guiding conservation strategies in the Satluj Watershed.
The study conducted in the Satluj Watershed has shown that GEE plays a crucial role in transforming the evaluation of soil erosion factors. By utilizing GEE’s powerful computational framework, the study was able to identify and measure significant variables, such as R, K, LS, and NDVI. This demonstrates GEE’s ability to manage intricate geospatial analyses on a large scale effectively. The use of GEE in the study simplified the methodology and greatly improved the accuracy and dependability of soil erosion estimations. This highlights the essential usefulness of GEE in environmental research.
This study emphasizes the practicality and applicability of our methodology using Google Earth Engine (GEE) for soil erosion assessment with the Revised Universal Soil Loss Equation (RUSLE) model. It highlights the innovation, efficiency, and effectiveness of integrating cloud-based geospatial analysis for soil conservation efforts. Specifically, it outlines how practicing engineers and soil conservation professionals can adopt these advanced techniques in real-world scenarios to assess soil erosion risks and implement targeted conservation measures accurately. This addition is intended to bridge the gap between academic research and field application, providing a clear and concise guide for professionals in the field.
Author Contributions
Conceptualization, S.K. and S.K.S.; methodology, B.S.; software, G.M.; validation, A.S., S.S. and S.K.; formal analysis, A.S.; investigation, A.S.; resources, P.K.; data curation, D.S.; writing—original draft preparation, J.D.; writing—review and editing, K.C.; visualization, B.D.; supervision, S.K.S.; project administration, S.K.; funding acquisition, B.D. All authors have read and agreed to the published version of the manuscript.
Funding
Research was supported under the project “Hydrological and geodetic analysis of the watercourse’’ in 2024 from the University North, Croatia.
Data Availability Statement
The data are available from the first author upon reasonable request.
Acknowledgments
We express our sincere gratitude for the support provided by the University North, Croatia, under the project “Hydrological and geodetic analysis of the watercourse” in 2024. We also extend our appreciation to Suresh Gyan Vihar University for their invaluable assistance and resources, which significantly contributed to the success of this research. Their collaborative efforts have been crucial in advancing our understanding of soil erosion dynamics and conservation strategies.
Conflicts of Interest
The authors declare no conflicts of interest.
References
- Allafta, H.; Opp, C. Soil Erosion Assessment Using the RUSLE Model, Remote Sensing, and GIS in the Shatt Al-Arab Basin (Iraq-Iran). Appl. Sci. 2022, 12, 7776. [Google Scholar] [CrossRef]
- Hazbavi, Z.; Sadeghi, S.H.; Gholamalifard, M. Dynamic Analysis of Soil Erosion-Based Watershed Health. GES 2019, 12, 43–59. [Google Scholar] [CrossRef]
- Ganasri, B.P.; Ramesh, H. Assessment of soil erosion by RUSLE model using remote sensing and GIS—A case study of Nethravathi Basin. Geosci. Front. 2016, 7, 953–961. [Google Scholar] [CrossRef]
- Almouctar, M.A.S.; Wu, Y.; Zhao, F.; Dossou, J.F. Soil Erosion Assessment Using the RUSLE Model and Geospatial Techniques (Remote Sensing and GIS) in South-Central Niger (Maradi Region). Water 2021, 13, 3511. [Google Scholar] [CrossRef]
- Li, X.; Wei, X. Analysis of the Relationship between Soil Erosion Risk and Surplus Floodwater during Flood Season. J. Hydrol. Eng. 2014, 19, 1294–1311. [Google Scholar] [CrossRef]
- Sharma, N.; Kaushal, A.; Yousuf, A.; Kaur, S.; Sharda, R.; Singh, S.P.; Gupta, O.; Sood, A. Prioritization of erosion susceptible watersheds using morphometric analysis and PCA approach: A case study of lower Sutlej River basin of Indian Punjab. Watershed Ecol. Environ. 2023, 5, 209–224. [Google Scholar] [CrossRef]
- Sharma, P.D.; Goel, A.K.; Minhas, R.S. Water and Sediment Yields into the Sutlej River from the High Himalaya. Mt. Res. Dev. 1991, 11, 87. [Google Scholar] [CrossRef]
- Soil Erosion: An Agricultural Production Challenge|Integrated Crop Management. Available online: https://crops.extension.iastate.edu/encyclopedia/soil-erosion-agricultural-production-challenge (accessed on 18 March 2024).
- Chen, C.-N.; Tfwala, S.S.; Tsai, C.-H. Climate Change Impacts on Soil Erosion and Sediment Yield in a Watershed. Water 2020, 12, 2247. [Google Scholar] [CrossRef]
- Bezak, N.; Borrelli, P.; Mikoš, M.; Auflič, M.J.; Panagos, P. Towards multi-model soil erosion modelling: An evaluation of the erosion potential method (EPM) for global soil erosion assessments. CATENA 2024, 234, 107596. [Google Scholar] [CrossRef]
- Dargiri, S.A.; Samsampour, D. Principles of Soil Erosion Risk Modeling. In Soil Erosion—Risk Modeling and Management; Mahmood, S., Ed.; IntechOpen: London, UK, 2024. [Google Scholar] [CrossRef]
- Hsieh, Y.P.; Grant, K.T.; Bugna, G.C. A field method for soil erosion measurements in agricultural and natural lands. J. Soil Water Conserv. 2009, 64, 374–382. [Google Scholar] [CrossRef]
- Raza, A.; Ahrends, H.; Habib-Ur-Rahman, M.; Gaiser, T. Modeling Approaches to Assess Soil Erosion by Water at the Field Scale with Special Emphasis on Heterogeneity of Soils and Crops. Land 2021, 10, 422. [Google Scholar] [CrossRef]
- Das, B.; Bordoloi, R.; Thungon, L.T.; Paul, A.; Pandey, P.K.; Mishra, M.; Tripathi, O.P. An integrated approach of GIS, RUSLE and AHP to model soil erosion in West Kameng watershed, Arunachal Pradesh. J. Earth Syst. Sci. 2020, 129, 94. [Google Scholar] [CrossRef]
- Avand, M.; Mohammadi, M.; Mirchooli, F.; Kavian, A.; Tiefenbacher, J.P. A New Approach for Smart Soil Erosion Modeling: Integration of Empirical and Machine-Learning Models. Environ. Model. Assess. 2023, 28, 145–160. [Google Scholar] [CrossRef]
- Kayet, N.; Pathak, K.; Chakrabarty, A.; Sahoo, S. Evaluation of soil loss estimation using the RUSLE model and SCS-CN method in hillslope mining areas. Int. Soil Water Conserv. Res. 2018, 6, 31–42. [Google Scholar] [CrossRef]
- Madhukar, A.; Hari, N.; Srivalli, R.; Neelima, T.L. Spatial Estimation of Soil Erosion Using RUSLE Model: A Case Study of Sangareddy Telangna State, India. IJPSS 2023, 35, 490–498. [Google Scholar] [CrossRef]
- Alewell, C.; Borrelli, P.; Meusburger, K.; Panagos, P. Using the USLE: Chances, challenges and limitations of soil erosion modelling. Int. Soil Water Conserv. Res. 2019, 7, 203–225. [Google Scholar] [CrossRef]
- Universal Soil Loss Equation|Ontario.ca. Available online: http://www.ontario.ca/page/universal-soil-loss-equation (accessed on 18 March 2024).
- Misra, K.G.; Yadav, R.R.; Misra, S. Satluj river flow variations since AD 1660 based on tree-ring network of Himalayan cedar from western Himalaya, India. Quat. Int. 2015, 371, 135–143. [Google Scholar] [CrossRef]
- Sharma, N.; Yousuf, A.; Kaushal, A. Prioritization of watersheds for land and water management in lower Sutlej River Basin using geospatial technology. J. Nat. Resour. Conserv. Manag. 2023, 5, 77–91. [Google Scholar] [CrossRef]
- Nam, K.-H.; Lee, D.-H.; Chung, S.-R.; Jeong, G.-C. Effect of Rainfall Intensity, Soil Slope and Geology on Soil Erosion. J. Eng. Geol. 2014, 24, 69–79. [Google Scholar] [CrossRef]
- Shen, H.; Zheng, F.; Wen, L.; Han, Y.; Hu, W. Impacts of rainfall intensity and slope gradient on rill erosion processes at loessial hillslope. Soil Tillage Res. 2016, 155, 429–436. [Google Scholar] [CrossRef]
- Parveen, R.; Kumar, U. Integrated Approach of Universal Soil Loss Equation (USLE) and Geographical Information System (GIS) for Soil Loss Risk Assessment in Upper South Koel Basin, Jharkhand. J. Geogr. Inf. Syst. 2012, 4, 588–596. [Google Scholar] [CrossRef]
- Musa, J.J.; Anijofor, S.C.; Obasa, P.; Avwevuruvwe, J.J. Effects of soil physical properties on erodibility and infiltration parameters of selected areas in Gidan Kwano. Nig. J. Technol. Res. 2017, 12, 46. [Google Scholar] [CrossRef]
- Das, S.; Bora, P.; Das, R. Estimation of slope length gradient (LS) factor for the sub-watershed areas of Juri River in Tripura. Model. Earth Syst. Environ. 2022, 8, 1171–1177. [Google Scholar] [CrossRef]
- Zhang, H.; Wei, J.; Yang, Q.; Baartman, J.E.; Gai, L.; Yang, X.; Li, S.; Yu, J.; Ritsema, C.J.; Geissen, V. An improved method for calculating slope length (λ) and the LS parameters of the Revised Universal Soil Loss Equation for large watersheds. Geoderma 2017, 308, 36–45. [Google Scholar] [CrossRef]
- Ozsahin, E.; Duru, U.; Eroglu, I. Land Use and Land Cover Changes (LULCC), a Key to Understand Soil Erosion Intensities in the Maritsa Basin. Water 2018, 10, 335. [Google Scholar] [CrossRef]
- Normalized Difference Vegetation Index—An Overview|ScienceDirect Topics. Available online: https://www.sciencedirect.com/topics/agricultural-and-biological-sciences/normalized-difference-vegetation-index (accessed on 26 March 2024).
- Almagro, A.; Thomé, T.C.; Colman, C.B.; Pereira, R.B.; Junior, J.M.; Rodrigues, D.B.B.; Oliveira, P.T.S. Improving cover and management factor (C-factor) estimation using remote sensing approaches for tropical regions. Int. Soil Water Conserv. Res. 2019, 7, 325–334. [Google Scholar] [CrossRef]
- Cardoso, D.P.; Silva, E.M.; Avanzi, J.C.; Muniz, J.A.; Ferreira, D.F.; Silva, M.L.N.; Acuña-Guzman, S.F.; Curi, N. RainfallErosivityFactor: An R package for rainfall erosivity (R-factor) determination. CATENA 2020, 189, 104509. [Google Scholar] [CrossRef]
- Ahmed, M.; Asif, M.; Hirani, A.H.; Akram, M.N.; Goyal, A. Chapter 7—Modeling for Agricultural Sustainability: A Review. In Agricultural Sustainability; Bhullar, G.S., Bhullar, N.K., Eds.; Academic Press: San Diego, CA, USA, 2013; pp. 127–147. [Google Scholar] [CrossRef]
- Mekonnen, E.; Kebede, A.; Asfaw, S.; Feyissa, S. Optimizing soil erosion estimates of RUSLE model by analyzing land use/cover dynamics in upper Awash River Basin, Central Ethiopia. Geomat. Nat. Hazards Risk 2023, 14, 2257363. [Google Scholar] [CrossRef]
- Mehmood, K.; Anees, S.A.; Rehman, A.; Pan, S.; Tariq, A.; Zubair, M.; Liu, Q.; Rabbi, F.; Khan, K.A.; Luo, M. Exploring spatiotemporal dynamics of NDVI and climate-driven responses in ecosystems: Insights for sustainable management and climate resilience. Ecol. Inform. 2024, 80, 102532. [Google Scholar] [CrossRef]
- Lal, R. Restoring Soil Quality to Mitigate Soil Degradation. Sustainability 2015, 7, 5875–5895. [Google Scholar] [CrossRef]
- Sustainability|Free Full-Text|Restoring Soil Quality to Mitigate Soil Degradation. Available online: https://www.mdpi.com/2071-1050/7/5/5875 (accessed on 18 March 2024).
- Flanagan, D.C.; Ii, J.C.A.; Nieber, J.L.; Misra, D.; Kyle, R. Douglas-Mankin. Advances in Soil Erosion Research: Processes, Measurement, and Modeling. Trans. ASABE 2013, 56, 455–463. [Google Scholar] [CrossRef]
- Chalise, D.; Kumar, L.; Kristiansen, P. Land Degradation by Soil Erosion in Nepal: A Review. Soil Syst. 2019, 3, 12. [Google Scholar] [CrossRef]
- Singh, M.; Sur, K.; Al-Ansari, N.; Arya, P.K.; Verma, V.; Malik, A. GIS integrated RUSLE model-based soil loss estimation and watershed prioritization for land and water conservation aspects. Front. Environ. Sci. 2023, 11, 1136243. [Google Scholar] [CrossRef]


Disclaimer/Publisher’s Note: The statements, opinions and data contained in all publications are solely those of the individual author(s) and contributor(s) and not of MDPI and/or the editor(s). MDPI and/or the editor(s) disclaim responsibility for any injury to people or property resulting from any ideas, methods, instructions or products referred to in the content. |
© 2024 by the authors. Licensee MDPI, Basel, Switzerland. This article is an open access article distributed under the terms and conditions of the Creative Commons Attribution (CC BY) license (https://creativecommons.org/licenses/by/4.0/).