1. Introduction
Warm water production accounts for a significant share of the energy used in buildings; nearly 20 percent of the energy consumption in the domestic sector is associated with water heating for various purposes (e.g., shower, bath, dishwasher, washing machine, kitchen, etc.) [
1]. A significant portion of this energy is unexploited since wastewater produced by residential, industrial, or commercial buildings and discharged after related uses still contains a significant amount of thermal energy. For example, in Switzerland, the loss of thermal energy in sewage has been estimated at around 6000 GWh per year, accounting for seven percent of the country’s total heat needs [
2]. Wastewater from domestic sources contains 2.5 times more recoverable thermal energy than the theoretical maximum chemical energy stored as COD (in the assumption of an energy recovery corresponding to a temperature effluent drop of 6 °C). According to an assessment carried out on sewage treatment plants in the Netherlands, assuming a thermal energy recovery from municipal effluents with a temperature drop of 5 °C, 24 h a day, 365 days a year, the total recovered energy would amount to about 40 PJ, equivalent to more than 40 percent of the total thermal energy produced by gas, coal, or biomass combustion processes [
3]. As for the Italian potential, starting from the annual figure of 9.8 billion m
3 of wastewater treated by sewage treatment plants [
4] and assuming a temperature drop of 5 °C, 24 h a day, 365 days a year, the calculated value for theoretically available thermal energy is about 200 PJ. Such a value corresponds to about 15 percent of the total thermal energy market in Italy for residential buildings and services [
5].
The scientific community is now fully aware of the great potential of wastewater as an energy resource to be exploited to reduce fossil energy consumption. Recent European policies go in this direction; an example for all is the recently proposed revision of the Urban Waste Water Treatment Directive 91/271/EEC (UWWTD) (COM (2022) 541), which fosters the energy efficiency of the sector. Wastewater treatment needs are estimated at around 0.8 percent of the total energy consumption in the EU. The proposed revision would require sewage treatment plants larger than 10,000 P.E. to achieve energy neutrality by 2045 using renewable energy sources (of which no more than 30% can be purchased from external sources). Such an objective can be achieved through the implementation of efficiency measures, as well as by increasing energy production from renewable sources.
However, the implementation of heat recovery from sewage effluents requires careful evaluation, considering the effects on the entire drainage and treatment systems [
6]. Heat recovery options for residential, commercial, and industrial facilities include the implementation of heat exchange technologies in sewer networks, near the wastewater discharge from the buildings, or at the centralized WWTP facilities. At present, there are several waste heat recovery technologies capable of producing thermal energy at different temperature levels, such as heat pumps and absorption refrigeration machines, systems already commercialized in many power ranges.
Several case studies show the achievable heat recovery potential in sewage networks or WWTPs [
7]. Worldwide, at least 500 applications exist today [
2], and many of them are implemented in Switzerland, Germany, and Scandinavia. Lucerne (Switzerland) and Oslo are examples of heat recovery in the sewer system, while in Berne (Switzerland), heat recovery is implemented within a WWTP achieving the potential for a heat recovery of more than 30 MW. Other practical applications of the thermal energy recovered from the effluent of WWTPs around the world are reported in [
8].
Compared to WWTPs, the main advantage of providing energy recovery in sewer networks lies in the higher effluent temperature and the proximity to the potential users of the recovered heat [
9]. On the other hand, sewer thermal energy recovery could result in appreciable changes in wastewater temperature and affect the WWTP performance [
10,
11]. In cold seasons, temperature drops can affect the kinetic rates of biological processes. Nitrification processes are particularly sensitive to temperature changes, as the relative maximum specific growth rate value μA of 0.8 d
−1 at 20 °C slows down to 0.3 d
−1 for a 10-degree decrease (ASM1) [
12]. In activated sludge processes, the maintenance of microbial populations in reactors requires a proper balance between the new biomass growing and the excess sludge extraction for both autotrophic and heterotrophic bacteria populations [
13]. The sludge retention time of autotrophic bacteria is carefully designed to prevent the washout of nitrifying bacteria as well as to avoid the resulting surge of ammonia nitrogen concentration in the effluent. As a rule of thumb, a sludge aerobic dilution rate (D
aer) significantly lower than the maximum net specific growth rate of nitrifying bacteria should be ensured, considering the temperature T of the process units. Wanner et al. [
10] defined a nitrification safety factor (SF) as the ratio of the two quantities. Since the aerobic dilution rate is the reciprocal of the average sludge residence time in aerobic tanks (STR
aer), it follows that higher SRTs in the treatment plant are required to maintain a sufficient safety factor at low nitrification rates. Generally, nitrification requires a minimum SRT of about 10 days.
Given these drawbacks of heat recovery systems in sewers, an alternative and attractive option for energy recovery is represented by the application of such technologies directly at centralized WWTPs. In such plants, substantial quantities of wastewater from various sewer systems are collected, characterized by higher flow rates and less flow variability. The average wastewater temperature in WWTPs is typically lower than in the sewer network, attributed to the greater distances from production points; however, it also exhibits reduced susceptibility to extreme variability.
The present study examined the impacts of heat recovery in sewer networks on WWTP performances in terms of nitrogen removal rates. For this purpose, all significant contributions of heat transfer from the sewer to the WWTP as well as the effects of different temperatures of the wastewater on biological processes were calculated using different modeling software. The study provided a means of assessing the feasibility of thermal recovery from municipal wastewater, identifying the suitable conditions capable of ensuring both the treatment process performances and compliance with discharge limits. The paper addresses a relevant topic that has already been investigated in other contests. However, the adopted approach, which integrates hydraulics, heat exchange in sewage pipes and WWTPs, and biological treatment process modeling, represents a novel and distinctive aspect of the methodology employed in this study.
2. Materials and Methods
In the present study, the sewer flow rate of the Fossolo urban basin located in the southeastern suburbs of Bologna was first modelled. The basin extension is around 48 hectares, and its mixed-type drainage network has the advantage of being isolated from the surrounding sewer networks. The heat exchange between the wastewater and the environment was modelled as well. Both of these analyses were carried out with the TEMPEST calculation code developed by the Eawag-Swiss Federal Institute of Aquatic Science and Technology [
12]. Heat transfer in the WWTP was then modelled by applying the “Basin Temperature” calculation code developed by researchers at the University of California, the University of Florence, and the Politecnico di Milano [
14]. To evaluate the effect of temperature changes on biological processes in the WWTP, a model was built by using the BioWin 6.2 software (EnviroSim Associates Ltd., Flamborough, ON, Canada), based on the Activated Sludge/Anaerobic Digestion model (ASDM). The effect of installing a heat recovery system was evaluated starting from a five-degree reduced temperature.
The following paragraphs present the methodological details of the different phases of the applied modeling process.
2.1. Hydraulic Modeling
Fossolo hydraulic network collects wastewater mainly from domestic origin for an average dry weather flow rate of about 65 m3/h. The total catchment area is about 48 ha, and there are about 10,000 inhabitants. The WWTP is located at a distance of about 10 km.
The network was studied extensively from a hydraulic point of view by Altobelli et al. [
15] through the running of SWMM 5.1 software [
16] by soliciting the network with 15 years of rainfall data starting from 2009 [
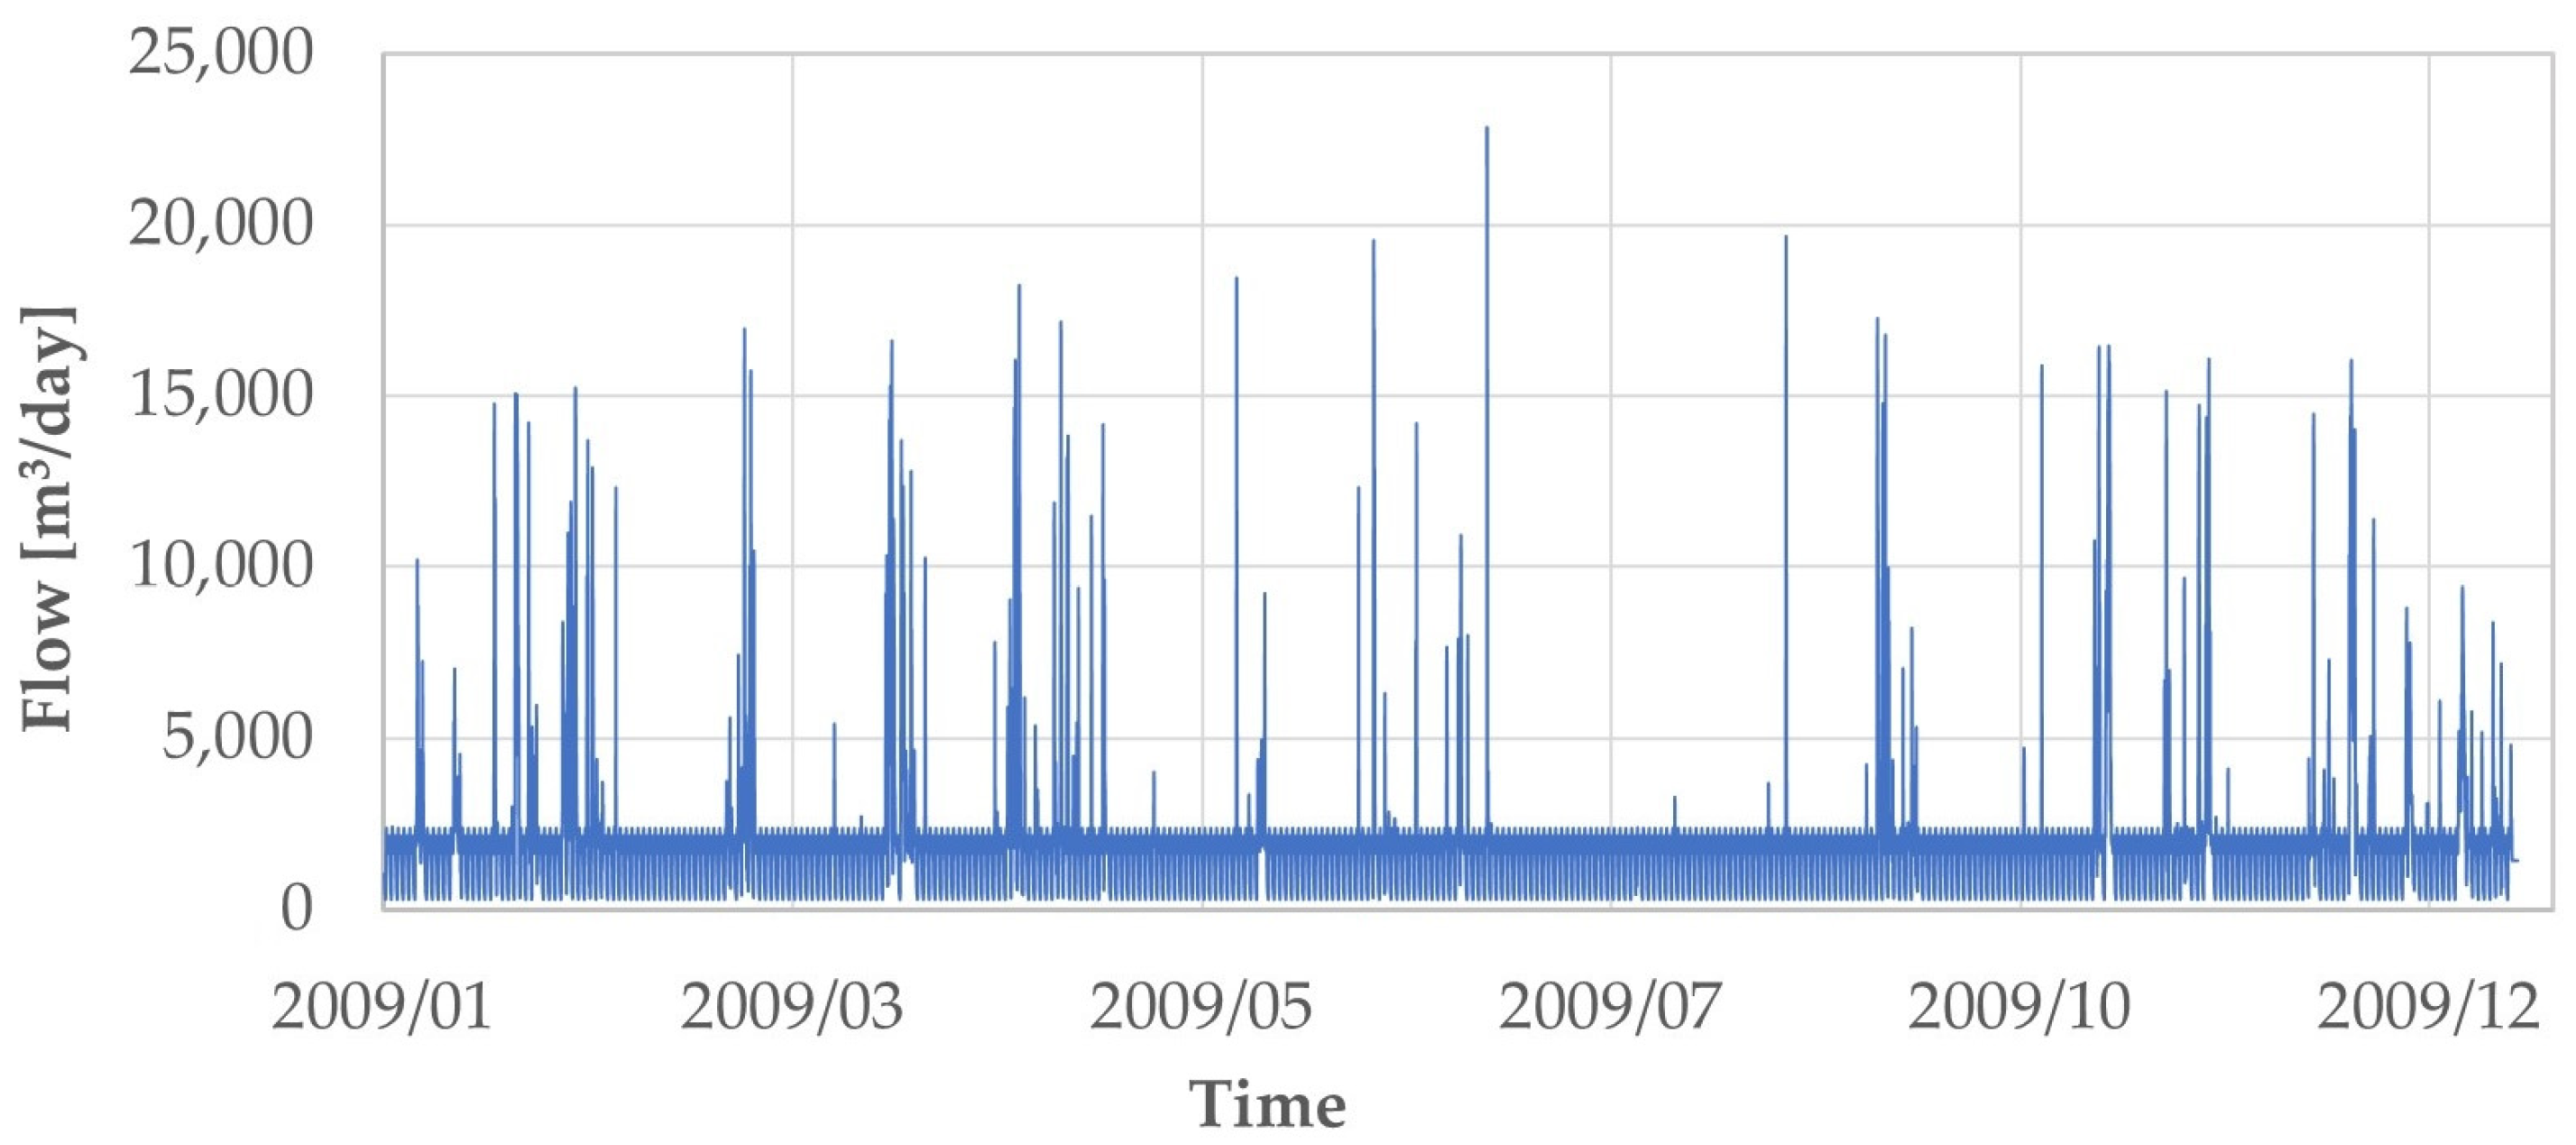
15]. The choice of the years was derived from a numerical analysis aimed at identifying the average year over the period between 2005 and 2016. The analysis evaluated the average daily rainfall over the entire period and identified the year with the smallest difference, in absolute value, between the daily data for the year under study and the average daily data for the entire period. The simulations allowed the calculation of the flow rate released from the flood overflows placed along the sewer line and the flow rate conveyed to the WWTP. The trend over time of the flow rate reaching the WWTP is shown in
Figure 1. The total volume conveyed from the sewer during the modeling year is approximately 690,000 m
3. This figure encompasses both the wastewater treated by the WWTP (638,000 m
3) and the upstream overflow discharged into the environment.
2.2. Thermal Exchange in Sewage Pipes
Proper modeling of the effects of wastewater heat recovery is required, in addition to the flow rate, to estimate the temperature of the effluent within the sewage collectors. For the present study, flow rate and temperature monitoring data related to the Bologna sewer network were used as starting input. The dataset used refers to a measurement campaign from September 2006 to February 2007 [
17], conducted on five measurement points at the sewer networks by the local water services provider, HERA S.p.A. The temperature values measured in the campaign are very similar among the various points. The temperature trend over time was interpolated by nonlinear regression by a periodic function of the equation: y = y0 + a sin (2π b x + c), with a period fixed at 365 days.
Once the temperature trend in the sewer network was defined, the heat transfer in the final sewer collector upstream to the WWTP was calculated for a total estimated distance of 10 km. To take into account heat exchanges between the network and the environment, the soil temperature at the depth of the pipeline was calculated using the method developed by Kusuda [
18], which takes into account not only the depth with respect to the surface layer but also the characteristics of the soil. According to [
17], where the sewer system of the city of Bologna was studied also in relation to the temperature of the wastewater and air in the various seasons, the soil temperature results as a function of the season and the depth below the surface layer.
One day in each month, from September 2006 through April 2007, was chosen to be reproduced, covering the entirety of the colder season this way.
The TEMPEST 1.02 software was employed to model heat exchange between the collector effluent and the soil using interpolated sewer temperature data and calculated soil temperature values. This tool facilitated the calculation of dynamic and longitudinal spatial profiles of wastewater temperature within the sewer collectors. Additionally, it allowed for simulating typical conditions on selected days during the colder season. One day was chosen each month, spanning from September 2006 through April 2007, to ensure coverage of the entirety of the colder season. The simulations were carried out considering constant soil and sewer pipe characteristics, as shown in
Table 1.
For each day, two types of simulations were carried out:
In the absence of heat recovery: the sewer water temperature at the upstream point (TU) is actually that resulting from the interpolation;
In the presence of heat recovery: the sewer water temperature value at the upstream point (TU) is 5 °C lower because of the heat recovery operated in the sewer.
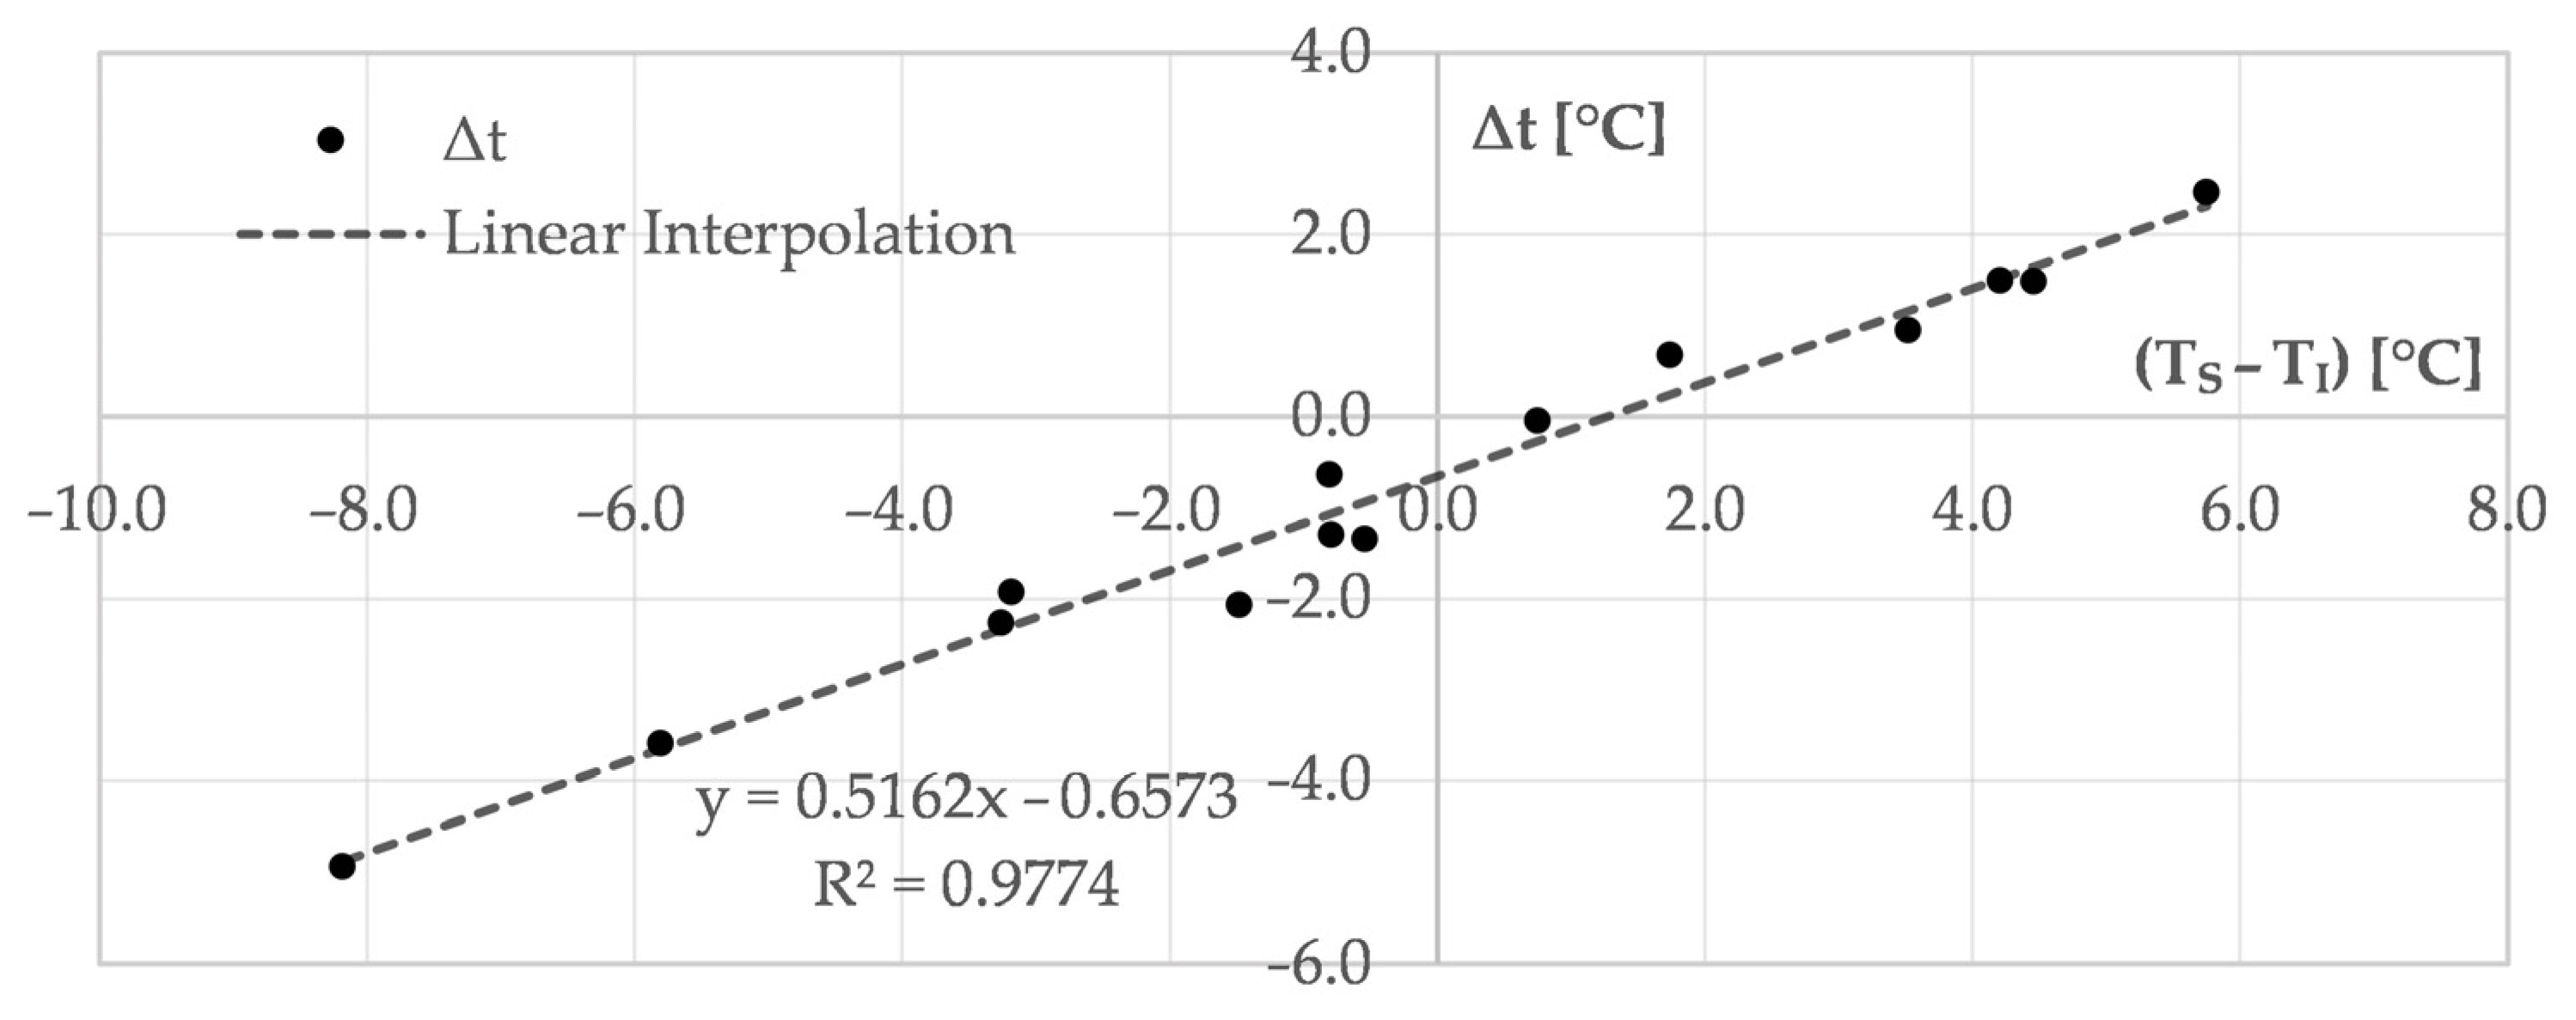
Thus, it was possible to define the temperature trend at the sewage inlet for the selected days. A sensitivity analysis of simulation data allowed for deriving the strong dependence of heat transfer on the difference between sewer and soil temperature.
Once the downstream temperature of the effluent entering the WWTP was denoted as TD, the following parameters were calculated:
∆t = (TD − TU): temperature change of the effluent between the downstream and the upstream point;
(TS − TD): the difference between the soil temperature (Ts) and the temperature of the effluent at the downstream point.
The linear correlation between these two quantities was then checked, and the correlation line equation was used to estimate the temperature TD for each day of the period.
2.3. Heat Exchange in the WWTP
In addition to the thermal exchanges within the sewer collector, thermal exchanges in the WWTP process sections need to be properly evaluated, and several contributions need to be considered. For each plant unit, the effects of energy exchanges across the external surface (i.e., the atmosphere and the walls), as well as of internal processes taking place (i.e., the effects of the mechanical aeration and the biochemical reactions), were assessed to evaluate the temperature variation of the mixed liquor. In the present study, the “Basin Temperature” calculation code was employed to calculate the net temperature change of wastewater in the WWTP [
14]. The computational code allows for steady-state calculations. The model represents a development of that of Sedory and Stenstrom [
19] and incorporates the heat transfer terms for biological processes of Makinia et al. [
20], introducing new functions to account for surface convection and heat of evaporation. The model has been validated through several scenario studies [
14].
The steady-state balance equation allows the calculation of the wastewater temperature in the plant units at equilibrium (T
w) as:
Qt = net heat exchange
ρw = density of water
cpw = specific heat of water
qw = wastewater flow rate
Tw = tank equilibrium temperature
TD = temperature of influent stream
Net heat transfer is the sum of various contributions according to the following equation:
Solar thermal radiation (Q
sr), biological reaction (Q
b), and power input (Q
p) terms are always positive and represent heat gains, while long wave thermal radiation (Q
lr), convection (Q
c), evaporation (Q
e), and tank wall conduction (Q
tw) terms can be gains or losses, with appropriate signs, depending on site-specific conditions. More information on the relationships used to estimate the quantities can be found in [
14].
The input data to the Basin Temperature code for calculating the temperature in the WWTP units are summarized in
Table 2.
The modeling allowed the calculation of the temperature inside the WWTP sections by referring again to the two defined cases based on the presence or absence of heat recovery systems in the sewer.
2.4. Effects on Biological Processes
The biological nitrogen removal rates were simulated by running the ASDM model in the BioWin software [
21]. The model accounts for 174 processes acting on 83 state variables, enabling the description of the typical chemical and biological processes occurring in WWTP processes [
22].
The virtual WWTP considered for the simulations was purposely designed for the treatment of the wastewater produced by the Fossolo district, applying classic WWTP design criteria [
13]. This choice is motivated by the need to fully calculate the effects of changes in sewer conditions on wastewater treatment processes. In centralized WWTPs, the mixing of several wastewater flows coming from other city districts would dilute such effects.
The main wastewater characteristics are shown in
Table 3.
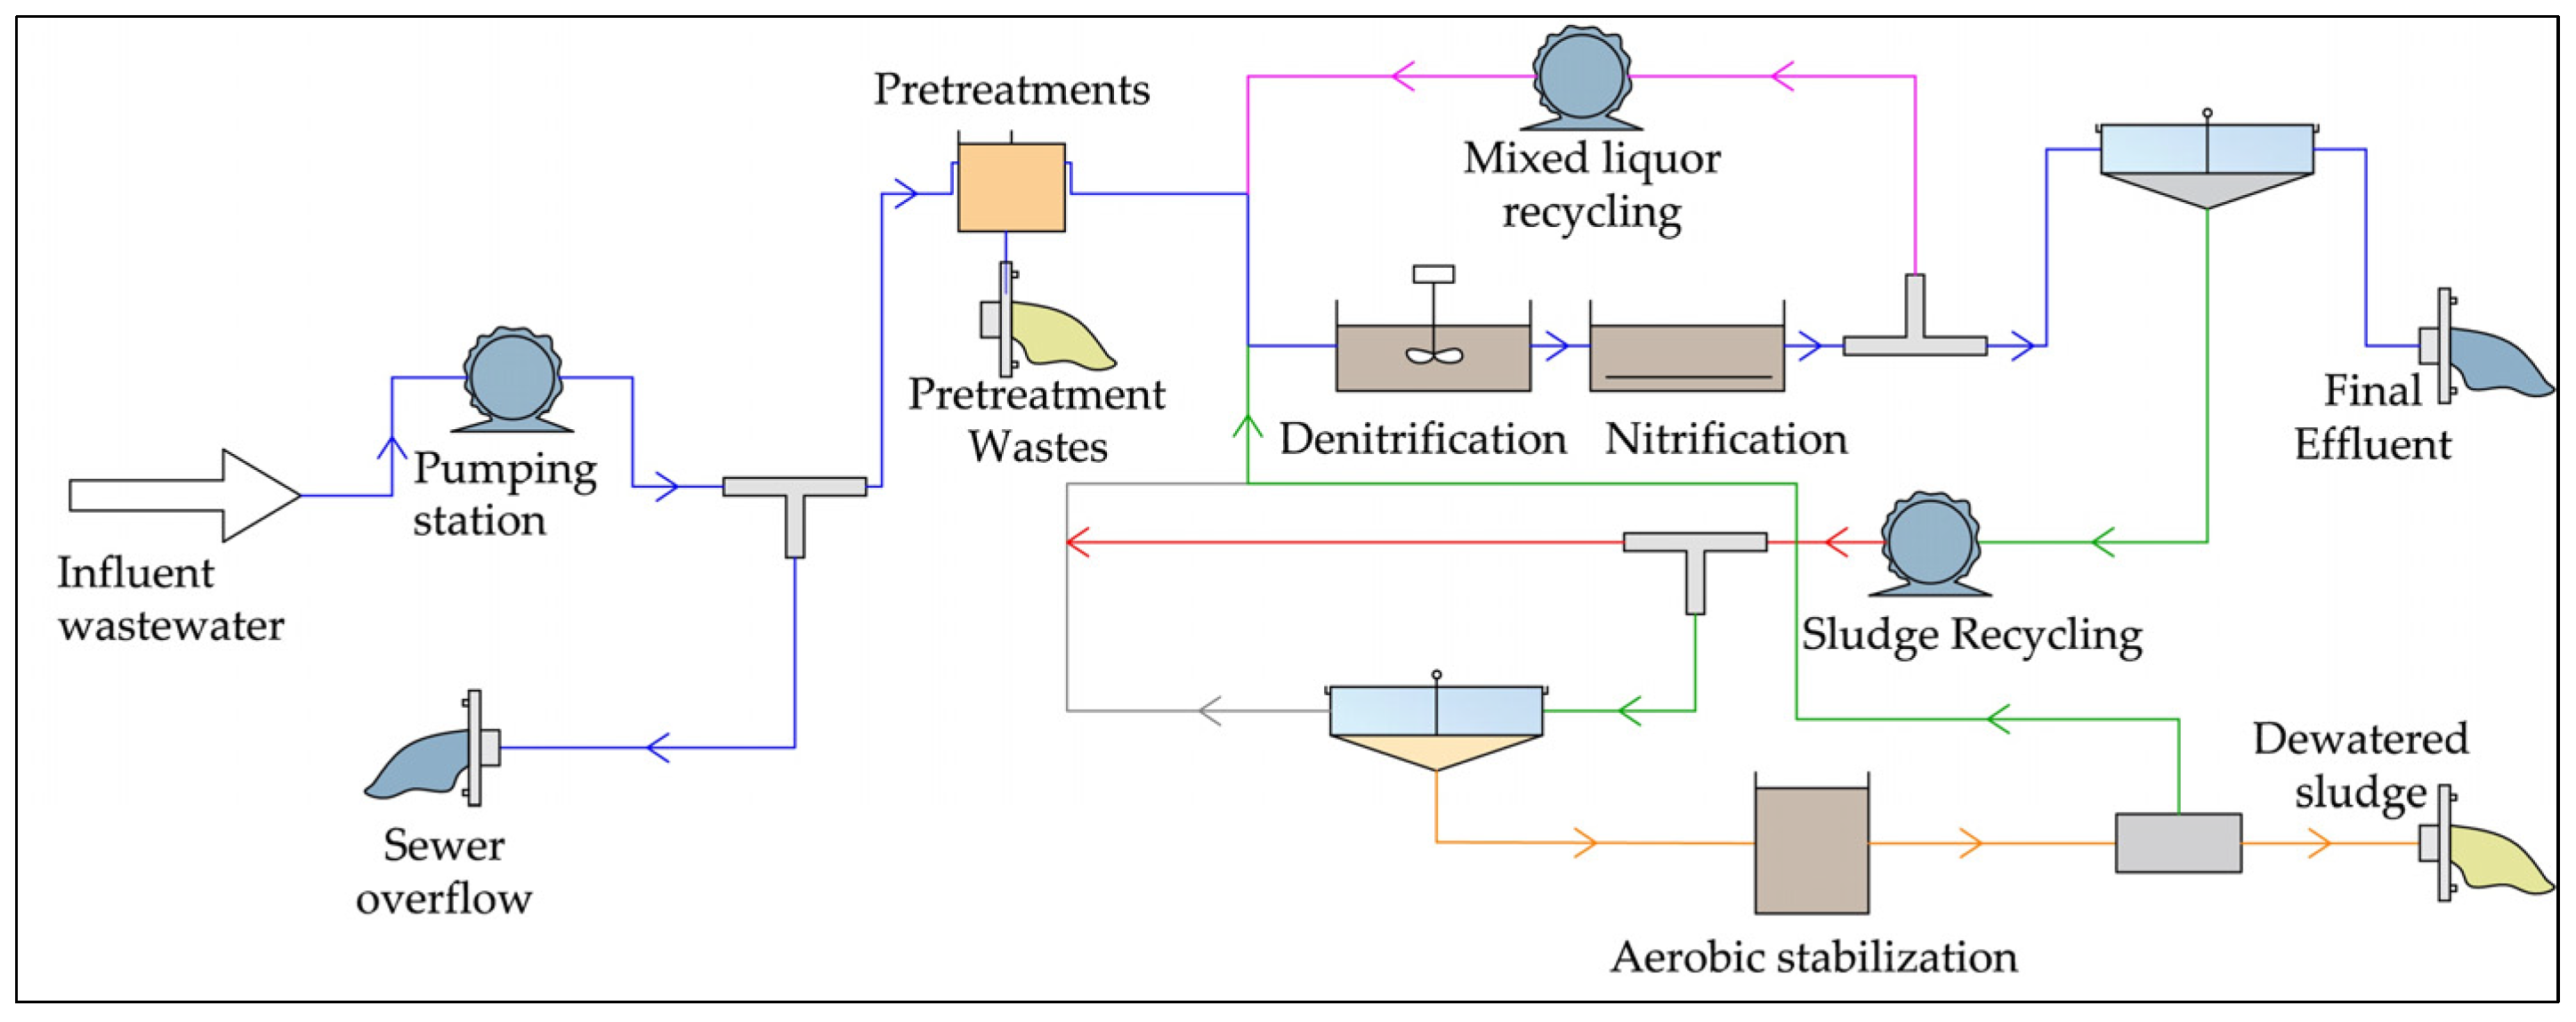
The layout of the WWTP, as depicted in
Figure 2, comprises a single treatment line utilizing a conventional activated sludge treatment cycle, including pre-denitrification and nitrification units, followed by sedimentation and discharge processes. The oxidation phase takes place within a tank equipped with fine bubble diffusers, and the aeration rate is controlled based on the dissolved oxygen concentration.
The configuration of the sludge treatment line aligns with the typical characteristics found in small and medium-sized Italian plants. It involves aerobic digestion followed by a dehydration stage, with the recirculation of the water extracted from the sludge back to the pre-denitrification tank.
A combined sewer overflow discharger (CSO), designed for releasing excess wastewater from the sewer network, is situated upstream of the plant. The total annual volume of wastewater supplied to the WWTP, excluding the overflowed volume from the CSO upstream of the WWTP, totals approximately 638,000 m3.
The WWTP operation was simulated for two scenarios, each characterized by different operating conditions and varying cellular residence time (SRT) values. Consequently, different SRT under aerobic conditions (SRTaer) were examined as follows:
- -
SRT = 15 days (SRTaer = 10 days);
- -
SRT = 20 days (SRTaer = 13 days);
- -
SRT = 25 days (SRTaer = 16 days).
These SRT changes were achieved by acting on the setting of the biological sludge overflow rate.
The temperature effects on the nitrification processes of the WWTP were analyzed based on (i) time trends in the concentration of ammonia, nitrous, nitrate, and total nitrogen at the WWTP outlet; (ii) time trends in the concentration of nitrifying biomass in the WWTP units differentiated into ammonium (AOB) and nitrite-oxidizing (NOB) bacteria.
All simulations were conducted using the default values of the kinetic parameters in Biowin. The values of the maximum specific growth rate and decay rates and the related Arrhenius temperature constant of AOB and NOB are reported in
Table 4.
3. Results and Discussion
Figure 3 shows the data recorded in the sewer during the monitoring campaign and the related curve obtained by nonlinear regression. The coefficient of determination is R
2 = 0.8853, while the resulting interpolating equation is shown in
Figure 3.
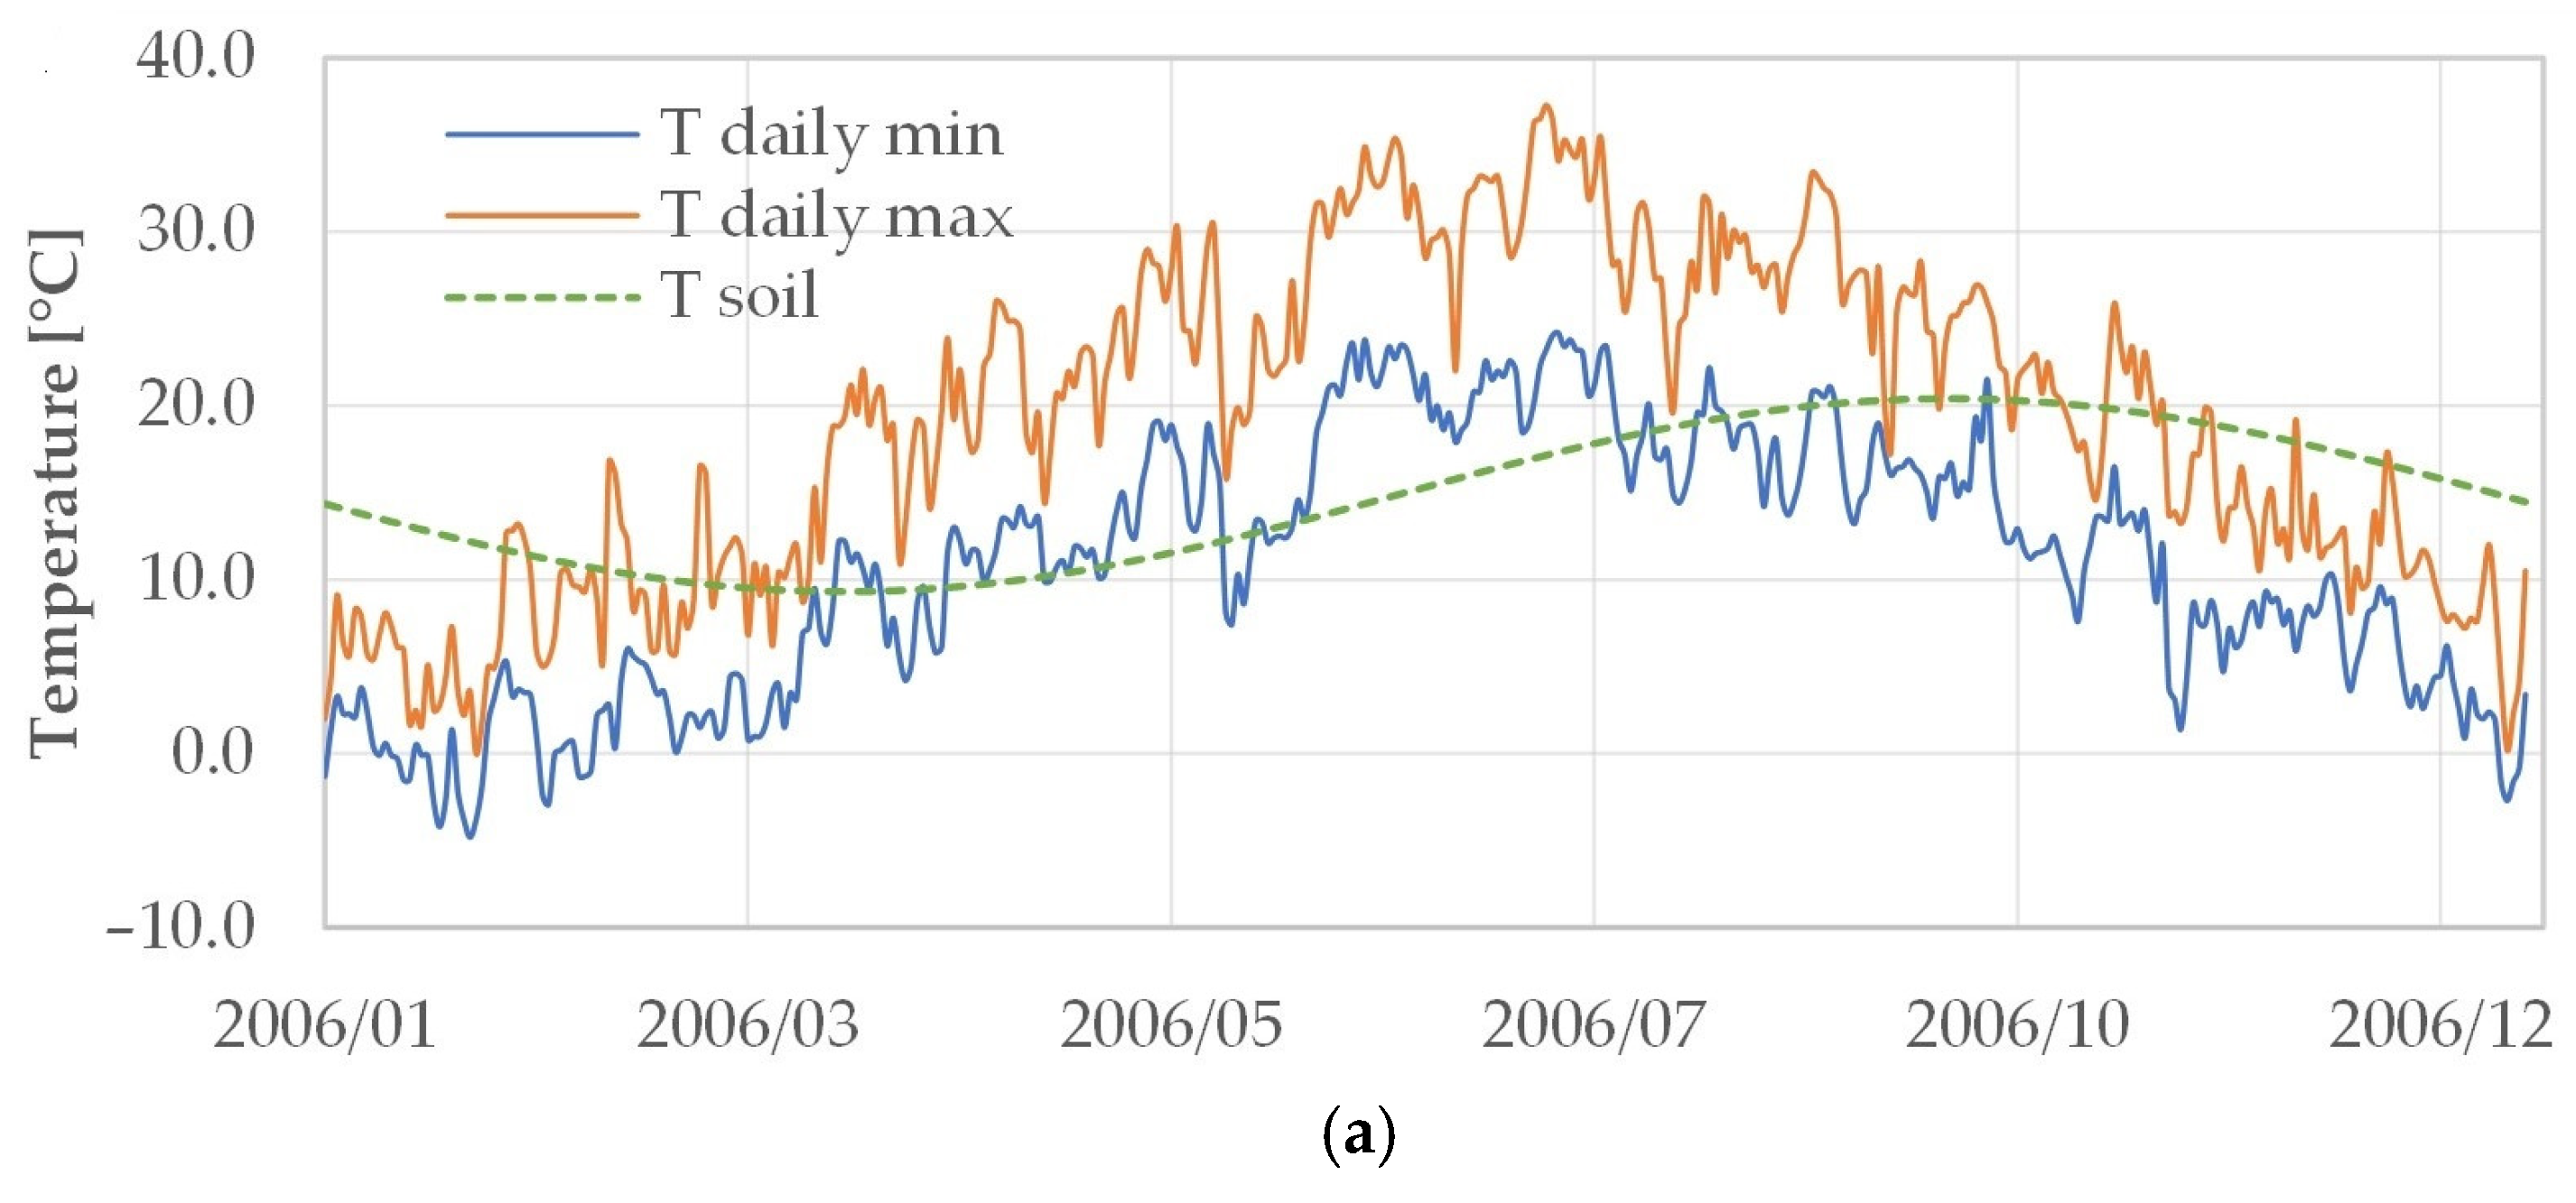
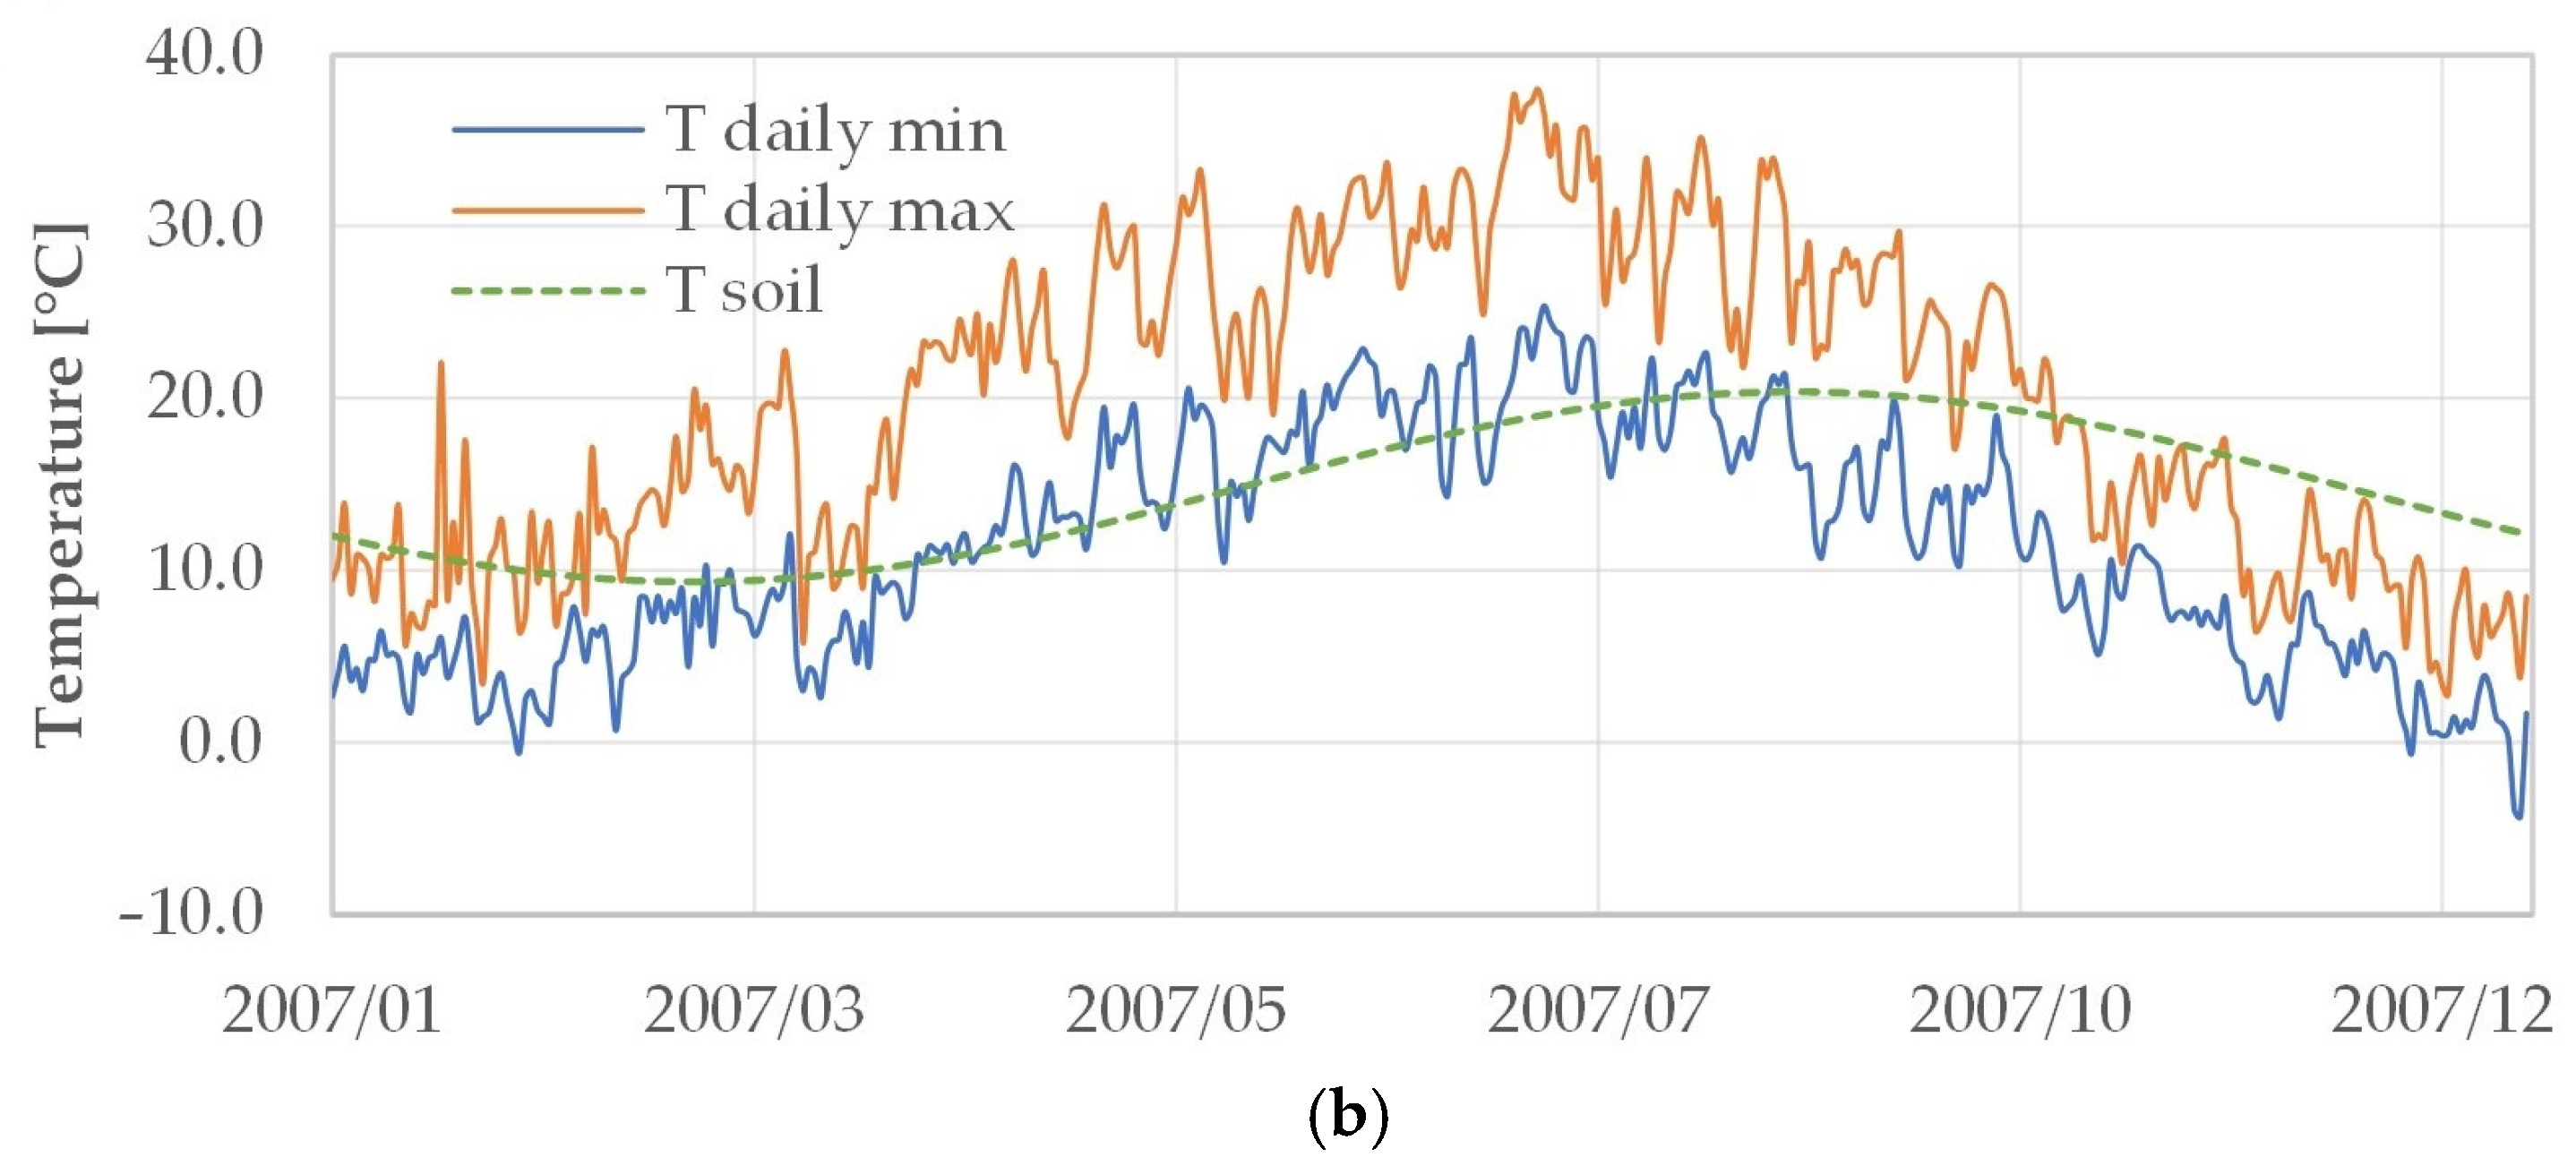
Figure 4 shows the annual trends of soil temperature (calculated by Kusuda’s method) and air temperature at the sewer pipe depth of 4.6 m for the years 2006 and 2007.
The maximum soil temperature value at the considered depth is reached in early autumn, while the lowest value falls in early spring.
Figure 5 depicts the interpolation of data obtained from the TEMPEST software, which simulated heat exchanges in the sewage collector. The graph illustrates the linear relationship between the upstream–downstream temperature drop in wastewater (
Y-axis) and the difference between soil and sewage temperatures (
X-axis). The linear interpolation of the points, supported by a high coefficient of determination, confirms the proportional relationship between these two quantities.
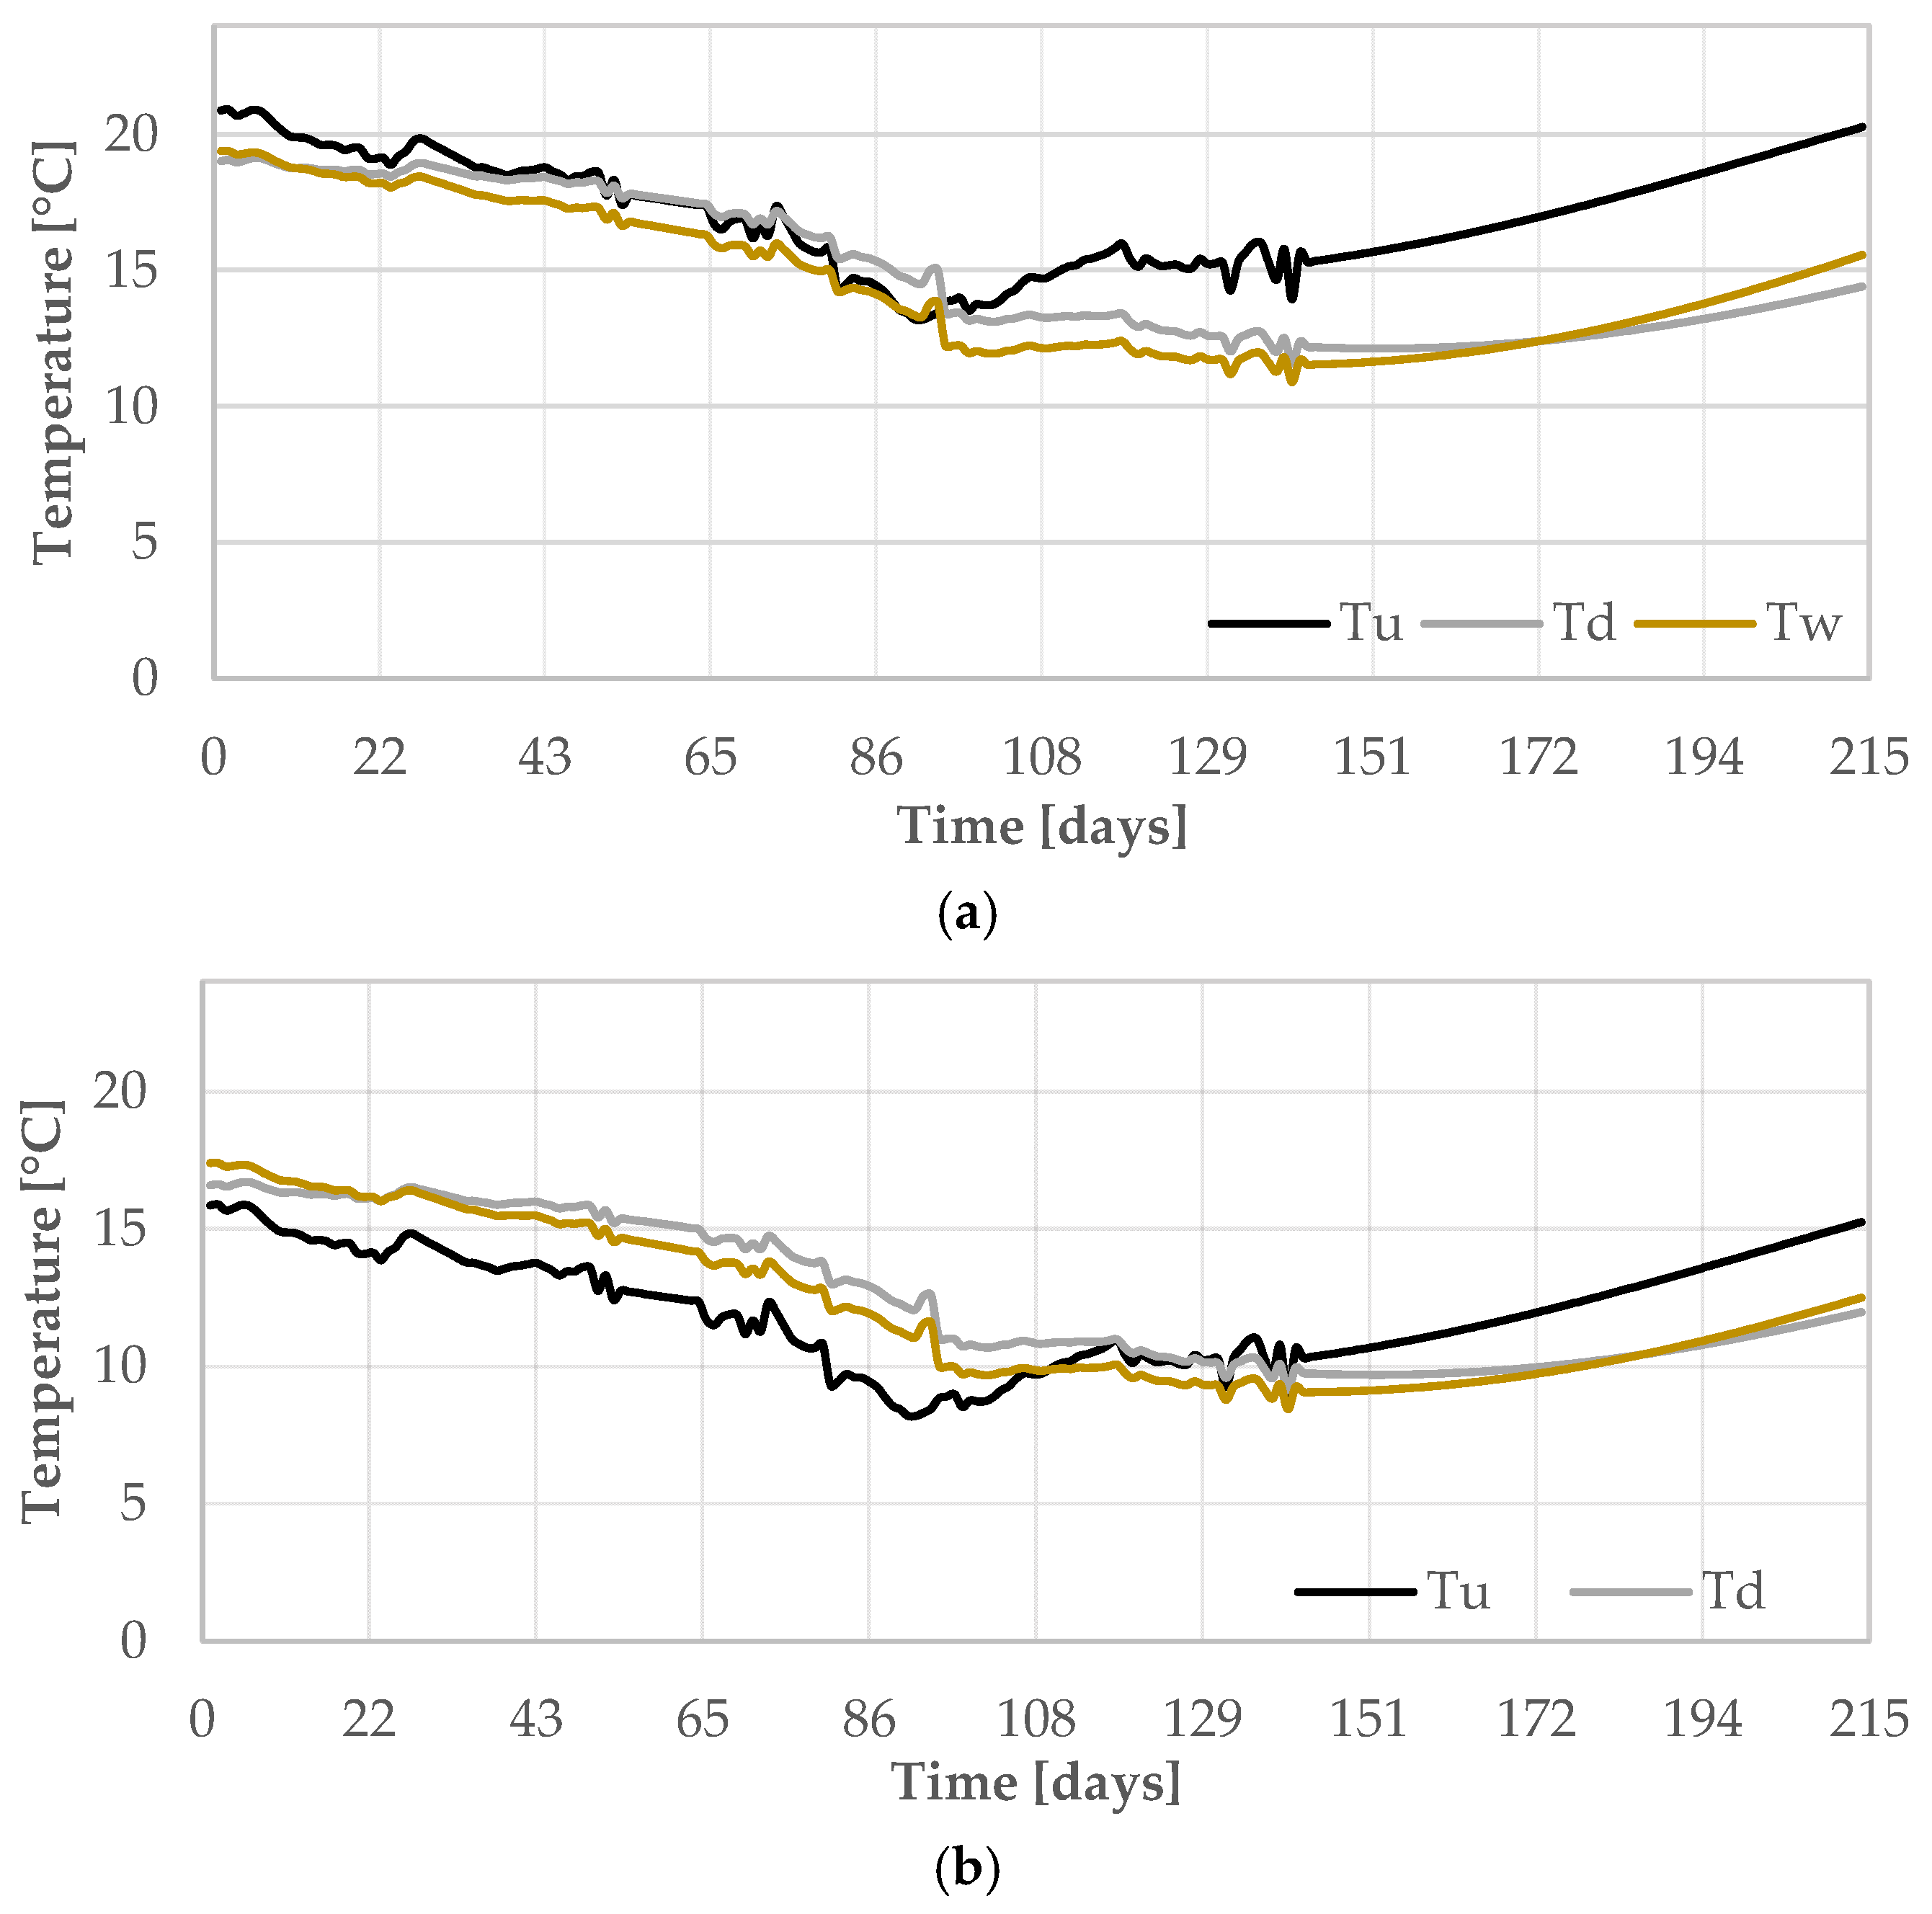
The temperature trend expected during the reference period, achieved through linear interpolation and related to the inlet section of the WWTP (T
d), is shown in
Figure 6, together with the temperature expected in the sewer (T
u) and the temperature of the WWTP effluent (T
w) calculated from Tu via “Basin Temperature” code. As shown in
Figure 6a, in the absence of heat recovery systems in the sewer, a significant variation in the wastewater temperature is expected, given the extended residence times available for heat exchange with the soil. In contrast, the heat exchange effect inside the WWTP treatment line is less significant. For almost the entire period, these exchanges result in a net wastewater cooling. Taking into account the T
u value in the first three months, substantially characterized by wastewater temperature drops, the mean value is 17.90 °C. In the same timeline, T
d and T
w assume an average value of 17.70 and 16.95 °C, respectively. In the following period when the heat exchanges with the surrounding structural assets cause a wastewater temperature rise, the related mean temperature values for T
u, T
d, and T
w stand at 16.46, 12.90, and 12.63 °C, respectively.
In
Figure 6b, the expected effects of the presence of heat recovery in the sewer are represented. Following the wastewater temperature drop in the heat exchangers, throughout the first three months, significant wastewater warming was verified due to the heat exchanges with the soil. The mean temperature values for T
u, T
d, and T
w are 12.90, 15.28, and 14.84 °C, respectively. In the sewer system, the wastewater temperature is well lower than the WWTP inlet point, which shows a fluid temperature recovery along the path. During the following months, starting from January, the wastewater temperature values in the collector are significantly lower, with a mean value of 11.46 °C; T
D and T
w are 10.48 and 10.03 °C, respectively. Effectively, some heat is still lost, but the amount is lower with respect to case 1.
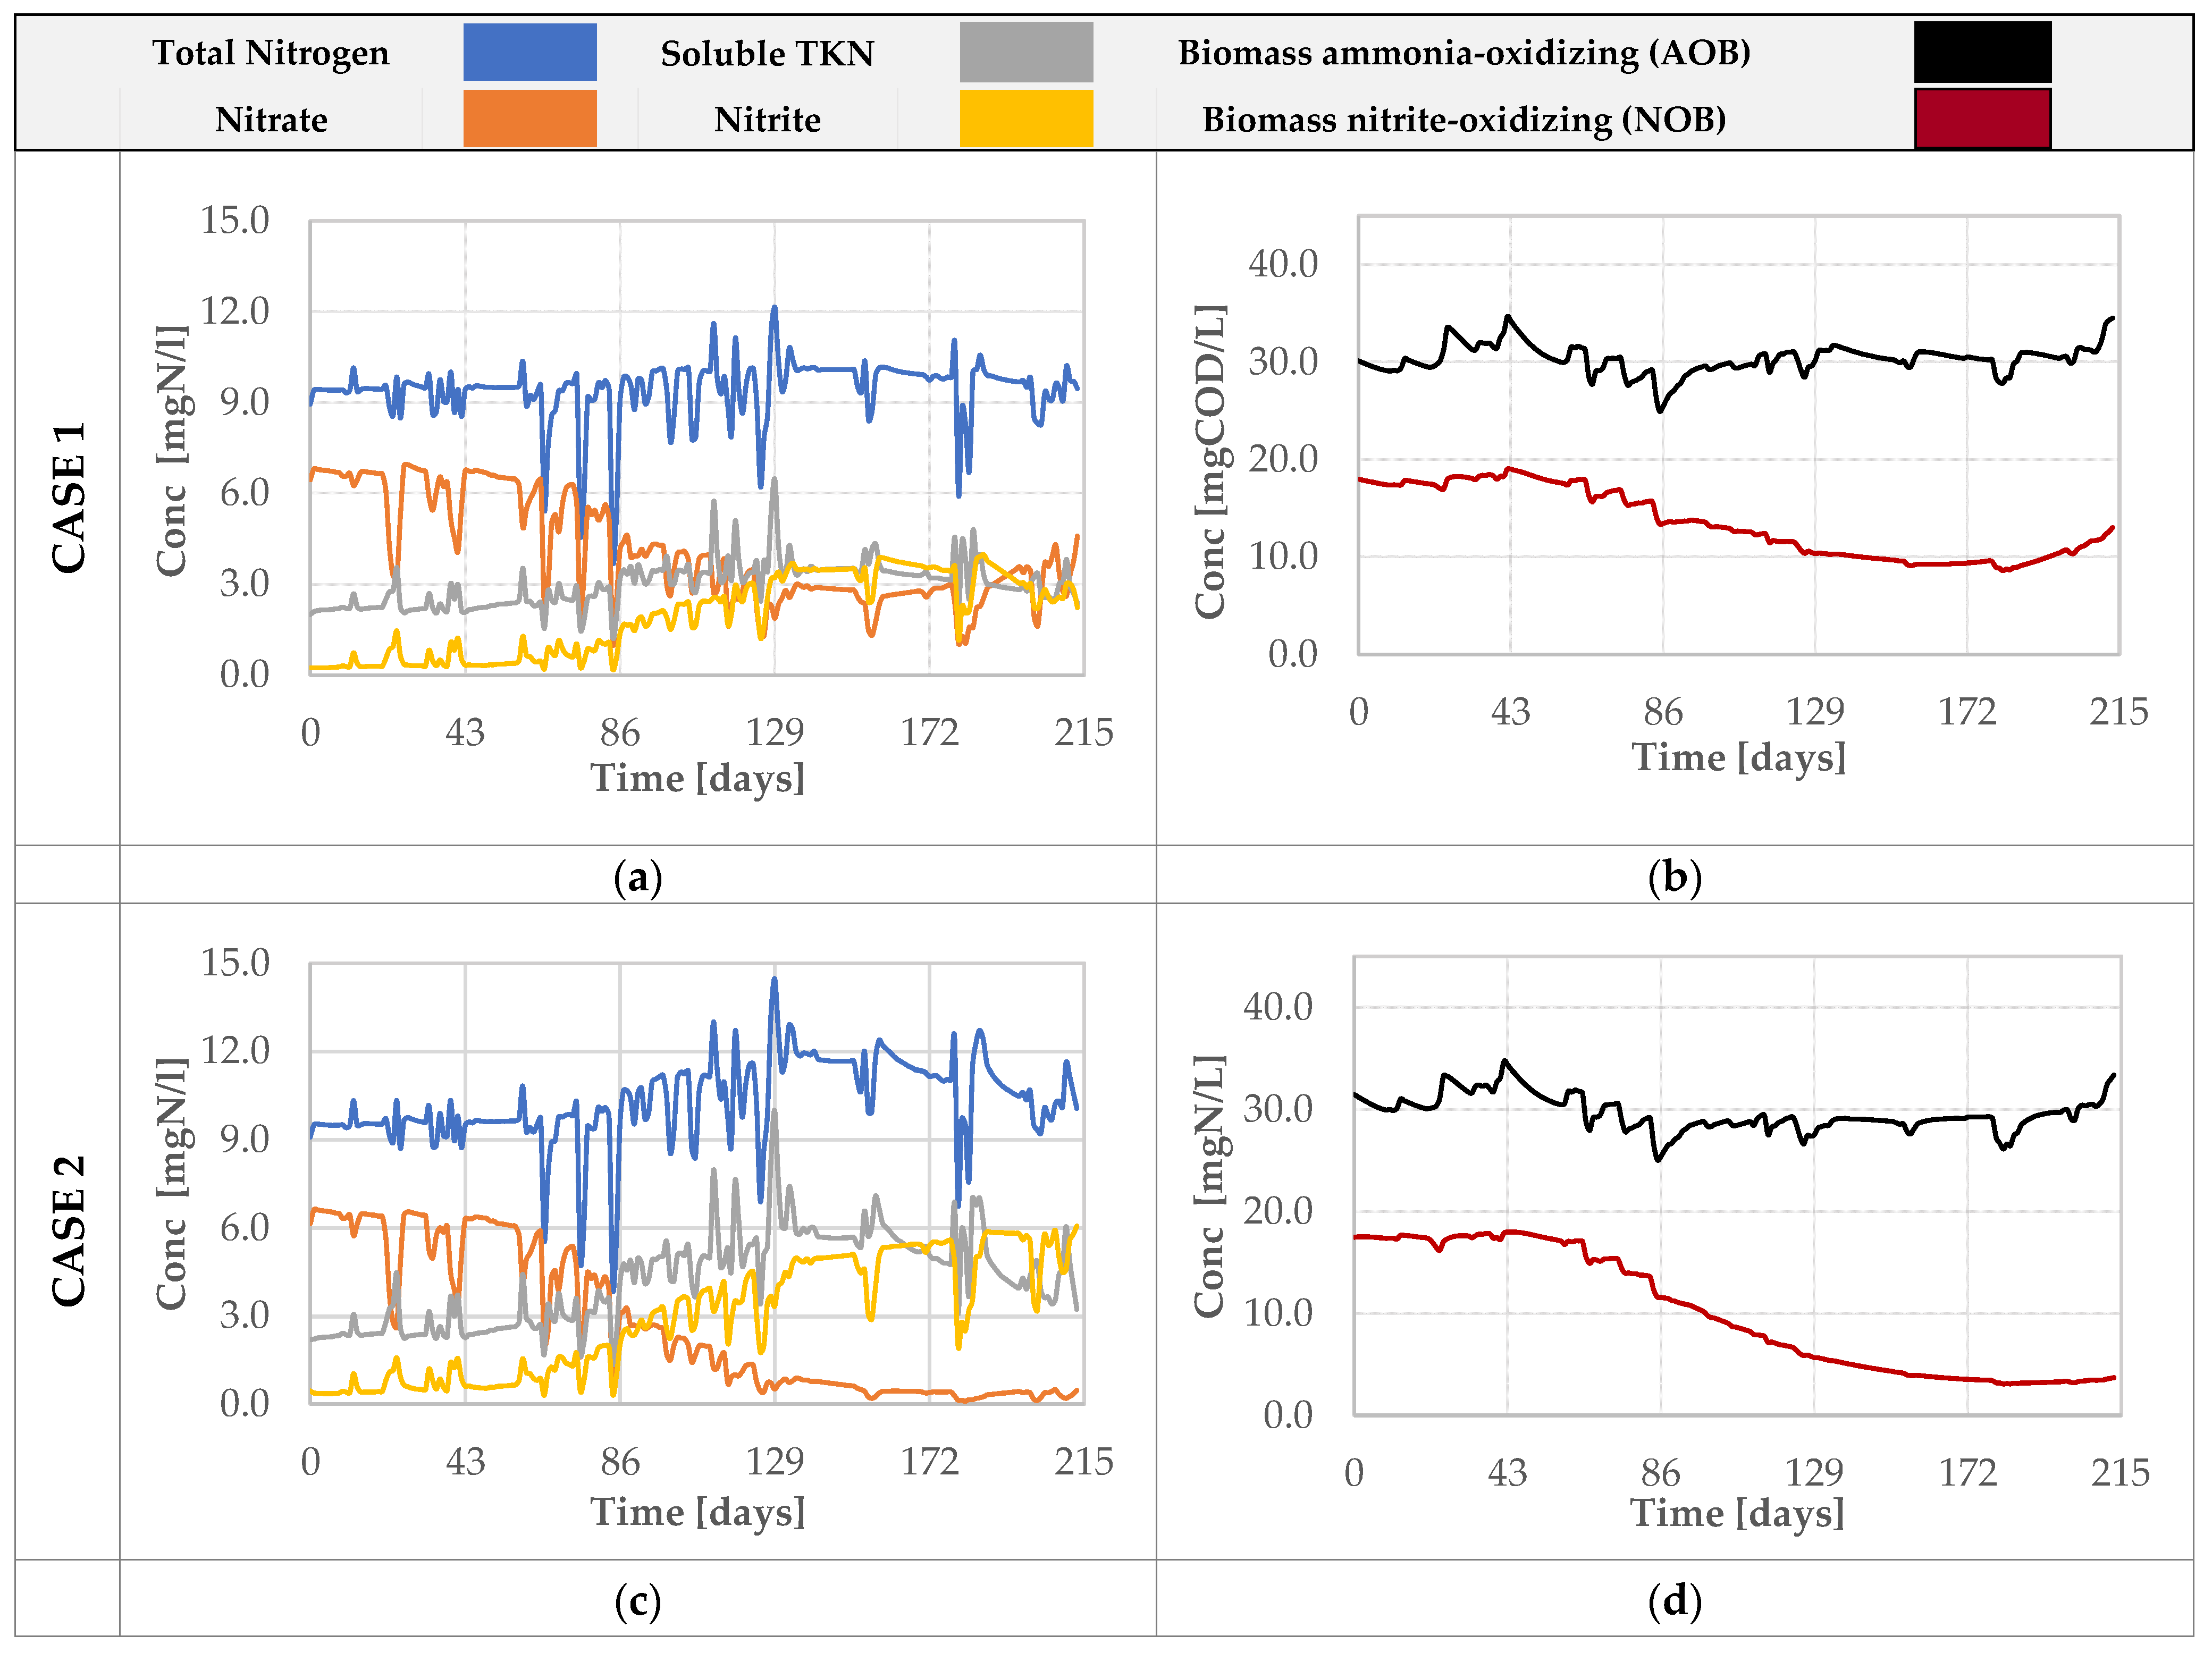
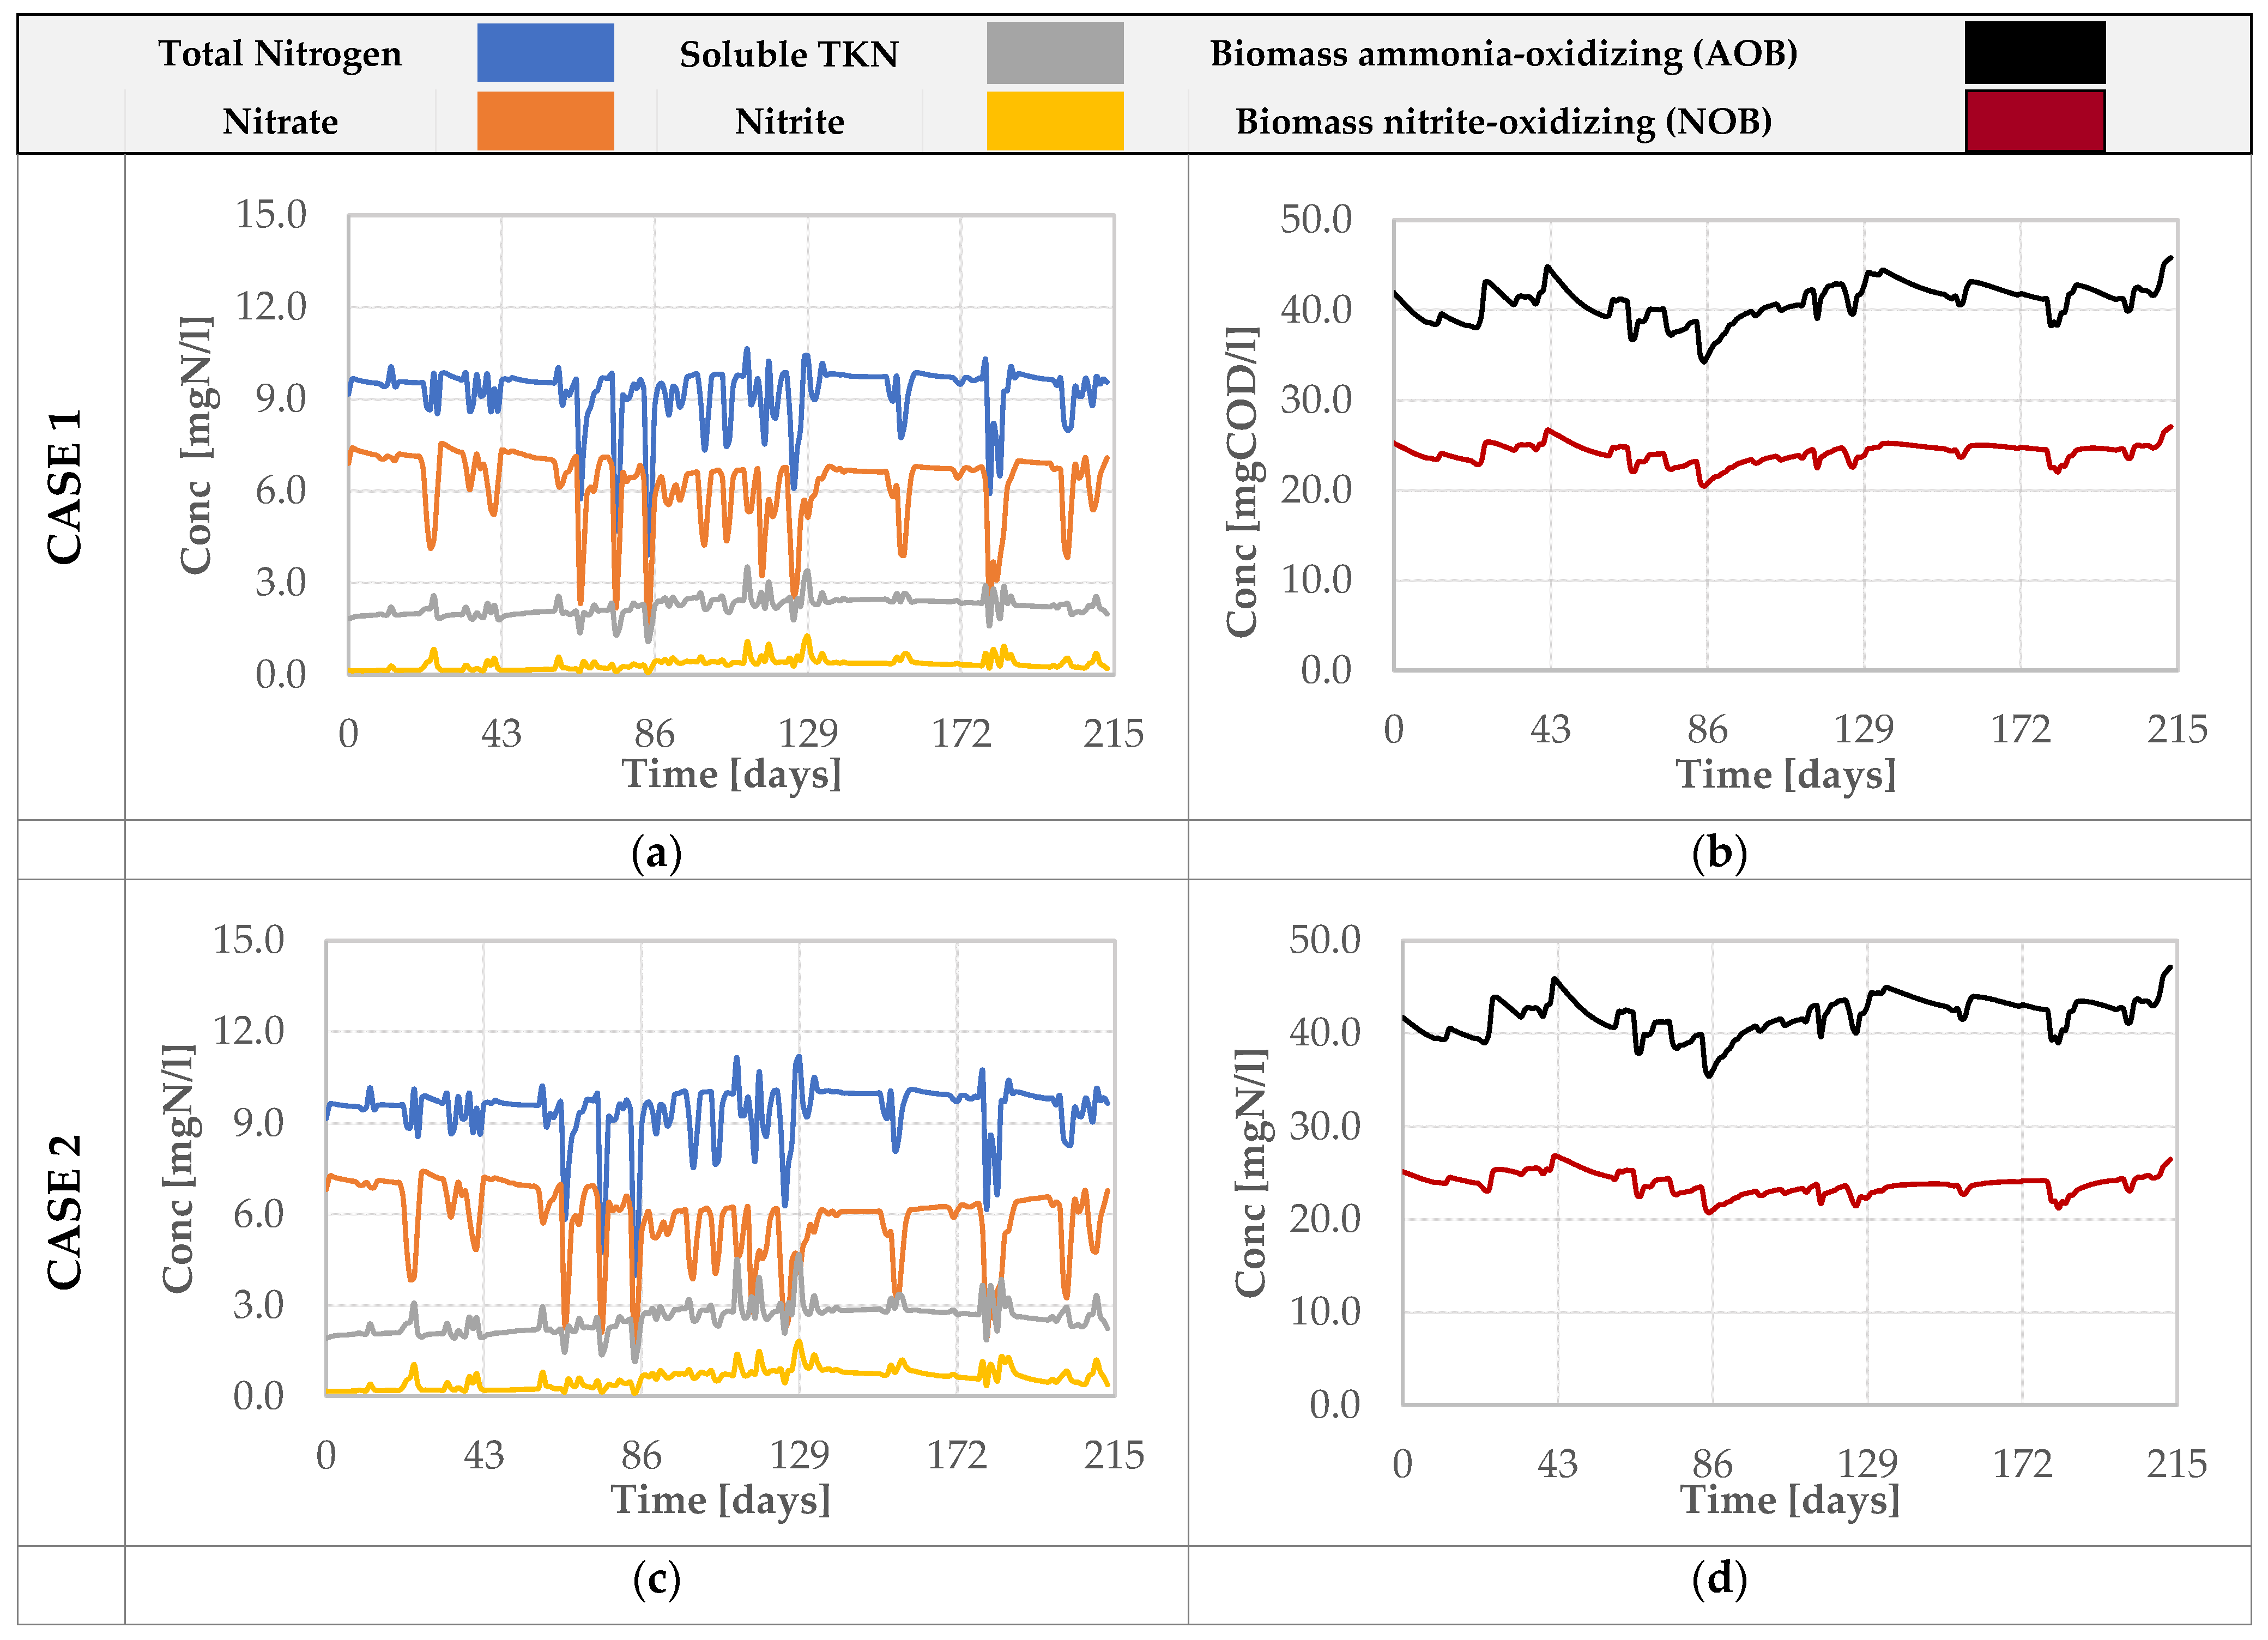
These temperature patterns cause an impact on the simulated WWTP nitrogen removal and on the AOB and NOB biomass concentration, as evidenced by
Figure 7,
Figure 8 and
Figure 9. In the absence of thermal recovery in the sewer and considering an SRT
aer of about 10 d (
Figure 7a), the modeling output returns an outlet concentration of all nitrogen forms stably below the legal standards for discharge (i.e., 15 mg TN/l in surface water bodies in sensitive areas) during the whole experimental period. The simulated pollutant concentrations at WWTP discharge point are 9.43 ± 1.01 mg/L for TN, 2.98 ± 0.73 mg/L for TKN, and 6.04 ± 1.08 mg/L for nitrate and nitrite. However, the NOB biomass concentration in the aerobic reactor declines during the cold season (i.e., starting from January), and consequently, a slight increase in TKN concentration is expected.
Comparing this trend with the graph in
Figure 7c, which refers to the case of thermal recovery in the sewer, it is possible to note how the effluent concentration of ammonia nitrogen is significantly affected by the reduced temperature, especially during the winter period.
The comparison of graphs in
Figure 7b,d reveals that, in case 2, the model predicts a progressive decline for both AOB and NOB biomasses, more marked for the latter group. This observed difference is primarily influenced by the default values of the kinetic parameters of both biomasses (
Table 4). Alternative assumptions regarding the Arrhenius temperature constants of the maximum specific growth rate could potentially result in a different pattern of AOB and NOB dynamics. For the purposes of this study, the main issue is the overall effect on the nitrification process while the specific impact of temperature on either group of nitrifiers is not so relevant and, thus, it was not further investigated.
As a direct consequence of the lower autotrophic biomass concentration and the decline of reaction kinetic rates due to the wastewater temperature drop, a higher increase in soluble TKN is expected (
Figure 7c). At the same time, the greater drop in NOB concentration in the coldest months leads to a nitrite concentration increase, while nitrate declines. These trends imply a significant increase in TN discharge during winter months for case 2, with some daily values close to the allowed discharge limit. Average inorganic and organic nitrogen concentrations of the treated effluent are 10.29 ± 1.42, 5.65 ± 1.16, 4.23 ± 1.56 mg/L, and 2.98 ± 0.73 mg/L for TN, nitrate plus nitrite nitrogen, and TKN, respectively. Considering the inlet TKN concentration (i.e., 46.0 mg/L) and the averaged effluent concentration, the verified removal rates are 93.5% and 90.8% for Cases 1 and 2, respectively.
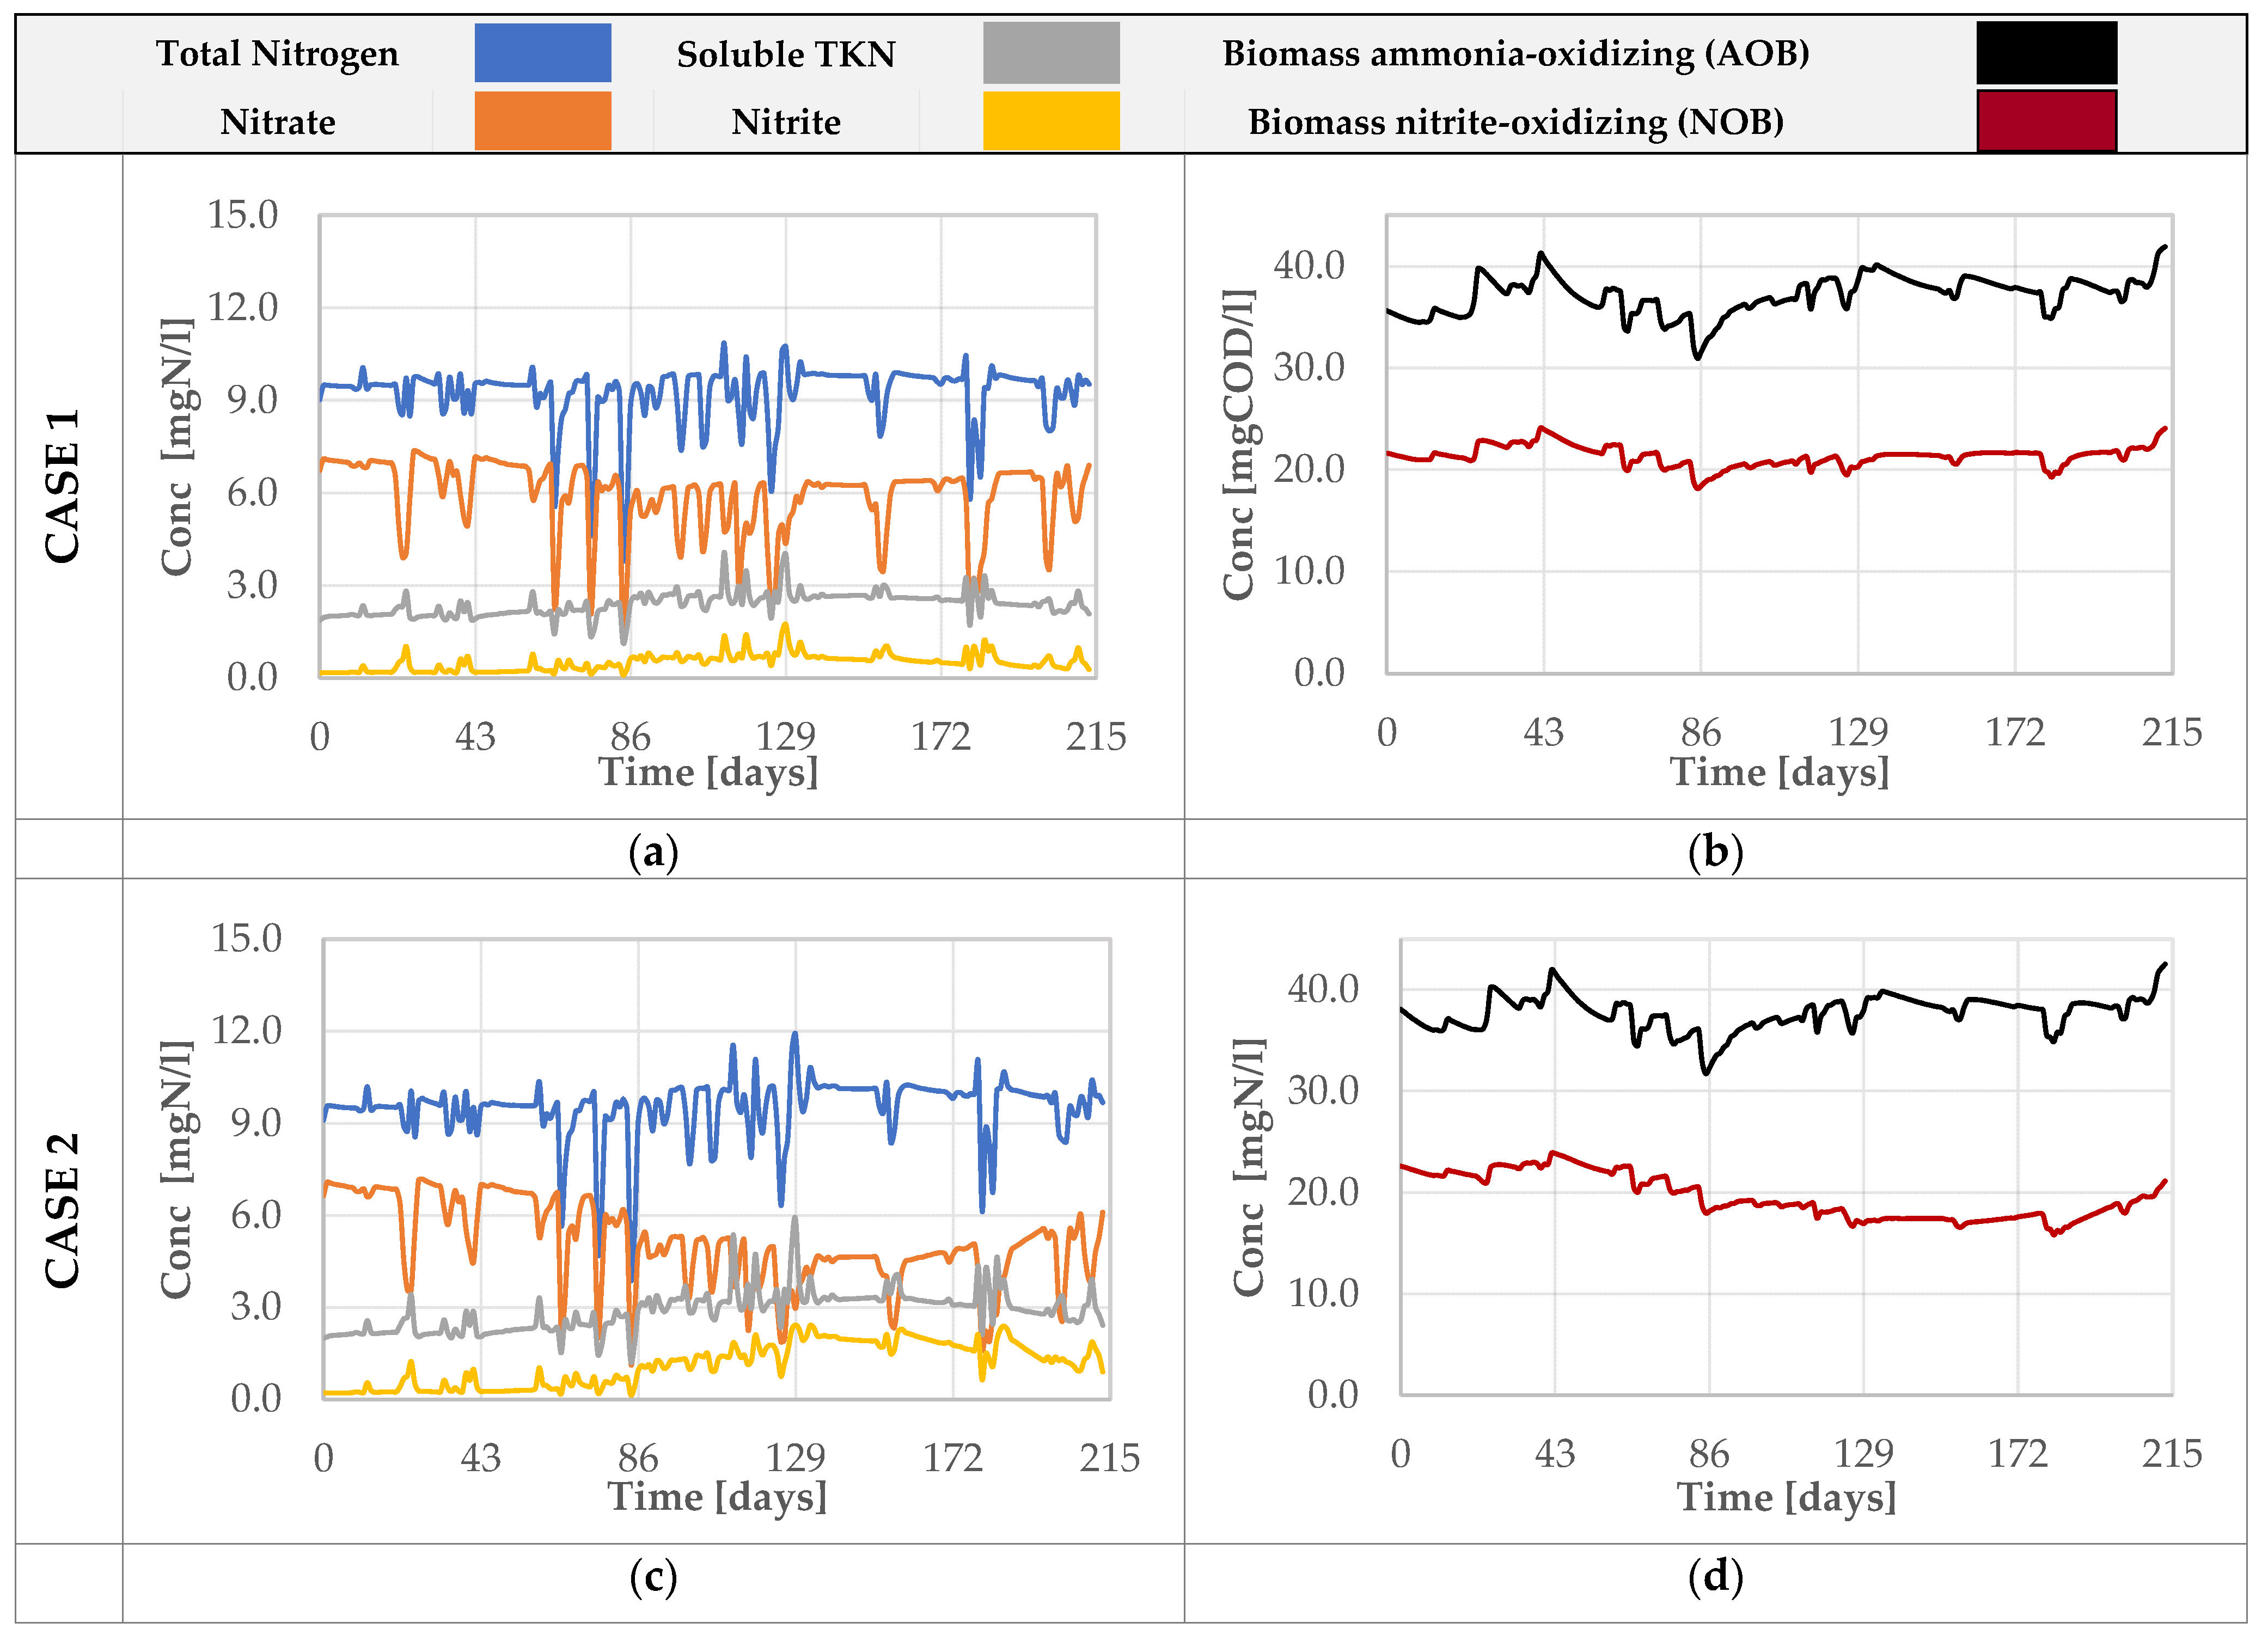
Further WWTP simulations raising the SRT
aer to about 13 days again were performed to evaluate the effects of potential operational measures to be applied to face the effects of temperature variations. The results of such modifications are shown in
Figure 8, revealing the same trends of the previous case, although significantly reduced. The comparison of
Figure 8a,c shows only a slight increase in ammonia nitrogen concentration in the case of thermal recovery in the sewer. The time-averaged concentration of total, inorganic, and organic nitrogen are 9.25 ± 0.95 mg/L TN, 6.44 ± 1.07 mg/L nitrate plus nitrite nitrogen, and 2.39 ± 0.39 TKN in the option of no thermal recovery systems (Case 1), whereas for Case 2, the same chemical components amount to 9.50 ± 0.99 mg/L TN, 6.22 ± 1.09 mg/L nitrate plus nitrite nitrogen, and 2.85 ± 0.67 mg/L TKN. The comparison of the removal efficiency of soluble TKN shows a negligible drop in the removal rates from 99.2% to 98.6% in the presence of thermal recovery systems implemented into the sewer network. In both cases, such percentages are significantly higher at an SRT
aer of 13 days with respect to 10 days.
Moreover, when considering an even higher SRT value, set at 16 days, no significant effect of the lower temperatures on nitrification processes is visible in
Figure 9b,d.
The results indicate that with an SRTaer of less than 13 days, commonly employed in denitrification–nitrification-based WWTPs, implementing a thermal recovery system in the sewer requires caution. Conversely, in the Italian climate, for extended or extensive aeration WWTPs with SRTs typically ranging between 20 and 30 days corresponding to SRTaer values exceeding 13 days, heat recovery should pose fewer challenges for WWTP performance. The potential effects of a wastewater temperature drop on the nitrification process need to be evaluated on a case-by-case basis. If such effects are found to be significant, interventions to increase the SRT of the aerobic stage might be considered to be coupled to a heat recovery practice. This target can be achieved, for example, by increasing aeration volumes through the construction of new process tanks or by expanding the volume of existing ones. Alternatively, for the same total treatment volume, an increase in aerobic treatment volumes can be obtained at the expense of those reserved for the anoxic treatment phase. Such a modification, however, requires careful evaluation of the effects on the treatment process. Another way to increase the SRTaer, avoiding any interventions on tank volumes, is to increase the biomass concentration by reducing the waste sludge flow. This option requires a preliminary evaluation to avoid the risk of significantly worsening sludge settling and overloading the secondary settlers, with possible biological sludge overflowing with the increase in the effluent flow rate, i.e., during rainy days.
4. Conclusions
This paper aimed to investigate the potential effects on the process performance of wastewater treatment plants (WWTPs) resulting from the implementation of heat recovery practices in sewer networks. Using a real sewer network servicing a residential area in Bologna, such as the Fossolo sewage network, and incorporating on-field monitoring data, we pursued this objective. Initially, hydraulic models were applied to estimate the incoming flow rates to the treatment plant facilities. Subsequent thermal modeling allowed for the calculation of temperatures in the final sewer section, representing the inlet section of the WWTP. With heat recovery systems in the sewer networks, the monthly average temperature reaches a minimum value of 10.8 °C in February, while without heat recovery, the minimum is 16.6 °C.
To assess the impact on treatment process units, a virtual WWTP was considered, and a dedicated model based on classic design criteria (including pre-denitrification and nitrification units followed by sedimentation, aerobic digestion of sludge, and a dehydration stage) was defined to simulate the processes in this plant. The temperature in the biological reactor and its influence on the nitrification process were then calculated. Our findings indicate that caution is advised when implementing thermal recovery systems in sewer networks for WWTPs with sludge residence times (SRTaer) of less than 13 days, common in many denitrification–nitrification WWTPs in Italy. The study highlights that biological processes may be inhibited due to temperature drops, particularly during the cold season, leading to adverse effects on nitrogen compound removal rates.
Conversely, in the typical Italian climate, for WWTPs with SRTaer values exceeding 13 days, no significant impacts on nitrification process performance are expected. This insight underscores the importance of considering specific operational parameters, such as SRTaer, when evaluating the feasibility of heat recovery systems in sewer networks for preserving WWTP nitrogen removal efficiency.


 ,
, 


