Article

Experimental Study on the Sedimentation Performance of an Arc-Plate Linear Sedimentation Tank

College of Water Resources and Civil Engineering, China Agricultural University, Beijing 100083, China
*
Author to whom correspondence should be addressed.
Water 2024, 16(8), 1075; https://doi.org/10.3390/w16081075
Submission received: 4 March 2024 / Revised: 6 April 2024 / Accepted: 8 April 2024 / Published: 9 April 2024

Abstract

:
To examine the influence of plate shapes and quantities on the sedimentation performance of a linear sedimentation tank, experimental research was conducted using tanks featuring five distinct plate structures. The findings reveal that when subjected to an inflow rate ranging from 60 to 100 m3/h and with median particle sizes of 571.110 μm and 162.254 μm, for sediment particles in water containing sediment, the flow field distribution in the arc-plate sedimentation tank facilitates the effective settling of sediment particles. Comparative analyses indicate that incorporating eight arc plates in the sedimentation tank, as opposed to an equal number of inclined plates, results in a notable reduction in surface sediment concentration within the plate region, ranging from approximately 8 to 34%. Additionally, the mass percentage of sediment particles with sizes less than 0.05 mm at the tank bottom increases by about 5–7%. Moreover, in comparison to tanks lacking plates and those equipped with four arc plates, the surface sediment concentration experiences a significant decrease, ranging from approximately 33% to 60% and 18% to 44%, respectively. Concurrently, the mass percentage of sediment particles with sizes less than 0.05 mm shows an increase of about 25–32% and 10–20%. The arc-plate sedimentation tank exhibits superior sedimentation efficiency with an inflow rate of 60 m3/h and the installation of eight arc plates. Additionally, the study concludes that increasing the number of plates and reducing the inflow rate enhance sediment settling. The research findings offer valuable insights for the design and advancement of sedimentation tanks.

1. Introduction

Presently, the scarcity of water resources is increasingly severe and agricultural water accounts for a significant proportion of the water resources in China [1,2,3]. Therefore, water-saving irrigation technology is extensively employed [4,5]. However, due to the high sediment content in diversion irrigation water, blockage and wear [6,7,8,9,10] are common issues faced by micro-irrigation system equipment. To address this problem effectively, sedimentation tanks are frequently installed at the beginning of the irrigation system for the sedimentation treatment of water containing sand [11]. The fundamental working principle of sedimentation tanks revolves around the separation of water and sediment through gravitational and hydraulic methods. Among these methods, the linear sedimentation tank is the most prevalent, when gravitational force is the primary mechanism [12]. Despite its advantages in terms of simplicity in structure, reliable operation, and ease of construction, this type of sedimentation tank is characterized by a lower sedimentation efficiency and the inadequate removal of fine particle sediments [13,14]. Consequently, this may lead to substantial wear on downstream equipment and a reduced lifespan. Furthermore, to attain optimal sedimentation performance, linear sedimentation tanks often demand a considerable footprint. To improve the sedimentation efficiency and enhance its capabilities of removing fine particles in linear sedimentation tanks, there is an urgent need for the optimization of their structural design.
Globally, scholars have undertaken numerous studies focusing on the design and parameter optimization of linear sedimentation tanks. The integration of plates, inclined pipes, and fins in these tanks is pivotal for enhancing sediment settling efficiency and facilitating the removal of fine particle sediments. Shahrokhi et al. [15,16,17,18] conducted a series of experimental and numerical simulation studies on the arrangement parameters of baffles at the inlet of sedimentation tanks. These studies aimed to determine the optimal positions, heights, angles, and quantities of baffles for improved tank performance. The optimal parameters for baffle arrangement were investigated by Asgharzadeh et al. [19], who examined the single baffle arrangement and the double baffle position at various heights. Gao et al. [20,21,22] employed the CFD numerical simulation method to investigate various baffle structures in sedimentation tanks and conducted a comparative analysis on the impact of three turbulence models on flow velocity and turbulence. Nguyen et al. [23] investigated the impact of varying numbers of inclined plates under different flow conditions, demonstrating that an increase in the number of inclined plates can enhance the effective settling area of the sedimentation tank and improve sediment settling efficiency. Hartloper et al. [24] and He and Marsalek [25] provided experimental and numerical evidence that adding fins to the sidewalls can alter the vortex and circulation zones, thereby enhancing sediment settling efficiency. In one study [26], orthogonal experiments were conducted on fin-type inclined-plate sedimentation tanks to explore the influence of the arrangement of the fin-type inclined plate structure on sediment removal efficiency. Tao et al. [27,28,29], relying on numerical simulations, studied the internal flow field of separating fins and the water–sediment separation efficiency of separating fins under different fin spacings. Wang et al. [30,31] used ADV and density bottle methods to investigate the water flow field characteristics and sediment movement trajectories inside slanted tube sedimentation tanks. Li et al. [32] conducted experimental studies on the sedimentation characteristics of a novel cross-flow sedimentation tank, establishing an equation for the movement of sediment on inclined plates. The addition of plates to linear sedimentation tanks can recalibrate the flow field distribution in the tank, thereby improving hydraulic conditions, increasing settling area, and enhancing sediment removal rates. However, the existing research on plate structures in linear sedimentation tanks is relatively limited and often centers on planar thin plate structures, with insufficient exploration of various plate shapes and arrangement parameters. Consequently, this paper introduces an innovative approach by proposing an arc-plate linear sedimentation tank, incorporating arc-shaped plates within the tank. A comparative analysis is conducted, contrasting this design with inclined plates (flat plates placed at an angle). The study systematically examines the impacts of the distinct shapes and quantities of plate structures on flow characteristics, sediment concentration, sediment removal rates, and the distribution of sediment particle sizes in the sedimentation tank. The innovative arc-plate sedimentation tank design is proposed, demonstrating superior sedimentation efficiency compared to traditional inclined-plate sedimentation tanks. The objective is to offer valuable insights for the design and advancement of sedimentation tank structures.

2. Materials and Methods

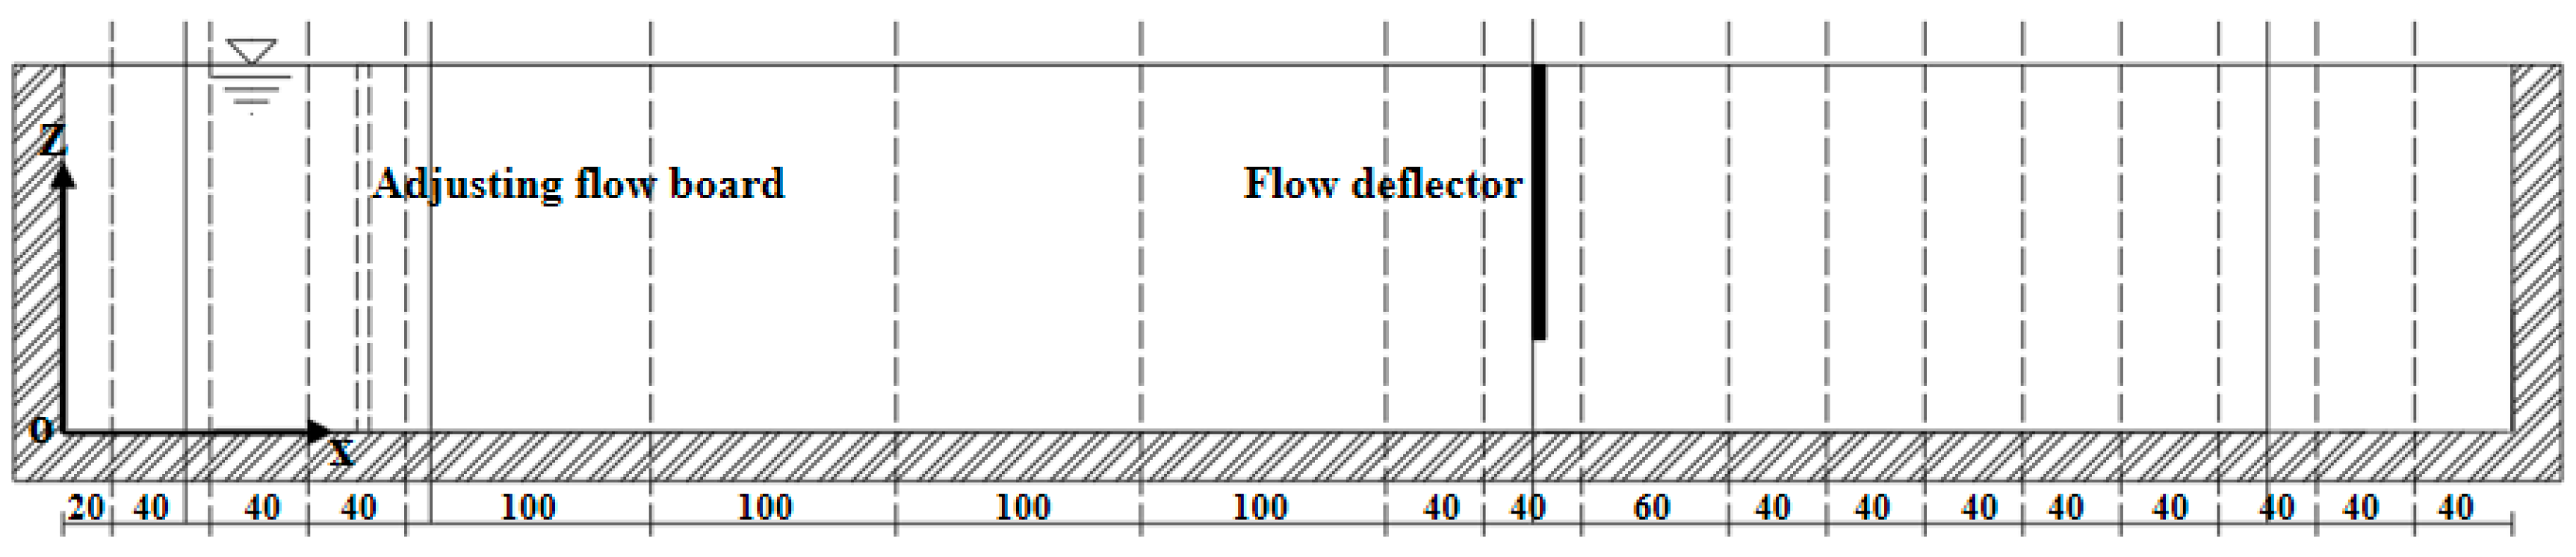
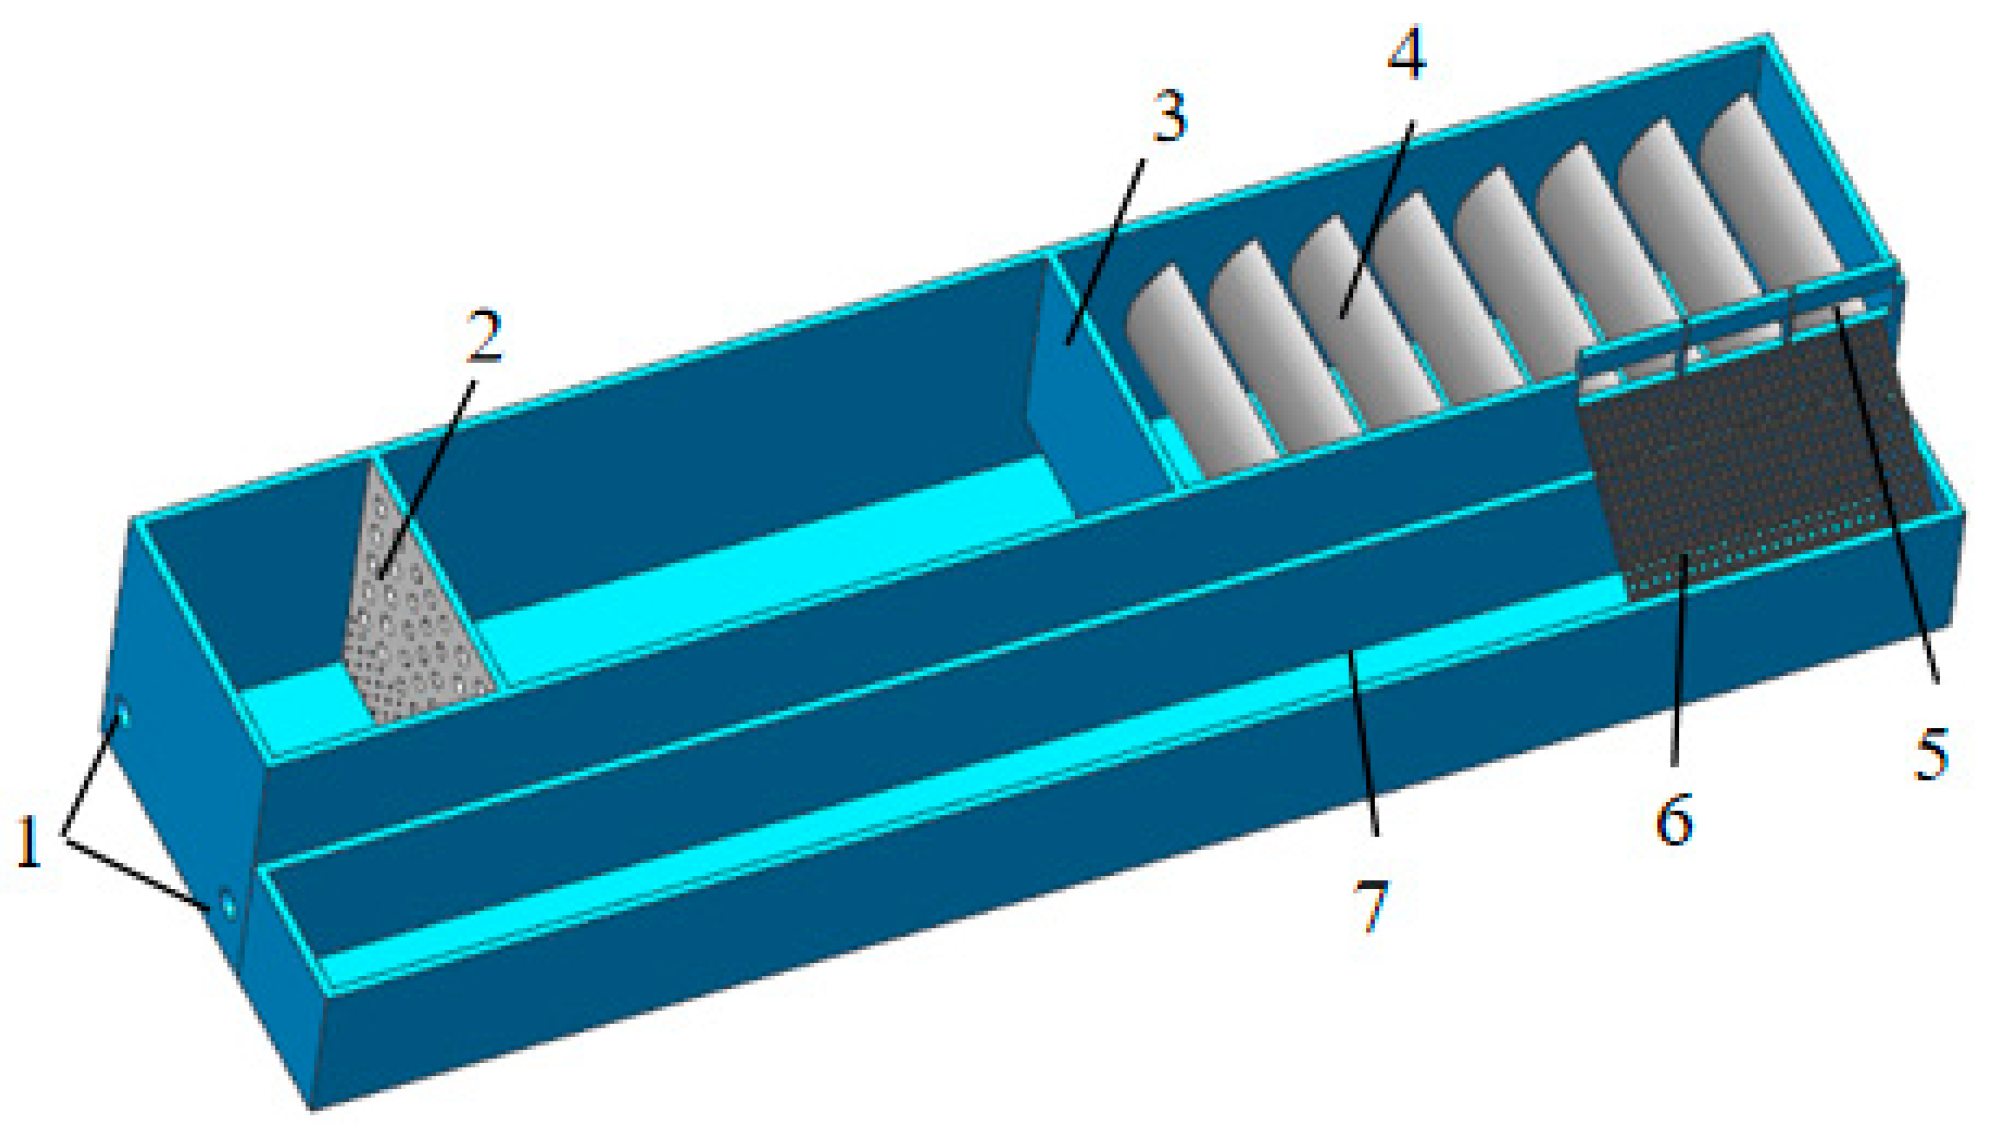
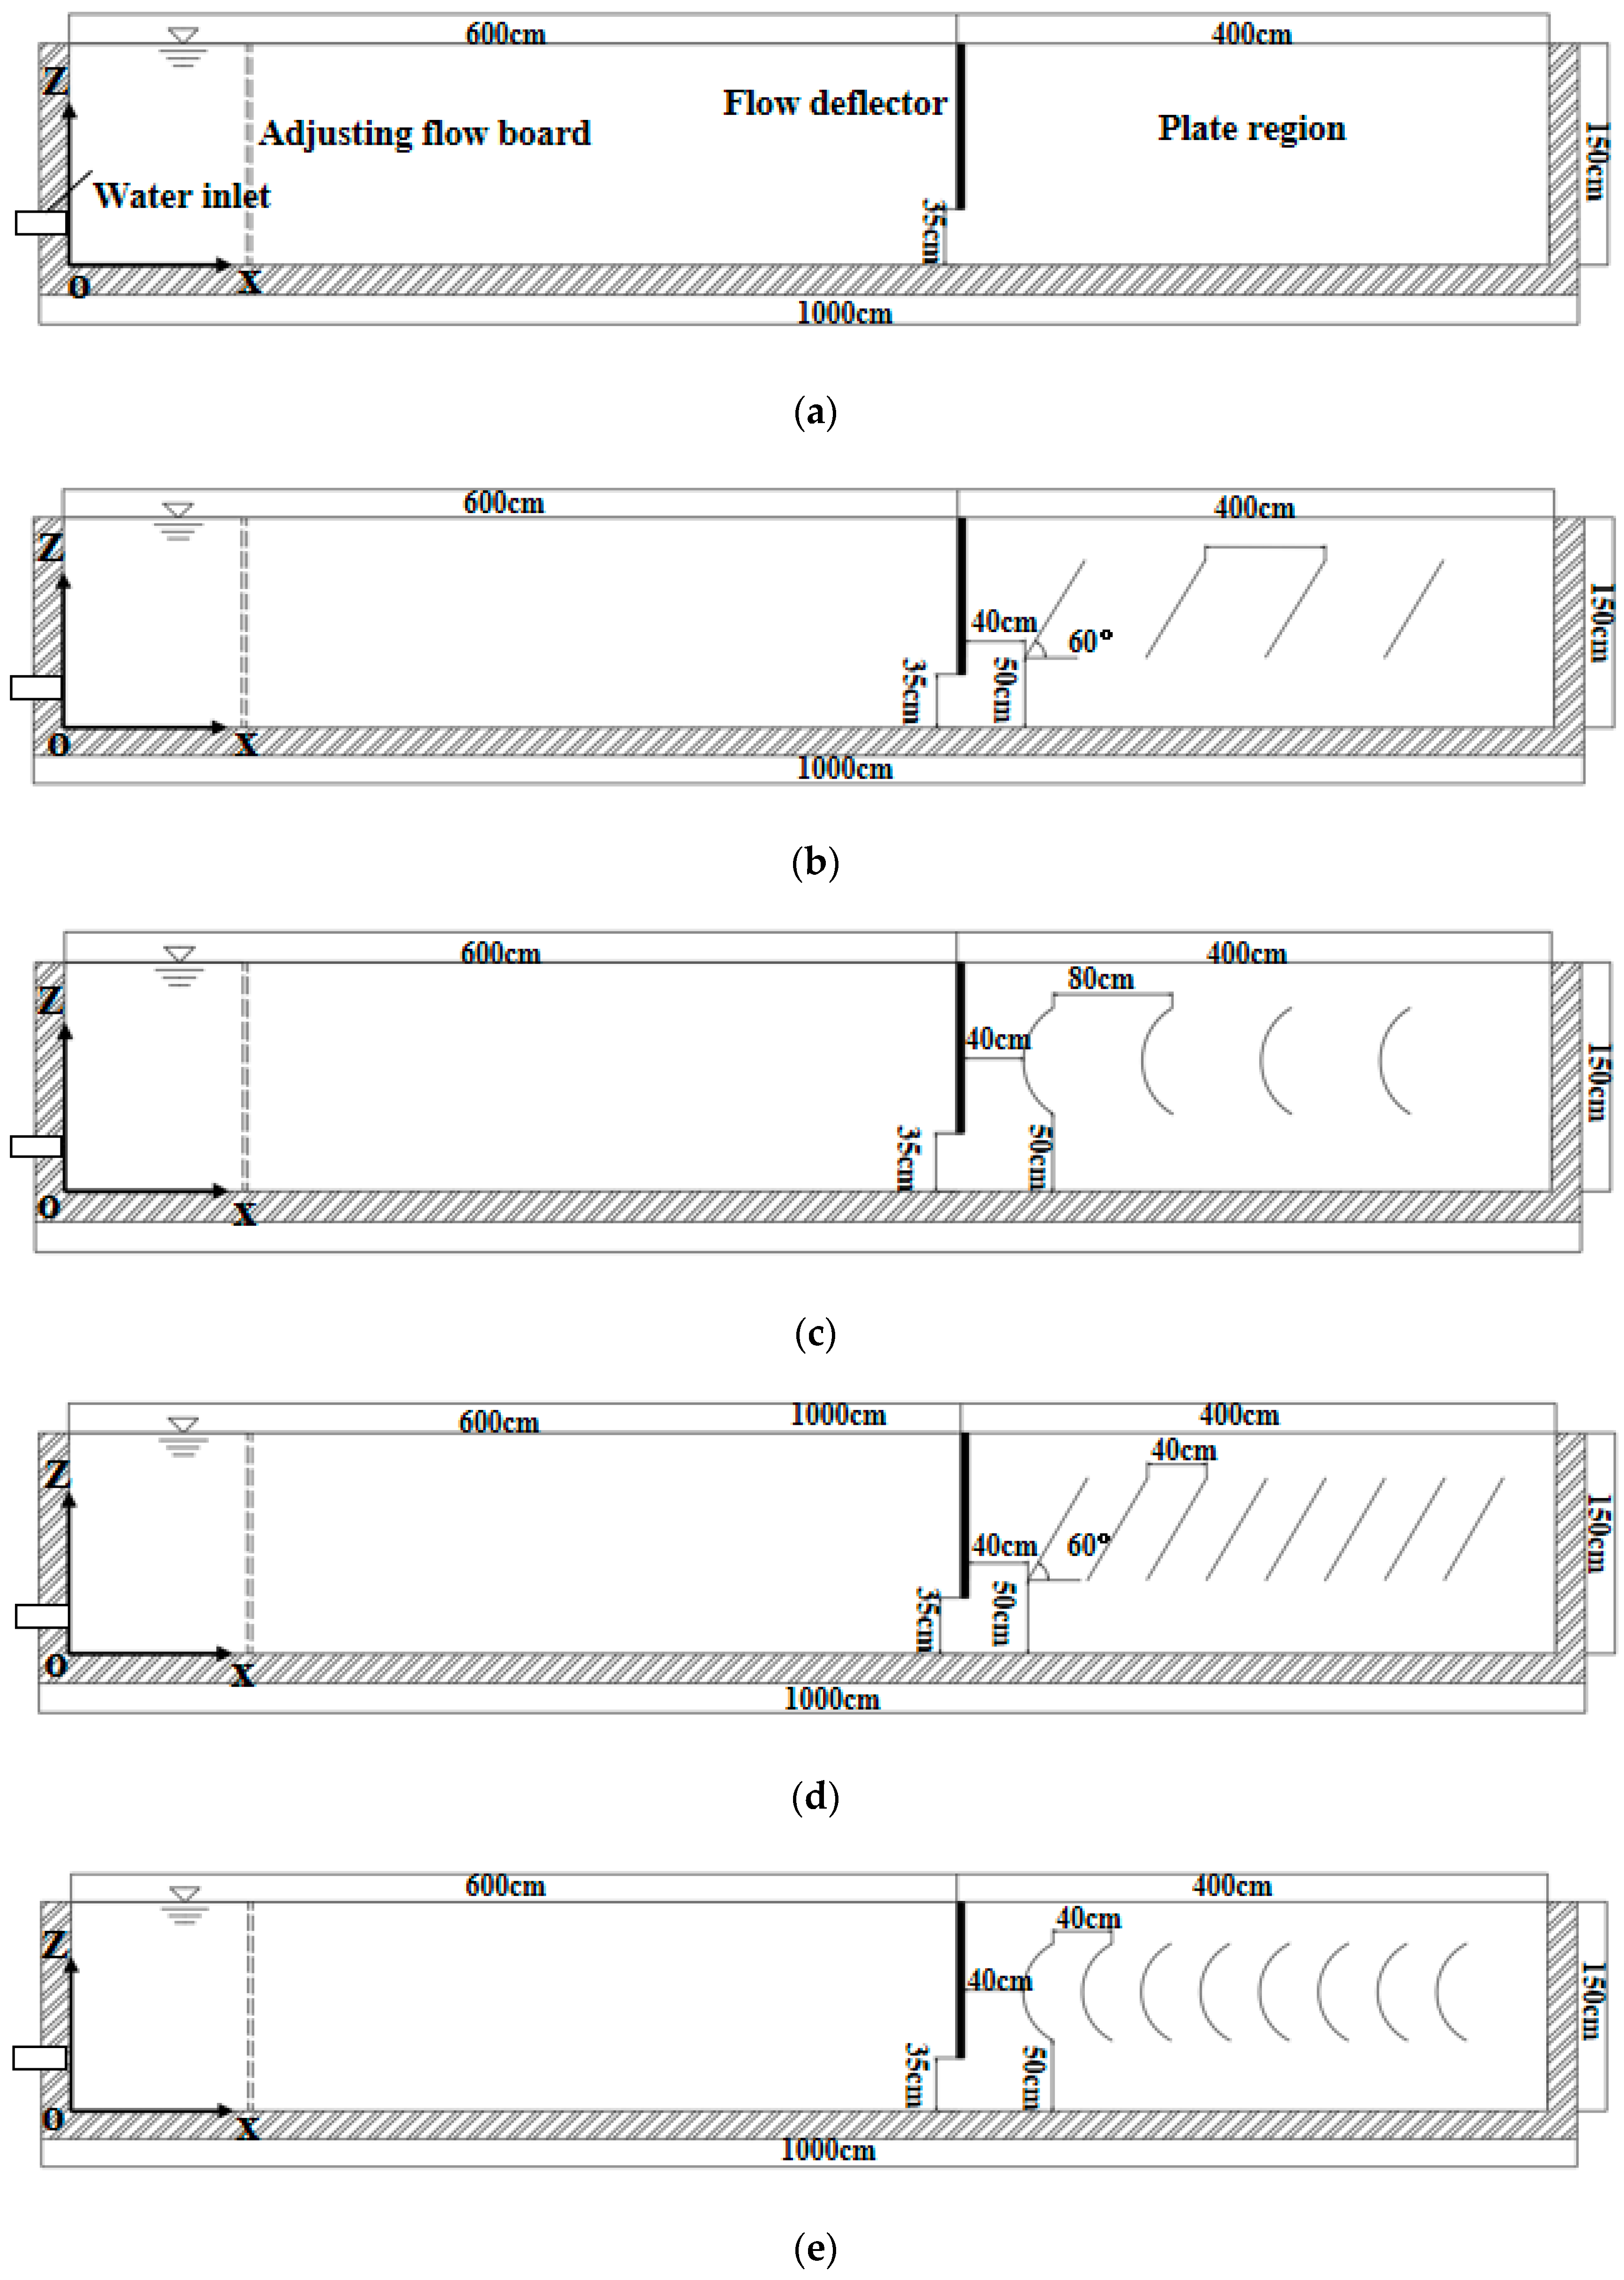
2.1. Structure and Operational Principles of the Linear Sedimentation Tank

The primary components of the linear sedimentation tank consist of the water inlet, tank, adjusting flow board, flow deflector, plate region, side overflow weir, and clear water tank, as illustrated in Figure 1. The operational principle of the sedimentation tank is as follows: Upon opening the inlet valve, water containing sediment is guided into the tank through the inlet pipe. The adjusting flow board plays an important role in dissipating the high velocity of the inflow, facilitating a more uniform distribution of water flow within the tank [33]. This process facilitates the settling of coarser sediment particles at the bottom of the tank. Following this, the controlled water flow passes through the gap below the flow deflector, encouraging additional sediment settling in the plate region. Clear water then flows through the side overflow weir into the clear water tank. Towards the tail end of the sedimentation tank, a sediment discharge funnel is installed to periodically flush the settled sediment accumulated at the tank bottom.

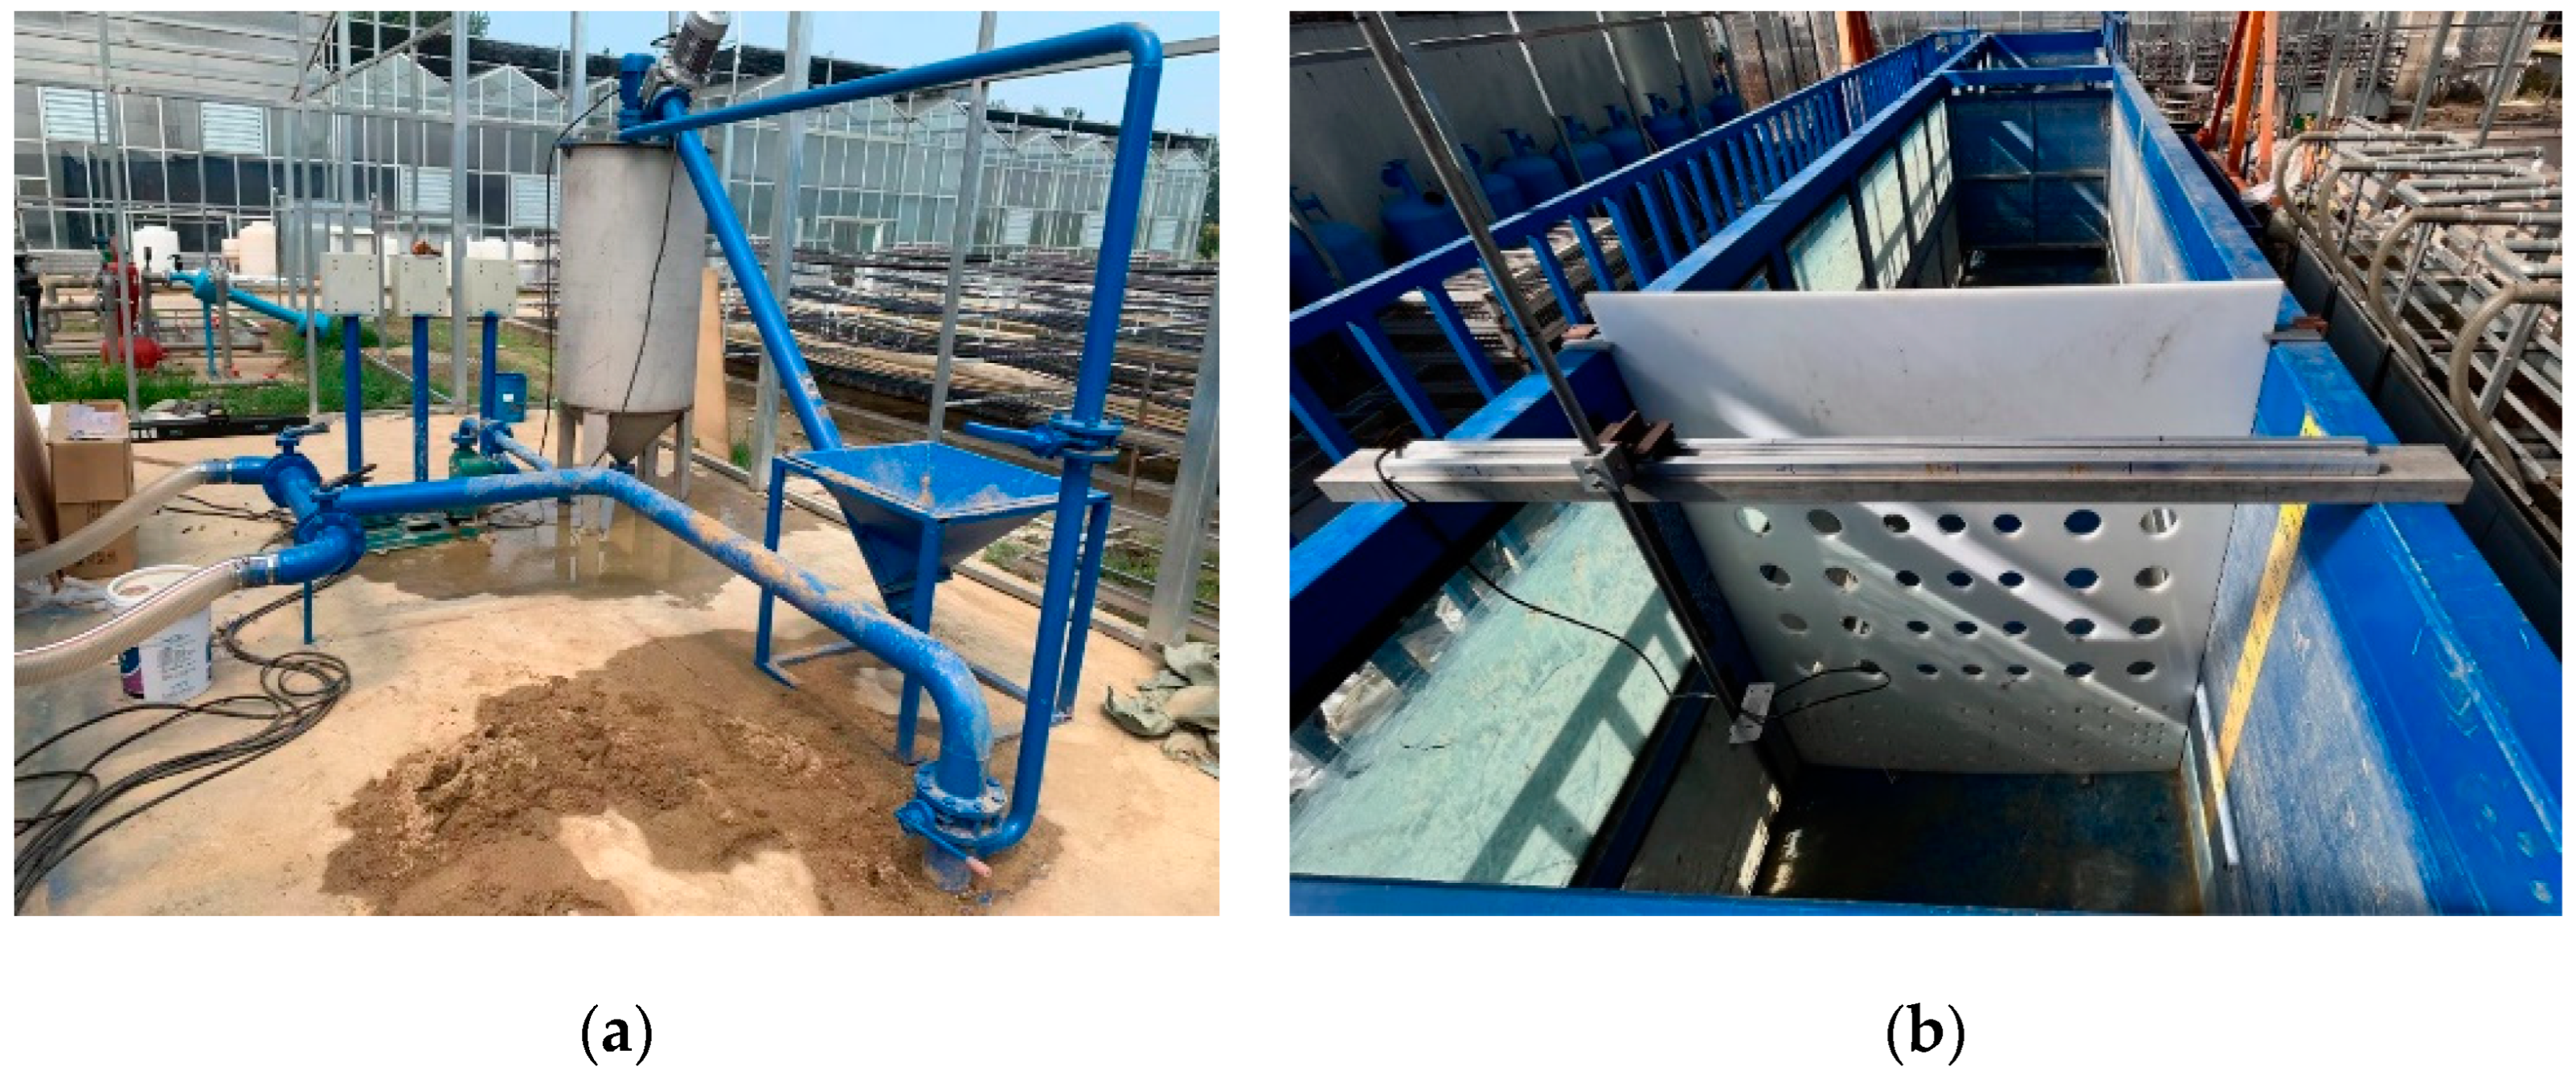
2.2. Experimental Setup

As depicted in Figure 2, the testing platform comprises a sediment stirring device and a linear sedimentation tank. This platform is situated at the Beijing Tongzhou Experimental Station of China Agricultural University. The sedimentation tank spans a length of 10 m and a width of 1.5 m, with a designed water depth of 1.7 m and an operational water depth of 1.5 m, featuring a flat-bottomed slope. A sediment stirring device, positioned at the front of the sedimentation tank, thoroughly mixes clear water and sediment to create a specific concentration of sediment-containing water. Subsequently, the water containing sediment is pumped into the sedimentation tank. An adjusting flow board is situated 1.2 m from the front wall of the sedimentation tank. The holes are arranged with larger ones at the top, smaller ones at the bottom, and symmetrically arranged larger holes in the middle, densely configured, particularly in the inlet region. The rear section of the sedimentation tank is designated as the plate region, housing a front-installed flow deflector positioned 0.35 m above the tank bottom. This arrangement allows water to flow into the plate region through the gap between the flow deflector and the tank bottom. At the tail end, a side overflow weir, 2 m in length, permits water to pass through and flow into the clean water tank through a filter screen.
For reference, the right side wall along the direction of the water flow is designated as the right wall of the sedimentation tank, the left side is designated as the left wall, and the XYZ directions are indicated in Figure 3.

2.3. Experimental Conditions

The arrangement parameters of the plates in sedimentation tanks play a pivotal role in influencing sedimentation efficiency. In this experiment, the traditional inclined-plate structure is adapted to an arc-plate configuration, with the aim of investigating the impact of plate shape and quantity on both flow patterns and sedimentation efficiency. As depicted in Figure 4, the experiment involved the design of five structural sedimentation tanks. Tank I was devoid of plates, whereas tanks II to V were equipped with four inclined plates, four arc plates, eight inclined plates, and eight arc plates, respectively. Based on previous research findings [34] on inclined-plate sedimentation tanks, where the flow direction opposes the settling direction of the sediment, the inclination angle of the inclined plates is typically set at 60° to facilitate the efficient settling of sediment to the tank bottom. Consequently, for this experiment, the inclination angle of the inclined plates was maintained at 60°, featuring dimensions of 1.5 m in length, 0.8 m in width, and 0.8 m in thickness for the thin plates. To maintain uniform horizontal projection areas for both inclined plates and arc-shaped plates, the central angle of the arc-shaped plates was set at 120°. The arc-shaped plates were constructed using thin plates with a radius of 0.4 m and a thickness of 0.8 m.
In this experiment, three different inflow rates of 60, 80, and 100 m3/h were applied. Observations were conducted on two types of sediment samples, ensuring that the inlet sediment concentration was maintained at around 3 kg/m3. In sediment sample A, the median particle size measured 571.110 μm. The cumulative particle distribution revealed a 10% particle size (D10) of 93.539 μm and a 90% particle size (D90) of 832.708 μm. Sediment sample B exhibited a median particle size of 162.254 μm, accompanied by a cumulative particle distribution indicating a D10 of 19.254 μm and a D90 of 560.132 μm.

2.4. Experimental Instruments and Measurement Methods

To analyze the internal flow characteristics and sediment concentration distribution within the sedimentation tank, measurements were taken for both flow velocity and sediment concentration. A total of 18 measurement cross-sections were established, as illustrated in Figure 5. The flow velocity measurements were conducted using an Acoustic Doppler Velocimeter, with a sampling frequency of 200 Hz and a sampling duration of 30 s. The measurement accuracy was ±0.5% ± 1 mm/s. The measurement points were positioned at longitudinal locations of Y = 20 cm, Y = 40 cm, Y = 75 cm, Y = 110 cm, and Y = 130 cm and at depth locations of Z = 10 cm, Z = 30 cm, Z = 50 cm, Z = 70 cm, Z = 90 cm, Z = 110 cm, and Z = 130 cm. This resulted in a total of 35 measurement points. The sediment concentration was determined using the specific gravity bottle method, employing instruments such as conical flasks, precision electronic balances, and platform scales. Due to the uniform distribution of sediment concentration across longitudinal sections, measurements for this experiment exclusively concentrated on the Y = 75 cm central axis. Measurement points were established at Z = 20 cm, Z = 50 cm, Z = 80 cm, Z = 110 cm, and Z = 140 cm. To minimize measurement errors in sediment concentration, three measurements were taken at each measurement point, with the error controlled within 1%, and then the average value was calculated. The sediment concentration is calculated using Equation (1).
  C s = ρ 1 ( m 2 m 1 ) V ( ρ 1 ρ 0 )
The sediment removal efficiency calculation equation is represented in Equation (2).
η s = C s 1 C s 2 C s 1 × 100 %
where C s is the sediment concentration (kg/m3); ρ 1 and ρ 0 are the sediment density (2650 kg/m3) and the density of distilled water (1000 kg/m3), respectively; m 1 is the mass of the specific gravity bottle and distilled water (kg); m 2 is the mass of the specific gravity bottle and water sample (kg); η s is the sediment removal efficiency (%);   C S 1 is the sediment concentration in the water source; and C S 2 is the sediment concentration at the sampling site.
To measure the particle size distribution of sediment at the tank bottom across four sections located at X = 50 cm, 150 cm, 600 cm, and 900 cm, the British MS2000 laser particle size analyzer was employed with a measurement range from 0.2 to 2000 μm and a measurement error of less than 1%.
Figure 5. Diagram of measurement section (cm). The dotted lines represent the velocity and sediment concentration measurement section, while the solid lines correspond to sections at x = 50 cm, 150 cm, 600 cm, and 900 cm.
Water 16 01075 g005

3. Results and Analysis

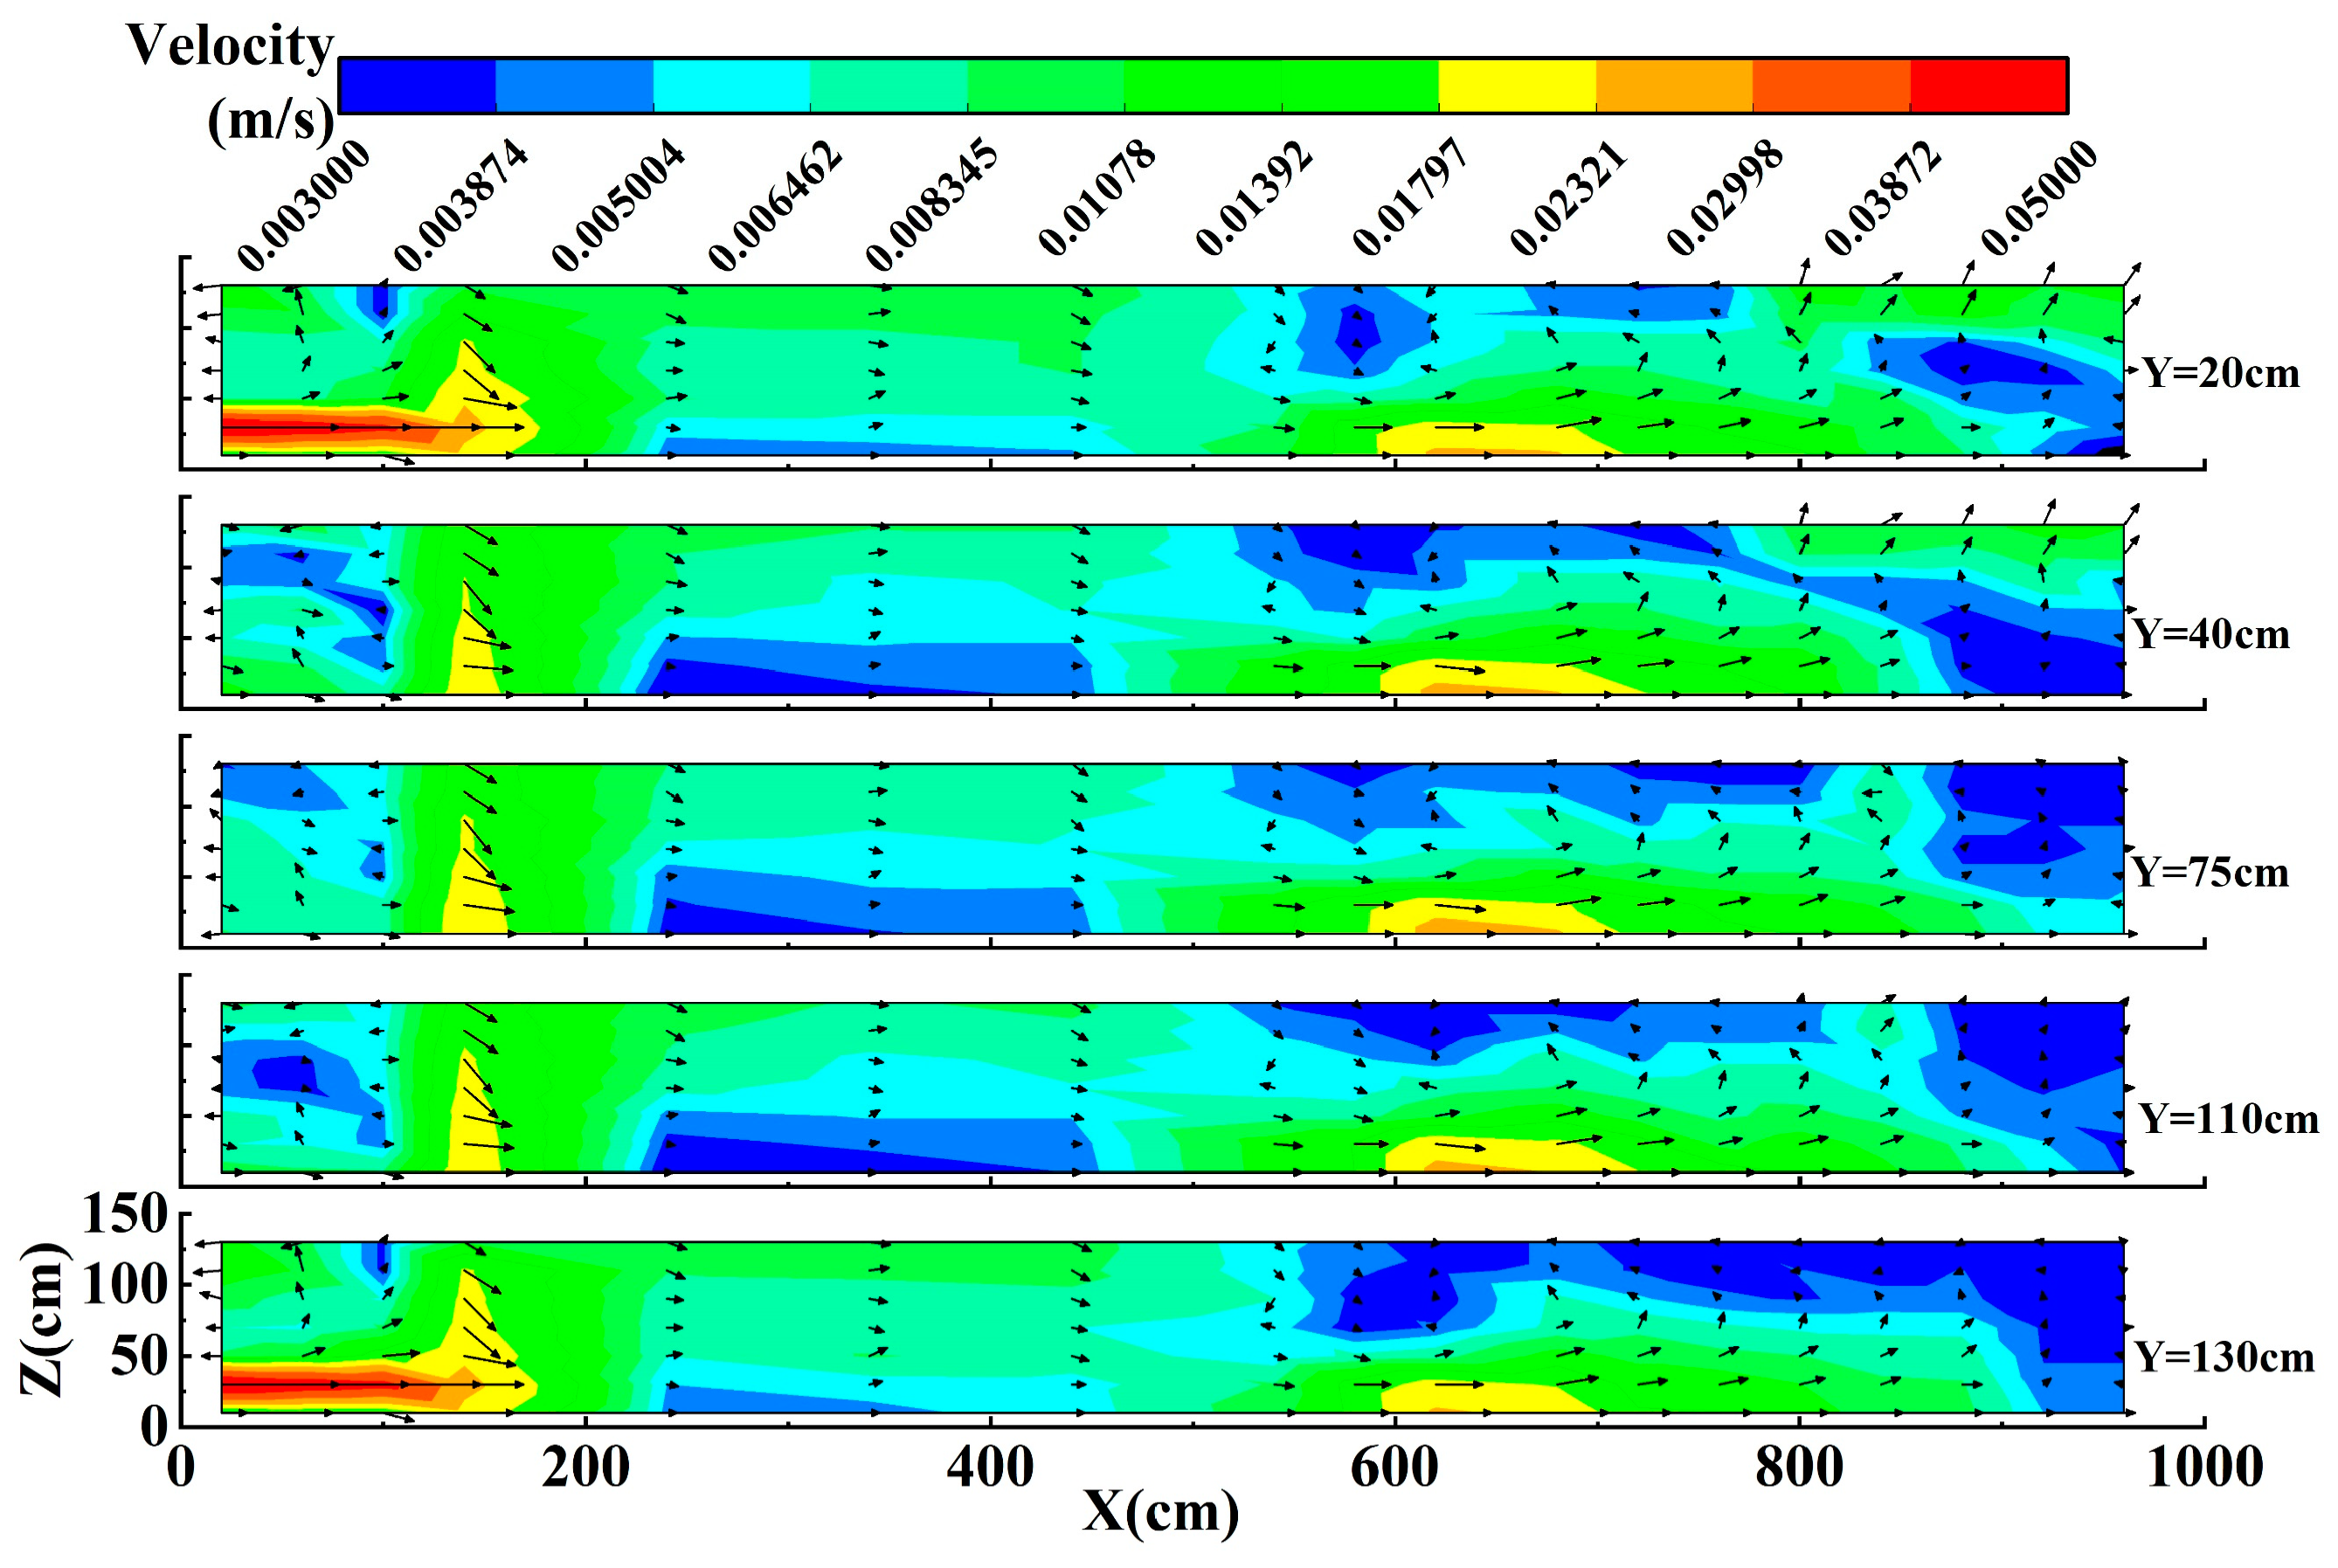
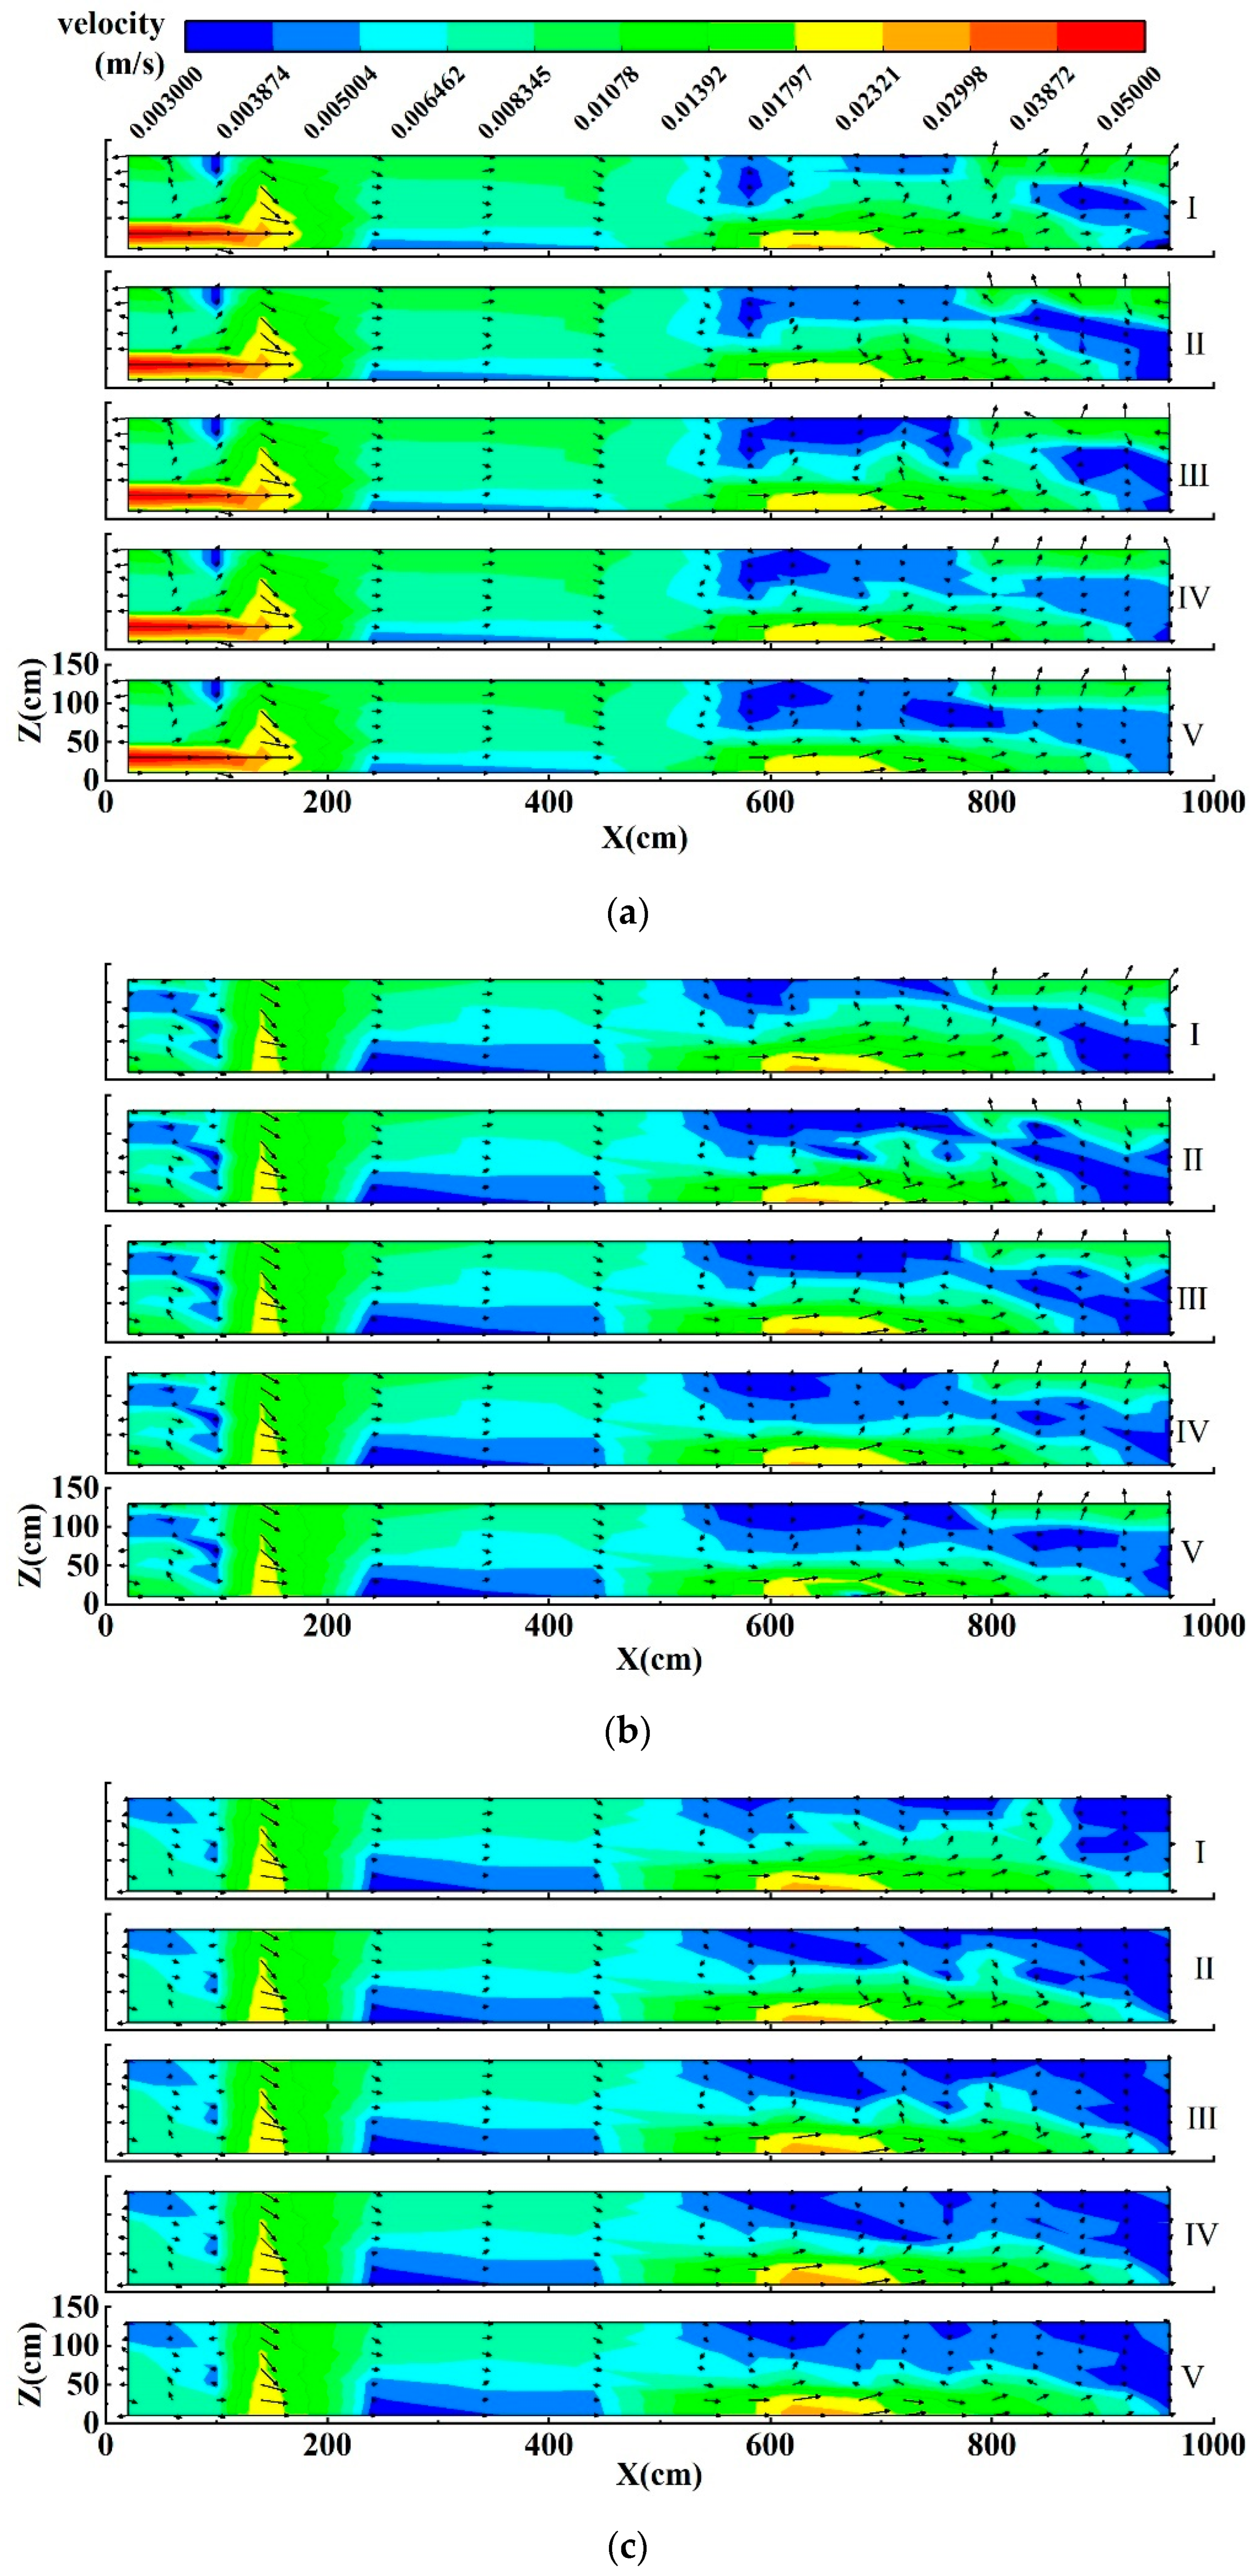
3.1. Analysis of Flow Characteristics

The combined lateral and vertical velocities, along with vector angles for each measurement point, were computed, and velocity cloud maps and vector diagrams were generated. Similar distribution patterns of flow velocities within the sedimentation tanks were observed under three different inflow rates. For instance, in the case of an inflow rate of 60 m3/h, a thorough analysis was conducted on the flow velocity characteristics across the sedimentation tanks, considering five different structural configurations.

3.1.1. Comparative Analysis of Flow Velocity along Sedimentation Tanks without Plates

Figure 6 displays velocity cloud maps and vector diagrams for longitudinal sections in sedimentation Tank I. In the sections at X = 20 cm and X = 60 cm, before the adjusting flow board, the distribution of the combined velocity direction appears chaotic, with irregular magnitudes. This can be attributed to higher flow velocity and turbulence near the inlet, leading to vortex phenomena. In particular, in the sections at Y = 20 cm and Y = 130 cm, which directly face the inlet, there is a significant flow velocity within the Z = 0–50 cm range. This notable flow may lead to the resuspension of sediment at the tank’s bottom, due to scouring, potentially reducing the sedimentation efficiency of sedimentation tank I. In the section at X = 100 cm, before the adjusting flow board, the combined velocity is predominantly directed upward. This is attributed to the larger apertures in the upper part of the adjusting flow board, which enhances the overflow capacity. Beyond the adjusting flow board at X = 120 cm, the primary direction of the combined velocity shifts downward, creating a more uniform flow. This phenomenon arises from the higher flow velocity in the upper part with larger apertures. The bottom velocity exceeds the upper velocity, inducing lower bottom pressure and, consequently, directing the flow towards the bottom. Between the adjusting flow board and the flow deflector, the velocity distribution across various sections remains similar, with the combined velocity consistently pointing downstream. The vertical flow velocity in this section is relatively small, with a uniform distribution ranging from 0.003 to 0.01 m/s. This suggests that the adjusting flow board plays a significant role in regulating the flow, facilitating uniform and stable sediment settling. The observed pattern, where the bottom flow velocity is smaller than the upper flow velocity, aligns with the principles of open-channel flow. In the sections preceding the flow deflector, the primary direction of the combined velocity is downward, as water enters the plate region through gaps in the flow deflector and the tank bottom. However, in the rear section after the flow deflector, the bottom flow velocity increases, potentially carrying deposited sediment into the plate region, thus affecting sedimentation efficiency. Within the plate region of the sedimentation tank, all sections exhibit backflow phenomena, which can be detrimental to sediment settling. Therefore, it is important to reduce backflow volume and enhance sedimentation efficiency by implementing plates. Notably, in the sections near the right wall tail at Y = 20 cm and Y = 40 cm, the upper flow velocity is relatively large and the combined velocity is directed upwards, due to the suction effect of the side overflow weir outlet.

3.1.2. Comparative Analysis of Flow Velocity along Sedimentation Tanks with Different Plate Structures

To explore the impact of plate structure shape and quantity on velocity distribution within the sedimentation tank, a study was conducted on the plate region with varying structures. The distinguishing factor lies in the influence of the left and right walls of the sedimentation tank, where the combined velocity is relatively smaller near the wall. Consequently, a comparative analysis of flow velocity was undertaken at the Y = 20 cm, 40 cm, and 75 cm sections for sedimentation tanks with different structures.
Figure 7 illustrates the flow velocity distribution and vector diagrams at the Y = 20 cm, 40 cm, and 75 cm sections for sedimentation tanks with different structures. To further investigate the influence of plate structure shapes on flow velocity, a comparison was conducted among sedimentation Tanks II, III, IV, and V. Interestingly, under the same number of plates, it was observed that the velocity in tanks with arc plates was smaller compared to those with inclined plates. In particular, the combined velocity direction between plates exhibited a downward trend, facilitating the accelerated settling of sediment. This trend proves to be particularly advantageous for fine sediment particles. This phenomenon can be attributed to the fact that, with the same proportion of increased effective settling area, the centrifugal force exerted on the water flow between arc plates leads to a reduction in velocity and a shift in the flow direction. These flow characteristics are conducive to effective sediment settling. To investigate the influence of the quantity of plates on flow velocity, a comparison was conducted among sedimentation Tanks I, II, and IV and I, III, and V. Analysis of the flow direction within the tank revealed that as the number of plates increased, the volume of backflow zone in the plate region decreased, thereby facilitating sediment settling. Furthermore, an examination of the flow velocity magnitudes within the tank indicated that with an increasing number of plates, the flow velocity between plates decreased, relatively, making it easier for smaller particle-sized sediment to settle.

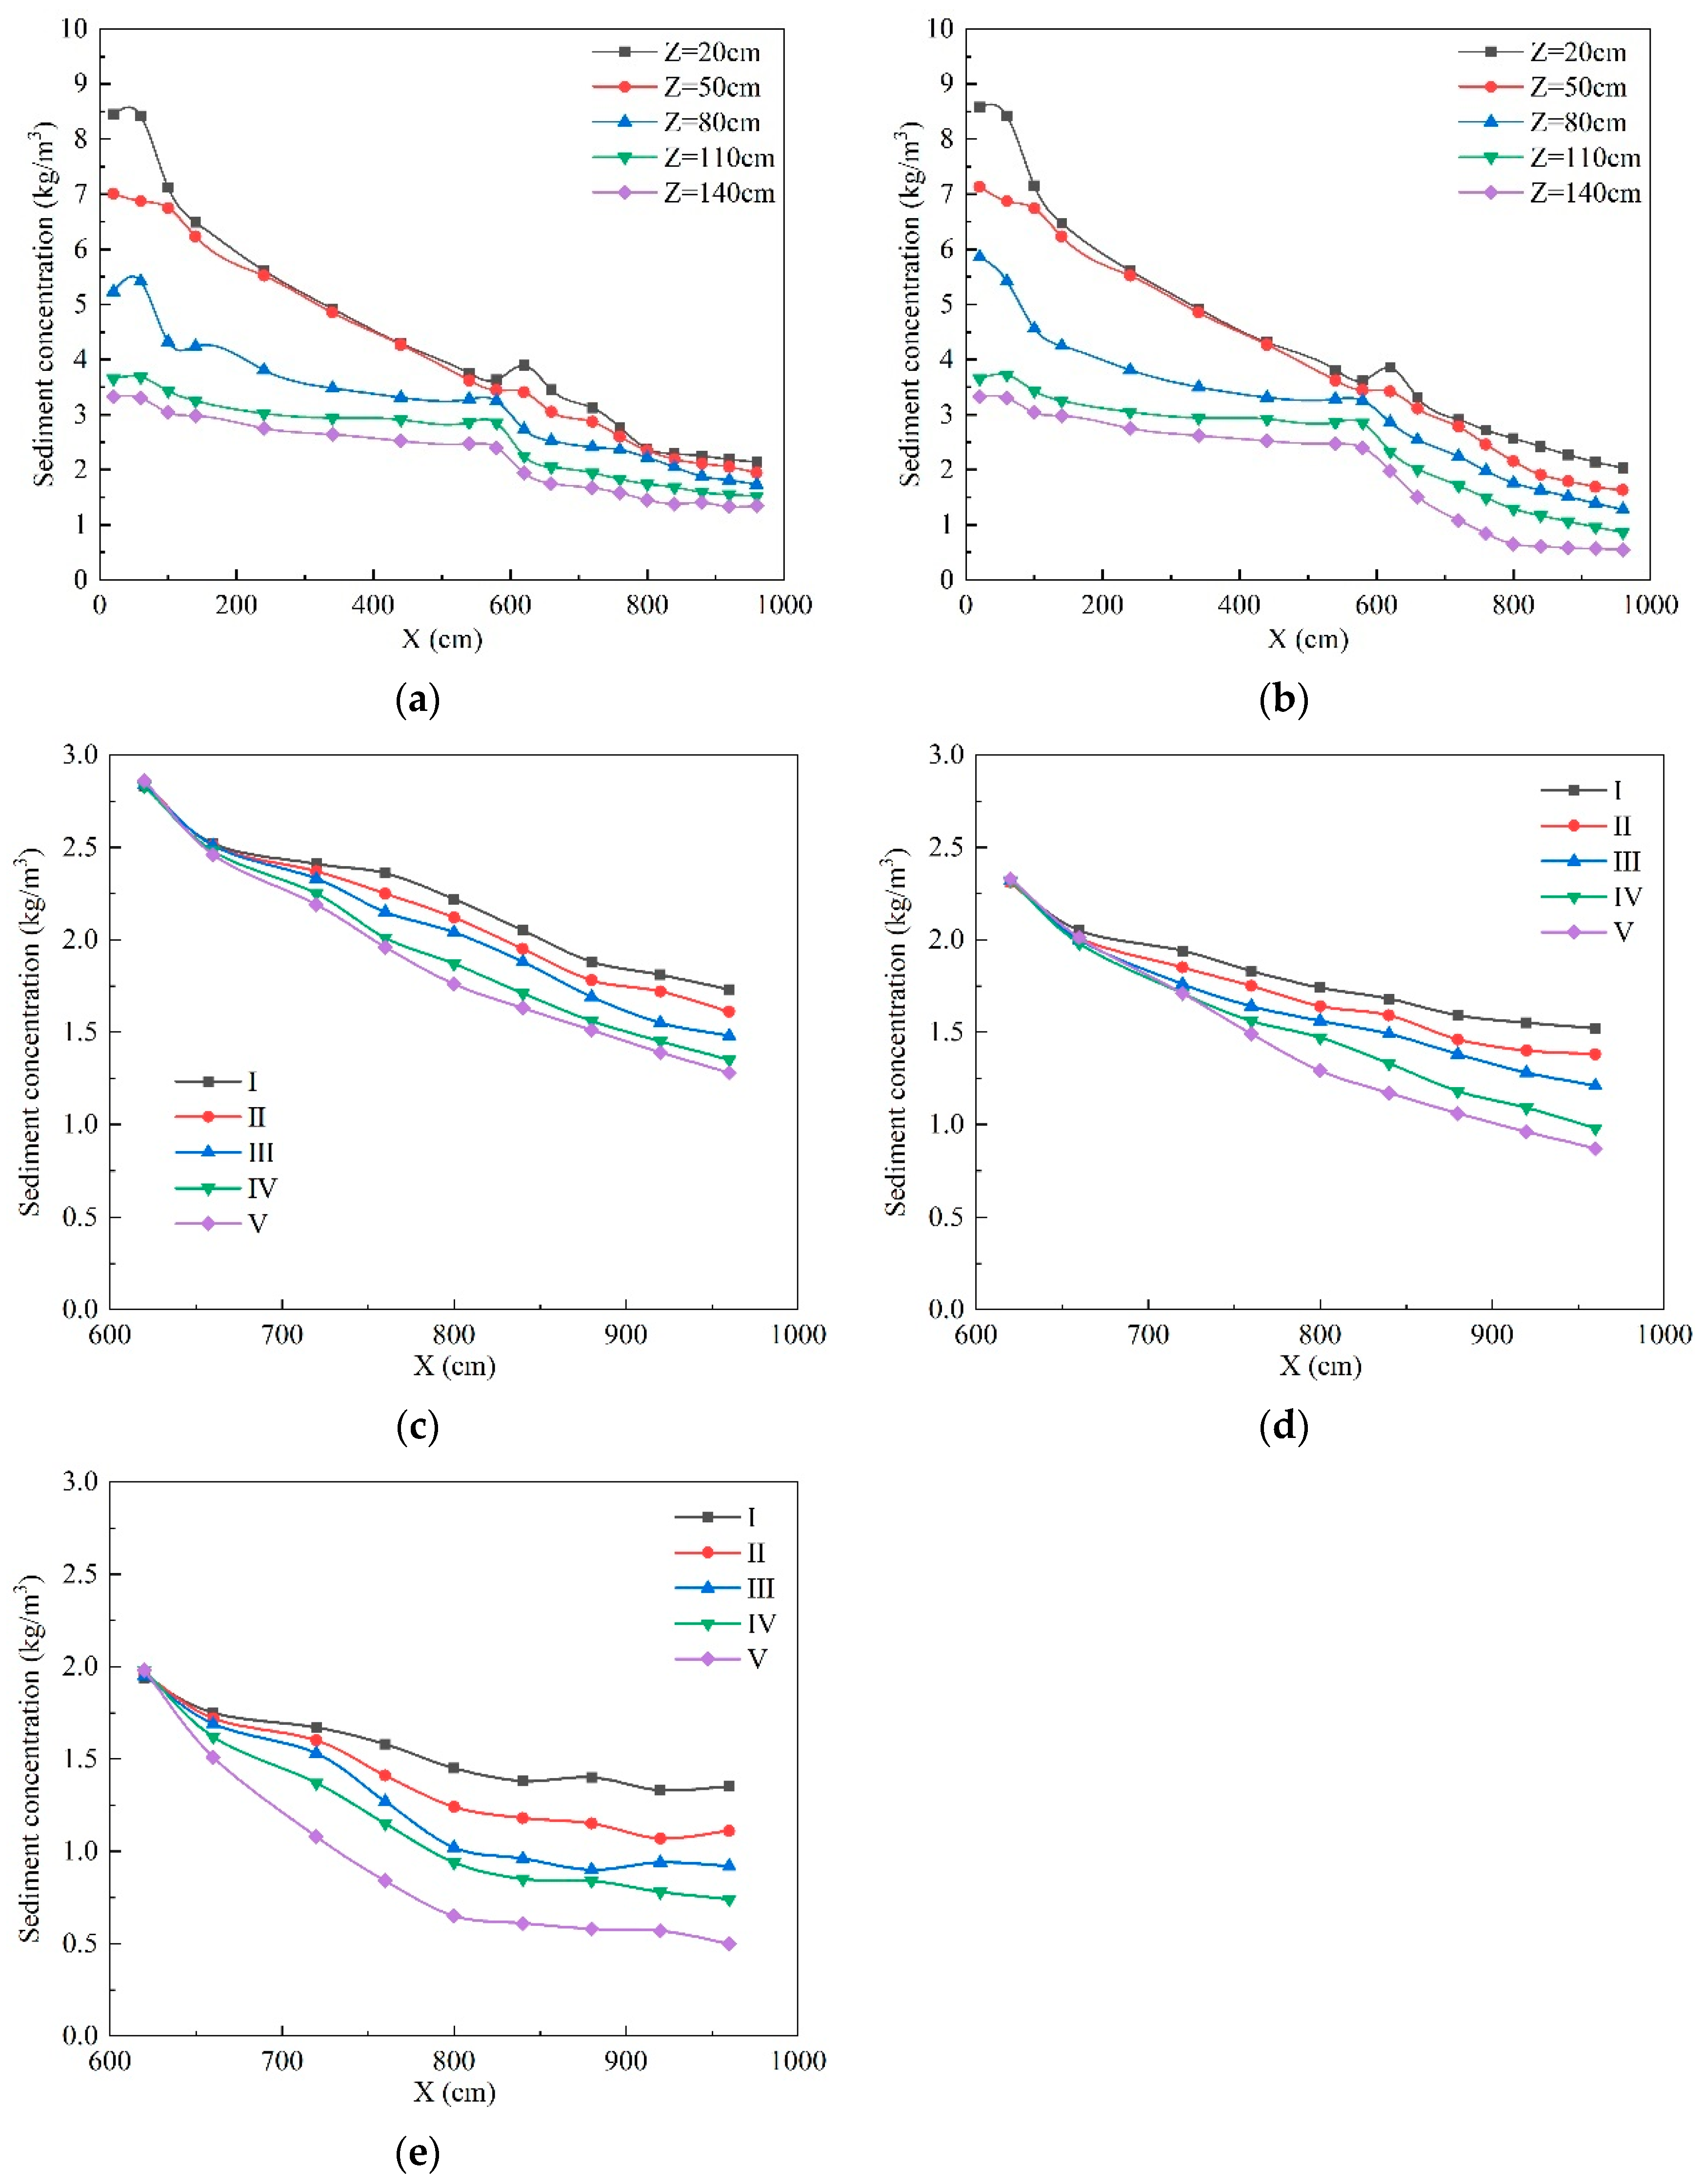
3.2. Analysis of Sediment Concentration Distribution

Under three different inflow rates, the variations in sediment concentration distribution across various sedimentation tanks for two distinct sediment samples are found to be similar. This section specifically focuses on the analysis of sediment concentration distribution patterns in sediment sample A within the sedimentation tank under an inflow rate of 60 m3/h.
The patterns of sediment concentration distribution among different sedimentation tanks are similar. Figure 8a,b illustrate the sediment concentration distribution in sediment sample A across sedimentation Tanks I and V, with an inflow rate of 60 m3/h. Prior to adjusting the flow board, higher sediment concentrations, ranging from 6.5 to 9 kg/m3, are observed near the bottom of the sedimentation tank at Z = 20 cm and Z = 50 cm. In the middle section of the sedimentation tank at Z = 80 cm, the sediment concentration decreases in comparison to the bottom, ranging between 4 and 6 kg/m3. At the surface layer of the sedimentation tank, the sediment concentration ranges from 3 to 4 kg/m3. The increased sediment concentrations at the bottom and middle sections can be attributed to the high inflow velocity near the inlet. This high velocity entrains sediment deposits from the bottom, causing them to be resuspended and dispersed upward during tank operation. The sediment concentration exhibits a decreasing trend between the adjusting flow board and the flow deflector, with varying rates of decrease. In the region of X = 140–240 cm, the sediment concentration decreases rapidly. However, in the region of X = 240–600 cm, the decrease is slower. This is due to larger particles settling quickly to the bottom in the front, whereas smaller particles settle at a slower rate. Additionally, the turbulent flow in this section is insufficient to facilitate the settling of smaller particles at the tank bottom.
After the flow deflector at X = 620 cm, there is an observed increase in sediment concentration at the tank bottom. This increase is attributed to the high flow velocity from the gap between the flow deflector and the tank bottom, causing scouring of the sediment from the tank bottom. Figure 8c–e illustrate sediment concentration distribution in sediment sample A across the plate region of sedimentation tanks under Z = 80 cm, Z = 110 cm, and Z = 140 cm. In the plate region, the sediment concentration shows a gradual decreasing trend. A comparison among sedimentation Tanks I, II, III, IV, and V reveals that sedimentation is more rapid in Tank V. The surface layer sediment concentrations in the plate region of sedimentation Tanks I, II, III, IV, and V are 1.33–1.45 kg/m3, 1.07–1.24 kg/m3, 0.9–1.02 kg/m3, 0.74–0.94 kg/m3, and 0.5–0.61 kg/m3, respectively. Tank III reduces sediment concentration by about 17% compared to Tank II, while Tank V reduces it by approximately 34% compared to sedimentation Tank IV. The results suggest that the arc-plate sedimentation tank has a more significant impact on sediment settling. When comparing sedimentation Tanks I, III, and V, it becomes evident that the trend of sediment concentration decrease accelerates with an increase in the number of plates. Notably, Tank V reduces sediment concentration by approximately 60% compared to Tank I and by about 42% compared to Tank II.
For other operating conditions, the patterns of sediment concentration variation along the tank are consistent. In summary, under an inflow rate of 60–100 m3/h and during the treatment of sediment sample A, the surface layer sediment concentrations in the plate region of various sedimentation tanks range from 1.33 to 1.74 kg/m3, 1.07 to 1.50 kg/m3, 0.85 to 1.35 kg/m3, 0.74 to 1.18 kg/m3, and 0.55 to 1.01 kg/m3, respectively. Under identical conditions, the sediment concentration in the surface layer of the plate region within Tank V decreases by approximately 15% to 34% when compared to Tank IV. Moreover, it exhibits a reduction of about 42% to 60% in comparison to Tank I and a decrease of 25% to 44% relative to Tank III. During the treatment of sediment sample B, at an inflow rate ranging from 60 to 100 m3/h, the surface layer sediment concentrations in the plate region vary across different sedimentation tanks. The concentrations are observed to be in the ranges of 1.52 to 1.96 kg/m3, 1.33 to 1.79 kg/m3, 1.11 to 1.61 kg/m3, 1.01 to 1.44 kg/m3, and 0.82 to 1.32 kg/m3, respectively. Under identical conditions, the surface layer sediment concentration in the plate region of Tank V experiences a decrease of approximately 8% to 19% compared to Tank IV. Furthermore, it demonstrates reductions of about 33% to 46% and 18% to 27% when compared with Tanks I and III, respectively. The analysis suggests that the arc-plate sedimentation tank proves more effective than the inclined-plate sedimentation tank in sediment settling. Additionally, it is noteworthy that the sedimentation effect improves with an increase in the number of plates.

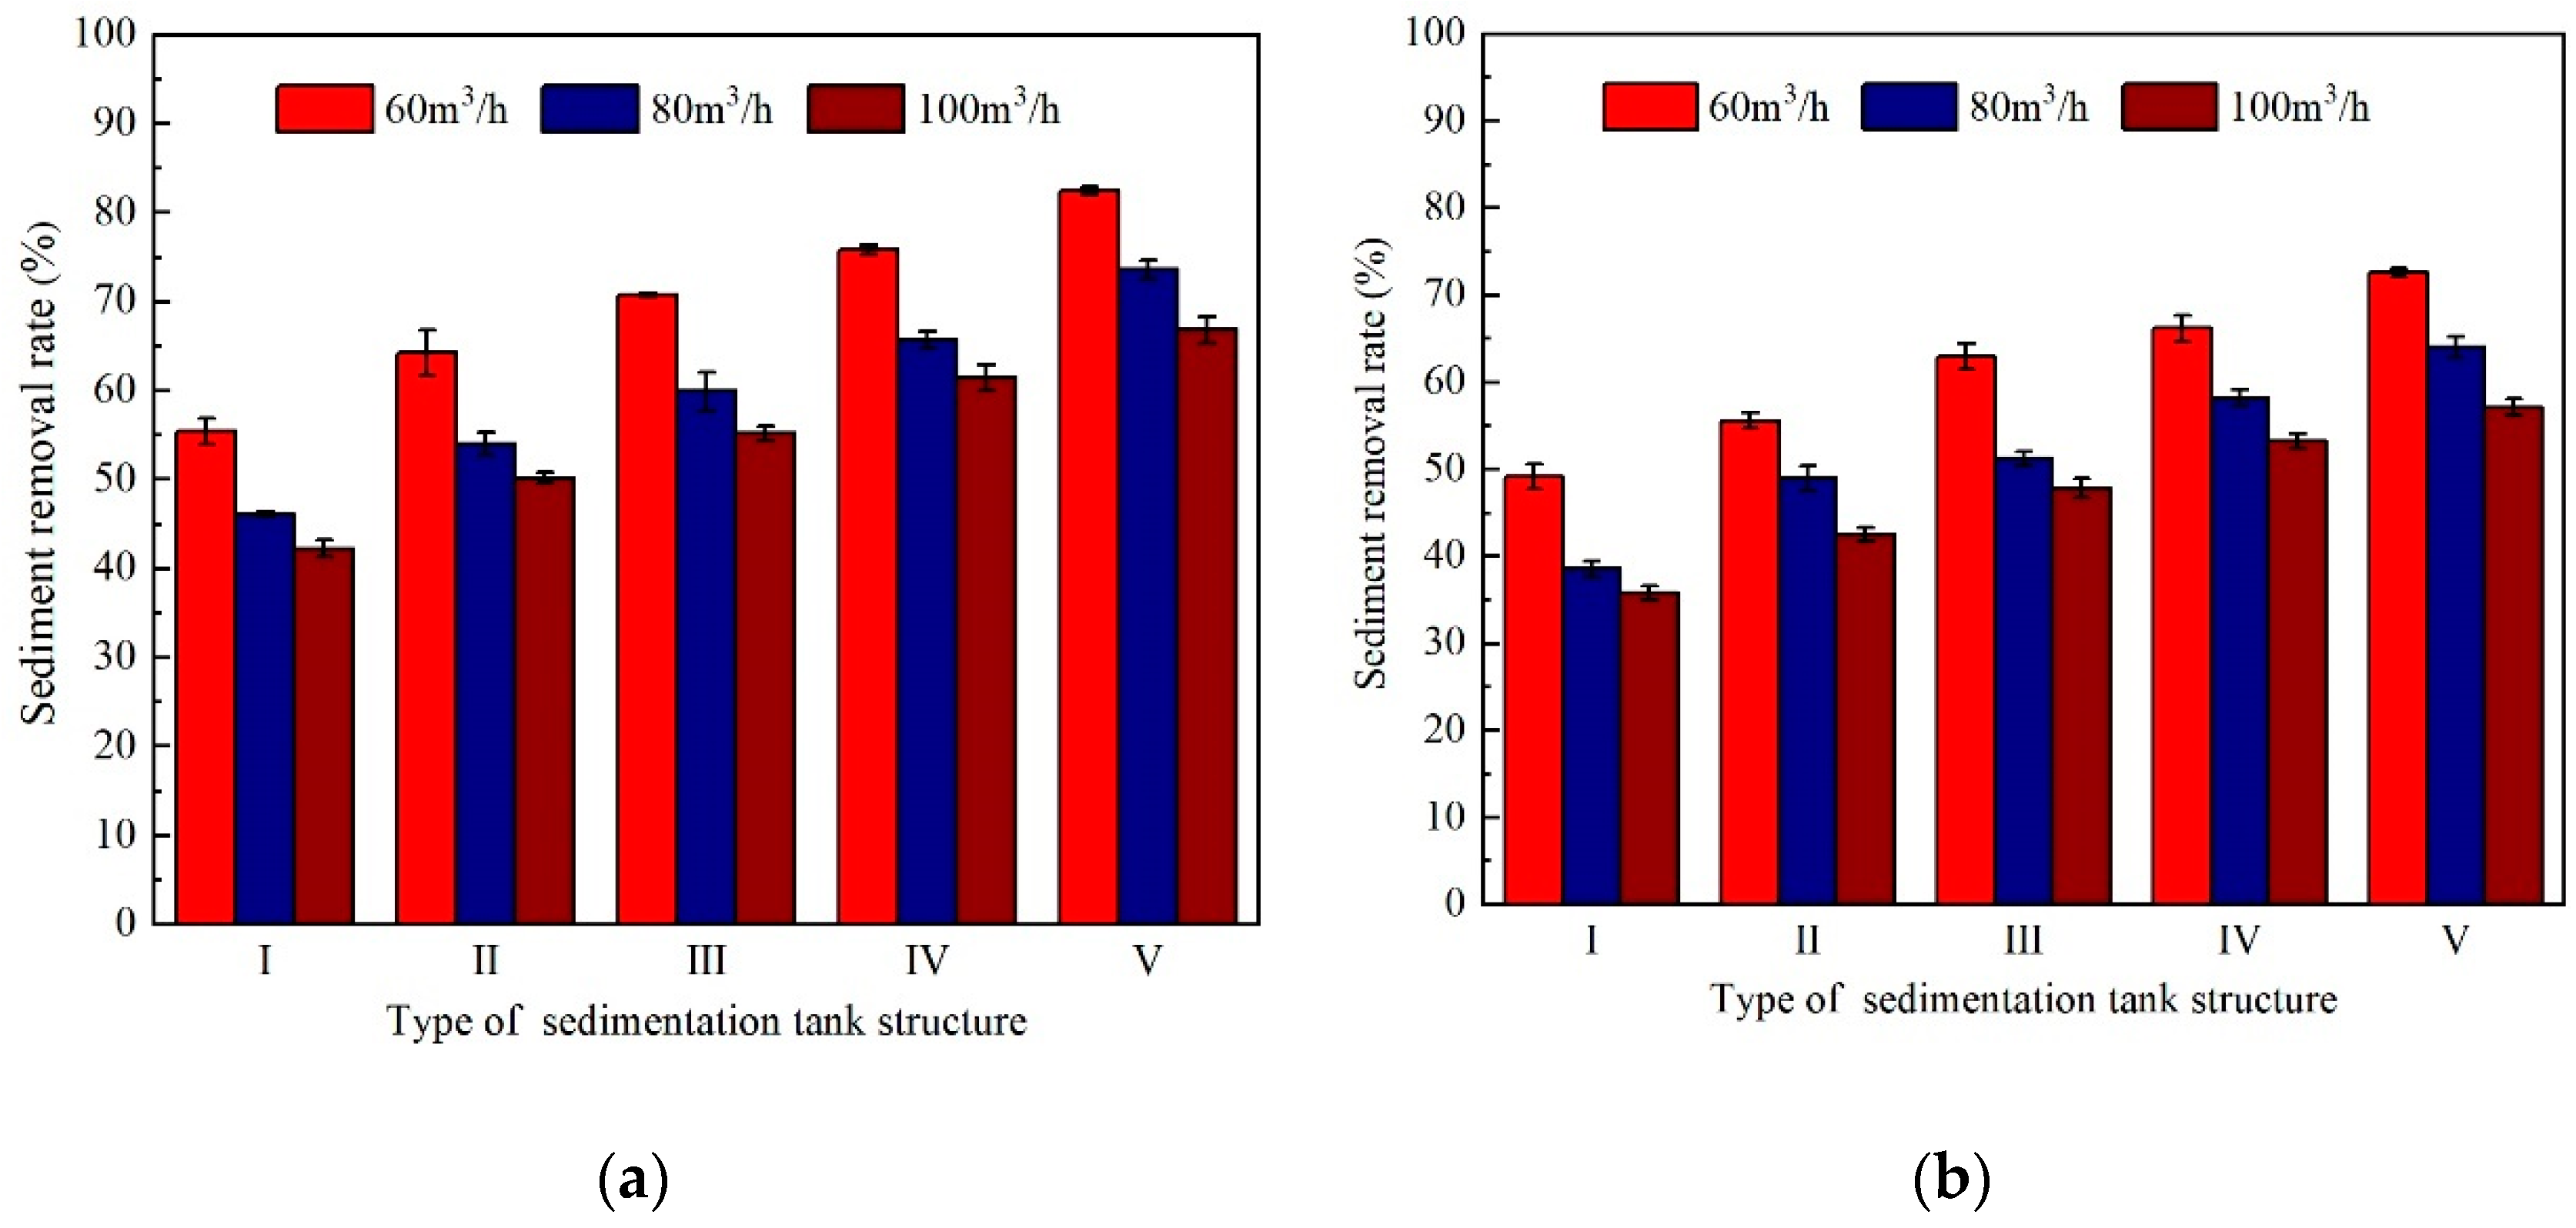
3.3. Analysis of Sediment Removal Efficiency

To conduct a more in-depth analysis of the sedimentation efficiency across different structural sedimentation tanks, water samples were systematically collected at surface locations (X = 800, 840, 880, 920, and 960 cm) at the outlet of the side overflow weir. The specific sampling coordinates were recorded as (800, 10, 150), (840, 10, 150), (880, 10, 150), (920, 10, 150), and (960, 10, 150). Following the collection of these samples, the sediment removal efficiency at each location was calculated and, subsequently, averaged for a comprehensive assessment.
Figure 9 depicts the sediment removal efficiency of five structural sedimentation tanks. Notably, within sedimentation tanks of identical structures, the sediment removal efficiency for sediment sample A proved markedly higher than that observed for sediment sample B across diverse conditions. Furthermore, for a given sediment sample, there was a discernible decreasing trend in sediment removal efficiency with an increase in the inflow rate. In the inflow rate range of 60–100 m3/h, Tank V exhibited the highest sediment removal efficiency. For sediment sample A, the sediment removal efficiency ranged from 66.85% to 82.45%, marking an increase of 8% to 10% when compared to Tank IV. Furthermore, it demonstrated a substantial improvement of 48–58% and 17–21% compared to Tanks I and III, respectively. In the case of sediment sample B, the sediment removal efficiency of Tank V ranged from 57.13% to 72.58%, highlighting an increase of 7–10% in comparison to Tank IV. Additionally, it displayed notable enhancements of 47–60% and 15–20% relative to Tanks I and III, respectively. These findings indicate that the arc-plate sedimentation tank plays a pivotal role in achieving a higher sediment removal efficiency, surpassing the performance of the inclined-plate sedimentation tank. Moreover, there is a discernible upward trend in sediment removal efficiency with an increase in the number of arc plates.

3.4. Analysis of Particle Size Distribution

3.4.1. Distribution of Particle Size in Different Sedimentation Tanks

Sediment samples were extracted from the tank bottom at the cross-section X = 900 cm for measurement. Figure 10 illustrates the comparative sediment particle size distribution curves of various sedimentation tanks under different operating conditions. To exemplify, considering the condition of treating sediment sample A at an inflow rate of 60 m3/h, the median particle sizes of sediment particles in sedimentation Tanks I–V are 161.426 μm, 108.568 μm, 92.595 μm, 63.267 μm, and 45.978 μm, respectively. The mass percentages of sediment particles smaller than 0.05 mm are as follows for sedimentation Tanks I–V: 19.81%, 26.35%, 32.27%, 46.03%, and 54.28%, respectively. The mass percentages of sediment particles with sizes ranging from 0.1 mm to 1 mm are reported as 57.15%, 51.29%, 43.91%, 34.25%, and 25.98%, for sedimentation Tanks I–V, respectively. These data suggest that as the number of plates increases, the sedimentation effect becomes more prominent. Notably, the arc-plate sedimentation tank, when compared to the inclined-plate sedimentation tank, exhibits a notable capability in facilitating the settlement of finer sediment particles. This highlights a significant enhancement in sediment settling achieved by the arc-plate sedimentation tank. Importantly, this pattern remains consistent across different flow rates and sediment samples.
Micro-irrigation water generally requires the removal of sediment particles with particle size greater than 0.05 mm in water containing sediment [6,35]. The mass percentages of sediment particles smaller than 0.05 mm for various sedimentation tanks under different flow rates and sediment sample conditions are depicted in Figure 11. Notably, under identical flow rates and sediment sample conditions, Tank V consistently exhibits the highest mass percentage of sediment particles smaller than 0.05 mm in its tank bottom sediment particle size distribution. However, an interesting trend is observed where, with an increase in flow rate, the mass percentage of sediment particles smaller than 0.05 mm tends to decrease. At an inflow rate ranging from 60 to 100 m3/h, during the treatment of sediment sample A, the mass percentage of sediment particles smaller than 0.05 mm in the tank bottom sediment particle size distribution of sedimentation Tank V varies from 42.73% to 54.28%. This represents an increase of approximately 7% compared to Tank IV and a substantial increase of about 32% and 20% compared to Tanks I and III, respectively. In the treatment of sediment sample B, the mass percentage of sediment particles smaller than 0.05 mm in the tank bottom sediment particle size distribution of Tank V ranges from 49.95% to 59.94%. This denotes an increase of approximately 5% compared to Tank IV and a significant rise of about 25% and 10% compared to Tanks I and III, respectively. These findings highlight that, in addressing sediment particles smaller than 0.05 mm, the arc-plate sedimentation tank exhibits superiority over the inclined-plate sedimentation tank. Furthermore, there is a noticeable enhancement in the treatment effect on fine particles with an increase in the number of arc plates.

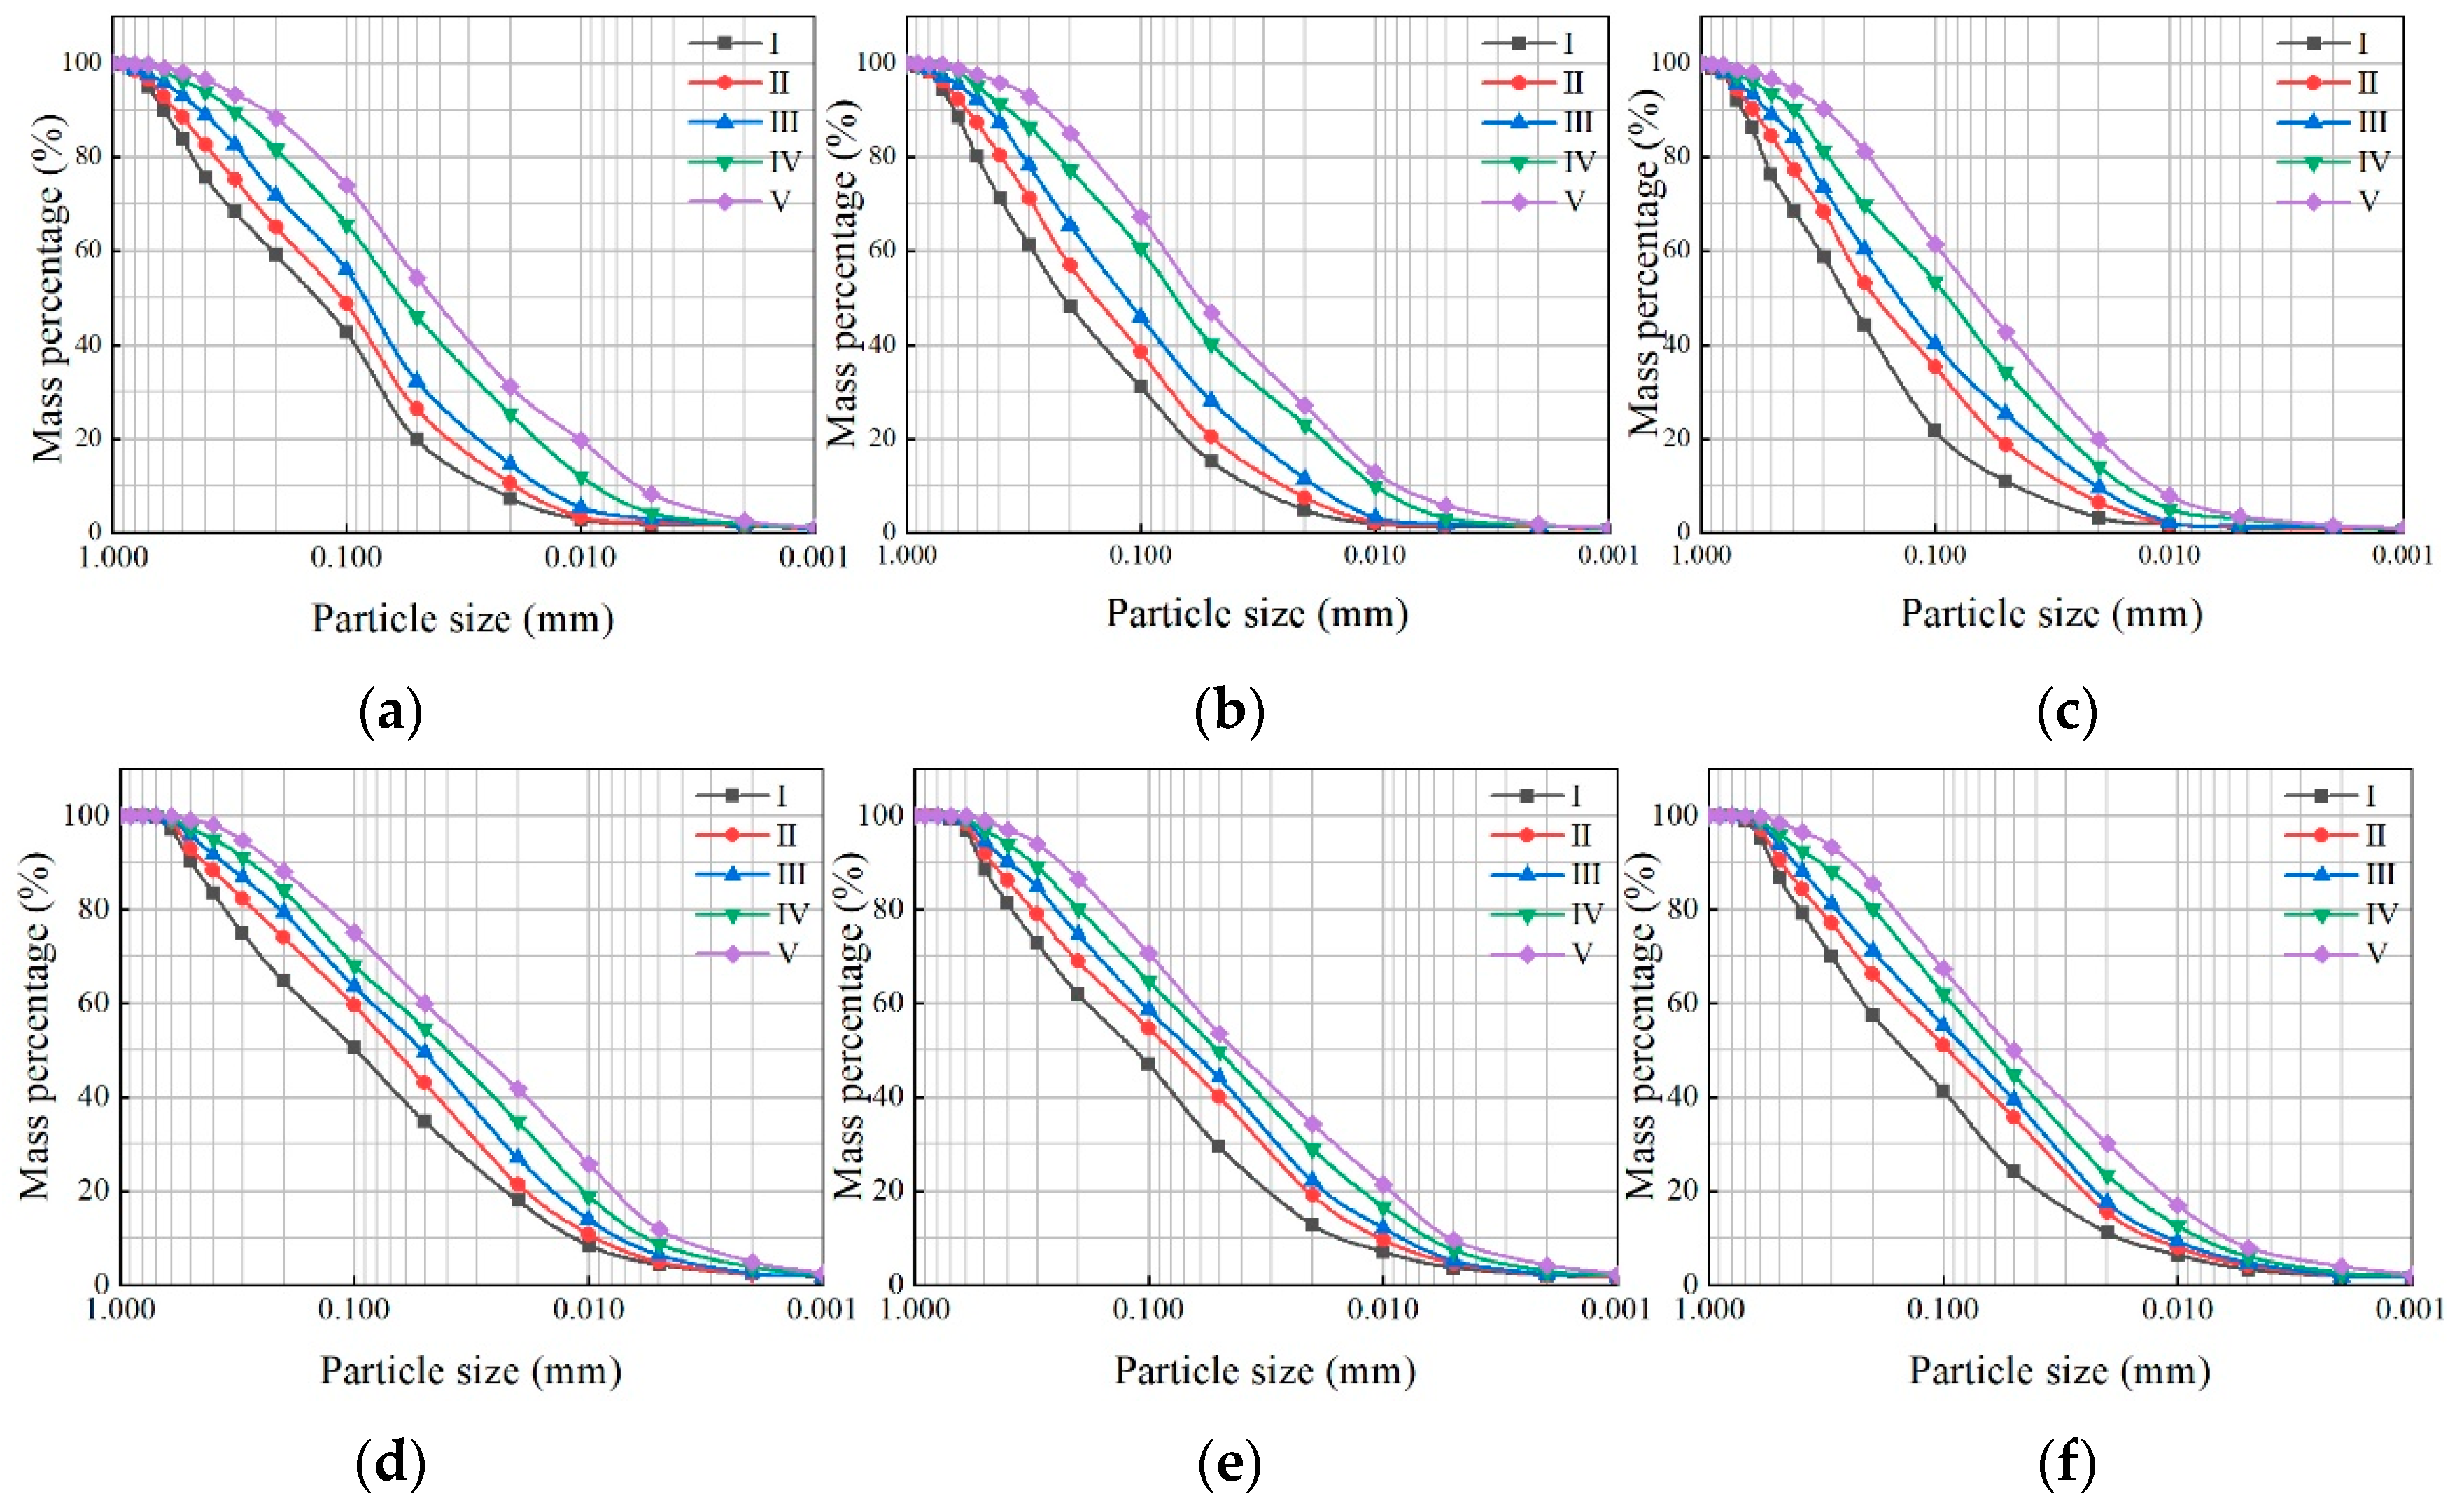
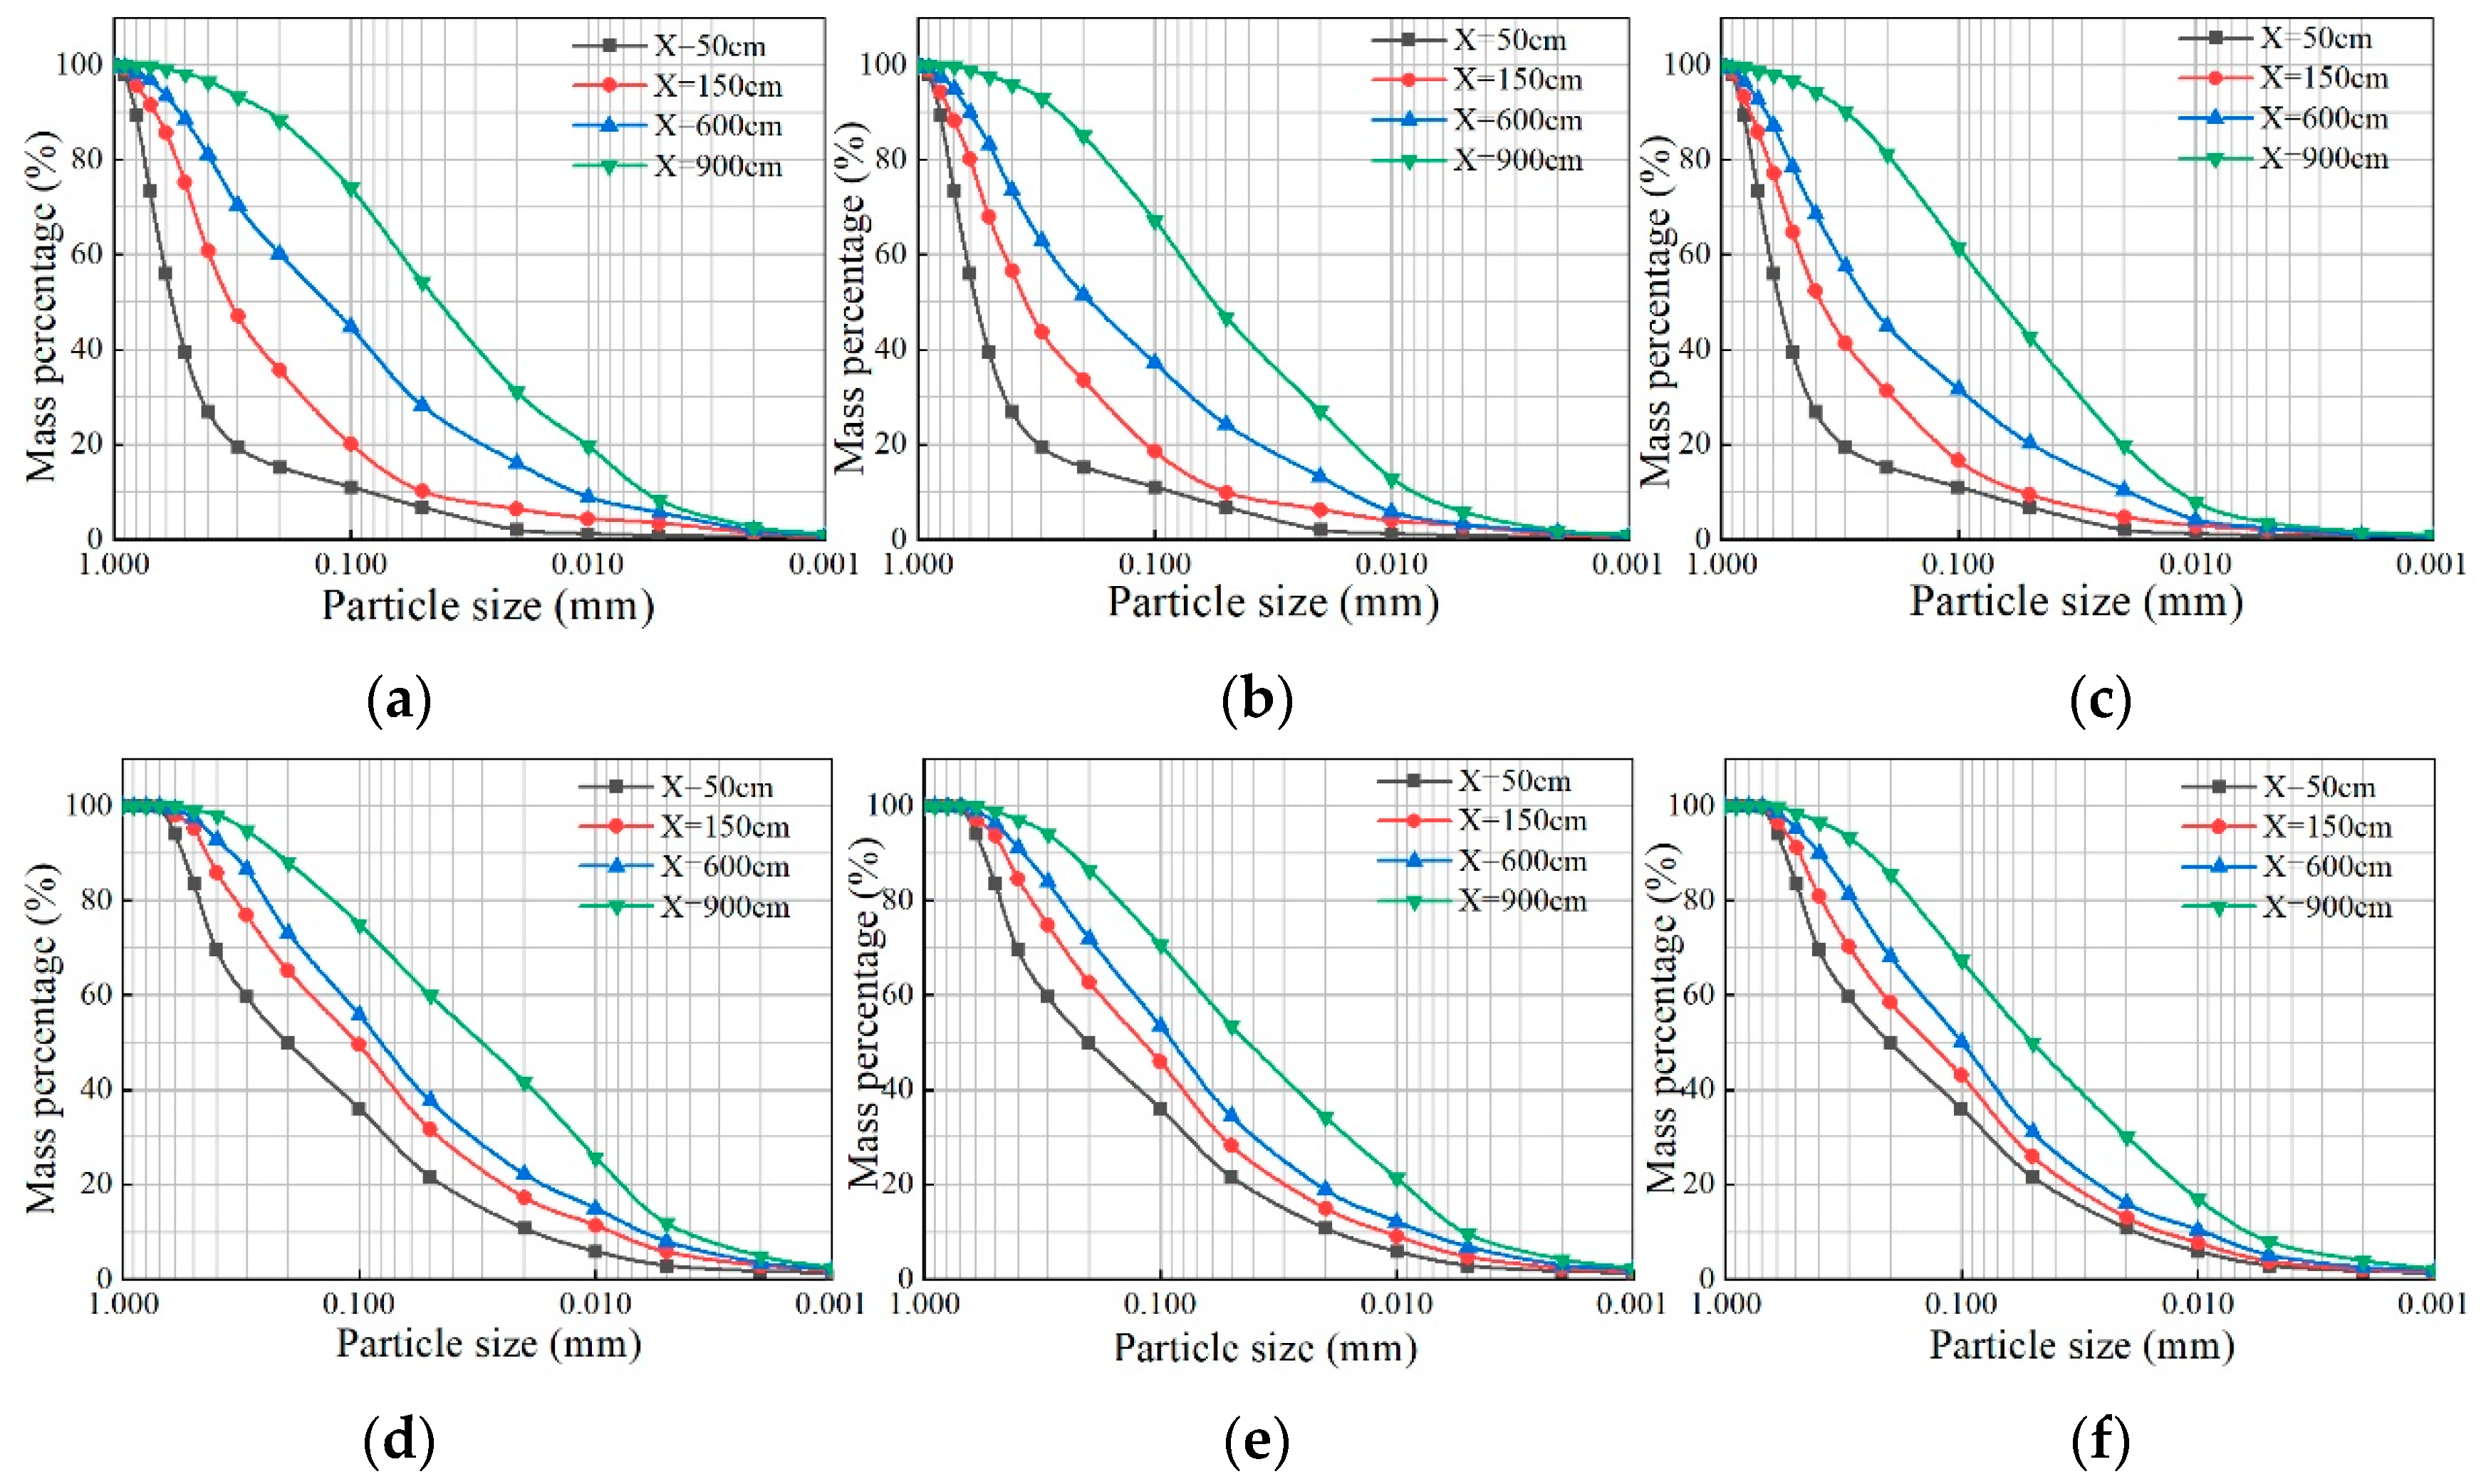
3.4.2. Distribution of Particle Size in Arc-Plate Sedimentation Tanks

A comprehensive study was undertaken to analyze the particle size distribution along the arc-plate sedimentation tank. In Figure 12, particle size distribution curves of sedimentation Tank V are presented under different inflow rate conditions. Sediment samples were meticulously collected at four bottom cross-sections (X = 50 cm, 150 cm, 600 cm, and 900 cm). Specifically, for an inflow rate of 60 m3/h and the treatment of sediment sample A, the mass percentage of sediment particles smaller than 0.05 mm was found to be 6.75%, 10.21%, 28.23%, and 54.28% at the X = 50 cm, 150 cm, 600 cm, and 900 cm cross-sections, respectively. Simultaneously, the mass percentage of particles larger than 0.1 mm was measured at 29.02%, 79.98%, 55.29%, and 25.98%, respectively. In the treatment of sediment sample B under identical flow conditions, the mass percentage of particles smaller than 0.05 mm was recorded as 21.41%, 29.68%, 32.72%, and 59.94% at the X = 50 cm, 150 cm, 600 cm, and 900 cm cross-sections, respectively. Concurrently, the mass percentage of particles larger than 0.1 mm was measured at 62.06%, 53.32%, 48.29%, and 24.95%, respectively. These findings suggest that along the arc-plate sedimentation tank, there is a gradual decrease in the mass percentage of particles larger than 0.1 mm, coupled with an increase in the mass percentage of particles smaller than 0.05 mm. This trend implies the effective removal of finer sediment particles along the tank, indicative of the sedimentation system’s efficiency in addressing smaller particle sizes. Moreover, it was noted that, under identical sediment conditions, the distribution pattern of sediment particles along the tank remained consistent at various flow rates. Notably, a more pronounced sediment removal efficiency was observed under lower flow conditions. This observation suggests that the sedimentation system shows a more effective particle removal performance when operating at lower flow rates.

4. Discussion

This paper investigates the sedimentation performance of an arc-plate linear sedimentation tank through experimental studies, employing various flow rates and sediment sample conditions. The analysis investigates the impact of the arc-plate sedimentation tank’s shape and quantity on the hydrodynamic state and sedimentation performance. Key conclusions drawn from experiments involving three inflow rates and two sediment sample conditions across five structural sedimentation tanks are as follows: under the same flow rate and sediment sample condition, a greater number of plates results in an enhanced sedimentation performance; conversely, processing the same sediment sample under different flow rates induces an increase in flow velocity, accompanied by a decrease in sedimentation efficiency. These findings align with previous studies conducted by Zha et al. [36] and Hu and Gui [37]. The experimental results reveal that the sedimentation efficiency of the arc-plate sedimentation tank exceeds that of the inclined-plate sedimentation tank. Numerous studies have investigated the removal efficiency of sediments in various types of linear sedimentation tanks, with most sediment removal rates falling within the range of 37% to 62% [38,39,40]. In this specific experiment, the arc-plate sedimentation tank achieved an impressive sediment removal rate of 82.45% for sediment sample A and a rate of 72.58% for sediment sample B at a flow rate of 60 m3/h.
The installation of plates in sedimentation tanks substantially improves the sedimentation efficiency of fine particle sediments. According to Nguyen et al. [23], the sedimentation efficiency of the inclined-plate sedimentation tank is intricately linked to the effective settling area. Increasing this area can reduce the settling distance of particles, consequently enhancing sedimentation efficiency. The equation representing the proportion of increasing effective settling area is as follows:
= A b A 0  
In this study, inclined-plate and arc-plate sedimentation tanks are analyzed and their horizontal projection areas are determined by considering the relevant geometric parameters.
A b 1 = n W L c o s θ  
  A b 2 = 2 n R L 1 c o s α 2
where ∆ represents the proportion of increasing effective settling area; A b 1   a n d   A b 2   indicate the horizontal projection area of the inclined plate before and after the increase; A 0 denotes the surface area of the sedimentation tank; n, W, and L signify the number, width, and length of the plates; θ designates the inclination angle of the inclined plate; and R and α show the radius and central angle of the arc plate.
Table 1 presents the details of the increase in the proportion of effective settling area for sedimentation tanks with five different structures.
Experimental investigations conducted under identical flow rates and sediment sample conditions revealed that, when compared to sedimentation Tanks I, II, and IV, as well as I, III, and V, an increase in the quantity of plates enhances the water flow characteristics and improves sediment settling efficiency. These results further support previous findings indicating that an increase in the effective settling area leads to improved sediment settling effectiveness [23]. Notably, the arc-plate sedimentation tank adheres to this observed pattern. Under constant effective settling area conditions, signifying a consistent plate quantity, a comparative analysis between sedimentation Tanks II and III, and IV and V reveals that the sedimentation efficiency of the arc-plate sedimentation tank surpasses that of the inclined-plate sedimentation tank. This improvement is attributed to the arc-shaped structure adjusting the flow characteristics within the tank through centripetal force. This adjustment results in an enhancement of hydraulic conditions by transforming the larger backflow area into a smaller eddy flow area between the plates, which is conducive to sediment settling. Furthermore, under equivalent proportions of increased effective settling area, the arc-plate sedimentation tank demonstrates reduced Reynolds numbers and diminished turbulence between the plates. In the comparison across different flow rates and sediment samples, the inflow rate emerges as a critical factor influencing sedimentation efficiency. An increase in flow rate leads to elevated flow velocities and intensified turbulence within the tank, which is unfavorable for sediment settling.

5. Conclusions

This study conducted a comparative investigation on various configurations of straight-line sedimentation tanks with plate structures through physical model experiments. The analysis encompassed three inflow rates and two sediment samples, exploring and discussing water flow velocity characteristics, sediment concentration distribution, sediment removal efficiency, and sediment particle size distribution at various cross-sections within the tank. Specifically, under the conditions involving an inflow rate ranging from 60 to 100 m3/h and processing sediment samples with median particle sizes of 571.110 μm and 162.254 μm, the main conclusions are as follows:
(1)
The distribution of the flow field and the velocity characteristics within the arc-plate sedimentation tank create a more favorable environment for the settling of sediment particles. The flow velocity between the arc plates is notably lower when compared to inclined plates, particularly when considering the downward direction of the combined velocity between the plates. This configuration effectively promotes a swifter settling of sediment. An increased number of plates leads to a reduction in the volume of the recirculation zone within the plate region. This alteration proves advantageous in facilitating the settling of sediment.
(2)
The arc-plate sedimentation tank proves highly effective in substantially reducing the surface sediment concentration within the plate region. When equipped with eight arc plates, the sediment concentration in the plate area measures between 0.5 and 1.32 kg/m3, indicating a noteworthy reduction ranging from approximately 8 to 34%, when compared to an equivalent number of inclined plates. In contrast to both plate-less tanks and those featuring four arc plates, the reduction in sediment concentration is even more pronounced. Specifically, the decrease ranges from about 33% to 60%, when compared to tanks without plates and from 18% to 44%, when compared to tanks with four arc plates. This highlights the superior sedimentation effect of the arc-plate sedimentation tank compared to its inclined-plate counterpart, with the sedimentation efficiency demonstrating an upward trend with an increasing number of arc plates.
(3)
The implementation of the arc-plate sedimentation tank results in a notable enhancement of sediment removal efficiency. Equipped with eight arc plates, the sediment removal efficiency spans from 57.13% to 82.45%, reflecting an improvement of approximately 7–10% when compared with a sedimentation tank featuring eight inclined plates. Furthermore, this efficiency increase becomes even more evident, showing a rise of about 47% to 60%, compared to a tank without plates, and a rise of 15% to 21% in comparison to a tank with four arc plates.
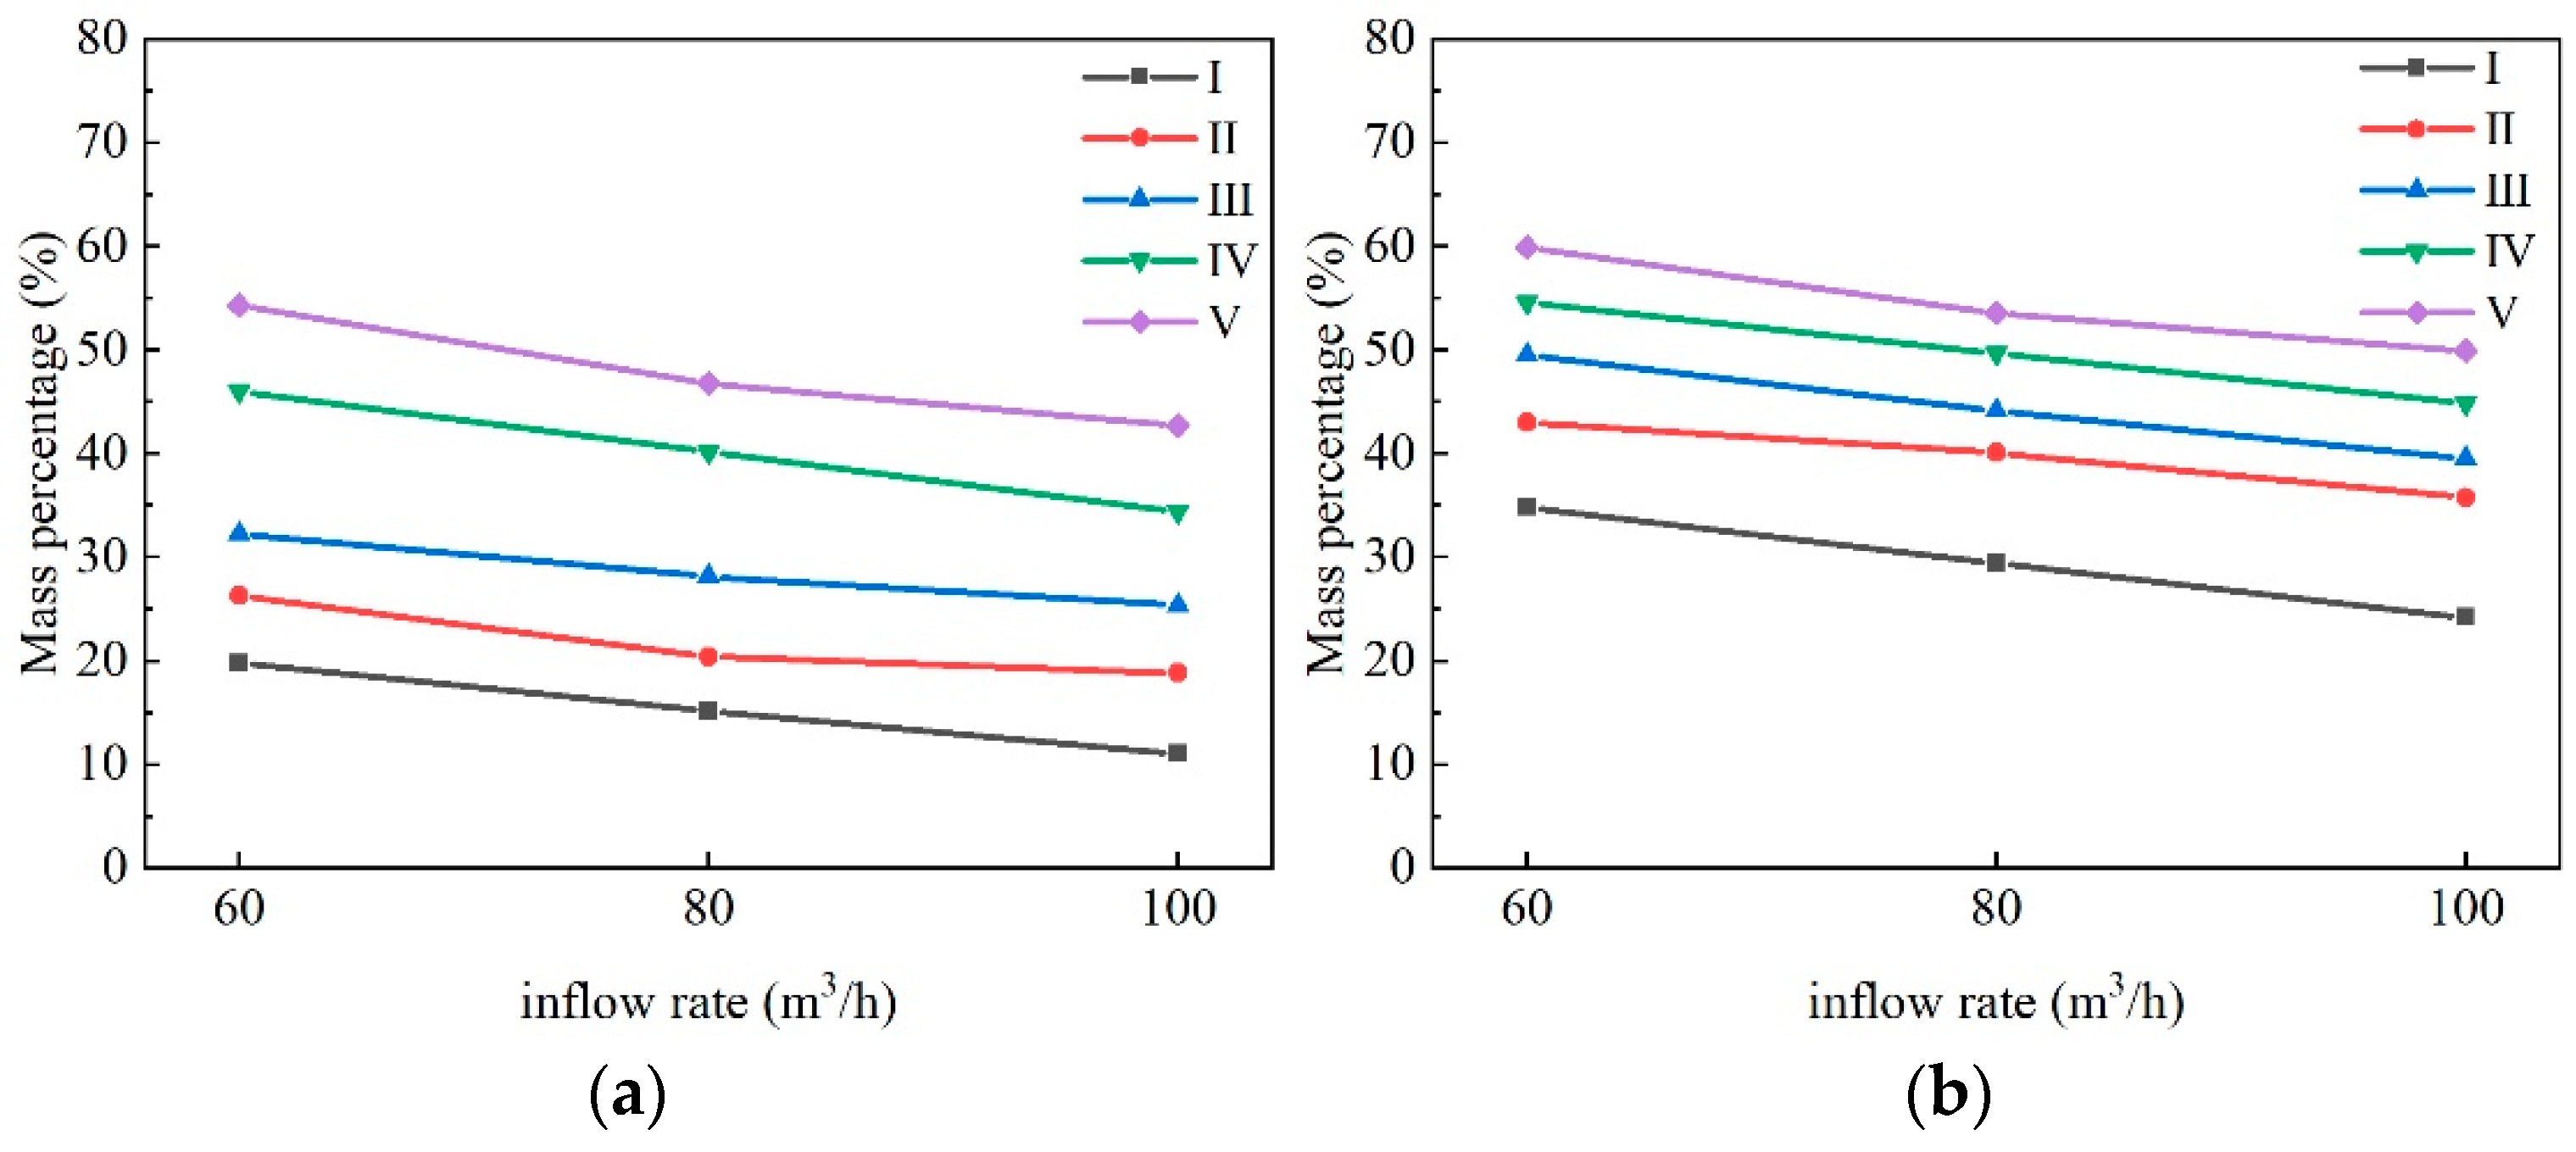
(4)
The arc-plate sedimentation tank demonstrates a noteworthy promotion of the settling of fine particle sediments. When equipped with eight arc plates, the mass fraction of sediment particles smaller than 0.05 mm in the tail bottom of the sedimentation tank falls within the range of 42.73% to 59.94%. This signifies an enhancement of approximately 5–7% compared to a sedimentation tank featuring eight inclined plates. Furthermore, this increase becomes more pronounced when compared to a tank without plates, showing a rise of about 25% to 32%, and when compared to a tank with four arc plates, exhibiting an increase of 10% to 20%.

Author Contributions

Methodology, X.H.; Investigation, P.W. and N.Y.; Resources, Y.H.; Data curation, P.W.; Writing—original draft, P.W.; Writing—review & editing, X.H.; Supervision, X.H.; Funding acquisition, Y.H. All authors have read and agreed to the published version of the manuscript.

Funding

This work is supported by the major projects of Xinjiang Production and Construction Corps, including “Research and Demonstration of Key Technologies for Radar Flow Measurement in High Sediment Concentration Channels in Irrigation Areas” (grant number 2023AB060-1).

Data Availability Statement

Data is contained within the article.

Conflicts of Interest

The authors declare no conflict of interest.

References

  1. Sun, J.; Kang, S. Current situation of water resource utilization in China and water-saving irrigation development strategy. Trans. CSAE 2000, 16, 1–5. [Google Scholar]
  2. Wang, Y.; Sheng, L.; Li, K.; Sun, H. Analysis of current situation of water resources in China and research on sustainable development countermeasures. J. Water Resour. Water Eng. 2008, 19, 10–14. [Google Scholar]
  3. Wu, P.; Feng, H. A preliminary study on the development strategy of water-saving agriculture in China. Trans. CSAE 2005, 21, 152–157. [Google Scholar] [CrossRef]
  4. Li, J.; Li, Y.; Wang, J.; Wang, Z.; Zhao, W. Micro-irrigation in China: History, Present and future. J. Hydraul. Eng. 2016, 47, 372–381. [Google Scholar] [CrossRef]
  5. Yuan, S.Q.; Li, H.; Wang, X.K. Development status, problems, trends and suggestions of water-saving irrigation equipment in China. J. Drain. Irrig. Mach. Eng. 2015, 33, 78–92. [Google Scholar] [CrossRef]
  6. Han, S.; Li, Y.; Xu, F.; Sun, D.; Feng, J.; Liu, Z.; Wu, R.; Wang, Z. Effect of Lateral Flushing on Emitter Clogging under Drip Irrigation with Yellow River Water and a Suitable Method. Irrig. Drain. 2018, 67, 199–209. [Google Scholar] [CrossRef]
  7. He, C.; Scott, E.; Rochfort, Q. Enhancing sedimentation by improving flow conditions using parallel retrofit baffles. J. Environ. Manag. 2015, 160, 1–6. [Google Scholar] [CrossRef]
  8. Li, Q.; Song, P.; Zhou, B.; Xiao, Y.; Muhammad, T.; Liu, Z.; Zhou, H.; Li, Y. Mechanism of intermittent fluctuated water pressure on emitter clogging substances formation in drip irrigation system utilizing high sediment water. Agric. Water Manag. 2019, 215, 16–24. [Google Scholar] [CrossRef]
  9. Liu, L.; Niu, W.; Zhou, B. Effect of fine sediment particle size on blockage of labyrinth channel irrigator. Trans. CSAE 2012, 28, 87–93. [Google Scholar] [CrossRef]
  10. Niu, W.; Liu, L. Effect of particle size and sediment content of muddy water on blockage of labyrinth channel. J. Drain. Irrig. Mach. Eng. 2011, 29, 547–552. [Google Scholar] [CrossRef]
  11. Yang, X.; Liu, F.; Wu, Y.; Liu, J. Discussion on the selection of the first filter equipment of Xinjiang farmland water-saving irrigation system. China Rural. Water Hydropower 2014, 56, 76–80. [Google Scholar] [CrossRef]
  12. Jiang, D.S.; Gao, P.; Xu, X.X.; Yang, S.W. Experimental design of structural form of sand settling tank in water cellar. Trans. CSAE 2001, 17, 27–31. [Google Scholar]
  13. Hu, S.K.; Li, W.X.; Yang, G.; Liu, N.N. The operation effect of linear sand settling pond in agricultural micro-irrigation was improved. J. Drain. Irrig. Mach. Eng. 2020, 38, 626–631. [Google Scholar]
  14. Hu, S.K.; Li, W.X.; Yang, G.; Liu, N.N.; Jing, J. Optimization of structure of improved linear sand settling pond for drip irrigation. Water Sav. Irrig. 2020, 11, 68–72. [Google Scholar]
  15. Shahrokhi, M.; Rostami, F.; Said, M.; Sabbagh-Yazdi, S.R.; Syafalni, S.; Abdullah, R. The effect of baffle angle on primary sedimentation tank efficiency. Can. J. Civ. Eng. 2012, 39, 293–303. [Google Scholar] [CrossRef]
  16. Shahrokhi, M.; Rostami, F.; Said, M.; Yazdi, S.; Syafalni, S. Computational investigations of baffle configuration effects on the performance of primary sedimentation tanks. Water Environ. J. 2013, 27, 484–494. [Google Scholar] [CrossRef]
  17. Shahrokhi, M.; Rostami, F.; Md Said, M.A.; Syafalni. Numerical modeling of baffle location effects on the flow pattern of primary sedimentation tanks. Appl. Math. Model. 2013, 37, 4486–4496. [Google Scholar] [CrossRef]
  18. Shahrokhi, M.; Rostami, F.; Said, M.A.M.; Yazdi, S.R.S.; Syafalni. The effect of number of baffles on the improvement efficiency of primary sedimentation tanks. Appl. Math. Model. 2012, 36, 3725–3735. [Google Scholar] [CrossRef]
  19. Asgharzadeh, H.; Firoozabadi, B.; Afshin, H. Experimental investigation of effects of baffle configurations on the performance of a secondary sedimentation tank. Sci. Iran. 2011, 18, 938–949. [Google Scholar] [CrossRef]
  20. Gao, H.; Stenstrom, M.K. Generalizing the effects of the baffling structures on the buoyancy-induced turbulence in secondary settling tanks with eleven different geometries using CFD models. Chem. Eng. Res. Des. 2019, 143, 215–225. [Google Scholar] [CrossRef]
  21. Gao, H.; Stenstrom, M.K. Evaluation of three turbulence models in predicting the steady state hydrodynamics of a secondary sedimentation tank. Water Res. 2018, 143, 445–456. [Google Scholar] [CrossRef] [PubMed]
  22. Gao, H.; Stenstrom, M.K. Turbulence and interphase mass diffusion assumptions on the performance of secondary settling tanks. Water Environ. Res. 2019, 91, 101–110. [Google Scholar] [CrossRef] [PubMed]
  23. Nguyen, T.; Dao, N.T.; Liu, B.; Terashima, M.; Yasui, H. Computational Fluid Dynamics Study on Attainable Flow Rate in a Lamella Settler by Increasing Inclined Plates. J. Water Environ. Technol. 2019, 17, 76–88. [Google Scholar] [CrossRef]
  24. Hartloper, C.; Kinzel, M.; Rival, D.E. On the competition between leading-edge and tip-vortex growth for a pitching plate. Exp. Fluids 2013, 54, 1447. [Google Scholar] [CrossRef]
  25. He, C.; Marsalek, J. Vortex Plate for Enhancing Particle Settling. J. Environ. Eng.-Asce. 2009, 135, 627–635. [Google Scholar] [CrossRef]
  26. Zhao, F.; Li, L.; Yang, L.; Zheng, Z. Study on the removal rate of the wing type inclined plate sand sink based on orthogonal test. J. China Res. Inst. Water Resour. Hydropower 2020, 18, 417–425. [Google Scholar] [CrossRef]
  27. Tao, H.; Qiu, X.; Li, Q.; Tan, Y.; Wang, M. Three-dimensional numerical simulation of flow field in separated gill with different gill spacing. Trans. CSAM 2014, 45, 183–189. [Google Scholar] [CrossRef]
  28. Tao, H.; Qiu, X.; Wang, M. Analysis of water and sediment separation efficiency and mechanism of separation gill based on numerical simulation. Water Sav. Irrig. 2015, 40, 66–71. [Google Scholar] [CrossRef]
  29. Tao, H.; Qiu, X.; Zhao, L.; Li, L. Numerical simulation of flow field in water-sand separating gills. Trans. CSAE 2013, 29, 38–46. [Google Scholar] [CrossRef]
  30. Wang, K.; Li, Y.; Ren, S.; Yang, P. Prototype Observation of Flow Characteristics in an Inclined-Tube Settling Tank for Fine Sandy Water Treatment. Appl. Sci. 2020, 10, 3586. [Google Scholar] [CrossRef]
  31. Wang, K.; Li, Y.; Ren, S.; Yang, P. A Case Study on Settling Process in Inclined-Tube Gravity Sedimentation Tank for Drip Irrigation with the Yellow River Water. Water 2020, 12, 1685. [Google Scholar] [CrossRef]
  32. Li, L.; Fu, H.; Tan, Y.; Pei, J.; Zhang, J. Test and mechanism analysis of sediment settling characteristics of a new type of heterogeneous flow sediment basin. Trans. CSAE 2021, 37, 90–98. [Google Scholar] [CrossRef]
  33. Wu, J.; Ma, J.; Tang, Y. Research on the head loss of the regulating plate in sand settling basin. Yellow River 2011, 33, 25–26. [Google Scholar] [CrossRef]
  34. Demir, A. Determination of settling efficiency and optimum plate angle for plated settling tanks. Water Res. 1995, 29, 611–616. [Google Scholar] [CrossRef]
  35. Liu, Z.; Xiao, Y.; Li, Y.; Zhou, B.; Feng, J.; Han, S.; Muhammad, T. Influence of operating pressure on emitter anti-clogging performance of drip irrigation system with high-sediment water. Agric. Water Manag. 2019, 213, 174–184. [Google Scholar] [CrossRef]
  36. Zha, Y.; Hou, P.; Liu, Z.; Wang, K.; Li, Y.; Wang, C. Influence of inclined pipe layout on the sedimentation of Yellow River sediment in sand basin. J. Irrig. Drain. 2023, 42, 1–11. [Google Scholar] [CrossRef]
  37. Hu, B.; Gui, L. Numerical simulation of water flow pattern in inclined slab settling pond. J. Southwest Univ. Natl. (Nat. Sci. Ed.) 2012, 38, 425–430. [Google Scholar] [CrossRef]
  38. Doroodchi, E.; Zhou, J.; Fletcher, D.F.; Galvin, K.P. Particle size classification in a fluidized bed containing parallel inclined plates. Miner. Eng. 2005, 19, 162–171. [Google Scholar] [CrossRef]
  39. Schamber, D.R.; Larock, B.E. Numerical Analysis of Flow in Sedimentation Basins. J. Hydraul. Div. 1981, 107, 575–591. [Google Scholar] [CrossRef]
  40. Stamou, A.I.; Adams, E.W.; Rodi, W. Numerical modeling of flow and settling in primary rectangular clarifiers. J. Hydraul. Res. 2010, 27, 665–682. [Google Scholar] [CrossRef]
Figure 1. Model diagram of linear sedimentation tank with key components. 1. Water inlet; 2. adjusting flow board; 3. flow deflector; 4. plate region; 5. side overflow weir; 6. filter screen; 7. clean water tank.
Water 16 01075 g001
Figure 2. Field diagram of the testing platform: (a) sediment stirring device and (b) field diagram of the linear sedimentation tank test platform.
Water 16 01075 g002
Figure 3. Schematic diagram of the structure of the testing platform: (a) top view and (b) section view.
Water 16 01075 g003
Figure 4. Five structural sedimentation tanks: (a) Tank I with no plates, (b) Tank II with four inclined plates, (c) Tank III with four arc plates, (d) Tank IV with eight inclined plates, and (e) Tank V with eight arc plates.
Water 16 01075 g004
Figure 6. Cloud and vector diagrams of flow velocity along sedimentation tank I.
Water 16 01075 g006
Figure 7. Flow velocity distribution and vector diagrams at Y = 20 cm, 40 cm, and 75 cm sections for sedimentation tanks with different structures. (a) Cloud and vector diagrams of flow velocity in different sedimentation tanks at Y = 20 cm. (b) Cloud and vector diagrams of flow velocity in different sedimentation tanks at Y = 40 cm. (c) Cloud and vector diagrams of flow velocity in different sedimentation tanks at Y = 75 cm.
Water 16 01075 g007
Figure 8. (a,b) show sediment concentration distribution in sediment sample A across sedimentation Tanks I and V. (ce) show sediment concentration distribution in sediment sample A across the plate region of sedimentation tanks under Z = 80 cm, Z = 110 cm, and Z = 140 cm.
Water 16 01075 g008
Figure 9. Sediment sample sediment removal rates of two sediment sample types in various sedimentation tanks. (a) Sample A and (b) Sample B.
Water 16 01075 g009
Figure 10. Comparative sediment particle size distribution curves of various sedimentation tanks under different operating conditions. (ac) show sediment particle size distribution curves of different sedimentation tanks at an inflow rate of 60–100 m3/h, when treating sediment sample A. (df) display sediment particle size distribution curves of different sedimentation tanks at an inflow rate of 60–100 m3/h, when treating sediment sample B. The vertical axis in the figure represents the mass percentage of sediment particles smaller than a certain particle size.
Water 16 01075 g010
Figure 11. Mass percentages of sediment particles smaller than 0.05 mm in different sedimentation tanks under varied flow rates and sediment sample conditions. (a) Sediment sample A and (b) sediment sample B. The vertical axis in the figure represents the mass percentage of sediment particles smaller than 0.05 mm.
Water 16 01075 g011
Figure 12. The particle size distribution curves of sedimentation Tank V under different inflow rate conditions. (ac) show sediment particle size distribution curves at four bottom cross-sections (X = 50 cm, 150 cm, 600 cm, and 900 cm) for an inflow rate ranging from 60 to 100 m3/h, illustrating the treatment of sediment sample A. (df) display sediment particle size distribution curves at the same four bottom cross-sections (X = 50 cm, 150 cm, 600 cm, and 900 cm) for an inflow rate of 60–100 m3/h, focusing on the treatment of sediment sample B. The vertical axis in the figure represents the mass percentage of sediment particles smaller than a certain particle size.
Water 16 01075 g012
Table 1. The proportion of increasing effective settling area.
Sedimentation TankIIIIIIIVV
Δ00.40.40.80.8
Disclaimer/Publisher’s Note: The statements, opinions and data contained in all publications are solely those of the individual author(s) and contributor(s) and not of MDPI and/or the editor(s). MDPI and/or the editor(s) disclaim responsibility for any injury to people or property resulting from any ideas, methods, instructions or products referred to in the content.

