Article

Water Erosion Response to Rainfall Type on Typical Land Use Slopes in the Red Soil Region of Southern China

1
Jinshan Soil and Water Conservation Research Center, Fujian Agriculture and Forestry University, Fuzhou 350002, China
2
Fujian Soil and Water Conservation Experimental Station, Fuzhou 350003, China
*
Author to whom correspondence should be addressed.
Water 2024, 16(8), 1076; https://doi.org/10.3390/w16081076
Submission received: 3 March 2024 / Revised: 1 April 2024 / Accepted: 3 April 2024 / Published: 9 April 2024
(This article belongs to the Special Issue Evolution of Soil and Water Erosion)

Abstract

:
Land use and rainfall are two important factors affecting soil erosion processes. The red soil region of southern China is a representative region with high rainfall amounts and rapidly changing land use patterns where the water erosion process is sensitive to changes in land use and rainfall. To comprehensively understand the water erosion response to land use and rainfall in this region, a 6-year in situ experiment based on eight plots (bare land and seven typical land uses) was conducted from 2015 to 2020. The 320 rainfall events were divided into 4 types, and there were 3 main rainfall types. The runoff of different rainfall types was primarily determined by the rainfall amount, while the soil erosion of different rainfall types was primarily determined by the rainfall intensity. High-intensity rainfall contributed the most to both total runoff and soil erosion. Compared with bare land, the seven typical land uses reduced runoff and soil erosion by more than 75%. Grassland, cropland, and forest with low vegetation coverage experienced high runoff and soil erosion, while shrubland most effectively reduced runoff and soil erosion. The combination of land use and rainfall type significantly affected the annual average runoff depth, soil erosion modulus, and soil loss coefficient. Rainfall types can change the relationship between runoff and soil erosion for different land uses. The runoff and soil erosion of bare land were highly correlated with rainfall characteristics, while vegetation weakened this relationship under short- or moderate-duration rainfall. To effectively reduce water erosion, high-intensity rainfall should receive special attention, and all land uses should ensure that vegetation is well developed, especially understory vegetation.

1. Introduction

Soil is a major natural resource for life on earth and provides a wide range of ecosystem services for humans [1]. However, soil erosion has become one of the most severe global eco-environmental problems [2], resulting in not only on-site soil loss, land degradation, nutrient loss, and biodiversity reduction but also in off-site impacts, such as surface water pollution, river channel and reservoir deposition, and increased flood risk [3,4]. In recent decades, various studies on soil erosion have been carried out, and many soil and water conservation methods have been proposed and implemented [4,5,6]. However, it is estimated that approximately 35.9 Pg of soil per year is lost from land [7]. Therefore, the effective and economical control of soil erosion is a long-term and difficult task for scientists and engineers [8].
Rainfall-induced soil erosion is the most important type of soil erosion, and it includes the following two distinct processes: the detachment of soil particles caused by raindrop splashing and the subsequent scouring of surface runoff or laminar flow [9]. Rainfall represents the main driving force of water erosion. Rainfall characteristics, such as the rainfall amount, duration, intensity, kinetic energy, and erosivity, notably affect runoff and soil erosion processes [2,8,10]. Simulated rainfall experiments are widely used to explore the impact of one or several rainfall characteristics on runoff and soil erosion [11,12]. These methods have several advantages [11]. Nevertheless, natural rainfall usually fluctuates in rainfall intensity; thus, the rainfall process is complex and dynamic [13]. It is difficult to reproduce the conditions of natural rainfall using simulated rainfall experiments [14]. Dividing natural rainfall into different types and analyzing these types separately are currently effective methods for revealing the actual impact of natural rainfall on the soil erosion process [15,16]. Many studies have shown that rainfall type greatly affects runoff and soil erosion [15,17]. However, due to the temporal and spatial heterogeneity of rainfall [18], there may be significant differences in the classification of rainfall types in different periods and regions. For example, summer precipitation in the Upper Yangtze River basin during 1960–2002 showed an insignificant upwards trend [19], while the trend of extreme precipitation in Xinjiang increased [20]. These differences may have diverse impacts on regional soil erosion.
In addition, the water erosion process is affected by many other factors [21], among which land use is considered one of the most important factors influencing the occurrence and intensity of runoff and soil erosion [22,23]. As a joint reflection of anthropogenic activities and their interactions with the natural ecosystem [24], land use can greatly reduce soil erosion after proper regulation [22]. However, the amount of runoff and soil erosion on the same land use type may vary greatly under different conditions. Taking southern China as an example, Chen et al. [23] found that all land use types (except bare land) were included in the six least runoff-prone and erosion-prone land use subtypes, and all land use types (except grassland and shrubland) were included in the seven most runoff-prone and erosion-prone land use subtypes. The reason for this phenomenon may be that the runoff and soil erosion of most land uses are affected by vegetation conditions [25,26], soil and water conservation measures [4], climate [27], and other factors. Many studies [3,23] also believe that land use has a limited influence on soil erosion if the vegetation cover is well developed or if good management practices are implemented.
There may be complex interactions among factors affecting soil erosion, and these interactions are considered a significant source of prediction uncertainty [21]. However, previous studies focused mostly on the effects of single factors on runoff and soil erosion [28], ignoring the effects of multifactor interactions on these processes. Although researchers have studied the interaction effects between different factors on runoff and soil erosion in recent years [14,21], the existing studies are still insufficient. Against the background of global climate change, vegetation and rainfall will be affected first, which will lead to great changes in water erosion. Therefore, it is necessary to systematically comprehend the impact of land use, rainfall, and their combination on runoff and soil erosion, which will help us predict and control soil and water loss under future climate change.
In China, population growth, rapid development, and intense human activity have greatly accelerated the land degradation induced by soil erosion [2,6]. The Chinese government has implemented erosion control projects (e.g., the “Grain for Green” project on the Loess Plateau). Although these projects have significantly reduced soil erosion, there is still a considerably high soil erosion rate in China [7]. The red soil region has high vegetation coverage, but it is a hot spot for soil erosion [2]. There are high amounts of rainfall that are unevenly distributed, rapidly changing land use patterns, and large areas of plantations in the red soil region. However, the impacts of rainfall and land use on runoff and soil erosion in the red soil region are still unclear, which restricts land use sustainability and soil and water conservation effectiveness in afforestation. Changting County is one of the most severely affected water and soil loss areas in the red soil region of southern China, and it has climatic conditions, land use types, and soil erosion characteristics that are typical of the red soil region [29]. Therefore, the Zhuxi watershed in Changting County of Fujian Province was selected as the study area representing the red soil region in southern China, and several typical mountain land use plots were monitored in situ. Finally, our study obtained and analyzed a long-term data set of runoff and soil erosion based on natural rainfall. The specific objectives were to (i) investigate the characteristics of runoff and soil erosion among different land uses, (ii) compare the runoff and soil erosion of different rainfall types and their relationships with rainfall characteristics, and (iii) evaluate the impacts on runoff and soil erosion caused by the combination of rainfall and land use.

2. Materials and Methods

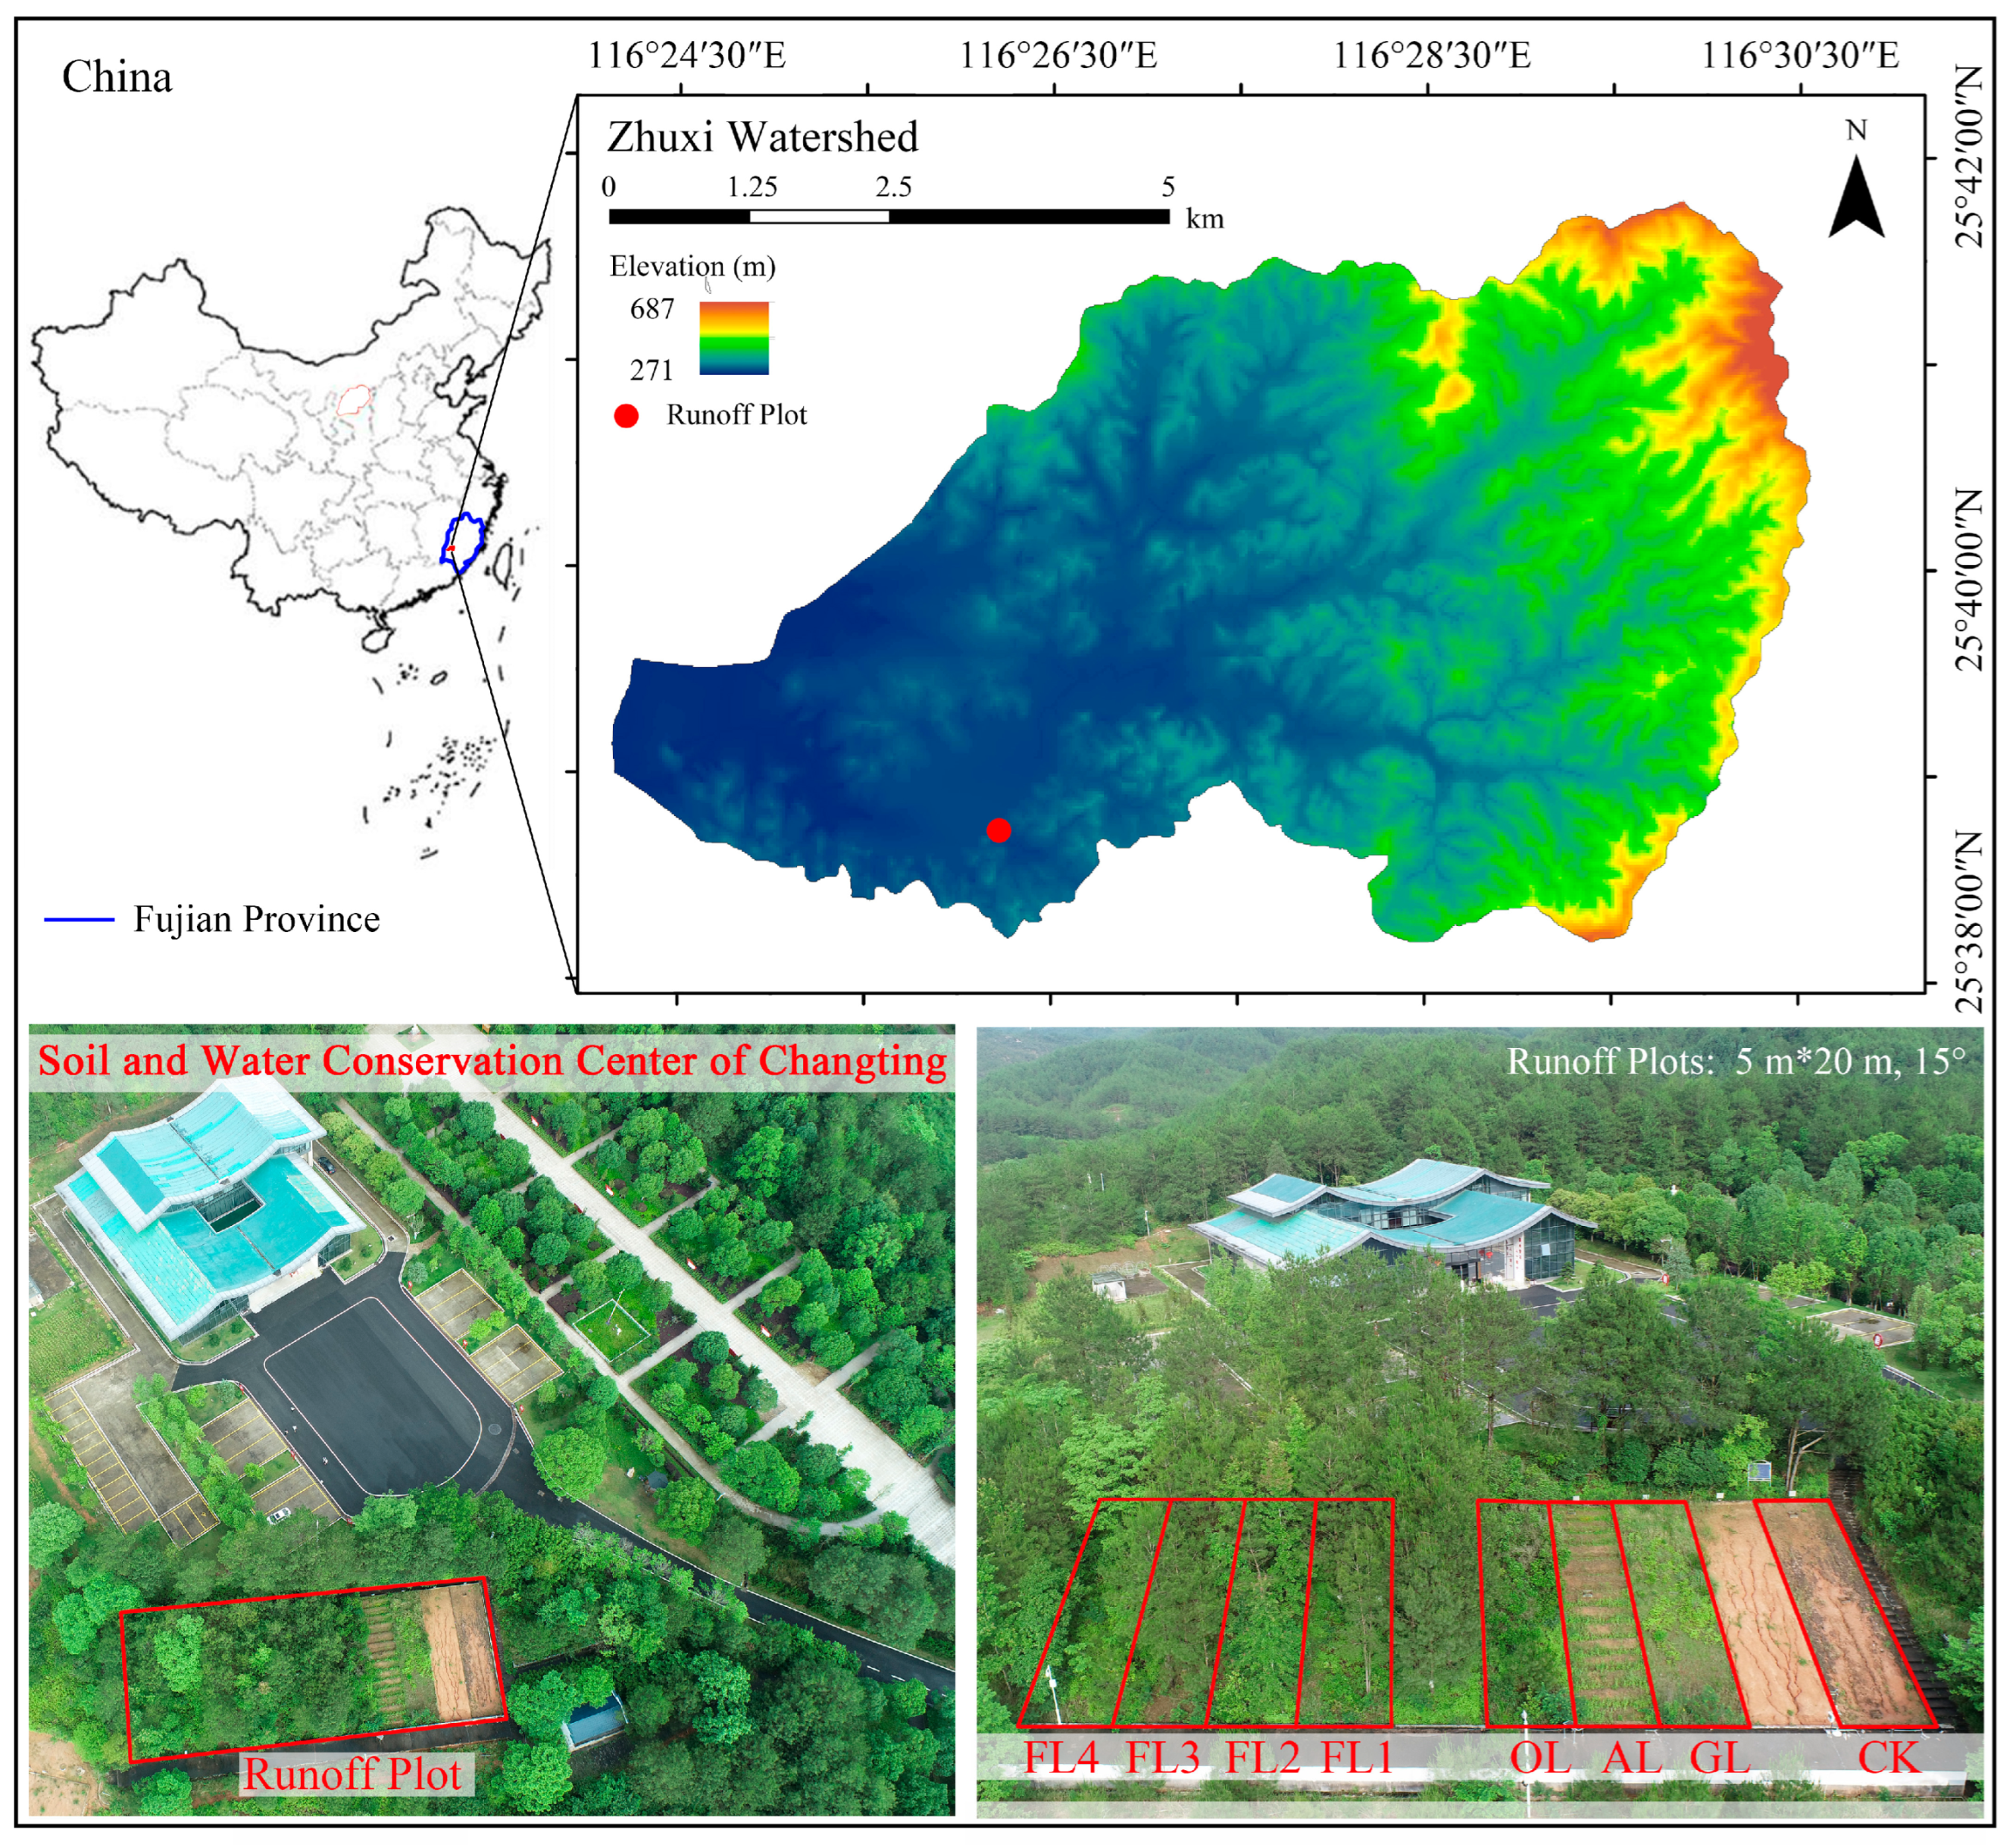
2.1. Study Area and Experimental Plots

This study was carried out in the Zhuxi watershed (116°23′30″–116°30′30″ E, 25°38′15″–25°42′55″ N) in Changting County of Fujian Province, which is a field experimental site of the Soil and Water Conservation Center of Changting (Figure 1). The Zhuxi watershed, with an area of 43.93 km2, is located in the southeastern part of the red soil region in China. The terrain is dominated by low mountains and hills, with an elevation of 270–680 m. The main soil type is red soil, and the bedrock is granite. The region has a humid subtropical monsoon climate, with an annual average temperature of 18.3 °C and an annual average rainfall amount of 1695.50 mm (1956–2015) [30]. The zonal vegetation in the watershed is subtropical evergreen broad-leaved forest, which has been destroyed by long-term human activities. At present, most forested areas are Pinus massoniana secondary forests and plantations, which have become the main vegetation types in the watershed [30].
Eight plots in the study area were constructed in 2000. All plots were located in the middle slope, with a slope gradient of 15° and an aspect of 270°. The projection area of the plots was 100 m2 (20 m in length, 5 m in width). The soil type was red soil. Rectangular water channels were built at the end of all the plots to collect the runoff and sediment. Finally, the runoff and the sediment were transferred into runoff ponds. The basic soil (in 2015) and vegetation information for each plot is listed in Table 1 and Table 2, respectively. The plots were either bare land or one of 7 typical mountain land use and vegetation combinations, and the vegetation species were the local native species. Bare land (CK) was used as a control, and the other plots were grassland (GL), cropland (AL), orchard (OL), shrubland (FL1), broad-leaved forest (FL2), Pinus massoniana forest (FL3), and Pinus massoniana and shrub forest (FL4). In 2015, soil samples were collected from different plots to obtain basic soil information (Table 1), and the soil organic matter (SOM) content was determined via the wet-oxidation method [31]. Except for AL, the 6 typical land use plots were planted with trees in 2006, and all the plots were repaired and managed in 2013.

2.2. Rainfall, Runoff, and Soil Erosion Measurements

The study period was from January 2015 to December 2020. During this time, there were no management practices in any of the plots except AL, and the vegetation coverage of the 8 plots did not change significantly. The data for each rainfall event were collected by a water level rainfall data acquisition instrument (WJF-2) installed in the plots, and the collected data included the rainfall P (mm), rainfall duration T (min), rainfall intensity I (mm/h), and runoff depth R (mm). The average rainfall intensity Im (mm/h), maximum rainfall intensity at 30 min I30 (mm/h), and rainfall erosivity EI30 (MJ·mm·hm−2·h−1) were calculated by automatic weather station software (CAWS600-R(T), Huayun Technology Development Co., Beijing, China). After rainfall, the water and sediment collected in the runoff pond were fully mixed, and sediment samples were collected from each runoff pond using a 1 L plastic bottle. All the samples were weighed and allowed to stand for 24 h. Then, the upper clear liquid was removed, and the sample was transferred to a wide-open container. Finally, the sediment samples were placed in a cool place to air dry. Then, they were weighed, and the amount of soil erosion was measured.
There were 320 rainfall events (erosive rainfall, as shown in Figure 2) causing runoff and soil erosion in the CK, and the rainfall amount was 6247.40 mm, accounting for 65.19% of the total rainfall (9582.80 mm) in the study area from 2015 to 2020. The annual rainfall and erosive rainfall (Figure 2a) were 1383.8~2251.5 mm and 1071.7~2015.0 mm, respectively. Most rainfall occurred from March to September, accounting for 70%~88%, and June had the highest rainfall amount (Figure 2b).
Runoff and soil erosion were reflected by the runoff depth (mm) and soil erosion modulus (t/hm2), respectively. The runoff depth (R) was obtained directly by WJF-2, and the soil erosion modulus (S) [8] (Zhu et al., 2021) was computed as follows:
S = SL / A
where SL is the soil loss during a single rainfall event (g) and A is the projected area of the runoff plot (m2).
In addition to R and S, the runoff and sediment per unit rainfall were studied; these values were represented by the runoff coefficient (RC) and soil loss coefficient (SLC) [13]. Generally, a high RC (%) or SLC (t·km−2·mm−1) indicates that a plot has a high risk of soil erosion; that is, more runoff and soil erosion will be generated under the same rainfall. RC and SLC were calculated as follows:
RC = R / P
SLC = S / P
where R is the runoff depth (mm), S is the soil erosion modulus (t/hm2), and P is the amount of rainfall (mm) causing runoff/sediment.

2.3. Rainfall Threshold of Runoff and Soil Erosion Generation

The four rainfall characteristics (P, Im, I30, and EI30) were selected to calculate the rainfall threshold of runoff and sediment generation in 7 typical land uses [32]. (1) All rainfall events that generated runoff and sediment were arranged in descending order based on rainfall characteristics. (2) The cumulative R and S in descending order of rainfall characteristics and the ratio of the cumulative R (S) to the total R (S) of rainfall events were calculated. (3) The regression equation of rainfall characteristics and the associated cumulative percentages of R and S were established. (4) When the ratio of cumulative R(S) to total R (S) was 95%, the corresponding rainfall characteristics were the rainfall thresholds of runoff and sediment generation. The mixing index (MI) was calculated to evaluate the rationality of the thresholds of runoff- and sediment-generating rainfall [33]. The smaller the MI value was, the better the threshold.
MI = N up + N dn N t
where MI is the mixing index, indicating the rate of the number of events that were “misclassified” in the rainfall events that generated runoff (sediment) or not to the number of total events; Nup indicates the number of rainfall events that did not generate runoff (sediment) with characteristics higher than the thresholds; Ndn indicates the number of rainfall events that generated runoff (sediment) with characteristics smaller than the thresholds; and Nt indicates the total number of events.

2.4. Rainfall Classification

According to the results of several previous studies (e.g., [15,34]), the T, P, and I30 of single rainfall events were selected as the characteristic indicators for classification. The K-means clustering method was used to classify the 320 rainfall events measured from 2015 to 2020 into several types. The classification results indicated that, as the clustering values increased, the within-groups sum of squared error (WSS) of T and P first decreased significantly and then tended to flatten, and the inflection point of the changes in their WSS corresponded to a clustering value of 4. Additionally, when the clustering value was greater than 4, there were 2 or more rainfall types containing only 1–3 rainfall events, which was obviously unreasonable. Therefore, the rainfall in this study can be divided into 4 types. The WSS was calculated as follows:
WSS = 1 NT - 1 i = 1 N t = 1 T x it - x ¯ i 2
where NT is the total number of events (320); N is the number of types; T is the number of events of each rainfall type; x is the rainfall characteristic value; and x ¯ is the mean of the rainfall characteristic value of each rainfall type.

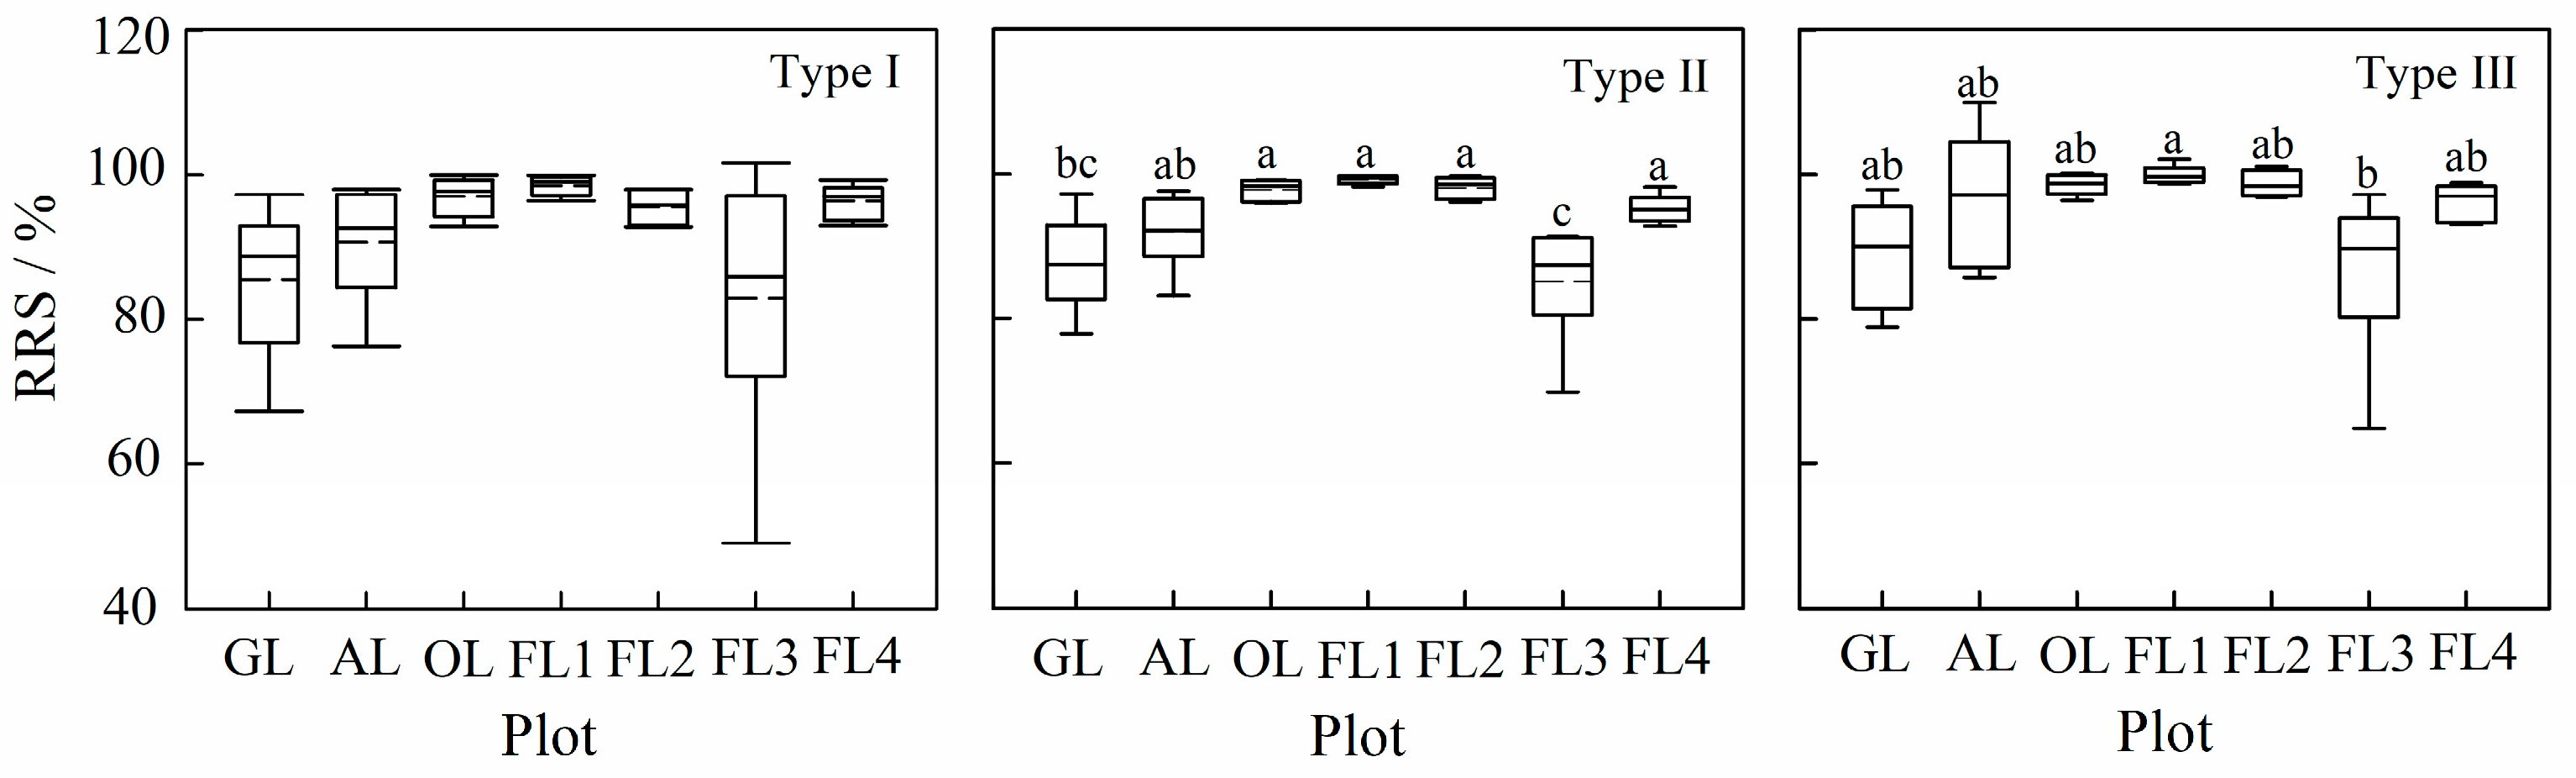
2.5. The Ratio between Runoff and Soil Erosion Reduction

The ratio between runoff reduction and sediment reduction (RRS, %) [4] was calculated and used to analyze the relative effectiveness between the runoff and soil erosion reduction of different land uses. A low RRS indicated that land use had a greater effect on reducing sediment than on reducing runoff.
RRE = R c R t R c × 100
SRE = S c S t S c × 100
RRS = RRE SRE × 100
where Rc and Rt represent the runoff depth for plots of bare land and 7 typical land uses, respectively. Sc and St represent the soil erosion modulus for plots of bare land and 7 typical land uses, respectively. RRE and SRE represent runoff reduction and sediment reduction, respectively.

2.6. Data Analysis

One-way ANOVA and the least significant difference (LSD) test were employed to detect the differences in the runoff and soil erosion indicators. K-means clustering was used to classify the rainfall types. Multivariate ANOVA and Pearson correlation were used to determine the relationships between rainfall, land use, runoff, and soil erosion, and the goodness-of-fit of the relationships was evaluated by Pearson correlation coefficients [8]. All data were analyzed by IBM SPSS (version 25.0) and SigmaPlot 12.5 software.

3. Results

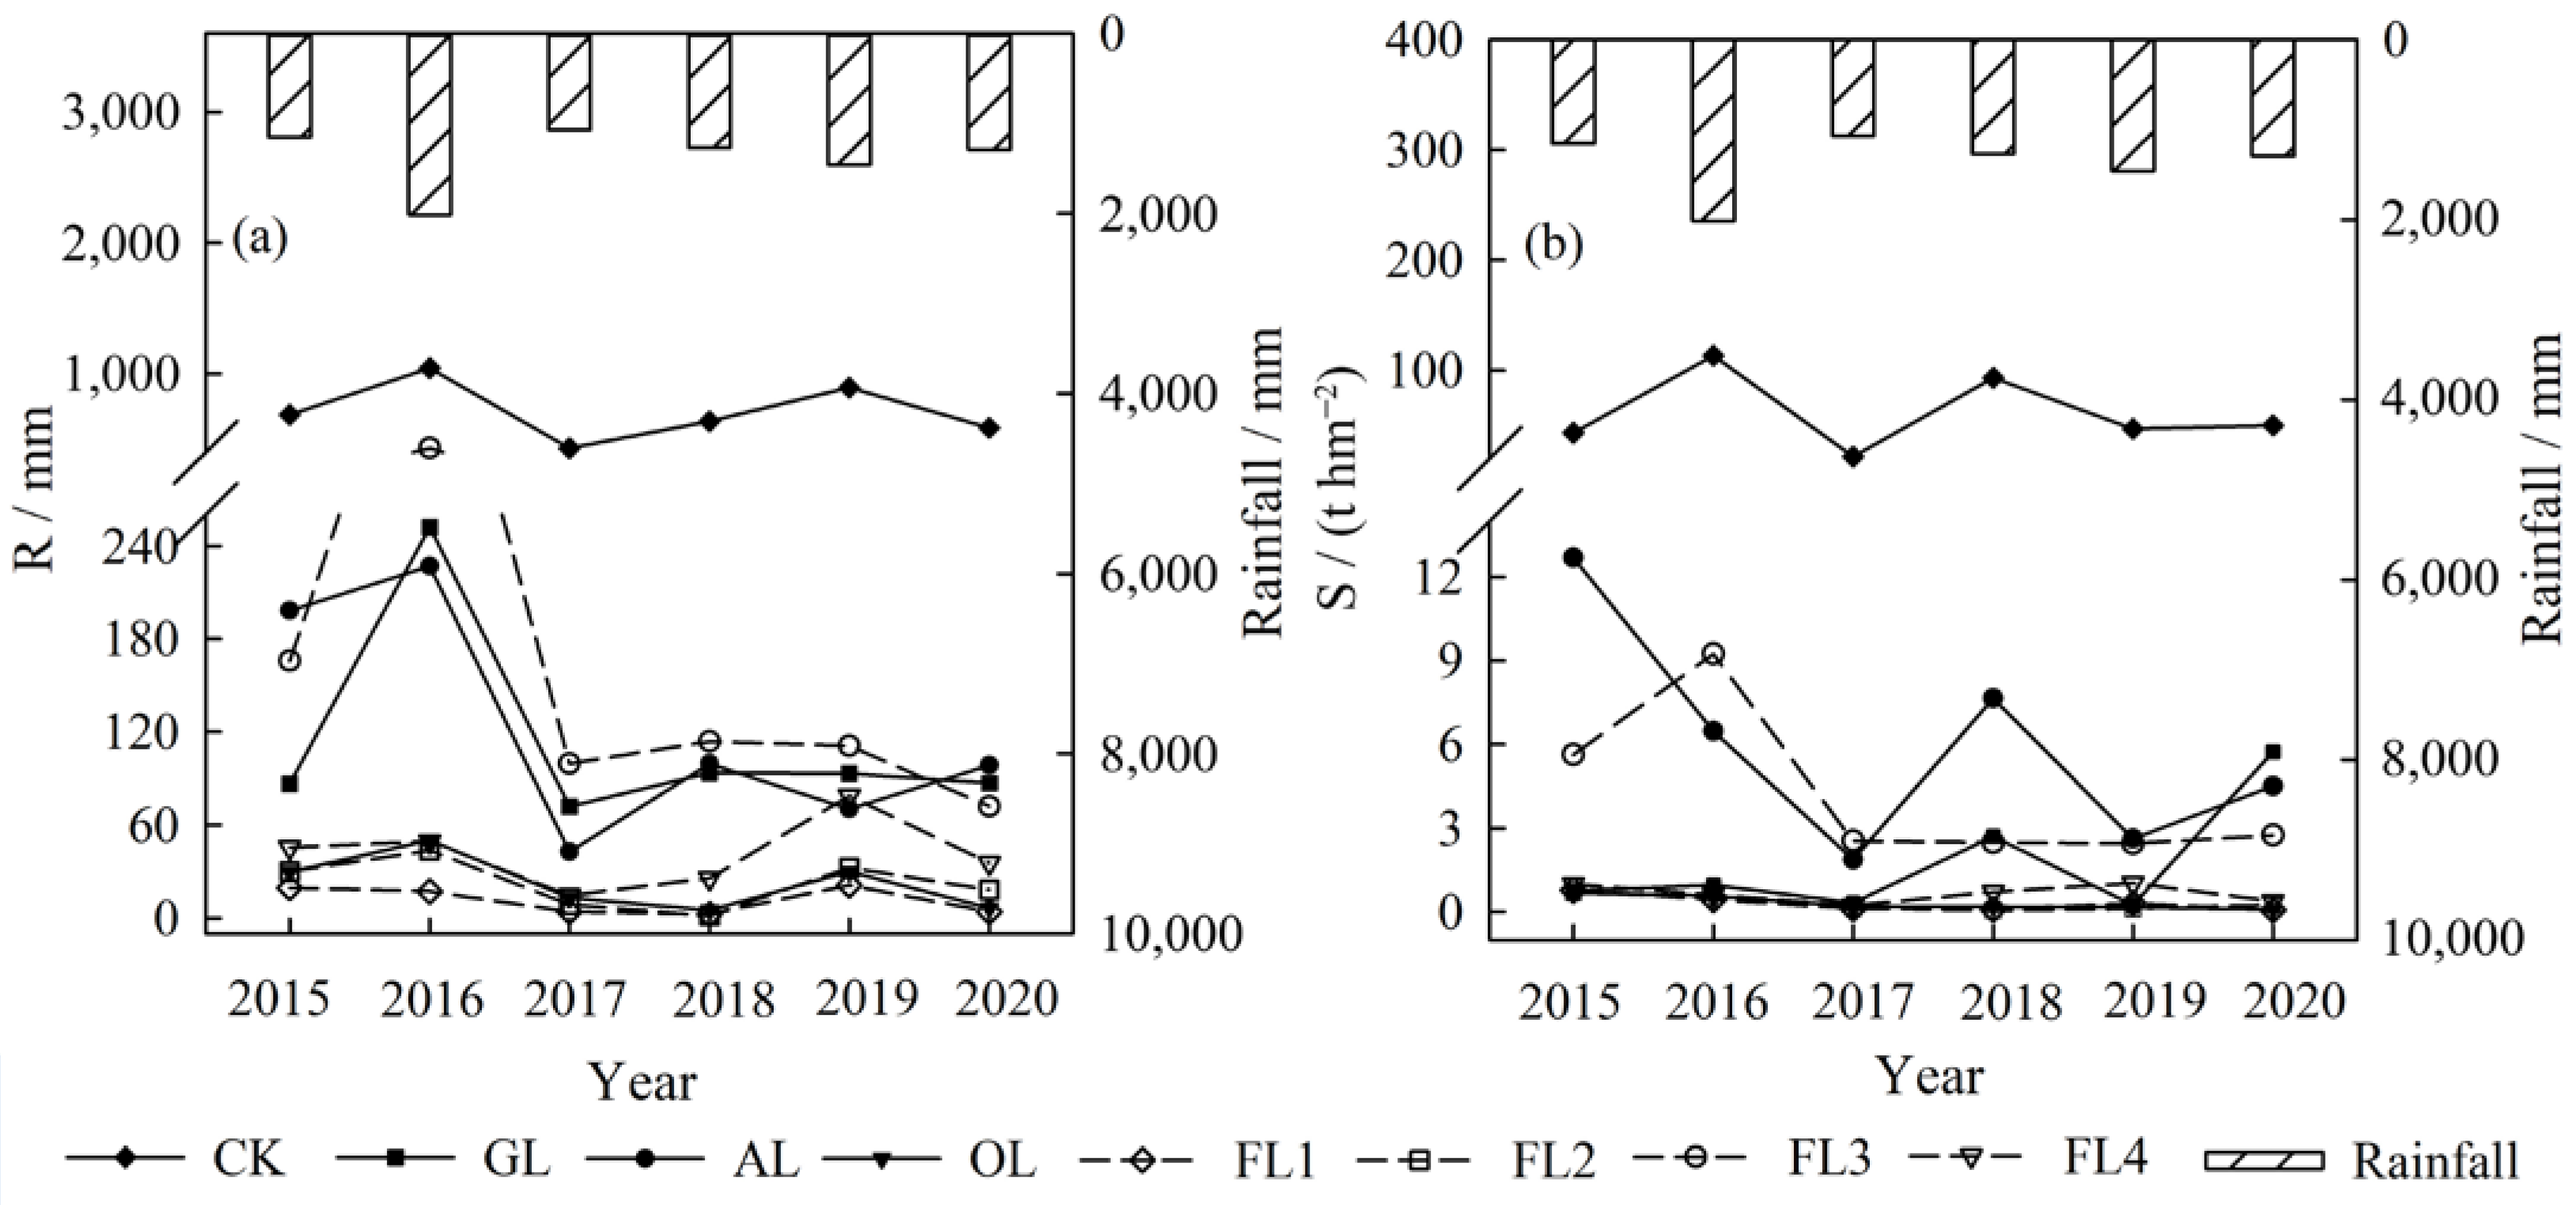
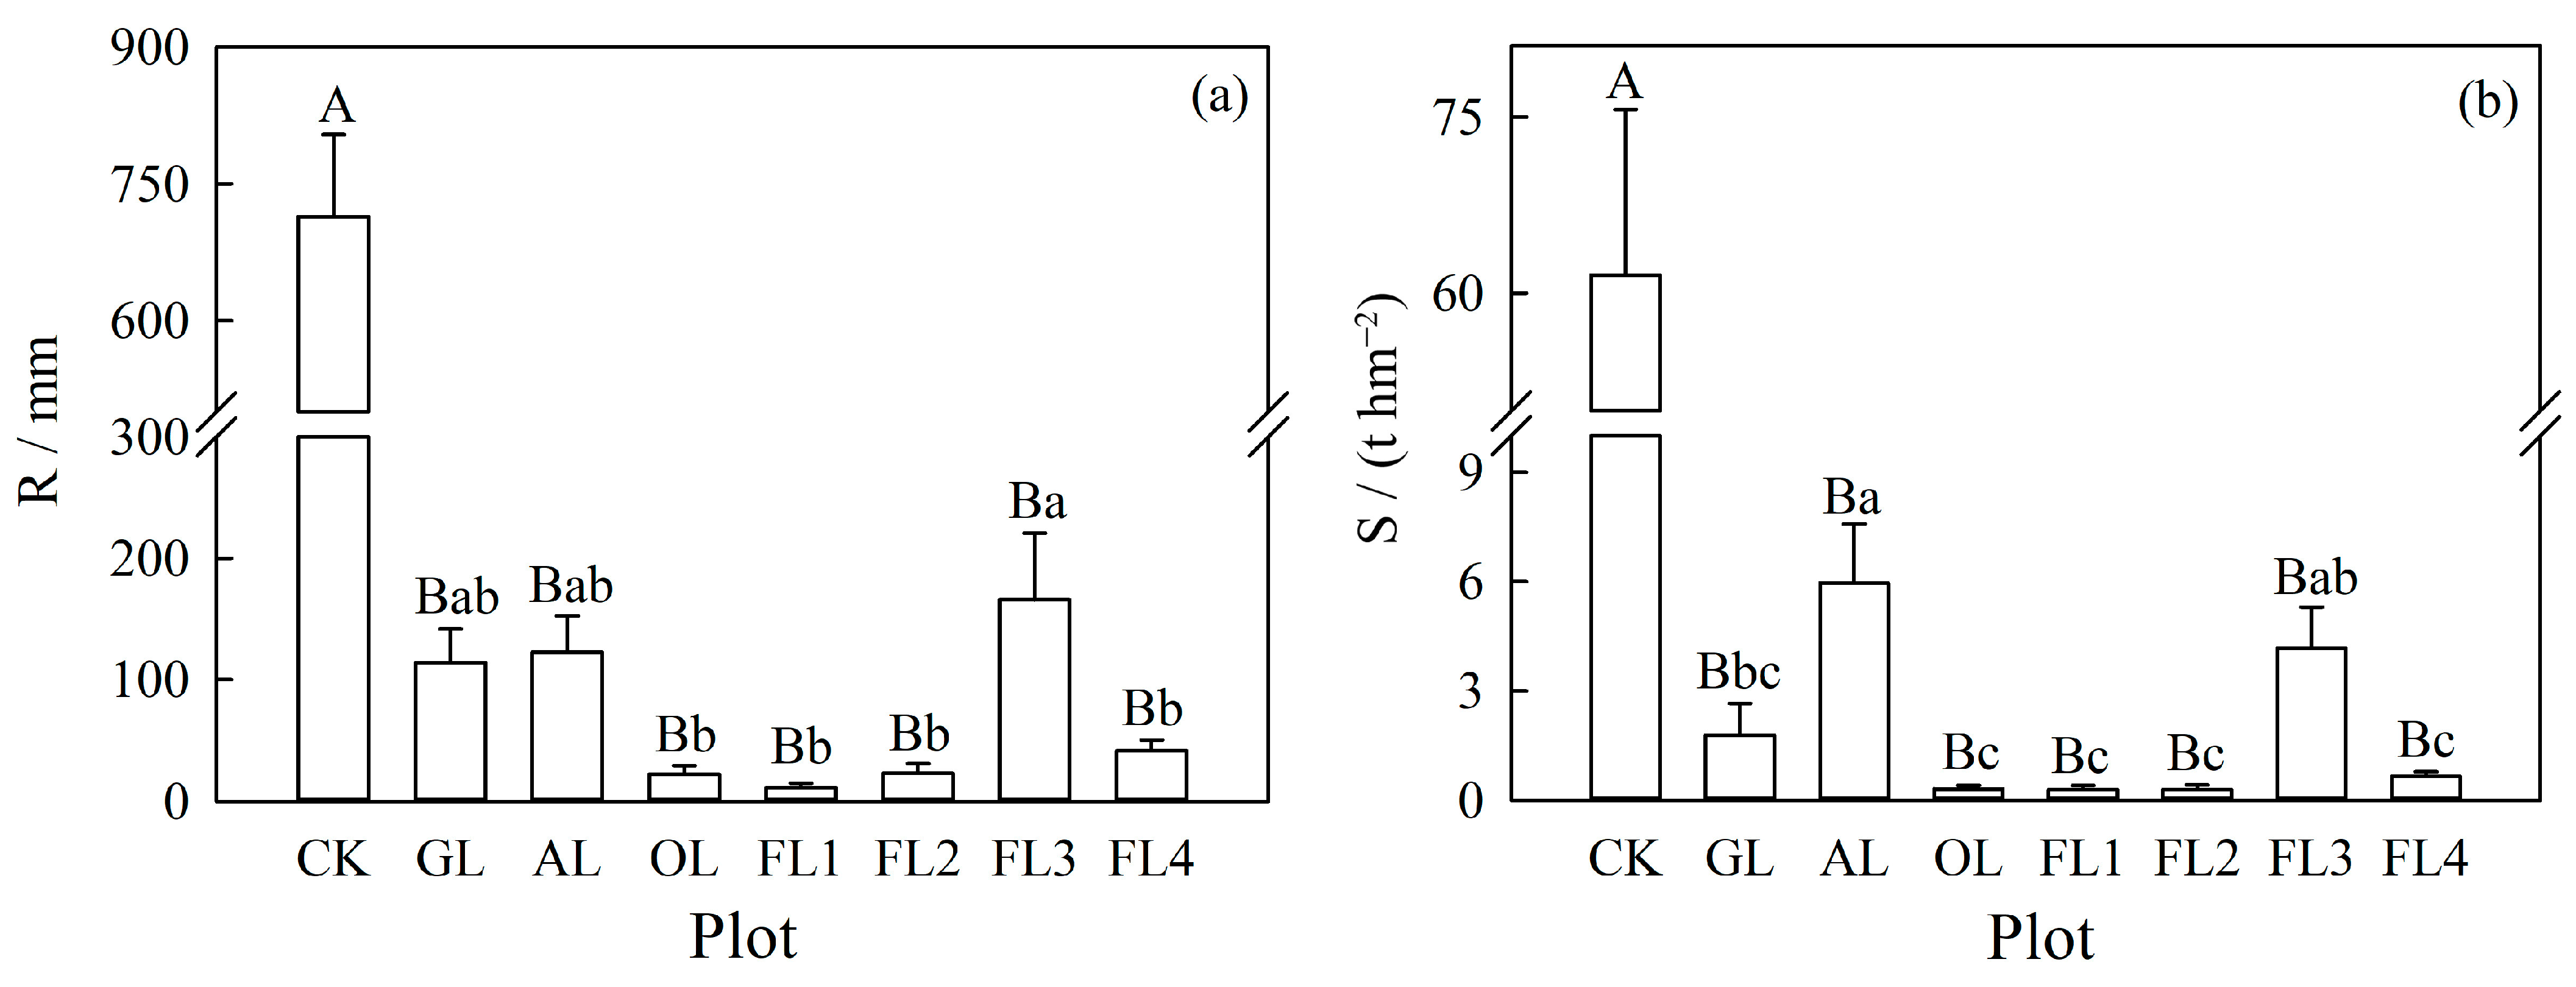
3.1. Runoff and Soil Erosion of Different Land Uses

The changes in annual rainfall, runoff, and soil erosion in each plot are shown in Figure 3. The annual R and annual S of all plots changed with the changes in annual rainfall from 2015 to 2020, especially when the rainfall amount was highest in 2016, and the R of CK, GL, AL, and FL3 increased greatly. Figure 4 shows that the annual average R and S of CK were significantly higher than those of the other land uses (p < 0.01), with an annual average R of 714.28 mm and an annual average S of 61.53 t/hm2. Compared with CK, the annual average R of the seven land uses (GL, AL, OL, FL1, FL2, FL3, and FL4) decreased by 84.03%, 82.83%, 96.87%, 98.42%, 96.75%, 76.81%, and 94.19%, respectively, and S decreased by 97.10%, 90.31%, 99.49%, 99.52%, 99.52%, 93.22%, and 98.94%, respectively. There were also differences in runoff and soil erosion among the seven typical land uses. GL, AL, and FL3 had high runoff and soil erosion, and OL, FL1, FL2, and FL4 had low runoff and soil erosion. The annual average R of FL3 was significantly higher than that of OL, FL1, FL2, and FL4 (p < 0.01), and the annual average S of AL and FL3 was significantly higher than that of OL, FL1, FL2, and FL4 (p < 0.01).
There are differences in the thresholds of erosive rainfall among different land uses [32]; therefore, the annual average RC and SLC values were analyzed (Table 3) to eliminate the influence of erosive rainfall amount variation. The annual average RC and SLC of CK were significantly higher than those of the seven typical land uses (p < 0.01). There were also differences in the RC and SLC among the seven typical land uses. The annual average RC values of GL, AL, and FL3 were significantly higher than those of the other land uses (p < 0.01), and the annual average SLC value of AL was significantly higher than those of GL, OL, FL1, FL2, and FL4 (p < 0.01). The thresholds of rainfall that generated runoff and sediment in the seven typical land uses were calculated (Table 4). The thresholds of P, Im, I30, and EI30 for runoff generation in OL, FL1, and FL2 were relatively high and had higher MI values than those of the other land uses. The thresholds of P, Im, I30, and EI30 for sediment generation in different land uses were obviously different and had higher MI values than those for runoff generation, indicating that the sediment generation of different land uses was more uncertain. In general, using a single rainfall characteristic may be ineffective in accurately separating runoff- and sediment-generating rainfall in different land uses. It is necessary to comprehensively consider rainfall characteristics to analyze the runoff and soil erosion of different land uses.

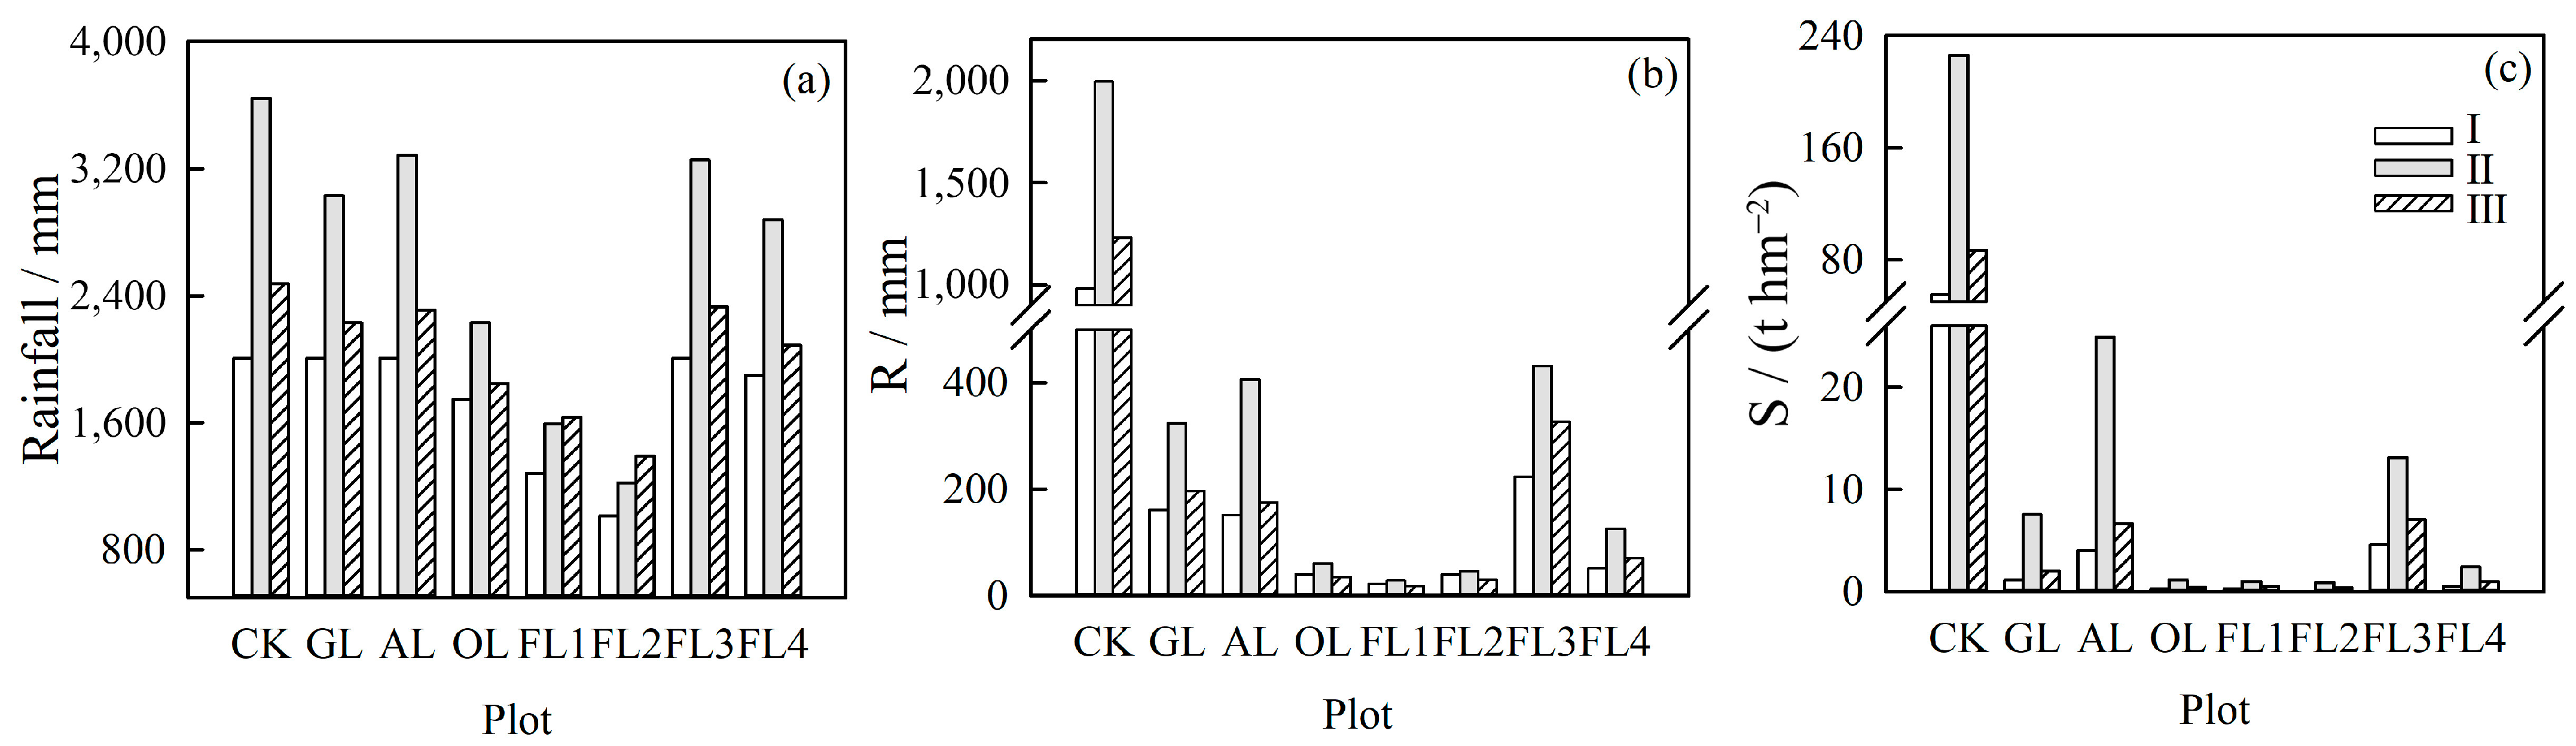
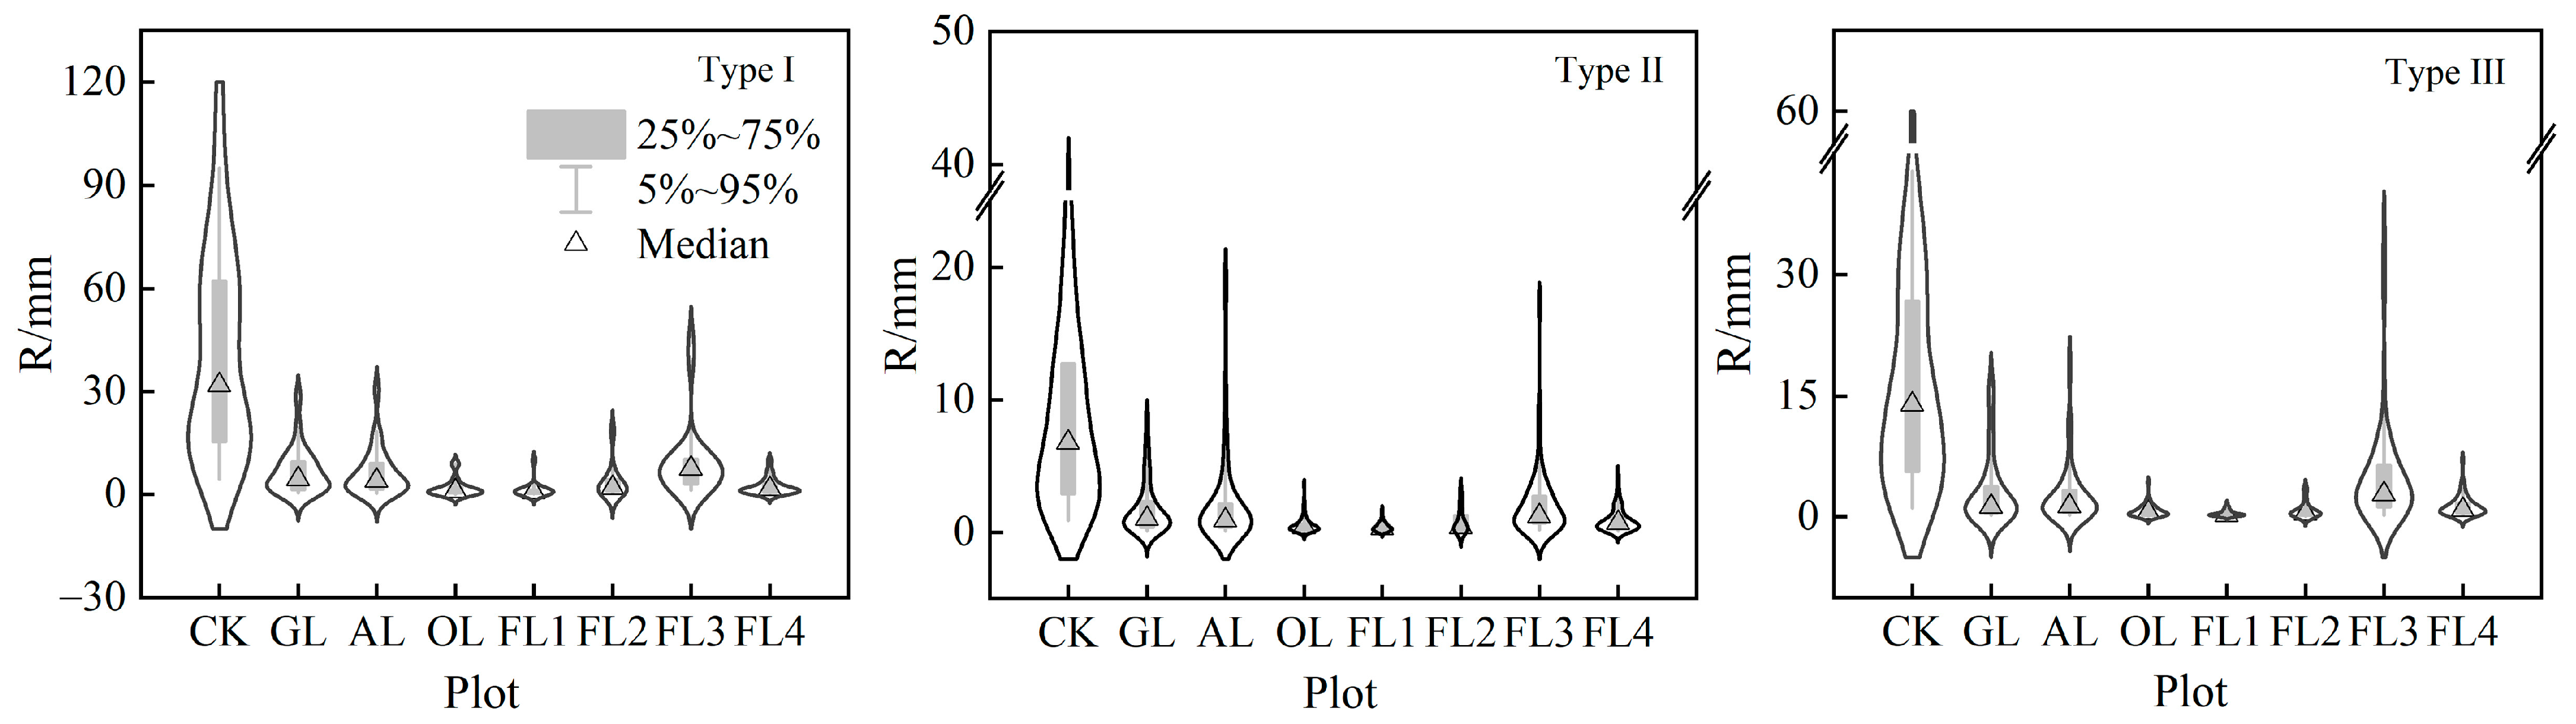
3.2. Variation of Runoff and Soil Erosion among Rainfall Types

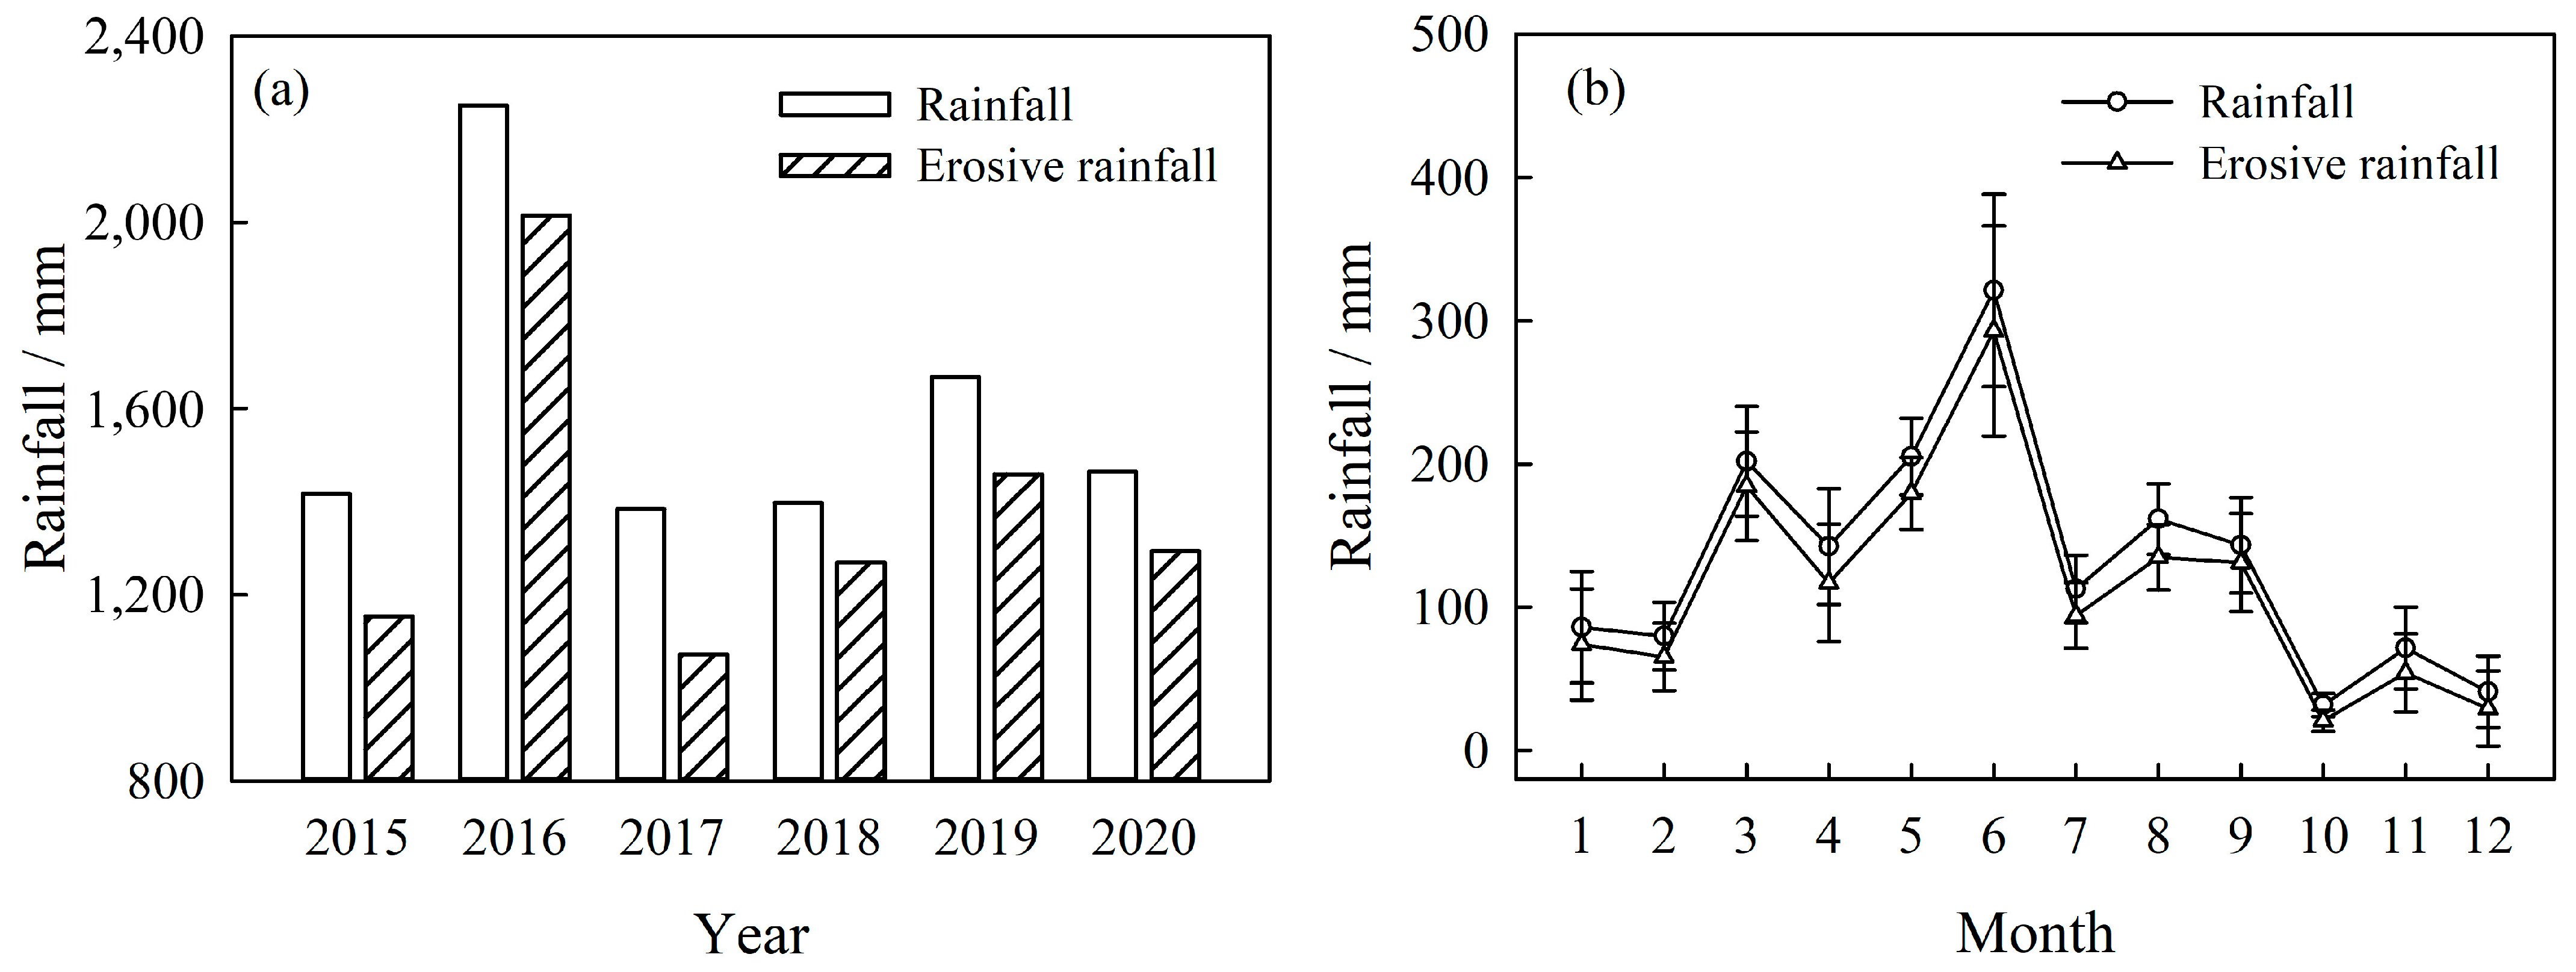
3.2.1. Rainfall Types

During the monitoring period, the rainfall amounts of the four rainfall types were 2006.40 mm, 3643.40 mm, 2473.60 mm, and 139.00 mm. The characteristics of these four types of rainfall are shown in Table 5. Type II was the most common type (218), followed by Type III (74), Type I (24), and Type IV (4). Type I had the highest T, P, and EI30. Type II had the smallest T, but its Im was large. Type III had moderate T, P, and EI30, but its Im and I30 were small. Type IV had the highest Im and I30, especially I30 (1317.50 ± 406.95 mm/h), which was significantly higher than that of the other rainfall types. Type IV was the extreme rainfall in the study area, and it was relatively rare and occurred only in 2015. Therefore, we did not analyze Type IV and its runoff and soil erosion in this study.

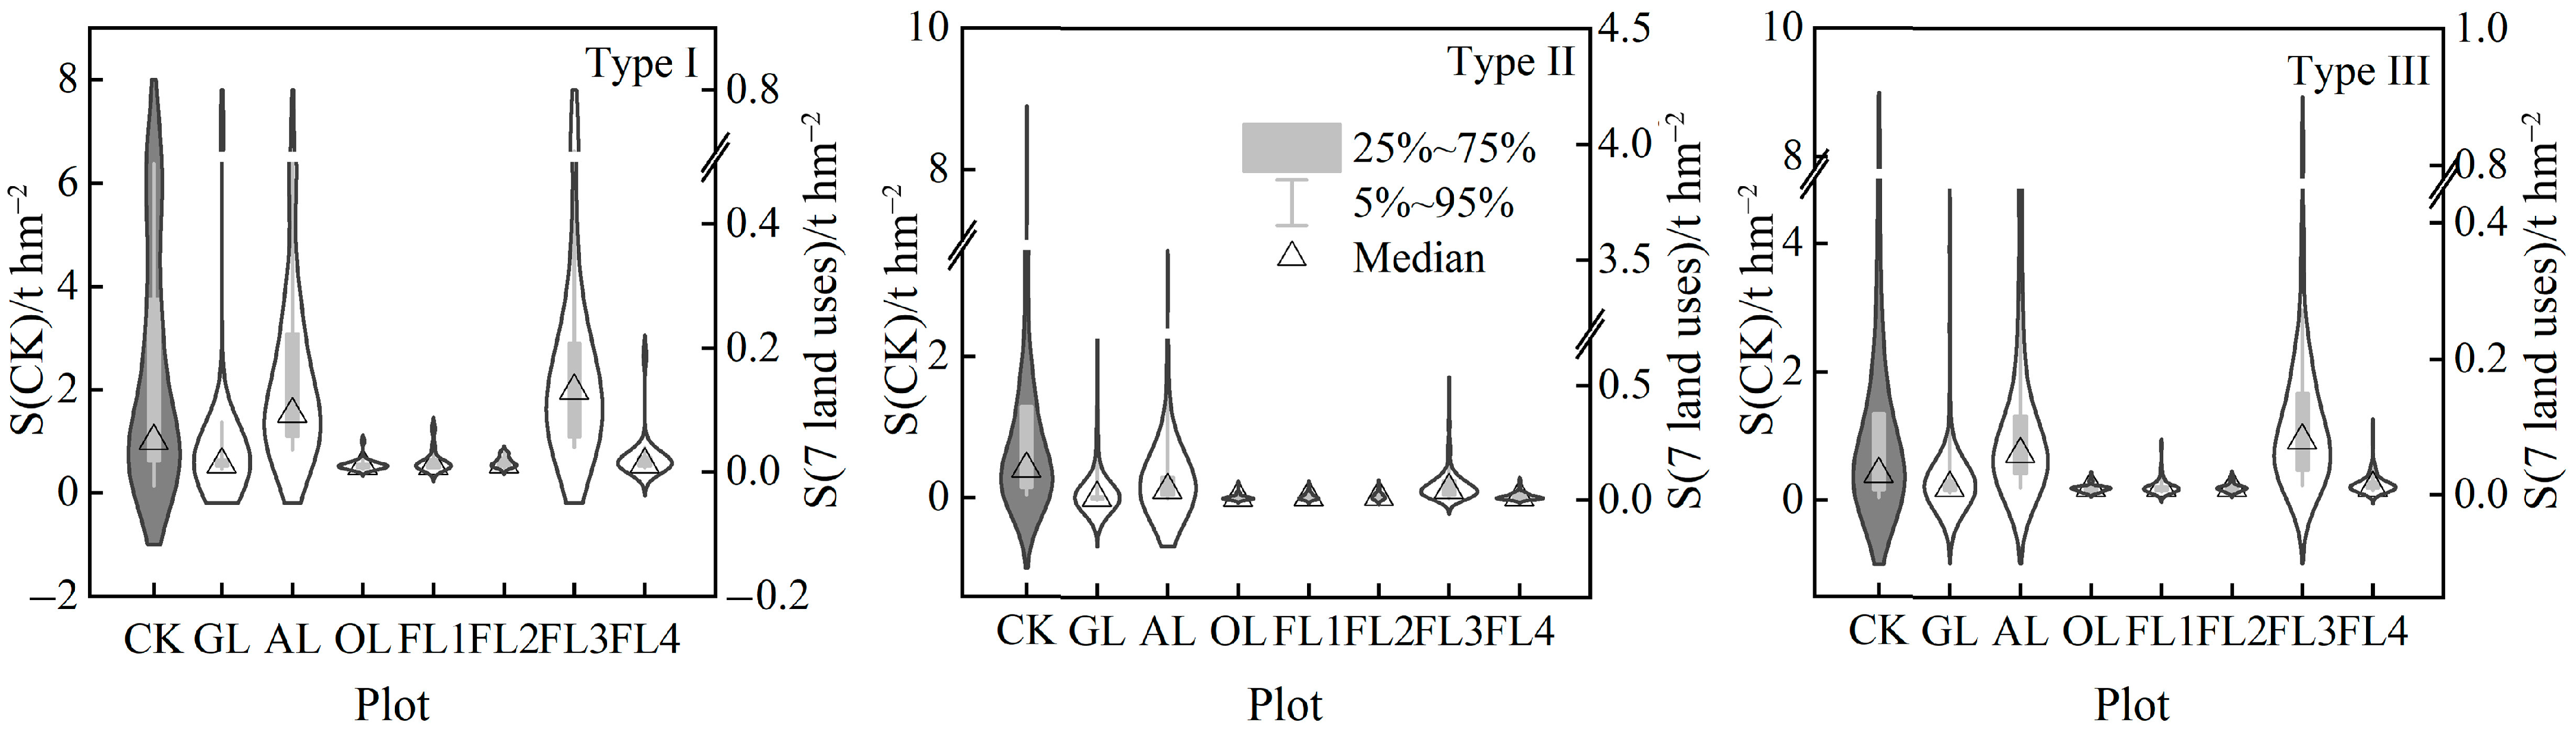
3.2.2. Runoff and Soil Erosion

The total amount of erosive rainfall in each plot (Figure 5a) was as follows: CK > FL3 > AL > GL > FL4 > OL > FL1 > FL2, of which the three main rainfall types were ranked as II > III > I. The total amounts of R and S of the different rainfall types are shown in Figure 5b,c. The total amount of R in CK, GL, AL, FL3, and FL4 was ranked II > III > I, and that in OL, FL1, and FL2 was ranked II > I > III, while the total amount of S in CK and the seven typical land uses was ranked II > III > I. The difference in the total amount of R and S in different plots under the same rainfall type was similar to the difference in the annual average R and S in different plots.
As shown in Table 3, the annual average RC and SLC values of CK and the seven typical land uses were the largest under Type II, and the annual average SLC value was ranked as II > III > I. Under the different rainfall types, the annual average RC and SLC values of CK were significantly higher than those of the other land uses (p < 0.01). There were also differences in the annual average RC and SLC values for the same rainfall type among the seven typical land uses. Under Type I, the annual average RCs of GL, AL, and FL3 were significantly higher than those of OL and FL1 (p < 0.01), and the annual average SLCs of AL and FL3 were significantly higher than those of the other land uses (p < 0.01). Under Type II, the annual average RC of GL, AL, and FL3 was significantly higher than that of the other land uses (p < 0.01), and the annual average SLC of AL was significantly higher than that of OL, FL1, FL2, and FL4 (p < 0.01). Under Type III, the annual average RC of GL, AL, and FL3 was significantly higher than that of OL, FL1, and FL2 (p < 0.01), and the annual average SLC of AL was significantly higher than that of OL, FL1, FL2, and FL4 (p < 0.01). Regardless of the rainfall type, GL, AL, and FL3 had high RC and SLC values. However, changes in the RC and SLC caused by the rainfall type varied with different land uses. Under Type II, the annual average SLC of AL significantly increased and became the highest, while under Types I and III, the annual average SLC of FL3 was the highest. Although rainfall type changed runoff and soil erosion to some extent, it did not change the overall trends of runoff and soil erosion among the bare land and the seven typical land uses.

3.3. Relationship between Runoff and Soil Erosion for Different Land Uses

There was a relative effectiveness between runoff reduction and soil erosion reduction in the same land use, which was reflected by the RRS [4]. The RRSs of GL, AL, OL, FL1, FL2, FL3, and FL4 were 87.3%, 95.43%, 97.44%, 99.03%, 97.30%, 83.08%, and 95.41%, respectively. The RRS values of seven typical land uses were all higher than 80%, which indicated that there were small differences in the efficiency of runoff reduction and sediment reduction among these land uses. AL and FL3 had relatively smaller RRS values than did the other land uses, indicating that AL and FL3 were much more effective in reducing sediment than in reducing runoff. The RRS may be affected by rainfall type. The distribution of the RRS of most land uses changed with the different rainfall types (Figure 6). The RRS of all the land uses under Type I was relatively low and had great variability compared with that under Types II and III, especially for GL, AL, and FL3. The RRS values of OL, FL1, FL2, and FL4 were higher than those of GL, AL, and FL3 under the three rainfall types, among which the RRS of FL1 was the highest and had the least variability.
In fact, the soil erosion processes driven by rainfall are closely related to runoff processes [35]. The nonlinear regression analysis showed that the relationship between single rainfall R and S could be well fitted as a power function of S = aRb (Table 6). The fitting coefficient a represents the amount of soil erosion per unit runoff, reflecting the sensitivity of the soil to erosion [8]. In this study, the fitting coefficient a of the different types of rainfall in each plot differed, and that of Type II was generally larger than that of the other two rainfall types. Additionally, the fitting coefficient a of the different land uses was different under the same rainfall type; it was largest for AL and FL3; followed by FL1 and FL4; and GL, OL, and FL2 had the lowest values.

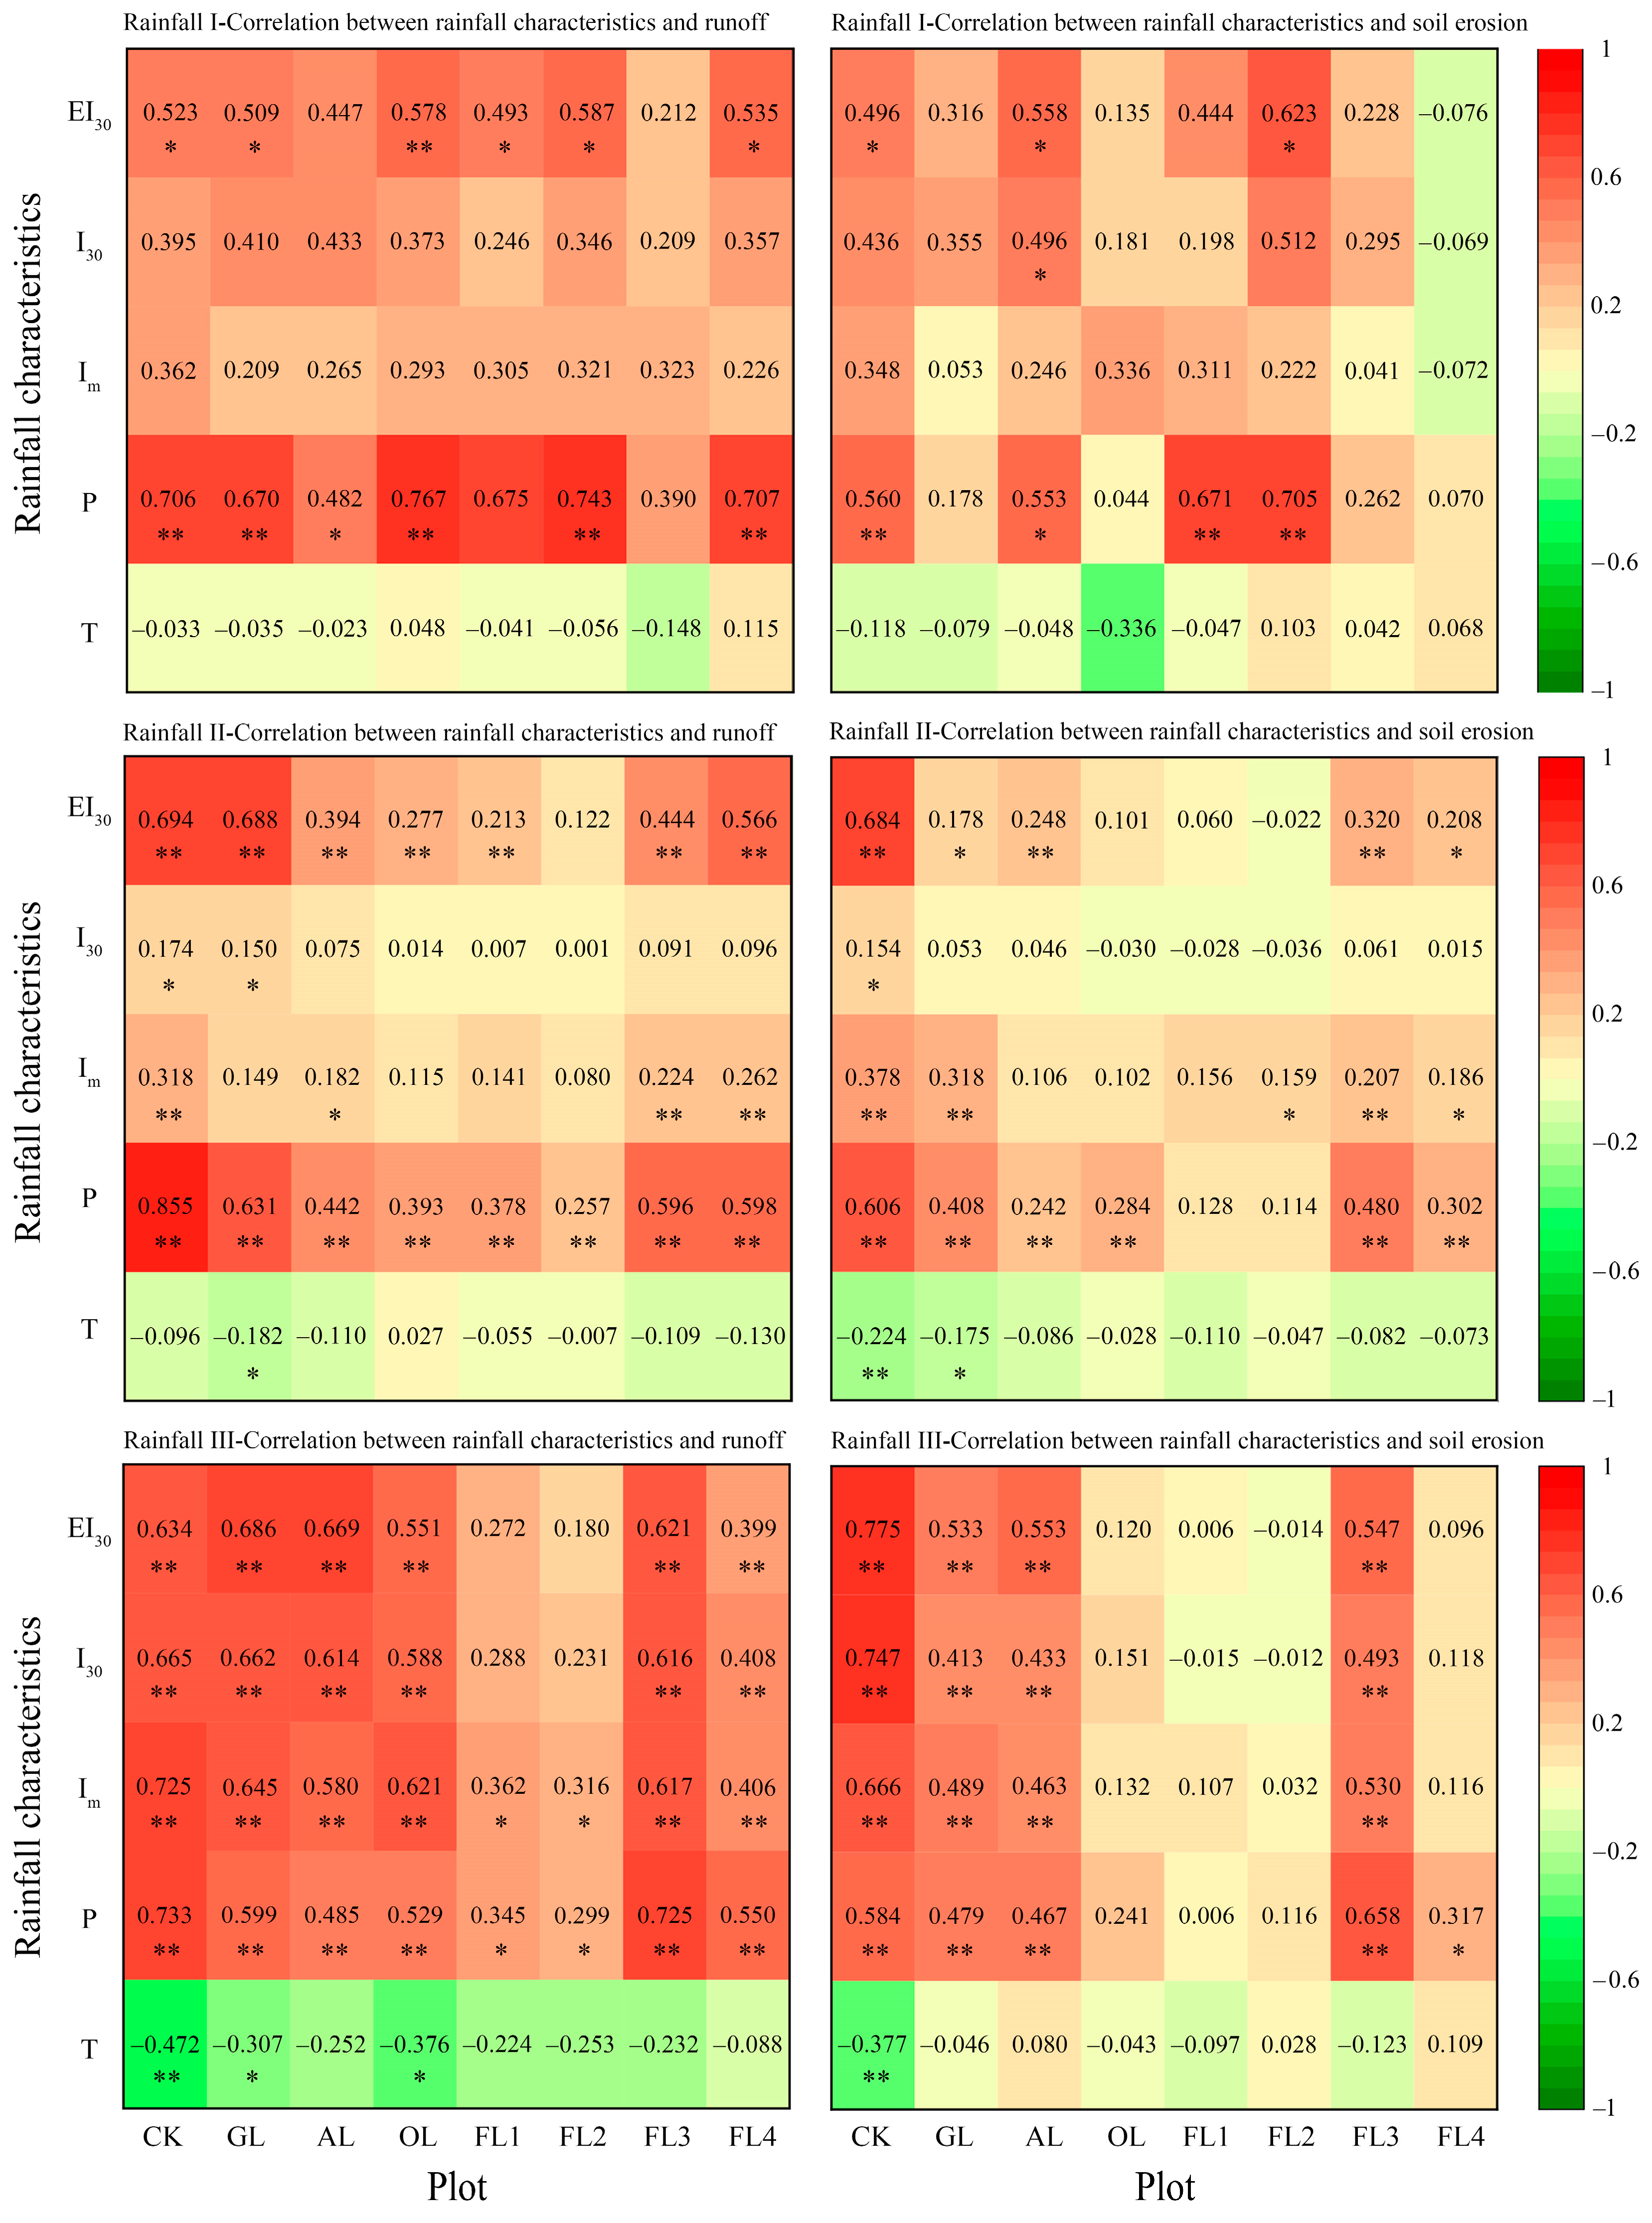
3.4. Effects of Rainfall and Land Use on Runoff and Soil Erosion

The results of multivariate ANOVA (Table 7) showed that land use had a significant impact on the annual average R, S, RC, and SLC, and rainfall type had a significant impact on the annual average R, S, and SLC. Moreover, there was a combination effect of land use and rainfall type on the annual average R, S, and SLC. Owing to the variability of natural rainfall characteristic indicators, the rainfall thresholds of runoff and soil erosion generation in different land uses were significantly uncertain (Table 4); however, the distribution characteristics of runoff and soil erosion at the event scale may provide some information about the impact of rainfall type and land use. As shown in Figure 7 and Figure 8, at the event scale, the average R values in all land uses were the highest under Type I, and the average S values in seven typical land uses were the highest under Type II. The R and S value ranges of CK were significantly larger than those of the other land uses. Under Type I, the R values of CK had a relatively uniform distribution (ranging from 0 to 120 mm), while under Type II, the R value distribution of CK was the most concentrated (ranging from 0 to 45 mm). In contrast, CK may have high S values (>8 t/hm2) under Types II and III. Among the seven typical land uses, the single rainfall R and S values of GL, AL, and FL3 had a larger distribution range and more dispersed distribution compared with those of OL, FL1, FL2, and FL4. Although high R values were generated by Type I in seven typical land uses, Types II and III may have led to high soil erosion.
Additionally, Pearson correlation analysis showed that the relationships between the single rainfall R and S and the rainfall characteristics differed due to the different land uses and rainfall types (Figure 9). The single rainfall R of almost all plots was significantly affected by P and EI30, with most showing a significant correlation at the 0.01 level. The single rainfall S of CK, AL, FL1, and FL2 under Type I (p < 0.05), as well as that of CK, GL, AL, and FL3 under Types II and III (p < 0.01), were significantly affected by P and EI30. Under Type II, the single rainfall R and S values of CK, GL, AL, FL3, and FL4 were significantly affected by Im (p < 0.05). Under Type III, the impacts of rainfall intensity on the single rainfall R and S values were obvious, with I30 and Im being significantly correlated with the single rainfall R of CK, GL, AL, OL, FL3, and FL4, and the single rainfall S of CK, GL, AL, and FL3 (p < 0.01). Pearson correlation coefficients showed that the single rainfall R and S values of CK were most strongly correlated with the characteristics of different rainfall types. There was a relatively weak correlation between the rainfall intensity of Type I and the single rainfall R and S values in all land uses, and the single rainfall R and S values of OL, FL1, FL2, and FL4 were weakly correlated with the characteristics of Types II and III (p > 0.05).

4. Discussion

4.1. Effects of Land Use on Runoff and Soil Erosion

The impact of land use on runoff and soil erosion has been well documented by numerous studies [22,23,27]. However, the runoff and soil erosion of the same land use type vary greatly in different regions (Table 8). In general, bare land has the highest soil loss, followed by cropland, orchard, grassland, shrubland, and forestland [14,22,27]. As shown in Table 7, the annual average rainfall of the study area and the runoff and soil erosion of bare land in this study were relatively close to the average values for the red soil region; thus, the results were representative. However, the soil erosion of shrubland (FL1), orchard (OL), and forests (FL2, FL3, and FL4) in this study was significantly lower than the regional average values, which may be related to the characteristics of vegetation and soil in the long-term undisturbed plots.
The vegetation characteristics of land use such as coverage, structure, species, aboveground biomass, litter coverage and density, and root mass [25,26,38,39] all impact water erosion. Furthermore, the soil physicochemical properties will change after long-term vegetation restoration. In this study, compared with bare land, the other land uses exhibited an increase in SOM and a decrease in silt content (Table 1). Studies have confirmed that vegetation restoration can significantly increase SOM and soil aggregate stability, leading to a reduction in soil erodibility [40,41]. Therefore, the runoff and soil erosion were most significant on bare land (CK). A decrease in vegetation coverage usually causes an increase in runoff and soil erosion [23,28,38]. Specifically, the tree canopy can intercept rainfall and change its kinetic energy [3,8,15], and it has a complex structure and low height and is beneficial for controlling soil erosion [3,42]. Grass can form ground cover, thereby decreasing splash erosion, intercepting surface runoff, and increasing soil infiltration [3,43]. Among the seven land use types, runoff and soil erosion can largely be explained directly by vegetation coverage (AL < FL3 < OL < FL2 < FL4 < FL1 < GL, Table 2); therefore, the annual average R, S, RC, and SLC values of FL3 and AL were higher than those of FL1, FL2, and FL4. Significantly, GL had the highest vegetation coverage but had high annual average R, S, RC, and SLC values, which contradicts the findings of several studies [44,45]. There was large and frequent rainfall in the study area [29,46]. Grass cannot effectively intercept rainfall and increase evapotranspiration due to the lack of a canopy, which will lead to high runoff. Moreover, the aboveground biomass, litter coverage, and root mass density of grass were lower than those of trees and shrubs; thus, long-term high levels of soil moisture content may result in a limited ability of grass to intercept runoff and increase soil infiltration. The process of water erosion is significantly affected by runoff processes, especially in southern China [46]), which ultimately leads to high soil erosion of grassland.
Mono-species communities are insufficient for controlling runoff and sediment [4,43,47]. Scientists have confirmed that planting shrubs or grass under forests is an ideal vegetation combination for controlling soil erosion [35,48]. However, the annual average R, S, RC, and SLC values of FL1 (only planted shrubs) were the lowest. This may be because the aboveground biomass of the understory vegetation (shrubs), which was roughly evaluated by the product of the height and coverage (Table 2), in FL1 was significantly higher than that in the other forests (p < 0.01). Previous studies have shown that shrubs most effectively reduce runoff and soil erosion [3,49]. Broad-leaved and mixed forests usually have higher canopy stratification, more differing functional traits (e.g., leaf area), and more litter than coniferous forests, which is helpful in reducing the risk of water loss and erosion [50]. The thresholds of erosive rainfall under vegetation were higher than those of bare land and cropland [32], which was reflected by the amount of erosive rainfall from land use (Figure 5a). However, the uncertainty of the relationship between rainfall characteristics and runoff and soil erosion may increase with the improvement of vegetation effectiveness in reducing runoff and soil erosion (Table 4).
The relationships between runoff and soil erosion differed among the different land uses (Table 6). Hence, although a reduction in runoff generally leads to a decrease in soil erosion in all land uses, the runoff reduction yields needed to decrease the same amount of sediment are not the same under different land uses [4,51]. In this study, the RRS values indicated that grassland and pure Pinus massoniana forests with no understory (FL3) were more unfavorable for reducing runoff than shrubs and other forests with multiple vegetation structures (OL and FL2). Moreover, the RRS of AL was significantly higher than that of cropland reported by Chen et al. [4] (0.7 ± 0.06). In addition to soil and water conservation measures, slope gradients [4], and vegetation [51], we speculated that rainfall may be one of the most important reasons for this phenomenon considering regional differences. In general, grassland, cropland, and forest with low vegetation coverage (FL3) were poorly effective in controlling runoff and soil erosion. In addition to increasing vegetation coverage, more attention should be given to the understory vegetation in different land use types to improve the effectiveness of land use conservation of soil and water in the study area.

4.2. Effects of Rainfall Type on Runoff and Soil Erosion

Rainfall is an important factor that causes differences in soil erosion between different regions. Taking the Loess Plateau as an example (Table 8), the runoff and soil erosion of different land uses shows an increasing trend with increasing annual rainfall. In contrast, the red soil region has a higher annual rainfall amount and less soil erosion. A previous study indicated that the relationship between soil erosion and annual precipitation is nonlinear for all land uses in China, with a clear increase in soil erosion with precipitation up to a mean annual precipitation of ca. 700 mm/yr and then a subsequent decrease and a second increase when the mean annual precipitation exceeds ca. 1400 mm/yr [36]. Moreover, there are significant differences in rainfall types in different regions, which affect runoff and soil erosion. According to the study of Chen et al. [15], the rainfall type with short duration and high intensity on the Loess Plateau (arid and semiarid areas) has an average rainfall of 15.4 mm and an average rainfall duration of 2.6 h. In contrast, the rainfall type considered to have the characteristics of short duration and high intensity may have relatively higher average rainfall and longer average rainfall duration in humid areas [34,52]. It is necessary to discuss the response of runoff and soil erosion to rainfall type in different regions separately.
In this study, rainfall was divided into four types, of which three were common types, namely Type I (long duration, heavy rainfall, moderate rainfall intensity), Type II (short duration, small rainfall, medium-to-high rainfall intensity), and Type III (medium duration, medium rainfall, low rainfall intensity). Rainfall intensity and amount are the dominant factors impacting runoff generation and soil erosion [11,15,17]. High-intensity rainfall can generally produce an earlier runoff start time, a larger runoff coefficient, and a higher peak flow velocity than can low-intensity rainfall [16,53]. Type II had the highest rainfall intensity and frequency, so it had the highest annual average RC and SLC values and contributed the most to runoff and soil erosion (Figure 5). However, Type I had moderate intensity but the lowest SLC values. Rainfall events with long durations and low intensities may show different behaviors than other rainfall types [11]. This behavior occurs because of the effects of the land surface roughness and physical barriers, which allow the accumulation of water in small puddles; additionally, these barriers prevent flow from entering the collecting channel until it acquires enough energy to break through the microrelief of the land [11,54]. This process can weaken the splash erosion of raindrops and reduce the runoff velocity, which ultimately results in a low soil loss coefficient. At the event scale, the average R value of Type I was higher than that of Types II and III (Figure 7), which may have been caused by the changes in erosive rainfall amount (e.g., the rainfall amount of Type I was the highest at the event scale and the lowest at the annual scale), indicating that the main factors determining the runoff of different the rainfall types in the study area were cumulative rainfall and rainfall frequency [55]. Rainfall type significantly affected R but not RC (Table 7), further confirming this finding, which was similar to previous studies [17,56]. In contrast, the average S value of Type II was still the highest at the event scale, indicating that the soil erosion of different rainfall types was mainly affected by rainfall intensity [15].
Significantly, the single rainfall R and S values of the different rainfall types were affected differently by the main rainfall characteristics (Figure 9). Because the Im and I30 values of short-duration rainfall were more representative of the rainfall intensity of the whole rainfall process, the rainfall intensity had a significant impact on the single rainfall R and S values with moderate and short-duration rainfall (Type II, Type III). This effect increased with the decrease in Im (Figure 9), which was contrary to the finding of Niu et al. [57]. Against the background of abundant rainfall (when the rainfall intensity was low), the runoff was low and the energy was not sufficient to initiate the movement of soil particles. Only pre-detached soil particles were transported by shallow surface runoff [11], so, in this process, raindrop splash erosion had a great impact on runoff and soil erosion.

4.3. Combination Effects of Land Use and Rainfall on Runoff and Soil Erosion

Land use and rainfall have a combination effect on runoff and soil erosion [14,57]. This study found that the combination effects of land use and rainfall type had a significant impact on the annual average R, S, and SLC (Table 7). The annual average R, S, RC, and SLC values under the different rainfall types followed the same trend (CK > GL, AL, FL3 > FL4 > OL, FL1, FL2), which indicated that the characteristics of runoff and soil erosion were mainly determined by land use, while the effect of the rainfall type was slight [14]. However, rainfall type greatly changed the distribution characteristics of runoff and soil erosion at the event scale (Figure 7 and Figure 8). The runoff and soil erosion distributions in different land uses had different responses to rainfall type. Specifically, the highest single rainfall R and S values of different rainfall types appeared in different land uses (except for bare land). Tillage, weeding, and harvesting practices have a great impact on the surface structure of the soil [58]; thus, there may be higher soil surface roughness and soil infiltration in cropland, which prevents runoff generation and increases runoff resistance [59]. Nevertheless, the raindrop median diameter and kinetic energy under high intensity rainfall may be much higher than those under other rainfall events [15], leading to more detachment of soil particles from loose soil. Therefore, under Type II, the single rainfall S value of cropland may be much higher than that of other land uses, while under other rainfall types, it may be easier to generate flow paths on the soil surface in FL3, which is also reflected by the annual average RC and SLC values.
Land use changes the process of rainfall-induced soil erosion and changes the relationships between runoff, soil erosion, and rainfall characteristics. Fang [43] found that soil and water conservation measures, such as vegetation (grass, shrubs, and forest), terracing, and level benching, changed the rainfall impact factors of runoff and soil erosion on cultivated plots from I30 to rainfall amount and duration. In this study, a single rainfall indicator could not accurately describe the rainfall threshold of runoff and sediment generation in land uses with abundant vegetation (with high MI values). Pearson correlation analysis showed that, under Types II and III, the correlation between soil erosion and rainfall characteristics weakened with increasing vegetation coverage (Figure 9) because the rainfall amount, rainfall kinetic energy, and raindrop splash that ultimately reached the soil surface changed due to the interception of vegetation [8]. This result was in accordance with the findings of Liu et al. [60]. The distribution of the RRS of the seven typical land uses changes with the different rainfall types because the trade-offs between runoff and soil erosion are not inherent in land use, and they can be changed by rainfall [4,51]. Under Type I, there was a high runoff cost of reducing the soil loss of grassland, cropland, and forest with low vegetation coverage; that is, continuous rainfall may lead to a decrease in the effectiveness of these land uses in reducing soil erosion. Moreover, the mean value and distribution of RRS in different land uses indicates that the vegetation patterns of OL, FL1, and FL2 may be a great choice for controlling water erosion in the study area.
In general, the runoff and soil erosion of grassland, cropland, and forest with low vegetation coverage were more sensitive to rainfall variation. In the context of global climate change, rainfall patterns may change in the future [17,61], especially in humid areas, and the interaction between land use and rainfall type may potentially cause great changes in regional soil erosion characteristics. A soil erosion model that incorporates the interaction of factors has more convincing outputs than a model that arranges factors in isolation [62]. Ke and Zhang [21] also confirmed this assumption in their research on the effects of rainfall and soil factors on runoff, erosion, and their predictions. Consequently, investigating the combination effects of land use and rainfall on runoff and soil erosion in the red soil region can help develop strategies for land use management and ecological restoration in response to climate change. However, soil erosion is driven by a combination of topography, climate, land use practices, and vegetation and soil characteristics [63]. Climate and land use practices largely determine the vegetation characteristics of a land unit, and both land use and vegetation can influence soil physicochemical properties [64]. At present, there is still a lack of understanding of the cascading interaction effects of regional climate, vegetation, and soil-on-soil erosion [63]. Similarly, in this study, due to the lack of annual information on soil and vegetation (such as biomass and litter), the underlying mechanisms of runoff and soil erosion changes in different land uses were not fully explored. Therefore, it is necessary to continuously monitor the soil physicochemical properties and vegetation characteristics of different land uses. Additionally, unpredicted extreme precipitation events may increase with global warming [20], and these precipitation events can significantly increase soil erosion, concurrently creating conditions conducive to triggering natural disasters such as landslides and mudslides [65]. Unfortunately, this study was unable to explore the characteristics of water erosion on different land use slopes under the extreme rainfall events due to their extremely rare occurrence (Type IV). To deepen the understanding of soil erosion caused by extreme rainfall and enhance the ability to cope correctly with the impacts of climate extremes, runoff and soil erosion data under such rainfall events should be collected as much as possible by extending the monitoring time in the future.

5. Conclusions

The long-term in situ effects of land use and rainfall type on water erosion in the red soil region of southern China were determined in this study. From 2015 to 2020, the 320 rainfall events were divided into 4 types, and 3 main types of rainfall were observed. Rainfall type and land use significantly influenced the annual average runoff depth, soil erosion modulus, and soil loss coefficient, while the runoff coefficient was significantly affected only by land use. The runoff of different rainfall types was primarily determined by the rainfall amount, while the soil erosion of different rainfall types was primarily determined by the rainfall intensity. Consequently, high-intensity and high-frequency rainfall (Type II) contributed the most to both total runoff and soil erosion, but long-duration rainfall (Type I) had the highest runoff at the event scale. Compared with bare land, the seven typical land uses reduced runoff and soil erosion by more than 75%. The differences in runoff and soil erosion among different land uses (except grassland) can be mainly attributed to vegetation coverage. Shrubland most effectively reduced runoff and soil erosion, while the runoff and soil erosion of grassland, cropland, and forest with low vegetation coverage were relatively high.
The combination effects of land use and rainfall type significantly influenced the annual average runoff depth, soil erosion modulus, and soil loss coefficient. Rainfall types can change the relationship between runoff and soil erosion for different land uses. The runoff and soil erosion of bare land were highly correlated with the rainfall characteristics, while vegetation clearly weakened this relationship under short- or moderate-duration rainfall (Types II and III). Overall, the runoff and soil erosion of grassland, cropland, and low vegetation coverage forests were more sensitive to rainfall type. To effectively reduce water erosion, high-intensity rainfall should receive special attention and all land uses should ensure that vegetation is well developed, especially understory vegetation. The results provide guidance for land use management and soil erosion control in the red soil region.

Author Contributions

Conceptualization, J.L.; methodology, H.W.; software, X.W.; validation, S.Y.; formal analysis, Z.Z.; resources, Y.H.; writing—original draft preparation, H.W.; writing—review and editing, Y.Z. and F.J. All authors have read and agreed to the published version of the manuscript.

Funding

This research was funded by the National Natural Science Foundation of China (No.: 41907043) and the Innovative Team Project of Forestry Subject (No.: 118/7220220020).

Data Availability Statement

Restrictions apply to the availability of these data. Data was obtained from the Soil and Water Conservation Center of Changting and are available from Jinshi Lin (corresponding author) with the permission of the Soil and Water Conservation Center of Changting.

Acknowledgments

We gratefully acknowledge the Soil and Water Conservation Center of Changting for data collection.

Conflicts of Interest

The authors declare no conflicts of interest.

References

  1. García-Ruiz, J.M.; Beguería, S.; Nadal-Romero, E.N.; González-Hidalgo, J.C.; Lana-Renault, N.; Yasmina Sanjuán, Y. A meta-analysis of soil erosion rates across the world. Geomorphology 2015, 239, 160–173. [Google Scholar] [CrossRef]
  2. Duan, J.; Liu, Y.J.; Tang, C.J.; Shi, Z.H.; Yang, J. Efficacy of orchard terrace measures to minimize water erosion caused by extreme rainfall in the hilly region of China: Long-term continuous in situ observations. J. Environ. Manag. 2021, 278, 111537. [Google Scholar] [CrossRef]
  3. Labrière, N.; Locatelli, B.; Laumonier, Y.; Freycon, V.; Bemoux, M. Soil erosion in the humid tropics: A systematic quantitative review. Agric. Ecosyst. Environ. 2015, 203, 127–139. [Google Scholar] [CrossRef]
  4. Chen, J.; Xiao, H.B.; Li, Z.W.; Liu, C.; Ning, K.; Tang, C.J. How effective are soil and water conservation measures (SWCMs) in reducing soil and water losses in the red soil hilly region of China? A meta-analysis of field plot data. Sci. Total Environ. 2020, 735, 139517. [Google Scholar] [CrossRef] [PubMed]
  5. Lal, R. Soil conservation and ecosystem services. Int. Soil Water Conserv. Res. 2014, 2, 36–47. [Google Scholar] [CrossRef]
  6. Chen, D.; Wei, W.; Chen, L.D. Effects of terracing practices on water erosion control in China: A meta-analysis. Earth-Sci. Rev. 2017, 173, 109–121. [Google Scholar] [CrossRef]
  7. Borrelli, P.; Robinson, D.A.; Fleischer, L.R.; Lugato, E.; Ballabio, C.; Alewell, C.; Meusburger, K.; Modugno, S.; Schütt, B.; Ferro, V.; et al. An assessment of the global impact of 21st century land use change on soil erosion. Nat. Commun. 2017, 8, 2013. [Google Scholar] [CrossRef] [PubMed]
  8. Zhu, P.Z.; Zhang, G.H.; Wang, H.X.; Yang, H.Y.; Zhang, B.J.; Wang, L.L. Effectiveness of typical plant communities in controlling runoff and soil erosion on steep gully slopes on the Loess Plateau of China. J. Hydrol. 2021, 602, 126714. [Google Scholar] [CrossRef]
  9. Alavinia, M.; Saleh, F.N.; Asadi, H. Effects of rainfall patterns on runoff and rainfall-induced erosion. Int. J. Sediment Res. 2019, 34, 270–278. [Google Scholar] [CrossRef]
  10. Wang, Y.; Ni, J.P.; Ni, C.S.; Wang, S.; Xie, D.T. Effect of natural rainfall on the migration characteristics of runoff and sediment on purple soil sloping cropland during different planting stages. J. Water Clim. Chang. 2021, 12, 3064–3081. [Google Scholar] [CrossRef]
  11. Almeida, W.S.; Seitz, S.; Oliveira, L.F.C.; Carvalho, D.F. Duration and intensity of rainfall events with the same erosivity change sediment yield and runoff rates. Int. Soil Water Conserv. Res. 2021, 9, 69–75. [Google Scholar] [CrossRef]
  12. Luo, B.L.; Han, Z.; Yang, J.; Wang, Q. Assessment of Erosion Characteristics in Purple and Yellow Soils Using Simulated Rainfall Experiments. Int. J. Environ. Res. Public Health 2022, 19, 357. [Google Scholar] [CrossRef]
  13. Liu, J.B.; Liang, Y.; Gao, G.Y.; Dunkerley, D.; Fu, B.J. Quantifying the effects of rainfall intensity fluctuation on runoff and soil loss: From indicators to models. J. Hydrol. 2022, 607, 127494. [Google Scholar] [CrossRef]
  14. Wei, W.; Chen, L.D.; Fu, B.J.; Huang, Z.L.; Wu, D.P.; Gui, L.D. The effect of land uses and rainfall regimes on runoff and soil erosion in the semi-arid loess hilly area, China. J. Hydrol. 2007, 335, 247–258. [Google Scholar] [CrossRef]
  15. Chen, H.; Zhang, X.P.; Abla, M.; Lü, D.; Yan, R.; Ren, Q.F.; Ren, Z.Y.; Yang, Y.H.; Zhao, W.H.; Lin, P.F.; et al. Effects of vegetation and rainfall types on surface runoff and soil erosion on steep slopes on the Loess Plateau, China. Catena 2018, 170, 141–149. [Google Scholar] [CrossRef]
  16. Feng, J.; Wei, W.; Pan, D.L. Effects of rainfall and terracing-vegetation combinations on water erosion in a loess hilly area, China. J. Environ. Manag. 2020, 261, 110247. [Google Scholar] [CrossRef]
  17. Huo, J.Y.; Yu, X.X.; Liu, C.J.; Chen, L.H.; Zheng, W.G.; Yang, Y.H.; Tang, Z.X. Effects of soil and water conservation management and rainfall types on runoff and soil loss for a sloping area in North China. Land Degrad. Dev. 2020, 31, 2117–2130. [Google Scholar] [CrossRef]
  18. Sampson, A.A.; Wright, D.B.; Stewart, R.D.; LoBue, A.C. The role of rainfall temporal and spatial averaging in seasonal simulations of the terrestrial water balance. Hydrol. Process. 2020, 34, 2531–2542. [Google Scholar] [CrossRef]
  19. Wu, X.S.; Guo, S.L.; Qian, S.N.; Wang, Z.L.; Lai, C.G.; Li, J.; Liu, P. Long-range precipitation forecast based on multipole and preceding fluctuations of sea surface temperature. Int. J. Climatol. 2022, 42, 8024–8039. [Google Scholar] [CrossRef]
  20. Zhang, J.X.; Wang, S.S.; Huang, J.P.; He, Y.L.; Ren, Y. The precipitation-recycling process enhanced extreme precipitation in Xinjiang, China. Geophys. Res. Lett. 2023, 50, e2023GL104324. [Google Scholar] [CrossRef]
  21. Ke, Q.H.; Zhang, K.L. Interaction effects of rainfall and soil factors on runoff, erosion, and their predictions in different geographic regions. J. Hydrol. 2022, 605, 127291. [Google Scholar] [CrossRef]
  22. Peng, T.; Wang, S.J. Effects of land use, land cover and rainfall regimes on the surface runoff and soil loss on karst slopes in southwest China. Catena 2012, 90, 53–62. [Google Scholar] [CrossRef]
  23. Chen, J.; Li, Z.W.; Xiao, H.B.; Ke, N.; Tang, C.J. Effects of land use and land cover on soil erosion control in southern China: Implications from a systematic quantitative review. J. Environ. Manag. 2021, 282, 111924. [Google Scholar] [CrossRef] [PubMed]
  24. Du, X.Z.; Zhao, X.; Liang, S.L.; Zhao, J.C.; Xu, P.P.; Wu, D.H. Quantitatively Assessing and Attributing Land Use and Land Cover Changes on China’s Loess Plateau. Remote Sens. 2020, 12, 353. [Google Scholar] [CrossRef]
  25. Liu, J.B.; Gao, G.Y.; Wang, S.; Jiao, L.; Wu, X.; Fu, B.J. The effects of vegetation on runoff and soil loss: Multidimensional structure analysis and scale characteristics. J. Geogr. Sci. 2018, 28, 59–78. [Google Scholar] [CrossRef]
  26. Chen, J.; Xiao, H.B.; Li, Z.W.; Liu, C.; Wang, D.Y.; Wang, L.X.; Tang, C.J. Threshold effects of vegetation coverage on soil erosion control in small watersheds of the red soil hilly region in China. Ecol. Eng. 2019, 132, 109–114. [Google Scholar] [CrossRef]
  27. Xiong, M.Q.; Sun, R.H.; Chen, L.D. A global comparison of soil erosion associated with land use and climate type. Geoderma 2019, 343, 31–39. [Google Scholar] [CrossRef]
  28. Zhou, Z.C.; Shangguan, Z.P.; Zhao, D. Modeling vegetation coverage and soil erosion in the Loess Plateau Area of China. Ecol. Model. 2006, 198, 263–268. [Google Scholar] [CrossRef]
  29. Gao, J.; Shi, C.Q.; Yang, J.Y.; Yue, H.; Liu, Y.; Chen, B.Z. Analysis of spatiotemporal heterogeneity and influencing factors of soil erosion in a typical erosion zone of the southern red soil region, China. Ecol. Indic. 2023, 154, 110590. [Google Scholar] [CrossRef]
  30. Chen, S.F.; Zha, X.; Bai, Y.H.; Wang, L.Y. Evaluation of soil erosion vulnerability on the basis of exposure, sensitivity, and adaptive capacity: A case study in the Zhuxi watershed, Changting, Fujian Province, Southern China. Catena 2019, 177, 57–69. [Google Scholar] [CrossRef]
  31. Jackson, M.L. Soil Chemical Analysis, 2nd ed.; University of Wisconsin: Madison, WI, USA, 1979. [Google Scholar]
  32. Liang, Y.; Jiao, J.Y.; Dang, W.Q.; Cao, W. The Thresholds of Sediment-Generating Rainfall from Hillslope to Watershed Scales in the Loess Plateau, China. Water 2019, 11, 2392. [Google Scholar] [CrossRef]
  33. Xie, Y.; Liu, B.; Nearing, M.A. Practical thresholds for separating erosive and non-erosive storms. Trans. ASABE 2002, 45, 1843–1847. [Google Scholar] [CrossRef]
  34. Duan, J.; Yang, J.; Tang, C.J.; Chen, L.H.; Liu, Y.J.; Wang, L.Y. Effects of rainfall patterns and land cover on the subsurface flow generation of sloping Ferralsols in southern China. PLoS ONE 2017, 12, 0182706. [Google Scholar] [CrossRef] [PubMed]
  35. Hu, J.; Lü, Y.H.; Fu, B.J.; Comber, A.J.; Harris, P. Quantifying the effect of ecological restoration on runoff and sediment yields: A meta-analysis for the Loess Plateau of China. Prog. Phys. Geogr. 2017, 41, 753–774. [Google Scholar] [CrossRef]
  36. Zhao, J.L.; Wang, Z.G.; Dong, Y.F.; Yang, Z.Q.; Govers, G. How soil erosion and runoff are related to land use, topography and annual precipitation: Insights from a meta-analysis of erosion plots in China. Sci. Total Environ. 2022, 802, 149665. [Google Scholar] [CrossRef] [PubMed]
  37. Zhang, X.X.; Song, J.X.; Wang, Y.R.; Deng, W.J.; Liu, Y.F. Effects of land use on slope runoff and soil loss in the Loess Plateau of China: A meta-analysis. Sci. Total Environ. 2021, 755, 142418. [Google Scholar] [CrossRef]
  38. Han, D.D.; Deng, J.C.; Gu, C.J.; Mu, X.M.; Gao, P.; Gao, J.J. Effect of shrub-grass vegetation coverage and slop gradient on runoff and sediment yield under simulated rainfall. Int. J. Sediment Res. 2021, 36, 29–37. [Google Scholar] [CrossRef]
  39. Cerdà, A.; Lucas-Borja, M.E.; Franch-Pardo, I.; Úbeda, X.; Novara, A.; López-Vicente, M.; Popović, Z.; Pulido, M. The role of plant species on runoff and soil erosion in a Mediterranean shrubland. Sci. Total Environ. 2021, 799, 149218. [Google Scholar] [CrossRef]
  40. Dou, Y.X.; Yang, Y.; An, S.S.; Zhu, Z.L. Effects of different vegetation restoration measures on soil aggregate stability and erodibility on the Loess Plateau, China. Catena 2020, 185, 104294. [Google Scholar] [CrossRef]
  41. Wang, B.; Xu, G.C.; Ma, T.T.; Chen, L.; Cheng, Y.T.; Li, P.; Li, Z.B.; Zhang, Y.X. Effects of vegetation restoration on soil aggregates, organic carbon, and nitrogen in the Loess Plateau of China. Catena 2023, 231, 107340. [Google Scholar] [CrossRef]
  42. Geißler, C.; Bohnke, M.; Bruelheide, H.; Shi, X.; Scholten, T. Splash erosion potential under tree canopies in subtropical SE China. Catena 2012, 91, 85–93. [Google Scholar] [CrossRef]
  43. Fang, H.Y. Responses of Runoff and Soil Loss on Slopes to Land Use Management and Rainfall Characteristics in Northern China. Int. J. Environ. Res. Public Health 2021, 18, 9583. [Google Scholar] [CrossRef] [PubMed]
  44. Anh, P.T.Q.; Gomi, T.; MacDonald, L.H.; Mizugaki, S.; Khoa, P.V.; Furuichi, T. Linkages among land use, macronutrient levels, and soil erosion in northern Vietnam: A plot-scale study. Geoderma 2014, 232–234, 352–362. [Google Scholar] [CrossRef]
  45. Zhang, B.J.; Zhang, G.H.; Yang, H.Y.; Wang, H. Soil resistance to flowing water erosion of seven typical plant communities on steep gully slopes on the Loess Plateau of China. Catena 2019, 173, 375–383. [Google Scholar] [CrossRef]
  46. Wang, H.; Chen, W.X.; Zhou, M.; Zhuo, Z.P.; Zhang, Y.; Jiang, F.S.; Huang, Y.H.; Lin, J.S. Runoff and sediment characteristics of a typical watershed after continuous soil erosion control in the red soil region of Southern China. Catena 2023, 233, 107484. [Google Scholar] [CrossRef]
  47. Mohammad, A.G.; Adam, M.A. The impact of vegetative cover type on runoff and soil erosion under different land uses. Catena 2010, 81, 97–103. [Google Scholar] [CrossRef]
  48. Fang, N.F.; Wang, L.; Shi, Z.H. Runoff and soil erosion of field plots in a subtropical mountainous region of China. J. Hydrol. 2017, 552, 387–395. [Google Scholar] [CrossRef]
  49. Fernández-Moya, J.; Alvarado, A.; Forsythe, W.; Ramírez, L.; Algeet-Abarquero, N.; Marchamalo-Sacristán, M. Soil erosion under teak (Tectona grandis L.f.) plantations: General patterns, assumptions and controversies. Catena 2014, 123, 236–242. [Google Scholar] [CrossRef]
  50. Gong, C.; Tan, Q.Y.; Liu, G.B.; Xu, M.X. Impacts of mixed forests on controlling soil erosion in China. Catena 2022, 213, 106147. [Google Scholar] [CrossRef]
  51. Liu, Y.F.; Dunkerley, D.; López-Vicente, M.; Shi, Z.H.; Wu, G.L. Trade-off between surface runoff and soil erosion during the implementation of ecological restoration programs in semiarid regions: A meta-analysis. Sci. Total Environ. 2020, 712, 136477. [Google Scholar] [CrossRef]
  52. Huang, Z.G.; Ouyang, Z.Y.; Li, F.R.; Zheng, H.; Wang, X.K. Response of runoff and soil loss to reforestation and rainfall type in red soil region of southern China. J. Environ. Sci. 2010, 22, 1765–1773. [Google Scholar] [CrossRef] [PubMed]
  53. Wei, W.; Jia, F.Y.; Yang, L.; Chen, L.D.; Zhang, H.D.; Yang, Y. Effects of surficial condition and rainfall intensity on runoff in a loess hilly area, China. J. Hydrol. 2014, 513, 115–126. [Google Scholar] [CrossRef]
  54. Wang, C.G.; Ma, J.Y.; Wang, Y.X.; Li, Z.B.; Ma, B. The influence of wheat straw mulching and straw length on infiltration, runoff and soil loss. Hydrol. Process. 2022, 36, 14561. [Google Scholar] [CrossRef]
  55. Tu, A.G.; Xie, S.H.; Li, Y.; Mo, M.H.; Nie, X.F. Analysis of erosive rainfall distribution and sediment yield on long-term field monitoring sloping bare land of red soil. Trans. Chin. Soc. Agric. Eng. 2019, 35, 129–135. (In Chinese) [Google Scholar] [CrossRef]
  56. Liang, Y.; Jiao, J.Y.; Tang, B.Z.; Cao, B.T.; Li, H. Response of runoff and soil erosion to erosive rainstorm events and vegetation restoration on abandoned slope farmland in the Loess Plateau region, China. J. Hydrol. 2020, 584, 124694. [Google Scholar] [CrossRef]
  57. Niu, Y.L.; Li, S.Y.; Liu, Y.; Shi, J.J.; Wang, Y.L.; Ma, Y.S.; Wu, G.L. Regulation of alpine meadow patch coverage on runoff and sediment under natural rainfall on the eastern Qinghai-Tibetan Plateau. J. Hydrol. 2021, 603, 127101. [Google Scholar] [CrossRef]
  58. Guo, X.J.; Shao, Q.Q. Spatial pattern of soil erosion drivers and the contribution rate of human activities on the Loess Plateau from 2000 to 2015: A boundary line from northeast to southwest. Remote Sens. 2019, 11, 2429. [Google Scholar] [CrossRef]
  59. Zhao, L.Y.; Qin, Q.S.; Geng, H.J.; Zheng, F.L.; Zhang, X.C.J.; Li, G.F.; Xu, X.Z.; Zhang, J.Q. Effects of upslope inflow rate, tillage depth, and slope gradients on hillslope erosion processes and hydrodynamic mechanisms. Catena 2023, 228, 107189. [Google Scholar] [CrossRef]
  60. Liu, Q.; Deng, D.P.; Liao, Q.D.; Ying, B. Analysis on the influence of rainfall characteristics on soil and water loss in rocky desertification region. Carbonates Evaporites 2021, 36, 36–77. [Google Scholar] [CrossRef]
  61. Westra, S.; Fowler, H.J.; Evans, J.P.; Alexander, L.V.; Berg, P.; Johnson, F.; Kendon, E.J.; Lenderink, G.; Roberts, N.M. Future changes to the intensity and frequency of short-duration extreme rainfall. Rev. Geophys. 2014, 52, 522–555. [Google Scholar] [CrossRef]
  62. Beven, K.; Brazier, R.E. Dealing with Uncertainty in Erosion Model Predictions; John Wiley & Sons, Ltd.: Hoboken, NJ, USA, 2010; pp. 52–79. [Google Scholar] [CrossRef]
  63. Han, Y.; Zhao, W.W.; Ding, J.Y.; Ferreira, C.S.S. Soil erodibility for water and wind erosion and its relationship to vegetation and soil properties in China’s drylands. Sci. Total Environ. 2023, 903, 166639. [Google Scholar] [CrossRef]
  64. Bogunovic, I.; Viduka, A.; Magdic, I.; Telak, L.J.; Francos, M.; Pereira, P. Agricultural and Forest Land-Use Impact on Soil Properties in Zagreb Periurban Area (Croatia). Agronomy 2020, 10, 1331. [Google Scholar] [CrossRef]
  65. Zhao, Y.S.; Zhu, D.Y.; Wu, Z.G.; Cao, Z. Extreme rainfall erosivity: Research advances and future perspectives. Sci. Total Environ. 2024, 917, 170425. [Google Scholar] [CrossRef]
Figure 1. Zhuxi watershed, location of runoff plots in the Soil and Water Conservation Center of Changting, and runoff plots.
Water 16 01076 g001
Figure 2. Rainfall characteristics in the study area. (a) Annual rainfall and erosive rainfall from 2015 to 2020 in the study area. (b) Monthly average rainfall and erosive rainfall from 2015 to 2020 in the study area.
Water 16 01076 g002
Figure 3. Annual runoff depth (a) and soil erosion modulus (b) in different plots. Notes: R indicates the annual runoff depth (mm), and S indicates the annual soil erosion modulus (t/hm2).
Water 16 01076 g003
Figure 4. Annual average runoff depth (a) and soil erosion modulus (b) in different plots. Notes: R indicates the annual average runoff depth (mm), and S indicates the annual average soil erosion modulus (t/hm2). Different capital letters indicate that differences were significant between different land uses and bare land; different lowercase letters indicate that differences were significant between different land uses.
Water 16 01076 g004
Figure 5. Total erosive rainfall (a), runoff depth (b), and soil erosion modulus (c) under different rainfall types in the different plots. Notes: R indicates the total runoff depth (mm), and S indicates the total soil erosion modulus (t/hm2).
Water 16 01076 g005
Figure 6. RSS of different land uses under rainfall Types I, II, and III. Notes: different lowercase letters indicate that differences were significant between different land uses.
Water 16 01076 g006
Figure 7. Single rainfall runoff depth (R) distribution of different land uses under rainfall Types I, II, and III.
Water 16 01076 g007
Figure 8. Single rainfall soil erosion modulus (S) distribution of different land uses under rainfall Types I, II, and III.
Water 16 01076 g008
Figure 9. Relationships between the rainfall characteristics and single rainfall runoff and soil erosion in different plots. Notes: R indicates the single rainfall runoff depth (mm), and S indicates the single rainfall soil erosion modulus (t/hm2). “*” indicates a significant correlation between R (S) and rainfall characteristics at the 0.05 level; “**” indicates a significant correlation between the R (S) and rainfall characteristics at the 0.01 level.
Water 16 01076 g009
Table 1. Basic soil information of the experimental plots in 2015.
PlotSoil Bulk Density (g/cm3)pHSoil Organic Matter
(%)
Soil Particle Composition (%)
0–0.0010.001–0.010.01–0.050.05–1
CK1.544.440.154.5225.6634.0935.73
GL1.274.780.303.4826.9537.1232.45
AL1.684.350.183.2834.4331.2431.05
OL1.434.300.342.4528.8635.5833.11
FL11.354.090.292.5229.6232.3335.53
FL21.464.170.272.9628.0536.2832.71
FL31.314.540.402.8726.1137.2233.80
FL41.364.040.282.7323.3838.1135.78
Table 2. Basic information on the vegetation of the experimental plots.
PlotTreeUndergrowth Vegetation
SpeciesHeight
(cm)
Basal Diameter
(cm)
Crown Diameter
(cm)
Canopy Density
(%)
TypesSpeciesCoverage
(%)
Height
(cm)
Coverage × Height
CK--------------------
GL----------HerbaceousPaspalun notatum86 ± 11.346.5 ± 0.67--
AL----------CropsSweet potato64 ± 2.6414 ± 0.98--
OLMyrica rubra365 ± 3.508.9 ± 0.20293 ± 1.6747 ± 5.16HerbaceousDicranopteris dichotoma, Cynodon dactylon70 ± 19.7724 ± 2.321715 ± 233.64 b
FL1----------Shrub
Herbaceous
Paspalum wettsteinii, Lespedeza bicolor85 ± 12.9937 ± 19.973315 ± 867.14 a
FL2Liquidambar formosana, Schima superba668 ± 6.836.1 ± 0.48326 ± 3.2565 ± 8.37Shrub
Herbaceous
Miscanthus floridulus, Lespedeza bicolor82 ± 25.6915 ± 1.041224 ± 170.50 b
FL3Pinus massoniana743 ± 5.675.8 ± 0.25392 ± 1.5565 ± 8.37HerbaceousPaspalum wettsteinii13 ± 1.565.2 ± 0.64--
FL4Pinus massoniana777 ± 6.0611.6 ± 0.58499 ± 5.5052 ± 13.29Shrub
Herbaceous
Paspalum wettsteinii, Lespedeza bicolor75 ± 23.0024 ± 1.971859 ± 267.80 b
Notes: CK—bare land; GL—grassland; AL—cropland; OL—orchard; FL1—shrubland; FL2—broad-leaved forest; FL3—Pinus massoniana forest; FL4—Pinus massoniana and shrub forest. Similarly, hereinafter. All vegetation characteristic indicators are the mean values of 6 years (2015–2020). The product of the height and coverage of the undergrowth vegetation (OL, FL1, FL2, and FL4) was calculated to evaluate the aboveground biomass of the low layers of vegetation; different lowercase letters indicate that differences were significant between different land uses. “--” indicates no data or not applicable.
Table 3. Runoff coefficient (RC) and soil loss coefficient (SLC) in different plots.
VariablesTime ScalesCKGLALOLFL1FL2FL3FL4
RC
%
Annual0.566 ± 0.149 A0.088 ± 0.022 Ba0.094 ± 0.050 Ba0.021 ± 0.012 Bb0.014 ± 0.009 Bb0.028 ± 0.014 Bb0.118 ± 0.056 Ba0.035 ± 0.016 Bb
Type I0.505 ± 0.148 A0.075 ± 0.030 Bab0.077 ± 0.026 Bab0.019 ± 0.017 Bc0.014 ± 0.014 Bc0.032 ± 0.024 Bbc0.110 ± 0.062 Ba0.026 ± 0.017 Bbc
Type II0.544 ± 0.093 A0.102 ± 0.030 Ba0.114 ± 0.083 Ba0.023 ± 0.015 Bb0.015 ± 0.008 Bb0.036 ± 0.018 Bb0.126 ± 0.060 Ba0.045 ± 0.024 Bb
Type III0.476 ± 0.100 A0.077 ± 0.036 Bab0.068 ± 0.031 Bab0.014 ± 0.007 Bc0.011 ± 0.008 Bc0.019 ± 0.010 Bc0.109 ± 0.060 Ba0.033 ± 0.017 Bbc
SLC
t·km−2·mm−1
Annual4.050 ± 1.983 A0.203 ± 0.260 Bb0.527 ± 0.415 Ba0.034 ± 0.032 Bb0.039 ± 0.027 Bb0.042 ± 0.029 Bb0.281 ± 0.131 Bab0.063 ± 0.029 Bb
Type I2.946 ± 1.213 A0.052 ± 0.081 Bb0.197 ± 0.081 Ba0.016 ± 0.007 Bb0.017 ± 0.008 Bb0.018 ± 0.004 Bb0.235 ± 0.097 Ba0.033 ± 0.034 Bb
Type II5.760 ± 2.207 A0.289 ± 0.431 Bab0.691 ± 0.658 Ba0.047 ± 0.034 Bb0.056 ± 0.034 Bb0.073 ± 0.049 Bb0.391 ± 0.207 Bab0.081 ± 0.035 Bb
Type III3.342 ± 1.524 A0.136 ± 0.229 Bab0.300 ± 0.128 Ba0.022 ± 0.014 Bb0.033 ± 0.021 Bb0.026 ± 0.014 Bb0.267 ± 0.105 Ba0.047 ± 0.024 Bb
Notes: different capital letters indicate that differences were significant between different land uses and bare land; different lowercase letters indicate that differences were significant between different land uses.
Table 4. Thresholds of runoff- and soil erosion-generating rainfall in the different land uses.
Land UseProjectP (mm)Im (mm·h−1)I30 (mm·h−1)EI30 (MJ·mm·hm−2·h−1)
ThresholdMIThresholdMIThresholdMIThresholdMI
GLR11.000.231.200.218.060.2321.860.26
S12.200.261.200.238.180.2728.100.28
ALR11.800.211.100.177.100.1918.070.20
S12.000.211.000.176.000.1617.280.24
OLR11.000.311.100.368.060.3425.400.28
S8.50 0.39 0.90 0.38 5.30 0.38 13.50 0.33
FL1R12.20 0.39 1.10 0.47 6.04 0.46 19.65 0.37
S9.20 0.46 0.70 0.54 4.06 0.53 12.27 0.44
FL2R12.50 0.46 1.40 0.49 8.06 0.49 25.40 0.42
S8.50 0.57 0.90 0.58 5.03 0.58 13.06 0.51
FL3R11.00 0.20 1.10 0.18 6.04 0.20 17.07 0.23
S9.60 0.19 0.90 0.17 5.03 0.18 12.96 0.19
FL4R11.00 0.24 1.20 0.23 6.04 0.24 13.06 0.23
S8.50 0.27 0.90 0.23 5.00 0.23 10.50 0.24
Notes: P—rainfall; T—rainfall duration; Im—average rainfall intensity; I30—maximum rainfall intensity in 30 min; EI30—rainfall erosivity; IM—mixing index. Similarly, hereinafter.
Table 5. Characteristics of different rainfall types.
Rainfall TypeNo.Variables
T (min)P (mm)Im (mm/h)I30 (mm/h)EI30 (MJ·mm·hm−2·h−1)
Type I242220.00 ± 785.90 A83.60 ± 23.80 A2.65 ± 1.36 B28.28 ± 17.26 584.71 ± 518.68 A
Type II218376.35 ± 270.06 C16.71 ± 9.33 C5.76 ± 8.03 A21.65 ± 43.11 102.09 ± 168.33 B
Type III741367.57 ± 544.03 B33.43 ± 15.38 B1.86 ± 1.50 B15.87 ± 15.91 160.65 ± 245.87 B
Type IV41317.50 ± 406.95 34.75 ± 18.80 7.81 ± 4.14 1317.50 ± 406.95 57.82 ± 56.00
Notes: different capital letters indicate that differences were significant between the 3 main rainfall types (Types I, II, and III).
Table 6. Relationships between runoff and soil erosion in different plots under the 3 rainfall types.
PlotType IType IIType III
Regression FunctionR2pRegression FunctionR2pRegression FunctionR2p
CKS = 0.053R1.0100.563<0.01S = 0.111R1.0190.472<0.01S = 0.005R1.7570.578<0.01
GLS = 0.006R0.5670.352<0.01S = 0.019R0.9980.146<0.01S = 0.010R0.9020.149<0.01
ALS = 0.037R0.8400.738<0.01S = 0.040R1.2410.503<0.01S = 0.053R0.7560.641<0.01
OLS = 0.012R0.2250.284<0.01S = 0.016R0.4980.425<0.01S = 0.010R0.1090.523<0.01
FL1S = 0.015R0.6740.902<0.01S = 0.027R0.6920.518<0.01S = 0.020R0.4670.412<0.01
FL2S = 0.012R0.3410.930<0.01S = 0.019R0.4560.542<0.01S = 0.011R0.0060.606<0.01
FL3S = 0.040R0.7330.554<0.01S = 0.039R0.7750.645<0.01S = 0.033R0.7820.697<0.01
FL4S = 0.014R0.3280.460<0.01S = 0.020R0.5400.438<0.01S = 0.013R0.9570.582<0.01
Table 7. Effects of land use and rainfall type on runoff and soil erosion.
FactorsRSRCSLC
FpFpFpFp
Land use38.259<0.0126.378<0.01164.753<0.0180.672<0.01
Rainfall type6.043<0.017.510<0.012.6360.0767.367<0.01
Land use × Rainfall type1.867<0.054.845<0.010.2720.9963.814<0.01
Table 8. Partial meta-analysis results of runoff and soil erosion under different land uses.
RegionRainfall
(mm)
Runoff (mm)Soil Erosion (t·km−2·a−1)Reference
BLALSLGLOLFLBLALSLGLOLFL
China--129.166.6--72.490.045.254352678--644820151Zhao et al., 2022 [36]
Loess Plateau, ChinaCold and arid regions175.467.157.412.28.3--17.4874054406801930--1120Zhang et al., 2021 [37]
Semi-arid region348.293.797.218.610.4--29.310,520558020701960--2670
Semi-humid region537.5127.6124.526.712.8--34.913,410769023402410--3560
Red soil region, China1300–2000434.1110.9214.2152.0110.9164.06165142860760516491175Chen et al., 2021 [23]
1695.5714.3122.611.3114.122.418.1–165.76153596301783127–316Present study
Notes: all data in the table are annual average values of the studies (BL—bare land; AL—cropland; SL—shrubland; GL—grassland; OL—orchard; FL—forest). “--” indicates no data or not applicable.
Disclaimer/Publisher’s Note: The statements, opinions and data contained in all publications are solely those of the individual author(s) and contributor(s) and not of MDPI and/or the editor(s). MDPI and/or the editor(s) disclaim responsibility for any injury to people or property resulting from any ideas, methods, instructions or products referred to in the content.

