1. Introduction
A storm surge is a phenomenon involving an abnormal increase or decrease in sea level due to intense atmospheric disturbances, such as storms or sudden changes in air pressure. This phenomenon seriously impacts the social economy of coastal areas and poses a notable threat to the sustainable development of coastal areas. Storm surge disasters frequently occur and exert considerable impacts on China, and since 1990, the China Bulletin on Marine Disasters has indicated that storm surge disasters account for more than 90% of all marine disaster losses. From the perspective of a single marine disaster, adopting the storm surge disaster caused by Super Typhoon Lekima in 2019 as an example, the direct economic losses due to this storm surge disaster reached CNY 10.288 billion [
1]. Storm surges driven by strong typhoons landing along the coast of China often cause high losses and casualties. Therefore, early warning and research on storm surges are important, and storm surge numerical forecasting systems comprise the basis for effectively performing this task, providing guarantees for the sustainable development of coastal areas.
Storm surges are affected by meteorology, tides, nearshore waves, and river runoff, among which meteorology, as the forcing of storm surges, fulfills a leading role. Typhoon characteristics, such as intensity, circulation size, and wind distribution, are particularly important for storm surge forecasting [
2,
3,
4]; moreover, Dullaart used wind fields with different resolutions to simulate storm surges, indicating that high-resolution wind fields could improve the accuracy of storm surge simulations and reduce forecast errors [
5]. In simulating storm surges caused by landfall of strong typhoons, parameterized typhoon wind field models based on simplified physical and numerical models have mostly been adopted because the wind field distributions of such typhoons are relatively uniform. In 1980, Holland proposed the Holland typhoon wind field model based on typhoon data from low-latitude waters in Australia and introduced the radial pressure distribution coefficient
B based on the maximum wind speed radius
to describe the change in the radial profile structure of typhoons [
6]. Since then, many scholars have empirically verified the key parameters of the Holland typhoon wind field model in different research areas. Based on aircraft detection data for the southeastern coastal areas of the United States, a fitting equation for parameter
with respect to
and latitude was provided [
7]. Vickery associated
with
and proposed a fitting equation for
with
and the central pressure difference
[
8]. Love provided fitting equations for
and the central pressure difference
based on measured hurricane data for Australian waters [
9]. Based on tropical cyclone data from the Bay of Bengal, Jakobsen proposed a fitting relationship between
and the central pressure difference
, as well as the maximum wind speed within 1 min [
10].
At the same time, many scholars have investigated the Northwest Pacific Ocean. Li showed that
follows a lognormal distribution, and a model for calculating
in typhoon-prone coastal areas of China was fitted [
11]. Based on historical typhoon data from 1949 to 2016, Fang provided a fitting equation for
regarding the central pressure difference
and latitude and constructed a parametric wind field model suitable for the Northwest Pacific Ocean [
12]. Luo employed several combinations of
and
to obtain the best combination of parameters suitable for the coastal area of Zhejiang by comparing the simulation results with the measured wind speed and applying the optimal parameter combination in storm surge hindcasting, which improved the simulation accuracy [
13].
Numerical models are important tools for studying storm surges and waves in estuarine areas. Interactions between storm surges, tides, and waves exist and cannot be ignored in estuaries and nearshore areas with wide tidal ranges. Bunya and Dietrich conducted detailed simulation validation of the powerful storms Katrina and Rita affecting southern Louisiana and Mississippi using the parallel Advanced Circulation for Oceanic, Coastal and Estuarine Waters (ADCIRC) + Simulating Waves Nearshore (SWAN) model and studied how storm tracks, winds, and waves interact with the topography, the protruding Mississippi River Delta, east–west shorelines, artificial structures, and low-lying structures, indicating the importance of considering multifactor coupling in estuarine areas [
14,
15]. Based on the ADCIRC model, Pavlova evaluated the quality of storm surge simulations in the Caspian Sea in winter and determined that the model performed well and that the contribution of winds to storm surges exceeded 90% and dominated [
16]. Xie studied the interaction among storm surges, tides, and waves along the southern coast of the Gulf of Maine in the United States and focused on elucidating the change characteristics of the significant wave height (SWH) and wave radiation stress gradient in shallow coastal areas. The results showed that waves must be considered when simulating flooding due to storm surges in estuarine areas [
17]. A parametric typhoon model combined with ERA5 data (ERA5H) and a fully coupled circulation wave model were employed to evaluate the contribution of waves to storm surges caused by Super Typhoon Meranti in 2016 along the coast of Taiwan, and the results indicated that the impact of tide–wave interactions on the total water level was relatively limited, which is due to the steep terrain along the southeastern coast of Taiwan [
18]. In addition, when studying extreme flood risks along the coast, Lewis coupled large waves, and the simulated high water levels in some areas were 20% higher than those in non-coupled areas; moreover, the simulation results for three grids of different resolutions varied by 10%, indicating that fine grids are beneficial for simulating flooding caused by storm surges [
19].
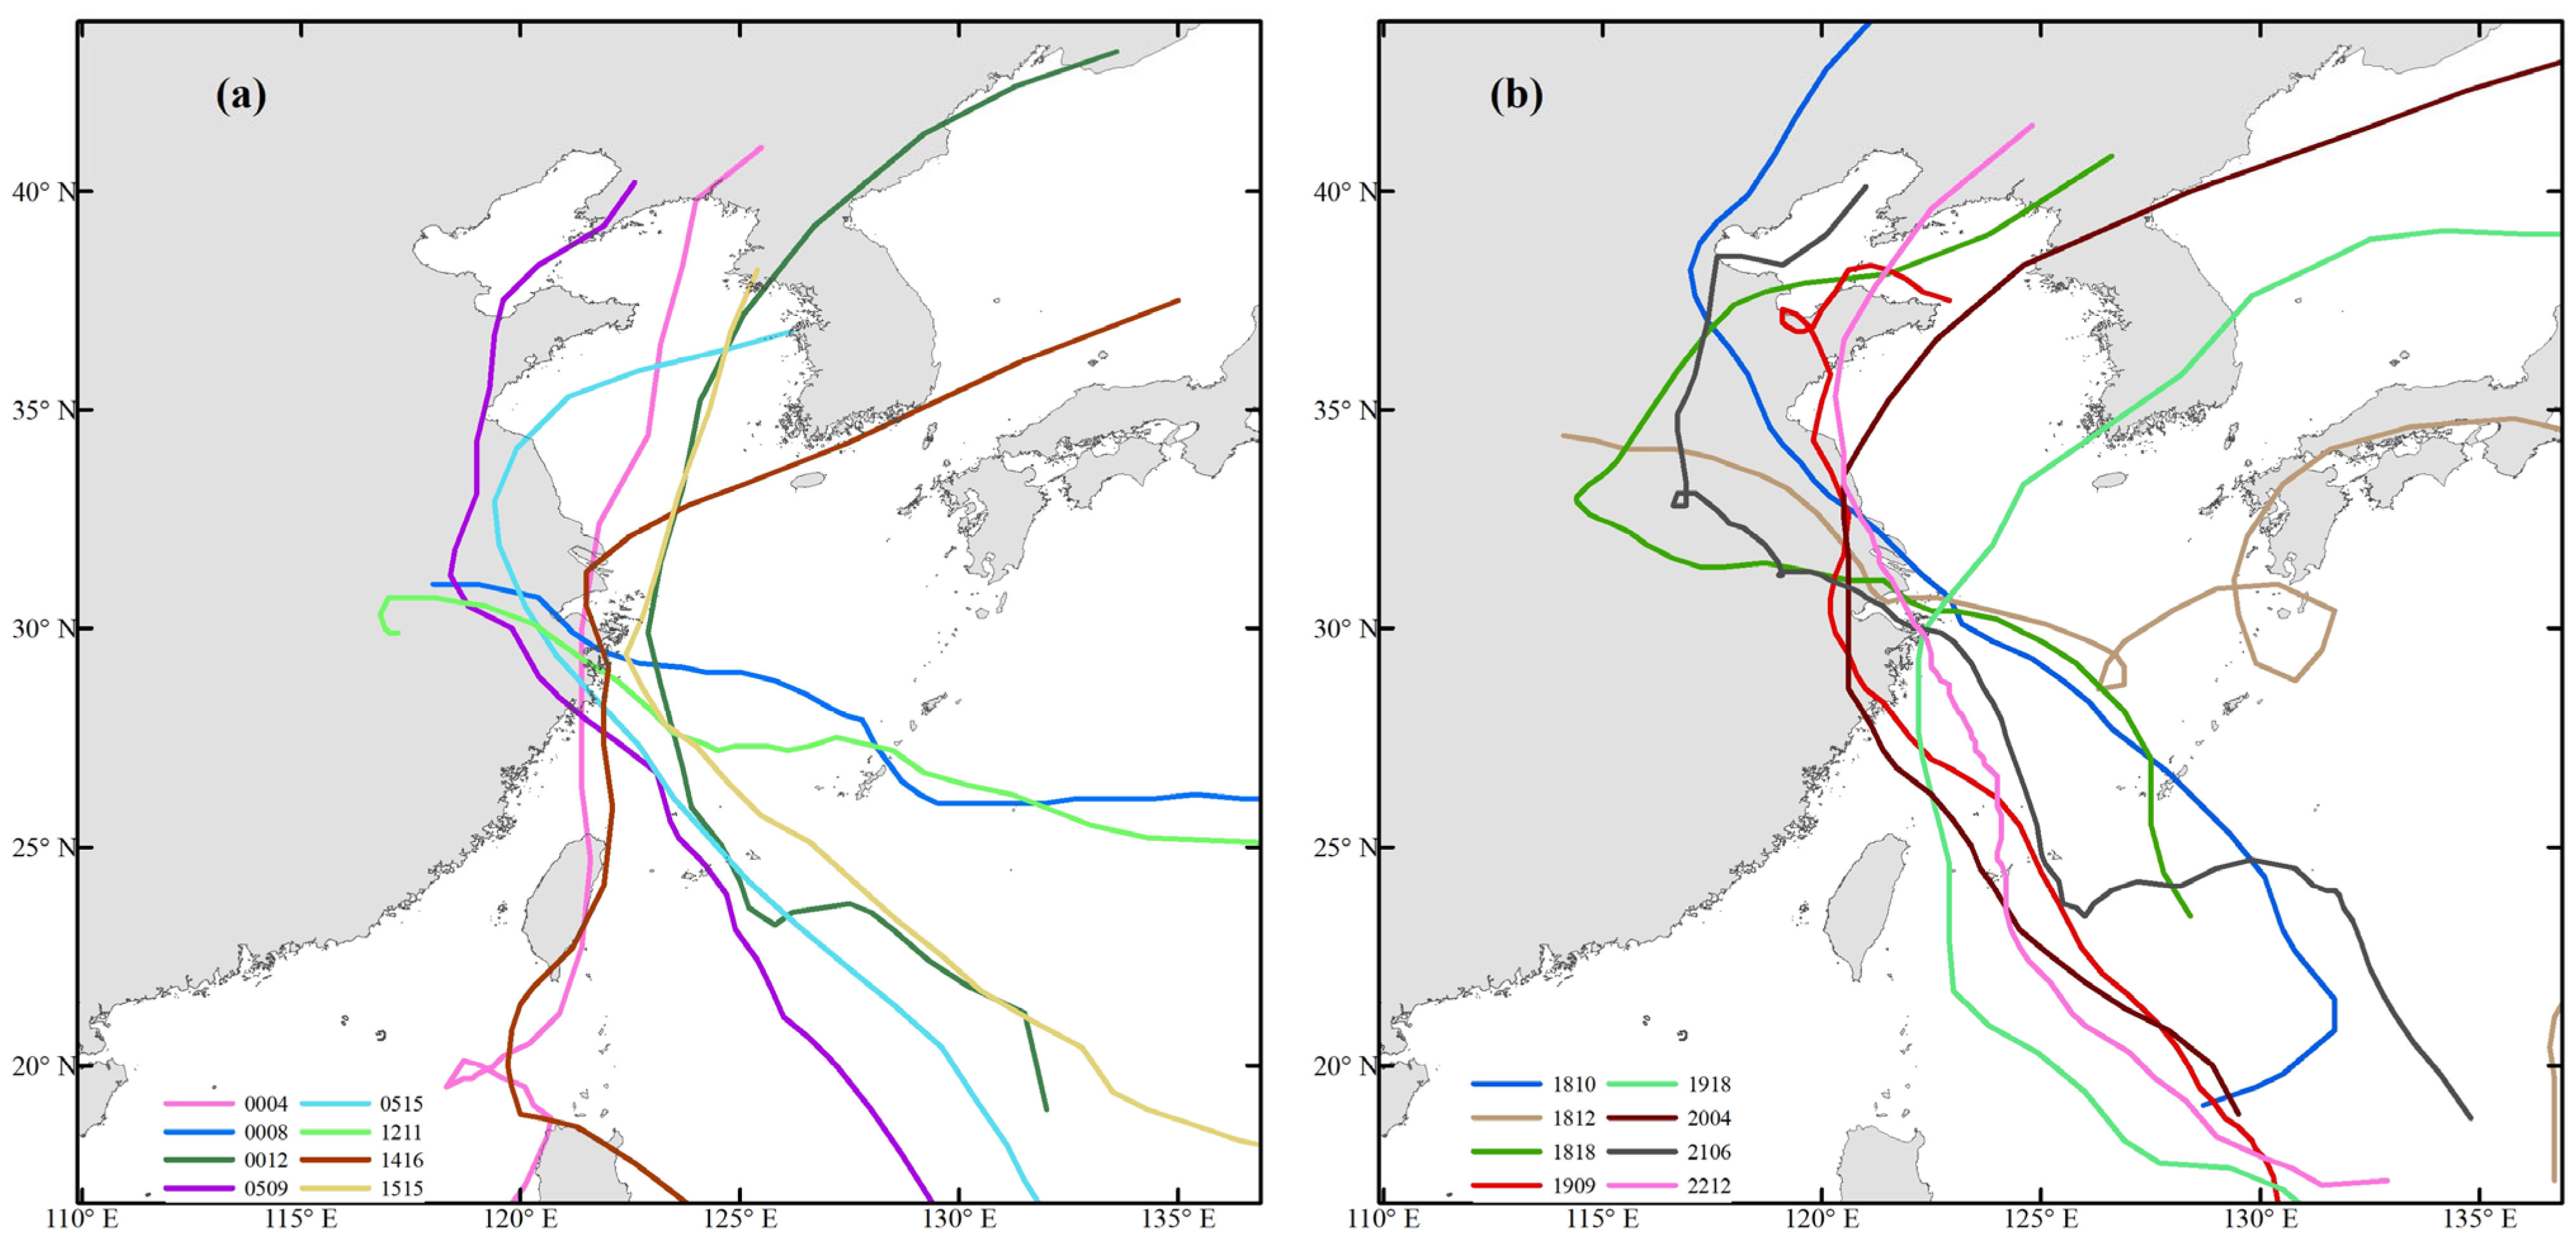
The above research provided important insights for this study. According to long-term China Meteorological Administration (CMA) Typhoon Best Track data [
20,
21], data on typhoons that made landfall or severely affected Hangzhou Bay and the Yangtze River Estuary from 2000 to 2022 were collected (
Figure 1). Eight typhoons notably impacted the region from 2000 to 2017, two of which made landfall at the front (
Figure 1a). From 2018 to 2022, eight typhoons seriously affected the region, six of which made landfall at the front (
Figure 1b), which indicates that the occurrence of typhoons affecting the region has become more frequent over the past five years. In 2019, 2021, and 2022, Typhoon Mitag, Typhoon In-fa, and Typhoon Muifa, respectively, made landfall in Hangzhou Bay and the Yangtze River Estuary, triggering strong storm surges, which resulted in challenges in coastal prevention. Additionally, storm surge forecasting is generally successful, but there was a notable storm surge forecast error in Hangzhou Bay during Typhoon Muifa. The storm surge numerical forecasting results may be excessively large due to the provided maximum wind speed radius of the typhoon. Determining the maximum wind speed radius is the key to storm surge numerical prediction and application. In this study, we focused on the storm surge event associated with Typhoon Muifa and analyzed the commonly used scheme for determining the maximum wind speed radius of a typhoon. Additionally, we established a stepwise scheme for driving wave and storm surge numerical models. Then, we compared the numerical results with wave buoys data to examine the advantages and disadvantages of each scheme. Finally, we obtained the best scheme for storm surge numerical forecasting and evaluated the improvement in 24 h storm surge numerical prediction.
3. Results
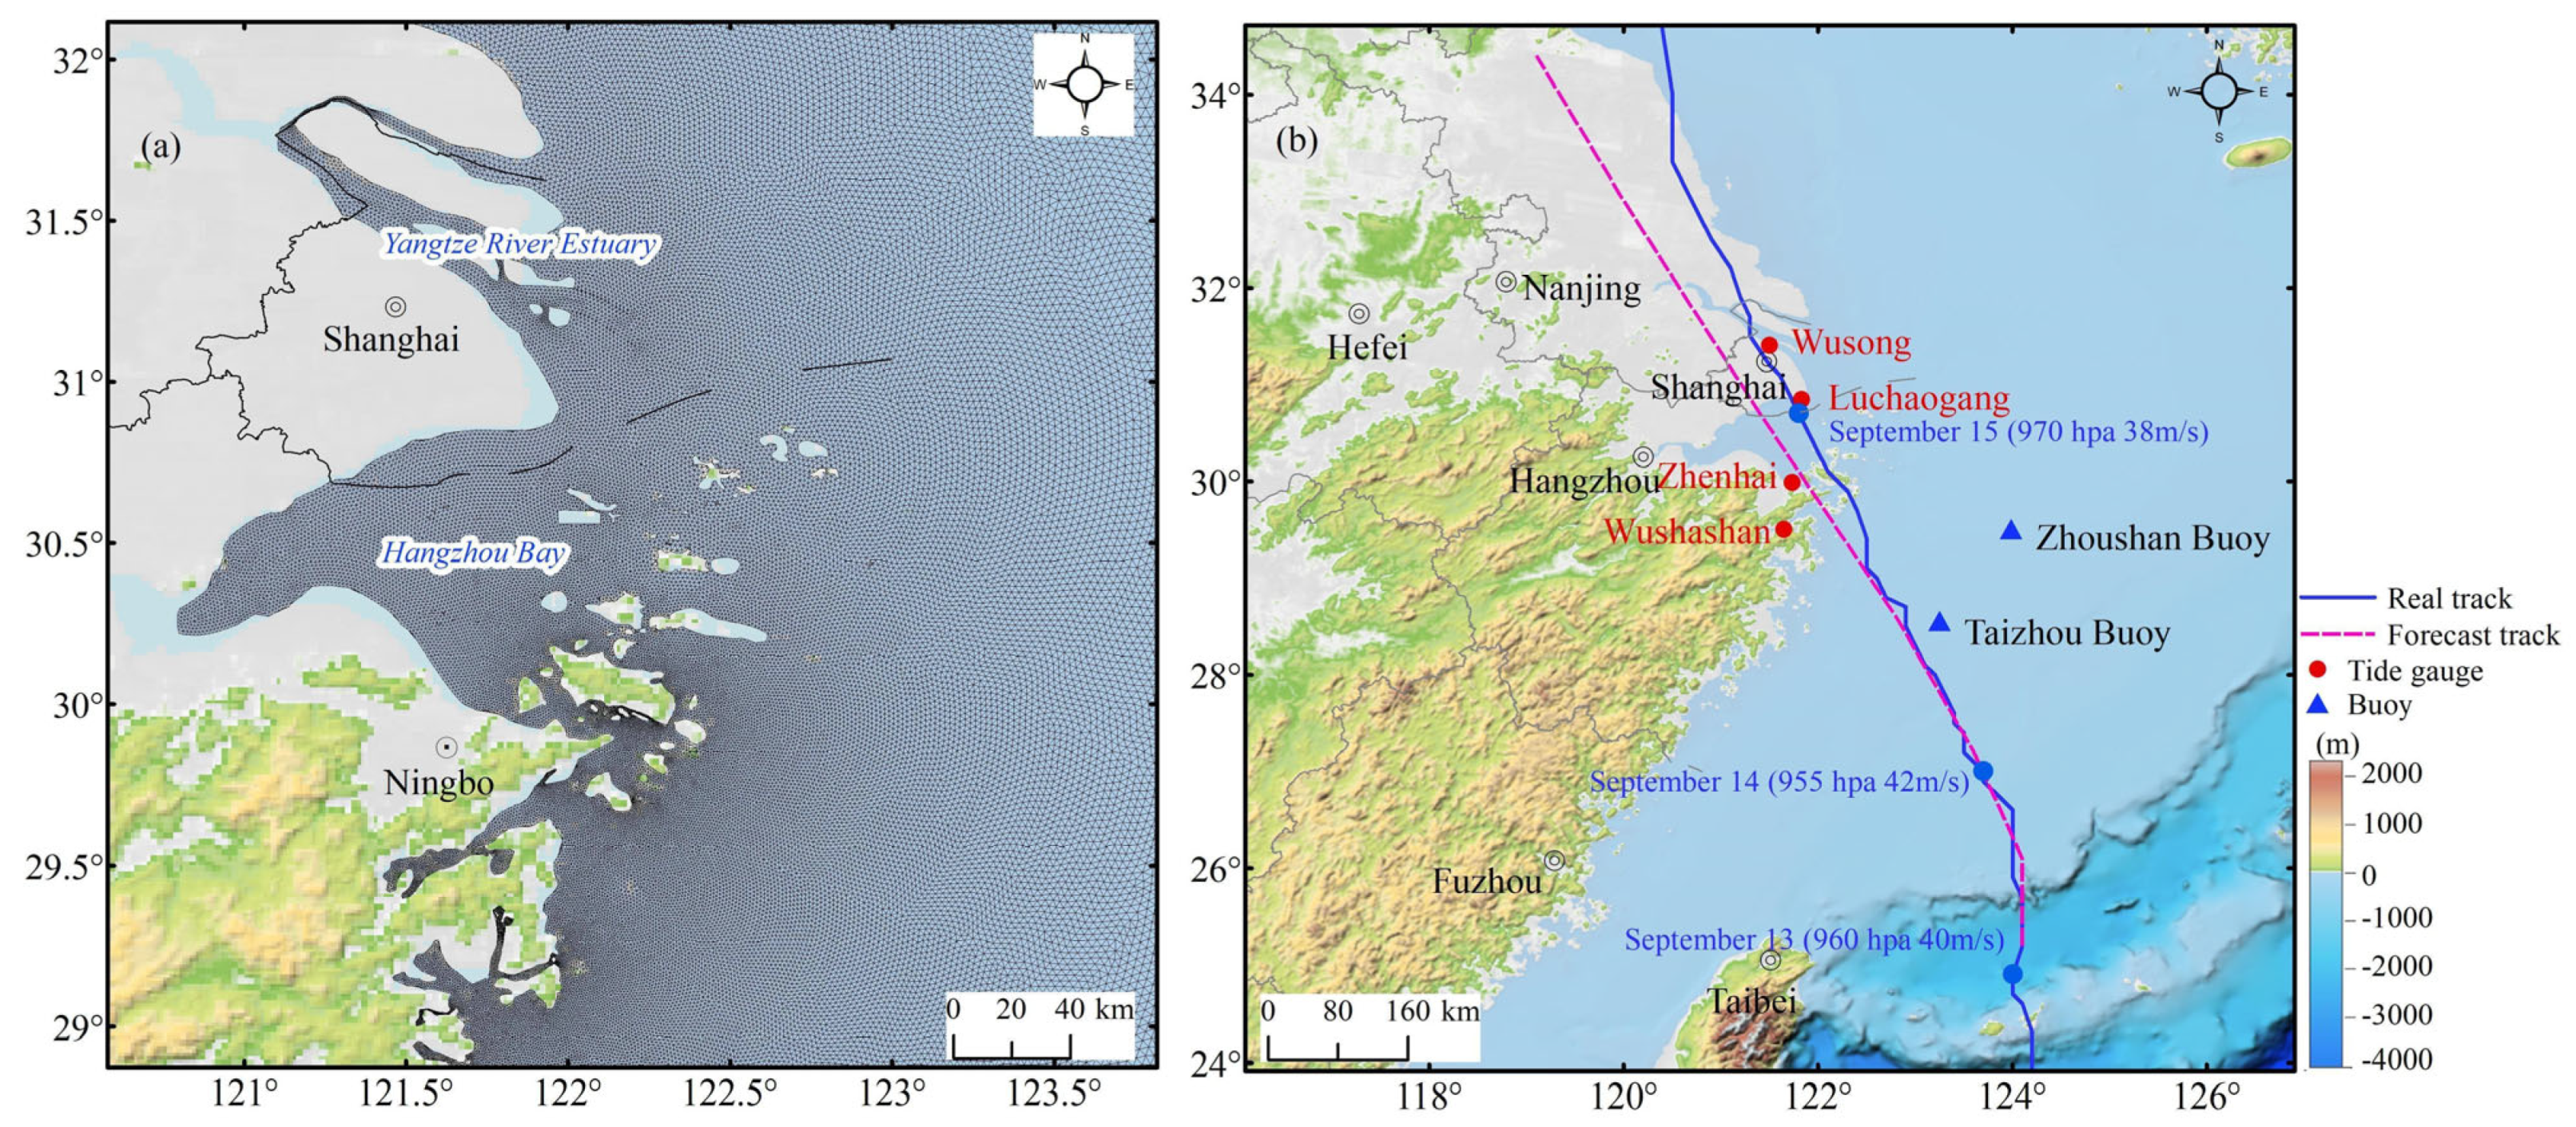
Typhoon Muifa formed over the Northwest Pacific Ocean on 7 September 2022 (Beijing time, the same below), intensified into a strong typhoon on 11 September, made landfall in Zhoushan, Zhejiang Province, China, at 20:30 on 14 September, and made its second landfall in Shanghai at 0:30 on 15 September (
Figure 2b), becoming the strongest typhoon to make landfall on the coast of China in 2022.
Affected by Typhoon Muifa, from 14 to 15 September, a maximum storm surge exceeding 1 m was generally observed at the coastal tidal gauge stations from the southern part of Jiangsu Province to the northern part of Zhejiang Province, and the maximum storm surges in Hangzhou Bay and the Yangtze River Estuary were close to 2 m. In the process of storm surge warning, the maximum storm surge forecast value was 2.8 m, which was greater than the measured value in the coastal section of Hangzhou Bay. The maximum tide level in the coastal section of Shanghai was predicted to reach the yellow or orange warning line, which is consistent with the actual tide, but the maximum tide level in the coastal section of Hangzhou Bay was predicted to reach the orange warning line, which exceeds the actual tide. The predicted storm surge and warning levels in the coastal section of Hangzhou Bay were greater than the actual measurements.
3.1. Schemes for the Maximum Wind Speed Radius of a Typhoon
Generally, the wind field structure of a severe typhoon making landfall is nearly circular, and the wind distribution is relatively uniform, which is suitable for the wind field depicted by the Holland model [
6]. The typhoon pressure and wind speed can be expressed as follows:
where
is the sea surface pressure at location
from the center of the typhoon, which is a function of the radial distance
and azimuth angle
,
is the central pressure of the typhoon,
is the background pressure, with a value of 1020 hPa in this paper,
is the maximum wind speed radius of the typhoon,
is the tangential wind speed at distance
from the center of the typhoon,
is the air density,
is the Coriolis parameter, and
is a typhoon profile parameter that characterizes the diameter and tangential velocity gradient of the typhoon eye area, with a value of 2.0 in this paper.
When forecasting the storm surge caused by a severe typhoon making landfall, the maximum wind speed radius of the typhoon is , providing a reference for the storm surge early warning system. A review of the research on the maximum wind speed radius provided the following two schemes:
When forecasting the storm surge caused by severe typhoons, the magnitude of typhoon circulation, wind distribution, and other information needed to determine must be comprehensively considered, providing a reference for storm surge warning systems. The research on can be summarized as follows:
(1) A universal equation has been obtained from the statistical analysis and fitting of multiyear historical typhoon data from different sea areas [
11,
12,
13]. There are differences in the parameterization schemes of the Holland typhoon wind field model parameters among various research areas, and in the Zhejiang Sea area, the parameterization scheme verified by Luo [
13] was adopted in this paper, which can be expressed as follows:
(2) Derivations from measured data or inversions and extrapolations have been reported. Airborne measurements of aviation aircraft [
33] can provide
in real time, but the cost is high. Based on satellite remote sensing-based wind field inversion [
34], microwave radiometers, and other equipment used after observation, the real-time performance of this method is lagging and may introduce errors into the actual measurements. Based on the inversion of wave buoys data, the method adopted in this study aimed to compare the numerical wave prediction results of ensemble members with the measured buoy data when the typhoon was located offshore, and
was selected based on the ensemble members closest to the measured values as the key parameter for 24 h storm surge numerical prediction.
In this paper, a stepwise value scheme was established for numerical simulation verification according to the above schemes. According to the first scheme, the of Typhoon Muifa’s change in central pressure from 8:00 on 12 September to 08:00 on 15 September was 33–41 km, and considering that the circulation of Typhoon Muifa was limited, the value was corrected according to forecast experience (a coefficient of 0.9), and during the strongest typhoon period was 30 km. According to the second scheme, the value must be determined after comparing the numerical hindcast results with the measured buoy data. In this paper, five stepped schemes were established, namely 30, 25, 20, 15, and 10 km, denoted as R30, R25, R20, R15, and R10, respectively.
3.2. Comparison and Analysis of the Numerical Hindcast Results
As is well known, the tidal range in Hangzhou Bay and its surrounding waters is large, and the nonlinear interaction between storm surges and tides cannot be ignored in this area. The open boundary was driven by eight constituents (M2, S2, K2, N2, K1, O1, P1, and Q1), and harmonic constants were derived from the global tidal model NAO99 [
35]. These data were used to calculate the open boundary tidal level with the tidal potential model [
28]. To achieve a stable tidal state, the tide for three days was calculated in advance, and typhoon information was added thereafter. Therefore, storm surges and tides were coupled. Severe typhoons with small circulation times do not experience large storm surges until a few hours before and after landfall; examples include Super Typhoon Saomai in 2006 and Super Typhoon Rammasun in 2014. Therefore, if
can be obtained by inverting wave buoys observation data one day before a typhoon makes landfall, this approach can provide an important reference for storm surge forecasting.
Figure 2b shows the actual track and 24 h forecast track of Typhoon Muifa. The wave buoys include the Taizhou and Zhoushan buoys, which are located within the influence range of Typhoon Muifa, approximately 250 km away from the coast of China, and the wave state can be observed one day before the typhoon makes landfall. According to the best track of the typhoon and the above five
schemes, the calculation time of the wave model ranged from 00:00 on 11 September to 23:00 on 15 September, and the result from 00:00 on 12 September to 23:00 on 14 September was adopted as the hindcast result. To obtain the response time for storm surge warning decisions, 08:00 on 13 September was considered the boundary, 00:00 on 12 September to 08:00 on 13 September was considered the 48 h warning period, and 09:00 on 13 September to 20:00 on 14 September was defined as the 24 h warning period. The calculation time of the storm surge model ranged from 00:00 on 11 September to 23:00 on 16 September, and the result from 00:00 on 12 September to 11:00 on 15 September was employed as the hindcast result, with 14:00 on 13 September as the boundary, 00:00 on 12 September to 14:00 on 13 September as the 48 h warning period, and 15:00 on 13 September to 06:00 on 15 September as the 24 h warning period.
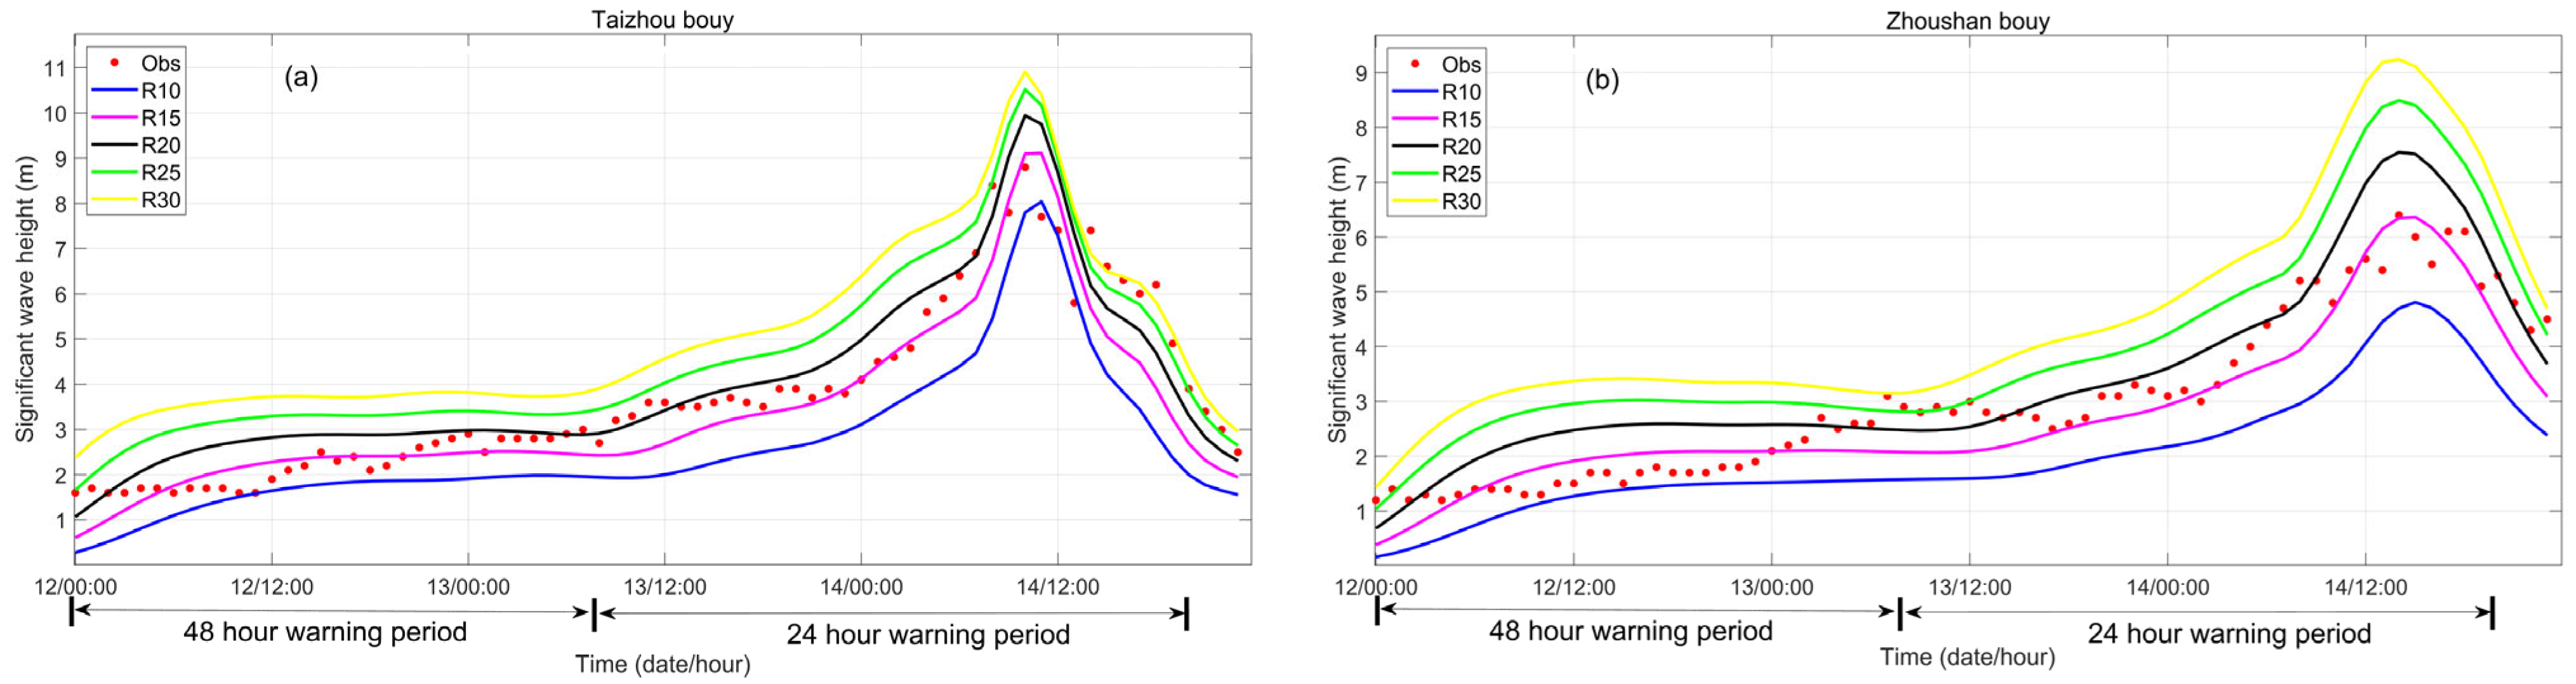
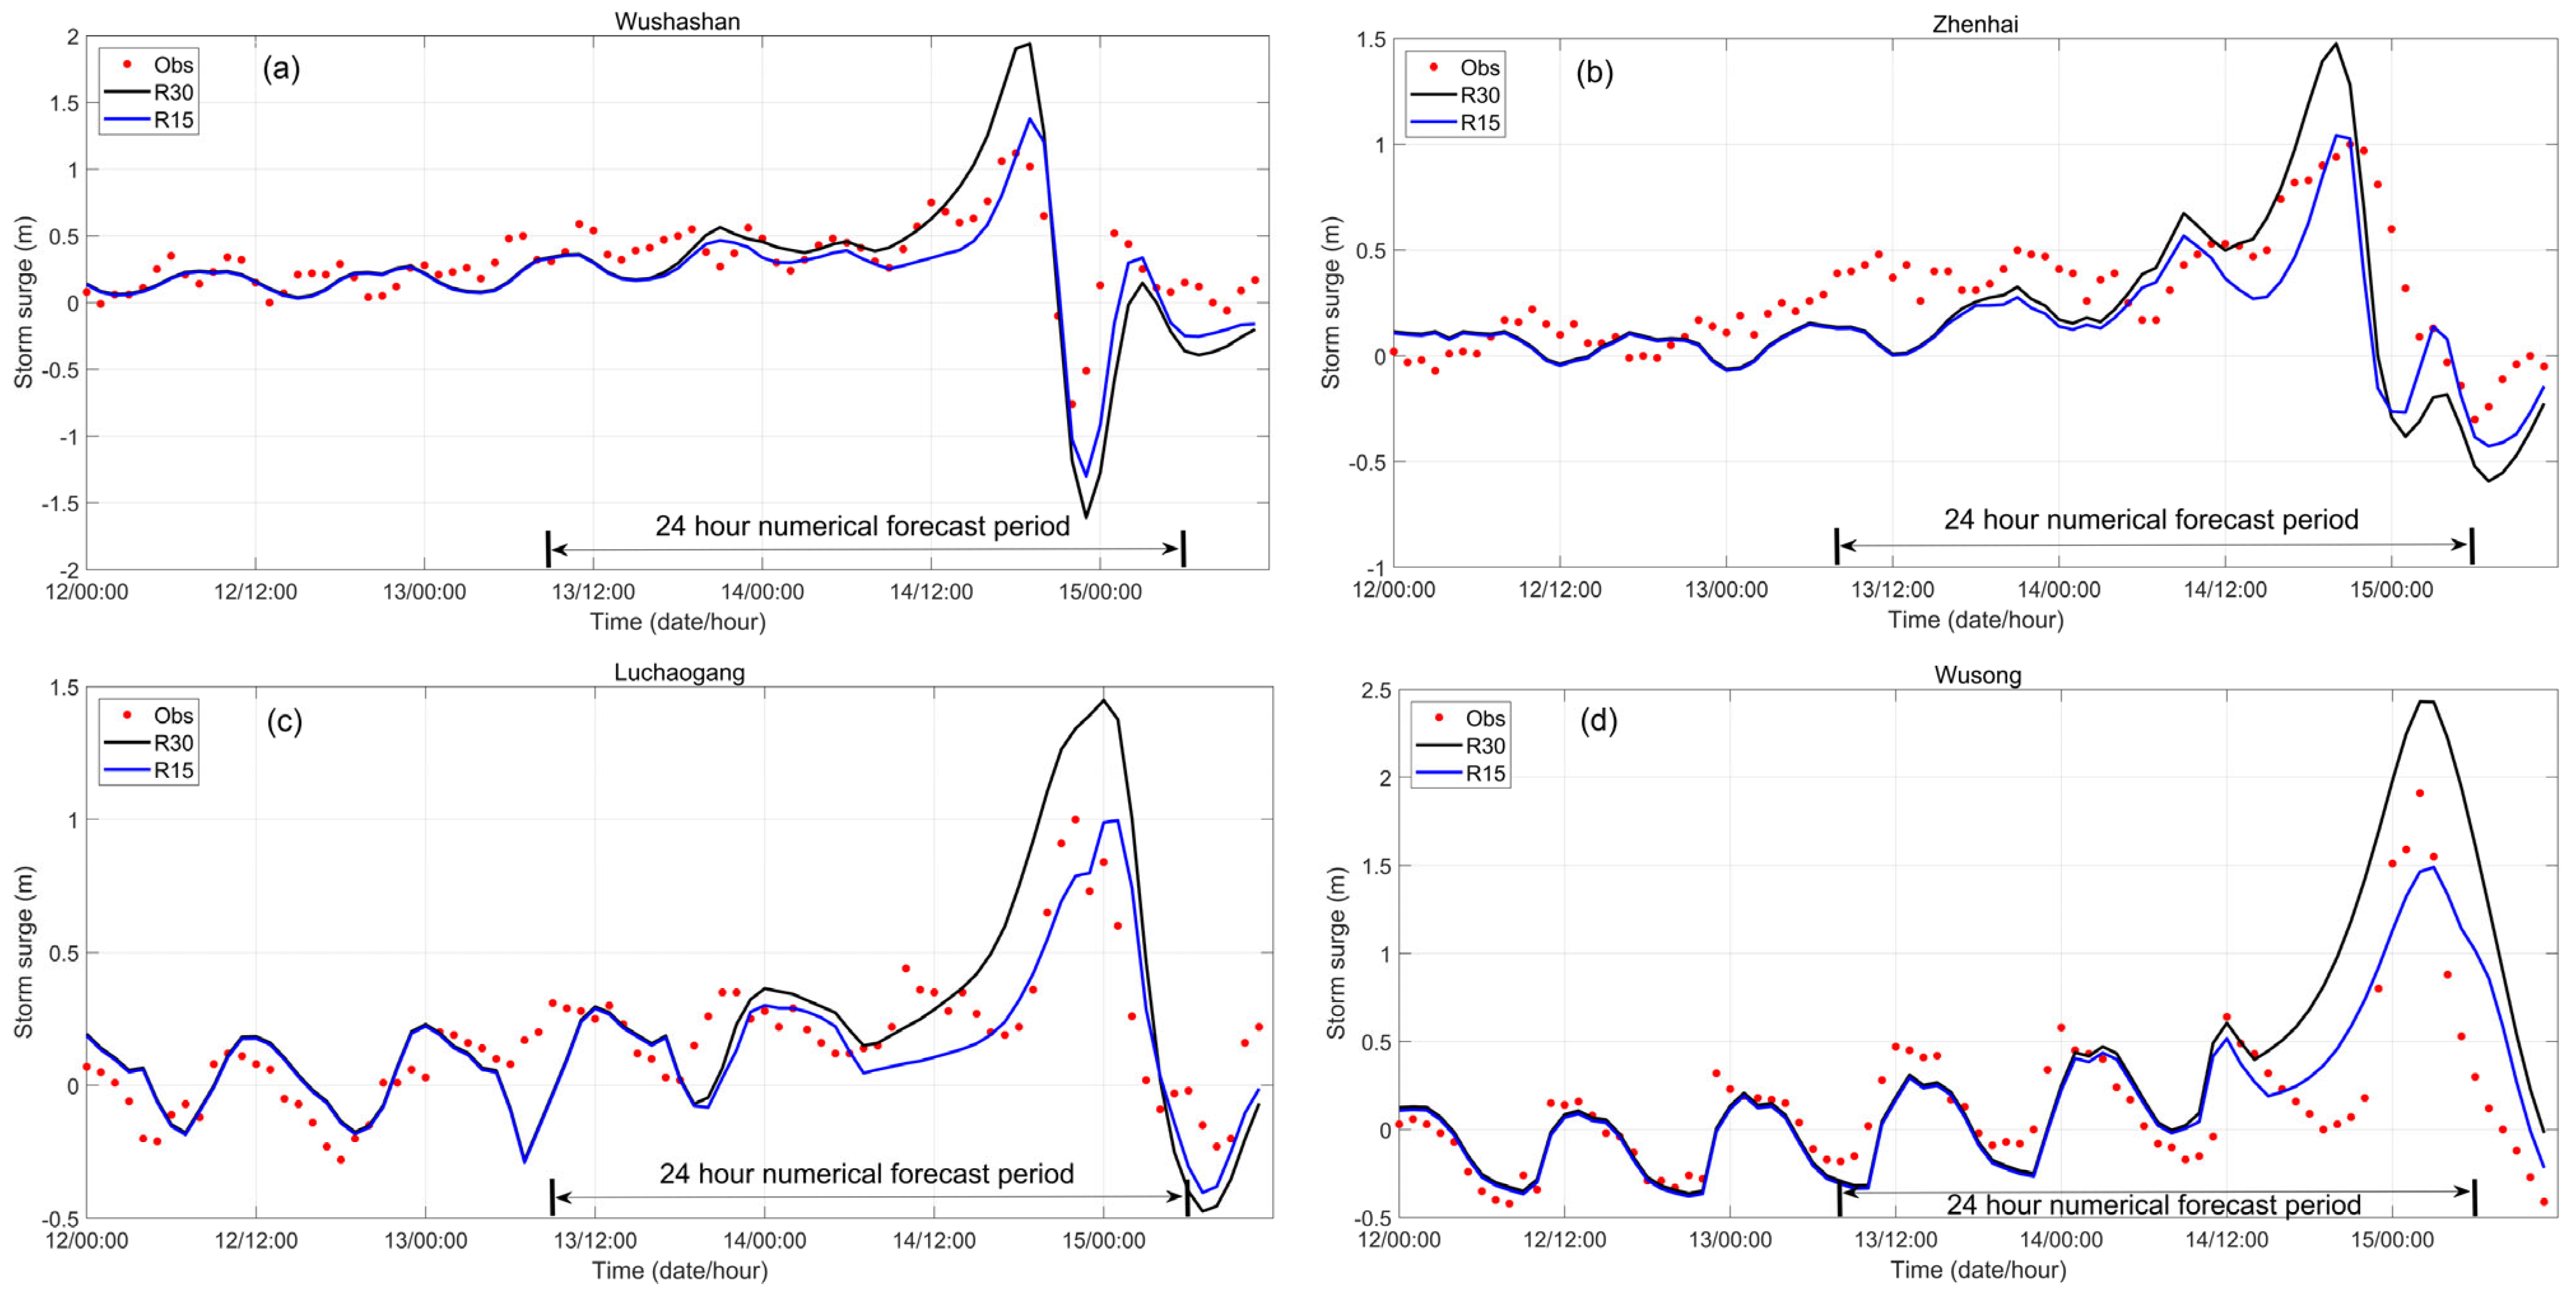
Figure 3 and
Table 1 provide the comparison and error statistics of the process curves of the SWH measured by the wave buoys and the hindcast results of the wave model, respectively. The trend in the SWH numerical results was consistent with that in the measured results. Notably, the root mean square error (RMSE) (0.39~0.76 m) of the R15 scheme was the lowest during both the 48 h warning period and the 24 h warning period, and the RMSE (0.58~0.88 m) of the R20 scheme was the second lowest. The RMSE values of the other three schemes were generally greater than 1. According to the comparison of the numerical hindcast results of the two warning periods to the actual measurements, the 48 h warning period coincided with the stage of SWH growth, the maximum value had not yet appeared, and the RMSE of each scheme was smaller than that during the 24 h warning period. Moreover, the R15 scheme performed better. In addition, from the perspective of the maximum SWH error, the R15 scheme achieved the lowest errors (1% and 4%), while the other four schemes generally yielded errors greater than 10%.
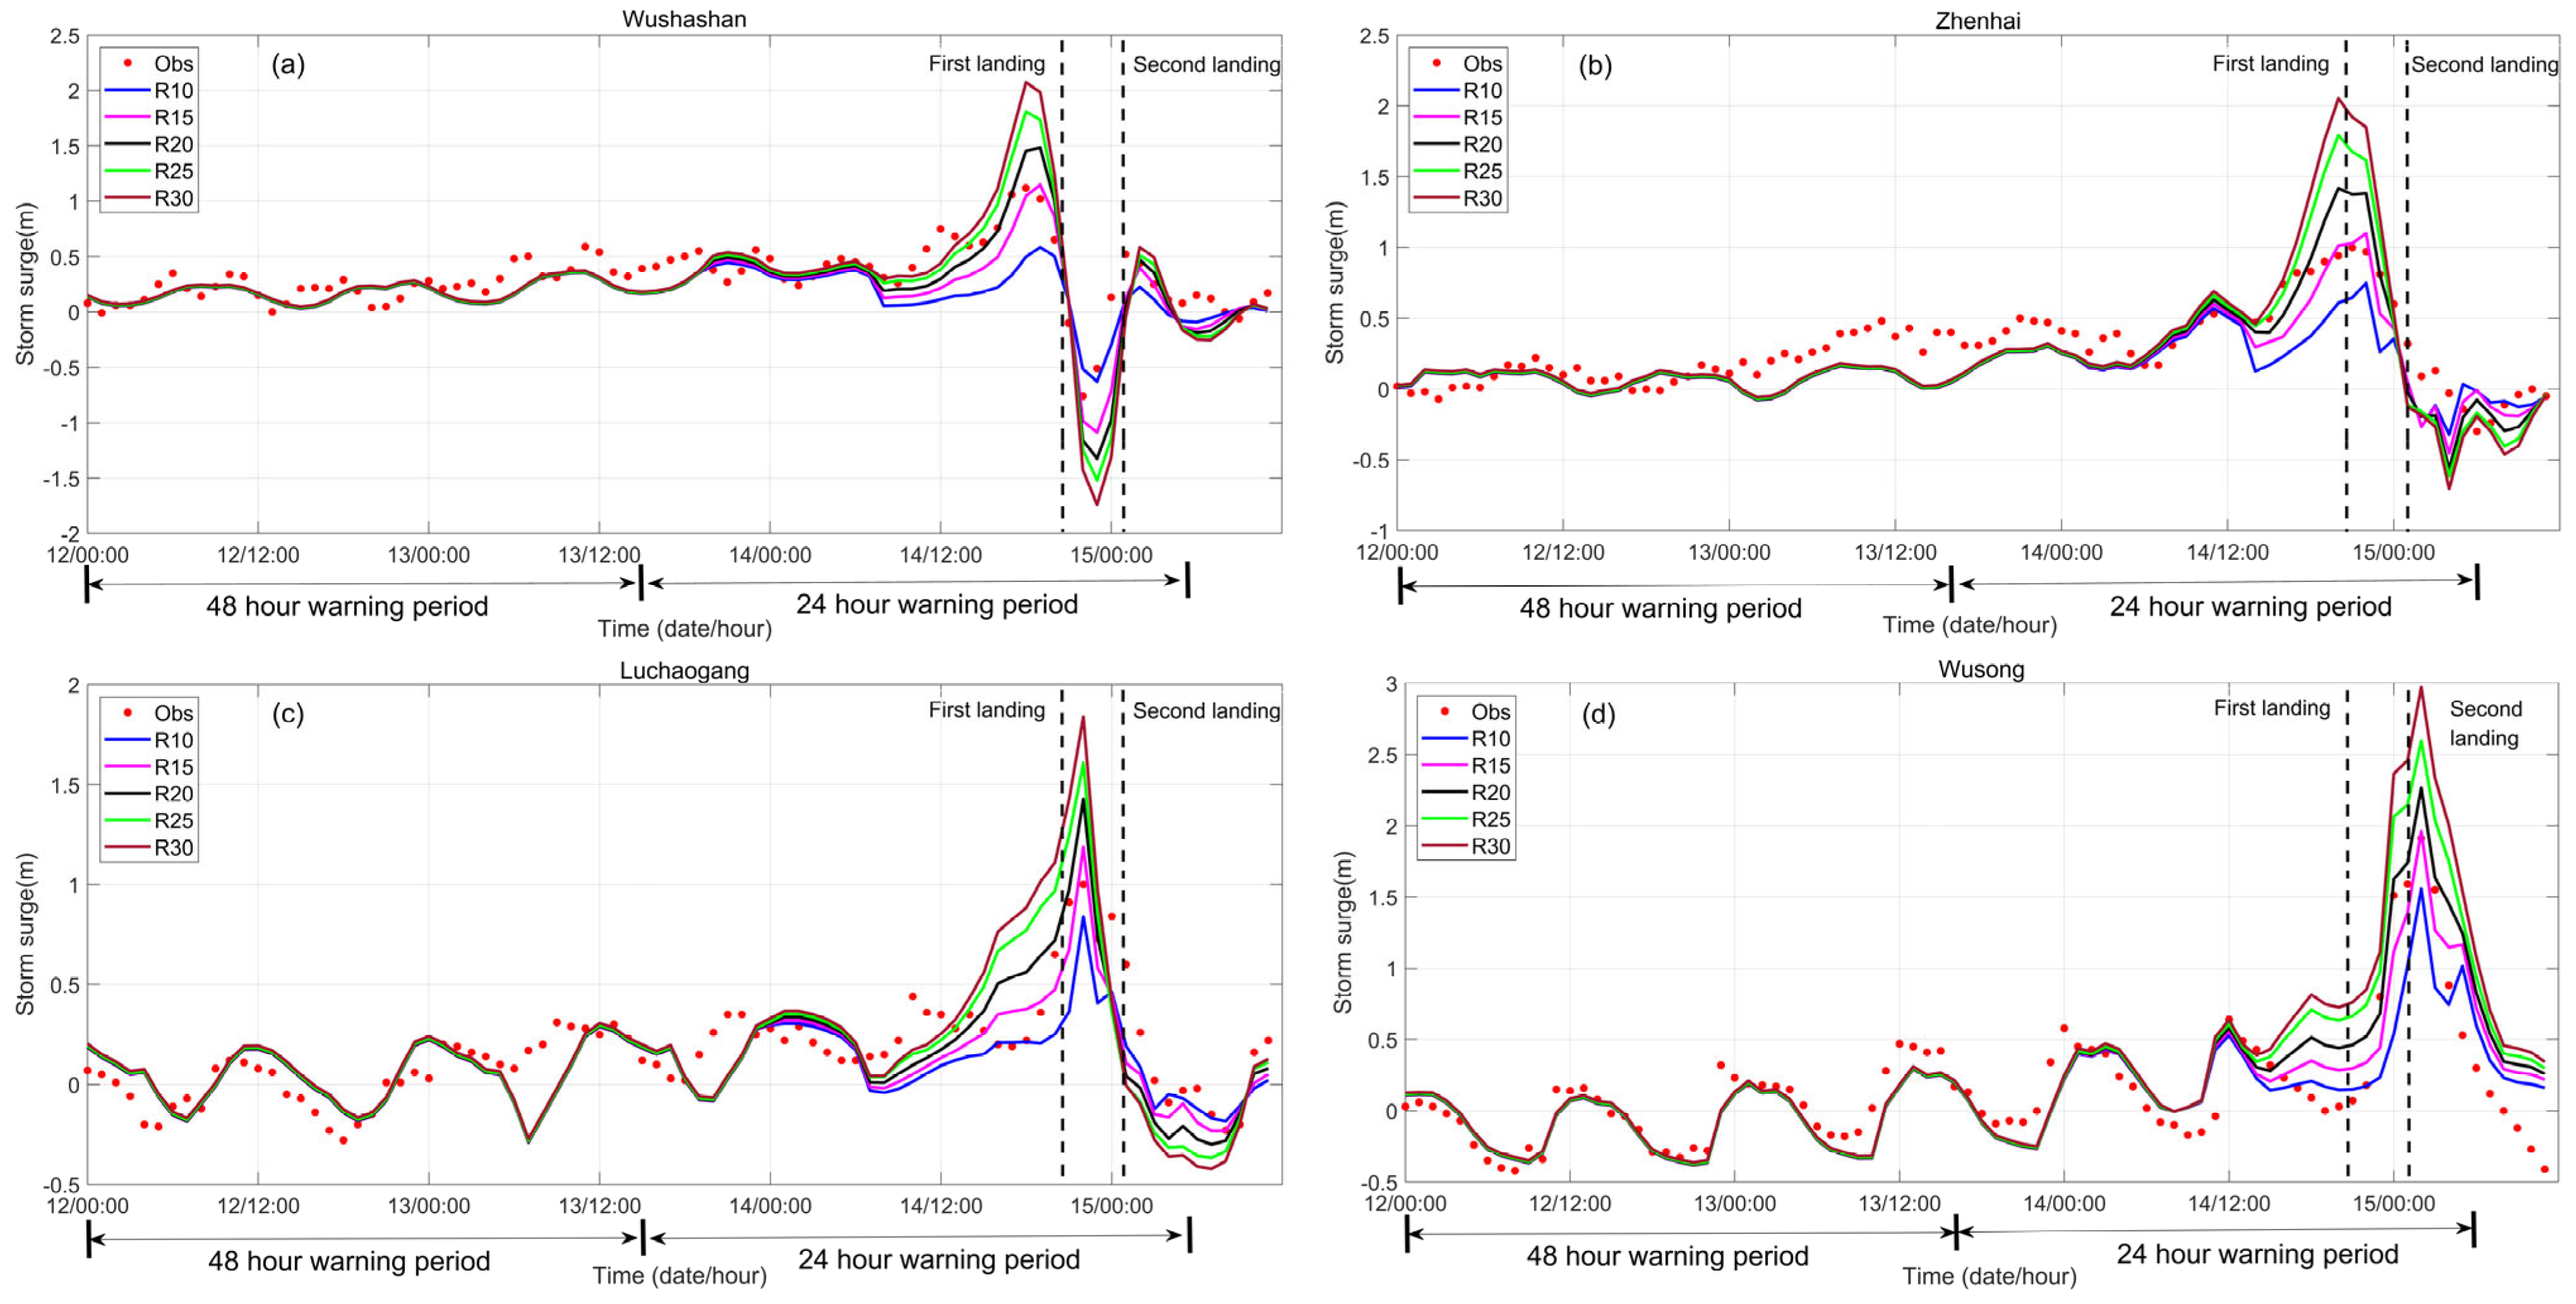
Similarly, the verification analysis results of the storm surge numerical hindcasts are shown in
Figure 4 and
Table 2. The numerical storm surge curves for the five schemes were basically consistent with those measured at the four tidal gauges, the storm surges at all tidal stations exhibited tidal oscillation characteristics of approximately 12 h, and the storm surge simulation results before typhoon landfall were closer to the observations than those after typhoon landfall. According to statistical analysis of the storm surge errors, the coastal tidal gauges exhibited no significant storm surge six hours before landfall, with precursor storm surges of only 0.2–0.5 m. During the 48 h warning period and the first half of the 24 h warning period (00:00 on 12 September~05:00 on 14 September), the RMSEs of the storm surges for the five schemes were very similar (0.13~0.19 m). Because the maximum storm surge caused by a strong typhoon usually occurs a few hours before and after landfall, it is difficult to determine the optimal scheme from the analysis of the storm surge errors during this period.
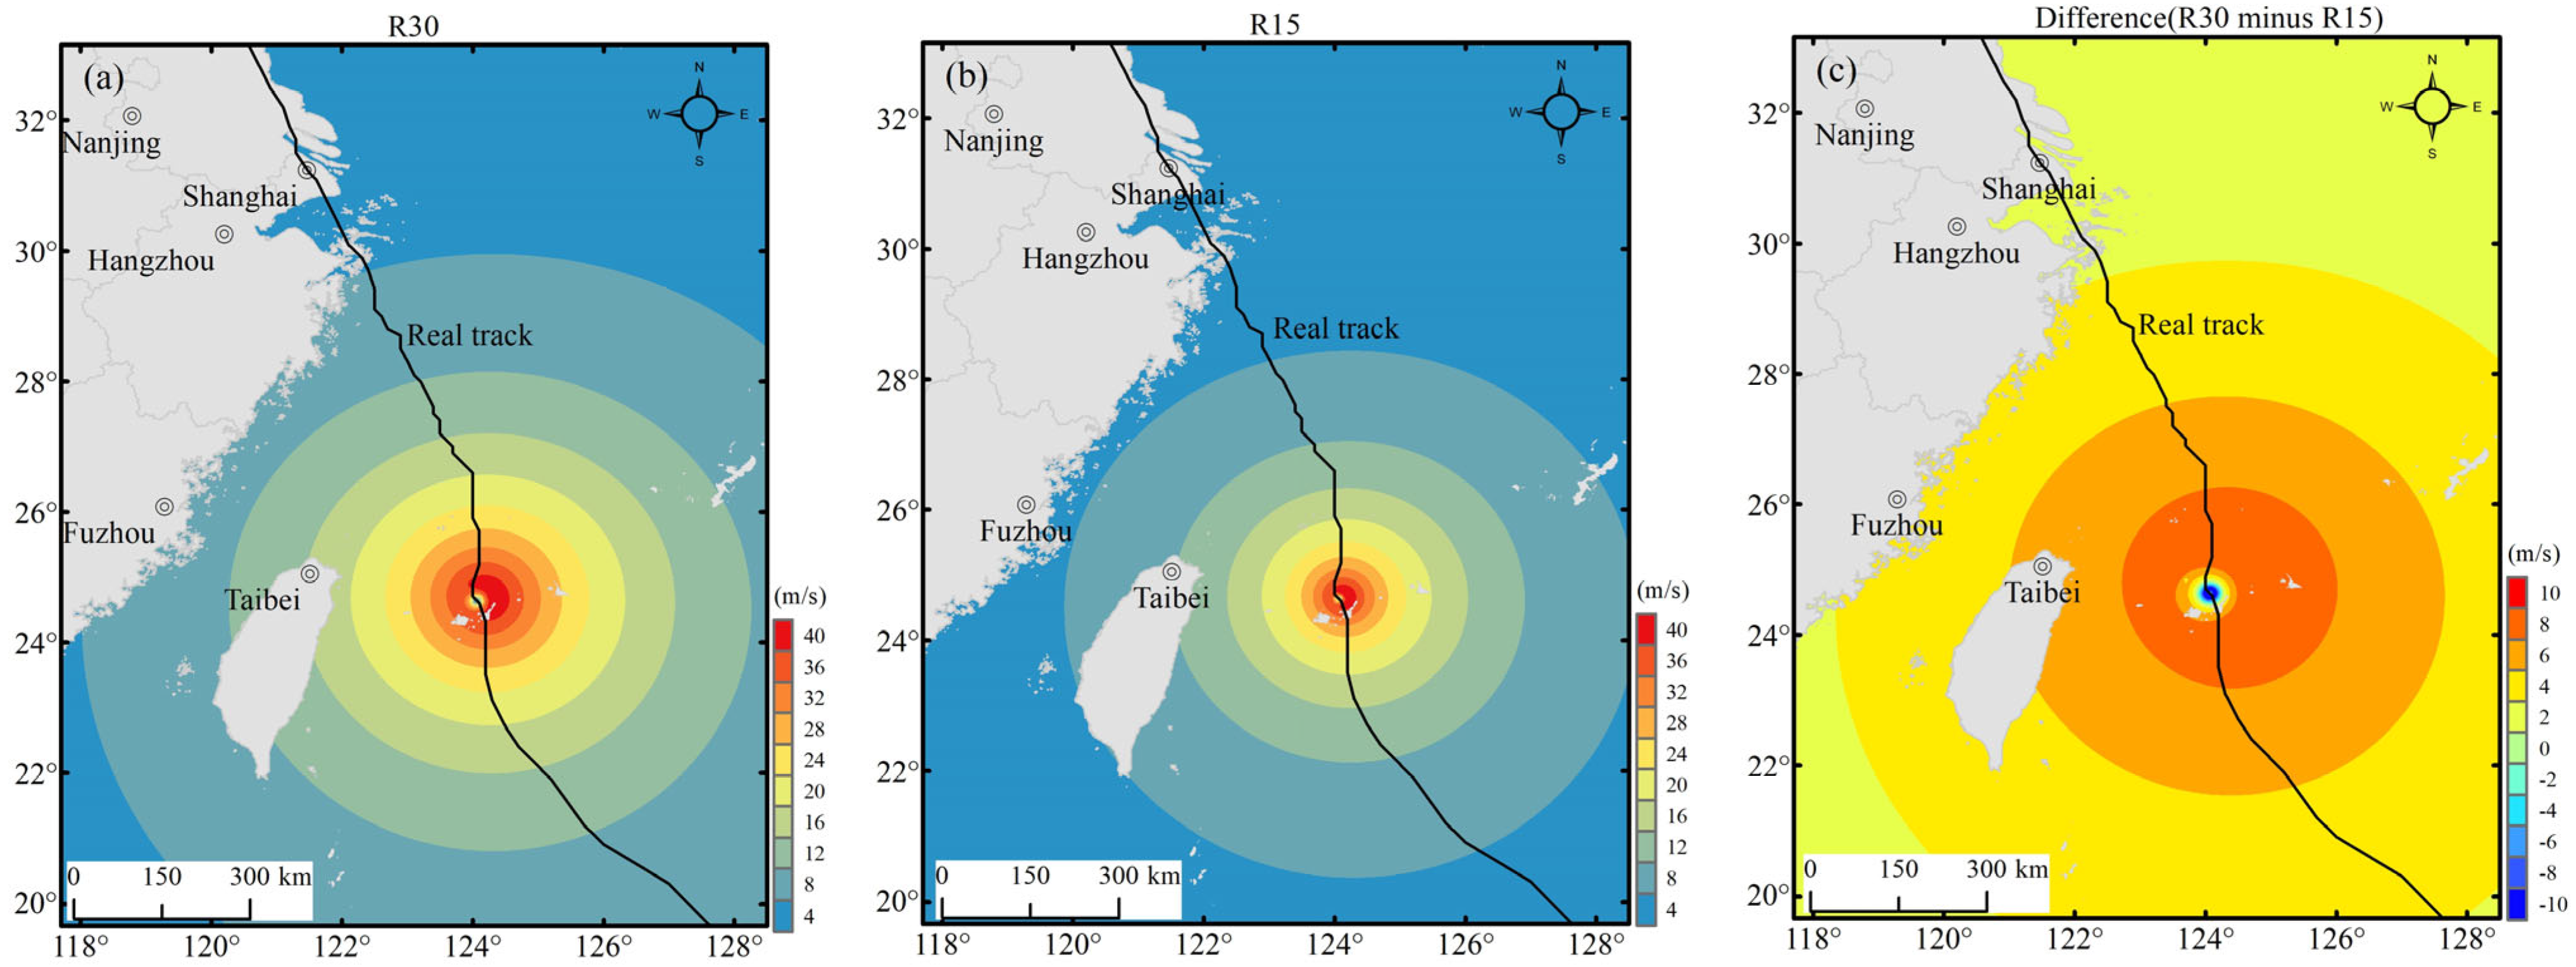
The Holland wind fields generated by the different values of
showed significant differences.
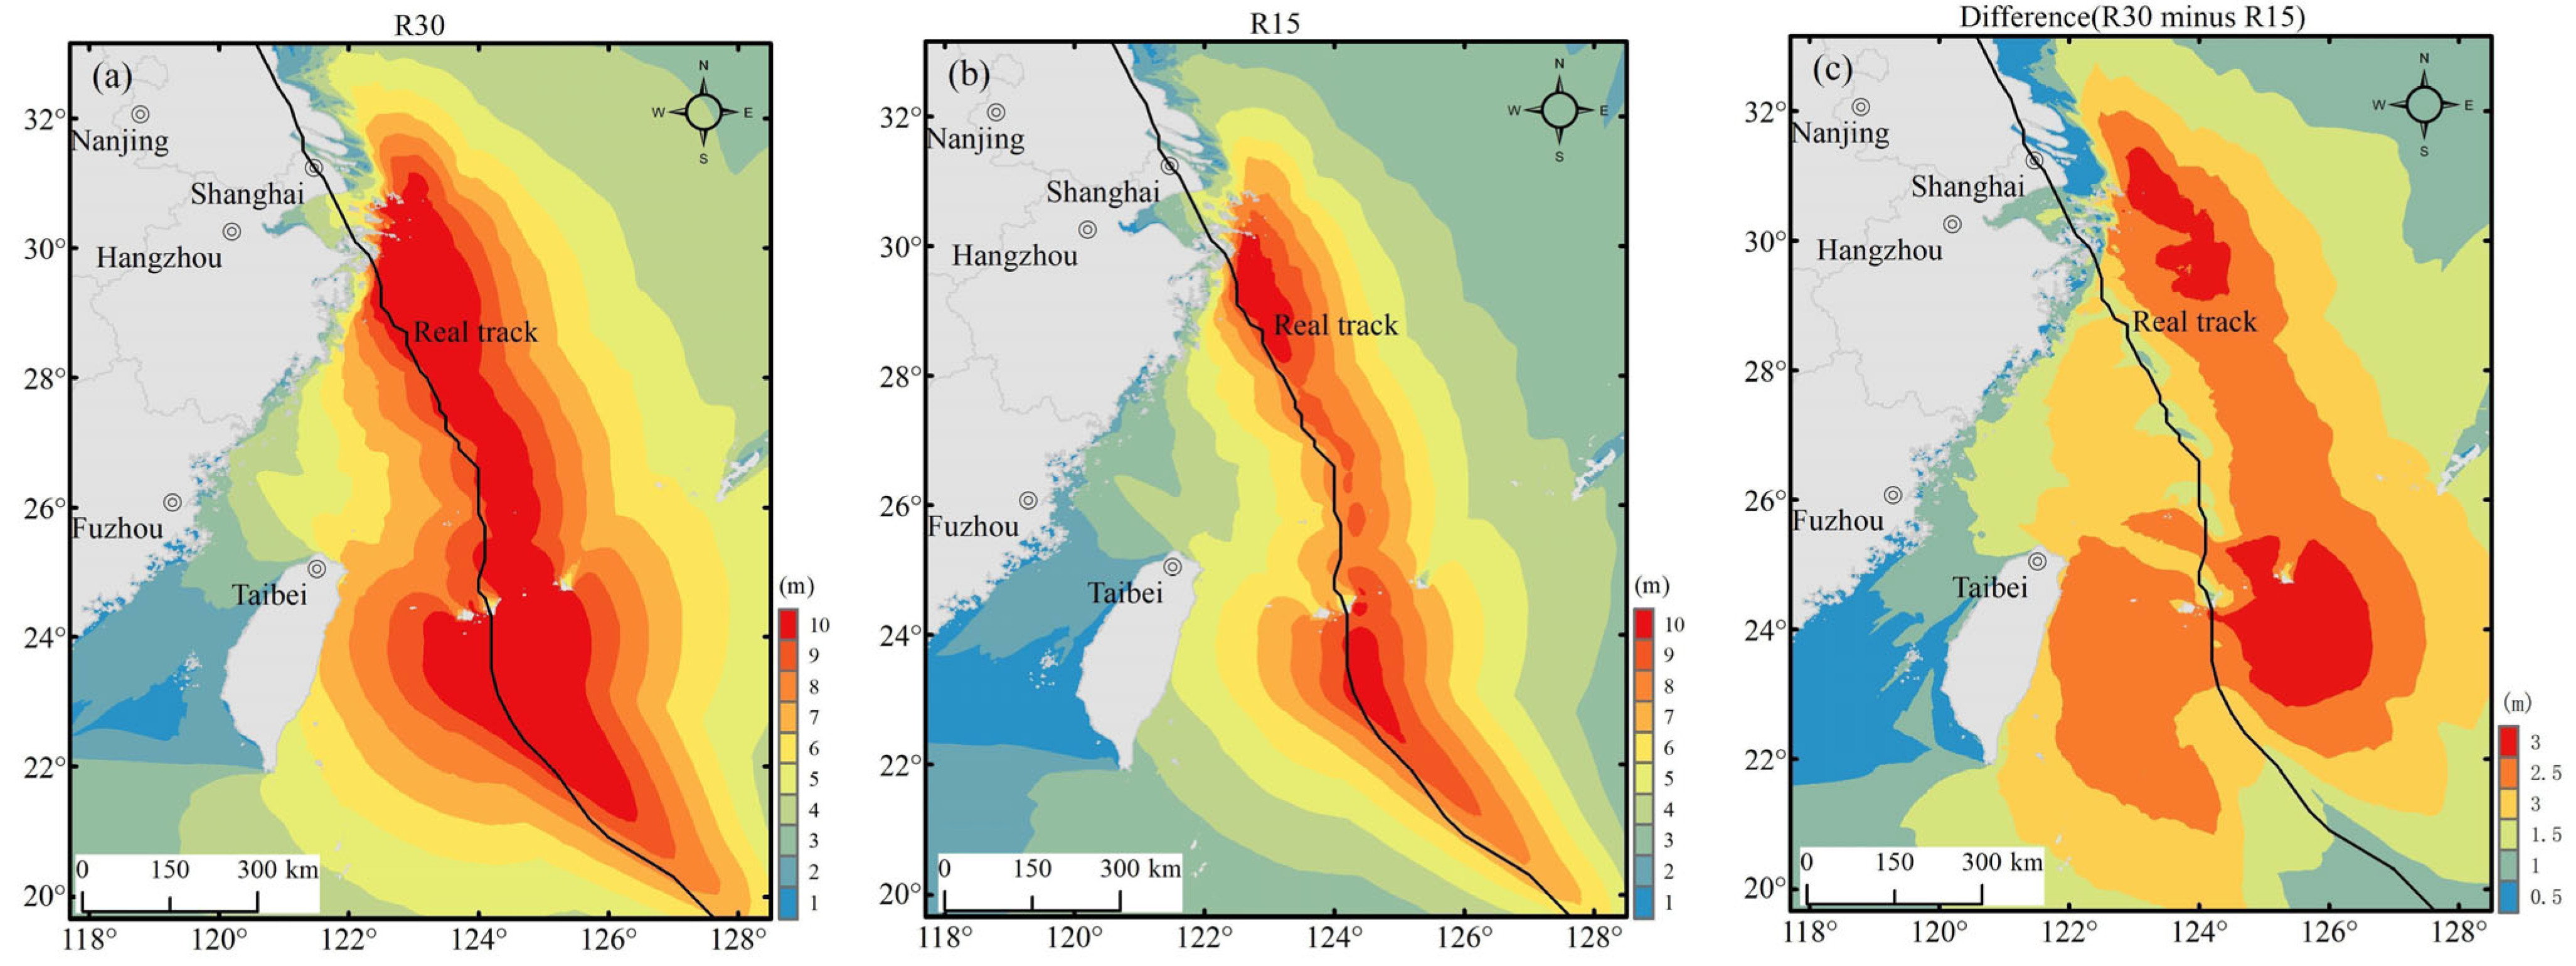
Figure 5 shows the R30 and R15 wind fields and their difference (at 14:00 on 12 September 2024, Typhoon Muifa occurred within the 48 h warning period). Although the maximum wind speed of the typhoon in both wind fields reached 40 m/s, the range of strong winds of R30 was larger than that of R15, which led to a greater SWH and giant wave range in offshore waters. This could be derived from the distribution of the maximum SWH and the difference between R30 and R15 (
Figure 6). On both sides of the typhoon, the maximum SWH of R30 was approximately 3 m greater than that of R15, and the giant wave range of R30 was approximately 200 km larger than that of R15. During the 48 h warning period, the waves were sufficient to determine the optimal scheme. In addition, during the 48 h warning period, strong winds closely related to nearshore storm surges were very limited, making it difficult to identify the optimal scheme.
In general, based on buoy monitoring data from the wave growth stage in the offshore sea, when Typhoon Muifa moved to the northeastern sea of Taiwan approximately 450 km away from the landfall site, namely, at 08:00 on 13 September (36 h before landfall), the advantages and disadvantages of each scheme could be distinguished by comparing the wave hindcast results to the measured data. The R15 scheme based on the inversion of wave buoys data was the optimal scheme.
3.3. Improvement in Storm Surge Numerical Forecasting Based on Wave Buoys Data
According to the above research, an
value of 15 km was the optimal scheme.
according to the statistical fitting relationship of 30 km of historical typhoons is often used as an important basis for the 24 h numerical prediction of storm surges. This scheme and the optimal scheme were used for the 24 h storm surge numerical forecasting of Typhoon Muifa. Similar to the previous study, the model presimulated three days of tides and then integrated them into the Holland model wind field. Storm surges and tides were still coupled, and the calculation time of the storm surge model ranged from 12 September to 16 September. Numerical forecast results were obtained from 00:00 on 12 September to 11:00 on 15 September, and the 24 h forecast track of Typhoon Muifa was more westerly than the actual track (
Figure 2b).
Figure 7 and
Table 3 provide a comparison of the measured and numerical forecast results and the corresponding error statistics. The numerical storm surge curve of the R15 scheme was closer to the measured storm surge curve than that of the R30 scheme. According to the storm surge error statistics of the 24 h numerical forecast period (from 08:00 on 13 September to 06:00 on 15 September), compared to the RMSEs (0.30~0.55 m) of the R30 scheme, the RMSEs of the R15 scheme (0.19~0.29 m) were smaller, and the RMSEs of the R15 scheme were 34% smaller than those of the R30 scheme. Considering the abruptness of storm surges, evaluating the maximum storm surge error is preferable, as the average maximum storm surge error of the R15 scheme reached 11.8%, which is significantly better than that of the R30 scheme (47.7%).
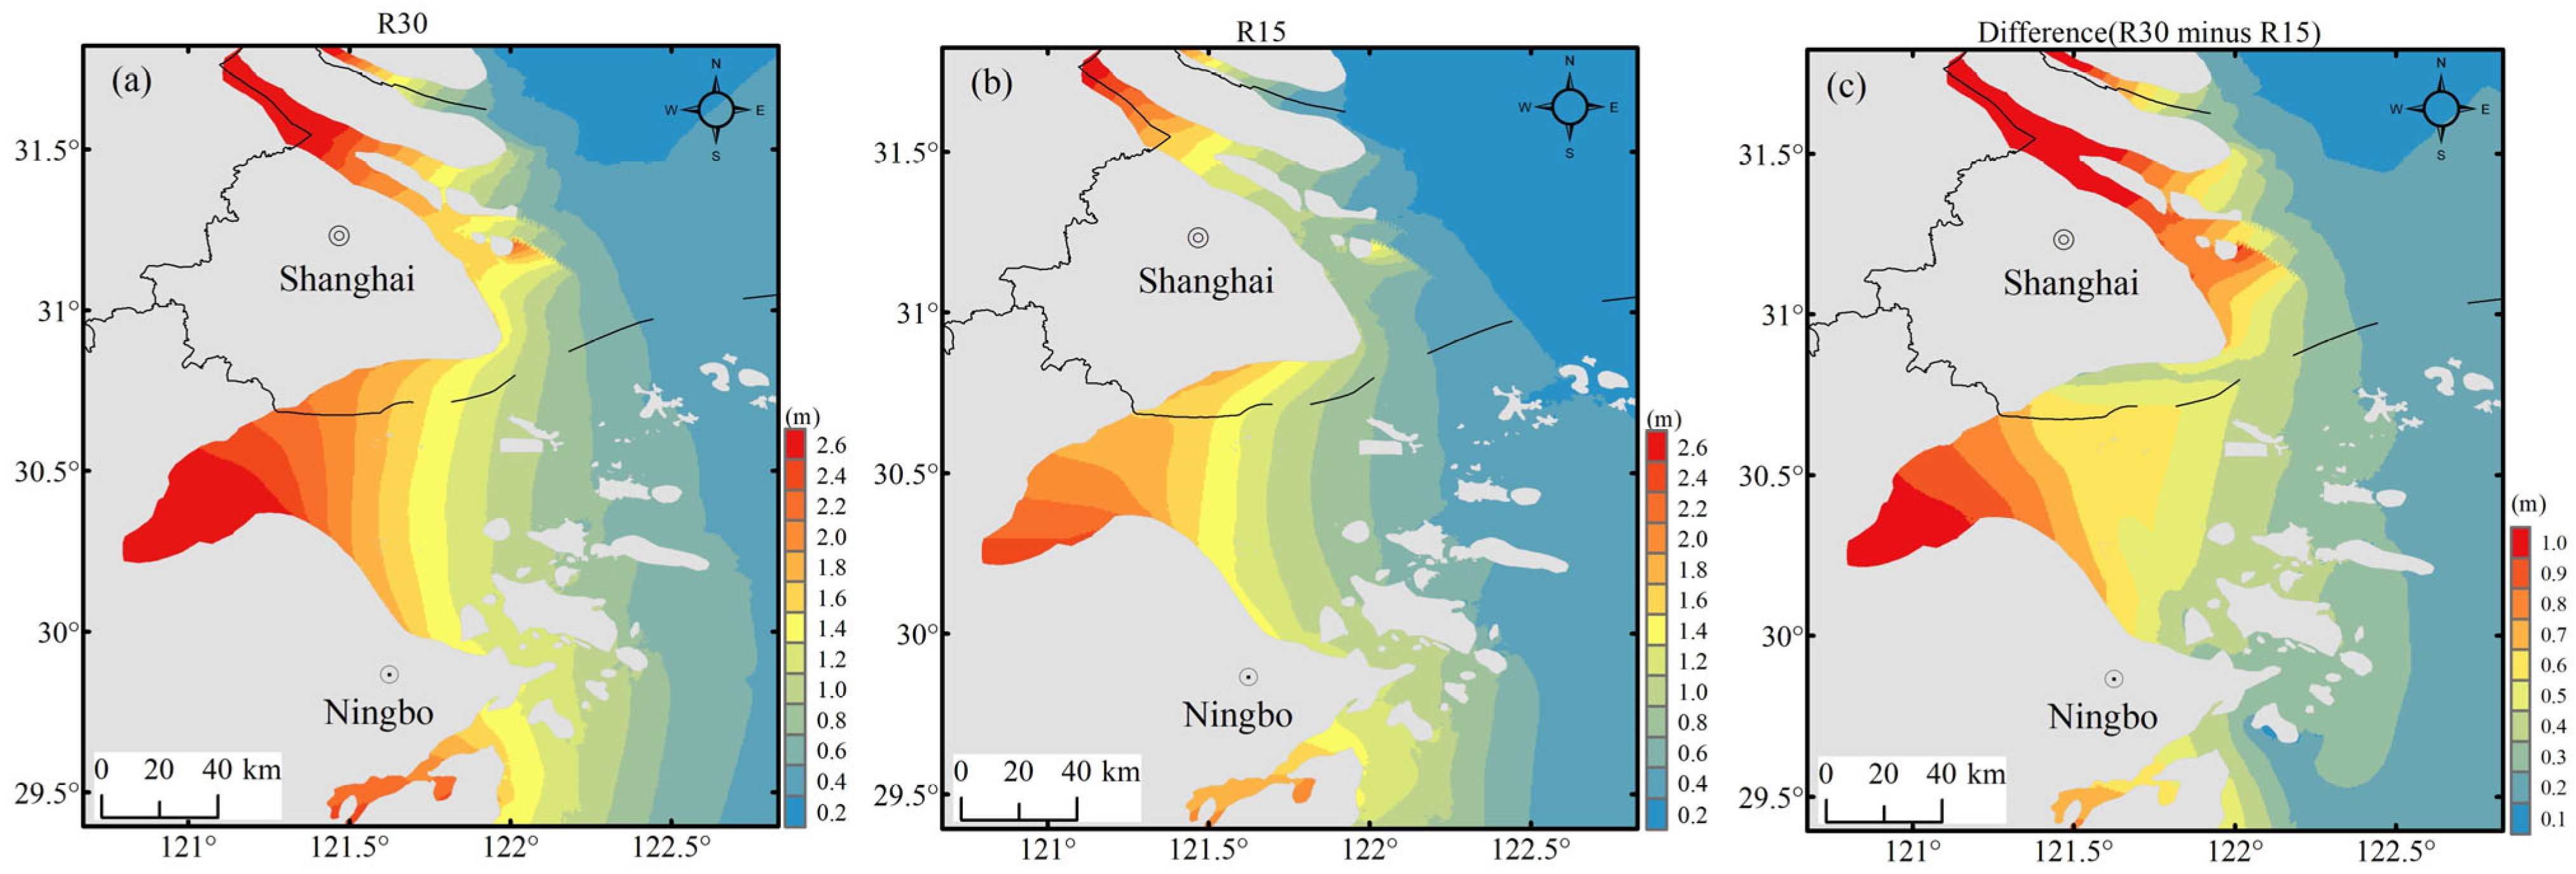
In addition, from the perspectives of the maximum storm surge field and the difference between the two schemes (
Figure 8), the maximum storm surge of the R30 scheme in Hangzhou Bay and the Yangtze River Estuary ranged from 2.6 to 3.2 m, and the maximum storm surge of the R15 scheme in Hangzhou Bay and the Yangtze River Estuary ranged from 1.9 to 2.2 m. Obviously, the prediction results of the R15 scheme were closer to the actual measurements than those of the R30 scheme. The maximum storm surge of the R30 scheme was 0.8~1.2 m greater than that of the R15 scheme in Hangzhou Bay and in the Yangtze River Estuary, resulting in a high storm surge forecast and warning level for Typhoon Muifa.
4. Discussion
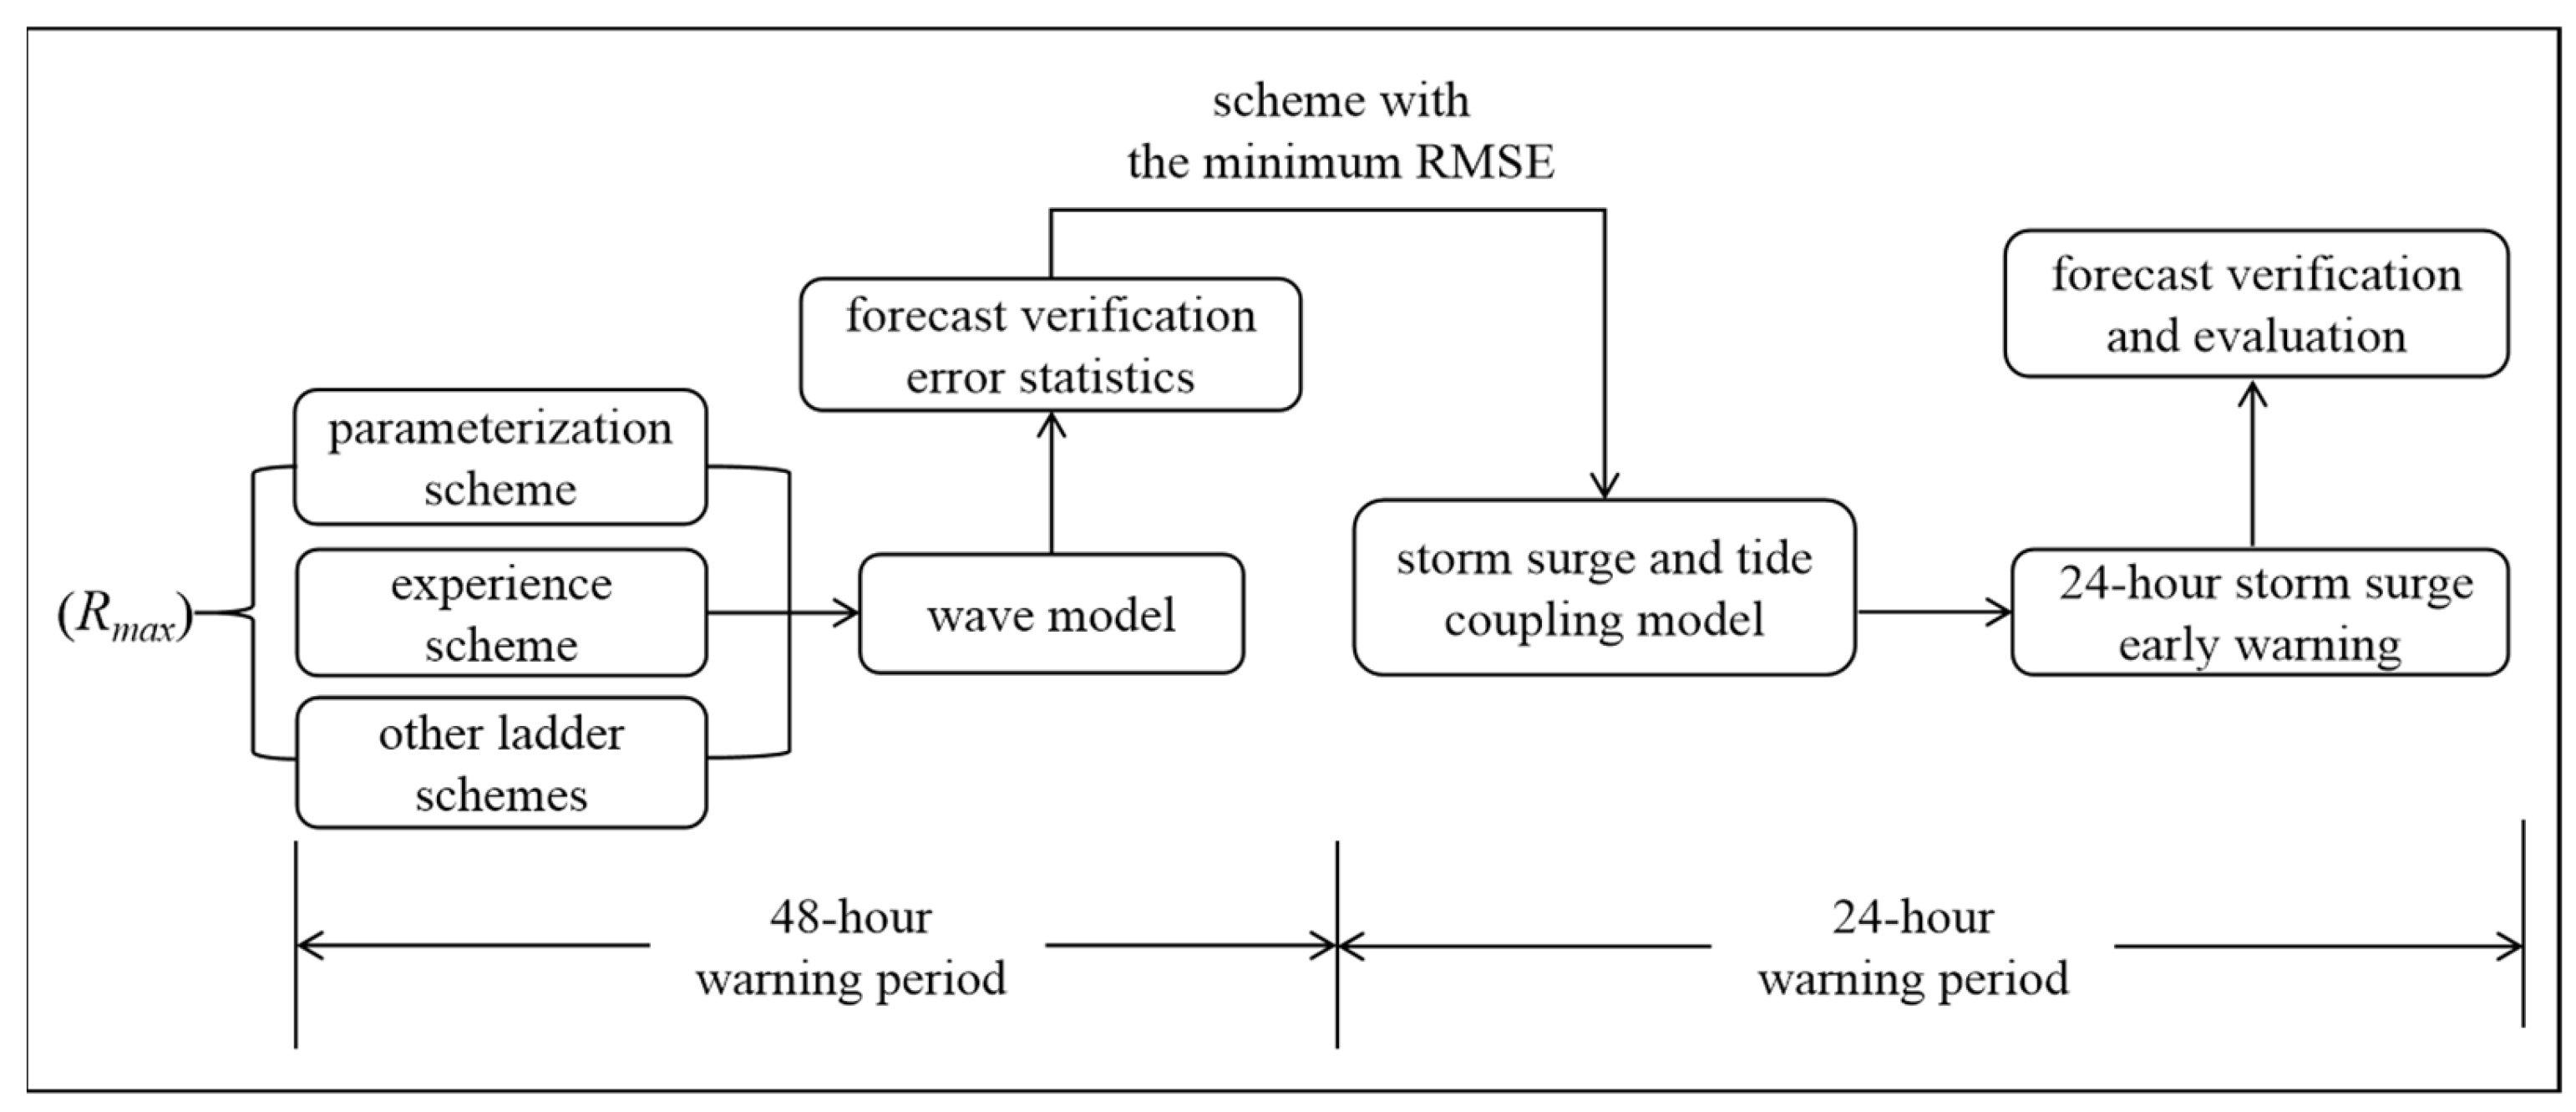
The method proposed in this study for retrieving the typhoon maximum wind speed radius from wave buoys data is effective and significantly reduces the error in 24 h storm surge forecasting. Based on this method, a technical framework for wind surge forecasting operations was proposed (
Figure 9), and the operation process can be described as follows: When a given typhoon enters the 48 h warning period, the typhoon maximum wind speed radius ensemble scheme automatically collects and drives the wave model, the calculation results are automatically compared with the real-time observations of wave buoys, and the errors are determined. The optimal scheme for the maximum wind speed radius is selected to drive the storm surge model, which is used for 24 h storm surge forecasting, warning, and evaluation. The operation process can automatically provide and update the numerical forecast results every three hours based on changes in CMA typhoon forecast information, which can respond quickly to fast changes in typhoon tracks. Compared to the two forecasts per day of the European Centre for Medium-Range Weather Forecasts (ECWMF), the frequency is higher, which can provide more forecast references, representing a significant advantage.
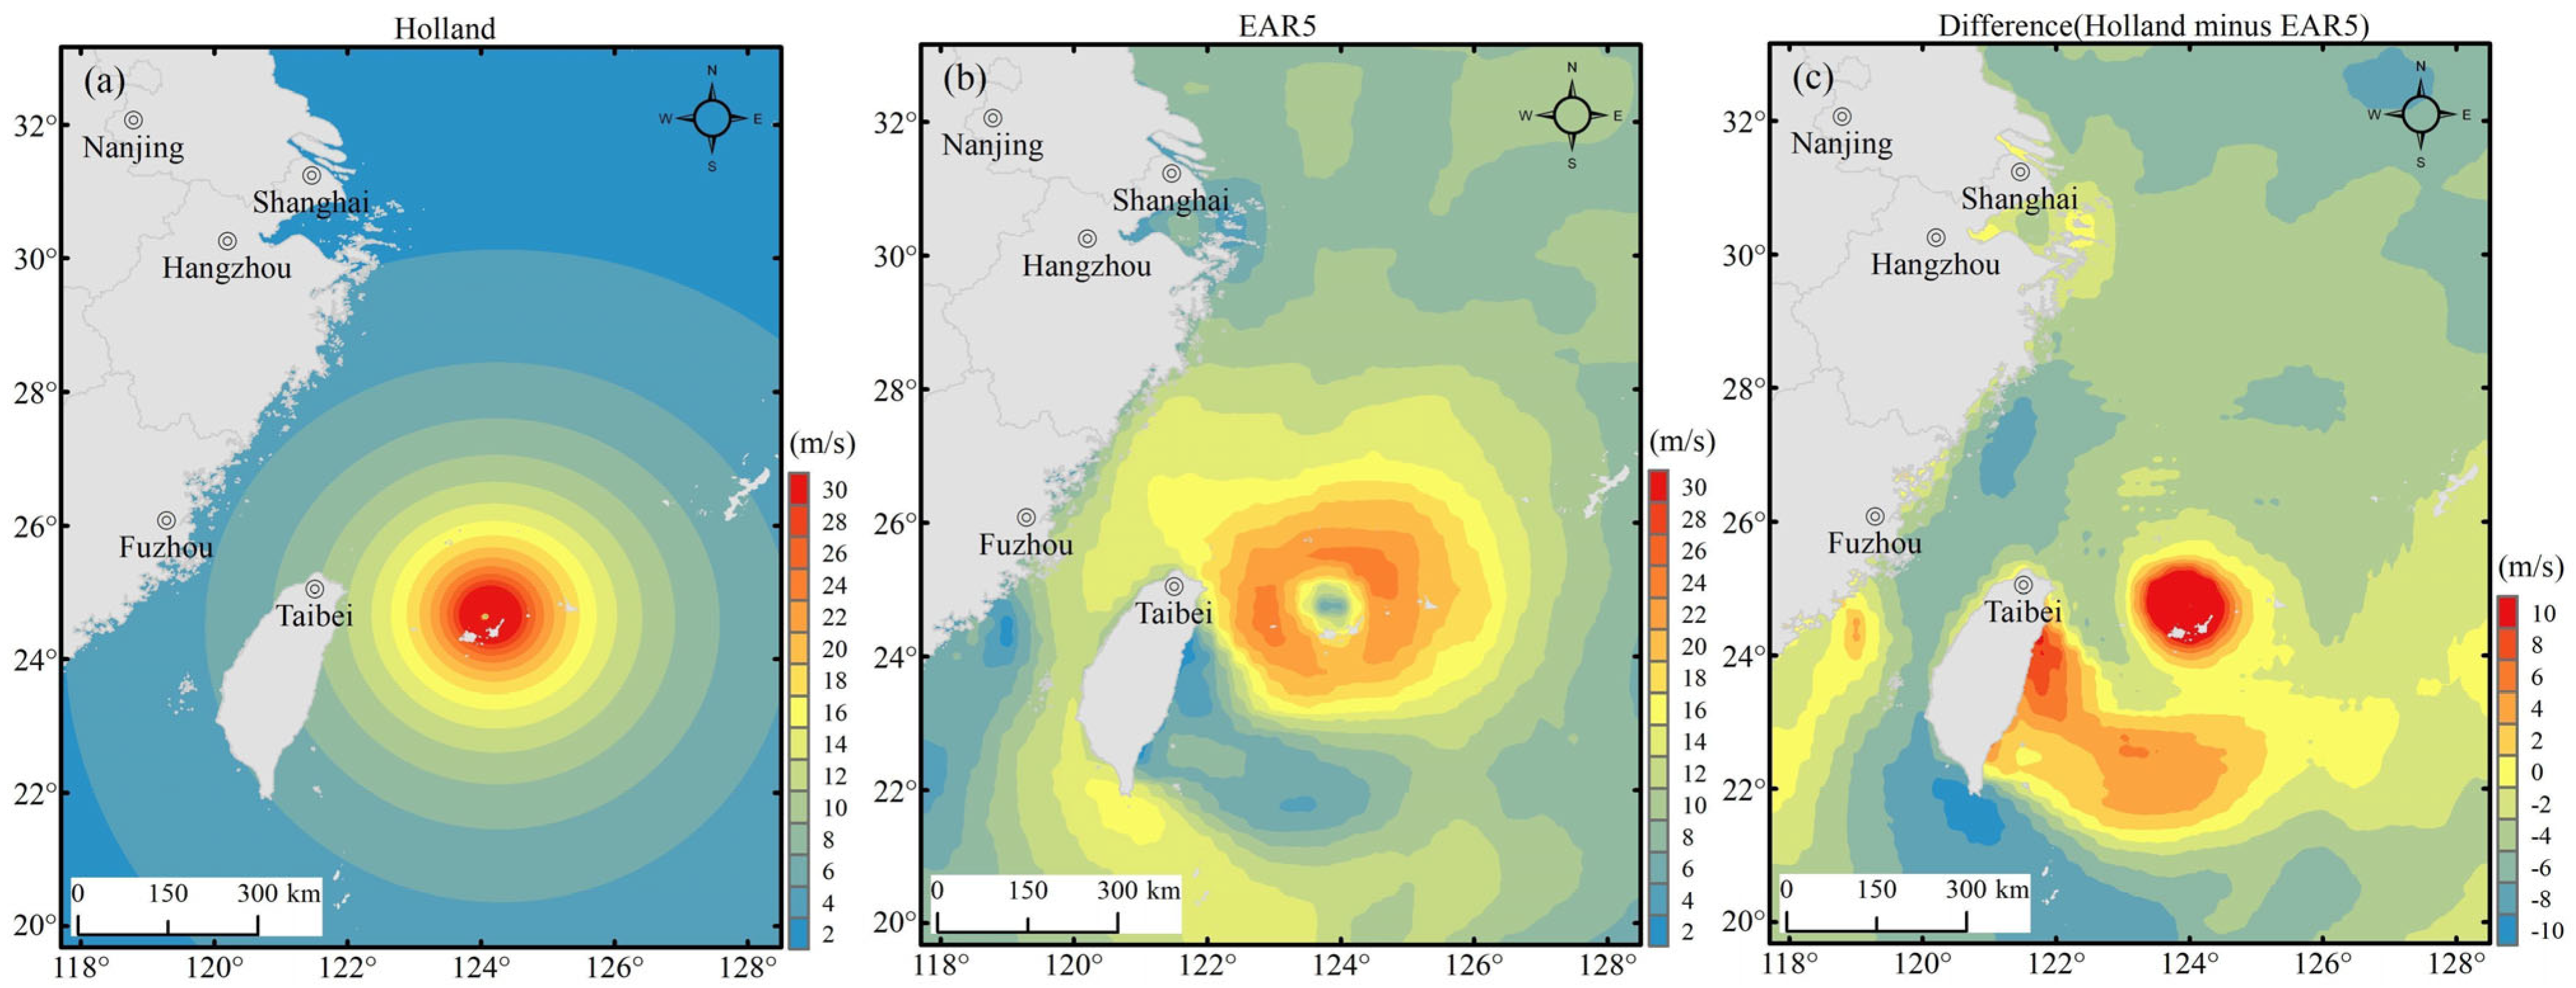
This method is applicable to coastal areas affected only by typhoon landings, especially compared to the ERA5 wind field.
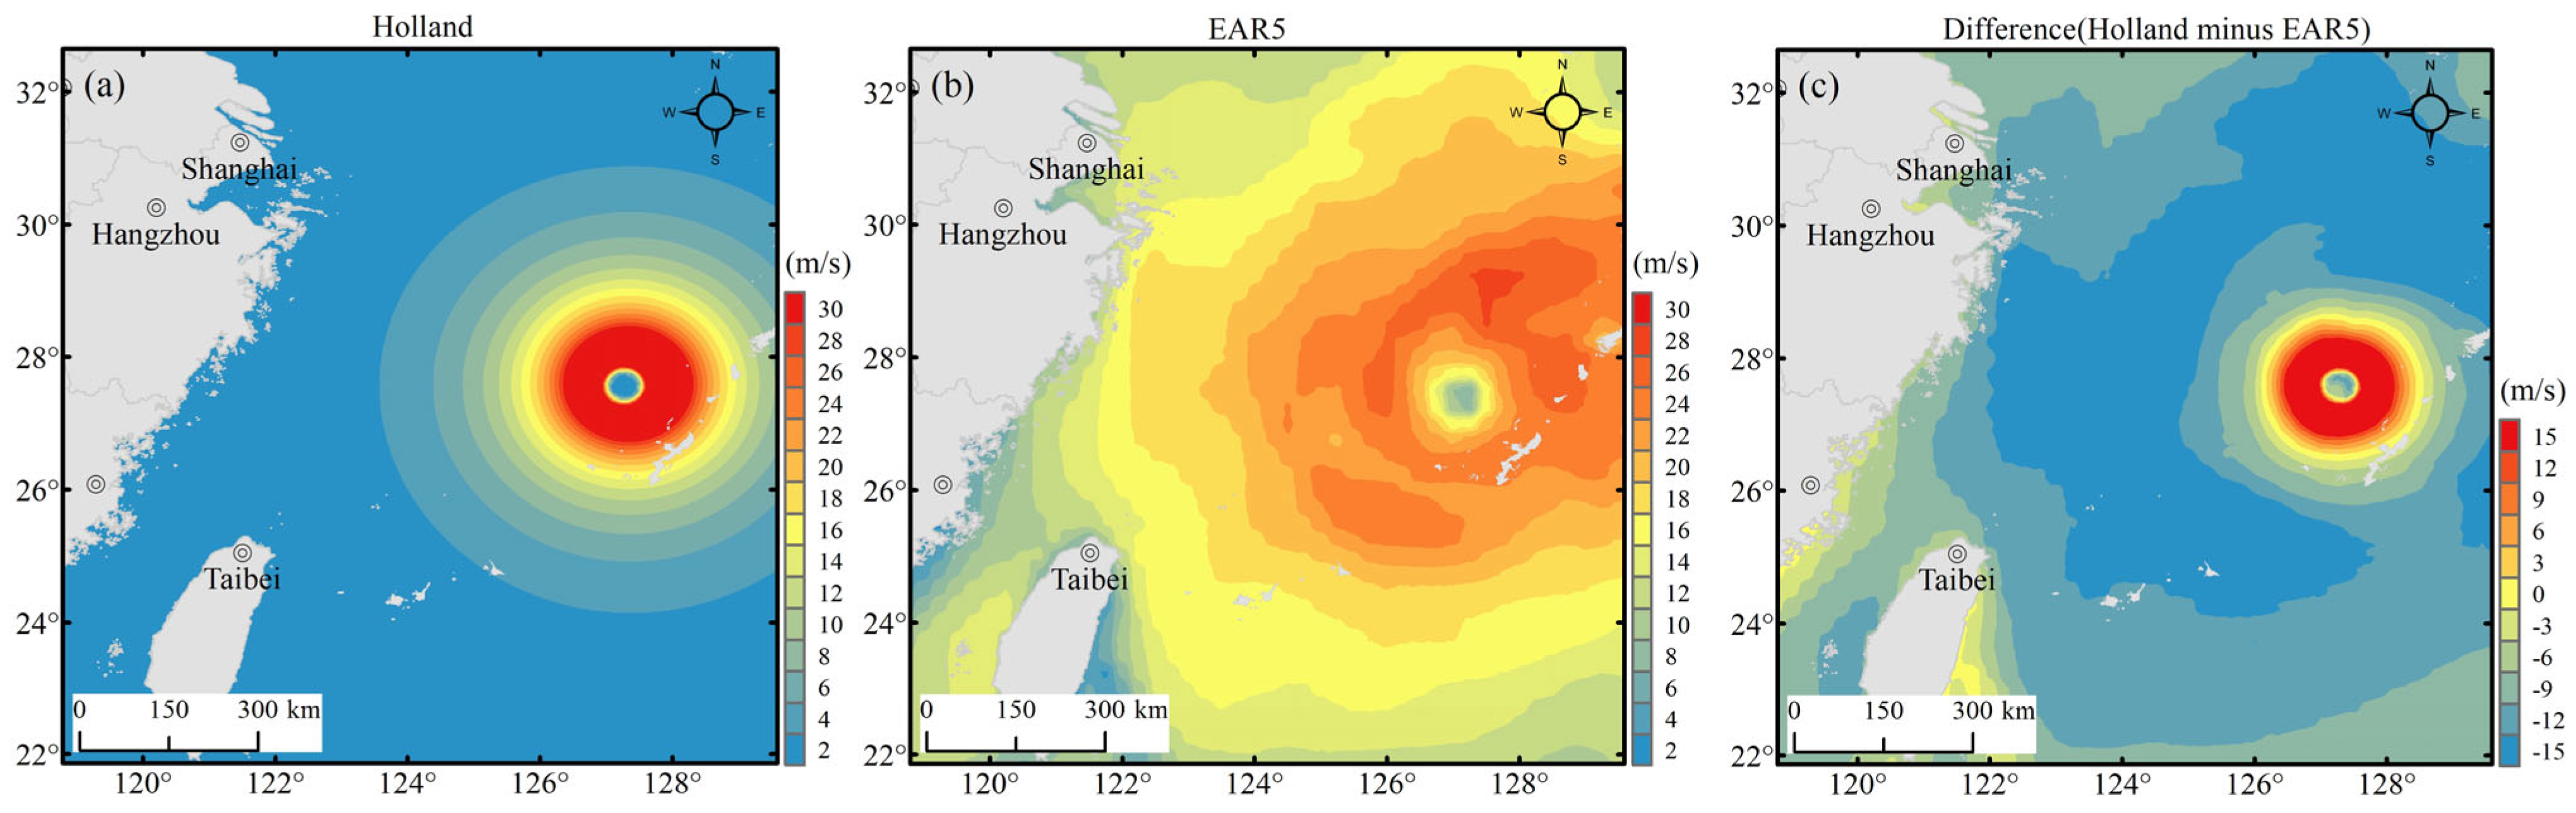
Figure 10 shows the wind speed distributions of the Holland model and ERA5 data and their difference under the influence of typhoons alone (at 14:00 on 12 September 2022, Typhoon Muifa). The strong winds near the center of the typhoon in the Holland wind field are significantly greater than those in the ERA5 data, which is closer to the observations. However, when typhoons combine with cold air or other weather systems to impact coastal areas, the wind field structure of typhoons exhibits asymmetry, and this method becomes unsuitable.
Figure 11 shows the wind speed distributions of the Holland model and ERA5 data and their difference under the combined influence of cold air and typhoons (at 08:00 on 12 October 2014, Typhoon Vongfong). Although the wind speed near the center of the typhoon in the Holland model is better than that in the ERA5 data, in areas far from the typhoon, the wind speed in the Holland model is 10-15 m/s lower than that in the ERA5 data. This results in lower storm surge simulations along the coast before the typhoon makes landfall than those observed.
In the future, with the continuous development and application of advanced technologies, such as artificial intelligence and graphics processing unit (GPU) parallel acceleration [
36], the problem of computational efficiency restricting storm surge numerical forecasting will be gradually resolved. With the continuous improvement in offshore and nearshore ocean observation networks, an increasing number of offshore buoys and coastal tidal gauges have entered operational observation systems, providing additional reference data and model verification sources for storm surge numerical forecasting systems. The authors believe that artificial intelligence technology, especially artificial intelligence with physical guidance, will provide new ideas for storm surge numerical forecasting. This approach aims to integrate observation data of coastal tidal gauges and the physical meaning of storm surges and is suitable for studying storm surge characteristics with small sample sizes. In addition, correcting and fusing observation data obtained by wave buoys and numerical model results approximately 24 h before typhoon landfall play a leading role in storm surge numerical forecasting. The integration of offshore observation data and numerical model correction should be continuously improved to improve the accuracy of storm surge prediction.
5. Conclusions
Hangzhou Bay and the Yangtze River Estuary have been frequently impacted by typhoons over the past five years. In this study, the reasons for the considerable storm surge forecast errors associated with Typhoon Muifa in Hangzhou Bay in 2022 were analyzed. In particular, the number of references to storm surge numerical forecasts decreased due to the large value of . Determining how to reasonably determine of a severe typhoon making landfall becomes important for numerical storm surge forecasting. A method for inverting based on wave buoys data was designed, which significantly reduced the error in 24 h storm surge forecasting. The conclusions of this paper can be described as follows:
This paper expanded upon and focused on analyzing the commonly used schemes of , and five stepped schemes (10, 15, 20, 25, and 30 km) were established to drive wave and storm surge numerical models. Moreover, the measured SWH of wave buoys was compared with the hindcast results. The numerical results of the R30 scheme were significantly higher than those measured by wave buoys in both the 48 h warning period and the 24 h warning period. Moreover, during the 48 h warning period, the optimal scheme closest to the measured data could be identified, and reached 15 km.
After the coupling of storm surges and tides, the storm surges at the four tidal stations exhibited tidal oscillation characteristics of approximately 12 h, and the storm surge simulation results before typhoon landfall were closer to the observed results. The RMSE values of the storm surges under the five schemes were very similar during the 48 h warning period. Because the maximum storm surge caused by a strong typhoon usually occurs a few hours before and after landfall, it is difficult to determine the optimal storm surge during the 48 h warning period. Therefore, based on buoy monitoring data from the wave growth stage in the offshore sea, the optimal scheme could be obtained one day before a typhoon made landfall.
A 24 h storm surge forecasting test was conducted by comparing the commonly used scheme (R30) and the optimal scheme (R15). The RMSE of the R15 scheme was 34% smaller than that of the R30 scheme, and the average maximum storm surge error of the R15 scheme reached 11.8%, which is significantly better than that of the R30 scheme (47.7%). In addition, the maximum storm surge of the R30 scheme was 0.8~1.2 m greater than that of the R15 scheme in Hangzhou Bay and in the Yangtze River Estuary, resulting in a high storm surge forecast and warning level for Typhoon Muifa.


